Embed Size (px)
Citation preview

biosensors
Article
Detection of Sub-Nanomolar Concentration of Trypsinby Thickness-Shear Mode Acoustic Biosensorand Spectrophotometry
Ivan Piovarci 1, Sopio Melikishvili 1, Marek Tatarko 1, Tibor Hianik 1,* and Michael Thompson 2,*
Citation: Piovarci, I.; Melikishvili, S.;
Tatarko, M.; Hianik, T.; Thompson, M.
Detection of Sub-Nanomolar
Concentration of Trypsin by
Thickness-Shear Mode Acoustic
Biosensor and Spectrophotometry.
Biosensors 2021, 11, 117. https://
doi.org/10.3390/bios11040117
Received: 11 February 2021
Accepted: 6 April 2021
Published: 11 April 2021
Publisher’s Note: MDPI stays neutral
with regard to jurisdictional claims in
published maps and institutional affil-
iations.
Copyright: © 2021 by the authors.
Licensee MDPI, Basel, Switzerland.
This article is an open access article
distributed under the terms and
conditions of the Creative Commons
Attribution (CC BY) license (https://
creativecommons.org/licenses/by/
4.0/).
1 Department of Nuclear Physics and Biophysics, Faculty of Mathematics, Physics and Informatics, ComeniusUniversity, Mlynska dolina F1, 84248 Bratislava, Slovakia; [email protected] (I.P.);[email protected] (S.M.); [email protected] (M.T.)
2 Lash Miller Laboratories, Department of Chemistry, University of Toronto, Toronto, ON M5S 3H6, Canada* Correspondence: [email protected] (T.H.); [email protected] (M.T.)
Abstract: The determination of protease activity is very important for disease diagnosis, drugdevelopment, and quality and safety assurance for dairy products. Therefore, the development oflow-cost and sensitive methods for assessing protease activity is crucial. We report two approachesfor monitoring protease activity: in a volume and at surface, via colorimetric and acoustic wave-based biosensors operated in the thickness-shear mode (TSM), respectively. The TSM sensor wasbased on a β-casein substrate immobilized on a piezoelectric quartz crystal transducer. After anenzymatic reaction with trypsin, it cleaved the surface-bound β-casein, which increased the resonantfrequency of the crystal. The limit of detection (LOD) was 0.48 ± 0.08 nM. A label-free colorimetricassay for trypsin detection has also been performed using β-casein and 6-mercaptohexanol (MCH)functionalized gold nanoparticles (AuNPs/MCH-β-casein). Due to the trypsin cleavage of β-casein,the gold nanoparticles lost shelter, and MCH increased the attractive force between the modifiedAuNPs. Consequently, AuNPs aggregated, and the red shift of the absorption spectra was observed.Spectrophotometric assay enabled an LOD of 0.42 ± 0.03 nM. The Michaelis–Menten constant, KM,for reverse enzyme reaction has also been estimated by both methods. This value for the colorimetricassay (0.56 ± 0.10 nM) is lower in comparison with those for the TSM sensor (0.92 ± 0.44 nM). Thisis likely due to the better access of the trypsin to the β-casein substrate at the surface of AuNPs incomparison with those at the TSM transducer.
Keywords: trypsin; β-casein; AuNPs; acoustic wave biosensor; colorimetric assay
1. Introduction
Peptidases, more frequently referred to as proteases, are a group of enzymes thatirreversibly hydrolyze a peptide bond in an amino acid sequence through the nucleophilicattack and subsequent hydrolysis of a tetrahedral intermediate. They play critical rolesin biological and physiological processes such as blood clotting, digestion, and a varietyof cellular activities [1,2]. Proteases are highly involved in the dairy industry as well,where their activity is directly linked to the shelf life of dairy products [3]. Owing to theirspecificity, protease activity-based biosensors are used in various diseases diagnostics [4–6].For example, pancreatic diseases such as cystic fibrosis, acute pancreatitis, or the acutephase of chronic pancreatitis are associated with the increased trypsin level of 2.1–71.42 nMin the serum of patients [7,8]. In the healthy physiological condition, the concentrationof trypsin varies in magnitude. Additionally, levels of trypsin differ between serum andintestinal levels. For serum levels for fasting individuals, the concentration of trypsin wasmeasured from 4 to 20 nM [9,10]. The intestinal level of trypsin depends on the location inthe intestine and ranges from 4 to 30 µM, which is much higher than in serum [11].
Moreover, the inhibitors of these proteases are successfully employed as therapeuticagents [2,12,13].
Biosensors 2021, 11, 117. https://doi.org/10.3390/bios11040117 https://www.mdpi.com/journal/biosensors
Biosensors 2021, 11, 117 2 of 17
Trypsin is an extremely important serine protease of the chymotrypsin family. Itis produced in the pancreas and it plays crucial roles in the small intestine. Trypsincatalyzes the hydrolysis of consumed proteins and activates protease proenzymes as partof the digestive system. It is highly specific toward the cleavage of peptide bonds at thecarboxyl side of lysine or arginine. Trypsin is often used as a model protease because it isinexpensive and readily available [14–16]. Standard assays for the detection of proteasessuch as trypsin usually utilize fluorogenic and chromogenic substrates. Those assays areuseful, practical, and highly sensitive. However, spectroscopic assays are incapable ofmeasuring protease activity in highly colored and turbid samples such as cells, tissuelysates, or milk. Therefore, the development of a new label-free method for detectingprotease activity without interruption from impurity inclusions is needed [1,15,17].
The thickness-shear mode (TSM) acoustic wave biosensor may present an attractiveplatform for the development of cost-effective and highly sensitive techniques for trypsindetection. The use of TSM devices is a well-known method for the detection of masschanges due to depositions or chemical/biochemical reactions on its surface. It is also anestablished method for detecting changes in the viscoelastic properties of the contactingmaterial. Therefore, the TSM biosensor is a sensitive tool for the study of molecularinteractions on surfaces [18]. Moreover, the coupling of a flow injection analysis (FIA)system to a TSM sensor device permits the monitoring of kinetic processes that take placeat the surface of the sensor [19]. The TSM device applies a high-frequency AC voltageacross an AT-cut quartz crystal on which, due to the piezoelectric effect, an acoustic shearwave is generated and propagated through the sensing layer perpendicular to the surfaceof the crystal [20]. It has a low noise level and higher Q-factor in clinical liquids suchas tissue fluids and serum. Compared to other common biosensing technologies, TSMelectroacoustic resonators have the combined advantages of high sensitivity and low cost,label-free detection of analyte, and simple operation without the requirement of bulkydetection systems [21]. Moreover, in contrast with traditional quartz crystal microbalance(QCM) techniques, the analysis of complex impedance spectra allows for the receipt ofinformation about changes in the properties of layers even with the adsorption of relativelysmall molecules that do not contribute to the mass but only to the viscoelastic propertiesof the layer [22]. The multi-harmonic QCM method has previously been applied for thedetection of plasmin and trypsin at the surface of β-casein layers [23]. This method allowsthe detection of these proteases at the sub-nM level. However, the possible contribution ofviscoelastic effects has not been analyzed.
In addition to the acoustic methods also the colorimetric assay based on gold nanopar-ticles (AuNPs) for protease detection is of increased interest. AuNPs have attracted tremen-dous interest because of their optical and electronic properties, which are tunable bychanging the size, shape, surface chemistry, or aggregation state. Colloidal AuNPs have adistinctive red color, which arises from the tiny dimensions of the AuNPs. The changesin the UV–vis spectra of the resultant colloids are measured to investigate the size effectof AuNPs on the surface plasmon resonance (SPR). Interestingly, the red color of citrate-stabilized AuNPs turns to blue when they are aggregated [24]. This approach has beenwidely applied to various methods for colorimetric detection of analytes via the aggregationof AuNPs [25], including those of trypsin detection [26].
In this work, we designed an analytical method based on the TSM biosensor for thereal-time and label-free detection of trypsin. Using TSM frequency responses, we studiedthe assembly and stability of self-assembled β-casein layers on a quartz crystal electrodeand measured the dynamics of TSM response and changes in motional resistance duringcasein cleaving by the protease.
Additionally, we compared the sensitivity of the TSM method with another label-freeassay of the protease activity by employing AuNPs coated by β-casein and 6-mercaptoh-exanol (MCH). Unlike the surface-sensitive TSM biosensor, the suggested approach wasvolume-sensitive, thus allowing us to monitor tryptic activity in the reaction mixture. Weused an approach developed by Chuang et al. [26]. However, instead of gelatin, β-casein

Biosensors 2021, 11, 117 3 of 17
was used as a substrate for trypsin. β-casein adsorbed on AuNPs kept the modifiednanoparticles stably suspended in solution.
Considering the results obtained, we believe that the proposed approaches constituterapid, cost-efficient, sensitive and useful tools for protease analysis. This paper is anextension of a conference paper published in the 1st International Electronic Conference onBiosensors [27].
2. Materials and Methods2.1. Reagents
Ultrapure water obtained by reverse osmosis (Thermo Scientific, Waltham, MA,USA, ρ = 18.2 MΩ cm) was used for the preparation of all aqueous solutions. As amedium, 10 mM, pH 7.4 phosphate-buffered saline (PBS) was used (10 mM Na2HPO4,2 mM KH2PO4, 2.7 mM KCl and 137 mM NaCl), prepared from tablets (Sigma-Aldrich,Darmstadt, Germany, Cat. No. P4417). In the experiments, trypsin from bovine pan-creas (≥90%, ≥7500 BAEE units/mg solid, Sigma-Aldrich, Darmstadt, Germany, Cat. No.T9201) served as a model protease. The concentration of stock bovine β-casein (≥98%,Sigma-Aldrich, Darmstadt, Germany, Cat. No. C6905) solutions, prepared in PBS, was0.5 mg/mL. 11-Mercaptoundecanoic acid (MUA, Sigma-Aldrich, Cat. No. 450561), N-(3-dimethylaminopropyl)-N′-ethylcarbodiimide (EDC, ≥98%, Sigma-Aldrich, Cat. No.E6383), and N–Hydroxysuccinimide (NHS, Sigma-Aldrich, Darmstadt, Germany, Cat. No.130672) were employed for β-casein immobilization. The chemicals needed to prepare thegold nanoparticles, such as auric acid (HAuCl4), sodium citrate, and 6-mercapto-1-hexanol(MCH), were purchased from Sigma-Aldrich (Darmstadt, Germany). All experiments werecarried out at 20 C.
2.2. Cleaning and Modification of Gold Electrode-Coated Quartz Crystals
Symmetric gold electrode-coated quartz discs (Total Frequency Control, Storrington,UK, working area, 0.2 cm2) with a fundamental frequency of 8 MHz were cleaned in a basicPiranha solution (29% NH3, 30% H2O and H2O2 with volumetric 1:5:1 ratio, respectively)for 25 min. After this treatment, the crystals were washed three times with deionized waterand stored in ethanol. After drying in a flow of nitrogen, the TSM crystals were immersedin 2 mM MUA and were incubated for 16 h to form a self-assembled monolayer. After thisstep, the crystals were rinsed several times with deionized water and dried under nitrogen,followed by incubation for 20 min in a 20 mM EDC and 50 mM NHS mixture in order toactivate the carboxylic groups of MUA for the further immobilization of bovine β-casein onthe gold electrode of the quartz sensor. The scheme of modification of the TSM transduceras well as the cleavage of β-casein by trypsin is shown in Figure 1.
Biosensors 2021, 11, x FOR PEER REVIEW 4 of 17
Figure 1. The scheme for modification of the gold layer on a TSM transducer and the cleavage of β-casein by trypsin.
2.3. TSM Measurements AT-cut 8.0 MHz gold electrode-coated quartz crystals, modified on one side by MUA
with activated carboxylic groups by NHS/EDC as described above, were incorporated into a home-built flow-through thickness shearing mode (TSM) acoustic wave device sensor system. The setup and general configuration of the flow-through system is described in reference [19]. One side of the crystal was exposed to liquid, the other one was exposed to air. The liquid was introduced using a syringe pump (Genie Plus, Torrington, CT, USA). Runs were performed with the crystals in the vertical position and at ambient temperature (approximately 20 °C). The modified crystal was secured in the holder using two O-rings. The gold electrodes were kept in contact with the gold leads in the holder. Resonance frequency, f, and motional resistance, Rm, were determined based on the Butterworth–van Dyke (BVD) model of a quartz crystal resonator [19]. The resonant frequency represents the energy storage and reflects the mass changes of the oscillating layer, while Rm is related to the dissipation of energy and provides evidence of changes in the shearing viscosity of the layer [22]. The measuring procedure was as follows. Each slide was flushed through with PBS at a flow rate of 50 μL/min until a stable baseline was achieved (45 min), using the flow-through injection system. This step was necessary to remove any weakly ad-sorbed molecules at the surface of the TSM transducer. Next, the pump was momentarily stopped. The β-casein solution (0.5 mg/mL in PBS) was slowly introduced to the sample, while the PBS was exchanged out in order to minimize pressure effects to the system. β-casein was introduced at a rate of 50 μL/min for approximately 45 min. Once again, the pump was momentarily stopped, and the sample input tube was slowly placed back into the PBS solution. The PBS was re-introduced at a rate of 50 μL/min to remove any loosely bound casein until a stable baseline was achieved. Changes of the resonant frequency and motional resistance were recorded. For proteolysis measurements, solutions with various concentrations of trypsin in PBS (0.1, 0.5, 1, 5, 10, and 20 nM) were flowed over TSM crys-tals with an immobilized β-casein layer at a flow rate of 50 μL/min. Trypsin and β-casein solutions were freshly prepared before each experiment.
2.4. Synthesis and Modification of AuNPs AuNPs were prepared using a modified citrate method described in reference [28].
Briefly, 100 mL of HAuCl4 (0.01%) was heated to boiling under vigorous stirring, which was followed by the addition of 5 mL of sodium tris-citrate solution (1%). The solution was left boiling while stirring until it turned a deep red. Then, we let the AuNPs solution cool down and stored it in the dark. In order to modify the gold nanoparticles with casein,
Figure 1. The scheme for modification of the gold layer on a TSM transducer and the cleavage ofβ-casein by trypsin.

Biosensors 2021, 11, 117 4 of 17
2.3. TSM Measurements
AT-cut 8.0 MHz gold electrode-coated quartz crystals, modified on one side by MUAwith activated carboxylic groups by NHS/EDC as described above, were incorporated intoa home-built flow-through thickness shearing mode (TSM) acoustic wave device sensorsystem. The setup and general configuration of the flow-through system is described inreference [19]. One side of the crystal was exposed to liquid, the other one was exposed toair. The liquid was introduced using a syringe pump (Genie Plus, Torrington, CT, USA).Runs were performed with the crystals in the vertical position and at ambient temperature(approximately 20 C). The modified crystal was secured in the holder using two O-rings.The gold electrodes were kept in contact with the gold leads in the holder. Resonancefrequency, f, and motional resistance, Rm, were determined based on the Butterworth–vanDyke (BVD) model of a quartz crystal resonator [19]. The resonant frequency represents theenergy storage and reflects the mass changes of the oscillating layer, while Rm is related tothe dissipation of energy and provides evidence of changes in the shearing viscosity of thelayer [22]. The measuring procedure was as follows. Each slide was flushed through withPBS at a flow rate of 50 µL/min until a stable baseline was achieved (45 min), using theflow-through injection system. This step was necessary to remove any weakly adsorbedmolecules at the surface of the TSM transducer. Next, the pump was momentarily stopped.The β-casein solution (0.5 mg/mL in PBS) was slowly introduced to the sample, whilethe PBS was exchanged out in order to minimize pressure effects to the system. β-caseinwas introduced at a rate of 50 µL/min for approximately 45 min. Once again, the pumpwas momentarily stopped, and the sample input tube was slowly placed back into thePBS solution. The PBS was re-introduced at a rate of 50 µL/min to remove any looselybound casein until a stable baseline was achieved. Changes of the resonant frequencyand motional resistance were recorded. For proteolysis measurements, solutions withvarious concentrations of trypsin in PBS (0.1, 0.5, 1, 5, 10, and 20 nM) were flowed overTSM crystals with an immobilized β-casein layer at a flow rate of 50 µL/min. Trypsin andβ-casein solutions were freshly prepared before each experiment.
2.4. Synthesis and Modification of AuNPs
AuNPs were prepared using a modified citrate method described in reference [28].Briefly, 100 mL of HAuCl4 (0.01%) was heated to boiling under vigorous stirring, whichwas followed by the addition of 5 mL of sodium tris-citrate solution (1%). The solution wasleft boiling while stirring until it turned a deep red. Then, we let the AuNPs solution cooldown and stored it in the dark. In order to modify the gold nanoparticles with casein, weadded 2 mL of 0.1 mg/mL β-casein to 18 mL of the AuNPs solution. After 2 h of incubationat room temperature without stirring, the gold nanoparticles were further incubated with200 µL of 1 mM MCH overnight for approximately 18 h. The scheme of modification ofAuNPs is showed in Figure 2.
2.5. Sprectrophotometric Assay
For the colorimetric assay, we prepared 0.95 mL of AuNPs. Trypsin was dissolved indeionized water, and 0.05 mL of trypsin from the stock solution was added to each cuvette.The concentration of trypsin in cuvettes was 0.1, 0.5, 1, 5, and 10 nM at 1 mL total volumeof solution. We also used a reference cuvette where only 0.05 mL of protease-free waterwas added to the AuNPs solution. We measured the spectra of the AuNPs before trypsinaddition (0 min), just after trypsin addition (approximately 1 s), and then every 15 min upto 60 min. The measurement was repeated 3 times. We multiplied the value of absorbanceat time t = 0 by the dilution factor to correct the changes in absorbance intensity caused bythe initial protease addition. Absorbance was measured by UV-1700 spectrophotometerat a temperature of around 20 C and in the wavelength range of 220–800 nm (Shimadzu,Kyoto, Japan).

Biosensors 2021, 11, 117 5 of 17
Biosensors 2021, 11, x FOR PEER REVIEW 5 of 17
we added 2 mL of 0.1 mg/mL β-casein to 18 mL of the AuNPs solution. After 2 h of incu-bation at room temperature without stirring, the gold nanoparticles were further incu-bated with 200 μL of 1 mM MCH overnight for approximately 18 h. The scheme of modi-fication of AuNPs is showed in Figure 2.
Figure 2. The scheme for modification of gold nanoparticles (AuNPs) by β-casein and by 6-mer-capto-1-hexanol (MCH) as well as the cleavage of β-casein by trypsin. Before enzymatic digestion, functionalized AuNPs were stable due to steric stabilization. After the AuNPs were subjected to protease cleavage, the casein was removed from the surface of AuNPs/MCH/β-casein. This caused the destabilization of the NPs, followed by their aggregation.
2.5. Sprectrophotometric Assay For the colorimetric assay, we prepared 0.95 mL of AuNPs. Trypsin was dissolved in
deionized water, and 0.05 mL of trypsin from the stock solution was added to each cu-vette. The concentration of trypsin in cuvettes was 0.1, 0.5, 1, 5, and 10 nM at 1 mL total volume of solution. We also used a reference cuvette where only 0.05 mL of protease-free water was added to the AuNPs solution. We measured the spectra of the AuNPs before trypsin addition (0 min), just after trypsin addition (approximately 1 s), and then every 15 min up to 60 min. The measurement was repeated 3 times. We multiplied the value of absorbance at time t = 0 by the dilution factor to correct the changes in absorbance intensity caused by the initial protease addition. Absorbance was measured by UV-1700 spectro-photometer at a temperature of around 20 °C and in the wavelength range of 220–800 nm (Shimadzu, Kyoto, Japan).
2.6. Analysis of Casein Adsorption and Hydrolysis Processes The surface concentration (ΓQCM, ng/cm2) of the adsorbed β-casein layer on the TSM
transducer was determined by a modified Sauerbrey Equation (1) as follows: 𝛤 = µ , (1)
where A is the area of the electrode, ρ = 2.648 g/cm3 is the density of quartz, μ = 2.947 × 10¹¹ g/cms2 is the shear modulus of AT-cut crystal, and f0 is fundamental resonant fre-quency [29]. The Sauerbrey equation is strongly valid for thin rigid films at the surface of quartz crystal in vacuum. However, in a liquid, the viscoelastic contribution can affect the frequency changes. Through analysis of the motional resistance, Rm, it is possible to esti-mate whether the mass or viscosity is dominant in frequency changes. It has been shown that the slope of |Δf/ΔRm| can be used for quantitative estimation whether the changes in frequency can be attributed to mass or to viscosity effects. For ideal rigid films, the ΔRm values are practically zero. This means that |Δf/ΔRm| parameters higher than a certain critical value can be assigned to the mass effect [30]. According to the calculations made
Figure 2. The scheme for modification of gold nanoparticles (AuNPs) by β-casein and by 6-mercapto-1-hexanol (MCH) as well as the cleavage of β-casein by trypsin. Before enzymatic digestion, func-tionalized AuNPs were stable due to steric stabilization. After the AuNPs were subjected to proteasecleavage, the casein was removed from the surface of AuNPs/MCH/β-casein. This caused thedestabilization of the NPs, followed by their aggregation.
2.6. Analysis of Casein Adsorption and Hydrolysis Processes
The surface concentration (ΓQCM, ng/cm2) of the adsorbed β-casein layer on the TSMtransducer was determined by a modified Sauerbrey Equation (1) as follows:
ΓQCM =−A√
µρ∆ f2 f 2
0, (1)
where A is the area of the electrode, ρ = 2.648 g/cm3 is the density of quartz, µ = 2.947× 10¹¹ g/cms2 is the shear modulus of AT-cut crystal, and f 0 is fundamental resonantfrequency [29]. The Sauerbrey equation is strongly valid for thin rigid films at the surfaceof quartz crystal in vacuum. However, in a liquid, the viscoelastic contribution can affectthe frequency changes. Through analysis of the motional resistance, Rm, it is possible toestimate whether the mass or viscosity is dominant in frequency changes. It has beenshown that the slope of |∆f/∆Rm| can be used for quantitative estimation whether thechanges in frequency can be attributed to mass or to viscosity effects. For ideal rigid films,the ∆Rm values are practically zero. This means that |∆f/∆Rm| parameters higher than acertain critical value can be assigned to the mass effect [30]. According to the calculationsmade in ref. [30] for the AT cut quartz crystal with fundamental frequency f 0 = 8 MHz,|∆f/∆Rm| = 10.37 Hz/Ω.
The frequency changes following the addition of the trypsin were normalized to thechanges of the resonant frequency caused by adsorption of the β-casein at the surface ofTSM crystal. This allowed consideration of a possible variation in the properties of theβ-casein layers that were subsequently cleaved by trypsin. The normalized frequencychanges were expressed as ∆fN = (∆fTRY/∆fcasein) × 100(%), where ∆fTRY are changes infrequency following the addition of trypsin at certain concentration of the protease and∆fcasein are changes in frequency caused by the formation of a β-casein layer.
An inverse Michaelis–Menten (MM) model [31] was used to describe the dependenceof the normalized frequency changes vs. concentration of trypsin at fixed concentration ofthe β-casein at the surface of TSM transducer:
∆ fN = (∆ fN)maxCTRY
KM + CTRY(2)
where (∆fN)max is the maximal change of the frequency that corresponds to the maximumrate of enzyme reaction achieved by the system happening at saturating enzyme concentra-

Biosensors 2021, 11, 117 6 of 17
tion, CTRY is the concentration of trypsin, KM is the reverse Michalis–Menten constant thatis equal to the trypsin concentration that achieves half of maximum rate. The hydrolysis ofβ-casein in a volume was modeled with an inverse MM Equation (3) as well
A0 − A15
A0100 = vmax
CTRYKM + CTRY
, (3)
where A0 is the absorbance of AuNPs before exposure to trypsin, A15 is the absorbanceafter 15 min of exposure to trypsin, and vmax = [100 × (A0 − A15)/A0]max represents themaximum rate achieved by the system.
2.7. Data Analysis
Origin version 7.5 software (Microcal Software Inc., Northampton, MA, USA) wasused for curve-fitting and data analysis. Data were obtained from a minimum of 3 inde-pendent experiments.
3. Results and Discussion3.1. Development of Acoustic Biosensor for the Detection of Trypsin Activity at Surfaces
For the detection of trypsin activity at surfaces, it is crucial to optimize the methods ofpreparation of the protein layers that serve as a substrate for the protease of interest. Thepreparation of the protein layers on the surface of the transducers is a common applicationof acoustic biosensors. For instance, the preparation of casein layers is attractive for futureapplications in the pharmaceutical and food industries [32].
In this study, we have monitored the activity of trypsin at various concentrations(from 0.1 to 20 nM) in the hydrolysis of a β-casein layer immobilized onto a gold surface bya carboxylate terminated self-assembled monolayer (SAM) of MUA using a TSM technique.MUA strongly binds to gold through thiol groups in a high level of molecular dimensionorder, forming a stable SAM [33]. The formation of the SAM itself enables the coupling ofactivated carboxylic groups with free amino groups in the β-casein, which is an effectivemethod for immobilizing proteins on a gold surface [34–36].
Figure 3 illustrates typical kinetic changes of the frequency, ∆f, and motional resistance,∆Rm, obtained during the TSM experiment. The TSM crystal covered by the MUA layeractivated by EDC/NHS established in a flow cell has been first washed by PBS. As soonas the stable baseline was established, the β-casein dissolved in PBS in a concentration of0.5 mg/mL has been added. The sharp drop of the resonant frequency and an increaseof the motional resistance were observed, indicating the adsorption of the β-casein tothe quartz crystal/liquid interface. The washing of the surface by PBS resulted in only aslight increase of the frequency, which is evidence of removal of weakly adsorbed β-caseinmolecules from the surface. Thus, the frequency did not recover to the original valueobtained when the crystals were exposed to the buffer. This suggests that there weretwo modes of casein binding to the MUA surface, a tightly bound layer and a weaklybound layer, and that only loosely bound casein layers were removed during the PBSwashing [37]. Since the increase in resonant frequency after PBS washing was so small, wecan speculate that β-casein adsorbed on the MUA formed a stable immobilized layer, whichmakes this result attractive for its potential applications in biosensors for the detection ofprotease activity.
The resulting frequency shift after the adsorption of the β-casein to the surfaces ofthe crystal was around −199.43 Hz. Furthermore, the buffer was changed to a 20 nMtrypsin solution. The frequency increased asymptotically to reach a stable value, indicatingthat the proteolysis process occurred. Washing of the surface by PBS did not result insignificant changes of frequency and motional resistance, which is evidence that the cleavedpeptide residues were removed from the surface in a flow mode during the applicationof trypsin. The kinetics of the changes of the resonant frequency and motional resistancewere recorded for different trypsin concentrations, each one with a new quartz crystal anda newly adsorbed β-casein layer.

Biosensors 2021, 11, 117 7 of 17
Biosensors 2021, 11, x FOR PEER REVIEW 7 of 17
casein molecules from the surface. Thus, the frequency did not recover to the original value obtained when the crystals were exposed to the buffer. This suggests that there were two modes of casein binding to the MUA surface, a tightly bound layer and a weakly bound layer, and that only loosely bound casein layers were removed during the PBS washing [37]. Since the increase in resonant frequency after PBS washing was so small, we can speculate that β-casein adsorbed on the MUA formed a stable immobilized layer, which makes this result attractive for its potential applications in biosensors for the detec-tion of protease activity.
Figure 3. Typical kinetics of the changes of resonant frequency, Δf, and motional resistance, ΔRm, of the thickness-shear mode (TSM) transducer for various modifications. The additions of β-casein, trypsin, and washing of the surface by phosphate-buffered saline (PBS) are shown by arrows.
The resulting frequency shift after the adsorption of the β-casein to the surfaces of the crystal was around −199.43 Hz. Furthermore, the buffer was changed to a 20 nM tryp-sin solution. The frequency increased asymptotically to reach a stable value, indicating that the proteolysis process occurred. Washing of the surface by PBS did not result in sig-nificant changes of frequency and motional resistance, which is evidence that the cleaved peptide residues were removed from the surface in a flow mode during the application of trypsin. The kinetics of the changes of the resonant frequency and motional resistance were recorded for different trypsin concentrations, each one with a new quartz crystal and a newly adsorbed β-casein layer.
Earlier works indicated that the Sauerbrey Equation (1) can be applied to obtain a rough estimate for the surface concentration of the adsorbed β-casein layer [23,38,39], which is valid only for the specific case of a crystal being loaded with rigid, well-adhered layers in air with a minor contribution to the surface viscosity [19,40,41]. As we mentioned in Section 2.6, the contribution of viscosity into the frequency changes can be estimated from the ratio |Δf/ΔRm|. At the highest concentration of trypsin (20 nM) studied and at the steady-state conditions (Figure 1), |Δf/ΔRm| = 199.43 Hz/7.4 Ω = 26.95 Hz/Ω. This value is much higher than the threshold value (10.37 Hz/Ω). This means that the changes of frequency are related mainly to the changes of the mass.
Therefore, with an awareness of the limitations stated above, Equation (1) can be used to estimate the amount of proteins on the surface (ΓQCM, ng/cm2) [38]. The average value
Figure 3. Typical kinetics of the changes of resonant frequency, ∆f, and motional resistance, ∆Rm,of the thickness-shear mode (TSM) transducer for various modifications. The additions of β-casein,trypsin, and washing of the surface by phosphate-buffered saline (PBS) are shown by arrows.
Earlier works indicated that the Sauerbrey Equation (1) can be applied to obtain arough estimate for the surface concentration of the adsorbed β-casein layer [23,38,39],which is valid only for the specific case of a crystal being loaded with rigid, well-adheredlayers in air with a minor contribution to the surface viscosity [19,40,41]. As we mentionedin Section 2.6, the contribution of viscosity into the frequency changes can be estimatedfrom the ratio |∆f/∆Rm|. At the highest concentration of trypsin (20 nM) studied and atthe steady-state conditions (Figure 1), |∆f/∆Rm| = 199.43 Hz/7.4 Ω = 26.95 Hz/Ω. Thisvalue is much higher than the threshold value (10.37 Hz/Ω). This means that the changesof frequency are related mainly to the changes of the mass.
Therefore, with an awareness of the limitations stated above, Equation (1) can beused to estimate the amount of proteins on the surface (ΓQCM, ng/cm2) [38]. The averagevalue of the frequency shift after the adsorption of the β-casein to hydrophilic surfaces was−165.26± 47.7 Hz. Using this value, as well as A = 0.2 cm2 for the area of the electrode of anAT-cut quartz crystal (f0 = 8 MHz fundamental resonant frequency), a surface concentrationof 228.1 ± 65.8 ng/cm2 was obtained for β-casein.
This is in good agreement with earlier experimental works based on ellipsometry thatreported 200–300 ng/cm2 for a full-coverage monolayer of β-casein [42–44]. Furthermore,QCM studies by Tatarko et al. estimated a mass density of 350 ng/cm2 for the immobilizedβ-casein monolayer [23]. These results support the interpretation that the surface concen-tration of β-casein obtained by TSM measurements corresponds to monolayer formation.
Based on the kinetic curves obtained for the concentration range of trypsin 0.1–20 nM,we prepared a plot of the frequency and motional resistance changes as a function oftrypsin concentration (Figure 4). It can be seen that the frequency changes increase withincreasing the trypsin concentration and started to saturate at CTRY > 10 nM. In contrastwith frequency, Rm decreased with increasing the concentration of the protease, which isevidence of dominant mass changes.

Biosensors 2021, 11, 117 8 of 17
Biosensors 2021, 11, x FOR PEER REVIEW 8 of 17
of the frequency shift after the adsorption of the β-casein to hydrophilic surfaces was −165.26 ± 47.7 Hz. Using this value, as well as A = 0.2 cm2 for the area of the electrode of an AT-cut quartz crystal (f0 = 8 MHz fundamental resonant frequency), a surface concen-tration of 228.1 ± 65.8 ng/cm2 was obtained for β-casein.
This is in good agreement with earlier experimental works based on ellipsometry that reported 200–300 ng/cm2 for a full-coverage monolayer of β-casein [42–44]. Further-more, QCM studies by Tatarko et al. estimated a mass density of 350 ng/cm2 for the im-mobilized β-casein monolayer [23]. These results support the interpretation that the sur-face concentration of β-casein obtained by TSM measurements corresponds to monolayer formation.
Based on the kinetic curves obtained for the concentration range of trypsin 0.1–20 nM, we prepared a plot of the frequency and motional resistance changes as a function of trypsin concentration (Figure 4). It can be seen that the frequency changes increase with increasing the trypsin concentration and started to saturate at CTRY > 10 nM. In contrast with frequency, Rm decreased with increasing the concentration of the protease, which is evidence of dominant mass changes.
Figure 4. Plots of changes of frequency, Δf, and motional resistance, ΔRm, vs. trypsin concentration (CTRY). Statistically, a value for the standard deviation was obtained from three independent exper-iments at each trypsin concentration.
For practical purposes, for the detection of trypsin in food or in other biological sam-ples such as blood or blood plasma, it is convenient to analyze the effect of trypsin on the cleavage of β-casein by changes of resonant frequency of the quartz crystal under steady-state conditions. In order to minimize the effect of variation of the properties of β-casein layers at the monolayer of 11-mercaptoundecanoic acid (MUA) on the resonant frequency, we plotted the normalized frequency changes: ΔfN = (ΔfTRY/Δfcasein) × 100% vs. concentra-tion of trypsin, CTRY (ΔfTRY is the frequency change corresponded to the cleavage of β-casein layer after incubation with a certain concentration of trypsin and Δfcasein is the fre-quency changes corresponded to the adsorption of β-casein at the MUA layer before tryp-sin addition). This dependence shown on Figure 5 can be fitted by the Langmuir isotherm (see Section 2.6 and Equation (2)).
Figure 4. Plots of changes of frequency, ∆f, and motional resistance, ∆Rm, vs. trypsin concentra-tion (CTRY). Statistically, a value for the standard deviation was obtained from three independentexperiments at each trypsin concentration.
For practical purposes, for the detection of trypsin in food or in other biologicalsamples such as blood or blood plasma, it is convenient to analyze the effect of trypsinon the cleavage of β-casein by changes of resonant frequency of the quartz crystal understeady-state conditions. In order to minimize the effect of variation of the properties ofβ-casein layers at the monolayer of 11-mercaptoundecanoic acid (MUA) on the resonantfrequency, we plotted the normalized frequency changes: ∆fN = (∆fTRY/∆fcasein) × 100%vs. concentration of trypsin, CTRY (∆fTRY is the frequency change corresponded to thecleavage of β-casein layer after incubation with a certain concentration of trypsin and∆fcasein is the frequency changes corresponded to the adsorption of β-casein at the MUAlayer before trypsin addition). This dependence shown on Figure 5 can be fitted by theLangmuir isotherm (see Section 2.6 and Equation (2)).
The fitting of calibration plots yielded (∆fN)max = 70.36± 4.60 and KM =0.92± 0.44 nM.The limit of detection (LOD) has been determined from the linear part of the dependencepresented in Figure 5 using the 3.3(SD)/S rule (SD is standard deviation at the lowestconcentration of trypsin, S is the slop of the linear dependence) as LOD = 0.48 ± 0.08 nM.Thus, in the presence of 20 nM trypsin, almost 70% of the casein layer is removed due toprotease cleavage. This value is close to the maximum cleavage obtained by fitting theLangmuir isotherm. It can be assumed that due to the restricted access of the trypsin to thecasein layer at the surface of the TSM transducer, around 30% of the casein remained at thesurface after protease cleavage.
β-casein interacts with the immobilized MUA layer preferably with N-terminus.This part of the protein contains most of the charge [45]. It also contains numerous freeamino groups that amino-reactive MUA can bind. β-casein is composed of 209 aminoacids starting with arginine at the N-end (Arg1) [46]. The immediate binding of Arg1 toMUA is possible. Following the addition of trypsin, the cleavage of available peptidebonds toward the C-terminus of lysine and partially arginine occurs. These cleavage sitesfor trypsin are mostly identical to that of the plasmin [47]. The only unique cleavagesite for trypsin is located between Arg202-Gly203, near the C-terminus [48]. The mostcommon hydrolysis takes place at Lys28-Lys29, Lys105-His106, and Lys107-Glu108 with the

Biosensors 2021, 11, 117 9 of 17
subsequent cleavage at Lys97-Ala98, Lys99-Glu100, and Lys113-Tyr114 [49]. The cleavageof these peptide bonds should cause release of the β-casein fragments (or so called γ-caseinfragments) that corresponds to up to 88% of the β-casein molecular weight. This ratio canbe affected by the β-casein assembly on the MUA layer and thus the availability of suchbonds to the trypsin. Considering that approximately 70% of casein fragments are releasedfrom the sensing, we can speculate that the closest site for its cleavage by trypsin at theMUA layer is probably after Lys48. According to the ExPASy Peptide Cutter tool [50], thecleavage of β-casein by trypsin at Lys48 is highly probable.
Biosensors 2021, 11, x FOR PEER REVIEW 9 of 17
Figure 5. Plot of the normalized changes of the resonant frequency ΔfN vs. trypsin concentrations, CTRY. Standard deviation values are obtained from three independent experiments. The red line is the fit according to the Langmuir isotherm (Equation (2)) with accuracy R2 = 0.99.
The fitting of calibration plots yielded (ΔfN)max = 70.36 ± 4.60 and KM =0.92 ± 0.44 nM. The limit of detection (LOD) has been determined from the linear part of the dependence presented in Figure 5 using the 3.3(SD)/S rule (SD is standard deviation at the lowest con-centration of trypsin, S is the slop of the linear dependence) as LOD = 0.48 ± 0.08 nM. Thus, in the presence of 20 nM trypsin, almost 70% of the casein layer is removed due to protease cleavage. This value is close to the maximum cleavage obtained by fitting the Langmuir isotherm. It can be assumed that due to the restricted access of the trypsin to the casein layer at the surface of the TSM transducer, around 30% of the casein remained at the surface after protease cleavage.
β-casein interacts with the immobilized MUA layer preferably with N-terminus. This part of the protein contains most of the charge [45]. It also contains numerous free amino groups that amino-reactive MUA can bind. β-casein is composed of 209 amino acids start-ing with arginine at the N-end (Arg1) [46]. The immediate binding of Arg1 to MUA is possible. Following the addition of trypsin, the cleavage of available peptide bonds to-ward the C-terminus of lysine and partially arginine occurs. These cleavage sites for tryp-sin are mostly identical to that of the plasmin [47]. The only unique cleavage site for tryp-sin is located between Arg202-Gly203, near the C-terminus [48]. The most common hy-drolysis takes place at Lys28-Lys29, Lys105-His106, and Lys107-Glu108 with the subse-quent cleavage at Lys97-Ala98, Lys99-Glu100, and Lys113-Tyr114 [49]. The cleavage of these peptide bonds should cause release of the β-casein fragments (or so called γ-casein fragments) that corresponds to up to 88% of the β-casein molecular weight. This ratio can be affected by the β-casein assembly on the MUA layer and thus the availability of such bonds to the trypsin. Considering that approximately 70% of casein fragments are released from the sensing, we can speculate that the closest site for its cleavage by trypsin at the MUA layer is probably after Lys48. According to the ExPASy Peptide Cutter tool [50], the cleavage of β-casein by trypsin at Lys48 is highly probable.
In the paper by Chen et al. [51], the detection of trypsin activity based on the electro-chemical method has been reported. They applied a gold working electrode modified with a short peptide substrate conjugated with graphene oxide (GO) and the thionine redox
0 5 10 15 20
0
10
20
30
40
50
60
70
80
ΔfN (
%)
CTRY (nM)Figure 5. Plot of the normalized changes of the resonant frequency ∆fN vs. trypsin concentrations,CTRY. Standard deviation values are obtained from three independent experiments. The red line isthe fit according to the Langmuir isotherm (Equation (2)) with accuracy R2 = 0.99.
In the paper by Chen et al. [51], the detection of trypsin activity based on the electro-chemical method has been reported. They applied a gold working electrode modified witha short peptide substrate conjugated with graphene oxide (GO) and the thionine redoxlabel. The incubation of the sensor with trypsin for 2 h resulted in cleavage of the peptidesubstrate, removal of the redox probe, and a decrease of the current amplitude. Althoughthe authors reported a lower detection limit, down to 0.05 nM, and a high selectivity totrypsin, this method has some drawbacks. First, the biosensor was based on the peptidesubstrate labeled by the graphene oxide (GO)–thionine conjugate, which is not availablecommercially. The peptide–GO–thionine conjugates are more expensive in comparisonwith the β-casein used in our work. Therefore, this limits the practical application of suchan electrochemical sensor. Moreover, unlike the label-free approach presented in our work,the method by Chen et al. cannot monitor the trypsin activity in real time, because thisactivity was detected only after 2 h of incubation of the trypsin with the peptide-modifiedelectrode. It should be also mentioned that commercially available enzyme-linked im-munosorbent assay (ELISA) kits for trypsin possess also high selectivity and sensitivitysimilar to the work of Chen et al. (down to 0.012 nM) [52]. However, those kits require ex-pensive antibodies, and detection is carried out in several steps. Furthermore, ELISA does

Biosensors 2021, 11, 117 10 of 17
not allow monitoring of the kinetics of the trypsin activity. The acoustic sensor developedby us is sufficiently sensitive (LOD of 0.48 ± 0.08 nM) to detect such dangerous diseases ascystic fibrosis, acute pancreatitis, or the acute phase of chronic pancreatitis that are char-acterized by raised concentration of trypsin in blood in the range of 2.1–71.4 nM [7,8]. Incontrast with ELISA, the TSM biosensor is label-free, straightforward, and facile regardingthe evaluation of the response. In addition, the TSM method can be used in samples thatare not transparent.
3.2. Sprectophtometric Assay of Protease Activity
In colorimetric sensor applications, AuNPs are most widely used due to their highstability, facile synthesis, excellent biocompatibility, and strong surface plasmon resonanceeffect. This effect can be utilized to produce visual color changes in a process termed thecolorimetric method [53,54]. Here, we report the results of a simple colorimetric assaybased on the optical properties of functionalized AuNPs (Figure 2). The purpose of thisstudy was a comparison of the sensitivity of surface-based (TSM) and volume-sensitivemethods of trypsin activity detection. We used a slightly modified version of the methodreported by Chuang et al. [26]. However, instead of gelatin, β-casein has been used as asubstrate for trypsin digestion. Briefly, for the protease assay, AuNPs were first modifiedby β-casein and subsequently with MCH. The molecules of MCH are chemisorbed to theAuNPs through a thiol group (-SH) substitution and the hydroxyl group (-OH) exposedon the AuNPs surface enhances the attraction force between AuNPs. Additionally, MCHmolecules on the AuNPs act as blockers, while covering the surface area of the AuNPsthat are not conjugated with casein and blocking adsorption of the protease on the surfaceof the AuNPs [26]. The addition of MCH to the AuNPs–β-casein solution led to a colorchange from wine-red to violet. When trypsin digests the casein at AuNPs/MCH–casein,NPs aggregated due to the removal of the protective layer of casein and the color changefrom violet to blue occurred within minutes; then, the solution became colorless.
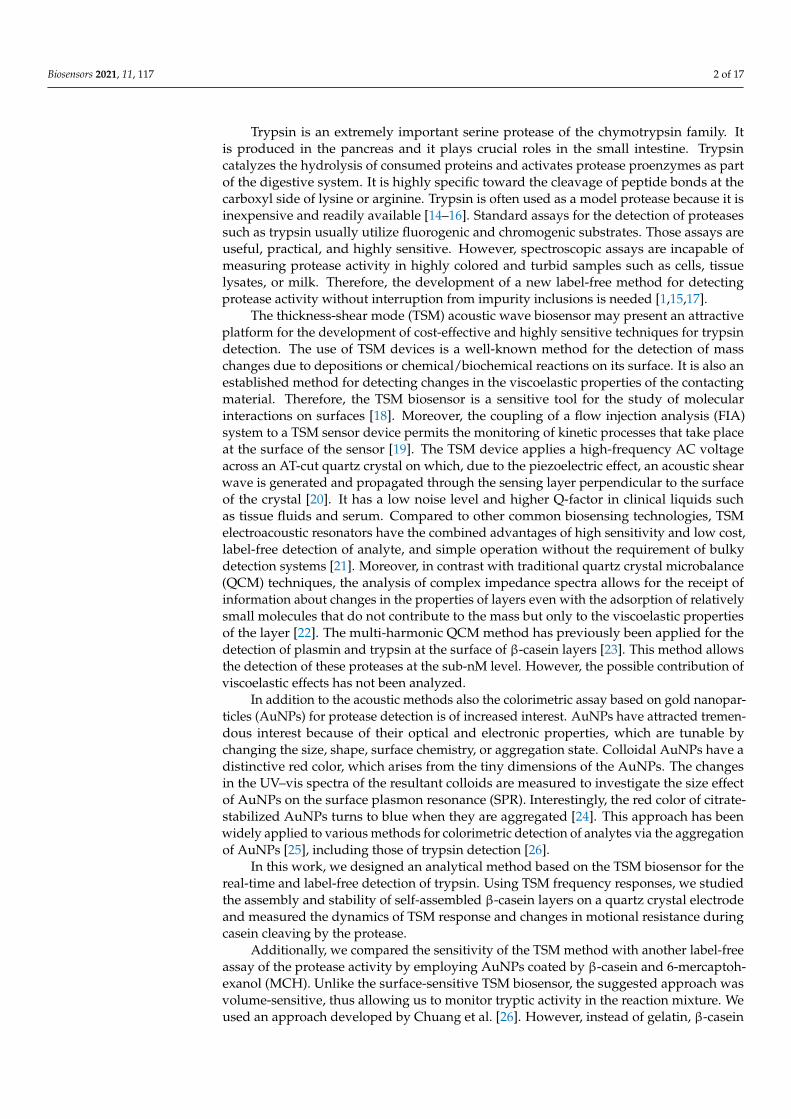
The absorption spectra of AuNPs in the absence of β-casein (black curve), presenceof β-casein (red curve), presence of β-casein and MCH (blue curve), and AuNPs withchemisorbed MCH (magenta curve) are shown in Figure 6. The absorption peak of pureAuNPs is centered at 520 nm as expected. This indicates that the gold colloids are notaggregated but well dispersed as individual particles [55]. After the modification of AuNPswith β-casein, the position of the maximum absorption of AuNPs shifted from 520 to525 nm, which indicates the formation of bioconjugates [55]. The shift is identical withthose reported in [26] for AuNPs modified by gelatin. The red shift in the position of theplasmon absorption band is produced by a perturbation in the dielectric constant aroundthe nanoparticles due to the chemisorption of β-casein molecules [56]. No significantbroadening of the spectrum was observed after the β-casein adsorption process, whichindicates that the separation distance between AuNPs is higher than their radii, and thatAuNPs do not experience aggregation into larger nanoparticles upon the adsorption ofβ-casein [55]. Further modification with MCH resulted in a significant red shift around60 nm accompanied by the broadening of the spectrum. This broadening is indicative ofan aggregation of nanoparticles This is due to the replacement of the β-casein protectivelayer with MCH, which in turn makes the nanoparticles closer to each other [57,58]. Themodification of AuNPs with MCH resulted in a significant red shift, indicating strongaggregation of the nanoparticles.
Additionally, a less expressed maximum at 280 nm is observed after the modificationof AuNPs by β-casein. This is due to the absorption of β-casein’s amino acids at thiswavelength. The amplitude of this peak decreases after the chemisorption of MCH, whichis probably due to the removal of weakly adsorbed casein molecules from the surface ofAuNPs. Furthermore, we carried out a quantitative analysis of trypsin activity via theUV-vis spectroscopy method. For this purpose, trypsin was added to the AuNPs solution.We recorded the changes of absorbance spectra of the AuNPs suspension during the trypsincleavage at 0 min, 0.01 min, 15 min, 30 min, 45 min, and 60 min. Figure 7 illustrates the

Biosensors 2021, 11, 117 11 of 17
changes in spectra over time in a 10 nM concentration of trypsin. A substantial red shift(up to 640 nm) of the spectra and a decrease in absorbance with time was observed at thisconcentration of trypsin, due to trypsin-induced aggregation caused by the cleavage of theAuNPs’ protective shell as well as the MCH induced increase of attractive force betweenthe AuNPs. Moreover, the absorbance spectra showed a decrease in the absorption spectraat 280 nm when the AuNPs/MCH–casein was digested by trypsin. It can also be seenthat the absorbance decreased with time. The absorbance also started to decrease aftermaximum shifting. Our results are in good agreement with those previously reported byChuang et al., whose work served as our inspiration to design a colorimetric assay basedon an AuNPs/MCH-protein platform. Chuang et al. demonstrated that protein modifiedAuNPs aggregation after treatment with protease can be successfully monitored via thered shift of absorption spectra [26].
Biosensors 2021, 11, x FOR PEER REVIEW 11 of 17
casein [55]. Further modification with MCH resulted in a significant red shift around 60 nm accompanied by the broadening of the spectrum. This broadening is indicative of an aggregation of nanoparticles This is due to the replacement of the β-casein protective layer with MCH, which in turn makes the nanoparticles closer to each other [57,58]. The modi-fication of AuNPs with MCH resulted in a significant red shift, indicating strong aggre-gation of the nanoparticles.
Figure 6. UV-vis absorption spectra of gold nanoparticles (AuNPs): bare (black), modified by β-casein (red), and subsequently modified by 6-mercapto-1-hexanol (MCH) (blue) as well as AuNPs modified by MCH (magenta).
Additionally, a less expressed maximum at 280 nm is observed after the modification of AuNPs by β-casein. This is due to the absorption of β-casein’s amino acids at this wave-length. The amplitude of this peak decreases after the chemisorption of MCH, which is probably due to the removal of weakly adsorbed casein molecules from the surface of AuNPs. Furthermore, we carried out a quantitative analysis of trypsin activity via the UV-vis spectroscopy method. For this purpose, trypsin was added to the AuNPs solution. We recorded the changes of absorbance spectra of the AuNPs suspension during the trypsin cleavage at 0 min, 0.01 min, 15 min, 30 min, 45 min, and 60 min. Figure 7 illustrates the changes in spectra over time in a 10 nM concentration of trypsin. A substantial red shift (up to 640 nm) of the spectra and a decrease in absorbance with time was observed at this concentration of trypsin, due to trypsin-induced aggregation caused by the cleavage of the AuNPs’ protective shell as well as the MCH induced increase of attractive force be-tween the AuNPs. Moreover, the absorbance spectra showed a decrease in the absorption spectra at 280 nm when the AuNPs/MCH–casein was digested by trypsin. It can also be seen that the absorbance decreased with time. The absorbance also started to decrease after maximum shifting. Our results are in good agreement with those previously re-ported by Chuang et al., whose work served as our inspiration to design a colorimetric assay based on an AuNPs/MCH-protein platform. Chuang et al. demonstrated that pro-tein modified AuNPs aggregation after treatment with protease can be successfully mon-itored via the red shift of absorption spectra [26].
Figure 6. UV-vis absorption spectra of gold nanoparticles (AuNPs): bare (black), modified by β-casein (red), and subsequently modified by 6-mercapto-1-hexanol (MCH) (blue) as well as AuNPsmodified by MCH (magenta).
Biosensors 2021, 11, x FOR PEER REVIEW 12 of 17
Figure 7. UV-vis absorption spectra of β-casein and MCH-conjugated AuNPs treated with 10 nM trypsin at different time points. Note that at time 0 and 0.01 min, the spectra are almost identical.
Trypsin at concentrations ranging from 0.1 to 10 nM was used in the study to estimate the detection limit of the optical AuNPs assay. In order to construct the calibration curve, we have plotted the changes in relative values of absorbance measured at around 640 nm after 15 min of trypsin exposure against the trypsin concentration (Figure 8a). As in the case of the analysis of trypsin activity via the TSM method, we were able to use an inverse Michaelis–Menten (MM) model expressed by Equation (3) to analyze the obtained cali-bration curve for trypsin activity in volume.
Figure 8. Calibration plots of colorimetric assay. (a) Changes in relative values of absorbance after β-casein and MCH functionalized gold nanoparticles (AuNPs/MCH-β-casein) exposure to trypsin (A0—exposure time 0 min, A15—exposure time 15 min.) vs. concentration of trypsin (CTRY). Symbols are experimental data, and the red line is the best fit of Equation (3). (b) Linear part of the calibration curve for calculation of the limit of detection (LOD). Values are means ± SD (n = 3). Red line is the linear regression fit.
The fitting of calibration plots with the MM model yielded vmax = 14.98 ± 0.81% and KM = 0.56 ± 0.10 nM. As was already mentioned, in the inverse MM model, the roles of the enzyme and substrate are swapped, and the concentration of the enzyme is changed while the substrate is presented in excess.
Figure 7. UV-vis absorption spectra of β-casein and MCH-conjugated AuNPs treated with 10 nMtrypsin at different time points. Note that at time 0 and 0.01 min, the spectra are almost identical.

Biosensors 2021, 11, 117 12 of 17
Trypsin at concentrations ranging from 0.1 to 10 nM was used in the study to estimatethe detection limit of the optical AuNPs assay. In order to construct the calibration curve,we have plotted the changes in relative values of absorbance measured at around 640 nmafter 15 min of trypsin exposure against the trypsin concentration (Figure 8a). As inthe case of the analysis of trypsin activity via the TSM method, we were able to use aninverse Michaelis–Menten (MM) model expressed by Equation (3) to analyze the obtainedcalibration curve for trypsin activity in volume.
Biosensors 2021, 11, x FOR PEER REVIEW 12 of 17
Figure 7. UV-vis absorption spectra of β-casein and MCH-conjugated AuNPs treated with 10 nM trypsin at different time points. Note that at time 0 and 0.01 min, the spectra are almost identical.
Trypsin at concentrations ranging from 0.1 to 10 nM was used in the study to estimate the detection limit of the optical AuNPs assay. In order to construct the calibration curve, we have plotted the changes in relative values of absorbance measured at around 640 nm after 15 min of trypsin exposure against the trypsin concentration (Figure 8a). As in the case of the analysis of trypsin activity via the TSM method, we were able to use an inverse Michaelis–Menten (MM) model expressed by Equation (3) to analyze the obtained cali-bration curve for trypsin activity in volume.
Figure 8. Calibration plots of colorimetric assay. (a) Changes in relative values of absorbance after β-casein and MCH functionalized gold nanoparticles (AuNPs/MCH-β-casein) exposure to trypsin (A0—exposure time 0 min, A15—exposure time 15 min.) vs. concentration of trypsin (CTRY). Symbols are experimental data, and the red line is the best fit of Equation (3). (b) Linear part of the calibration curve for calculation of the limit of detection (LOD). Values are means ± SD (n = 3). Red line is the linear regression fit.
The fitting of calibration plots with the MM model yielded vmax = 14.98 ± 0.81% and KM = 0.56 ± 0.10 nM. As was already mentioned, in the inverse MM model, the roles of the enzyme and substrate are swapped, and the concentration of the enzyme is changed while the substrate is presented in excess.
Figure 8. Calibration plots of colorimetric assay. (a) Changes in relative values of absorbance after β-casein and MCHfunctionalized gold nanoparticles (AuNPs/MCH-β-casein) exposure to trypsin (A0—exposure time 0 min, A15—exposuretime 15 min.) vs. concentration of trypsin (CTRY). Symbols are experimental data, and the red line is the best fit of Equation(3). (b) Linear part of the calibration curve for calculation of the limit of detection (LOD). Values are means ± SD (n = 3).Red line is the linear regression fit.
The fitting of calibration plots with the MM model yielded vmax = 14.98 ± 0.81% andKM = 0.56 ± 0.10 nM. As was already mentioned, in the inverse MM model, the roles ofthe enzyme and substrate are swapped, and the concentration of the enzyme is changedwhile the substrate is presented in excess.
To calculate the LOD, we used only part of the calibration curve from 0 to 5 nM, wherethe dependence was almost linear. The obtained LOD was 0.42 ± 0.03 nM, according tothe rule 3.3 (SD)/S, where SD is the standard deviation of the sample with the lowestconcentration and S is slope calculated from the fit of the linear part of the calibrationcurve [59]. The results are shown in Figure 8b.
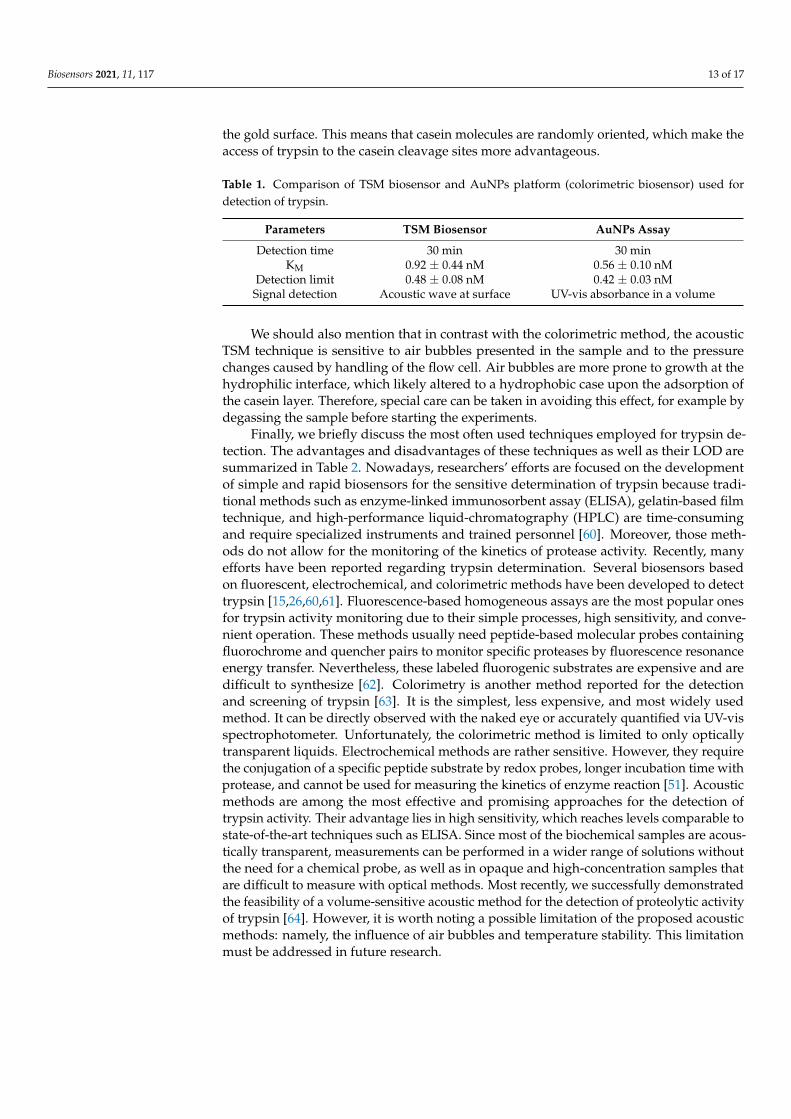
It is interesting to compare the properties of the AuNPs assay and the TSM methodused to detect trypsin activity (Table 1). On one hand, both methods successfully detectedprotease activity at the sub-nM level, within a similar time range in a real-time mode.However, it should be noted that a major drawback of the AuNPs assay is that the methodis of limited application in a turbid medium. On the other hand, unlike the TSM method,detection using the AuNPs assay can be carried out in only one step, as the signal detec-tion simply involves the direct measurement of the absorbance values at A640. It is alsointeresting to compare the reverse Michaelis–Menten constants for both methods. As canbe seen in Table 1, a lower KM value has been obtained for the AuNPs-based colorimetricassay. This can be attributed to trypsin’s better access to the β-casein substrate. Certainly,the β-casein layer is formed at MUA monolayers by covalent binding of the casein hy-drophilic amino groups. Thus, the cleavage sites are closer to the quartz crystal surfacewith limited access to the trypsin. In addition, due to covalent binding of casein moleculesat the self-assembled MUA, the casein layer is compactly packed, which creates additionalrestriction of access of trypsin to the cleavage sites. A similar conclusion was also obtainedfor chymotrypsin detection [57]. In contrast, at AuNPs, the casein is physically adsorbed at
Biosensors 2021, 11, 117 13 of 17
the gold surface. This means that casein molecules are randomly oriented, which make theaccess of trypsin to the casein cleavage sites more advantageous.
Table 1. Comparison of TSM biosensor and AuNPs platform (colorimetric biosensor) used fordetection of trypsin.
Parameters TSM Biosensor AuNPs Assay
Detection time 30 min 30 minKM 0.92 ± 0.44 nM 0.56 ± 0.10 nM
Detection limit 0.48 ± 0.08 nM 0.42 ± 0.03 nMSignal detection Acoustic wave at surface UV-vis absorbance in a volume
We should also mention that in contrast with the colorimetric method, the acousticTSM technique is sensitive to air bubbles presented in the sample and to the pressurechanges caused by handling of the flow cell. Air bubbles are more prone to growth at thehydrophilic interface, which likely altered to a hydrophobic case upon the adsorption ofthe casein layer. Therefore, special care can be taken in avoiding this effect, for example bydegassing the sample before starting the experiments.
Finally, we briefly discuss the most often used techniques employed for trypsin de-tection. The advantages and disadvantages of these techniques as well as their LOD aresummarized in Table 2. Nowadays, researchers’ efforts are focused on the developmentof simple and rapid biosensors for the sensitive determination of trypsin because tradi-tional methods such as enzyme-linked immunosorbent assay (ELISA), gelatin-based filmtechnique, and high-performance liquid-chromatography (HPLC) are time-consumingand require specialized instruments and trained personnel [60]. Moreover, those meth-ods do not allow for the monitoring of the kinetics of protease activity. Recently, manyefforts have been reported regarding trypsin determination. Several biosensors basedon fluorescent, electrochemical, and colorimetric methods have been developed to detecttrypsin [15,26,60,61]. Fluorescence-based homogeneous assays are the most popular onesfor trypsin activity monitoring due to their simple processes, high sensitivity, and conve-nient operation. These methods usually need peptide-based molecular probes containingfluorochrome and quencher pairs to monitor specific proteases by fluorescence resonanceenergy transfer. Nevertheless, these labeled fluorogenic substrates are expensive and aredifficult to synthesize [62]. Colorimetry is another method reported for the detectionand screening of trypsin [63]. It is the simplest, less expensive, and most widely usedmethod. It can be directly observed with the naked eye or accurately quantified via UV-visspectrophotometer. Unfortunately, the colorimetric method is limited to only opticallytransparent liquids. Electrochemical methods are rather sensitive. However, they requirethe conjugation of a specific peptide substrate by redox probes, longer incubation time withprotease, and cannot be used for measuring the kinetics of enzyme reaction [51]. Acousticmethods are among the most effective and promising approaches for the detection oftrypsin activity. Their advantage lies in high sensitivity, which reaches levels comparable tostate-of-the-art techniques such as ELISA. Since most of the biochemical samples are acous-tically transparent, measurements can be performed in a wider range of solutions withoutthe need for a chemical probe, as well as in opaque and high-concentration samples thatare difficult to measure with optical methods. Most recently, we successfully demonstratedthe feasibility of a volume-sensitive acoustic method for the detection of proteolytic activityof trypsin [64]. However, it is worth noting a possible limitation of the proposed acousticmethods: namely, the influence of air bubbles and temperature stability. This limitationmust be addressed in future research.

Biosensors 2021, 11, 117 14 of 17
Table 2. Comparison of the most used analytical methods for trypsin determination.
Method Advantages Disadvantages LOD, nM References
ELISA High selectivity and sensitivityRequires expensive antibodies,the kinetics of trypsin activity
cannot be measured0.012 [42]
Fluorescent assay High sensitivity, operates inreal-time mode
Fluorogenic substrates areexpensive and difficult to
be synthesized.3.8–29 [15,61]
Colorimetric assaySimple, inexpensive, and
sensitive, enables real-timedetection of trypsin activity
Limited to only opticallytransparent liquids
0.190.42 ± 0.03
[63]This work
Electrochemical sensor High sensitivityyNecessity to use peptide
substrate conjugated withgraphene oxide and thionine
0.05 [51]
Acoustic TSM sensor
High sensitivity, capable ofreal-time monitoring ofkinetics of the trypsin
mediated cleavage
Measurements are sensitive toair bubbles presented in
the sample
0.20.48 ± 0.08
[23]This work
High-resolutionultrasonic spectroscopy
High sensitivity, capable ofreal-time monitoring ofkinetics of the trypsin
mediated cleavage
Measurements are sensitive toair bubbles presented in
the sample~1.0 [64]
4. Conclusions
We have shown that β-casein forms a stable monolayer via an 11-mercaptoundecanoicacid (MUA) cross-linker at the gold surface of a piezoelectric transducer. The TSM sensorbased on a β-casein layer enabled a detection limit of 0.48 ± 0.08 nM for trypsin. Thecleavage of β-casein resulted in an increase of resonant frequency and a decrease ofmotional resistance. Furthermore, we compared the results obtained by the TSM methodwith a colorimetric assay for quantifying trypsin activity in a volume. This assay was basedon AuNPs modified by β-casein and MCH and on the phenomena of surface plasmonresonance (SPR) and yielded a detection limit of 0.42 ± 0.03 nM, which is comparablewith the LOD obtained from TSM experiments. We also analyzed the Michaelis–Mentenconstants, KM, for reverse enzymatic reaction and showed that the KM value for thecolorimetric assay (0.56 ± 0.10 nM) is lower in comparison with that obtained in the caseof the TSM method (0.92 ± 0.44 nM). This has been explained by better access of trypsinto the β-casein in a volume. The TSM method is useful for the study of the kinetics ofthe protease’s activity, which is not possible via conventional ELISA or HPLC methods.The obtained results can be considered as a first step toward the application of a TSMsensor and colorimetric assays based on β-casein for the label-free detection of trypsinactivity. For practical application in medical diagnostics, both acoustic and optical methodsneed additional validation in complex biological fluids such as blood or blood plasma.In addition, the sensitivity of the TSM method can be improved by the application ofhydrophobic substrates for casein immobilization. We anticipate in this case that thedetection limit can be improved at least five times. The improved sensitivity of detection isimportant for working with diluted bilogical samples in order to minimize the matrix effect.
Author Contributions: Investigation, validation, formal analysis, writing—original draft preparation,I.P.; investigation, validation, formal analysis, writing—original draft preparation, S.M.; investigationand formal analysis, writing—review and editing, M.T. (Marek Tatarko); conceptualization, writing—original draft preparation, writing—review and editing, supervision, project administration, fundingacquisition, T.H.; methodology, project administration, writing—review and editing, M.T. (MichaelThompson). All authors have read and agreed to the published version of the manuscript.

Biosensors 2021, 11, 117 15 of 17
Funding: This work was supported by European Union’s Horizon 2020 research and innovationprogramme under the Marie Sklodowska-Curie grant agreement No. 690,898 and by Science GrantAgency VEGA, project No. 1/0419/20.
Institutional Review Board Statement: Not applicable.
Informed Consent Statement: Not applicable.
Data Availability Statement: Not applicable.
Conflicts of Interest: The authors declare no conflict of interest.
References1. Gemene, K.L.; Meyerhoff, M.E. Detection of protease activities by flash chronopotentiometry using a reversible polycation-
sensitive polymeric membrane electrode. Anal. Biochem. 2011, 416, 67–73. [CrossRef]2. Siklos, M.; Aissa, B.; Thatcher, G.R.J. Cysteine proteases as therapeutic targets: Does selectivity matter? A systematic review of
calpain and cathepsin inhibitors. Acta Pharm. Sin. B 2015, 5, 506–519. [CrossRef]3. Glantz, M.; Rosenlow, M.; Lindmark-Månsson, H.; Johansen, L.B.; Hartmann, J.; Hojer, A.; Waak, E.; Lofgren, R.; Saeden, K.H.;
Svensson, S.; et al. Impact of protease and lipase activities on quality of Swedish raw milk. Int. Dairy J. 2020, 107, 104724. [CrossRef]4. Verdoes, M.; Verhels, S.H.L. Detection of protease activity in cells and animal. Biochim. Biophys. Acta (BBA) Proteins Proteom. 2016,
1864, 130–142. [CrossRef] [PubMed]5. Ku, M.; Hong, Y.; Heo, D.; Lee, E.; Hwang, S.; Suh, J.-S.; Yang, J. In vivo sensing of proteolytic activity with an NSET-based NIR
fluorogenic nanosensor. Biosens. Bioelectr. 2016, 77, 471–477. [CrossRef]6. Buss, C.G.; Dudani, J.S.; Akana, R.T.K.; Fleming, H.E.; Bhatia, S.N. Protease activity sensors noninvasively classify bacterial
infections and antibiotic responses. Ebiomedicine 2018, 38, 248–256. [CrossRef]7. Sharma, H.; Vyas, R.K.; Vyas, S. Role of serum trypsin level in diagnosis and prognosis of pancreatitis and compared with healthy
subjects of rajasthan. Am. J. Biochem. 2018, 8, 93–99.8. Heinrich, H.C.; Gabbe, E.E.; Icagic, F. Immunoreactive serum trypsin in diseases of the pancreas. Klin. Wochenschr. 1979,
57, 1237–1238. [CrossRef]9. Lake-Bakaar, G.; McKavanagh, S.; Redshaw, M.; Wood, T.; Summerfield, J.A.; Elias, E. Serum immunoreactive trypsin concentra-
tion after a lunch meal. Its value in the diagnosis of pancreatic disease. J. Clin. Pathol. 1979, 32, 1003–1008. [CrossRef]10. Artigas, J.M.; Garcia, M.E.; Faure, M.R.; Gimeno, A.M. Serum trypsin levels in acute pancreatic and non-pancreatic abdominal
conditions. Postgrad. Med. J. 1981, 57, 219–222. [CrossRef] [PubMed]11. Borgstrom, B.; Dahlqvist, A.; Lundh, G.; Sjovall, J. Studies of intestinal digestion and absorption in the human. J. Clin. Investig.
1957, 36, 1521–1536. [CrossRef] [PubMed]12. Mumtaz, T.; Qindeel, M.; Rehman, A.; Tarhini, M.; Ahmed, N.; Elaissari, A. Exploiting proteases for cancer theranostic through
molecular imaging and drug delivery. Int. J. Pharm. 2020, 587, 119712. [CrossRef]13. Dunn, D.T.; Stöhr, W.; Arenas-Pinto, A.; Tostevin, A.; Mbisa, J.L.; Paton, N.I. Next generation sequencing of HIV-1 protease in the
PIVOT trial of protease inhibitor monotherapy. J. Clin. Virol. 2018, 101, 63–65. [CrossRef] [PubMed]14. Kahler, U.; Kamenik, A.S.; Waibl, F.; Kraml, J.; Liedl, K.R. Protein-protein binding as a two-step mechanism: Preselection of
encounter poses during the binding of BPTI and trypsin. Biophys. J. 2020, 119, 652–666. [CrossRef]15. Hou, S.; Feng, T.; Zhao, N.; Zhang, J.; Wang, H.; Liang, N.; Zhao, L. A carbon nanoparticle-peptide fluorescent sensor custom-made
for simple and sensitive detection of trypsin. J. Pharm. Anal. 2020, 10, 482–489. [CrossRef]16. Sato, D.; Kato, T. Novel fluorescent substrates for detection of trypsin activity and 541 inhibitor screening by self-quenching.
Bioorg. Med. Chem. Lett. 2016, 26, 5736–5740. [CrossRef]17. Sao, K.; Murata, M.; Fujisaki, Y.; Umezaki, K.; Mori, T.; Niidome, T.; Katayama, Y.; Hashizume, M. A novel protease activity assay
using a protease-responsive chaperone protein. Biochem. Biophys. Res. Commun. 2009, 383, 293–297. [CrossRef] [PubMed]18. Sakti, S.P.; Lucklum, R.; Hauptmann, P.; Bühling, F.; Ansorge, S. Disposable TSM-biosensor based on viscosity changes of the
contacting medium. Biosens. Bioelectr. 2001, 16, 1101–1108. [CrossRef]19. Cavic, B.A.; Thompson, M. Interfacial nucleic acid chemistry studied by acoustic shear wave propagation. Anal. Chim. Acta 2002,
469, 101–113. [CrossRef]20. Poturnayova, A.; Karpisova, I.; Castillo, G.; Mezo, G.; Kocsis, L.; Csámpai, A.; Keresztes, Z.; Hianik, T. Detection of plasmin based
on specific peptide substrate using acoustic transducer. Sens. Actuators B Chem. 2016, 223, 591–598. [CrossRef]21. Liu, J.; Chen, D.; Wang, P.; Song, G.; Zhang, X.; Li, Z.; Wang, Y.; Wang, J.; Yang, J. A microfabricated thickness shear mode
electroacoustic resonator for the label-free detection of cardiac troponin in serum. Talanta 2020, 2015, 120890. [CrossRef] [PubMed]22. Šnejdárková, M.; Poturnayová, A.; Rybár, P.; Lhoták, P.; Himl, M.; Flídrová, K.; Hianik, T. High sensitive calixarene-based sensor
for detection of dopamine by electrochemical and acoustic methods. Bioelectrochemistry 2010, 80, 55–61. [CrossRef]23. Tatarko, M.; Muckley, E.S.; Subjakova, V.; Goswami, M.; Sumpter, B.G.; Hianik, T.; Ivanov, I.N. Machine learning enabled
acoustic detection of sub-nanomolar concentration of trypsin and plasmin in solution. Sens. Actuators B Chem. 2018,272, 282–288. [CrossRef]

Biosensors 2021, 11, 117 16 of 17
24. Lerdsri, J.; Chananchana, W.; Upan, J.; Sridara, T.; Jakmunee, J. Label-free colorimetric aptasensor for rapid detection of aflatoxinB1 by utilizing cationic perylene probe and localized surface plasmon resonance of gold nanoparticles. Sens. Actuators B Chem.2020, 320, 128356. [CrossRef]
25. Borghei, Y.-S.; Hosseinkhani, S. Colorimetric assay of apoptosis through in-situ biosynthesized gold nanoparticles inside livingbreast cancer cells. Talanta 2020, 208, 120463. [CrossRef] [PubMed]
26. Chuang, Y.-C.; Li, J.-C.; Chen, S.-H.; Liu, T.-Y.; Kuo, C.-H.; Huang, W.-T.; Lin, C.-S. An optical biosensing platform for proteinaseactivity using gold nanoparticles. Biomaterials 2010, 31, 6087–6095. [CrossRef] [PubMed]
27. Melikishvili, S.; Hianik, T.; Thompson, M. Detection of sub-nanomolar concentration of trypsin by thicken-shear mode (TSM)acoustic wave biosensor. Proceedings 2020, 60, 6.
28. Kimling, J.; Maier, M.; Okenve, B.; Kotaidis, V.; Ballot, H.; Plech, A. Turkevich method for gold nanoparticle synthesis revisited.J. Phys. Chem. B 2006, 110, 15700–15707. [CrossRef]
29. Sauerbrey, G. Verwendung von schwingquarzen zur wagung dunnerschichten und zur mikrowagung. Z. Phys. 1959,155, 206–222. [CrossRef]
30. Rehman, A.; Zeng, X. Monitoring the cellular binding events with quartz crystal microbalance (QCM) biosensors. In Biosensors andBiodetection. Methods in Molecular Biology; Prickril, B., Rasooly, A., Eds.; Humana Press: New York, NY, USA, 2017; Volume 1572,pp. 313–326.
31. Kari, J.; Andersen, M.; Borch, K.; Westh, P. An inverse michaelis-menten approach for interfacial enzyme kinetics. Catalysis 2017,7, 4904–4914. [CrossRef]
32. Dizon, M.; Tatarko, M.; Hianik, T. Advances in analysis of milk proteases activity at surfaces and in a volume by acoustic methods.Sensors 2020, 20, 5594. [CrossRef]
33. Ahmadab, A.; Moore, E. Electrochemical immunosensor modified with self-assembled monolayer of 11-mercaptoundecanoicacid on gold electrodes for detection of benzo[a]pyrene in water. Analyst 2012, 137, 5839–5844. [CrossRef] [PubMed]
34. Huenerbein, A.; Schmelzer, C.E.H.; Neubert, R.H.H. Real-time monitoring of peptic and tryptic digestions of bovine -casein usingquartz crystal microbalance. Anal. Chim. Acta 2007, 584, 72–77. [CrossRef] [PubMed]
35. Yao, J.; Lin, C.; Tao, T.; Lin, F. The effect of various concentrations of papain on the properties and hydrolytic rates of β-caseinlayers. Colloids Surf. B Biointerfaces 2013, 101, 272–279. [CrossRef]
36. Murray, B.S.; Cros, L. Adsorption of β-lactoglobulin and β-casein to metal surfaces and their removal by a non-ionic surfactant,as monitored via a quartz crystal microbalance. Colloids Surf. B Biointerfaces 1998, 10, 227–241. [CrossRef]
37. Ozeki, T.; Verma, V.; Uppalapati, M.; Suzuki, Y.; Nakamura, M.; Catchmark, J.M.; Hancock, W.O. Surface-bound casein modulatesthe adsorption and activity of kinesin on SiO2 surfaces. Biophys. J. 2009, 96, 3305–3318. [CrossRef] [PubMed]
38. Goda, T.; Miyahara, Y. Interpretation of protein adsorption through its intrinsic electric charges: A comparative studyusing a field-effect transistor, surface plasmon resonance, and quartz crystal microbalance. Langmuir 2012, 28, 14730–14738.[CrossRef] [PubMed]
39. Pérez-Fuentes, L.; Drummond, C.; Faraudo, J.; Bastos-González, D. Adsorption of milk proteins (β-casein and β-lactoglobulin)and BSA onto hydrophobic surfaces. Materials 2017, 10, 893. [CrossRef] [PubMed]
40. Románszki, L.; Tatarko, M.; Jiao, M.; Keresztes, Z.; Hianik, T.; Thompson, M. Casein probe–based fast plasmin determination inthe picomolar range by an ultra-high frequency acoustic wave biosensor. Sens. Actuators B Chem. 2018, 275, 206–214. [CrossRef]
41. Miodek, A.; Poturnayová, A.; Šnejdárková, M.; Hianik, T.; Korri-Youssoufi, H. Binding kinetics of human cellular prion detectionby DNA aptamers immobilized on a conducting polypyrrole. Anal. Bioanal. Chem. 2013, 405, 2505–2514. [CrossRef]
42. Nylander, T.; Wahlgren, N.M. Competitive and sequential adsorption of β-casein and β-lactoglobulin on hydrophobic surfacesand the interfacial structure of β-casein. J. Colloid Interface Sci. 1994, 162, 151–162. [CrossRef]
43. Nylander, T.; Tiberg, F.; Wahlgren, N.M. Evaluation of the structure of adsorbed layers of β-casein from ellipsometry and surfaceforce measurements. Int. Dairy J. 1999, 9, 313–317. [CrossRef]
44. Krisdhasima, V.; Vinaraphong, P.; McGuire, J. Adsorption kinetics and elutability of α-lactalbumin, β-casein, β-lactoglobulin, andbovine serum albumin at hydrophobic and hydrophilic interfaces. J. Colloid Interface Sci. 1993, 161, 325–334. [CrossRef]
45. Evers, C.H.J.; Andredsson, T.; Lund, M.; Skepo, M. Adsorption of unstructured protein β-casein to hydrophobic and chargedsurfaces. Langmuir 2012, 28, 11843–11849. [CrossRef]
46. Eskin, N.A.M.; Goff, H.D. Milk. In Biochemistry of Foods, 3rd ed.; Eskin, N.A.M., Shaidi, F., Eds.; Academic Press: Cambridge, MA,USA, 2013; pp. 187–214.
47. Kelly, A.L.; McSweeney, P.L.H. Indigenous proteinases in milk. In Advanced Dairy Chemistry—1 Proteins, 3rd ed.; Fox, P.F.,McSweeney, P.L.H., Eds.; Springer: New York, NY, USA, 2003; pp. 495–521.
48. Bumberger, E.; Belitz, H.D. Bitter taste of enzymic hydrolysates of casein. I. Isolation, structural and sensorial analysis of peptidesfrom tryptic hydrolysates of beta-casein. Z. Lebensmittel-Unters. Forsch. 1993, 197, 14–19. [CrossRef] [PubMed]
49. Rauh, V.M.; Johansen, L.B.; Ipsen, R.; Paulsson, M.; Larsen, L.B.; Hammershøj, M. Plasmin activity in UHT milk: Relationshipbetween proteolysis, age gelation, and bitterness. J. Agricult. Food Chem. 2014, 62, 6852–6860. [CrossRef]
50. Gasteiger, E.; Hoogland, C.; Gattiker, A.; Duvaud, S.; Wilkins, M.R.; Appel, R.D.; Bairoch, A. Protein identification and analysistools on the ExPASy server. In The Proteomics Protocols Handbook; Walker, J.M., Ed.; Humana Press: Totowa, NJ, USA, 2005;pp. 571–607.

Biosensors 2021, 11, 117 17 of 17
51. Chen, G.; Shi, H.; Ban, F.; Zhang, Y.; Sun, L. Determination of trypsin activity using a gold electrode modified with a nanocovercomposed of graphene oxide and thionine. Microchim. Acta 2015, 182, 2469–2476. [CrossRef]
52. Trypsin ELISA Kit. Available online: https://assets.thermofisher.com/TFS-Assets/LSG/manuals/EH468RB.pdf (accessed on27 February 2021).
53. Akshaya, K.; Arthi, C.; Pavithra, A.J.; Poovizhi, P.; Shilpa Antinate, S.; Hikku, G.S.; Jeyasubramanian, K.; Murugesan, R.Bioconjugated gold nanoparticles as an efficient colorimetric sensor for cancer diagnostics. Photodiagnosis Photodyn. Ther. 2020,30, 101699. [CrossRef] [PubMed]
54. Lapenna, A.; Dell’Aglio, M.; Palazzo, G.; Mallardi, A. “Naked” gold nanoparticles as colorimetric reporters for biogenic aminedetection. Colloids Surf. A Physicochem. Eng. Asp. 2020, 600, 124903. [CrossRef]
55. Liu, Y.; Guo, R. The interaction between casein micelles and gold nanoparticles. J. Colloid Interface Sci. 2009, 332, 265–269. [CrossRef]56. Lee, S.; Pérez-Luna, V.H. Dextran-gold nanoparticle hybrid material for biomolecule immobilization and detection. Anal. Chem.
2005, 77, 7204–7211. [CrossRef]57. Piovarci, I.; Hianik, T.; Ivanov, I.N. Detection of chymotrypsin by optical and acoustic methods. Biosensors 2021, 11, 63.
[CrossRef] [PubMed]58. Lang, N.J.; Liu, B.; Zhang, X.; Liu, J. Dissecting colloidal stabilization factors in crowded polymer solutions by forming self-
assembled monolayers on gold nanoparticles. Langmuir 2013, 29, 6018–6024. [CrossRef] [PubMed]59. Mei, H.; Chu, H.; Chen, W.; Xue, F.; Liu, J.; Xu, H.; Zhang, R.; Zheng, L. Ultrasensitive one-step rapid visual detection of bisphenol
A in water samples by label-free aptasensor. Biosens. Bioelectron. 2013, 39, 26–30. [CrossRef] [PubMed]60. Lin, Y.; Shen, R.; Liu, N.; Yi, H.; Dai, H.; Lin, J. A highly sensitive peptide-based biosensor using NiCo2O4 nanosheets and g-C3N4
nanocomposite to construct amplified strategy for trypsin detection. Anal. Chim. Acta 2018, 1035, 175–183. [CrossRef] [PubMed]61. Duan, X.; Li, N.; Wang, G.; Su, X. High sensitive ratiometric fluorescence analysis of trypsin and dithiothreitol based on WS2 QDs.
Talanta 2020, 219, 121171. [CrossRef]62. Hu, L.; Han, S.; Parveen, S.; Yuan, Y.; Zhang, L.; Xu, G. Highly sensitive fluorescent detection of trypsin based on BSA-stabilized
gold nanoclusters. Biosens. Bioelectron. 2012, 32, 297–299. [CrossRef]63. Zhang, L.; Du, J. A sensitive and label-free trypsin colorimetric sensor with cytochrome c as a substrate. Biosens. Bioelectron. 2016,
79, 347–352. [CrossRef]64. Melikishvili, S.; Dizon, M.; Hianik, T. Application of high-resolution ultrasonic spectroscopy for real-time monitoring of trypsin
activity in β-casein solution. Food Chem. 2021, 337, 127759. [CrossRef]