Embed Size (px)
Citation preview
Boise State UniversityScholarWorksMechanical and Biomedical Engineering FacultyPublications and Presentations
Department of Mechanical and BiomedicalEngineering
6-25-2017
Detection of Structural Bolt Detorquing UsingDirect Stethoscope MeasurementJoe GuarinoBoise State University
Robert HamiltonBoise State University
This document was originally published in Proceedings of Meetings on Acoustics by Acoustical Society of America. Copyright restrictions may apply. doi:10.1121/2.0000547
Volume 30 http://acousticalsociety.org/
Acoustics `17 Boston173rd Meeting of Acoustical Society of America and 8th Forum Acusticum
Boston, Massachusetts25-29 June 2017
Structural Acoustics and Vibration: Paper 4aSAc3
Detection of structural bolt detorquing using direct stethoscopemeasurementJoe GuarinoMechanical and Biomedical Engineering, Boise State University, Boise, Idaho, 83725; [email protected]
Robert HamiltonCivil Engineering Department, Boise State University, Boise, Idaho, 83725; [email protected]
A method for detecting loosened bolts in a structural joint based upon open-loop acoustic measurementis presented. The acoustic measurement is taken directly on the bolt head. The response of the bolt to aproximal hammer impact is evaluated and characterized using wavelet decomposition of the signal measuredfrom the bolt head. Data were also taken from an accelerometer mounted longitudinally and transversely onthe bolt head. Results from the stethoscope and the accelerometer are presented from a set of structural boltsin several conditions of preload and looseness. A stethoscope applied to the loose bolt and a proximal boltduring impact recorded a marked difference between tight, finger tight, and loose bolts. The study couldenable a quick and simple method for detecting and evaluating detorqued bolts in structural joints.
Published by the Acoustical Society of America
© 2017 Acoustical Society of America [DOI: 10.1121/2.0000547]Proceedings of Meetings on Acoustics, Vol. 30, 065003 (2017) Page 1
Introduction
Detecting loose bolts in a structural connection is an important area of study in the field of structural-
health monitoring (SHM). Many non-destructive evaluation (NDE) methods for detecting damage and
looseness in joints and bolts have been investigated. Accelerometer-based methods are exemplified by
Jaques and Adams (2012)1, using an array of impact and sensor locations to detect loose bolts in lap joints
and panels. Esmaeel et al. (2012)2 published a study of a bolted flange in a pipeline that was degraded by
progressively loosening bolts. The structure was impacted with a hammer and the dynamic response was
measured by an array of piezoelectric sensors. Results indicated that the bolt looseness could be detected
and quantified. Amerini and Meo (2011)3 presented a method for determining degrees of bolt looseness
using acoustic ultrasonography (AU), over a wide range of frequencies. Among their findings, Amerini
and Meo reported differences in PSD spectra between states of looseness in the frequency range of 1 to 7
kHz, using sensors attached to a bolted plate. Milanese et al. (2008)4 presented a method for detecting
progressively-loosened bolts using an output-only model based upon measurements taken from fiber-
optic strain sensors attached to the bolts. Nichols et al. (2007)5 used bolt-mounted fiber-optic strain
sensors to detect a loose bolted joint using ambient vibrations, without the need for baseline data. Guarino
and Hamilton (2015)6 presented an output-only method for detecting loose bolts in a bolted flange
connection, using an electronic stethoscope applied to the bolted beams.
The authors explore a simple and inexpensive method for determining degrees of looseness of a specific
bolt in a bolted flange, based upon direct measurement of the bolt head. We present an output-only
method using an electronic stethoscope and processing software that is free at this time. We compare
response spectra from the stethoscope and from an accelerometer mounted on the bolt head in both
normal and transverse directions. Measurements were taken from the head of the loosened bolt and the
head of a proximal bolt that remained tight.
Methods
A bolted flange connecting a horizontal, standard W 27 X 84 I-beam to a vertical steel column in a full-
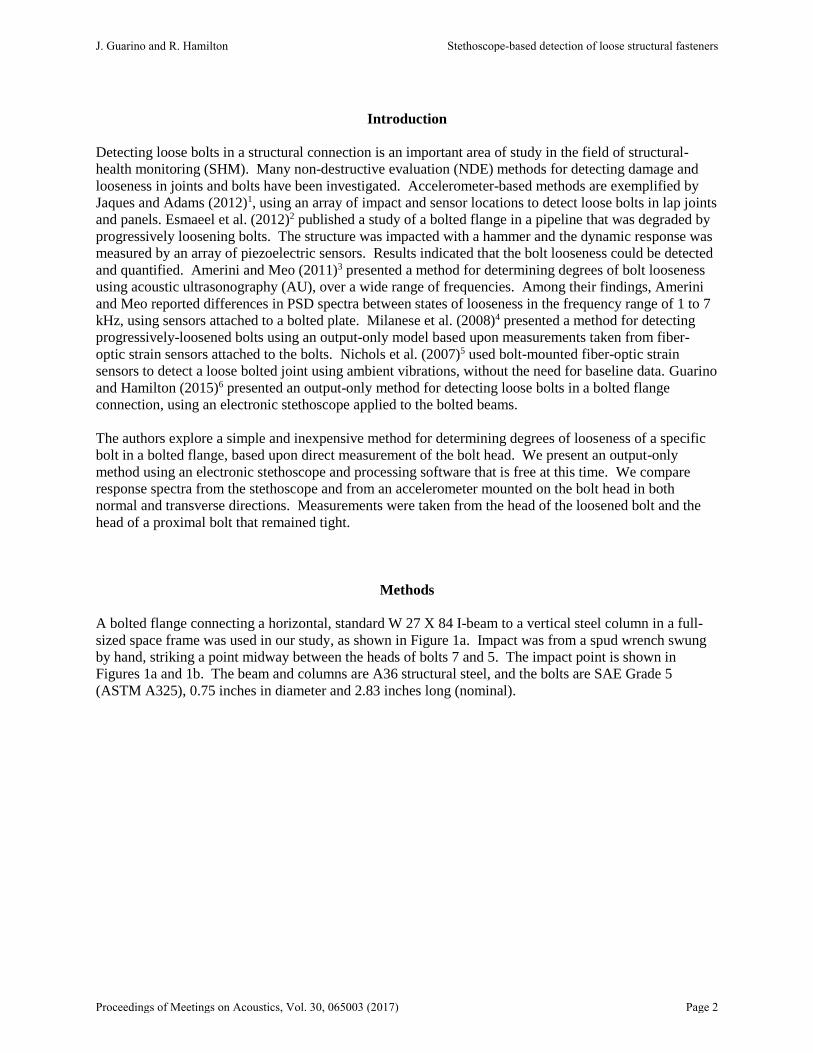
sized space frame was used in our study, as shown in Figure 1a. Impact was from a spud wrench swung
by hand, striking a point midway between the heads of bolts 7 and 5. The impact point is shown in
Figures 1a and 1b. The beam and columns are A36 structural steel, and the bolts are SAE Grade 5
(ASTM A325), 0.75 inches in diameter and 2.83 inches long (nominal).
J. Guarino and R. Hamilton Stethoscope-based detection of loose structural fasteners
Proceedings of Meetings on Acoustics, Vol. 30, 065003 (2017) Page 2
Figure 1a. Connection and impact point Figure 1b. End view of connection plate
showing bolt locations and impact
point
Measurements were taken using a common electronic stethoscope and an accelerometer. The stethoscope
is a Rhythm ds32a Digital Stethoscope, from Thinklabs, Inc.7. The Rhythm ds32a is an electronic
stethoscope that filters and records acoustic data when applied and activated. The listening piece
incorporates a flexible material that is placed in contact with the surface. The back of the flexible
material moves in an electric field within the listening piece, creating a measurable electric signal that is
further processed by the stethoscope to closely simulate the response of a common analog stethoscope.
Like an analog stethoscope, the frequency response of the Rhythm ds32a can be “tuned” to be more
sensitive to lower frequencies by increasing the pressure against the surface; however, this tuning
property has virtually no effect in the Rhythm ds32a above 1000 Hz 8,9 . The diaphragm piece of the
stethoscope is larger than the bolt heads. Firm pressure was applied to the diaphragm piece to ensure
good contact with the bolt head. All data were processed and displayed using Audacity ® acoustic
processing software, which could be downloaded at no cost at the time of this study10.
We wished to evaluate the effect of a proximal loose bolt on a tight bolt. Therefore, measurements were
taken at the tops of bolts five and seven for three conditions:
1. All bolts tight
2. Bolt 7 finger tight
3. Bolt 7 loose.
Bolt tightness was defined using the turn-of-the-nut method following RCSC Specifications for Structural
Joints Using ASTM A325 or A490 Bolts11 .
All measurements were taken from the top of bolts 5 and 7, for three different conditions of tightness of
bolt 7. The eighteen different measurements are described below in Table 1.
J. Guarino and R. Hamilton Stethoscope-based detection of loose structural fasteners
Proceedings of Meetings on Acoustics, Vol. 30, 065003 (2017) Page 3
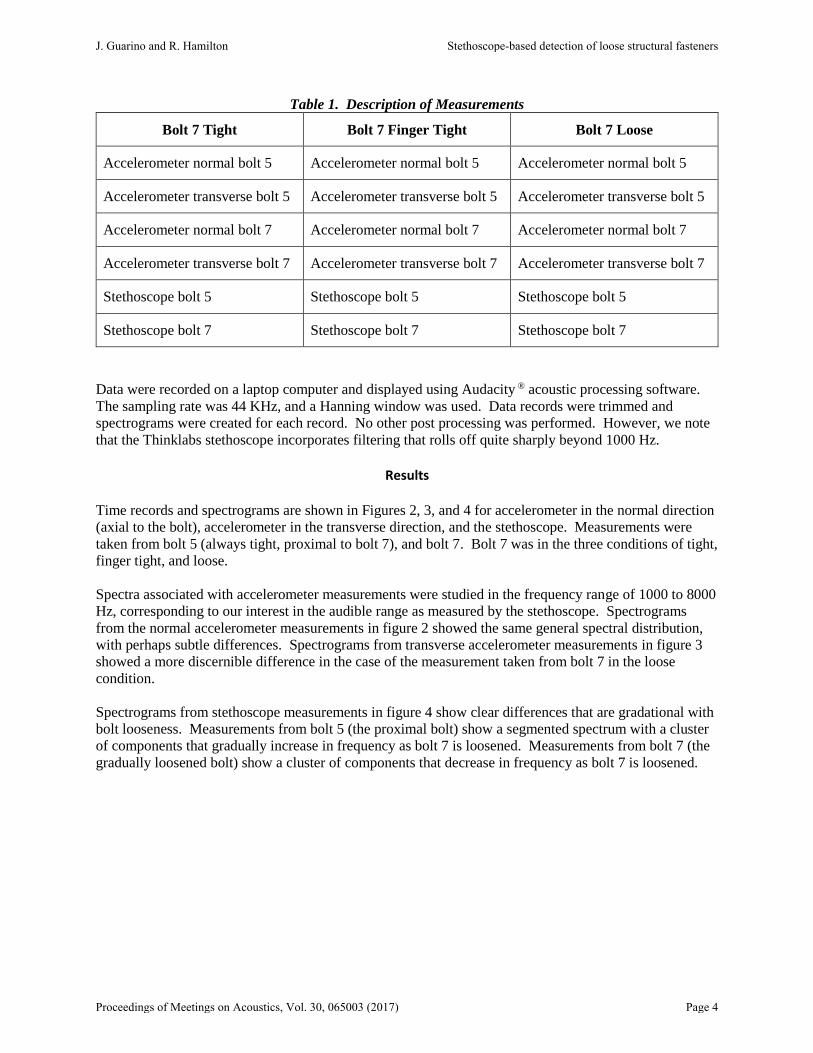
Table 1. Description of Measurements
Bolt 7 Tight Bolt 7 Finger Tight Bolt 7 Loose
Accelerometer normal bolt 5 Accelerometer normal bolt 5 Accelerometer normal bolt 5
Accelerometer transverse bolt 5 Accelerometer transverse bolt 5 Accelerometer transverse bolt 5
Accelerometer normal bolt 7 Accelerometer normal bolt 7 Accelerometer normal bolt 7
Accelerometer transverse bolt 7 Accelerometer transverse bolt 7 Accelerometer transverse bolt 7
Stethoscope bolt 5 Stethoscope bolt 5 Stethoscope bolt 5
Stethoscope bolt 7 Stethoscope bolt 7 Stethoscope bolt 7
Data were recorded on a laptop computer and displayed using Audacity ® acoustic processing software.
The sampling rate was 44 KHz, and a Hanning window was used. Data records were trimmed and
spectrograms were created for each record. No other post processing was performed. However, we note
that the Thinklabs stethoscope incorporates filtering that rolls off quite sharply beyond 1000 Hz.
Results
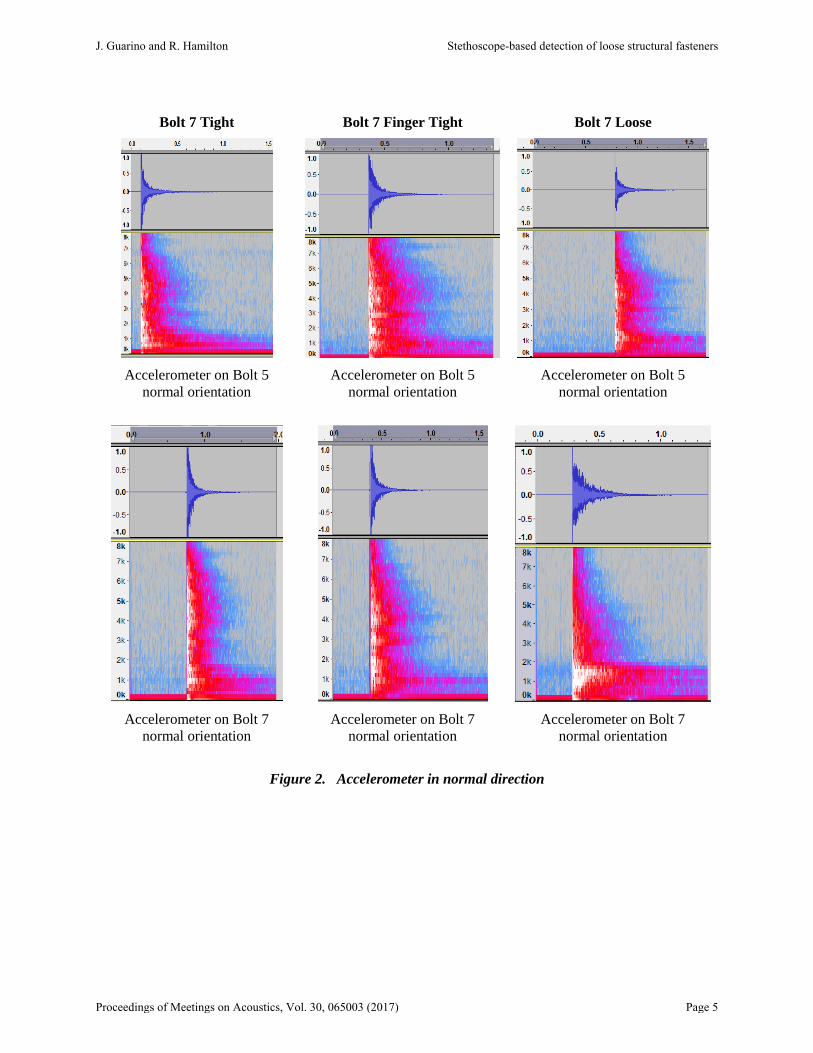
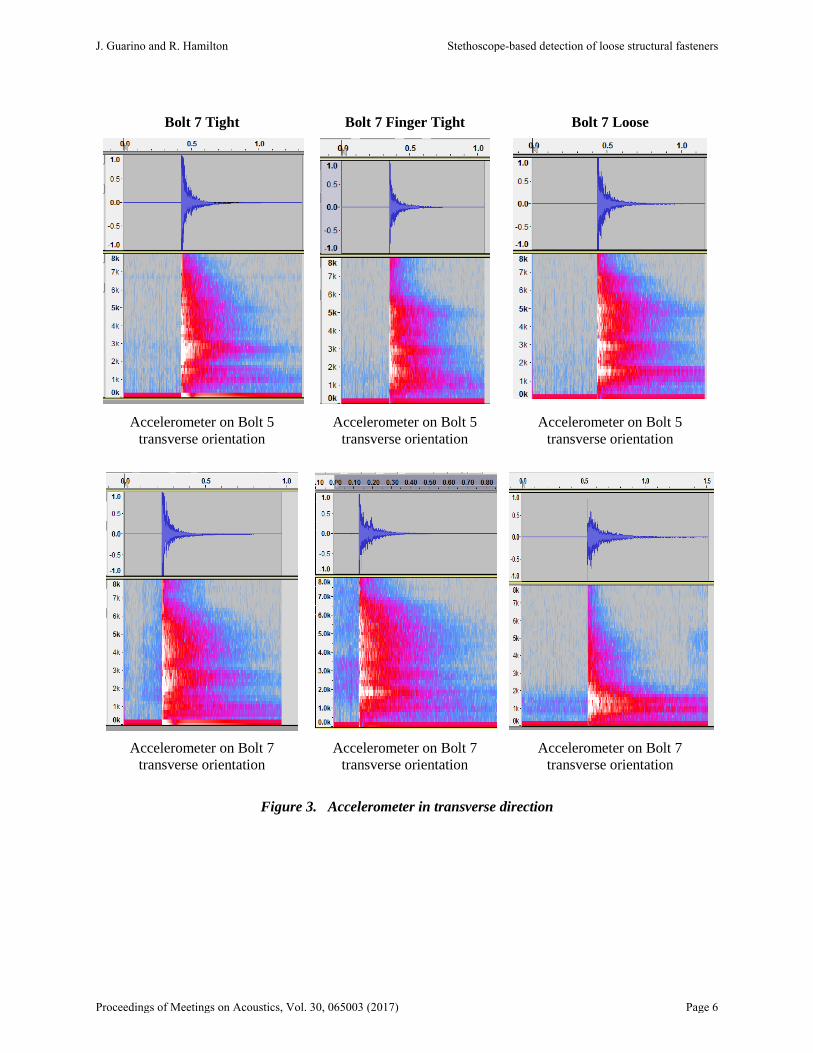
Time records and spectrograms are shown in Figures 2, 3, and 4 for accelerometer in the normal direction
(axial to the bolt), accelerometer in the transverse direction, and the stethoscope. Measurements were
taken from bolt 5 (always tight, proximal to bolt 7), and bolt 7. Bolt 7 was in the three conditions of tight,
finger tight, and loose.
Spectra associated with accelerometer measurements were studied in the frequency range of 1000 to 8000
Hz, corresponding to our interest in the audible range as measured by the stethoscope. Spectrograms
from the normal accelerometer measurements in figure 2 showed the same general spectral distribution,
with perhaps subtle differences. Spectrograms from transverse accelerometer measurements in figure 3
showed a more discernible difference in the case of the measurement taken from bolt 7 in the loose
condition.
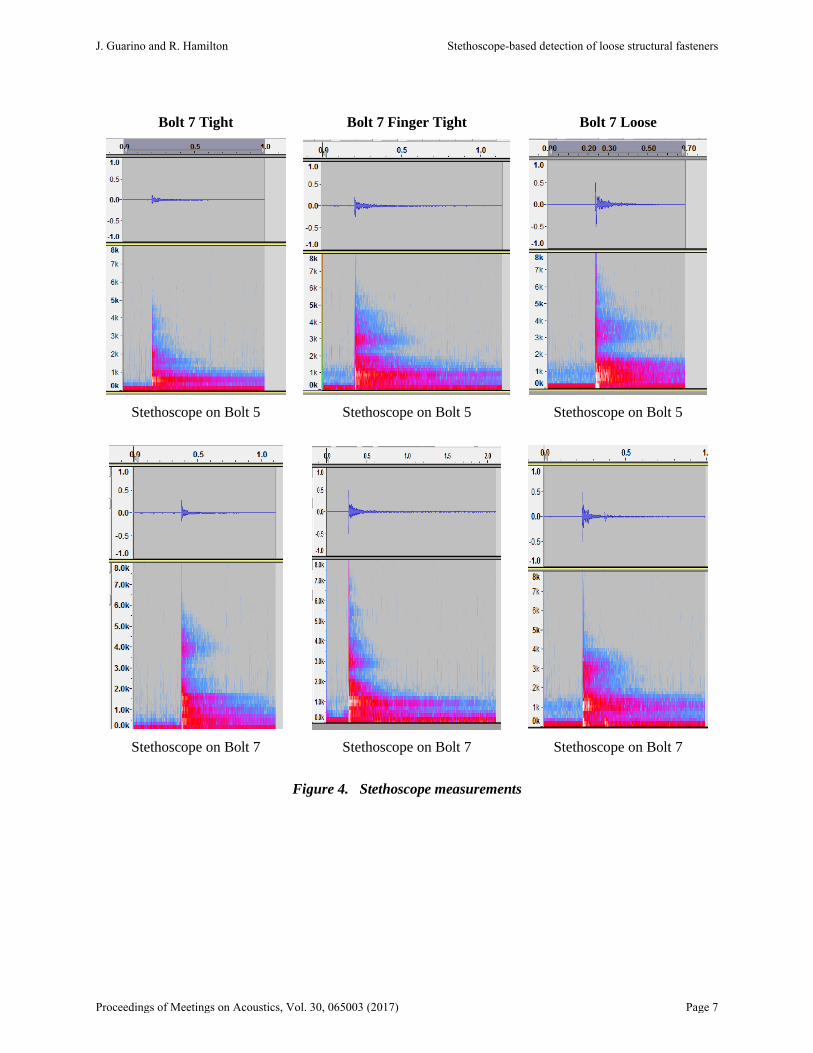
Spectrograms from stethoscope measurements in figure 4 show clear differences that are gradational with
bolt looseness. Measurements from bolt 5 (the proximal bolt) show a segmented spectrum with a cluster
of components that gradually increase in frequency as bolt 7 is loosened. Measurements from bolt 7 (the
gradually loosened bolt) show a cluster of components that decrease in frequency as bolt 7 is loosened.
J. Guarino and R. Hamilton Stethoscope-based detection of loose structural fasteners
Proceedings of Meetings on Acoustics, Vol. 30, 065003 (2017) Page 4
Bolt 7 Tight Bolt 7 Finger Tight Bolt 7 Loose
Accelerometer on Bolt 5
normal orientation
Accelerometer on Bolt 5
normal orientation
Accelerometer on Bolt 5
normal orientation
Accelerometer on Bolt 7
normal orientation
Accelerometer on Bolt 7
normal orientation
Accelerometer on Bolt 7
normal orientation
Figure 2. Accelerometer in normal direction
J. Guarino and R. Hamilton Stethoscope-based detection of loose structural fasteners
Proceedings of Meetings on Acoustics, Vol. 30, 065003 (2017) Page 5
Bolt 7 Tight Bolt 7 Finger Tight Bolt 7 Loose
Accelerometer on Bolt 5
transverse orientation
Accelerometer on Bolt 5
transverse orientation
Accelerometer on Bolt 5
transverse orientation
Accelerometer on Bolt 7
transverse orientation
Accelerometer on Bolt 7
transverse orientation
Accelerometer on Bolt 7
transverse orientation
Figure 3. Accelerometer in transverse direction
J. Guarino and R. Hamilton Stethoscope-based detection of loose structural fasteners
Proceedings of Meetings on Acoustics, Vol. 30, 065003 (2017) Page 6
Bolt 7 Tight Bolt 7 Finger Tight Bolt 7 Loose
Stethoscope on Bolt 5 Stethoscope on Bolt 5 Stethoscope on Bolt 5
Stethoscope on Bolt 7 Stethoscope on Bolt 7 Stethoscope on Bolt 7
Figure 4. Stethoscope measurements
J. Guarino and R. Hamilton Stethoscope-based detection of loose structural fasteners
Proceedings of Meetings on Acoustics, Vol. 30, 065003 (2017) Page 7
Conclusions
The electronic stethoscope provided the best differentiation in response to three different degrees of bolt
looseness, in the frequency range that we studied. There are likely to be differences in the measurements
taken from the accelerometer that would be revealed under more sophisticated analysis of a broader
frequency range. In our frequency range, the transverse accelerometer orientation provided somewhat
more differentiation than the normal orientation. Spectra from the stethoscope provided clear
differences that were gradational associated with the three degrees of bolt looseness. However, changes
in the spectra from the stethoscope applied to the proximal bolt were almost the reverse of changes in the
spectra from the stethoscope applied to the loosened bolt. Further study is needed to elucidate the physics
and specificity with regard to the response of the stethoscope. However, we conclude that an effective
method for detecting bolt looseness can be developed using an inexpensive electronic stethoscope and
simple processing software.
References
1. J. Jaques and D.E. Adams, “Using Impact Modulation to Detect Loose Bolts in a
Satellite,” In: Adams D., Kerschen G., Carrella A. (eds) Topics in Nonlinear
Dynamics, Volume 3. Conference Proceedings of the Society for Experimental
Mechanics Series. Springer, New York, NY, 2012
2. Esmaeel, R. A., J. Briand, F. Taheri, “Computational simulation and experimental
verification of a new vibration-based structural health monitoring approach using
piezoelectric sensors,” Structural Health Monitoring 2012 11:237 , Sage publications
3. F. Amerini and M. Meo, “Structural health monitoring of bolted joints using linear and
nonlinear acoustic/ultrasound methods,” Structural Health Monitoring, 10(6):659-672, 2011.
4. A. Milanese, P. Marzocca, J.M. Nichols, M. Seaver, and S.T. Trickey, “Modeling and
detection of joint loosening using output-only broad-band vibration data,” Structural Health
Monitoring, 7(4):309–328, 2008. 5. J.M. Nichols, S.T. Trickey, M. Seaver, S.R. Motley, and E.D. Eisner, “Using ambient
vibrations to detect loosening of a composite-to-metal bolted joint in the presence of strong
temperature fluctuations,” Journal of Vibration and Acoustics, 129(6):710 – 717, 2007.
6. Guarino, Joe, and R. Hamilton, “Stethoscope-based detection of detorqued bolts using
impact-induced acoustic emissions,” Proceedings of Meetings on Acoustics (POMA), V.
22, 065001 (2015), Acoustical Society of America
7. Thinklabs One Digital Stethoscope: Filtering, (Filter Frequency Response vs. Gap),
www.thinklabs.com/#1filtering/c9w9
8. Rhythm ds32a Digital Stethoscope, Thinklabs Inc., 6571 South Pontiac Court,
Centennial, Colorado 80111 USA
J. Guarino and R. Hamilton Stethoscope-based detection of loose structural fasteners
Proceedings of Meetings on Acoustics, Vol. 30, 065003 (2017) Page 8
9. Finkelstein, Eli, “The Ulitmate Acoustic Stethoscope Review,” For Us Docs,
www.forusdocs.com , July 1, 2008
10. Audacity ® 2.0.6 , Audacity Team, available from SourceForge.net
11. Specification for Structural Joints Using ASTM A325 or A490 Bolts, Publication
Number S348 (2M205), Research Council on Structural Connections, c/o American
Institute of Steel Construction, Inc., One East Wacker Drie, Suite 3100, Chicago, Illinois
60601-2001, June 30, 2004
J. Guarino and R. Hamilton Stethoscope-based detection of loose structural fasteners
Proceedings of Meetings on Acoustics, Vol. 30, 065003 (2017) Page 9