Embed Size (px)
Citation preview

Detection of somatic variants from genomic data
and their role in neurodegenerative diseases
Irene Lobón García
Aquesta tesi doctoral està subjecta a la llicència Reconeixement 4.0. Espanya de Creative Commons. Esta tesis doctoral está sujeta a la licencia Reconocimiento 4.0. España de Creative Commons. This doctoral thesis is licensed under the Creative Commons Attribution 4.0. Spain License.

Memoria presentada por Irene Lobón García para optar al grado de doctora
por la Universidad de Barcelona
Programa de Doctorado en Biomedicina
Tesis realizada en el Instituto de Biología Evolutiva (CSIC-UPF)
Detection of somatic variants from genomic data and their role in neurodegenerative diseases
Irene Lobón García
Eduardo Soriano García Tomàs Marquès Bonet


A mi familia,


“La paciencia es la madre de la ciencia”
Refranero español


VII
Acknowledgements
De estos cinco años me llevo innumerables enseñanzas. Por supuesto muchas en
lo profesional, pero incluso más en lo personal. Esta tesis ha sido un trabajo en
grupo y sin el apoyo y ayuda de mucha gente hubiese sido imposible.
En primer lugar, quiero agradecer a Eduardo su confianza todos estos años y
sobre todo el haberme introducido con sus proyectos en el tema que ahora me
apasiona. También a Tomàs por aceptarme en su grupo como estudiante de
máster y después hacer lo posible para que me quedase de alguna manera en el
grupo. También por introducirme en el consorcio que ha sido fundamental para
mi trabajo y porque nunca hubiese salido de mí pedir una estancia en Harvard.
Esta experiencia solo ha sido posible gracias a vosotros.
Los comienzos fueron duros, después de tantos años de aprendizaje guiado el
salto a la investigación es difícil. Esperas que haya una forma correcta y
determinada de hacer las cosas, pero en la práctica no suele ser así. Una vez
hecho algún análisis, es difícil evaluar si te has equivocado en algún paso, y hay
que superar esa inseguridad, al menos en parte. Como tantos estudiantes de
doctorado y especialmente muchas mujeres, la mayor parte del tiempo sufrí de
síndrome del impostor. Pero con el tiempo te das cuenta de que todos estamos
en la misma situación y de que lo bonito de este trabajo es que consiste en hacer
lo que más me gusta en la vida, aprender.
Cuando llegué me quise quedar en este grupo en gran parte por la gente. Me
sentí apoyada desde el principio y aprendí del ejemplo de cada uno de vosotros
Javi, Irene, Tiago. Especialmente agradezco a Guillem todas sus bromas y a Ignasi
por cuidarme tanto cuando llegué y por siempre llevar la contraria, no sabéis
cuantos días merecían la pena por las conversaciones del café. Se os sigue
echando de menos.
Por supuesto a mis chicas, Jéssica y Raquel. Vosotras ya sabéis lo mucho que os
quiero. Esto hubiese sido absolutamente imposible sin vuestro apoyo
incondicional y vuestras continuas palabras de aliento. Jéssica, eres un amor de
persona. Siempre tienes en cuenta a los demás y fuiste tú sola los cimientos del
grupo durante mucho tiempo. Gracias por cuidarme tanto todos estos años. Por
traerme cosas, por ayudarme en todo lo que necesitase. Por escuchar tantos líos
de análisis y ayudarme a resolverlos, por limpiarme la botella de agua, por
ayudarme con esta tesis incluso sin poder encontrar postura cómoda. Por toda tu

VIII
ayuda, gracias de verdad. Estoy segura de que vas a ser una madre genial, me
muero de ganas de conocer a Mario.
Raquel, qué hubiese hecho sin ti todo este tiempo! Hemos aprendido mucho
juntas, me ha encantado estar tanto tiempo sentadas al lado para poder
preguntarnos dudas constantemente. Aunque al final la mayor parte del tiempo
fuese solo mirar. Siempre has estado ahí para escucharme y reafirmarme y me
ayudó mucho sentir que estábamos pasando por lo mismo en tantos momentos.
Gracias también por introducirme a body pump. Has sido mi postdoc privada y
espero no haber abusado demasiado, gracias por revisarte esta tesis tan
eficientemente. Gracias también a vuestros Ramón y Jesse, ambos me han
alegrado muchos momentos duros, ayudado a cuidar a Laia y especial
agradecimiento a Jesse por su revisión de la tesis.
Y madre mía los Tomasinos, menudo grupo de gente. Os agradezco a todos lo
mucho que me habéis escuchado y sobre todo haber tenido este entorno de gente
dispuesta a debatir sobre cualquier cosa en cualquier momento. Me temo que me
habéis malcriado enormemente. Me alegro de haber sido consciente de la suerte
que tenía en el momento, por lo menos estos últimos meses, y de haberlo podido
disfrutar. Especialmente mientras he estado escribiendo esta tesis me habéis
apoyado muchísimo. Si lo he logrado ha sido gracias a vosotros.
Marc, es siempre un placer hablar contigo. Todo te interesa y siempre mantienes
una paz interior digna de admiración. Espero que te dediques en la vida a lo que
te haga feliz, pero ojalá sea a la ciencia. Creo que el mundo se perdería un gran
científico si no.
Lukas, aunque empecé poco después de ti siempre me pareció que llevabas
milenios de ventaja. Gracias por compartir tanta información y por tu apoyo
cuando lo he necesitado.
Clàudia, me encanta tener conversaciones profundas contigo. Y de cualquier
cosa, incluso aunque no estemos de acuerdo. Hablando de las que estamos
medio de acuerdo, he aprendido muchísimo. Por tus miradas cómplices, por
darme un abrazo cuando lo necesitaba. Por hacerme sentir valorada siempre.
Aitor, mi fuente de conocimiento estadístico. Gracias por siempre tener tiempo
para los demás, por siempre estar dispuesto a ayudar con cualquier cosa, por
venir a ver todos mis plots y escuchar todas mis dudas a horas intempestivas.
Luis, gracias por descubrirme a Marvin Harris y tanta música buena. Por
ayudarme a darme cuenta de que dar paseos es lo mejor.
Paula, eres genial. Soy fan de tu seguridad, de tu forma de hacer las cosas. De
tus ganas de aprender. De tu disposición a ayudar. Has sido mi predoc postdoc,
ya lo sabes. Sin ti hubiese habido miles de ocasiones en que no hubiese podido.

IX
Gracias por revisarte mis emails, por traerme tanta comida rica. Por siempre estar
ahí. Espero que cuando estos años necesites algo, me dejes devolverte el favor.
Manolo, gracias por aguantar mis múltiples interrupciones diarias para hablar de
GOT o política. Por contarme cosas random. Por ser una luz del sur. Por tomártelo
todo bien.
Laura, gracias por tu alegría. Por todo tu apoyo y por cuidarme tanto en esta recta
final. Por siempre escucharme. Por, junto con Manolo, compartir el struggle de las
mutaciones somáticas.
David, gracias por tu ejemplo, por tu ayuda en un momento que estaba tan
perdida. Por enseñarme tanto de tantas cosas. Por tener tan buenas ideas tras
solo un segundo de concentrarte en algo. Por las conversaciones en el viaje a
Washington. Por tomártelo todo de esa manera, eres digno de admiración.
Sojung, thank you for all our conversations in the sofas. For wanting to talk about
life and people for hours with me. I learnt a lot from you. For having shared this
experience these last few months. Thank you for all your support and affection, I
really appreciate it.
Martin, thank you for always understanding. For always being able to joke about
bad situations. For helping me persevere and for trying to help always.
Esther, gracias por tu actitud ante todo lo que se te pone por delante, por ser un
ejemplo para los demás.
Marina, gracias por siempre querer ayudar. Por ser fuerte. Por ser una artista.
Xavi, gracias por ser tan alegre, por tu capacidad de observación, por tu bondad.
Txema, te incluyo aquí más que merecidamente. Gracias por tu ayuda, por
pasarme todos los papers relevantes para mi trabajo, por hacerme sentir que
puedo. Por meterte cada vez menos con mi veganismo. Por tantos ánimos en esta
última etapa. Tú puedes.
Xavi, por ayudarme a llevar la cuenta de los cafés. Por ser mi dealer de azúcar.
Jonas, thank you for your kindness and for being the way you are. You are a light
everywhere you go and I count myself lucky for having shared some time with you.
For encouraging me to go vegan.
Gracias a tanta gente que estuvo o está por estos despachos: Meritxell, Alejandro,
Ferriol, Irune, Marco, Carlos, Marina, Diego, Juan, Nino.. y tanta otra gente.
Hemos compartido muchas cosas en este tiempo. Gracias a Judit por todas sus
imprescindibles gestiones y ayuda.
Gracias también al grupo de Eduardo por recibirme siempre con los brazos
abiertos, a Ash, a Lluis y especialmente a Toni, que me ayudó a hacerme la
bióloga experimental durante unas semanas hace ya varios años.

X
I would also like to thank the Park group people. They received me very openly
and it was a wonderful experience. Peter, for giving me the opportunity and for
being so open to collaboration. Anna for being so efficient always. Isidro, por
hablarme con acento mañico en Boston, descubrirme el Museum of Fine Arts y
por enseñarme a ser más paper-focused. Alon, Joe, Geoff, Scott and Simon, for
being so friendly. Max for always being available to answer all my questions.
Yanmei for being so kind and teaching me so much. Soo, Doga, Giorgio, and
specially Tiziana for being incredibly welcoming, making me feel like I belonged
with our conversations over lunch and for introducing me to squash.
Por supuesto mi tiempo en Boston fue maravilloso gracias a quienes fueron mi
familia mientras estuve allí, Neus e Iñigo. Gracias por invitarme a cenar en vuestra
casa tantas veces, descubrirme comida buena e incluirme siempre en vuestros
planes. Neus, desde el primer día que me fuiste a buscar al aeropuerto te
consideré mi amiga y aluciné de que no hubiésemos hablado aquí nunca. Gracias
por tantas conversaciones, fue genial tener una amiga de verdad allí. Por hacerme
una tarta en mi cumpleaños y celebrar Thanksgiving conmigo. Lo malo fue que
volver se hizo más triste por tu culpa. Espero que podamos volver a coincidir en
algún sitio y si no seguiremos viviendo de audios de whatsapp.
También soy consciente de la suerte que es hacer ciencia en esta época, con
tanta información en internet y acceso muy rápido a artículos y a foros de ayuda.
Aprendí R, bash y Python gracias a Stack Overflow. Aproximadamente el 99.9%
de mis dudas fueron resueltas por Pierre Lindenbaum en Biostars. Y si pude leer
el 30% de los papers que quise fue gracias a Sci Hub, ojalá llegue pronto la
revolución Open Access. Gracias a todas estas herramientas ahora sé cómo
aprender cosas nuevas por mí misma y si me pierdo o no entiendo, googleo;
siempre le ha pasado a alguien antes que a ti.
Gracias a todos mis amigos por su apoyo, Mikel, Cristina, Irene, Flamenco, Pastor
y Lucía. Aunque la distancia hace que hablemos menos regularmente, ya sois
familia y siempre reconecto con vosotros en un segundo. Especialmente a Cristina
e Irene en esta última etapa con las tres escribiendo tesis, vivirlo casi en paralelo
es siempre un consuelo.
Gracias a toda mi familia en general, especialmente a mi tía Isabel. Siempre
interesada en escuchar lo que hago y darme palabras de ánimo. Los findes en
Zaragoza siempre son unas mini vacaciones con tanta gente dispuesta a
cuidarme.

XI
Gracias a mis padres. Por vuestra magnífica labor cuidándome y apoyándome
todos estos años, me habéis animado y ayudado siempre a hacer todo lo que he
querido. Es obvio para mí que soy quien soy fundamentalmente por vuestra forma
de educarme. Siempre que tenía una pregunta intentabais responderla o pensar
conmigo. La curiosidad que mantengo hoy por entender es gracias a ello, y esa
es justamente la razón por la que esta tesis existe. Papá, eres una enciclopedia
andante, estoy muy orgullosa de tenerte como padre y soy consciente de la suerte
que he tenido y tengo. No sabes cuántos conceptos básicos y no tan básicos
tienen tu voz en mi mente y cuántas explicaciones recuerdo después de tantos
años. Siempre todo partía de la lógica y eso ha estructurado mi manera de pensar.
Tuve el ejemplo de cómo explicar cosas sin hacer que nadie se sienta mal por no
saber, compartir conocimiento porque es divertido. Gracias también por entender
la dificultad de mi trabajo. Mamá, sufriste conmigo innumerables tablas de
multiplicar, verbos irregulares en inglés y mi incapacidad para memorizar fechas
con una paciencia infinita. Y siempre diciendo que te iba muy bien para repasar.
Me has enseñado a ser quien soy, con empatía hasta por las cosas inanimadas,
y más importante, a estar orgullosa de quién soy. Siempre has encontrado el
equilibrio entre hacerme sentir segura sabiendo que estabas ahí, incluso hoy, a
una llamada de teléfono, y a la vez, como tú dices, preparar al pollito para volar
del nido. Espero poder hacerlo una décima parte de lo bien que lo habéis hecho
conmigo. Os quiero.
Nicolas, esto es en gran parte gracias a ti. Primero, porque desde que nos
conocimos, por fin encontré a alguien a quien le gustaba saber de todo tanto como
a mí, si no más. Me enseñaste que es posible aprender por uno mismo casi de
todo y a no tener miedo a enfrentarme a las cosas de golpe. A abrir el terminal por
primera vez. A mejorar mi inglés viendo series sin subtítulos. Compartes conmigo
información difícil de conseguir y ya sabes cuánto lo aprecio. A tu lado, las cosas
que me definían han prosperado. Segundo, porque estos años que han sido tan
duros y han puesto a prueba mi salud mental, los he superado gracias a tu apoyo
y a tu forma de hacerme ver que todo está bien. Aunque cuando me decías que
hacía mucho drama pero que luego siempre todo salía bien, te odiaba; al cabo de
más veces de las que es razonable, me di cuenta de que tenías razón y la
combinación de las circunstancias difíciles y de tenerte a mi lado me ha hecho
mucho más fuerte. Eres un ejemplo de perseverancia y capacidad de aprendizaje.
Soy absolutamente afortunada de saber que voy a pasar el resto de mi vida con
mi mejor amigo, aunque hablar durante horas suponga menos horas de sueño.
Te quiero muchísimo. Gracias por ser quien eres.

XII

XIII
Abstract
Somatic mutations are those that arise after the zygote is formed and are therefore
inherited by a fraction of the cells of an individual. Their relevance to a handful of
diseases has been known for almost half a decade and they have been extensively
studied in the context of cancer, the most common disease caused by somatic
mutations. Yet, their prevalence in healthy individuals, their importance in
phenotypic variation or their putative role in other human disorders such as
neurodegenerative diseases are still open questions. Furthermore, accurate
detection of somatic variants from bulk sequencing data poses a technical
challenge. This work focuses on detecting and circumventing the biases that
hinder their identification in such approach. Using this knowledge, we identified
somatic point mutations in the exomes of five different tissues from sporadic
Parkinson disease patients. We also assessed the detection of somatic copy
number variants from array CGH data using two tissues from Alzheimer disease
patients. Finally, we participated in the identification of somatic variants in an
extensive genomic dataset from a neurotypical individual.

XIV

XV
Resumen
Las mutaciones somáticas son aquellas que surgen tras la formación del cigoto y
son por ello heredadas por una fracción de las células de un individuo. Su
importancia para algunas enfermedades se conoce desde hace casi medio siglo
y se han estudiado extensamente en el contexto del cáncer, la enfermedad más
común causada por mutaciones somáticas. Sin embargo, su prevalencia en
individuos sanos, su importancia en la variación fenotípica, así como su potencial
relevancia en otras afecciones humanas, tales como las enfermedades
neurodegenerativas, son cuestiones por resolver. Asimismo, detectar variantes
somáticas con precisión en datos de secuenciación de muestras
homogeneizadas es complicado técnicamente. Este trabajo se centra en la
detección y resolución de los sesgos que dificultan su identificación. Aplicando
este conocimiento, identificamos mutaciones somáticas de una sola base en
datos de secuenciación del exoma de cinco tejidos diferentes de pacientes de la
enfermedad de Parkinson. También evaluamos la detección de variantes de
número de copia somáticas en datos de array CGH de dos tejidos de pacientes
de Alzheimer. Finalmente, hemos participado en la identificación de variantes
somáticas en un amplio conjunto de datos genómicos de un individuo neurotípico.

XVI

XVII
ABBREVIATIONS
aCGH array Comparative Genomics Hybridisation AD Alternative allele Depth BAC Bacterial Artificial Chromosome BER Base-Excision Repair bp Base pairs BPES Blepharophimosis-Ptosis-Epicanthus inversus Syndrome BSMN Brain Somatic Mosaicism Network CADD Combined Annotation Dependent Depletion CGH Comparative Genomics Hybridisation CN Copy Number CNV Copy Number Variant COSMIC Catalogue Of Somatic Mutations In Cancer DNA Deoxyribonucleic Acid DS Down Syndrome DSB Double Strand Break EBV Epstein-Barr virus ENCODE Encyclopaedia of DNA Elements FET Fisher Exact Test GWAS Genome-Wide Association Studies HMW High Molecular Weight HR Homologous Recombination IBS Iberian populations in Spain IGV Integrative Genomics Viewer indel Short insertion or deletion kb kilobase lncRNA long non-coding RNA LQTS Long-QT syndrome MALBAC Multiple Annealing and Looping-Based Amplification Cycles MDA Multiple Displacement Amplification miRNA micro RNA MMR Mismatch Repair mRNA messenger RNA NAHR Non-Allelic Homologous Recombination ncRNA non-coding RNA Ne Effective population size NER Nucleotide-Excision Repair NHEJ Non-Homologous End Joining OMIM Online Mendelian Inheritance in Man PacBio Pacific Biosciences PCA Principal Component Analysis PCR Polymerase Chain Reaction PD Parkinson Disease PFC Prefrontal Cortex PIR Position In Reads piRNA piwi-interacting RNA RNA Ribonucleic Acid SD Standard Deviation

XVIII
SD Segmental Duplication siRNA small interfering RNA SMRT Single Molecule Real Time snoRNA small nucleolar RNA SNP Single Nucleotide Polymorphism snRNA small nuclear RNA SNV Single Nucleotide Variant STR Short Tandem Repeat TAD Topologically Associating Domains TE Transposable Element tRNA transfer RNA UV Ultra Violet VAF Variant Allele Frequency VaD Vascular Dementia WES Whole Exome Sequencing WGA Whole Genome Amplification WGAC Whole Genome Assembly Comparison WGS Whole Genome Sequencing

XIX
INDEX
INTRODUCTION ............................................................................................................. 1
1. The genome .................................................................................. 3 1.1 Protein coding genes .......................................................................... 4 1.2 Non-coding DNA ................................................................................ 6
2. DNA repair ................................................................................... 12 2.1. Replication errors ............................................................................. 12 2.2. DNA damage ................................................................................... 13 2.3. Repair systems ................................................................................ 14
3. Early embryonic development ...................................................... 18 3.1. Embryonic development stages ....................................................... 18 3.2 Cell genealogy vs developmental lineage .......................................... 23
4. Germline variants ......................................................................... 26 4.1 Monogenic variants .......................................................................... 26 4.2 Polygenic variants ............................................................................. 27 4.3 Copy number variants ....................................................................... 28
5. Somatic mutations ....................................................................... 31 5.1 First observations ............................................................................. 32 5.2 Cancer ............................................................................................. 33 5.3 Somatic mutations in healthy tissues ................................................. 37 5.4 Somatic mutations can cause disease .............................................. 39
6. Genome analysis technologies ..................................................... 42 6.1 Comparative genomic hybridization arrays ........................................ 42 6.2 DNA sequencing ............................................................................... 44 6.3 Exome sequencing ........................................................................... 47 6.4 Other technologies useful for somatic variation analysis .................... 49
7. Neurodegenerative diseases ........................................................ 52 7.1 Parkinson disease ............................................................................. 52 7.2 Alzheimer disease ............................................................................. 55
OBJECTIVES ................................................................................................................ 57
RESULTS ...................................................................................................................... 59
Somatic mutations in Parkinson disease patients ............................. 61 1. Data processing for somatic variant calling ......................................... 61 2. Germline variants ................................................................................ 62
2.1. Germline variants in known PD genes .......................................... 63 2.2. Polymorphisms previously linked to PD ........................................ 65 2.3 Deleterious variants in the exome ................................................. 66
3. Somatic variants ................................................................................. 67 3.1. Exploring the biases affecting somatic variant calling ................... 67 3.2. Candidate somatic variants with VarScan 2 ................................. 83 3.3 Candidate somatic variants with HaplotypeCaller ploidy 10 ........... 91

XX
3.4 Tissue clustering by somatic variant allele frequencies .................. 95
Exploring somatic copy number variants in Alzheimer disease with array CGH data ............................................................................... 97
1. Array CGH data processing ................................................................ 97 2. Array CGH data copy number calling ................................................ 100 3. Whole genome sequencing copy number calling ............................... 106 4. Alternative aCGH data treatment approach ¡Error! Marcador no definido.
Somatic mutations in a neurotypical individual ................................ 109 1. The Brain Somatic Mosaicism Consortium ........................................ 109 2. Calling somatic variants from deep WGS .......................................... 110 3. Using deep WGS replicates to identify germline variants ................... 113
DISCUSSION .............................................................................................................. 115
CONCLUSIONS .......................................................................................................... 127
METHODS .................................................................................................................. 129
Somatic mutations in Parkinson disease patients ........................... 131 1. Experimental methods ...................................................................... 131 2. Computational methods .................................................................... 131
Exploring somatic copy number variants in Alzheimer disease with array CGH data ............................................................................. 135
1. Experimental methods ...................................................................... 135 2. Computational methods .................................................................... 136
Somatic mutations in a neurotypical individual ................................ 139 1. Experimental methods ...................................................................... 139 2. Computational methods .................................................................... 139
BIBLIOGRAPHY .......................................................................................................... 143
SUPPLEMENTARY FIGURES ...................................................................................... 179
SUPPLEMENTARY TABLES ........................................................................................ 191

1
INTRODUCTION

2

3
1. The genome
The genome is defined as the complete set of genetic information of an organism.
Its material substrate is the deoxyribonucleic acid (DNA), a double helix formed by
two chains of nucleotides (Franklin and Gosling 1953). The strands are formed by
a backbone of alternating phosphate groups and deoxyriboses, with one of the
nucleobases bound to the latter (Fig. 1). There are two types of nucleobases,
purines: adenine (A) and guanine (G), and pyrimidines: cytosine (C) and thymine
(T). Each purine base is complementary to one pyrimidine – A with T and C with
G – and linked across the strands by hydrogen bonds (Watson and Crick 1953).
This way, the double helix is formed by a sequence of nucleotides on one strand
and its reverse complement on the other strand. Information for multiple biological
processes is encoded in the nucleotide sequence and can be precisely copied
according to the base pairing rules.
Figure 1. DNA structure. The double helix is formed by two chains of nucleotides, characterized by the nucleobase they incorporate. Backbones are closer together on one side of the helix (minor groove) than in the other (major groove). Nucleobases are linked by hydrogen bonds according to the complementary base pairing rules. The different chemical groups of the backbone create directionality from the 5′ end, with a terminal phosphate group, to the 3′ end, with a terminal hydroxyl group. (From Lumen Learning 2019)
Since guanine and cytosine are joined by three bonds and adenine and thymine
are linked by just two, each pair has different properties, both in vivo and in vitro.
Therefore, GC content is an important genomic feature vastly studied because it
correlates with life history traits in mammals (Romiguier et al. 2010), and affects
sequencing technologies (Benjamini and Speed 2012). Single nucleotide
substitution changes from one purine to the other or from a pyrimidine to the other
are termed transitions, whereas transversions imply a change in the nucleobase
type. Even though there are more possible transversions than transitions, they are
less frequent, with the transition/transversion ratio (ti/tv) of the human genome
reported to be at 2.1 (Durbin et al. 2010).

4
1.1 Protein coding genes
Only about 1.5% of the human genome codes for proteins, with an estimated
number of ~19,000 protein coding genes (Ezkurdia et al. 2014). This portion of
the genome is comprised by the complete set of exons and it is called the exome.
Proteins are a fundamental type of macromolecules for living organisms. Their
functions are varied, from catalyzation of chemical reactions to structural roles.
They are also composed of the sequence of simpler molecules: amino acids. Only
22 amino acids make up proteins in all known organisms (Srinivasan, James, and
Krzycki 2002), with 20 comprising the standard eukaryotic set. Since they have
different shapes, sizes and polarities, their combination creates different 3D
structures.
The information on the sequence of amino acids necessary to produce a specific
protein is encoded in protein coding genes. However, in between exons – the
sequence stretches that code for amino acids – eukaryotes have introns,
sequences that need to be removed before being translated to proteins, a process
known as splicing. Within an intron, three sites are required for splicing: the donor
site at the 5′ end, the branch site near the 3′ end and the acceptor site at the 3′ end. The multiple components that form the spliceosome complex bind to these
sites, which have different consensus sequences, and remove the intron, joining
exons together. Splicing allows the combination of different exons from the same
DNA sequence, a mechanism known as alternative splicing, which increases
protein diversity.
Since many copies of the same protein need to be produced and processed at the
same time, the DNA sequence is first transcribed into ribonucleic acid (RNA)
molecules in the nucleus following the complementary base pairing rules (Fig. 2).
RNA essentially differs from DNA in that it consists of a single strand of nucleotides
and it contains uridine (U) instead of thymine. RNA has multiple key roles: when it
is copied from the DNA sequence and takes the information to the ribosomes it is
called messenger RNA (mRNA). Each mRNA gets spliced inside the nucleus and
once processed, goes to the cytoplasm and binds to a ribosome, where translation
to proteins occurs. Each triplet of nucleotides, or codon, is translated into an amino
acid. A different type of RNA, the transfer RNAs (tRNAs), also participate in this
process. They carry a nucleotide triplet – the anticodon – as well as one of the
amino acids. When a tRNA finds the complementary codon on the mRNA, the

5
amino acid it carries is bonded to the existing chain, synthesizing a new protein
which depends on the nucleotide sequence on the processed mRNA (Fig. 2).
The correspondence between codons and amino acids is the genetic code. There
are 64 possible permutations of 4 nucleotides taken in triplets (43) but only 20
amino acids. Although there are three stop codons, which signal for translation
stop (Fig. 3), 61 codons code for amino acids. For this reason, the genetic code
is redundant, i.e., multiple codons translate to the same amino acid. However, this
redundancy is not arbitrary, changes in the third nucleotide of a codon frequently
encode for the same amino acid. This codon degeneracy is mediated by tRNA
chemical modifications that allow certain nucleotides to wobble, that is, to pair with
multiple nucleotides (Agris, Vendeix, and Graham 2007).
Figure 2. Transcription and translation. DNA is transcribed to messenger RNA (mRNA) inside the nucleus. Transfer RNAs (tRNAs) are also transcribed from genomic DNA. For translation to proteins, mRNA binds to a ribosome, where each codon is matched to an anticodon from a tRNA and the amino acid it carries is incorporated to the polypeptide chain. (From Barton 2007)
6
Figure 3. The genetic code. Each triplet of nucleotides in the mRNA, or RNA codon, codifies for an amino acid. AUG is the starting codon, which always codes for methionine, and there are three different stop codons. (By Sarah Greenwood)
This is why certain point mutations, mostly in the third codon position, are termed
synonymous mutations: their replacement does not result in a different amino acid
being incorporated, maintaining the resulting protein unchanged. On the other
hand, nonsynonymous mutations occur when nucleotide substitutions change the
produced protein. They are known as missense mutations when they change the
amino acid sequence, nonsense mutations when they create a new stop codon or
readthrough mutations when they remove a stop codon, producing a longer
protein. Also, point mutations in the introns can modify the consensus sites,
altering splicing, which can result in aberrant proteins.
Besides single nucleotide variants (SNVs), small insertions or deletions (indels) in
the exons can also change the resulting protein. Often, the number of base pairs
added or removed is not a multiple of 3, changing the grouping of the following
nucleotides in codons. This is why they are called frame-shift mutations.
1.2 Non-coding DNA The remaining more than 3 billion base pairs of the genome are termed non-coding
DNA. It has been known for many decades that only a small fraction of the genome
is protein-coding, which was later confirmed by the Human Genome Project
(International Human Genome Sequencing Consortium 2001). Besides promoters
– the regions adjacent to protein-coding genes where the enzymes that catalyze

7
replication or transcription attach – it was difficult to assign a function to the rest
of the genome, which is mostly formed by repetitive elements. Moreover, the huge
variability in genome size, even between closely related species, points towards
much of the genome not having a function (Palazzo and Gregory 2014).
Still, a structural function was proposed early on. In fact exactly at the same time
that the term “junk DNA” was coined (Ohno 1972). The original idea was that
placing genes far away from the centromeres allows for duplications or deletions
of centromeric regions along evolution without damaging consequences, which
result in the chromosomal rearrangements we oftentimes observe accompanying
speciation. Also, the existence of non-coding chromatin in between protein-coding
genes ensures that the consequences of nonsense or frame-shift mutations are
contained to one single locus.
More recently, chromosome conformation capture methods such as Hi-C (Dekker
et al. 2002; Lieberman-Aiden et al. 2009) have encouraged the scientific
community to explore the genome’s 3D nuclear architecture and how it relates to
function. It has been shown that during the interphase, chromosomes reside in
specific spaces, called chromosome territories (reviewed in Cremer and Cremer
2001). In a smaller scale, the genome organizes in domains with increased
frequency of internal interactions (Fig. 4), which are termed topologically
associating domains (TADs) (Dixon et al. 2012; Nora et al. 2012; Sexton et al.
2012). They are delimited by CTCF binding motifs, regions that allow the
attachment of the homonymous insulator protein, which through a process that is
not yet fully unraveled, creates chromatin loops (Rao et al. 2014). TADs bring
together gene promoters and enhancers (Shen et al. 2012) and share chromatin
features such as coordinated gene expression or replication timing (Dixon et al.
2012). This is why their disruption can cause disease (Lupiáñez, Spielmann, and
Mundlos 2016), hinting at how little we know about the role of most genomic
regions and making it difficult to judge the existence of non-coding DNA functions
or lack thereof.

8
Figure 4. Structural organization of chromatin. A. In the interphase, chromosomes occupy specific nuclear spaces, termed chromosomal territories. B. Chromosomes are subdivided into topological associated domains (TAD). TADs with repressed transcriptional activity tend to be associated with the nuclear lamina (dashed inner line), while active TADs tend to be in the nuclear interior. C. Each TAD is flanked by CTCF binding motifs called TAD boundaries (purple hexagon). (From Matharu and Ahituv 2015)
The most prominent component of the human genome, and more so of larger
genomes, are transposable elements (TEs). These DNA sequences are able to
copy and insert themselves into new genomic regions (McClintock 1950). They
can do this because they encode transposase, the enzyme that catalyzes these
reactions. Since TEs have control over their own transmission, they have been
labelled, together with regions of similar characteristics, as selfish genomic
elements (Doolittle and Sapienza 1980; Orgel and Crick 1980; Ågren and Clark
2018). This implies that the reason they are so frequent in genomes is because
they self-copy, so to some extent, they expand independently of their effect on
fitness. Nonetheless, because TEs insert frequently in the genome, occasionally
they become functional, fine-tuning the transcriptome (Cowley and Oakey 2013)
or even influencing local adaptation by altering splicing (González et al. 2010).
Unsurprisingly, the same alterations of splicing can derive in disease (Hancks and
Kazazian 2016). Moreover, they can create novel transcription binding sites, such
as CTCF sites, which can alter genome function and architecture (Bourque et al.
2008; Merkenschlager and Odom 2013).
However, there are specific non-coding sequences whose role we do understand.
An important group are RNA molecules, the genomic regions that are transcribed

9
to various forms of RNA and carry out their function without being translated to
proteins. Besides mRNA, tRNA and ribosomal RNA (rRNA), the RNAs that make
translation possible, a myriad of non-coding RNAs (ncRNAs) have essential
regulatory roles. Long non-coding RNAs (lncRNAs) appear to be involved in
transcription regulation by recruiting transcription factors (Feng et al. 2006) and
tethering RNA binding proteins (Wang et al. 2008). The most famous lncRNA is
the X inactivate-specific transcript (XIST), which inactivates one chromosome X in
females for dosage compensation (Rastan 1994). MicroRNAs (miRNAs) are
involved in mRNA silencing (Fig. 5). Because double-stranded RNA molecules are
degraded, miRNAs are complementary to the target mRNA so that their base-
pairing induces specific mRNA cleavage (Lau et al. 2001). Similarly, small
interfering RNAs (siRNAs) are double stranded molecules that also induce
complementary mRNA silencing (Hamilton and Baulcombe 1999).
Figure 5. Target recognition by siRNA and miRNA. A. siRNA is usually fully complementary to the coding region of its target mRNA. B. miRNA is partially complementary to its target miRNA. Complementary binding usually occurs at the seed region of miRNA and the 3’ UTR of the target mRNA. (From Lam et al. 2015)
Small nuclear RNAs (snRNAs) are instead part of the spliceosome, a complex that
processes the pre-mRNA in the nucleus (Will and Lührmann 2011). A subset of
snRNAs, small nucleolar RNAs (snoRNAs) are located in the nucleolus, where they
guide chemical modifications of other RNAs (Samarsky et al. 1998). Finally, piwi-
interacting RNAs (piRNAs) are the largest group of small ncRNA. Their main
function is to protect the integrity of the genome by restricting the mobilization of
TEs (Siomi et al. 2011) and many have interesting names, such as the flamenco
locus, which determines whether the transposable element gypsy “dances”
(Prud’homme et al. 1995).
Further, introns are also involved in the regulation of gene expression. They do so
via multiple mechanisms, including altering transcription timing (Swinburne and

10
Silver 2008) or promoting the export of mRNAs to the cytoplasm (Valencia, Dias,
and Reed 2008). They are also responsible for mRNA quality control (Lee et al.
2009). Because some of these intronic functions depend on intron length rather
than on sequence (Chorev et al. 2017), the detection of functional introns is
complex, making it challenging to estimate the proportion of the genome carrying
out these functions.
A different type of repetitive sequences, short tandem repeats (STRs) consist of a
simple DNA motif – usually from two to thirteen base pairs long – repeated a
variable number of times. When the motif is just one nucleotide, and therefore the
STR contains the same nucleotide repeated multiple times, it is termed a
homopolymer. Whether homopolymers are STRs or not is a matter of debate.
Since STRs are repetitive, during replication, the different repetitions can pair
between them, making DNA polymerase replicate the region over again, a process
known as replication slippage (Kornberg et al. 1964). Most of the time, these
errors are repaired by nucleotide excision repair (see 2.3) (Strand et al. 1993), but
still, together with other mutational mechanisms (Fan and Chu 2007), this makes
them highly mutable genomic regions. Precisely for this reason, their sequencing
is widespread in forensic analysis (Tautz 1989); they are so variable within
populations that the characterization of 13 to 17 known loci is used as a molecular
fingerprint.
STRs have been shown to be involved in gene expression regulation (Gymrek et
al. 2012), in altering recombination frequency (Wahls, Wallace, and Moore 1990)
and in generation of nucleosome positioning signals (Wang and Griffith 1995).
Furthermore, the expansion of certain trinucleotides within genes causes multiple
disorders. Perhaps the most famous of them is Huntington disease, in which the
number of CAG repeats in the HTT gene (MacDonald et al. 1993) determines its
stability in replication. The disease is developed when the number of repeats
surpasses 40 and more copies increase its severity (Aziz et al. 2009). Other
trinucleotide repeat disorders include Fragile X syndrome, myotonic dystrophy or
spinocerebellar ataxia (Orr and Zoghbi 2007).
Besides functions determined by DNA sequence, the role of multiple genomic
regions is indicated by their epigenetic marks. Certain chemical modifications to
the DNA and histone proteins – those that package DNA around them, forming
nucleosomes – determine how accessible chromatin is, regulating its level of
transcription (Fig. 6). This is one of the mechanisms by which the same DNA
sequence in different cell types can result in different transcriptomes. The

11
Encyclopedia of DNA Elements (ENCODE) project (Birney et al. 2007) and the
Roadmap Epigenomics Mapping Consortium (Bernstein et al. 2010) have worked
towards identifying functional elements in the human genome. Besides already
known promoter and enhancer regions, they discovered new candidate regulatory
elements and assigned different states to chromatin depending on the
combination of its epigenetic marks. This knowledge allowed for the interpretation
of non-coding variants previously linked to disease (Maurano et al. 2012; Ward
and Kellis 2012).
Figure 6. Epigenetic modifications. Epigenetic marks include DNA methylation (A) and histone modifications (B) such as methylation or acetylation of some histone amino acids. They determine how compacted chromatin is, which makes it more or less accessible to cell machinery, regulating expression. (From van der Harst, de Windt, and Chambers 2017)

12
2. DNA repair
Cells reproduce by division, the process by which a parent cell gives rise to two
daughter cells. Since there is one copy of the genome in each cell, DNA needs to
be replicated so that each daughter cell has its own copy. Multiple enzymes are
required for replication, from those that recognize replication origins to many
directly involved in DNA synthesis. After DNA primases and helicases separate
both DNA strands, DNA polymerases catalyze the polymerization of a new DNA
strand using one of the existing strands as a template. This way, each daughter
cell inherits a double strand composed by one of the original strands and a newly
synthesized one.
2.1. Replication errors
Considering the genome is large and there are many cells in an organism – 3·1013
in an adult human body (Sender, Fuchs, and Milo 2016) – any error rate when
copying DNA, even if low, will produce many mutation. Since there is only one
copy of the nuclear genome in each cell, changes in its sequence can be of great
importance. Thus, cells have suffered a big selective pressure to evolve
mechanisms that help avoid and correct errors. The polymerases most commonly
used by eukaryotes have high fidelity, with replication error rates of ~10-5 for Polδ
and from 10-3 to 10-4 for Polα and Polβ (D. C. Thomas et al. 1991; Osheroff et al.
1999). Because many subsequent repair mechanisms ensure the correction of
replication errors and spontaneous or environmental DNA damage, human
germline mutation rate is much lower, roughly 10-9 (Michael Lynch 2010).
During replication itself, DNA polymerases can correct misincorporated bases.
This process, known as proofreading, is a type of excision repair (see 2.3) in which
polymerases use their 3′→5′ exonuclease activity to remove a mismatched
nucleotide. All three bacterial DNA polymerases have this ability, whereas in
eukaryotes only those enzymes involved in elongation have it. The vast majority of
replication errors are recognized by proofreading, so that after a mistake, DNA
polymerases reverse their direction to excise the mismatched base. Following
base excision, polymerases re-insert the correct nucleotide. The few cases that
escape this repair mechanism, are then recognized by the mismatch repair system
(see 2.3).

13
2.2. DNA damage
DNA damage can be spontaneous or induced by environmental factors. The most
common type of spontaneous damage is deamination of 5-methylcytosine
(methylated cytosine) (Shen, Rideout, and Jones 1994), which results in thymine
and ammonia, producing a C>T substitution. Unmethylated cytosines can suffer
deamination too, resulting in uracil bases, which would also give rise to a C>T
substitution. Although the deamination of purines is very infrequent in comparison
(Tomas Lindahl 1993), guanine deamination results in xanthine, which base-pairs
with thymine, producing a G>A substitution, and adenine deamination produces a
hypoxanthine which base-pairs with cytosine, resulting in an A>G substitution.
Another type of spontaneous damage is depurination, or the loss of the
nucleobase at purine sites, adenine and guanine, by the cleavage of the β-N-
glycosidic bond, which is especially susceptible to hydrolysis (Lindahl and Nyberg
1972), creating an apurinic site that decreases fidelity of DNA replication
(Shearman and Loeb 1977).
Ultraviolet (UV) radiation is one of the main sources of induced damage. UV light
induces the appearance of covalent bonds between consecutive pyrimidine
nucleotides, cytosine and thymine, producing dimers (Setlow and Carrier 1966),
which are mutagenic if left unrepaired and the main cause of human melanomas
(Nelson and Nelson 1957; Holman et al. 1986; Østerlind et al. 1988).
Alkylating agents, such as mustard gas, can transfer methyl or ethyl groups to a
DNA base (Lawley and Brookes 1967). When guanines are alkylated, they form
complementary base pairs with thymine, creating a G>A substitution.
Oxidation affects most commonly guanines, because they have a lower reduction
potential (Steen Steenken and Jovanovic 1997). Oxidized guanines abnormally
pair with adenine, producing a G>T substitution (Shibutani, Takeshita, and
Grollman 1991).
Further, double strand breaks (DSBs) occur frequently after exposure to ionizing
radiation, induced by certain chemical agents, due to cross-overs during
replication (Haber 1999; Karran 2000) or as a normal step of recombination in
meiosis. DSBs are especially dangerous for cells because they can result in big
duplications or deletions, as well as chromosomal rearrangements and even cell
death (Carson et al. 1986).

14
2.3. Repair systems
Besides DNA polymerases proofreading, any remaining error or damage is
corrected by a series of mechanisms, depending on the type of alteration.
Direct reversal of damage
Occasionally, damage is directly reversed. For example, methylation of guanines
is reversed by the protein methyl guanine methyl transferase (MGMT) (Yarosh et
al. 1984), crucial for genome stability. Also, many organisms use light energy for
photoreactivation, a process by which photolyase directly reverses pyrimidine
dimers (Sancar 1994). This enzyme is absent in placental mammals, including
humans (Kato et al. 1994), and other small effective population size (Ne)
eukaryotes (Lucas-Lledó and Lynch 2009) which use nucleotide excision repair to
resolve the dimers instead.
Single strand damage
Excision repair occurs when errors are removed, and the sequence is
resynthesized according to the correct strand. We classify these mechanisms in
three main types:
Base-excision repair (BER) (Fig. 7, left) is used when just the base itself is incorrect
and it is obvious. Hence, presence of uracil bases (from cytosine deamination) in
the DNA, oxidized guanines, alkylated or deaminated bases are all corrected
through this system. The incorrect base is recognized and removed from the
deoxyribose by DNA glycosylases (Tomas Lindahl 1982) and then the remaining
deoxyribose is removed so that DNA polymerase and ligase can fill and close the
gap, respectively (Seeberg, Eide, and Bjørås 1995).
Nucleotide-excision repair (NER) (Fig. 7, right panel) recognizes damaged regions
because of the changes they produce to the DNA structure. This is the way T-T
dimers resulting from UV damage are corrected in humans and other placental
mammals. Nucleases and helicases remove an oligonucleotide including the
damaged region and again DNA polymerase and ligase fill and close the gap (de
Laat, Jaspers, and Hoeijmakers 1999).

15
Mismatch repair (MMR) is used when there is just a mismatch between bases. In
this case the incorrect DNA sequence is not as apparent, but the original strand
must be recognized in order to remove the erroneous base. These are the errors
that escape from DNA polymerase proofreading. Because they happen during or
right after replication, single-strand breaks that are only present in the newly
synthesized strand are used as a mark (Kolodner and Marsischky 1999) to guide
the process in mammalian cells.
Figure 7. Base and nucleotide excision repair. Base excision repair (left) and nucleotide excision repair (right). (From Khan Academy 2019)
Double strand breaks
Double strand breaks (DSBs) are repaired by two different mechanisms: non-
homologous end joining (NHEJ) and homology directed repair.
In NHEJ, DNA ligase IV, together with multiple other proteins, directly joins the
ends of the broken DNA strands without the need for extensive homology between
them. This process is heavily influenced by the stage of cell cycle (Moore and
Haber 1996) and although it can be somewhat accurate, it is, in general, a
mutagenic process, which can lead to translocations or deletions (Hiom 1999).
On the other hand, homology directed repair, or homologous recombination (HR),
occurs when a homologous sequence is used as a template for repairing the
break, resulting in higher accuracy repairs. A protein fundamental for HR, RAD51,
searches the genome for an intact copy of the broken DNA that is used to retrieve

16
the lost information (Houtgraaf, Versmissen, and van der Giessen 2006). Ideally,
the template is the sister chromatid, so the sequence is repaired accurately. If the
two sequences are not exactly homologous, it can result in gene conversion.
Allelic gene conversion occurs when a strand carrying the other allele is used as
a template, overwriting the original allele. However, if the repair is guided by a
paralogous sequence, non-allelic homologous recombination (NAHR) occurs.
Low-copy repeats or segmental duplications (SDs) – sequences 10-400 kb long
with 95-97% identity – are the hotspots for NAHR, predisposing those regions to
copy number variation and chromosomal rearrangements (Stankiewicz and
Lupski 2002) (Fig. 8). NAHR accounts for most of the recurrent rearrangements:
those that share a similar size, show clustering of breakpoints, and recur in multiple
individuals (Gu, Zhang, and Lupski 2008).
Figure 8. Genomic rearrangements resulting from NAHR between segmental duplications. Segmental duplications are depicted as arrows and the different loci are represented by letters. A. Recombination between direct repeats can result in deletion and duplication. B. Recombination between inverted repeats results in inversions. C. Types of NAHR depending on the involved sequences location and their consequences. (Modified from Gu, Zhang, and Lupski 2008)
Besides its relevance for resolving recombination, DSB repair is crucial for
restoring collapsed replication forks (Saleh-Gohari et al. 2005). Its importance is
evidenced by the fact that BRCA1, a gene whose mutations result in increased
risk of breast cancer, is involved in multiple of these mechanisms (J. Zhang and
Powell 2005).

17
Further, neuronal activity causes the formation of DSBs within the promoters of
early-response genes, those that are rapidly activated in response to a wide
variety of stimuli (Madabhushi et al. 2015b). These genes already display the
hallmarks of active transcription, such as RNA polymerase II at the transcription
start site, before stimulation. With neuronal activity, histone methylation and
transcription factor binding are minimally altered (T.-K. Kim et al. 2010). DSBs
allow the interaction of promoters with early-response genes, producing their
expression. This shows how fundamental DSB repair is in the central nervous
system.
Nonetheless, all the above-mentioned repair mechanisms are not infallible, in fact,
error rates can be reduced only as long as they provide a fitness advantage
greater than the power of genetic drift, which for species with small Ne is high. This
implies that the lower bound on the mutation rate is not set by physiological or
biochemical limitations, but by the inability of selection to push it lower (Michael
Lynch 2010). All these errors accumulate during embryonic development and
even during adult tissue proliferation and maintenance. They are shared by all the
descendants of the cell where they appeared, including germ cells when they
belong to the mutant lineage.

18
3. Early embryonic development
Sexual organisms generate gametes through meiosis, a process that separates
homologous chromosomes to produce cells with half the ploidy, such that the
fusion of two of these sexual cells at fertilization results in a single cell, the zygote,
which will divide and develop to produce a new individual, in a process known as
embryogenesis. Especially relevant to this work is human embryonic development.
3.1. Embryonic development stages Cleavage
After fertilization, the zygote is confined inside the zona pellucida, the glycoprotein
layer that surrounded the oocyte, which limits its growth in size and avoids
premature implantation (W. Liu et al. 2017). In mammals, the zygote starts to
divide at a pace of approximately a division per day during the first two days, a
slower rate than other metazoans (O’Farrell, Stumpff, and Tin Su 2004). At this
stage, cells do not grow between divisions, hence the term cleavage. After the 2-
cell stage (Fig. 9, left), mammalian cleavage is asynchronous, meaning that one
of the cells divides first, forming a 3-cell embryo (Kelly, Mulnard, and Graham
1978). By this stage, cells are called blastomeres (from ancient Greek blastos,
germ or sprout) and they stay aggregated into an undifferentiated sphere (Fig. 9,
middle). At the 8-cell stage, embryos enter compaction, a phase when
blastomeres join with gap and tight cell junctions (Ducibella and Anderson 1975).
When the embryo has approximately 12 to 32 cells, it is called a morula because
of its resemblance to a mulberry.
Blastulation
Then, a cavity in the middle of the morula starts to form, the blastocoel. It is
produced by the pumping of sodium into the middle of the sphere, which pulls in
water osmotically (Manejwala, Cragoe, and Schultz 1989). The accumulated liquid
makes the zygote grow, helping it hatch the zona pellucida. At this moment the
embryo is referred to as a blastocyst. Then, cells start to differentiate between
those in the outer layer, the trophoblast, and those grouped on the inside
contacting the trophoblast, the inner cell mass (Fig. 9, right). The region where the
inner cell mass is attached to is the embryonic pole. The contribution of each
blastomere from the 4-cell stage to the inner cell mass and the trophoblast is not

19
clear (Zernicka-Goetz 2006), but the general consensus is that some positional
bias exists in guiding this commitment (Zernicka-Goetz, Morris, and Bruce 2009).
The inner cell mass cells will give rise to the body of the embryo itself as well as
some extraembryonic structures, such as the umbilical cord. On the other hand,
trophoblast cells exclusively form extraembryonic tissues, like the outer layer of
the placenta.
Figure 9. Photomicrographs of human embryos. Left: Two blastomeres are visible inside the zona pellucida. Middle: Morula with 12 visible cells. Right: Blastocyst with the trophoblast cells on the periphery and the inner cell mass marked by the arrow. (From Veeck and Zaninovic 2003)
Implantation
Approximately 6 days after fertilization, implantation into the uterine wall starts.
Because mammalian embryos depend on maternal sustenance, after hatching the
zona pellucida, the expanded blastocyst attaches to the endometrial epithelium at
the embryonic pole. After the first contact, or apposition, the trophoblast cells that
are near the inner cell mass fuse to form the syncytiotrophoblast, maintaining a
layer of proliferative cells underneath, which also derive from the trophoblast,
called the cytotrophoblast (Fig. 10A) (Enders and Schlafke 1969). The
syncytiotrophoblast fusion is assisted by syncytin, a protein whose gene was
inserted into the genome of an ancestor of all catarrhines by a retrovirus. Along
evolution, other mammals have also exapted similar retroviral sequences for
placentation (Lavialle et al. 2013).
Projections of the syncytiotrophoblast, called villi, insert between the uterine
epithelial cells, and after penetrating the basal lamina, they eventually make their
way into the endometrial stroma, the connective tissue beneath the epithelium.
This highly invasive tissue erodes into the blood vessels of the uterus, making
maternal blood fill small spaces previously formed in the syncytiotrophoblast called
lacunae (Cross, Werb, and Fisher 1994). This is when some blood can leak,
producing implantation spotting. Then, the decidual reaction occurs: maternal

20
connective tissue cells swell up due to the accumulation of glycogen and lipid
droplets that will be transferred to the embryo (Wislocki and Dempsey 1948). This,
together with maternal arterial changes and both maternal and embryonic
hormonal release, inhibit an overly aggressive invasion (Kliman 2000) and create
an immunologically privileged site for the embryo (Xu et al. 2017). Later on, the
maternal epithelium heals, enclosing the embryo in the stroma (Fig. 10B).
Figure 10. Embryo implantation. A. At 5-6 days post fertilization, implantation starts. Maternal tissues are depicted in orange. The syncytiotrophoblast is starting to appear and invade the endometrium. At the same time, the hypoblast and epiblast start to differentiate. B. At 11-12 days post fertilization, implantation is complete. Maternal capillaries have been eroded into, uterine epithelium has closed, and, in the embryo, the amniotic cavity has opened (blue bubble) and the hypoblast has formed the primary yolk sac. (From Carlson 2014)
Formation of the embryonic disk
At the same time that the syncytiotrophoblast starts to form, some inner cell mass
cells form a ventral layer, constituting the hypoblast, or primitive endoderm. The
upper part of the inner cell mass is known as epiblast and also forms an epithelial-
like sheet (Fig. 12A). Whether an inner cell mass cell forms part of one or other
layer is determined by the expression of two transcription factors, NANOG and
GATA6. These two factors are initially expressed in an overlapping manner. The
earliest stages of cell differentiation seem to be dominated by stochastic
fluctuations of these transcription factors producing what is known as the salt-and-
pepper stage (Fig. 11A). Then, through cell sorting, NANOG expressing cells form
the epiblast whereas GATA6 expressing cells commit to the hypoblast by the
regulation of the expression levels of fibroblast growth factor 4 (FGF4) and FGF
receptor (Schrode et al. 2014). This way, a bilaminar disk is formed. Later on, a
layer from the epiblast, called the amnion, separates from it, leaving the amniotic

21
cavity in between. At the same time, cells from the hypoblast begin to spread and
line the cytotrophoblast from the inside, forming the parietal endoderm, which
once closed is called the yolk sac, the first site where hematopoiesis occurs (Fig.
11B) (Palis and Yoder 2001).
Figure 11. Development of the bilaminar disk. A. The transcription factors NANOG and GATA6 determine inner cell mass differentiation into epiblast cells (red, EPI) and hypoblast cells (blue, PrE) through the regulation of FGF. B. The amniotic cavity is formed by the cavitation of epiblast cells (blue) whereas the yolk sac derives from migrating hypoblast cells (yellow). The body stalk derives from the extraembryonic mesoderm and will give rise to the umbilical cord. (From Schrode et al. 2014 and Carlson 2014, respectively)
Gastrulation
This process starts with the formation of the primitive streak (Fig. 12C), a structure
resulting from the loss of basal lamina and epithelial to mesenchymal transition of
epiblast cells (Williams et al. 2012). At this stage, cell cycles are very rapid, as
short as 2.2 hours (Snow 1977) and cells start to migrate. Cells ingress into the
streak while the epiblast epithelial sheet is maintained. The first cells leaving the
posterior part of the streak give rise to the extraembryonic mesoderm, which lies
between the trophoblast and yolk sac and forms the body stalk (Fig. 11B), which
later will become the umbilical cord, as well as give rise to the germ cells. A more
anterior wave of mesoderm forms the paraxial, lateral plate, and cardiac
mesoderm; structures that will give rise to the mesodermal tissues of the embryo
itself. A final, anteriormost wave gives rise to the notochord (the mesodermal
structure that together with ectoderm will form neural tissues) as well as to the
embryonic endoderm, which will form the gut. Cells remaining in the epiblast
constitute the embryonic ectoderm (Fig. 12D and E).
However, little is known about the movements cells undergo to create these layers
and which are the mechanisms responsible. A study on chick embryo gastrulation
showed that cells destined to different structures follow defined pathways of
A B

22
movement, which appear to correlate more closely with the tissue to which they
would contribute than to their position in the streak at the time of labelling
(Psychoyos and Stern 1996).
Figure 12. Gastrulation. A. Frontal section of the implanted embryo. The syncytiotrophoblast (in orange) and the cytotrophoblast (in red) surrounding the bilaminar disk. B. Orientating diagrams, showcasing the opposition of the hypoblast (yellow) and the epiblast (blue). C. Formation of the primitive streak in the bilaminar disk. D. Cells migrating along the primitive streak first form the endoderm, which mixes with the hypoblast and later (in E) the mesoderm. (From Marieb and Hoehn 2013)
Organogenesis
The three germ layers differentiate at gastrulation: ectoderm, mesoderm and
endoderm. Afterwards, complex processes and rearrangements need to take
place in order to produce all the body organs and organ systems (Fig. 13). Briefly,
ectoderm will give rise to the outermost layer of skin, central and peripheral
nervous systems, eyes, inner ear, and several connective tissues. Mesoderm will
give rise to the circulatory system, including the heart and spleen, cartilage, bones,
skeletal muscle, dermis, kidneys and gonads. Endoderm will give rise to the
epithelial lining of the gastrointestinal track as well as the respiratory tract, the
thyroid, thymus, pancreas and bladder.
Interestingly, germ cell determination occurs somewhat far from the embryo
proper. Primordial germ cells derive from the extraembryonic mesoderm and

23
commit to their lineage at the allantois, an evagination of the body stalk (Chiquoine
1954). Once specified, they first migrate to the hindgut and finally to the gonads
(Tilgner et al. 2008). On their way, they proliferate at a moderate pace, each 16
hours (Tam and Snow 1981), and undergo extensive reprogramming of the
epigenome, such as the removal of gene imprinting (Tilgner et al. 2008).
Figure 13. Developmental lineages. Flow chart of cell differentiation and commitment with lineages colored similarly to previous images. Determinant lineage splits are labelled with white numbers in black circles.
3.2 Cell genealogy vs developmental lineage
Whether the cell differentiation tree matches the cell genealogy tree is of particular
importance for the study of somatic mutations. One of the first examples of
embryonic cell lineage tracing is that of Caenorhabditis elegans, a transparent
nematode whose adult body has a fixed number of cells (eutely) at ~1,000. Sulston
et al. traced the complete development of C. elegans and recorded the
correspondence between genealogy and final tissue commitment for the different
lineages. They noted that despite the fixed relationship between cell ancestry and
cell fate, the correlation between the two lacked an obvious pattern (Sulston et al.
1983). For example, they observed that most main lineages contributed both to
the generation of muscle and to the generation of neurons, even if in different
proportions. Therefore, the total set of neurons was constituted by diverse
Zygote
Inner cell mass
Amnion
Embryonicmesoderm
Nervous systemSkin and its glandsMammary glandsEyesHair and nailsInner ear
Circulatory systemCartilage and bonesMuscleDermisKidneysGonads
Gastrointestinal systemRespiratory trackThyroidPancreasBladder
Cytotrophoblast
Trophoblast
Hypoblast
Extraembryonicendoderm Embryonic
ectoderm
Epiblast
Primitivestreak
Embryonicendoderm
Germ cellsAllantoisBody stalkUmbilical cord
AllantoisUmbilical cord
Extraembryonicmesoderm
Yolk sac endoderm
1
2
3
Placenta
Syncytiotrophoblast

24
proportions of cells coming from multiple lineages, and those same lineages were
present in muscle, although in different proportions than neurons.
Cell genealogy is much harder to ascertain in mammals, but new techniques such
as genome editing of synthetic target arrays for lineage tracing (GESTALT)
(McKenna et al. 2016), are leading the way towards acquiring this knowledge. In
this case, the barcode is an array of clustered regularly interspaced short
palindromic repeats (CRISPR)/Cas9 target sites. Random changes are introduced
at each cell division, so that the sequencing of single cells allows the
reconstruction of their genealogy. However, the resolution is limited to a few
divisions.
Nonetheless, studying somatic mutations in humans has shown results consistent
with those in C. elegans. Lodato et al. showed that a few neurons from the cerebral
cortex of normal individuals share somatic SNVs with cardiomyocytes and not with
some of the surrounding neurons, indicating they share a more recent common
ancestor with those cardiomyocytes (Lodato et al. 2015). They showed that
variants produced during embryonic development, with a frequency in neurons
(an ectodermal derivative) as low as 2% were also present in tissues derived from
a different germ layer, the mesoderm, such as heart and liver.
The relationship between the genealogy and developmental trees was discussed
in Arendt et al. They proposed the concept of “serial sister cell types” (Fig. 14).
This concept builds upon the observation of body regionalization in metazoans and
hypothesizes that cell types arise in the different regions concurrently, producing
a lack of correspondence between the trees (Arendt et al. 2016).
Currently, the consensus is that the first commitment between trophoblast and
inner cell mass (Fig. 13 (1)) is not random, and that not all cells contribute to both
lineages (Zernicka-Goetz, Morris, and Bruce 2009). In contrast, the second
fundamental differentiation (Fig. 13 (2)), that between hypoblast and epiblast, is
stochastically driven by NANOG and GATA6 (Schrode et al. 2014). However, how
subsequent lineage commitments are determined, and which cells differentiate
into them is not clear. Gastrulation occurs approximately after the 12th cell division
(Snow 1977). Because cell cycles are short at gastrulation, just over 2 hours, the
repair machinery efficiency is more limited in that period (Anderson, Lewellyn, and
Maller 1997), leading to the appearance of variants that will be present in all the
descendant cells. Hence, over 4,000 cells exist at gastrulation, meaning that

25
variants with a frequency as low as 0.02% in the adult could potentially be inherited
by cells migrating to all the different germ layers.
Figure 14. Serial sister cell types. The interrelationship of developmental and evolutionary cell type lineages. A. Ancestral state. In a hypothetical simple metazoan, cell types arise from a stem cell-like developmental lineage. B. Derived state. Cells first diversify regionally, giving rise to region-specific serial sister cell types. Within each region, cell types arise in parallel, so that developmental and evolutionary lineages differ. (From Arendt et al. 2016)
It has been estimated that ~40% of embryos end in spontaneous abortions, 80%
of them before the pregnancy is detected, also known as preclinical losses (Opitz
1987; Wilcox et al. 1988). This is most usually the result of cytogenetic alterations
such as aneuploidies and trisomies (H. P. Robinson 1975; M. Ohno, Maeda, and
Matsunobu 1991; Minelli et al. 1993) with better formed and latter loss embryos
having conditions more compatible with life, such as chromosome 13, 18, 21 or
sex chromosome abnormalities (Hardy and Hardy 2015), including somatic
alterations (Vorsanova et al. 2005; Lebedev 2011), which indicates how
mutagenic the first cell cycles can be.
A B

26
4. Germline variants
In a diploid organism, there are two copies of each chromosome, the maternal and
the paternal. Variants present in the germline of the parents, which are therefore
inherited by all the cells of the offspring, are called germline variants. These are
the variants usually considered when the genetic variation of an individual is
studied.
The main types of variants are single nucleotide variants (SNVs), a nucleotide
substitution at a specific genomic position; short insertions or deletions (indels)
and structural variation, which includes copy-number variants (larger insertions or
deletions), inversions and translocations. When SNVs reach a certain frequency
level in a population, usually established at 1% (Cavalli-Sforza and Bodmer 1971),
they are considered single nucleotide polymorphisms (SNPs). Different versions
of the same locus are called alleles.
4.1 Monogenic variants
Although the epigenome and transcription and translation regulation modulate and
tune the genotype to give rise to the phenotype, genetic variants can still directly
cause phenotypic variation. Traits can be determined by one or more loci. Those
driven by a single gene are called monogenic or mendelian traits, after Gregor
Mendel, who proposed the laws of inheritance in the late XIX century.
Mendelian traits can be of dominant or recessive inheritance. Dominant variants
are those that cause the phenotype when just one allele is affected. This is the
case of the most common variants that confer lactose persistence in humans;
individuals with just one allele inducing lactase expression after infancy produce
enough enzyme for lactose digestion (Flatz 1984). On the other hand, when the
phenotype appears only if both alleles carry the mutation, variants are of recessive
inheritance, or haploinsufficient. Examples include diseases such as cystic fibrosis,
caused by mutations in the CFTR gene (Riordan et al. 1989). In such cases, a
single defective allele is not enough to cause the disease, so individuals with one
copy are unaffected and are known as carriers.
Both dominant and recessive mendelian mutations have been found to cause
neurodegenerative diseases, such as mutations in the alpha synuclein gene
(Polymeropoulos et al. 1997) causing dominant inheritance of Parkinson disease

27
(PD), variants on the Parkin gene (Kitada et al. 1998) causing recessive PD or
amyloid precursor protein mutations causing dominant Alzheimer disease (Tanzi
et al. 1987).
However, traits can still be monogenic but non-mendelian. Incomplete dominance
occurs when the heterozygote phenotype is in between those of the homozygotes.
For example, achondroplasia patients present a much more severe phenotype
when they are homozygotes, and for most diseases, homozygotes are so rare that
whether they have complete or incomplete dominance is unknown (Rimoin,
Pyeritz, and Korf 2019). Also, codominance happens when both alleles are
expressed independently, such as in human ABO blood groups.
4.2 Polygenic variants
On the other hand, phenotypes determined by more than one locus are known as
polygenic traits, such as skin pigmentation in humans, for which more than a
dozen loci have been described (Deng and Xu 2018). In the simplest model, the
effect of each variant is additive. However, because protein interplay is structured
as networks, interactions usually exist between genes in the production of
phenotypes, a phenomenon called epistasis. Many phenotypes are very complex,
with multiple genes and their interactions involved in their determination (Botstein
and Risch 2003). Especially, this is the case for complex diseases; variants
causing monogenic or simpler inheritance diseases suffer a stronger negative
selective pressure and their frequency lowers in the population. Their appearance
is many times the result of genomic instability causing recurrent mutations (Gu,
Zhang, and Lupski 2008). However, when a disease is caused by a large number
of variants as well as their interactions, the selective pressure on each of them
decreases substantially, making it more difficult for natural selection to purge them
from populations, especially those with low effective population size.
The heritability of a trait – the proportion of variation that is attributable to genetic
factors – can be estimated by calculating the concordance rate between
monozygotic twins compared to fraternal twins. Assuming both pairs of twins
share the same environment, when identical twins have more similar phenotypes,
the variance dependent on genes can be inferred (Sahu and Prasuna 2016). A
typical example of a complex quantitative human trait is height. Its heritability has
been estimated to be ~80% (Visscher, Hill, and Wray 2008). Genome-Wide
Association Studies (GWAS) have been performed to find the variants behind it.
In this type of analysis, the association of SNPs and traits is measured by

28
comparing carriers and non-carriers, or in this particular case, people above and
below a selected height. The first GWASs on height found only a few associated
SNPs, explaining at most less than 4% of the variance (Gudbjartsson et al. 2008).
This led to the debate on the missing heritability and where it could reside (Maher
2008). Because of the sizable number of variants involved in the phenotype, only
very large samples provide enough power to discover a high proportion of the
variance. Polygenic scores are used in this context; they aggregate the effects of
many SNPs, even if their independent association on the trait is not significant.
When analyzing ~700,000 individuals, a polygenic score could explain ~35% of
the variance (Yengo et al. 2018).
However, many times shared environment and especially assortative mating are
not properly modelled when estimating heritability (Lynch and Walsh 1998) and
association (Marchini et al. 2004). Non-random mating creates population
structure, or non-homogeneous populations. If a phenotype varies between
populations and subpopulations, this creates spurious correlations between that
trait and the variants involved in the structure, especially when using methods that
rely on large numbers of small effects, such as polygenic scores (Barton,
Hermisson, and Nordborg 2019). Indeed, the latest analyses on polygenic scores
for human height found uncorrected population structure caused an
overestimation of polygenic scores, which were found to not be easily portable
among populations (Sohail et al. 2019; Berg et al. 2019), highlighting methods for
correcting for population stratification in GWAS may not always be sufficient for
polygenic trait analyses and that any claims of differences in polygenic scores
between populations should be treated with caution.
4.3 Copy number variants
The use of microarrays and the expanded application of paired-end sequencing
enabled the analysis of small structural variation. Insertions and deletions of
regions a few hundred to millions of base pairs, known as copy number variants
(CNVs) have been linked to disease (reviewed in Stankiewicz and Lupski 2010)
and are variants that also contribute to the evolution of species.
The most common mechanism for a CNV to influence a phenotype is by dosage
effect. One of the most famous cases is the gain of amylase copies in the human
lineage as an adaptation to a starch-rich diet. The number of copies of the gene
an individual has correlates with the concentration the enzyme has on their saliva
as well as with dietary starch consumption across populations (Perry et al. 2007).

29
The dosage effect also produces diseases, such as Charcot-Marie-Tooth disease
type 1 (CMT1), the most common inherited peripheral neuropathy. It results from
the duplication of the gene PMP22, which is part of myelin, the insulation layer
surrounding neuronal axons. Myelin formation requires the equilibrium of its
components, so the duplication impairs the process (Nobbio et al. 2004), resulting
in deficient myelinization, which in turn reduces nerve conduction velocities
(Lupski et al. 1992). Because 76–90% of sporadic CMT1 cases have a de novo
duplication (Hoogendijk et al. 1992; Nelis et al. 1996), it can be inferred that
genomic rearrangements in this region are highly recurrent (Lupski 2007). These
recurrent duplications are mediated by nonallelic homologous recombination
(NAHR) between segmental duplications (Fig. 8) flanking the genomic region
containing this gene (Inoue et al. 2001; Yuan et al. 2015). Also, deletions of this
same region have been linked to a different disease, hereditary neuropathy with
liability to pressure palsies (Inoue et al. 2001).
Besides dosage effect, the deletion of a region can cause disease by unmasking
recessive mutations or functional polymorphisms of the remaining allele, as
observed for Sotos syndrome (Kurotaki et al. 2005). Also, smaller deletions,
affecting portions of protein coding genes can result in abnormal proteins, lacking
functional domains (Licht et al. 2006).
However, not only coding region CNVs can cause disease, the deletion of
regulatory regions can also produce pathologies. Nonsense, missense and
frameshift mutations in FOXL2 result in blepharophimosis-ptosis-epicanthus
inversus syndrome (BPES) (Beysen, De Paepe, and De Baere 2009). FOXL2 is a
developmental gene with a strictly regulated spatiotemporal expression pattern.
Microdeletions upstream and downstream of the gene were found in 4% of BPES
cases, and chromosome conformation capture of the region revealed physical
interactions with FOXL2 promoter (D’haene et al. 2009), explaining the
appearance of the condition. Also, analysis of deletions common in Van Buchem
syndrome patients helped to identify that sclerostin was involved in the disease,
since the deleted regions affected regulatory elements of that gene (Loots et al.
2005).
As discussed in the previous section, cytogenetic alterations are very common in
early embryos, including aneuploidies and trisomies as well as smaller
rearrangements. The best tolerated trisomy is that of chromosome 21, Down
syndrome (DS). It has been found that proteins in this chromosome interact much

30
less between them than those of other chromosomes, explaining the high viability
of DS patients (Kirk et al. 2017). For the same reason, the consequences of gene
duplications are very diverse depending on where in the interactome they are
located. For example, alpha synuclein duplications have been described in
Parkinson disease (Singleton et al. 2003), while the DS trisomy of 21 causes the
overexpression of the APP gene, giving rise to the Alzheimer pathology in DS
patients.

31
5. Somatic mutations
Mutations that appear during embryonic development or adult tissue maintenance
and are therefore present only in a proportion of the cells in an individual are
termed somatic mutations. They are also known as postzygotic variants, owing to
the fact that they occur after the formation of the zygote. Depending on the
developmental stage when the mutation occurs, it will affect a varying proportion
of cells and tissues (Fig. 15), including the individual’s germline. The resulting
presence of cells with slightly different genomes in a single individual is known as
mosaicism.
Figure 15. De novo and somatic mutations. A. De novo mutations occur at some point in the cell lineage of parental germ cells. They are present in the zygote and therefore in all tissues and cells of the offspring. B. Early somatic mutations occur during the first cell divisions of the embryo and because the mutant cells contribute to multiple tissues, even from different germ layers, they are spread in the individual. C. Later somatic mutations are confined to a smaller cell lineage and are only present in some tissues of the individual. D. Appearance of the different types of mutations. (i) Blue variants are those that occurred more than a generation ago, germline inherited variants or polymorphisms. (ii) De novo mutations, in green, appeared at some point during parental development or tissue maintenance, the specific moment determines the amount of germ cells carrying the variant and is fundamental for estimating recurrence probabilities. (iii and iv) Early (orange) and late (red) somatic mutations occur during embryonic development. (From Nishioka et al. 2018)

32
5.1 First observations
Mosaicism was observed early on as a result of chemical or less frequently,
radioactive mutagenesis in lab animals producing striking mosaics (reviewed in
Auerbach and Kilbey 1971). In 1961, Mary Lyon showed that half the human
population is functionally mosaic for chromosome X (Lyon 1961). Soon thereafter
Gartler and Francke proposed half chromatid or early somatic mutations as a
mechanism for the appearance of Lesch-Nyhan syndrome (Gartler and Francke
1975). This impairing X-linked recessive condition is caused by a deficiency of the
enzyme hypoxanthine-guanine-phosphoribosyl transferase (HGPRT) and
produces hyperuricemia, which results toxic to the central nervous system. Given
that male patients are not able to produce offspring, the disease should diminish
in frequency. However, new mutations seemed to occur with enough frequency to
maintain the observed rate. Further, male patients with homozygous unaffected
mothers were observed, so somatic mutations were proposed as an explanation
for both phenomena. Mosaicism was also suggested to be the cause of other X-
linked conditions visible on the skin, such as incontinentia pigmenti (Lenz 1975).
A decade later, Rudolf Happle evidenced that many of these hereditary conditions
manifested on the skin following the lines of Blaschko, patterns previously
associated with embryonic development, with a typical dorsal V-shape and an
abdominal S-figure. He proposed that these lines observed in women affected with
X-linked skin disorders could result from the clonal proliferation of two functionally
different populations of cells during early embryogenesis of the skin, each with a
different inactivated X chromosome (Happle 1985). Interestingly, he found the
same skin pattern accompanied a different disease, the McCune-Albright
syndrome, which was completely sporadic. Since the Blaschko lines suggested
the existence of a distinct cell population carrying the mutation during skin
development, but no hereditary cases had been reported, he suggested that the
causal mutation had to be lethal to embryonic development and only compatible
with life when in a mosaic state (Happle 1986a). This supposed the description of
the first obligate somatic disease, a concept that was then extended to many
others, such as the well-known Proteus syndrome (Happle 1986b; Clark et al.
1987).

33
5.2 Cancer
Cancer as a model for understanding somatic mutations
Cancer could be considered as the most prevalent disease caused by somatic
mutations. In the 1920s, it was proposed that tumors originate from cells affected
by genetic mutations. This was inferred from the observation of chromosomal
aberrations in cancer cells together with the fact that contact with mutagenic
agents increased the risk of cancer (Nordling 1953). In the following decades, it
became clear that the age-of-onset distribution suggested that two hits or even
multiple hits were necessary for cancer development: at least one mutation to
increase cell division rate and a second one to release the cells from control
(Armitage and Doll 1957; Ashley 1969). Later, it was proposed that both sporadic
and inherited forms of retinoblastoma could be caused by lesions to the same
gene, the so-called “two-hit hypothesis” (Knudson and Jr. 1971), with one
inherited germline mutation being the first hit and the second one occurring during
somatic development. This theory was corroborated when the responsible gene
was found (Friend et al. 1986) and it was confirmed that a mutation in each allele
produced the total loss of function of the retinoblastoma protein gene, a cell cycle
regulator and the first tumor suppressor gene to be discovered. This finding led to
the search for genes whose mutation could cause different types of cancers, an
effort that caused the discovery of multiple cancer driver genes (M. H. Bailey et al.
2018).
The advent of DNA sequencing and the fast reduction of its cost paved the way
towards understanding the origin of somatic mutations in cancer genomes. The
sequencing and comparison of melanoma and lymphoblastoid cell lines from the
same patient showed that almost two thirds of the mutations were C>T transitions
(Pleasance, Cheetham, et al. 2010), which were already known to be produced
by UVB light mutagenesis on dipyrimidines containing 5-methylcytosine (Gerd P.
Pfeifer, You, and Besaratinia 2005). Similarly, the comparative analysis of a lung
tumor genome from the type of cancer most associated with smoking showed the
high prevalence of G>T transversions (Pleasance, Stephens, et al. 2010). This
was consistent with the pattern observed after exposure to tobacco carcinogens,
polycyclic aromatic hydrocarbons, that covalently bond to guanines in the GpA
context (Denissenko et al. 1996). These discoveries showing that different
carcinogens produce different mutational patterns in a context dependent manner
led to the development of mutational signature analysis, which focuses on the
deconvolution of the different patterns (Alexandrov et al. 2013a). Mutational

34
signature analysis of over 7,000 cancers showed the existence of at least 21
signatures, with signature 1 being ubiquitous (Alexandrov et al. 2013b). This
signature is characterized by C>T transitions caused by the spontaneous
deamination of methylated cytosine, which occurs predominantly at NpCpG
trinucleotides (G P Pfeifer 2006). Although it was discovered in disease, this is a
universal process, so it has been observed in both de novo (Rahbari et al. 2016)
and somatic mutations (Bae et al. 2018) as well as in population variation studies
(Mathieson and Reich 2017).
This shows the potential cancer genome analysis has to discover universal
patterns and mechanisms of somatic mutation. In fact, it has been shown that the
mutation rate along the genome is not as homogeneous as once thought, with
density of mutations at the 1-Mb scale being very variable and similar among
different cancer genomes as well as the germline. Mutation rates correlate with
GC content, replication timing, nucleosome occupancy (Hodgkinson, Chen, and
Eyre-Walker 2012), transcribed regions (Pleasance, et al. 2010) and euchromatin
(Schuster-Böckler and Lehner 2012). As fundamental repair machinery is
sometimes inactivated in cancer, it poses an exceptional context to find the
mechanisms behind this variability. MMR deficient tumors show a considerably
flatter mutation rate variability, demonstrating the relevance this pathway has in
generating this variation (Supek and Lehner 2015). MMR machinery is recruited
by the histone modification H3K36me3 (Supek and Lehner 2017), which has a
differential presence in introns than exons, explaining the lower mutation rate of
the latter (Frigola et al. 2017).
Differences with other somatic mutation diseases
When compared to other somatic mutation diseases, cancer is a different
scenario. Developmental somatic mutation diseases such as Proteus syndrome
(Happle 1986b) are caused by mutations that do not confer clonal advantage to
the mutant cells. That is, as they do not divide faster than other cells, mutant cells
do not outgrow other cell lineages, so their proportion in the tissues is a product
of drift rather than selection. On the contrary, since cancer is caused by the
uncontrolled division and migration of cells, the responsible mutations are
precisely those that give the mutant cells a proliferative advantage and therefore
their proportion increases driven by positive selection (Bignell et al. 2010).
This conceptual difference implies significant technical changes in their analysis.
In cancer, clonal expansion produces enough mutant cells to be sequenced in

35
bulk. Also, the use of paired samples can help in identifying driver mutations –
those only present in the tumor and responsible for its malignancy – although
passenger mutations are also present in the tumor (Haber and Settleman 2007).
In other diseases, mutation frequencies can vary substantially. Considering that
embryonic cells contribute to the extraembryonic tissues (Fig. 13) and can do so
in an asymmetrical way (Ju et al. 2017), a somatic variant could putatively be
present in more than 50% of the cells. On the other hand, a mutation occurring
later could be very rare in the tissues (Fig. 15). Even if the former is the case, a
mutation present in most tissues can still be responsible for a disease if the
affected gene is only expressed or relevant for a specific organ. Further, because
approximately 12 cell divisions occur before gastrulation (Snow 1977), even
mutations present in only 0.02% of the cells can be found in different tissues from
all germ layers. For this reason, sequencing the affected organ and comparing it
to an unaffected tissue is an inadequate strategy, because for a reasonable
sequencing resolution, variants will most probably be present in both. This
suggests that variant calling algorithms should be quite different for cancer and
other somatic mutation diseases. In particular, systematic sequencing errors or
those arising from misaligned unresolved regions of the genome become relevant,
since they produce false positives for different samples in a similar proportion. Yet,
in the worst-case scenario in cancer calling, such artefacts would be considered
as shared between control and tumor DNA and therefore discarded.
These systematic or recurrent errors are often only distinguishable from true
somatic variants by the fact that they are found in multiple tissues and individuals,
which given the somatic mutation rate found to date (Lodato et al. 2015; Alexej
Abyzov et al. 2017; Bae et al. 2018) is very unlikely to be the case. The probability
of those calls being biased sequencing errors or other kind of artefacts is much
higher. Nonetheless, the interaction of DNA with certain local chromatin features
has a strong influence on how nucleotides are damaged and repaired at the local
level, which ultimately results in different mutation probabilities along the genome
(Gonzalez-Perez, Sabarinathan, and Lopez-Bigas 2019). Moreover, when
analyzing patients suffering from the same disease, some recurrent events could
be expected. This is why comparisons with a panel of controls can be helpful to
discern between these scenarios.
Cancer driver somatic mutations in healthy tissues
Nonetheless, it is becoming clear that even for assessing the relevance of
mutations in cancer, basic knowledge on healthy tissue development and

36
maintenance and the forces shaping clone dynamics is necessary. In one of the
first examples of healthy tissue analysis, Martincorena et al. sequenced 74 cancer
genes at an average depth of coverage of 500x in 234 biopsies of sun-exposed
but physiologically normal skin from four individuals. They found a surprisingly high
burden of mutations, higher than that of many tumors, some of them already under
strong positive selection. Hundreds of evolving clones per square centimeter of
skin and thousands of mutations per skin cell were detected. They suggested that
there may be an underlying reservoir of competing clones in normal skin. It was
also noted that even if a drug that killed all cells with an inactivated tumor
suppressor gene commonly inactivated in squamous cell carcinomas – NOTCH1
– was developed, 60% of the tumors could be treated but with considerable
collateral damage to physiologically normal skin, whose cells frequently carry
inactivated NOTCH1 (Martincorena et al. 2015).
To test whether these observations were the result of skin exposure to mutagens
like UV light, a similar study was carried out on 844 small samples of normal
esophageal epithelium from nine individuals. Again, 74 cancer genes were target
sequenced at high depth, 870x. Clones carrying mutations in 14 of them were
found to be under strong positive selection. Interestingly, mutations in NOTCH1
were more common in normal esophageal epithelium than in esophageal cancer,
demonstrating that the appearance of these genes in cancer could be caused by
their high mutation frequency in the normal cells from which tumors evolve
(Martincorena et al. 2018). On the other hand, CNVs were infrequent, suggesting
negative selection. A similar observation has been recently made for neurons
(Chronister et al. 2019).
Two recent preprints on colorectal and endometrial epithelium came to similar
conclusions. Somatic mutations on cancer driver genes were present in ∼1% of
normal colorectal crypts in middle-aged individuals, indicating that adenomas and
carcinomas are rare outcomes of a pervasive process of neoplastic change across
morphologically normal colorectal epithelium. However, the structure of this
tissue, organized in crypts, constrained clonal expansion (Lee-Six, Ellis, et al.
2018). In contrast, a vast majority and even all of the endometrial glands were
found to be colonized by cells carrying driver mutations in most women, probably
because periodic endometrial shedding creates more opportunities for such
clones to expand. Further, mutational burdens increased with age as well as with
other factors such as body mass index and parity (Moore et al. 2018).

37
All of these studies were performed on epithelium, a tissue with an elevated
turnover in which mutations conferring proliferative advantages would be
expected to spread with age, even if differences are observed depending on tissue
structure and renewal. Also, many of the studies only sequenced cancer driver
genes to a sufficient coverage, which limits their ability to study population
dynamics in these healthy tissues.
Analyzing a different tissue, whole-genome sequences of normal blood from 241
adults at a coverage of ~30x resulted in the identification of 163 early embryonic
mutations. A few of them were also found in breast, an ectodermal tissue, including
some variants whose frequencies were smaller than 5% in both tissues.
Reconstruction of cell lineages with the identified mutations suggested that the
two daughter cells of many early embryonic divisions contribute asymmetrically to
adult blood at an approximately 2:1 ratio (Ju et al. 2017). This could be general to
other adult tissues, but since blood development and maintenance is clonal (Sun
et al. 2014), it might well be an exception. Indeed, in the immune system,
developmentally programmed somatic mutations produce cellular diversity for
antigen recognition through V(D)J recombination, the process by which T and B
cells randomly assemble different gene segments to construct varied lymphocytes
receptors during early development (reviewed in Alt et al. 1992). Furthermore, in
response to antigen, somatic hypermutation occurs, which involves the MMR
machinery (Chaudhuri, Khuong, and Alt 2004), making blood a tissue where
somatic mutations are expected to be at higher rates.
5.3 Somatic mutations in healthy tissues
Rehen et al. showed that somatic copy number variants as big as chromosome 21
aneuploidy were frequent in the healthy human brain. Later, it was also shown that
retrotransposons mobilize during neurogenesis creating mosaicism both in both
rodents and humans and (Muotri and Gage 2006; Coufal et al. 2009; Muotri et al.
2009; Singer et al. 2010), indicating this process is common in the mammalian
development. In the past five years, several studies have tried to characterize the
number of somatic mutations in human cells, adult and fetal, from different tissues.
In a recent study, the whole genomes of 36 single neurons from the prefrontal
cortex of neurotypical individuals were sequenced. The somatic SNVs reflected a
pattern of transcription damage rather than replication and the cell tree
reconstructed with the variants evidenced the existence of different lineages.
Recurrent SNVs in neurons were rare – 1 to 11 per neuron – compared to a higher

38
number of potentially unique SNVs – 300 to 900 – which are difficult to reliably
distinguish from errors produced by amplification methods. Interestingly, some
SNVs exclusive to one neuron lineage were also present in cardiomyocytes, even
though they arose from a different germ layer, the mesoderm (Lodato et al. 2015).
This is not completely unexpected since those variants were present in more than
2% of the cells in both tissues, pointing towards them happening at the 6th division.
Significant proliferation and cell movements occur between then and gastrulation
during embryonic development, providing an explanation for their presence in
multiple tissues. Similar numbers of variants and proportion of shared mutations
were found using mice reprogrammed adult postmitotic neurons generated by
somatic cell nuclear transfer of neuronal nuclei into enucleated oocytes (Hazen et
al. 2016).
A different technique was used to explore somatic mutations in fibroblasts derived
from children. Human induced pluripotent stem cell lines were derived from 32
fibroblasts. This technique uses clonal expansion of the cells to amplify the original
DNA up to a point where it can be sequenced without PCR amplification. Then,
variants present in the original fibroblast must be present in all cells, or 50% of the
reads in bulk sequencing, while variants arisen during culture will be less frequent.
On average, each fibroblast carried ~1,000 mosaic SNVs. This number was similar
in adults, indicating that somatic mutations happen mainly during embryonic
development (Alexej Abyzov et al. 2017).
Sequencing clonally expanded forebrain neurons from fetuses, as expected, a
lower number of variants was found, 200-400 SNVs per cell. SNVs with a
frequency higher than 2% in brain were also present in the spleen (Fig. 16),
revealing a pregastrulation origin. Assigning mutations to the first five postzygotic
cleavages based on their frequency showed an early mutation rate of ~1.3
mutations per division per cell, with a mutational spectrum similar to that of de
novo mutations. However, variants assigned to later divisions, during
neurogenesis, implied a higher rate and a spectrum associated with oxidative
damage, which the authors proposed to be a result of the development of the
cardiovascular system (Bae et al. 2018). The inferred somatic mutation rate is
higher than that found in adult epithelium (Lee-Six, Øbro, et al. 2018; L. Moore et
al. 2018), once again indicating higher mutation rates during embryonic
development.

39
Figure 16. Assignment of somatic mutations to early development divisions. A. Hierarchical clustering of SNVs genotyped in the different brain regions and spleen by their variant allele frequencies (VAFs). White squares represent zero VAF. B. Reconstructed cell genealogy tree and assignment of SNVs. Conflicts of SNV assignment are denoted by “?”. Expected VAF denotes the VAF mutations arising at each stage should have, assuming equal contribution of all lineages to tissues. (From Bae et al. 2018)
5.4 Somatic mutations can cause disease
Most of the early observations linking somatic mutations with disease were cases
of parental mosaicism. Maternal mosaicism for chromosome 21 trisomy was
reported in the early 1960s (Weinstein and Warkany 1963) and during the 1980s
multiple studies showed germline mosaicism in phenotypically normal parents
could affect recurrence risk of diseases such as achondroplasia or Duchenne
muscular dystrophy (reviewed in Hall 1988) or retinoblastoma (Sippel et al. 1998).
The first decade of this century witnessed the association of somatic mutations to
neurological diseases. Gleeson et al. discovered over 30% of cells had to be
mutant for the DCX gene for patients to develop doublecortex and lissencephaly.
It was also shown that microdeletions of NF1 produce neurofibromatosis type-1
(Messiaen et al. 2011) and AKT3 mosaicism contributes to hemimegaloencephaly
(Poduri et al. 2012).
Examples of somatic mutations causing diseases have become increasingly
common over the past lustrum. Priest et al. were among the first to show the
relevance low frequency somatic mutations can have. An infant with perinatal
long-QT syndrome (LQTS), a life-threatening arrhythmia, carried an SNV in a
sodium channel, SCN5A, in 8% of their leukocytes. The same variant could be

40
detected in 5.4% and 11.8% of cardiac transcripts in two ventricular myocardial
samples. A computational model showed the delay of sodium current caused by
the mutation was sufficient to explain the arrhythmia. It was also found that a small
proportion of LQTS patients (13/7,500 or 0.17%) also carried early somatic
mutations (Priest et al. 2016).
A second case highlights the relevance of low frequency variants in a phenotypic
rescue event. Hutchinson-Gilford progeria syndrome (HGPS) is a fatal sporadic
dominant condition in which mutations of the LMNA gene cause premature
ageing. Patients heterozygous for a T>A mutation at a specific position suffer with
very severe cases of progeria. On the other hand, individuals with a T>C at the
same position present milder symptoms. A case with 4.7% of cells carrying T>C
and 41.3% carrying T>A was described, and a significantly milder phenotype than
the one found with just T>A was observed. The authors’ hypothesis was that the
T>A variant was a germline de novo mutation and the A>C substitution occurred
during embryonic development, partially rescuing the phenotype (Bar et al. 2017).
Primary immunodeficiencies are oftentimes caused by germline de novo mutations
in a group of well-characterized genes. A target sequencing study showed that
roughly 25% of genetically undiagnosed cases could be explained by a somatic
mutation in one of these genes, with mutant cell frequencies ranging from 0.8% to
40.5% (Mensa-Vilaró et al. 2019).
Neurological developmental diseases have also been linked to somatic variants. A
case of hemimegaloencephaly was found to be caused by a somatic mutation in
AKT3 in 35% of brain cells and not detected in blood at a 2% resolution (Poduri et
al. 2012). Also, focal cortical dysplasia type II has been found to be the result of
somatic mutations in MTOR in 6-13% of brain cells and undetectable in 600x blood
exome sequencing (Lim et al. 2015; Park et al. 2018). Another study identified
nine somatic variants in early-onset Alzheimer disease patients in genes related to
the disease: two in APP, five in SORL1, one in NCSTN, and one in MARK4 with
allele fractions ranging from 0.2% to 10.8% (Nicolas et al. 2018).
Further, somatic mutations can be used to associate genes with diseases in
discordant monozygotic twins. This helped to detect new as well as previously
described genes involved in amyotrophic lateral sclerosis, schizophrenia,
Tourette’s syndrome and autism spectrum disorder (Vadgama et al. 2019).

41
Finally, the burden of somatic variants was found to be much higher in patients
with autism compared with controls (Lim et al. 2017; Dou et al. 2017), indicating
the putative relevance of somatic mutations in complex diseases.
Somatic mutations and ageing
Somatic mutations were proposed to be implicated in ageing more than two
decades ago, in the somatic mutation theory of ageing. It suggests that ageing did
not evolve but has always been present, occurring as the result of fundamental
chemical processes (Morley 1995). In fact, somatic SNVs accumulate with age in
the brain (Lodato et al. 2018). Also, the absence of negative selection in cancer
and on point mutations during normal somatic tissue maintenance suggests that
even point mutations deleterious to the carrying cell do not drive cellular
senescence, exhaustion, and death (Martincorena et al. 2017). This suggests that
mutations could accumulate in the tissues with age and be the cause behind the
structural and functional changes that accompany the passage of age.
All these studies illustrate how little we know about somatic evolution within healthy
tissues, a fundamental process that is likely to take place to varying degrees in
every tissue of every species (Martincorena et al. 2018), with consequences in
disease and ageing. It can be considered that all germline variants, including
population polymorphisms, were at some point de novo mutations, which in turn
were somatic mutations that occurred in the germline lineage of an individual (Fig.
15). Therefore, the study of somatic mutation emergence, and the molecular
mechanisms behind this process is also the foundation towards understanding the
origin of population variants and probably to resolve the issue of the molecular
clock in population genetics. Even if the germline is a privileged cell lineage with
strong selective pressure against deleterious mutations, there is still controversy
on how germline mutations originate. Contradicting evidence pointing towards the
main role of either replication errors (Jónsson et al. 2017) or DNA damage (Z. Gao
et al. 2018) is still being leveraged. Understanding the determinants of somatic
mutation appearance can elucidate some of these questions.

42
6. Genome analysis technologies
Since the discovery of the molecular structure of the DNA, several tools have been
developed to analyze it, so that its changes can be linked to phenotypes and
diseases. Here we focus on the methods relevant for this thesis.
6.1 Comparative genomic hybridization arrays
Comparative genomic hybridization (CGH) consists of the simultaneous
hybridization of differentially labelled test and reference DNA to genomic probes.
Duplications or deletions are then identified as differences in the ratio of the
fluorescent labels. Traditional CGH was developed as a method for achieving
higher resolution than other forms of cytogenetic analysis such as Giemsa
banding, which could only detect events affecting heterochromatin distribution
pattern. It was first applied using whole metaphase chromosomes on a slide as
probes for cancer samples, which allowed the identification of new amplified loci
(Kallioniemi et al. 1992).
Later on, array CGH (aCGH) was developed by applying this concept to DNA
microarrays – a solid surface containing known nucleotide sequences at specific
locations – to detect copy number changes on a genome wide and high-resolution
scale (Solinas-Toldo et al. 1997). This is achieved by first attaching 100-200 kb
cloned DNA fragments to the array. The test DNA, such as DNA from a patient
suspected to have a CNV, is fragmented and labelled with a red fluorophore
(cyanine 5), while a control genome is labelled with a green fluorophore (cyanine
3). Equal amounts of both samples are co-hybridized to the array. Then, both
fluorescent light intensities are measured at each array spot, so that an excess of
red light indicates a duplication of the region containing the probe in the test
genome, whereas an excess of green light results from its deletion (Fig. 17). This
way, estimations of copy number with respect to the control sample can be
calculated with high resolution. However, because DNA must be previously
fragmented, balanced chromosomal rearrangements are not detectable, since the
translocated pieces will be in the pool of fragments irrespectively of their position
in the test genome. Nonetheless, most rearrangements, even if apparently
balanced, are associated with deletions whose detection with aCGH can be useful
for clinical treatment (Astbury et al. 2004; Schluth-Bolard et al. 2009).

43
Figure 17. Array comparative genomic hybridization process. (From Shaw-Smith 2004)
Since genomic rearrangements occur frequently in cancer, array CGH has been
extensively used to identify them. Due to its higher resolution, several tumor
suppressor genes located in previously identified loci were found with this
technology (Hodgson et al. 2001; Lassmann et al. 2007). Interestingly, the
correlation of poor prognosis in mantle cell lymphoma with aCGH data showed
that 8p and 13q14 deletions were relevant for survival (Kohlhammer et al. 2004).
Further, small deletions have been associated with other diseases such as autism
with the use of aCGH in large patient cohorts (Weiss et al. 2008), even in a somatic
state (Celestino-Soper et al. 2011). Several other intellectual impairment
syndromes are caused by microdeletions. Previous methods could not identify
these short changes, but aCGH has been proven to detect them (Vissers et al.
2003) albeit with a high false positive rate (Sagoo et al. 2009). Also, its use for
prenatal diagnosis has been implemented (Rickman et al. 2005), although
orthogonal methods such as SNP arrays can be of use to detect triploidy (Wapner
et al. 2012).
Finally, cases of APP duplication in early onset Alzheimer patients have also been
detected with aCGH (Kasuga et al. 2009) as well as multiplications of the α-
synuclein gene in familial Parkinson disease patients (Sironi et al. 2010; Ferese et
al. 2015).

44
6.2 DNA sequencing The first DNA sequencing technologies had a very low throughput. Sanger
sequencing requires four separate reactions, each with one different labelled
dinucleotide. Primers are hybridized to the input DNA strands and extended with
a mixture of the four regular nucleotides and one of the labelled dinucleotides.
Each time a base complementary to the dinucleotide of that reaction is present in
the input sequence, extension is arrested in a few of the fragments while the others
continue until the complementary base appears again. After this process, the
resulting fragments are sorted by size in a polyacrylamide gel, each reaction in
one lane, so that an autoradiography shows the arrested fragments and hence the
nucleotide sequence can be inferred (Sanger, Nicklen, and Coulson 1977).
Sequences as long as 1,000 bp can be determined with this method and a
physical map was used to order and concatenate the obtained sequences into
chromosomes or genomes.
Later on, shotgun sequencing made sequencing possible without the need of a
physical map. DNA sequences are randomly broken into fragments called reads,
which after sequencing, are assembled into the original sequence by the use of
their overlaps to align them. DNA sequences coming from the same genomic
region are broken into different reads and the same position is sequenced multiple
times. The number of reads a position is sequenced by is known as depth of
coverage. As an example, the Human Genome Project, the first to use shotgun
sequencing, sequenced most of the human genome at about 10x (International
Human Genome Sequencing Consortium 2001).
Next-generation sequencing
Next-generation sequencing, or high-throughput methods, sequence DNA in a
different manner, called sequencing-by-synthesis (Fig. 18). The input DNA is
broken into small fragments whose ends are then ligated to adaptors, short
sequences complementary to flow cell oligos as well as to the sequencing primers.
In paired end sequencing, fragments will be sequenced from both ends. Hence,
to avoid overlapping, DNA is usually shredded by sonication into fragments with
length, or insert size, longer than double the read length.
The flow cell is a glass slide divided in lanes with two type of oligos fixed to it.
Fragments attach to the flow cell by one of the adaptor strands. Then, the
complementary sequence is formed by polymerase chain reaction (PCR)
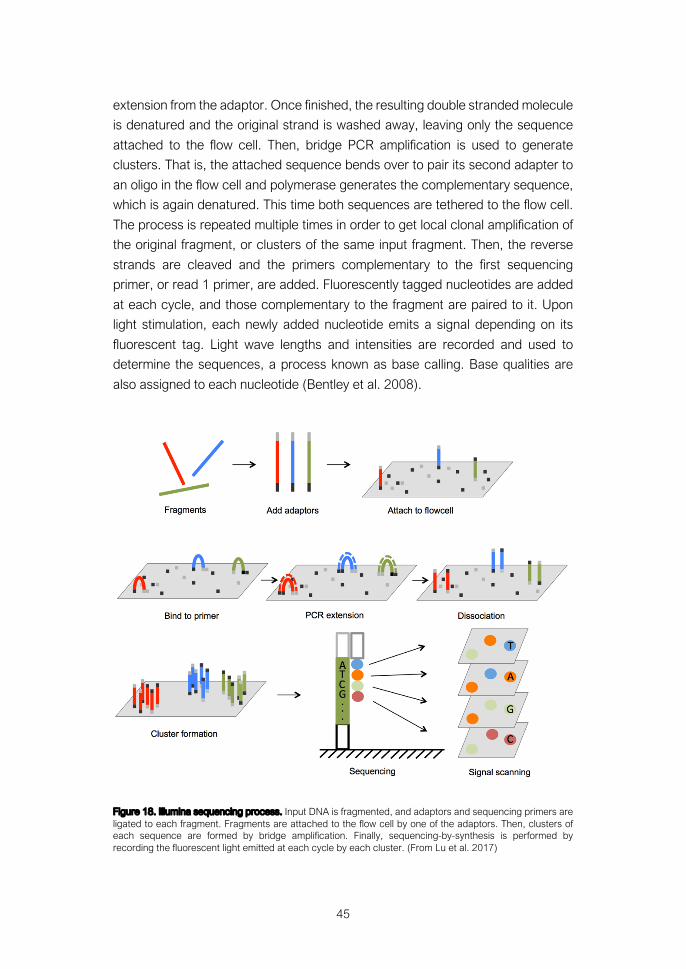
45
extension from the adaptor. Once finished, the resulting double stranded molecule
is denatured and the original strand is washed away, leaving only the sequence
attached to the flow cell. Then, bridge PCR amplification is used to generate
clusters. That is, the attached sequence bends over to pair its second adapter to
an oligo in the flow cell and polymerase generates the complementary sequence,
which is again denatured. This time both sequences are tethered to the flow cell.
The process is repeated multiple times in order to get local clonal amplification of
the original fragment, or clusters of the same input fragment. Then, the reverse
strands are cleaved and the primers complementary to the first sequencing
primer, or read 1 primer, are added. Fluorescently tagged nucleotides are added
at each cycle, and those complementary to the fragment are paired to it. Upon
light stimulation, each newly added nucleotide emits a signal depending on its
fluorescent tag. Light wave lengths and intensities are recorded and used to
determine the sequences, a process known as base calling. Base qualities are
also assigned to each nucleotide (Bentley et al. 2008).
Figure 18. Illumina sequencing process. Input DNA is fragmented, and adaptors and sequencing primers are ligated to each fragment. Fragments are attached to the flow cell by one of the adaptors. Then, clusters of each sequence are formed by bridge amplification. Finally, sequencing-by-synthesis is performed by recording the fluorescent light emitted at each cycle by each cluster. (From Lu et al. 2017)

46
The number of cycles performed determines read length. After all the cycles are
completed, the fragments synthesized during sequencing are washed away. Then,
the original fragment bends over, pairs with the second oligo, is extended by
polymerase, and the original forward strands are cleaved, leaving only the reverse
strands in the flow cell. Finally, the read 2 sequencing primer is added and the
process is repeated to sequence the fragment from its other end (Bentley et al.
2008).
It is important to differentiate between strand and read pair. The strand of a
sequence is determined only after aligning it to the reference genome. By
convention, the reference genome sequence is considered the forward or plus (+)
strand, while its reverse complement is considered the reverse or minus (-) strand.
As previously described, in paired end sequencing, read 1 is the first read to be
sequenced. In Illumina, sequencing starts with the 5’ end sequencing primer.
Therefore, reads that are read 1 can be forward or reverse, and the same is true
for read 2.
Over run time, clusters can grow to the point where they start to overlap. This,
together with reagents suffering suboptimal temperatures for several hours or
even days during sequencing, implies that base calling from sequencing read 2 is
more difficult, hence usually read 2 base qualities are lower.
Calling somatic mutations from next-generation sequencing reads
In order to obtain the input DNA, it has to be extracted from a bulk sample, that is,
a piece of tissue. Often, the chosen tissue is blood, since it is accessible without
the need of an invasive biopsy. Cell membranes are first broken to release the
DNA, which is then precipitated and separated from other cell components. This
way, most of the DNA in all the cells present in the sample ends up in the
extraction. Then, the extracted DNA is shred into small fragments and a DNA
library is prepared by ligating the sequencing adaptors to them. In the end, only a
small proportion of those fragments is sequenced, so when the obtained reads are
mapped to the reference genome, the different reads overlapping the same region
come from different DNA molecules, and most probably, from different cells. Since
the main interest of this project are somatic mutations, which will be present only
in one of the chromosomes of a small proportion of cells, after library preparation,
only some library fragments will contain the mutation, and this number will be
proportional to the number of cells carrying it. This way, from the proportion of

47
reads supporting the alternative allele, we can infer the proportion of mutant cells
in the tissue.
Traditional somatic mutation callers were developed for cancer and were focused
on detecting mutations present in the tumor and absent in the normal tissue, so
they usually require paired samples. In fact, most reviews and evaluations of
somatic variant callers are centered on the use of paired samples (Krøigård et al.
2016; C. Xu 2018). However, as previously discussed, expectations in a
developmental somatic mutation scenario are different. Nonetheless, some callers
can be used without matched normal samples, such as Varscan 2 (Koboldt et al.
2012), Mutect2 (Cibulskis et al. 2013) or MosaicHunter (A. Y. Huang et al. 2017).
Callers use read features to assess the probability of alternative allele supporting
reads being artefactual or true somatic mutations. On the one hand, MosaicHunter
combines a Bayesian genotyper with filters that heavily refine calls based on
multiple features, including extreme depth, repetitive regions, strand bias or a
variant being observed in population databases. On the other hand, Varscan 2
applies heuristic methods to detect variants and can be tuned for different
sensitivity levels. Of course, if sensitivity is set high, a multitude of false positive
variants is also called. Other callers such as Mutect2 use intermediate strategies.
Somatic mutation calling from a single sample is a complex process with many
features flagging different noise sources. Thus, using the consensus of multiple
callers has been proposed for increasing accuracy (Goode et al. 2013). This is
because certain read features indicate a higher probability of a call being a false
positive. However, they cannot perfectly separate true and false positives, so the
combination of different callers with a variety of confidence thresholds helps to
determine a more reliable set at the cost of sensitivity. The lack of a benchmarking
dataset with a known ground truth for somatic mutations hinders the task of
developing accurate somatic callers.
6.3 Exome sequencing
Although genome sequencing price decreased almost exponentially in the first
decade of this century (Check Hayden 2014), it still costs several hundreds of
euros to sequence a genome at the coverage needed for population genetics or
the discovery of deleterious germline variants. Somatic mutation calling requires a
much higher coverage to have the power necessary to uncover a significant
number of variants, usually at least 3 to 4 times more coverage. Also, mutation
rates are not high, so it could be argued that it is more probable that de novo

48
mutations causing human diseases are located in the exome, where they have a
more direct effect on the phenotype. Since the exome is about 1% of the total
sequence of the genome, even if capture baits are necessary, the cost of
sequencing only this region is reduced proportionally. Accordingly, exome
sequencing has been extensively used for the detection of causal germline
mutations (review in Bamshad et al. 2011) as well as for the discovery of somatic
mutations involved in multiple diseases (Pagnamenta et al. 2012; Azizan et al.
2013; Yu et al. 2014; J. S. Lim et al. 2015).
Exome sequencing can be achieved by two different methods. The least common
of them is amplicon-based exome sequencing, where primers complementary to
the boundaries of exons amplify them specifically and the resulting product is
sequenced. This method has higher false positive as well as false negative call
rates and produces worse coverage uniformity (Samorodnitsky et al. 2015). The
most common method is hybridization-based exome sequencing. RNA probes
with exome sequences hybridize with the complementary DNA fragments,
capturing them, while the rest is washed away. Then, the retained fragments are
amplified and sequenced (R. Chen, Im, and Snyder 2015). Although this method
is superior to amplicon-based methods, probes are synthesized with the reference
sequence. Hence, if an individual is heterozygous for multiple close positions, the
DNA fragments carrying the alternative allele will hybridize less effectively with the
probes, reducing their capture efficiency. Fewer fragments with these variants will
be present in the final sample so after sequencing, allele balance will be smaller
than 50%, a phenomenon known as capture bias. Nonetheless, even if this is the
main reason why exome variants are better found with whole genome sequencing,
they only differ in about 3% of variants (Belkadi et al. 2015).
Several bases surrounding the exons are usually also captured, especially around
short exons. Some of these bases are off-target, bases not intended to be
captured but retrieved because fragments complementary to the probes
contained them. Nonetheless, depending on the capture design, some intronic
bases will be on-target, so their coverage is enough to discover variants. This
allows to find intronic variants that can alter splicing donor or acceptor sites as
well as positions involved in nonsense-mediated decay.

49
6.4 Other technologies useful for somatic variation analysis
Single cell sequencing
Unlike bulk sequencing, where multiple cells are homogenized into a single
sample, techniques that allow the sequencing of individual cells have been
recently developed (Marcy et al. 2007; Pushkarev, Neff, and Quake 2009). Since
the amount of DNA present in an individual cell is insufficient for sequencing, whole
genome amplification (WGA) needs to be performed first. Multiple methods exist
to do this, such as multiple annealing and looping-based amplification cycles
(MALBAC) (Elowitz et al. 2002) or more frequently used, multiple displacement
amplification (MDA) (Dean et al. 2001). MDA amplifies a DNA sample by random
priming using the bacteriophage Φ29 polymerase (Lázaro, Blanco, and Salas
1995), which amplifies continuous strands that are then displaced and again
amplified. This produces a large amount of DNA from a very limited input sample.
Unfortunately, biases are common, specifically, one of the DNA strands can be
preferentially amplified to the point where allele dropout occurs. That is, one of the
alleles is not amplified. Moreover, amplification can be uneven, producing a few
very poorly amplified chromosomes (Borgström et al. 2017). Further, the type of
lysis used in the protocol can influence the profile of errors obtained (Dong et al.
2017).
Single cell sequencing has been used to explore tumor heterogeneity (Gerlinger
et al. 2012) and has also been proposed as a method for screening in-vitro
fertilized embryos prior to implantation (Xu et al. 2016). Although it can be used to
discover somatic variants, the cost of sampling enough cells to get a robust
estimation of mutation frequencies in the tissue would be high. Nonetheless, it is
very useful for validating somatic mutations found in bulk sequencing, especially
systematic sequencing errors. They can be identified if a proportion of reads
supporting a somatic mutation (1-30%) support the alternative allele in multiple
single cells. Also, cell lineage trees can be inferred by using this technology
(Frumkin et al. 2005).
Clonal expansion of single cells
A different strategy to amplify the genome of a single cell and to have enough
material for sequencing is to culture it. Primary cultures can be derived by growing
single cells from multiple tissues. This way, DNA is copied by replication and the

50
repair machinery of the cell can ensure a high-fidelity process. Then, DNA can be
extracted and sequenced from a bulk sample of the culture. Variants present in
the original single cell will be inherited by all the culture cells and therefore will be
in ~50% of the sequencing reads. On the contrary, mutations that appear during
clonal expansion will be present in less cells and reads, and can be discarded
subsequently (Alexej Abyzov et al. 2017). Nonetheless, certain variants could
provide cells with proliferative advantage and as a consequence, be
overrepresented in the culture. To ensure the somatic state of the variants, target
sequencing or PCR of DNA obtained from a bulk sample of the same tissue from
where the cells were obtained can confirm their presence even if their frequency
is very low (Bae et al. 2018). Also, systematic errors would fit better with a clonal
expansion variant and would be discarded.
Linked reads sequencing
Linked reads are those known to belong to the same DNA molecule. This is
achieved by tagging high molecular weight (HMW) DNA molecules during library
preparation. In the Chromium by 10x platform, about 10 long DNA strands are
mixed with a barcoded gel bead and restriction enzymes in a microfluidics chip so
that micelles are formed. Then, the micelles are incubated, and the DNA is
partitioned and barcoded. The probability of two HMW molecules from the same
locus to have the same tag is very low. This way, after sequencing the resulting
reads, reads that map close to each other and share the barcode can be linked
(Kitzman 2016). This knowledge can be used to resolve regions with lower
complexity as well as to build haplotypes. In somatic mutation calling, linked reads
can be very useful to determine heterozygous mutations, since even if the
proportion of reads supporting one allele fits more with it being a somatic mutation,
if each allele is phased with one of the germline haplotypes, it must be a
heterozygous mutation. Also, artefacts can be detected if they phase with both
haplotypes, because true somatic mutations only phase with one of the germline
alleles, that of the strand where they first appeared. This methodology can be used
both with bulk and single-cell sequencing strategies, including exome sequencing
(Mortensen et al. 2019).
Third generation sequencing
New sequencing technologies have been established in the past few years.
Instead of generating reads a few hundred base pairs long, third generation
sequencing platforms produce single molecule reads as long as 100,000 bp.

51
Pacific Biosciences (PacBio) Single Molecule Real Time sequencing (SMRT)
technology uses sequencing-by-synthesis and fluorescent emissions by the four
differently tagged nucleotides incorporation but does so for long single molecules
and without cluster amplification (Korlach et al. 2010). A more recent technology
is the Oxford Nanopore MinION. DNA molecules pass through a nanopore and
the disruption to the electric current is used to determine their sequence, without
DNA synthesis (Stoddart et al. 2009). Although the potential utility of long reads
for calling somatic mutations is obvious – they would help identifying heterozygous
variants and artefacts from unresolved regions – higher and recurrent errors are
still common (Carneiro et al. 2012; Laver et al. 2015), complicating their use.

52
7. Neurodegenerative diseases
Neurodegenerative diseases are those that result from the progressive loss of
nervous system cells and functions. The greatest risk for such conditions is ageing.
Thus, modern lifespan increase implies that the number of people suffering with
neurodegeneration has and probably will increase. Alzheimer and Parkinson
diseases are the two most common neurodegenerative disorders, whose causes
are far from being elucidated.
7.1 Parkinson disease
Parkinson disease (PD) is the second most common neurodegenerative disorder.
Though it is rare in the general population, prevalence increases with age, so that
about 1% of people over 60 years of age and up to 4% in the highest age groups
are afflicted (de Lau and Breteler 2006). PD cases have been reported all
throughout history (García Ruiz 2004) but it was finally named after James
Parkinson in 1817 for his dedication to the shaking palsy.
The most characteristic clinical manifestations of this progressive disease are
resting tremor, bradykinesia, rigidity and postural instability (Hoehn and Yahr
1967). Its pathological features are the loss of dopaminergic neurons in the
substantia nigra, a basal ganglia structure, and the appearance of Lewy bodies,
abnormal accumulations of ubiquitinated proteins inside cells (Kuzuhara et al.
1988), which mainly contain α-synuclein, a presynaptic protein (Spillantini et al.
1997).
The substantia nigra has two main parts, pars reticulata and pars compacta.
Neurons at the pars reticulata are GABAergic and thus inhibit multiple brain
regions, modulating body and eye movement. On the other hand, pars compacta
has mainly dopaminergic neurons which are involved in learning and reward-
seeking through their connection to the striatum, the largest structure of the basal
ganglia (Afifi 1994).
In 1960, it was discovered that PD patients presented an acute loss of dopamine
in the caudate nucleus and the putamen (Ehringer and Hornykiewicz 1960), which
led to the well-established therapy with levodopa, a drug by then already known
to be decarboxylated to dopamine in the body (Holtz 1939). This loss is driven by
neuronal death, which affects especially the ventral component of the substantia

53
nigra (Bernheimer et al. 1973), a structure that by time of death has lost 50-70%
of its neurons compared to unaffected individuals (Davie 2019). Pathological
changes progress to other regions as the disease advances, and such progression
is what determines the different Braak stages (Braak et al. 2003). Lewy neurites,
fibrillar α-synuclein aggregates are more frequent in stage I, when structures of
the lower brainstem and the olfactory nucleus are affected. Then, in stage II, they
expand to the medulla oblongata. In stage III, Lewy bodies are more frequent, and
they expand to the pars compacta of the substantia nigra. In stage IV, severe
dopaminergic cell death in the pars compacta occurs. Also, the amygdala and
thalamus are affected. In stage V, the disease expands to the neocortex and at
stage VI motor and sensory areas in the brain are also affected (Braak et al. 2003;
Jellinger 2009).
Some environmental causes for parkinsonism have been reported. Manganese
intoxication induces parkinsonism without the appearance of Lewy bodies
(Aschner et al. 2009) and because different structures are affected, such as the
cerebellum (Perl and Olanow 2007), it cannot be considered as a cause of
Parkinson disease, but just of parkinsonism. More importantly, 1-methyl-4-phenyl-
1,2,3,6-tetrahydropyridine (MPTP) causality of PD was accidentally discovered
after heroin addiction sufferers consumed a synthetic opioid, desmethylprodine
(MPPP) which was contaminated with MPTP (Lewin 1984; P. A. Ballard, Tetrud,
and Langston 1985). MPTP is metabolized to 1-methyl-4-phenylpyridinium
(MPP+), which has high affinity for the dopamine transporter dopaminergic
neurons use to reuptake the neurotransmitter, thus making them more vulnerable
to this toxin (Shen et al. 1985). MPTP has been used for inducing Parkinson in
animals since. Interestingly, some herbicides such as Paraquat, have a similar
chemical structure to MPTP, and it has been shown that continued exposure to
them increases the risk of PD development (Koller et al. 1990; Van Maele-Fabry
et al. 2012).
Since it is primarily a sporadic disease, a genetic cause was considered unlikely
for a long time. However, in the 1990s some early-onset familial cases were
reported (Duvoisin 1996) and finally, a dominant variant in the α-synuclein gene
(SNCA) was identified as causal (Polymeropoulos et al. 1997). It was proposed
that the missense mutation promoted self-aggregation by changing protein
structure. Soon thereafter, α-synuclein was also detected in Lewy bodies of
sporadic PD cases (Spillantini et al. 1997), and a second mutation in familial cases
was discovered (Krüger et al. 1998) demonstrating the relevance of this protein in
the development of Parkinson disease.

54
A different progression of the disease, juvenile parkinsonism, which has a very
early onset (before the age of 40) and a very slow progression with no Lewy bodies
or neurites at autopsy, has also provided insight into the molecular mechanisms
by the identification of mutations in familial cases. This is how mutations in parkin,
PRKN, were first described (Kitada et al. 1998). Parkin is a protein that attaches
ubiquitin to proteins, tagging them for degradation, a process known as
ubiquitination. Even more relevant loci have been discovered with family studies,
such as UCHL1 (Leroy et al. 1998), whose mutation creates a partial loss of its
catalytic activity that results in aberrations in the proteolytic pathway and
aggregation of proteins; once again highlighting the relevance of protein
degradation pathways for the disease. Among multiple other loci, microtubule associated protein tau (MAPT), though
more famously associated with Alzheimer, has also been linked to PD by
association within families (Martin et al. 2001). Pathogenic mutations in the GBA
gene produce Gaucher disease – a lysosomal disease – in homozygosis, whereas
in heterozygosis have been related to PD (Mata et al. 2008). Mitochondrial
dysfunction has also been proposed to be involved in the development of the
disease, with a hereditary form of Parkinson in consanguineous families caused by
mutations of PINK1 (Valente et al. 2004). Another monogenic form of
parkinsonism is caused by mutations in DJ1 (Bonifati et al. 2003) whose lack of
function sensitizes cells to oxidative stress (Yokota et al. 2003). However, whether
mitochondrial alterations result in malfunctions in the ubiquitin–proteasome
system or insufficiency in protein degradation leads to mitochondrial damage is
yet to be disentangled (Abou-Sleiman, Muqit, and Wood 2006).
Besides these monogenic familial cases, most PD cases are sporadic, and its
estimated heritability is quite low, with 18% of concordance between monozygotic
twins (Burn et al. 1992) when testing putamen dopamine uptake, and 25% of first-
degree relatives of Parkinson patients having abnormally reduced putamen
dopamine uptake (Piccini et al. 1997). A meta-analysis of genome-wide complex
traits analysis (GCTA) also identified up to 27% phenotypic variance (Keller et al.
2012).
The link between PD and somatic mutations is unclear. A study on 511 sporadic
cases did not find somatic variants in SNCA with a sensitivity limit at 5% of variant
allele frequency (Proukakis et al. 2014). On the other hand, high levels of
heteroplasmic mitochondrial DNA deletions in substantia nigra neurons were

55
found (Bender et al. 2006) and neurons at the substantia nigra carried more SNCA
gains than controls, positively correlating with age of onset (Mokretar et al. 2018). 7.2 Alzheimer disease
Alzheimer disease is the most common form of dementia, with millions of patients
worldwide (Cornutiu 2015). It is characterized by impaired memory, judgment,
decision making, orientation to physical surroundings, and language (Nussbaum
and Ellis 2003). The pathological hallmarks are neuronal loss, extracellular senile
plaques, and neurofibrillary tangles (Alzheimer 1907).
Similar to Parkinson disease, Alzheimer is a progressive disease. Hence, Braak
stages are also used to characterize the advancement of the disease, determined
by the appearance of neurofibrillary tangles in different brain regions
independently of senile plaque progression. In stages I and II, neurofibrillary
tangles are mainly confined to the entorhinal cortex. In stages III and IV limbic
regions such as the hippocampus are also affected, and in stages V and VI there
is extensive neocortical involvement (Braak et al. 2006). The entorhinal cortex is
the first brain structure to be affected and its functions are memory and planning
and spatial navigation, which some authors propose are two sides on the same
coin (Buzsáki and Moser 2013).
Senile plaques are also referred to as amyloid plaques, a term coined by the
German pathologist Rudolf Virchow in the XIX century because they appeared
starch or cellulose-like. We now know they result from the polymerization of
amyloid beta (Aβ) peptides. Aβ derives from the processing of the amyloid
precursor protein (APP), which is concentrated at synapses. APP is cleaved by β-
secretases and γ-secretases to form Aβ peptides. These peptides then form
soluble oligomers which could be involved in the disease (Hsia et al. 1999;
Shankar et al. 2008). When the oligomers polymerize into bigger structures, they
form amyloid plaques (Alzheimer 1907).
Aβ was shown to be in senile plaques in both Alzheimer and Down syndrome
patients (Masters et al. 1985). Although infrequent, duplications of APP cause
autosomal dominant early-onset familial Alzheimer (Sleegers et al. 2006). Because
they carry an extra copy of chromosome 21, where the APP gene resides, all
Down syndrome patients that survive to age 40, something increasingly common,
develop Alzheimer (Lott and Head 2005). Several mutations in APP were found in

56
familial cases (Goate et al. 1991; Tanzi et al. 1987; Chartier-Harlin et al. 1991),
which made Aβ polymerize at a higher rate. This led to the amyloid cascade
hypothesis in the 90s (Hardy and Higgins 1992) which suggests that is the toxic
effect of the plaques which results in synaptic alterations.
Neurofibrillary tangles are aggregates of hyperphosphorylated microtubule
associated proteins tau (MAPT). The main function of this protein is the
stabilization of microtubules, which is of especial relevance in axons and dendrites,
where microtubules are fundamental to vesicle transport. When tau is
hyperphosphorylated it dissociates from microtubules and polymerizes, forming
the neurofibrillary tangles (Alonso, Grundke-Iqbal, and Iqbal 1996). Other
diseases that have this same pathological element are called tautopathies (van
Slegtenhorst, Lewis, and Hutton 2000).
Familial cases also identified other loci involved in Alzheimer disease. Presenilin 1,
PSEN1, is a component of γ-secretase, one of the complexes that processes APP
into Aβ (St George-Hyslop et al. 1987). Later on, PSEN2, also a component of the
same complex was found (Schellenberg et al. 1992).
Altogether, heritability is estimated to be around 70% or higher than 90% for late
and early onset Alzheimer disease, respectively (Ballard et al. 2011; Wingo et al.
2012). It is clearly a complex disease, where multiple markers explain a portion of
the phenotypic variability (Ridge et al. 2013), nonetheless, some of it remains
unexplained.
Finding the cause of the sporadic forms of neurodegenerative diseases supposes
a great challenge. Since these cases are clinically undistinguishable from familial
forms, somatic mutations have been proposed as a non-inherited genetic cause
(Pamphlett 2004). Also, the fact that SNVs accumulate in neurons with age
(Lodato et al. 2018) could explain late onset cases.

57
OBJECTIVES
1. Detect features affecting somatic variant calling
2. Explore the burden of exonic single nucleotide somatic variants in
Parkinson disease
3. Assess the detection of somatic copy number variants in from aCGH data
4. Examine the abundance of somatic variants in a neurotypical individual in
the context of the Brain Somatic Mosaicism Network

58

59
RESULTS

60

61
Somatic mutations in Parkinson disease patients 1. Data processing for somatic variant calling
To explore somatic mutations in Parkinson disease (PD), we sequenced the whole
exome of five different tissues from ten patients. Blood was obtained from stored
vials, while central nervous system samples — neocortex, cerebellum, substantia
nigra and striatum — were collected during autopsies (table 1). Their exome was
captured and sequenced.
Inspection of the resulting FASTQ files showed increased per base sequence (Fig.
S1) and kmer content (Fig. S2) at the beginning and end of reads, that is, the same
sequences appear frequently at read ends. This usually appears as a result of
sequencing the ends of adapters ligated to each sample’s DNA fragments for
sequencing. Trimming algorithms can be used to remove these sequences, but
always suppose a compromise between keeping adapter sequence and removing
true sequence. This is because the algorithms look for portions of the known
adapter sequence at read ends. If one chose to be very stringent, all reads starting
with the last nucleotide of the adapter should be trimmed.
Further, the need to trim the reads disappears when using a mapper that performs
soft-clipping, i.e., read starts or ends are masked when they do not align to the
reference genome. Commonly used downstream tools take this masking into
consideration, so that nucleotides coming from adapters will not be included when
calling variants. This issue is especially relevant to consider when calling somatic
mutations. Excessive trimming could imply losing a few reads supporting an allele,
which can be crucial for variant calling. On the other hand, if reads are not
trimmed, adapter sequences could be mistaken for somatic variation if not
inspected carefully. Hence, a mapper that clips alignments — BWA — was used
to map the untrimmed reads to the human reference genome.
The chosen reference was hs37d5, the version of the human genome used by the
1000 Genomes Project (Gibbs et al. 2015) Phase II. Coordinates match the
standard hg19 reference, which enables the use of the more complete annotations
and orthogonal information available for that reference. Additionally, hs37d5
contains known human genomic sequences: An Epstein-Barr virus (EBV)
sequence and the decoy, which includes sequences coming from HuRef, BAC and
fosmid clones and the de novo assembly of NA12878. In contrast, alternate loci

62
are not included. The advantage the decoy provides is suggested by its name.
Reads find an accurate alignment quicker, instead of spending time looking for
more inexact matches. This improves mapping speed, and more importantly,
reduces false positive variant calls.
This strategy resulted in high mapping percentages; between 99.92% and 99.98%
of reads were mapped to hs37d5. FASTQ files were merged by sample, that is to
say, each tissue of each individual. Duplications accounted for a median of 5.5%
of reads. After their removal, secondary alignments were also excluded. This last
step is important for minimizing unspecific mapping, which can generate false
positives in somatic variant calling. After processing, the mean coverage on the
target region was 60x per sample (table 1, Fig. S3). Relative mean coverage
between the X and Y chromosomes was used to confirm each patient’s reported
sex (table 1).
Table 1. Sample information. Age at death, age at Parkinson onset, reported and genomic (Y/X) sex for each individual. Mean coverage over the exome per tissue and patient is indicated.
2. Germline variants
HaplotypeCaller with standard parameters was used to call germline variants for
each sample. Principal components analysis (PCA) of the obtained SNPs
suggested that the cerebellum sample from individual DV2 (DV2C) could instead
belong to DV8 (Fig. 19). In addition, compared to the other individuals, DV2’s
blood sample was distant to the rest of DV2’s tissues. Manual inspection of a few
variants confirmed this, showing DV2C shared variants with DV8 and not with the
other DV2 samples while DV2B had a smaller allele fraction of those same
Mean coverage
Patient ID Sex Age Onset Blood Cerebellum Striatum Neocortex Subst. nigra Y/X
DV1 Female 87 NA 57 58 57 57 57 0
DV2 Male 83 51 60 59 47 60 63 1
DV3 Female 81 68 59 61 60 61 63 0
DV4 Female 96 69 60 60 59 66 61 0
DV5 Female 81 NA 65 64 60 67 65 0
DV6 Male 76 51 61 61 61 64 61 1
DV7 Female 82 54 60 61 61 61 59 0
DV8 Male 79 NA 59 57 58 58 58 1
DV9 Male 50 27 61 57 57 58 56 1
DV10 Female 78 56 57 57 50 58 60 0

63
variants, suggesting a mixture of genomes in that sample (Figs. S4 and S5).
Because of this, DV2 was excluded from somatic variant calling. Still, its samples
were considered for noise profiling.
Figure 19. Germline variants PCA. Plots showing the four first principal components with the amount of variance explained by each of them in parenthesis.
2.1. Germline variants in known PD genes
We first checked germline variants in genes previously related to PD and reported
at OMIM (table S1). Combined Annotation Dependent Depletion (CADD) score
integrates multiple annotations into a single metric by contrasting simulated
variants to those that were not removed by natural selection. Specifically, a CADD
> 15 (Rentzsch et al. 2019) was used to select putative deleterious mutations. Two
variants, rs17651549 and rs12595158, had high values (table 2), indicating that
they are amongst the 0.6% most deleterious mutations that can occur in the
human genome. Variant rs17651549 is a missense mutation of the gene MAPT
predicted as deleterious by multiple methods (table 2) and at a position highly
conserved in vertebrates. The specific variant has been previously linked to PD by
different means: multivariate family-based association tests (K. S. Wang,
Mullersman, and Liu 2010), pathway analysis (Song and Lee 2013) and targeted
resequencing (Spataro et al. 2015). However, a contradictory haplotype
association analysis has shown it to provide a reduced risk for PD (J. Li et al.
2018). It is not infrequent in Europe; particularly, the frequency of the
heterozygous genotype (C|T) in the 1000G IBS population (Iberian populations in
Spain) is 0.383. Among our reduced number of individuals, the frequency is
higher, 6 out of the 10 are heterozygous.
●
●
●
●
●
●
●
●
●
●
−0.2
−0.1
0.0
0.1
0.2
−0.3 −0.2 −0.1 0.0 0.1PC1 (11.16%)
PC2
(10.
27%
)
●●
●
●
●
●
●
●
●
●
−0.2
−0.1
0.0
0.1
−0.2 −0.1 0.0 0.1 0.2PC3 (10.18%)
PC4
(10.
12%
)
Tissue
●● Blood
Cerebellum
Striatum
Neocortex
S.Nigra
Individual
●●●●●●●●●●●●●●●●●●●●
DV1
DV2
DV3
DV4
DV5
DV6
DV7
DV8
DV9
DV10

64
Another missense variant, rs12595158, overlapping the gene VPS13C, was
heterozygous in one of the individuals, DV3. VPS13C is involved in lipid dynamics
and has been shown to tether the endoplasmic reticulum to endosomes and
lysosomes (Lesage et al. 2016). Although rs12595158 is predicted as deleterious
by multiple methods and variants in the VPS13C gene have been linked to the
early onset autosomal-recessive form of PD (Lesage et al. 2016; Schormair et al.
2018), and to PD in general via GWAS (Safaralizadeh et al. 2016), this specific
variant has not been associated to any disease. The frequency of the C|T genotype
in IBS is 0 (0.054 pulling all European samples) but it is more frequent in South
Asian, East Asian and especially America, with more than half of Peruvians in Lima
(PEL) being heterozygote. Its relevance could depend on the genomic background
of different populations.
Table 2. Germline variants related to Parkinson disease. Variants identified both by genotyping PD related genes at OMIM and single nucleotide polymorphisms (SNPs) previously associated to the disease by GWAS studies. 1000 Genomes Project populations with the highest frequency are in parenthesis (IBS: Iberian populations in Spain, TSI: Toscani in Italia, PEL: Peruvians from Lima, Peru, GIH: Gujarati Indian from Houston, Texas, MSL: Mende in Sierra Leone, CHB: Han Chinese in Beijing, China). Effect predictions are encoded as deleterious (D), possibly damaging (P), tolerable (T), benign (B) and neutral (N).
Strategy PD genes PD genes GWAS SNPs GWAS SNPs GWAS SNPs GWAS SNPs
dbSNP ID rs17651549 rs12595158 rs34884217 rs1801582 rs7412 rs2010795
hg19 coordinates 17:44061278 15:62316035 4:944210 6:161807855 19:45412079 21:45172628
Ref C C A C C G
Alt T T C G T A
Gene name MAPT VPS13C TMEM175 PARK2 APOE PDXK
Type Missense Missense Splice acceptor Missense Missense Intronic
Change R370W R153H - V352L R202C -
Alt frequency 1000G EUR
0.231 0.034 0.083 0.150 0.066 0.337
Alt frequency 1000G IBS
0.266 0 0.154 0.229 0.056 0.369
Highest population alt frequency
0.36 (TSI) 0.43 (PEL) 0.154 (IBS) 0.301 (GIH) 0.141 (MSL) 0.510 (CHB)
CADD phred 25.2 22.5 14.02 10.30 26.3 5.656
GERP 5.51 4.98 4.9 4.71 5.09 -2.97
SIFT D D T T D NA
Polyphen2 HDIV D D B B D NA
Polyphen2 HVAR P P B B D NA
MutationTaster P P D P D NA
PROVEAN D N D N D NA
phastCons100way Vertebrates
1 1 1 0 0.986 0
Individuals DV3, DV4, DV5, DV6,
DV8 DV3 DV3, DV4
DV1, DV3, DV4, DV6, DV8, DV9
DV5, DV6, DV10
DV1, DV3, DV4, DV6, DV8, DV9,
DV10

65
2.2. Polymorphisms previously linked to PD
Then, we interrogated other polymorphisms previously linked to PD by GWAS
(table S2) (E.-K. Tan et al. 2010; Do et al. 2011; International Parkinson Disease
Genomics Consortium 2011; International Parkinson Disease Genomics
Consortium and Wellcome Trust Case Control Consortium 2 2011; Lill et al. 2012;
Nalls et al. 2014a; C.-M. Chen et al. 2016). Even if they overlap genes linked to
PD, our previous analysis was not able to pick them up because their CADD score
is not high enough (table 2). However, we can make use of the power that large
GWAS studies have to pinpoint interesting variants. Four of the linked
polymorphisms were heterozygous in at least one of our individuals:
DV3 and DV4 were heterozygous for a splice acceptor variant at TMEM175,
rs34884217. This variant has been associated to PD (Nalls et al. 2014b; Heckman
et al. 2017) and affects a gene in a site predicted to affect nonsense-mediated
decay on a gene whose deficiency has been linked to the increase of α-synuclein
aggregation (Jinn et al. 2017), indicating a possible causal link.
A heterozygote variant found in six of our individuals, rs1801582, is a missense
mutation of PARK2. It is not well conserved in vertebrates and its frequency in IBS
is 0.421. However, a meta-analysis reported an odds ratio (OR) of 1.36 in
Caucasians when considering a heterozygote model (Ramakrishnan et al. 2016),
making it an interesting variant.
Three individuals (DV5, DV6 and DV10) carried the alternative allele at rs7412. It
was picked up because it is a missense variant at the APOE gene predicted as
deleterious by most methods (table 2). Together with another nonsynonymous
mutation, rs429358, it determines APOE allele. The reference version, TC (at
rs429358 and rs7412, respectively) is known as ApoE-ε3. Most of the individuals
are homozygous for this version. Three individuals carry ApoE-ε2 (TT) in one of
their alleles. While ApoE-ε4 has been linked to increased risk of Alzheimer disease
(Saunders et al. 1993; Michaelson 2014), ApoE-ε2 has been modestly linked to
increased risk of PD (X. Huang, Chen, and Poole 2004; Williams-Gray et al. 2009)
although a bigger study showed no association (Federoff et al. 2012).
Finally, rs2010795, an intronic position on the pyridoxal kinase gene (PDXK) was
variable among our individuals, with 4 being heterozygotes (DV1, DV6, DV8, DV9)
and 3 homozygotes (DV10, DV3, DV4). Frequencies of those genotypes in IBS
are 0.495 and 0.121, respectively. Interestingly, PDXK was identified as

66
differentially expressed in dopaminergic neurons of PD patients and controls. The
rs2010795 polymorphism was subsequently found to be associated to PD in
German, British and Italian cohorts (Elstner et al. 2009) although a bigger sample
of Italians revealed no association (Guella et al. 2010).
2.3 Deleterious variants in the exome
In addition, all germline SNVs obtained were annotated to look for any damaging
mutations even if not previously linked to PD. Limiting variants to those with CADD
> 15, predicted by SIFT as deleterious and with a frequency in the 1000G
European population < 0.1 resulted in a total of 241 variant positions.
Overrepresentation enrichment analysis (ORA) (B. Zhang, Kirov, and Snoddy
2005) for molecular function with all protein coding genes as background showed
significant enrichment for “kinesin binding” (Fig. 20), driven by proteins involved in
axonal transport that have been previously associated to PD: CLSTN1 (Chuang et
al. 2017; Kong et al. 2018), KIF1B (J.-M. Kim et al. 2006; Kedmi et al. 2011) and
KTN1 (van Dijk et al. 2012); to Alzheimer: KCNC1 (Boda et al. 2012) or to
amyotrophic lateral sclerosis (ALS): TTBK2 (Liachko et al. 2014). Other
significantly enriched molecular functions included some genes that could be
related to PD phenotype, such as ATP13A5 (Sørensen et al. 2018).
Contrarily, disease ORA did not result in any significant result.
Figure 20. Germline variants enrichment analysis. Overrepresentation enrichment analysis for molecular function of germline variants predicted as deleterious and with low frequency in the Spanish population.
0 1 2 3 4 5 6 7 8 9 10 11Enrichment ratio
kinesin binding
motor activity
ATPase activity, coupled
ATPase activity
cytoskeletal protein binding
structural molecule activity
drug binding
ribonucleotide binding
purine ribonucleotide binding
purine nucleotide binding
FDR ≤ 0.05 FDR > 0.05

67
3. Somatic variants Standard variant callers, such as HaplotypeCaller, are designed to find germline
variants. They assume the potential genotypes in a diploid sample are
homozygous for the reference allele (0/0), heterozygous (0/1) or homozygous for
the alternative allele (1/1). Since they try to fit allele frequencies to this expectation,
they are unsuited for somatic variant calling. While higher frequency somatic
variants may be called as heterozygous positions, low frequency somatic variants
will be classified as homozygous reference positions, i.e., invariant, interpreting
alternative allele support as noise. Thus, calling somatic variants requires a more
sensitive approach.
Somatic variant callers’ development has been focused on cancer. Theoretically,
cancer causing mutations should be present in the tumor but absent in the
surrounding healthy tissue. As a consequence, many callers require matched
“tumor” and “control” samples, so that they can identify the variants exclusive to
the tumor. However, recent research has shown that somatic mutations are
present in multiple tissues, even if they come from different germ layers (Lodato et
al. 2015). Although lower frequency mutations or those whose high frequencies
result from clonal expansion can be tissue exclusive, these are out of the scope of
this study, due to the limited power provided by our sequencing coverage. With a
mean of 60x per tissue and requiring a minimum of 3 reads supporting the
alternative allele, we would call variants with a frequency of 5% or higher, which
we expect to be in other tissues (Lodato et al. 2015). However, blood may have
some exclusive somatic variants because of clonal expansion.
Nevertheless, our statistical power is increased by having five different tissues
from each individual. Even if variants have a frequency below noise levels, in
general, noise is quite random, so the presence of a variant in multiple tissue
samples would strongly suggest the existence of a true somatic variant.
3.1. Exploring the biases affecting somatic variant calling
We tested two different approaches to call somatic single nucleotide variants
(SNVs) that do not require matched samples. The first of them was a lax VarScan
2 calling (Koboldt et al. 2012). The goal was to get every variant position that
passed a minimum base quality threshold and then explore the importance of
different features of the data in predicting the quality of the call.

68
Because callers return variable positions, an absence of call could be due to either
absence of alternative allele support or absence of coverage at that position. In
order to be able to differentiate between these two scenarios, the five tissue
samples of each individual were genotyped together.
Number of reads supporting the alternative allele
Standard VarScan 2 mpileup2snp parameters fix a harsh frequency threshold at
20%. This, together with other parameters, limits the discovery of somatic variants.
In order to get every variant position, we used --min-coverage 1 --min-reads2 1 --
p-value 1 --min-var-freq 0.000001 --output-vcf. This configuration only limits
calling to the variants reported by samtools mpileup. For this reason, the raw
output from VarScan 2 contains mostly sequencing errors, resulting in almost 7 M
positions reported per individual. Requiring at least two reads supporting the
alternative allele along the tissues of an individual drastically reduced the number
to around 0.6 M. This is expected because virtually all positions with just one read
supporting the alternative allele along an individual’s tissues are due to random
sequencing noise, so the probability of this happening is equal to the random
Illumina sequencing error. However, the probability of getting two errors at the
same position is much lower, it is two times the random error multiplied by the
error specific to that type of substitution. This makes random errors decrease
quickly when requiring higher numbers of reads supporting an allele. Nonetheless,
random sequencing errors are still considerably more frequent than true events,
as evidenced by the number of variant positions retained after this filter, so other
features have to be considered to discriminate them.
Up to this point, filtered calls were too numerous to be true somatic variants, so a
random set was inspected manually in IGV (J. T. Robinson et al. 2011) in order to
pinpoint the most frequent confounding factor. Once the biggest source of false
positives was addressed, the resulting calls were inspected again in search of
additional biases. This recurrent procedure determined multiple features that help
to identify true somatic variants, which we describe next, in a logical rather than a
chronological order.
Multiple alleles called at the same position
Multiallelic calls tend to be noisier, because the probability of getting different
substitution type errors at the same position is much higher than that of getting

69
the same type of substitution. This has been recently reported (J. Kim et al. 2019).
Excluding them from further analyses reduced calls in half.
Biased sequencing errors
Non-random errors are caused by library preparation damage, such as G>T
substitutions caused by oxidation (Costello et al. 2013), and amplification error,
which gets higher the more PCR cycles are performed (Brodin et al. 2013). Some
positions in the genome are more prone to damage or harder to copy for
polymerases, so recurrent noise occurs. Besides, not every Illumina sequencing
error is random; the sequencing of certain positions always results in a small
proportion of reads supporting an incorrect allele (Meacham et al. 2011). These
systematic or biased errors are very difficult to distinguish from true somatic
variants individually and represent a big obstacle for correct somatic variant
identification. Since they are recurrent, having a panel of control samples greatly
facilitates their identification, because variants found in several individuals in a
somatic frequency are very unlikely to be true somatic variants. The influence of
biased errors is illustrated by Fig 3. Positions whose total alternative depth (AD) is
2 along the five tissues are mostly private to the individual in which they were
called. This shows these are random sequencing errors, not probable to be shared
by multiple individuals. Increasing total AD decreases the proportion of unique
calls such that, by total AD of 5, most positions are called in other individuals,
indicating this part of the distribution is dominated by recurrent sequencing errors.
At total AD ~50, which with a mean coverage of 60x per tissue corresponds to a
frequency of 15%, variants are more individual-specific. Germline heterozygous
positions (AD ~ 150) are, as expected, shared by higher numbers of individuals.
A similar pattern is observed for particularity of calls by variant allele frequency
(VAF) (Fig. S6). To consider this when filtering calls, we annotated the number of
samples with support for the same alternative allele and then required a minimum
of 2 AD, to get a better picture of biased errors.

70
Figure 21. Singleness of calls by total alternative depth. Each bar shows the proportion of calls with a given alternative depth along the five tissues of an individual that have been called in none (0), or 1-9 other individuals. Calls were filtered so that their total depth was between 250 and 350.
R1 vs R2 bias
In Illumina paired-end sequencing, adaptors are directional. This allows us to
distinguish reads sequenced in the original strand orientation, which are known as
read 1 (R1) from those sequenced in the reverse complement orientation, read 2
(R2). When library preparation produces the oxidation of Gs in the original strands,
they are incorrectly paired to As in the first PCR cycle and thus changed to Ts in
the second PCR cycle. This creates an imbalance where R1 carries G>T changes
while R2 carries the reverse complement, C>A changes. On the contrary, true
variants would produce the two types of changes in both R1 and R2 (L. Chen et
al. 2017). The R1/R2 ratio is more dispersed than a binomial distribution (Fig. S7),
indicating more than sampling error is causing them. Although read pair
differences are not as symmetrical in reality as the model suggested, variants with
highly imbalanced R1 to R2 ratios are likely to be spurious. Further, because our
coverage implies just a few reads would support a somatic variant, the power of
any statistical test to identify this bias in a single tissue would be very limited. Still,
callers do not annotate information on R1 and R2 read counts, much less stratified
by allele. In order to be able to consider this information for our final calls, we
developed a custom python script to annotate read pair allele counts (RAC) to
VCFs.
0.00
0.25
0.50
0.75
1.00
0 20 40 60 80 100 120 140 160 180 200 220 240 260 280 300Total AD along 5 tissues
Prop
ortio
n
0
1
2
3
4
5
6
7
8
9
Number of other individuals sharing call

71
Somatic “non-callable”
In addition to experiment-specific noise, there are regions of the genome less
accessible to next generation sequencing technologies, especially when using
short reads. Calling variants in these regions is especially challenging, and more
so for somatic variants.
The 1000 Genomes Project generated a mask accumulating information from the
numerous samples they sequenced. It reports positions where depth of coverage
is much higher (H) or lower (L) than average, where many reads have a mapping
quality of zero (Z), where the average mapping quality is low (Q) or positions where
no reads align (0). Specifically, the strict version of the 1000G mask requires that
total coverage is within 50% of the average, that no more than 0.1% of reads have
mapping quality of zero, and that the average mapping quality for the position is
56 or greater. It overlaps with 23.1% of the non-N bases of the genome, but since
it singles out its most unique regions, and the exome is enriched in such
sequences, it only overlaps 7% of our target region. However, a bigger proportion
of raw on-target calls fall within those regions (Fig. 22), proving the 1000G mask
is able to identify noisier regions.
Figure 22. The 1000G strict mask overlaps with on-target VarScan 2 calls. Bars show the proportion of the target region (black) and raw on-target calls per individual (grey) overlapping the 1000G strict mask.
0.00
0.05
0.10
0.15
Target DV1 DV3 DV4 DV5 DV6 DV7 DV8 DV9 DV10
Prop
ortio
n ov
erla
ppin
g 10
00G

72
Adding to short read accessibility, mappability is the score that indicates the
uniqueness of a genomic region given a read length. It is calculated by breaking
the reference genome into read-length kmers and mapping them against the same
reference genome. Regions where a single kmer aligns can be uniquely mapped
with the given read length and their mappability is defined as 1. Regions where
multiple kmers align are not uniquely mappable and have lower mappabilities.
Since inaccurate mapping can produce false positives, we masked regions with
mappability lower than 1 for our read length, 100bp. This only represents 0.35%
of the exome and ~80% of it overlaps the 1000G strict mask (Fig. 23).
Finally, segmental duplications are an important source of false positive somatic
variant calls. This is because different copies frequently carry different variants, so
aligning the reads belonging to one of the copies to the other generates artefacts
that are otherwise difficult to distinguish from true positives. Just over 45% of this
track overlaps with the 1000G strict mask (Fig. 23), evidencing multiple segmental
duplication regions are H or Q bases.
Figure 23. Overlaps between masking tracks over the target region. Horizontal bars show the number of target region base pairs overlapped by each of the three masks: 1000G strict mask (SM1000G), mappability for 100-mers (Mappability) and WGAC segmental duplications track (Segdups). Vertical bars indicate the number of positions in each intersection. Masks involved in each intersection are indicated by dots.
2886015
810373
581138
12423925462 19493 11618
0e+00
1e+06
2e+06
3e+06
Inte
rsec
tion
Size
SM1000G
Segdups
Mappability
0e+001e+062e+063e+06Set Size
73
In summary, regions overlapping the 1000G strict mask, with mappability smaller
than 1 or overlapping WGAC segmental duplications track constitute the portion
of the genome we consider non-callable for somatic mutations. It supposes 9.8%
of the target region or a little over 5Mbp in total. We annotated them in the VCFs
so that we could remove them.
Copy number variants (CNVs)
Once the somatic callable positions in the genome have been singled out, there
are still multiple confounding factors one has to take into account. One of the most
obvious sources of false positives are copy number variants (CNVs). With a similar
logic to segmental duplications, when an individual has a germline CNV, it is likely
that the non-reference copy carries single nucleotide variants within it. If the
reference genome has only one copy included, reads coming from all copies will
be mapped to it, collapsing them into one locus. If there are only two copies,
because the non-reference copy has different boundaries, its mapping rate will be
lower, reducing the frequency of its variants to a frequency rather smaller than
50%, making them look like somatic variants. When a CNV consists of more than
two copies, copy-specific SNVs will invariably look like somatic variants. This can
be tackled more clearly by, depth of coverage. Collapsed reads coming from both
copies significantly increase depth at the region. An example can be seen in Fig.
24: All DV1 tissues have a T>C at 1:145115820 with a VAF between 17 and 23%,
which would make it a reasonable candidate somatic SNV. However, the same
variant is found in other individuals such as DV10, whose tissues have similar
frequencies (19-27%) at that position. Depth at the region is over 170x for both
individuals, almost 3 times the mean coverage, pointing towards a common CNV
with at least 3 copies being collapsed in that region.
Depth of coverage is typically variable along the genome and more so along the
exome after its capture. For this reason, calling CNVs can be challenging in exome
sequencing data. Also, CNV callers, as any calling algorithm, try to limit false
positive calls, so they only return the most reliable instances. However, we should
consider any possible copy number variable region because germline CNVs are
more frequent than detectable somatic SNVs (Campbell and Eichler 2013; Bae et
al. 2018). To address this, we first called CNVs with XHMM (Fromer et al. 2012a)
and annotated calls in the VCFs and secondly, we required candidate positions to
have a total depth (DP) between 20 and 100, which removes the more extreme
25% of the depth distribution.

74
Figure 24. Example of population CNV variant creating a FP somatic mutation. A T>C change is seen in ~20% of DV1’s blood and substantia nigra reads. Coverage in the region is almost 3 times the mean, >170x. DV10’s tissues show a very similar coverage and C frequency.
Figure 25. Example of clustered variants as a proxy of CNV presence. Region with coverage >300x and multiple variants in 10-20% frequencies in multiple tissues of DV10. Many of them are also observed in DV1.

75
Additionally, at times, copies present multiple contiguous variants, which look like
clustered somatic variants when collapsed (Fig. 25). Because localized somatic
hypermutation — kataegis — is not expected in non-cancer tissues, we only
considered a candidate if at most three other variants were within read-length
distance. This is demonstrated when looking at the other filters targeting variants
removed by this filter (Fig. S8).
Biased position in reads
VarScan 2 called some variants with an expected somatic VAF in multiple
individuals, suggesting those variants were actually artefacts. Taking a closer look,
we observed that reads supporting the alternative allele carried it in the same
portion of the read and they only aligned to a certain fraction of the region (Fig.
26). Further, reads supporting the alternative alleles were clipped at both ends,
indicating that sequence at the ends of the reads does not align to the genomic
region. In contrast, reference allele position in the reads was unbiased, i.e., there
were reads carrying it in different portions of the reads and reads aligned to the
surrounding regions. These regions are not included in the 1000G strict mask nor
in the segmental duplications track and they were not excluded by our 100-mers
mappability track or when removing secondary alignments and at the same time
are present in many individuals. Because of these reasons, they most probably
come from unresolved regions in the genome. These must be parts of the genome
that share a portion of their sequence with a known region but are not included in
the genome. This makes reads coming from the unresolved region map to the
known region by clipping the parts of reads that overlap the sequences private to
the unresolved region, while differences in the shared sequence will look like
variants. Because the mapping efficiency is extremely limited by the non-
homologous portions surrounding the common sequence, variant allele frequency
is reduced, making them look like somatic mutations without increasing coverage
significantly. To address this, we developed a score, PIR (position in reads) which
indicates a bias of an allele towards the first, middle or last third of the aligned
reads (PIR=1 2 or 3 respectively) when more than 90% of the reads carry the allele
in that portion; or towards none (PIR=4) if that is not the case (Fig. 27) and
annotated it for each allele at each call with our custom python script.

76
Figure 26. Biased position in reads example. Reads are ordered by their allele at 19:6833180.
Figure 27. Position in reads or PIR score. Grey lines represent reads and the orange square a mismatch to the reference. When variants are concentrated in one of the thirds of the reads, PIR score is 1, 2 or 3. If they are carried by reads without a position bias, PIR score value is 4.
Strand bias
When calling germline SNVs, calls whose strand bias falls in the most extreme
10% are commonly excluded (Guo et al. 2012). However, subtler strand
imbalances can affect one allele more than the other, lowering its frequency and
making it difficult to distinguish from a somatic SNV. The example in Fig. 28 shows
a T>C variant exclusive to DV4 where most of the alternative allele supporting
reads are R1 (pink) reads. This phenomenon can be caused by sampling errors
when sequencing, especially with lower coverages, but it can also arise when
processing data by applying local realignment and base quality score recalibration
(Guo et al. 2012). We used a Poisson test for evaluating the overall strand
PIR=1
PIR=2
PIR=3
PIR=4

77
imbalance and a Fisher exact test (FET) with strand counts stratified by allele to
find cases where strand bias affects only one allele and we annotated on the VCFs
with our custom python script. However, true low frequency somatic SNVs are
supported by very few reads at each tissue, so filtering by FET p-value can be too
stringent.
Figure 28. Example of strand bias. Region with adequate coverage per sample (~50x). Reads are colored by strand: plus or forward (pink) and minus or reverse (blue). Most reads supporting the alternative allele are forward reads.
Indels and homopolymers
Aligning reads to regions of the genome with small insertions or deletions (indels)
or with homopolymers is especially challenging. This is why best practices
pipelines include local realignment steps. Still, these regions are a source of false
positive somatic calls, because a small proportion of reads mapped incorrectly
can place allele support where it does not belong. To address this, we excluded
variants found within 5 bp of an indel. An example of a false positive variant within
an indel can be seen in Fig. 29. Tissues from multiple individuals carry the indel,
probably in a heterozygous state. A small proportion of reads carry an A>C variant,
but because it is in multiple individuals, it is an artefactual call.
Also, we observed several cases of calls found adjacent to homopolymers, and
whose alternative allele was the homopolymers’ nucleotide. Some calls, such as

78
the G>A in Fig. 30 are within stretches of a nucleotide, which makes polymerase
replication errors very probable. Allele support for A can be seen in all the Gs in
the region in different individuals. For this reason, we did not consider variants
within this scenario.
Figure 29. Example of artefactual call around an indel. Black horizontal lines represent deletions in the reads. Multiple individuals carrying the indel in a heterozygous state have a few reads supporting an A>G change.
Figure 30. Example of errors at a nucleotide immersed in a homopolymer. In a region with A homopolymer stretches, 10-15% of bases aligned to a G carry an A allele in multiple samples. The same can be observed at positions 102055815, 102055820 and 102055825, other Gs surrounded by As.

79
Heterozygosity
One could expect variant allele frequency (VAF) to be crucial for differentiating
somatic from heterozygous variants. The latter should have VAFs close to 50%
while somatic variants should have a smaller frequency. Yet, we found allele
balance dispersion in high-confidence heterozygous positions to be higher than
that of a binomial distribution (Fig. 31). High-confidence heterozygous positions
are those that are included in the common variant dbSNP database, are called in
all tissues of one of the individuals (excluding DV2) and have a VAF between 0.45
and 0.55 and a depth from 20 to 100 in at least one of the tissues. Although allele
balance is shifted in favor of the reference allele (reference bias), higher VAFs are
also more frequent than expected (right part of the distribution). As the distribution
gets narrower with higher sequencing depth (Fig. 32), we can infer a significant
portion of the error comes from allele sampling.
Figure 31. Variant allele frequencies at heterozygous positions. Histogram of VAFs at high-confidence heterozygous positions (blue) vs a random binomial distribution with p=0.5 (grey). High-confidence heterozygous positions are those present in the common dbSNP database, where all tissues of an individual are called as variant and at least one tissue has a VAF between 0.45 and 0.55 and a depth of 20 to 100.
This dispersion makes the heterozygous VAF distribution overlap with the theoretical somatic range, such that a single position’s VAF does not give much information. Having five tissues from the same individual greatly improves our power to determine heterozygous positions (Fig. 33). While 18.4% of high confidence heterozygous positions have a significant binomial test (p-value <0.05), meaning that they would not be considered as heterozygous variants, including the information of one other tissue reduces the proportion to 3.9% if we consider one non-significant test as proof of the position being heterozygous. If we
0
20000
40000
60000
0.0 0.1 0.2 0.3 0.4 0.5 0.6 0.7 0.8 0.9 1.0VAF
coun
t
High confidence heterozygous positions
Binomial
Empirical

80
include 4 tissues, we can get as few as 0.16% (SD=0.019) misclassified, so the binomial test p-value for VAF was annotated for each sample and call with our custom python script. Also, in order to add more information to help us differentiate heterozygous variants, we annotate variants present in the common variant dbSNP database, those present in >1% of the population.
Figure 32. Variant allele frequency dispersion gets smaller at higher depths. VAF was stratified by coverage window (Y axis facets). Random samples were obtained from each bin with size equal to that of the smaller bin (in blue). A binomial distribution with p=0.5 is shown in grey for reference.
20−4040−60
60−8080−100
0.0 0.1 0.2 0.3 0.4 0.5 0.6 0.7 0.8 0.9 1.0
0
2000
4000
0
2000
4000
0
2000
4000
0
2000
4000
VAF
coun
t
High confidence heterozygous positions
Binomial
Empirical

81
Figure 33. Power to detect heterozygous variants by number of tissues. Median percentages of high-confidence heterozygous positions that would be classified as not heterozygous because their binomial test in all the 1, 2, 3 or 4 tissues tested is significant (p-value<0.05). Black bars show they standard deviation. For each number of tissues, all possible comparisons were performed.
Number of haplotypes
True somatic variants create a third haplotype in the region, i.e., the maternal or
the paternal haplotype suffer a mutation, creating a new haplotype with their
previous haplotype along with that mutation. For this reason, somatic variants
should exclusively be in phase with one of the paternal haplotypes. However,
artefacts affect both the maternal and paternal haplotypes, creating at least four
haplotypes with a nearby heterozygous variant (Fig. 34). Because we use short
reads, only a few variants can be phased, but we can use that information to detect
false positives. We annotated it with our custom python script, which allowed us
to remove variants with four haplotypes or more.
●
●
●
●0
5
10
15
20
1 2 3 4Number of tissues
Perc
enta
ge
Positions with significant binomial test
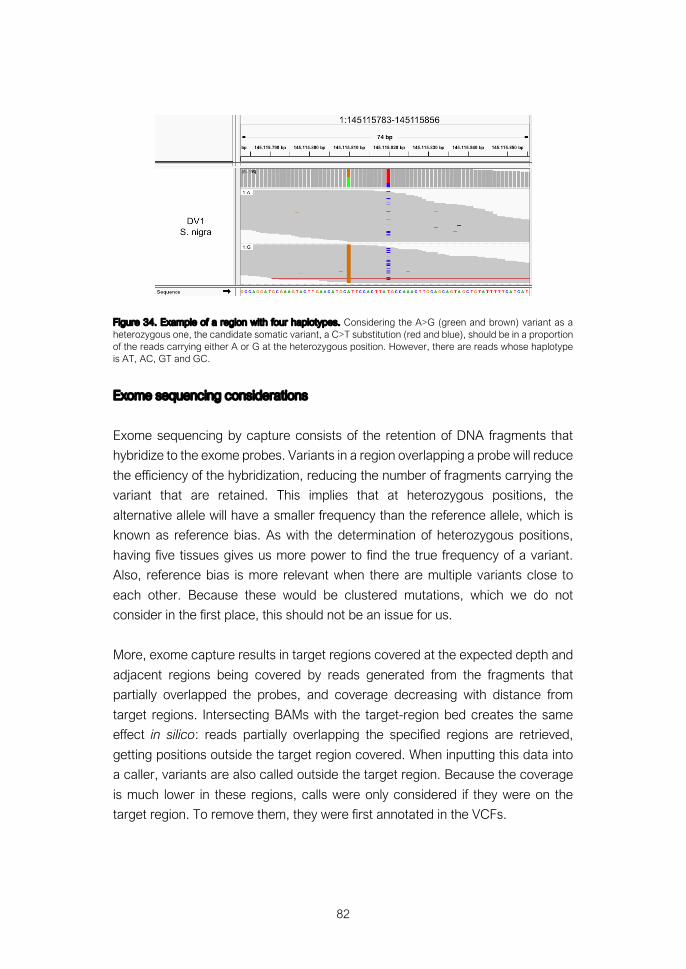
82
Figure 34. Example of a region with four haplotypes. Considering the A>G (green and brown) variant as a heterozygous one, the candidate somatic variant, a C>T substitution (red and blue), should be in a proportion of the reads carrying either A or G at the heterozygous position. However, there are reads whose haplotype is AT, AC, GT and GC.
Exome sequencing considerations
Exome sequencing by capture consists of the retention of DNA fragments that
hybridize to the exome probes. Variants in a region overlapping a probe will reduce
the efficiency of the hybridization, reducing the number of fragments carrying the
variant that are retained. This implies that at heterozygous positions, the
alternative allele will have a smaller frequency than the reference allele, which is
known as reference bias. As with the determination of heterozygous positions,
having five tissues gives us more power to find the true frequency of a variant.
Also, reference bias is more relevant when there are multiple variants close to
each other. Because these would be clustered mutations, which we do not
consider in the first place, this should not be an issue for us.
More, exome capture results in target regions covered at the expected depth and
adjacent regions being covered by reads generated from the fragments that
partially overlapped the probes, and coverage decreasing with distance from
target regions. Intersecting BAMs with the target-region bed creates the same
effect in silico: reads partially overlapping the specified regions are retrieved,
getting positions outside the target region covered. When inputting this data into
a caller, variants are also called outside the target region. Because the coverage
is much lower in these regions, calls were only considered if they were on the
target region. To remove them, they were first annotated in the VCFs.

83
3.2. Candidate somatic variants with VarScan 2
Some of the abovementioned features completely prevent us from calling somatic
variants in a set of genomic positions: those overlapping our somatic “non-
callable” track, overlapping a CNV, close to indels, by homopolymers and off-
target positions. However, many other features do not imply a binary decision, but
give us important information. The probability of a candidate variant passing a test
is higher if it is truly a somatic variant, but the tests cannot perfectly separate false
positives from true positives (see Fig. 31 for an example). Since we are testing
multiple features — number of reads supporting the alternative allele, multiple
alleles, the number of samples with alternative reads, R1/R2 bias, clustered
variants, PIR, strand bias, heterozygosity and number of haplotypes when possible
— it is extremely unlikely that all tests will be passed for all tissues, even for a true
somatic variant.
Also, requiring at least 2 reads supporting the alternative allele in a sample with a
coverage of 60x puts our sensitivity limit at a variant allele frequency of 3%, or at
2% if coverage is at our upper threshold, 100x. Assuming equal contribution of
cells to the gastrula, the cell division at which those mutations occurred can be
calculated with formula 1.
#$%%&'(')'*+ = %*-2/ 1(23/35)7
(Formula 1)
Where AD is the number of reads supporting the alternative allele and DP is the
total depth at a position. Their ratio is the variant allele frequency, and its inverse
is the number of existing cells at the moment the mutation happened. If we
consider a mutation happens in replication, so that only one of the daughter cells
inherits the mutation, its log2 gives us the division number at which the error
occurred. For our DP range (20-100), with an AD of 2, it would be between the 3rd
and 6th division. Because those are very early cell divisions, happening even before
the appearance of the blastocoel, those variants will be present in every adult
organ, probably at different proportions because of stochasticity and clonal
expansion in certain tissues. Besides epithelia, one of the tissues where clonal
expansion is highly recognized at is blood.

84
It follows that two different strategies are needed to get candidate variants. To pick
up variants common to all tissues, we required a position to pass each of the filters
in at least 4 tissues, not demanding that they are the same 4 tissues for each filter.
To identify variants exclusive to a tissue, be it due to clonal expansion in blood or
to sampling or other type of stochasticity, a variant had to pass each filter in a
single tissue.
Somatic variants common to multiple tissues
To filter variants, we used the information VarScan 2 provided as well as that we
added to the VCFs. Specifically, we required at least 4 tissues to pass these filters:
1. Not multiallelic
2. Not overlapping somatic non-callable tracks
3. On target
4. Not overlapping a CNV call and DP 20x to 100x
5. No more than 3 variants close by in any of the individuals’ tissues
6. Not within 5 bp of indels
7. Not by homopolymers
8. AD >=2
9. At most called in 1 sample from another individual
10. R1 and R2 proportion between 0.25 and 0.75 for each allele
11. Non-significant FET for strand and allele
12. Strand ratio between 0.5 and 2
13. All tissues with significant binomial VAF test
14. At most 3 haplotypes
15. Unbiased position in reads for both alleles
Applying these filters, we got 3 candidates (table 3). All of them were present in
the four central nervous samples, and two of them were also present in blood,
even if at lower frequencies. Each tissue has a quite low AD, showing the power
of combining the information from multiple tissues.
Although all of them have a dbSNP ID, they are present in 1 to 3 samples in
gnomAD and/or TOPmed, which makes their population frequency extremely low.
Two of them are missense variants in the genes PCDH10 and DENND4A and the
third one overlaps the UTR regions of two genes. All of the changes have high
CADD scores, indicating their functional relevance.

85
PCDH10 is expressed in brain and arteries (The GTEx Consortium 2013) and is
essential for normal forebrain axon outgrowth (Williamson et al. 2007). It was found
in homozygous deletion in a study of consanguineous autism spectrum disorder
(ASD) families (Morrow et al. 2008) where they demonstrated that PCDH10 was
strongly up-regulated in hippocampal neurons in response to membrane
depolarization and that it is a transcriptional target of MEF2, a transcription factor
induced by neuronal activity.
The other missense variant affects DENND4A a gene involved in vesicle-mediated
transport (Belinky et al. 2015) which was related to Parkinson’s in a translatome-
regulatory network analysis. DENND4A was found to be one of 19 genes driving
the expression signature change of dopaminergic (DA) neurons after Parkinson
induction with MPTP (Brichta et al. 2015). This specific variant is predicted as
deleterious and probably damaging by SIFT and PolyPhen respectively.
The last variant overlaps with two genes in the two strands. On the forward strand,
the variant is in the 5’ UTR of PACRGL, the Parkin Coregulated Like gene, and it
is predicted by Ensembl (Hunt et al. 2018) to activate non-sense mediated decay,
a route involved in the reduction of expression of aberrant proteins. This gene was
found to be regulated by the same promoter as that of PARK2 (West et al. 2003).
On the reverse strand it is the first base pair of the 3’ UTR of the KCNIP4, a gene
that encodes a K channel-interacting protein, which modulates the activity of Kv4
A-type potassium channels thus playing a significant role in the firing of action
potentials within the neurons (Holmqvist et al. 2002). A study on the regulatory
networks in Parkinson disease (Su et al. 2018) identified a lncRNA whose target
is KCNIP4, making both genes interesting candidates.

86
Table 3. Somatic variants common to multiple tissues. Chromosome and position are in reference to hg19. VAF: Variant allele frequency. AD: Alternative allele depth.
Individual DV1 DV6 DV6
Chr 4 4 15
Position 134073018 20731704 66044838
dbSNP rs754282504 rs1224107540 rs1268304474
Frequency <1e-4 <1e-4 <1e-4
Consequence Missense 3 prime UTR/ Intron NMD
Missense
Gene PCDH10 KCNIP4/ PACRGL
DENND4A
CADD 22.6 18.08 33
Reference G G G
Alternative C A A
VAF
Blood 1.61% 0% 5.26%
Cerebellum 13.64% 4.17% 10.61%
Striatum 6.9% 5.88% 9.84%
Neocortex 9.57% 5.26% 16.98%
Substantia nigra 13.93% 6.67% 12.5%
AD
Blood 1 0 4
Cerebellum 9 2 7
Striatum 4 3 6
Neocortex 9 3 9
Substantia nigra 17 3 8
Tissue-exclusive somatic variants
Looking exclusively at read features from one tissue constitutes a rougher
approach. We have to be stricter because we do not have the information added
by the presence of the same variant in the other tissues with features indicating
good quality. For this reason, we increment the minimum AD from 2 to 5, the AD
at which we see a reduction of random noise (Fig. 21). As for an upper AD
threshold, we know no specific threshold can be successful in removing
heterozygous variants (Fig. 31). However, we can use the information provided by
the other tissues to remove those cases; if a tissue shows a VAF compatible with
heterozygosity, most probably the variant will be heterozygous. Also, requiring it
not to be in the dbSNP common variant database is an obvious step to remove
heterozygous variants.

87
To filter each tissue independently we required multiple conditions. Most of them
are the same as for shared variants, and the differences are highlighted in bold:
1. Not multiallelic
2. Not overlapping somatic non-callable tracks
3. On target
4. Not overlapping a CNV call and DP 20x to 100x
5. No more than 3 variants close by in any of the individuals’ tissues
6. Not within 5 bp of indels
7. Not by homopolymers
8. AD >=5
9. At most called in 1 sample from another individual
10. R1 and R2 proportion between 0.25 and 0.75 for each allele
11. Non-significant FET for strand and allele
12. Strand ratio between 0.5 and 2
13. All tissues with significant binomial VAF test
14. At most 3 haplotypes
15. Unbiased position in reads for both alleles
16. Not in dbSNP common variants
From this we obtained 10 variants (table 4). Two of those variants (in grey) are
present in the 5 tissues and as expected are also in table 3. The one on PCDH10
was recovered from two different tissues while the one on DENND4A only passed
filters for the neocortex sample. From the remaining 8 variants, 5 are blood
exclusive, 3 are mainly present in blood with 1 read supporting the alternative allele
in substantia nigra or striatum, and the other one is neocortex exclusive.
Inspecting these variants in IGV (J. T. Robinson et al. 2011) some reads whose
mate maps too far away can be identified. The reads carrying the alternative allele
look fine, but orthogonal validation is necessary to confirm they are true variants.
However, blood suffers from clonal expansion (Champion et al. 1997; Zink et al.
2017), therefore it is reasonable that variants are exclusive to this tissue or have
higher or lower frequencies than the other tissues depending on whether the
expanded lineages carry that variant or not. This is what we observe, giving
credibility to our results.

88
Table 4. Somatic variants identified in a single tissue. Chromosome and position are in reference to hg19. VAF: Variant allele frequency. AD: Alternative allele depth. Variants with information in grey were also recovered with the previous strategy.
Sample DV1B DV1C, DV1N DV3B DV3B DV3B DV4N DV6B DV6N DV7B DV8B
Chr 12 4 5 12 13 2 2 15 12 11
Position 93873233 134073018 94990053 66849194 21987914 158115786 145157076 66044838 57976385 58170304
dbSNP rs1201602329 rs754282504 rs767559079 rs1296372237 NA NA rs730881194 rs1268304474 NA rs763347958
Frequency <1e-4 <1e-4 0 0 0 0 <1e-3 <1e-4 0 <1e-4
Consequence Synonym./NMD Missense Synonymous Missense Intronic acceptor site "synonymous"
Missense Missense Missense Missense Synonymous
Gene MRPL42 PCDH10 RFESD GRIP1 ZDHHC20 GALNT5 ZEB2 DENND4A KIF5A OR5B3
CADD 12.09 22.6 16.80 29.1 12.41 14.28 23.8 33 34 0.541
Reference A G A C A G G G G G
Alternative G C G A G A A A A A
VAF
Blood 20% 1.61% 14.93% 13.56% 18.75% 0% 12.77% 5.26% 8.96% 5.75%
Cerebellum 0% 13.64% 0% 0% 0% 0% 0% 10.61% 0% 0
Striatum 0% 6.9% 0% 0% 0% 0% 0% 9.84% 1.75% 0
Neocortex 0% 9.57% 0% 0% 0% 6.25% 0% 16.98% 0% 0
Subst. nigra 0% 13.93% 0% 1.64% 0% 0% 0% 12.5% 0% 0
AD
Blood 6 1 10 8 6 0 6 4 6 5
Cerebellum 0 9 0 0 0 0 0 7 0 0
Striatum 0 4 0 0 0 0 0 6 1 0
Neocortex 0 9 0 0 0 5 0 9 0 0
Subst. nigra 0 17 0 1 0 0 0 8 0 0

89
The first blood exclusive somatic variant overlaps the gene MRPL42. It is a
previously observed variant with very low population frequency. MRPL42 is a
mitochondrial ribosomal protein, involved in mitochondrial translation. Ensembl
predicts it to induce non-sense mediated decay in some transcripts, but it is a
synonymous variant for the main transcripts.
A second blood exclusive synonymous variant, was found on the RFESD gene,
involved in oxidation-reduction processes. Although variants at that position have
been reported, none of them were A>G. Another synonymous variant was found
at gene OR5B3, an olfactory receptor gene.
An intriguing variant is that on ZDHHC20. In this case it is an A>G change but
because the gene is in the reverse strand, its relevance would be caused by the
T>C change in that strand. It is the third base upstream of an exon, so part of the
splicing acceptor site, which changes from TAG to CAG, which still fits the
consensus sequence of pyrimidine-A-C. The position is not reported as variant in
any population sequencing project. A study on the effect of glial cell line-derived
neurotrophic factor (GDNF), a transforming growth factor involved in the
development and maintenance of mesencephalic DA neurons (Lin et al. 1993),
over microRNAs in MN9D mouse cells, found it to result in the differential
expression of 143 miRNAs, 3 of them targeting ZDHHC20 (L. Li et al. 2013).
The remaining 4 variants are missense variants. The one on GRIP1, a glutamate
receptor interacting protein, is found in blood and also has a supporting read in
the substantia nigra. This gene supplies synapses with two key synaptic proteins,
GluA2 and N-cadherin, by acting as a scaffold at trafficking vesicles (Heisler et al.
2014). The one on GALNT5, exclusively found in the neocortex sample, is a
missense variant not reported in population studies either. The predicted CADD is
moderately high and the protein is involved in glycan biosynthesis and protein
metabolism, and is causative of hereditary multiple exostoses (Simmons et al.
1999).
The missense variant on gene ZEB2 was only found in blood. It has been reported
previously at very low frequency and has a moderately high CADD score, SIFT
prediction of deleterious and PolyPhen as possibly damaging. This zinc finger
homeodomain protein is responsible for Mowat-Wilson syndrome. Also, it is a
negative regulator of midbrain dopaminergic axon growth and target innervation
(Hegarty et al. 2017), acts in myelination (Weng et al. 2012) and regulates the fate
switch between cortical and striatal interneurons (McKinsey et al. 2013).

90
Finally, a missense variant in KIF5A was found in blood and striatum samples. It is
a member of the kinesin family mainly expressed in neurons (Niclas et al. 1994),
where it acts as a microtubule-dependent motor required for slow axonal transport
of neurofilament proteins (Hirokawa et al. 2009) whose mutation causes
monogenic spastic paraplegia (Reid et al. 2002), Charcot-Marie-Tooth disease
type 2 (Y.-T. Liu et al. 2014) and familial amyotrophic lateral sclerosis (Brenner et
al. 2018). A missense mutation in this same gene has been previously described
in a Parkinson patient (Martikainen et al. 2015) and its expression was increased
during progression of dementia associated with PD (Stamper et al. 2008). This
specific missense variant has a high CADD, indicating possibly damaging
consequences.
Tissue-exclusive somatic variants without other tissues information
If we use the same exact filters as for the previous analysis but exchange the
binomial test result in all tissues by a harsh threshold at VAF of 20%, which we
derive from Fig. 31, we get the same 8 variants we got before (table 4) plus two
more (table 5).
The first one, on the EDAR gene, looks actually like a heterozygous variant when
we look at the other tissues. Nonetheless, the variant is predicted by most
methods as damaging and this gene is responsible for ectodermal dysplasia as
well as hair thickness in Asian populations.
The other one overlaps with one of the transcripts of the gene SYT15, where it
supposes a missense variant. Maybe more importantly, it overlaps with its
promoter. This protein, involved in the synaptic vesicular cargo trafficking was
affected by a CNV in a study on Parkinson disease patients (La Cognata et al.
2017). It is interesting that all tissues have frequencies between 16 to 36%.
Because of this, not all of them pass the binomial filter, but because also Haplotype
Caller with ploidy 10 (see below) reports similar frequencies, it seems plausible
that it is a somatic variant.

91
Table 5. Somatic variants identified in a single tissue without other tissue information. Chromosome and position are in reference to hg19. VAF: Variant allele frequency. AD: Alternative allele depth.
Sample DV5B DV9S
Chr 2 10
Position 109524434 46970793
dbSNP rs757685532 rs752701929
Frequency <1e-4 8,00E-03
Consequence Missense Missense/
TF binding site
Gene EDAR SYT15/
TBX15, TBX20, TBX1
CADD 26.8 3.674
Reference C G
Alternative T A
VAF
Blood 19.23% 36.36%
Cerebellum 34.29% 25.4%
Striatum 40.91% 16.67%
Neocortex 41.18% 26.19%
Substantia nigra 56% 18.6%
AD
Blood 5 12
Cerebellum 12 16
Striatum 9 5
Neocortex 14 11
Substantia nigra 14 8
3.3 Candidate somatic variants with HaplotypeCaller ploidy 10
Samples were also called with HaplotypeCaller. Although it is a germline caller, it
is designed to be applicable to higher ploidy organisms by changing its allele
frequency expectations. To increase sensitivity, we set the ploidy parameter to 10
(default is 2). This way, the priors change, increasing its sensitivity. We annotated
the VCFs with the same information we did on VarScan 2 VCFs.

92
Somatic variants common to multiple tissues
Using exactly the same filters we did with VarScan 2 VCFs to get variants common
to multiple tissues, we got the exact same 3 variants (table 6). Frequencies also
seem very comparable between the two.
Table 6. Somatic variants common to multiple tissues from Haploype Caller. Chromosome and position are in reference to hg19. VAF: Variant allele frequency. AD: Alternative allele depth. HCP10: Haplotype Caller with ploidy parameter set to 10.
Individual DV1 DV6 DV6
Chr 4 4 15
Position 134073018 20731704 66044838
dbSNP rs754282504 rs1224107540 rs1268304474
Method VarScan 2 HCP10 VarScan 2 HCP10 VarScan 2 HCP10
VAF
Blood 1.61% 0% 0% 0% 5.26% 4.40%
Cerebellum 13.64% 13.89% 4.17% 5.46% 10.61% 10.26%
Striatum 6.9% 8.96% 5.88% 5% 9.84% 9.86%
Neocortex 9.57% 10.20% 5.26% 4.48% 16.98% 20%
Subst. nigra 13.93% 14.93% 6.67% 5.26% 12.5% 14.81%
AD
Blood 1 0 0 0 4 4
Cerebellum 9 10 2 3 7 8
Striatum 4 6 3 3 6 7
Neocortex 9 10 3 3 9 12
Subst. nigra 17 20 3 3 8 12
Tissue-exclusive somatic variants
Because is not possible to make HaplotypeCaller as lax as VarScan 2, when a
candidate SNV is present in an individual’s tissue with AD>=5 and the same variant
is present in a handful of other samples with 1 or 2 reads per sample, which would
indicate some kind of bias, HaplotypeCaller would not call those other lower AD
samples, making it difficult for us to detect the false positive. To try to circumvent
that, we called all 50 samples together. However, after using the same filters we
used with VarScan 2, we found many passing variants were supported by reads
in multiple tissues of different individuals but were only called in the most confident
sample by HaplotypeCaller. This makes sense for the caller, it is applying a
confidence score to remove those cases that are very clearly false positives, but
unfortunately leaves us powerless to remove the higher confidence false positives.

93
We explored whether any HaplotypeCaller quality fields could remove those
cases, but we did not find any. Of note, certain quality scores have to be treated
differently depending on ploidy and coverage. Genotype quality (GQ) in
HaplotypeCaller is calculated as the difference between the two lowest phred-
scale likelihoods for each genotype. When ploidy is 2 there are three possible
genotypes, so for coverages well above 20x, the difference between their
probabilities should always be high. A threshold at GQ>=90 is therefore
sometimes used in this scenario (Horai et al. 2018). However, when setting
ploidies as high as 10, the probabilities of similar genotypes (e.g.
0/0/0/0/0/0/1/1/1/1 vs 0/0/0/0/0/1/1/1/1/1) are quite similar, producing GQ values
invariantly low.
If we use VarScan 2 to filter those cases out, we get 16 variants passing filters.
Once again, we are able to retrieve 2 out of the 3 variants common to multiple
tissues (grey in table 4) as well as all the other 8 variants we got with VarScan 2
filtering per tissue (black in table 4). We also get 6 more variants. After IGV
inspection, one of them looked too strand biased, so it was discarded. The
remaining 5 variants are shown in table 7.
One of the variants was not detected in VarScan 2 because it was triallelic, which
belongs to the set of noisier calls. Two others had less than 5 AD after VarScan 2
internal read filtering and the remaining two had more than 4 variants called within
read distance, but IGV inspection shows the other variants are actually noise we
are taking into account with VarScan 2. This shows that HaplotypeCaller improves
sensitivity and its specificity can be improved by using VarScan 2 calls and very
probably also just by looking for alternative reads in other samples directly on the
BAM files with tools such as pysam.
As for the newly discovered variants, they were all detected in blood but two of
them have also support in the striatum and one has it in the substantia nigra too.
The first variant is a missense mutation in the gene ZSCAN16. It is a zinc protein
whose function is not well characterized. A deep intronic variant was also detected
in NAV3, the neuron navigator 3 gene, named after its role in axon guidance was
determined in Caenorhabditis elegans (Maes, Barceló, and Buesa 2002). In a
study of circulating cell-free microRNAs in Parkinson’s patients, miR-29a was
found to be downregulated in PD cases (Botta-Orfila et al. 2014) and has also
been seen aberrantly expressed in Alzheimer’s (Batistela et al. 2017). NAV3 is a
target of this miRNA (Batistela et al. 2017), so it would be upregulated in PD. Also,

94
a copy number variant affecting the gene has been found in PD cases (Botta-Orfila
et al. 2014).
Table 7. Somatic variants identified in a single tissue by HaplotypeCaller exclusively. Chromosome and position are in reference to hg19. VAF: Variant allele frequency. AD: Alternative allele depth.
Sample DV3B DV3B DV7B DV7B DV10B
Chr 6 12 6 9 5
Position 28097592 78521098 31905132 87367003 55264231
dbSNP rs766950970 rs968223137 rs765550448 NA NA
Frequency <1e-4 <1e-4 <1e-4 0 0
Consequence Missense Intronic Missense Splicing donor site Intronic
Gene ZSCAN16 NAV3 C2 NTRK2 IL6ST
CADD 19.73 2.262 22 21.6 9.827
Reference G C C A G
Alternative A T T G T
V A F
Blood 9.37% 8.93% 29.55% 28.28% 8.05%
Cerebellum 0% 0% 0% 0% 0%
Striatum 0% 0% 3.51% 4.32% 0%
Neocortex 0% 0% 0% 0% 0%
Subst.nigra 0% 0% 0% 3.79% 0%
A D
Blood 6 5 26 28 7
Cerebellum 0 0 0 0 0
Striatum 0 0 2 6 0
Neocortex 0 0 0 0 0
Subst. nigra 0 0 0 5 0
A missense variant quite frequent in blood affects C2, a gene involved in the
immune system. Studies have looked at the association of variants in this and
other HLA-linked complement markers, finding no association (Nerl, Mayeux, and
O’Neill 1984).
An unreported variant in NTRK2 is at the splicing donor site of the 14th exon. It is
the 3rd base so it does not affect the consensus sequence GU. Nonetheless, this
gene is a receptor of neurotrophic factors, which have been proposed to have a
role in neurodegeneration (Dawbarn and Allen 2003). Specifically, in a primate
MPTP model of PD, infusion with a neurotrophic factor reversed motor dysfunction
(Grondin et al. 2002). It was also found to be down-regulated in Alzheimer disease

95
brains (Ferrer et al. 1999). Finally, an intronic variant was found at gene IL6ST, an
interleukin signal transducer found to be differentially expressed in a mouse MPTP
model (L. Gao et al. 2015).
Summarizing all the results, at least one somatic variant was found at each
individual (tables 3-7) and the involved genes had been previously related to the
nervous system or even PD for 6 of the patients. Also, all but DV7 were
heterozygous for a variant in genes previously related to PD (table 2).
3.4 Tissue clustering by somatic variant allele frequencies
The allele frequency of somatic mutations generated during embryonic
development will differ among adult tissues depending on the proportion of mutant
cells present in the founder cell population of each tissue. Development and
growth dynamics of each organ as well as clonal expansion during adult tissue
maintenance will also alter the final frequencies. Hence, distance among the
tissues can inform us about these processes.
The frequencies at each tissue from every somatic mutation detected were
accumulated. Tissues were clustered by Pearson correlation based on the variant
allele frequencies (Fig. 35). Blood was the most distant tissue. This was expected
since out of the 18 somatic variants, 12 are exclusive to blood. The distance
among the four central nervous system tissues is thus very small. Still, the distance
between the two basal ganglia structures is smaller, but this is mainly driven by
the two last mutations, those on EDAR and SYT15, whose status as somatic
variants is less clear. Higher sensitivity or more individuals could help us to define
these relationships with better accuracy.

96
Figure 35. Tissue clustering by somatic mutation frequencies. Heatmap values indicate the variant allele frequency of the variants from tables 3-7 at each tissue. The top dendrogram resulted of Pearson correlation clustering based on the frequencies.
Blood
Striatum
S. Nigra
Cerebellum
Neocortex
OR5B3IL6STNAV3KIF5AZSCAN16ZEB2GRIP1RFESDZDHHC20MRPL42NTRK2C2KCNIP4/ PACRGLGALNT5PCDH10DENND4ASYT15 / TBX15EDAR
01020304050
Blood
Striatum
S. Nigra
Cerebellum
Neocortex
OR5B3IL6STNAV3KIF5AZSCAN16ZEB2GRIP1RFESDZDHHC20MRPL42NTRK2C2KCNIP4/ PACRGLGALNT5PCDH10DENND4ASYT15 / TBX15EDAR
01020304050
VAF (%)

97
Exploring somatic copy number variants in Alzheimer disease with array CGH data 1. Array CGH data processing
Array comparative genomic hybridization (aCGH) technology was used to explore
somatic copy number variation in Alzheimer disease (AD). Matched blood and
hippocampus DNA samples were obtained from 21 AD patients, 2 vascular
dementia (VaD) patients and 3 controls (table S3). Samples were processed in
two different batches. Each tissue’s DNA was hybridized to the Roche Exon-
Focused aCGH together with a commercially available control genome, the male
human genomic DNA from Promega.
Quality control
The control genome was labelled with the red fluorescent dye cyanine 5 whereas
each test genome was labelled with a green fluorescent dye, cyanine 3. However,
a PCA of the raw data (Fig. 36) showed more variance among the red than among
the green channel at both batches.
Figure 36. PCA of each channel raw intensities. The two first principal components for batch 1 (left) and batch 2 (right) are shown, with the amount of variance explained by each of them in parenthesis.
Because the variability in the raw light emissions strongly depends on the
consistency of the excitation light, regions with apparent germline copy number
variants were used to confirm the labelling. Log2 ratios between the two channels
●●
●
●
●
●
●●
●
●
● ●
●
● ●
●
●●
●●
●
●
●
●
●●
●
●●
●
●
● ●
●●
●
●●
●
●
●
●
●
●
●
●
●
●
●
●
●
●
●
●
●
●
●●●
●
−0.3
−0.2
−0.1
0.0
0.1
0.2
−0.15 −0.10 −0.05PC1 (26.7%)
PC2
(6.2
5%)
Raw intensities − Batch 1
●●●
●●●
●●
●
●●
●
●●●
●
●●●●
●
●
●
●
●
●
●
●
●●●●●
●
●
●●● ●
●●●
●
●●
●
●●
● ●
−0.2
0.0
0.2
0.4
0.10 0.15 0.20PC1 (34.01%)
PC2
(8.6
9%)
Channel
●
●
Green
Red
Raw intensities − Batch 2

98
by genomic position were inspected for both the blood and hippocampus of two
samples (Fig. S9). This allowed the detection of regions with extremely low log2
ratios in just one individual and present in both its tissues. Median intensities for
each channel showed that the most variable was the green channel (table 8),
confirming this was the test sample channel.
Table 8. Raw intensities at deletions. Raw green and red channel intensities for regions where log2 ratios were extremely low. Grey numbers highlight the smallest values at each genomic region, showing that the green channel is variable among individuals and less between tissues.
Raw intensity
1:118940915-119024481
1:204588543-204828734
20:5938122-6021265
1G
Hippocampus Red 2062.47 2206.17 1754.12
Green 3241.37 3762.1 412.43
Blood Red 1375.45 1492.27 1128.31
Green 3078.73 3715.92 363.65
2M
Hippocampus Red 1519.49 1675.49 1012.02
Green 352.82 354.25 2098.71
Blood Red 3828.96 3701.14 2525.84
Green 313.76 369.13 2767.94
Moreover, densities of log2 ratios at the sex chromosomes (Fig. S10) showed that
the distribution of chromosome X was either centered around 0, corresponding
to the same copy number as the control, or around a mean of 0.65, indicating a
duplication with respect to the control. Correspondingly, chromosome Y was
either centered around 0 or dispersed towards negative log2 ratios, with a mean
of -1.64, indicating a deletion with respect to the control. Since the control sample
is a male, this further confirmed the channel labelling. Also, both tissues of all
samples showed consistent genomic sex.
Normalization
As expected, extensive differences are found between the median and dispersion
of raw light intensities of the different channels and arrays (Fig. 37). MA plots were
used to examine the common bias in the log2 ratios (M) with respect to the mean
intensity (A). Indeed, higher light intensities showed higher log2 ratios (example in
Fig. 38), a tendency that affected different arrays with variable strength (Fig. S11).

99
Figure 37. Raw light intensity distributions. Boxplot showing the raw light intensity per each channel and sample from batch 1. Individual names are followed by a “B” for blood samples and “H” for hippocampus samples.
Figure 38. MA plot of raw data. Mean intensity of both channels (A) against log2 ratio (M) at each probe in the blood sample from individual 1G. Grey line is at the mode of the M distribution.
Accordingly, we applied quantile normalization to the raw data. Since the variance
of the two channels is quite different, we normalized the intensities from both
channels from all arrays together. Log2 ratios after normalization were centered
at 0 with outliers were still identifiable, even those with less extreme log2 ratios
(Fig. 39), which could be the regions were only a portion of the cells have a copy
number variant and those we are most interested in.
On the other hand, batch effect correction produced strong deviations for a subset
of probes at some arrays (Fig. S12). Since the number of arrays in each batch is
0
2500
5000
7500
10000
1AB 1AH 1DB 1DH 1EB 1EH 1GB 1GH 2AB 2AH 2BB 2BH 2CB 2CH 2GB 2GH 2IB 2IH 2JB 2JH 2LB 2LH 2MB 2MH 2NB 2NH CT1AB CT1AH CT1CB CT1CH
Inte
nsity Channel
Control
Test
Batch 1 − Raw

100
sufficient for independent analysis, we restrained from performing batch correction
and kept the two datasets separated in the subsequent processes.
Figure 39. Log2 ratios before and after quantile normalization. Log2 ratios per position in the chromosome 20 are shown for 1G’s blood before and after quantile normalization.
Alternative normalization approaches exist and are mainly used in cancer studies
(Staaf et al. 2007). Their objective is to normalize the data while considering the
existence of aneuploidies, trisomies or considerably sized rearrangements.
Because these extreme regions can affect quantile normalization, they are
excluded for the centralization of the data. However, initial inspection of our data,
with log2 ratios vs position, did not show any of such rearrangements, and since
quantile normalization was successful at keeping shorter variants (Fig. 39), we
decided to use the latter approach.
2. Array CGH data copy number calling
Segmentation and calling
Normalized log2 ratios were segmented with the package DNAcopy (van de Wiel
et al. 2007). We tested different SD thresholds for merging adjacent regions: 1, 2
and 3. That is, the distribution of log2 ratios is inspected in windows by the
software. Then, adjacent windows whose log2 ratio mean is within the selected
SD limit of the original window are merged to it. Inspection of the results obtained
with the different values showed that segmentation with SD=1 and SD=2 resulted
in too many short fragments, which would be difficult to compare between the
tissues in subsequent analysis. On the contrary, segmentation with SD=3 reflected
the raw log2 ratios variance while limiting the amount of noise incorporated (Fig.
40), so this was the selected parameter.

101
Figure 40. Segmented log2 ratios with different SD parameters. Normalized log2 ratios at each probe, in grey, were segmented with SD=1, resulting in the purple values. When segmented with SD=3, the green values were obtained.
Copy number variant probabilities were called with CGHcall (van de Wiel et al.
2007), which calls aberrations for aCGH data using a six-state mixture model. In
short, the fragmented signal from the previous step is used to find breakpoints.
Most algorithms assume three possible copy number states: duplication, normal
or deletion. However, CGHcall incorporates two more classes, differentiating
between one and two copies lost or gained, which improves the detection of single
copy gains and amplifications. The output consists on the probabilities each probe
has to belong to each of the six states as well as calls indicating the most probable
copy number.
Germline copy number variants
Segmentation and calling quality were evaluated by comparing the correlations of
autosomal probes’ log2 ratios between arrays belonging to the same individual
and to different individuals after each step (Fig. 41). The median of the correlations
between normalized log2 ratios of tissues from the same individual was higher than
when comparing tissues from different individuals but their ranges overlapped
considerably. After segmentation with DNAcopy, the ranges separated better but
still overlapped, probably indicating noise was still driving most of the correlations.
Hence, probes were filtered by incorporating calling information. We required
segments to have at least five consecutive probes with a CN call different than 0
and at least three probes with “extreme” normalized log2 ratios, that is, smaller

102
than -1 for deletion calls and bigger than 0.585 for duplication calls, corresponding
to CN 1 and 3, respectively. This produced much higher tissue correlations while
keeping the individual comparison median at a similar level.
Figure 41. Distribution of Pearson correlations at each processing step. Autosomal probes correlation was calculated between the tissues of the same individual (dark purple) and for all possible comparisons within batch between different individuals (light purple).
This filter is quite restrictive, so we expected to only retrieve germline copy number
variants together with those somatic variants that clonally expanded during tissue
maintenance. Since blood experiences clonal expansion, if expanded somatic
variants were called, we would expect a higher number of filtered segments in this
tissue than in the hippocampus. Indeed, the median number of segments for blood
samples was higher (Fig. 42), indicating some copy number variants present in a
considerable number of cells are restricted to blood, at least at such high
frequency.
Filtered segments were intersected with the RefSeq gene set. Those linked to
Alzheimer disease in OMIM (table S4) were inspected with special attention. Of
the six evaluated genes, only APP and HFE overlapped with filtered called
●
●
●
●
●
●
●
●
●
●
−0.5
−0.4
−0.3
−0.2
−0.1
0.0
0.1
0.2
0.3
0.4
0.5
0.6
0.7
0.8
0.9
1.0
Log2ratio Segmented Filtered
Pear
son
corre
latio
n
ComparisonTissue
Individual

103
segments. However, when comparing the log2 ratios and calls overlapping the
filtered segments, many other samples presented similar patterns, as is the case
for the samples of the first batch on the APP gene, where 12 out of 30 samples
had a call made by CGHcall (Fig. 43). This could indicate that this gene is
frequently altered in Alzheimer patients but nevertheless, out of the two control
individuals, one of their tissues was also called in the same region. Furthermore,
the number of samples called for a set of genes not linked to the disease but with
the same number of filtered called probes was comparable (Fig. S13).
Figure 42. Number of filtered segments per tissue. The distribution of the number of segments filtered per sample by tissue. Horizontal lines show the median value for each set.
Figure 43. CGHcall calls at the APP gene. Each line shows the calls per sample at each position. The blue line corresponds to the sample with the filtered segment, 2IH, whereas the red line shows the calls for the blood of the same individual, 2IB. The grey rectangle highlights the gene position and the blue segment shows the region the filtered call overlapped.
0
300
600
900
Blood Hippocampus
Num
ber o
f filt
ered
seg
men
ts
−1
0
1
27200000 27300000 27400000 27500000 27600000Position in chr21
CG
Hca
ll C
N c
all
APP

104
Since no relevant calls clearly distinguishable from noise were found, we
performed overrepresentation enrichment analyses (ORA) with the genes
overlapping filtered calls from all the Alzheimer patients. When molecular function
was evaluated with all protein coding genes as background, several processes
were shown to be significantly enriched, mainly related to transcription regulator
activity and nucleoside and ribonucleotide binding (Fig. 44). Proteins classified as
nucleotide binding and purine ribonucleotide binding proteins were found to be
downregulated in the hippocampus of Alzheimer patients (Ho Kim et al. 2015).
Enrichment of OMIM’s disease genes produced multiple significant results though
Alzheimer disease was not one of them (Fig. S14).
Figure 44. Filtered calls molecular function enrichment. Overrepresentation enrichment analysis for molecular function of genes overlapping filtered calls in the Alzheimer patients.
Somatic copy number variants
To explore somatic copy number variants in our data, we filtered the probes
without considering CGHcall calls, as the thresholds this approach uses are
designed for germline or clonally expanded variant identification. Hence, we
selected segments with more than ten adjacent probes with segmented log2 ratios
between -0.23 and -0.62, corresponding to 30% to 70% of cells with a deletion or
between 0.2 and 0.43, roughly corresponding to the same proportion of cells
carrying a duplication. As it was already difficult to differentiate between copy
number 0 and 1 as well as between copy number 3 and 4, we focused on somatic
copy alterations of a single copy, which are also more probable to occur.
0.0 0.1 0.2 0.3 0.4 0.5 0.6 0.7 0.8 0.9 1.0 1.1 1.2 1.3Enrichment ratio
DNA-binding transcription factor activity, RNA polymerase II-specific
DNA-binding transcription factor activity
purine ribonucleotide binding
ribonucleotide binding
purine nucleotide binding
drug binding
purine ribonucleoside triphosphate binding
adenyl ribonucleotide binding
adenyl nucleotide binding
molecular function regulator
FDR ≤ 0.05 FDR > 0.05

105
We observed extremely low correlation between the tissues for this segments (Fig.
45), but tissue comparisons, that is, when we compare the segmented log2 ratios
of both tissues from the same individual, still showed higher correlations than inter-
individual comparisons, indicating more resemblance. Nonetheless, this small
difference in log2 ratio to the control could be due to SNPs on the probes slightly
affecting hybridization. Biologically, the lack of correlation could be explained by
blood’s clonal expansion. This extremely limited sensitivity for the somatic copy
number range has been observed before (King et al. 2017).
Figure 45. Distribution of Pearson correlations for candidate somatic copy number variants. Autosomal probes correlation was calculated between the tissues of the same individual (dark purple) and for all possible comparisons within batch between different individuals (light purple).
−0.4
−0.3
−0.2
−0.1
0.0
0.1
0.2
0.3
0.4
0.5
0.6
0.7
0.8
0.9
1.0
Somatic candidates
Pear
son
corre
latio
n
ComparisonTissue
Individual

106
3. Comparison with whole genome sequencing
Because the increase in copy number we would expect from a somatic event is
within the noise levels of the arrays, we used an orthogonal methodology to
evaluate the replicability of the results. We sequenced the whole genome of blood
and hippocampus from five of the individuals, two from the first batch and three
from the second batch.
Comparison of copy number with mrCanavar
Copy number in 1kb windows was called with mrCanavar (see Methods), which
uses coverage as a proxy of copy number. The caller identifies some windows as
being of reference copy number, or the control regions. The copy number
distribution of this control regions for each sample was comparable to the
theoretical normal distribution calculated with the same mean and standard
deviation, indicating the good quality in the results (Fig. S15). Although the copy
number distribution in and out of control regions shows some overlap, they still are
for the most part distinguishable (Fig. S16).
In order to compare WGS copy number to the arrays, log2 ratios were taken. Then,
genomic windows corresponding to the previously identified putative somatic copy
number mutations where selected. The medians of the log2 ratios of probes
overlapping each of the WGS windows were calculated to allow a pairwise
comparison. Of note, the Promega male genome used as a control in the arrays
was not sequenced. This is because it is a variable sample derived from multiple
anonymous donors, designed to be used as a control is experiments such as
Southern blot hybridizations or PCRs. It has nonetheless been successfully used
as an array CGH control but sequencing a new batch of this sample would have a
very limited comparability. Unfortunately, the correlation of this in silico log2 ratios
with the CGH log2 ratios was extremely poor (Fig. 46), independently of windows
being control regions in one tissue, both or none. We repeated the analysis by
using ranks, to avoid incorporating noise, but still no correlation was found.

107
Figure 46. aCGH log2 ratios vs in silico WGS log2 ratios. Colors correspond to windows where both tissues are control regions (blue), only one is (pink) or none (green).
Comparison of copy number calling with CNVnator
Since the results were so poor, CNVs were also called with CNVnator. A window
length of 100 bp was used, as recommended for the mean coverage. Then, calls
were filtered so that the t-test p-value or the gaussian p-value were < 0.05 and the
proportion of reads with q0 was smaller than 0.5. The mean coverage in each of
the regions passing this filter was calculated. The mean Pearson correlation with
the normalized RD was 0.82. A contingency table showed that the calls were
CNVnator and the mean coverage were pointing towards opposite events had one
of the p-values > 0.05. Hence, calls were filtered so that both p-values were
smaller than 0.05, resulting in a mean correlation of 0.95 and 98.3% of calls
agreeing with mean CN. The mismatches were deletion calls in CNVnator with CN
2 according to the mean coverage, showing overall good quality filtered calls.

108
Events present in multiple individuals in the WGS data are more probable to be
also present in the Promega control genome, as they are expected to have higher
population frequency, so we removed this variants. Since somatic copy number
variants are difficult to call with a caller such as CNVnator, we started by taking
calls overlapping in both tissues of each individual. Surprisingly, mean coverage
per region had a mean Pearson correlation of 0.14. To check if one class of copy
number variant was driving the poor correlation, they were stratified by type. Also,
if the reason of the poor correlation was that we were considering events that were
also present in the control sample, we reasoned its comparison with the other
samples whose whole genome we sequenced would show the opposite pattern,
so we checked the aCGH log2 ratio distribution in the same sample were calls
were made as well as in the other WGS samples (Fig.47). Still, the distributions
were all centered on 1, demonstrating contradictory results. More, the segmented
log2 ratios presented a comparable patter (Fig. S17)
Figure 47. aCGH normalized log2 ratio distribution at WGS calls. Dark colors indicate log2 ratios are from the sample were the WGS call was made, whereas lighter colors show the log2 ratios of the other sequenced samples at those same calls.
−1
0
1
2
3
Deletions Duplications
aCG
H ra
tio

109
Somatic mutations in a neurotypical individual 1. The Brain Somatic Mosaicism Consortium
Rationale
The Brain Somatic Mosaicism Network is an American consortium whose
objective is to study somatic mosaicism in human brains. The project is focused
on understanding the role of somatic mosaicism in neuronal diversity within
neurotypical individuals and their relevance in complex neuropsychiatric
disorders.
The different 18 research groups participating are focused on particular diseases:
autism spectrum disorder, schizophrenia, Tourette syndrome, bipolar disorder, or
epilepsy. Results from the study of somatic mutations in these disorders may lead
to the discovery of biomarkers and genetic targets to improve the treatment of
neuropsychiatric disease and may offer hope for improving the lives of patients
and their families (McConnell et al. 2017). To this end, a resource of deep whole
genome, whole exome and single-cell sequencing is being generated from
patients of the different diseases.
Phase I
Due to the lack of well-established pipelines to call somatic mutations, specially
from WGS data, the first phase of the consortium has consisted on identifying
variants in a neurotypical individual, also termed the common experiment. Each
group called somatic variants from the same tissues so that the comparison and
validation of the results could help in stablishing somatic calling best practices
(unpublished).
Brain and fibroblast samples were obtained from the autopsy of a 55-year-old
male. DNA was extracted from a prefrontal cortex (PFC) sample and aliquots were
sequenced by several groups, producing technical replicates with a mean
coverage of 200x and 90x (table 9) as well as other lower coverage whole genome
sequencing data or exome sequencing data. A distinct PFC sample from the same
individual was obtained by our group. DNA was extracted in the ancient DNA
laboratory and it was sequenced at 90x, generating a biological replicate. Skin

110
fibroblasts were expanded in culture and two deep WGS replicates were also
generated.
Table 9. Sample ID and coverage. Replicates of deep whole genome sequencing from the same individual. Depth of coverage after removing duplicates is shown.
Sample ID Tissue Coverage
B04 PFC 76x
B03 PFC 86x
F03 Fibroblasts 70x
B06 PFC 204x
F06 Fibroblasts 234x
2. Calling somatic variants from deep WGS
We called somatic variants in the higher sequencing depth samples (table 9). To
do this, a similar strategy to that used in the first section of the results was applied.
Variants were called for each sample with HaplotypeCaller -ploidy 10. They were
then annotated with our custom python script in order to incorporate the
information needed for detecting biases. In-depth explanations on each of the
noise sources can be found at 3.1 in the Somatic mutations in Parkinson section.
Briefly, we required variants at each sample to comply with the following filters:
1. Not multiallelic
2. Not overlapping somatic non-callable tracks (1000G strict mask,
segmental duplications and mappability for the 150mers)
3. Not overlapping CNV calls (CNVnator)
4. No more than 3 variants close by
5. Not within 5 bp of indels
6. Not by homopolymers
7. AD >=5
8. R1 and R2 ratio between 0.5 and 2 for each allele
9. Non-significant FET for strand and allele
10. Non-significant Poisson for strand
11. Significant binomial VAF test (<0.01)
12. At most 3 haplotypes
13. Unbiased position in reads for both alleles
14. Not present in gnomAD

111
Of note, since all replicates come from the same sample, a set of different
individuals would be required to help us to identify systematic sequencing errors.
Depending on the coverage and allele balance cut-offs used to call variants in
human population studies, a portion of this variants can appear as low population
frequency polymorphisms. For this reason, we compared the number of variants
passing filters 1 to 13 to the number of variants also not present in the gnomAD
database (table 10).
As previously discussed, differentiating heterozygous and somatic mutations can
be difficult. With the exomes we used the multiple tissues per patient to help us to
identify heterozygous variants. Here we can also use the replicates to increase our
power. Nonetheless, these deep WGS samples are very expensive, making it
interesting to compare the results we would get without the use of replicates, a
more realistic scenario. Variants present in population databases can also be
useful to identify heterozygous mutations.
The number of variants obtained after applying any filter tackling heterozygous
mutations is one order of magnitude higher in both fibroblast samples. This
indicates that many mutations that appeared during clonal expansion in their
culture are confounded with somatic mutations. This is especially patent from the
huge difference in the proportion of calls retained after filters 1-13 that are
heterozygous in the brain depending on the tissue they were called at (table 10).
We decided to assess the probability of a variant coming from the germline only
from brain replicates. This is because we detected a few variants passing all filters
in the three brain replicates with a non-significant binomial test in at least one of
the fibroblast samples.
After each group made their callings, a set of the candidate variants was selected
for validation. Amplicon sequencing was performed by our collaborators in DNA
from the same brain as well as NA12878 to serve as a control for systematic
sequencing errors. 10X linked reads sequencing was obtained by some groups,
and the phasing of candidate positions with both germline haplotypes or with more
than 90% of the reads from one of them was considered as an indication of noise
and heterozygous variants, respectively. Single cell sequencing of neurons and
glia coming from the same PFC were also genotyped. They were especially useful
for identifying biased sequencing errors, since they appear at very low frequencies
in most if not all the cells (unpublished data). We used these results to evaluate
the specificity of our approach (table 10). As we do not know the true set of
variants, sensitivity cannot be determined. However, because variants were

112
prioritized for validation with this orthogonal data, our validation rates are inflated
by ascertainment bias, very obvious in our calls from F06.
Table 10. Number of variants passing filters and validation rate. The total number of variants passing filters from 1 to 13 or adding the gnomAD filter are shown. Variants were further filtered
B04 B03 F03 B06 F06
Filters 1-13
Total number 5466 5142 5531 6239 8062
Not heterozygous in brain 123 105 894 183 2006
Validation 11/15 13/15 4/5 21/21 3/3
Filters 1-13 + not in gnomAD
Total number 66 56 733 71 1720
Not heterozygous in brain 44 30 707 44 1688
Validation 9/12 11/12 4/4 19/20 3/3
Interestingly, even if the validation rate is higher than 75% for each sample, the
overlap between the variants discovered in brain replicates, that passed the 14
filters and were not heterozygous in other replicates was low (Fig. 48). The nine
variants shared by more than one replicate were all validated successfully.
Variants validated but not recovered from every sample were mostly due to
absence of call by HaplotypeCaller due to low alternative allele supporting reads
or because they did not reach the minimum of 5 we required.
Figure 48. Intersection diagram of brain replicates filtered calls. Overlap between variants called in the brain replicates, passing all the filters, including absence from gnomAD and with significant binomial test in the other two brain replicates.
38
63
35
21
B04
B03
B06

113
3. Using deep WGS replicates to identify germline variants
Variant allele frequency at high-confidence heterozygous positions, defined as
those present in the common dbSNP database and with a variant allele frequency
between 0.4 and 0.6 in at least one sample, showed high dependence on the
coverage (Fig. 49). The replicates with coverage higher than 200x have a
narrower VAF dispersion than a theoretical binomial distribution, showing the
remarkable dependency on coverage for establishing frequency thresholds for
separating germline from somatic variants. Nonetheless, outliers exist far from the
expected range, even below VAFs of 0.2. Inspection of these variants showed that
their frequency was affected by the clonal expansion of fibroblasts. They were
either somatic mutations whose frequency increased on culture or heterozygous
mutations that decreased in frequency.
Figure 49. Variant allele frequency dispersion is smaller at higher depths. Histogram of VAFs at high-confidence heterozygous positions (blue) vs a random binomial distribution with p=0.5 (grey). Each panel shows the VAF distribution for one of the replicates, ordered by depth. High-confidence heterozygous positions are those present in the common dbSNP database and with at least one tissue having a VAF between 0.4 and 0.6.
F03B04
B03B06
F06
0.0 0.1 0.2 0.3 0.4 0.5 0.6 0.7 0.8 0.9 1.0
0
2000
4000
6000
0
2000
4000
6000
0
2000
4000
6000
0
2000
4000
6000
0
2000
4000
6000
VAF
coun
t
High confidence heterozygous positions
Binomial
Empirical

114
The high depth of coverage of these samples gave us much more power to
determine heterozygous positions. Nonetheless, by using only one sample to
perform a binomial test on the read counts ~3% of the high-confidence
heterozygous variants would be rejected and considered as somatic (Fig. 50).
Using two replicates we would be able to correctly classify more than 99.5% of
the variants, even when using the expanded fibroblasts or the two lower brain
samples.
Figure 50. Proportion of high-confidence heterozygous variants misidentified as somatic. Median percentages of high-confidence heterozygous positions that would be classified as not heterozygous because their binomial test in the indicated samples is significant (p-value<0.05). Black bars show they standard deviation. For each number of replicates, all possible comparisons were performed.
●
●
●
●
●0
1
2
3
4
Fibroblast(x1) Brain(x1) Fibroblast(x2) Brain(x2) Brain(x3)
Perc
enta
ge
Positions with significant binomial test

115
DISCUSSION

116

117
The interest of somatic mutations in neurodegenerative diseases
The number of studies demonstrating that somatic mutations can cause diseases
has been increasing for the past few years (Gleeson et al. 2000; Messiaen et al.
2011; Poduri et al. 2012; Priest et al. 2016; Bar et al. 2017; Dou et al. 2017; Park
et al. 2018; Nicolas et al. 2018; Mensa-Vilaró et al. 2019), spanning from cardiac
arrhythmia to autism spectrum disorder. Even if the importance of a small
proportion of cells carrying a deleterious mutation can seem questionable, these
studies show that low frequency variants, even in as little as 0.8% of the DNA, can
produce harmful phenotypes. In the brain, the organ of interest for this thesis, a
small number of mutated neurons are sufficient to impair neural function, as shown
by studies on focal dysplasia patients (Lim et al. 2015, Lim et al 2017). Whether
the same holds true for neurodegenerative diseases is an open question worth
exploring.
Associating genetic causes to disease when the variants are not inherited can be
counterintuitive. However, multiple diseases are caused by recurrent mutations in
the same genomic locations. Point mutations reoccur in genes with CpG rich
regions (Agarwal et al. 1998) where spontaneous deamination is frequent; in short
tandem repeats slippage occurs (MacDonald et al. 1993) and regions flanked by
segmental duplications are repeatedly duplicated (Inoue et al. 2001), all causing
disease. In a similar way, it is reasonable to assume that the processes involved
in the appearance of somatic mutations will make specific genomic regions more
susceptible to their appearance. In fact, recent evolutionary divergence has been
shown to be variable along the human genome and to correlate with replication
timing (Stamatoyannopoulos et al. 2009). In cancer samples, where mutation is
so frequent that these patterns become more apparent and faulty repair
mechanisms can be used to infer their role, it has been demonstrated that multiple
genomic features such as GC content, transcription (Hodgkinson, Chen, and
Eyre-Walker 2012) and euchromatin (Schuster-Böckler and Lehner 2012)
correlate with the mutation rate and that differential mismatch repair underlies this
variation (Supek and Lehner 2015). Furthermore, the histone modification that
recruits this machinery is more abundant in exons than introns (Frigola et al.
2017), explaining, at least partially, their lower mutation rate. The different
accessibility of both damage agents and the repair machinery to the nucleotides
closer of further away from the nucleosomes at each helix turn further influences
these patterns, both in cancer and in the germline (Pich et al. 2018).
118
The mutation distribution observed in cancer compiles all the possible changes to
the genome in a context where mutation control is lost and the only major acting
force is positive selection (Martincorena et al. 2017). In contrast, although
mutation to the germline seems to follow many of these rules, purifying selection
has been observed to influence the events that enter into the population variation
pool (Xu et al. 2011; Wang et al. 2016). Non-cancerous somatic tissues can be
considered as an intermediate state, because mutations lethal to the embryo
appear later in development, and depending on the tissue maintenance
mechanism, clones with replication advantage will expand, constituting tumors
(Lee-Six, et al. 2018; Moore et al. 2018). Hence, the equilibrium of forces
governing somatic mutations in these tissues could vary depending on the
developmental stage when they occurred.
Besides these general mechanisms, it has been demonstrated that neuronal
activity is mediated by double strand breaks (DSBs) in the promoters of a subset
of genes (Madabhushi et al. 2015). Furthermore, DSBs occur during the
development of the nervous system, making its repair machinery crucial (Onishi
et al. 2017) and suggesting that tissue-specific processes could also induce
different types of mutation. It is plausible then that somatic mutations appear in a
few brain cells and their interaction, together with predisposing germline variants,
cause complex developmental diseases such as autism spectrum disorder (Dou
et al. 2017), and through their accumulation over aging produce
neurodegenerative diseases. In fact, a decrease in the efficiency of
nonhomologous end joining repair with age has been proven both in mouse
(Vaidya et al. 2014) and human cell lines (Z. Li et al. 2016), whose restoration
suppresses the onset of stress-induced premature cellular senescence, making
unrepaired DSBs a potential cause of neurodegenerative diseases.
Identification of somatic mutations in sequencing data: present and future
Identifying single nucleotide somatic variants from sequencing data is still
challenging for multiple reasons. Differentiating them from heterozygous germline
variants is not trivial. Their frequencies overlap, specially at lower coverages, as
we have shown in the exomes dataset by means of comparing the tissues of the
same individual. Even at high depth of coverage, such as that of the BSMN
samples, their range still overlaps. In both projects we have seen that using
replicates or different tissues from the same individual greatly increases the power
to discern one from the other. We also observed that the general frequency
distribution is shifted towards the reference allele in the exomes, that is,

119
frequencies are generally lower, an effect produced by the capture method. This
is not the case in the BSMN samples, whose heterozygous calls are symmetrical
around a variant allele frequency of 0.5. Hence, considering whether whole
genome sequencing or exome capture were performed, as well as the coverage
of the experiment is fundamental for stablishing cut-offs to separate heterozygous
and somatic variants when only one sample per individual is available.
We found that many false positive somatic mutations were called in multiple exome
samples from different individuals. This is because a considerable proportion of
them are a product of systematic sequencing errors, that is, after a certain
nucleotide sequence one base is erroneously identified with a given error rate.
Because this rate is low, its relevance is minor when identifying germline variants
or somatic variants clonally expanded in cancer, especially when a threshold is
used to remove this kind of noise. On the contrary, they are highly detrimental for
the identification of somatic mutations present in a small proportion of the cells of
a single sample.
While the reasons behind these biases are poorly understood (Taub, Corrada
Bravo, and Irizarry 2010; Ross et al. 2013), the best way to circumvent them is
through the use of control panels. In the Parkinson exomes analyses we used the
other individuals as a control panel for the identification of biased sequencing
errors. When several individuals seem to carry the same somatic variant, we can
infer it is a systematic error. Some of these errors are present in a very high
number of samples, clearly indicating they are a product of noise. When a variant
is only found in a few other samples it is less clear whether recurrent events could
be the cause, since as previously discussed, the rate of somatic mutation is
heterogeneous along the genome and especially because we are studying
patients of the same disease. However, even if we expect the same molecular
routes or the same genes to be affected, the probability of recurrent variants at
the same exact position seems to be low (Dou et al. 2017; Mensa-Vilaró et al.
2019) and systematic errors and artefacts are so frequent that until more is known
about these events, the simplest approach is to discard all these recurrent calls.
A different method for identifying these errors is through single-cell sequencing.
Although whole genome amplification methods can result in quite biased data, with
frequent allelic dropout or marked changes in depth along the genome (Borgström
et al. 2017), the same technology is used for sequencing the amplified material.
Hence, the same biased sequencing errors appear in a small proportion of the
single cell reads. Because single cells can only have three defined genotypes in

120
diploid organisms such as humans, this is an unequivocal sign of a systematic
error. However, it is still an expensive technique, especially for discovering multiple
variants and accurately estimating their frequency in the cell population, so its
combination with bulk whole genome sequencing seems to be a better approach
at this point.
Unresolved regions of the genome, those not present in the reference, can have
a high identity to resolved regions. This is because many of them originate from
segmental duplications that arose at some point in the population history (Bovee
et al. 2008), but they usually accumulate variants with the passage of time. Reads
coming from these reference gaps will map against their paralogous sequence,
with a lower efficiency because of differences in their boundaries. This results in
regions where a few reads carry a variant, or multiple close variants, and
oftentimes reads are clipped where the homology region ends. If the new copy is
old enough it can appear in other individuals from the same population and can
therefore be identified as an artefact with the use of a control panel, as we saw
with the exomes, highlighting the value in using samples from the same population.
If duplications are more recent, or even de novo, they can be pinpointed by
increased coverage, clipped reads and clustered variants. Nonetheless, somatic
copy number variants carrying a point mutation are undistinguishable from
somatic point mutations when using short reads.
Some of these noisier regions are implicitly collected by the 1000 Genomes
Project strict mask, which was developed from the realization that systematic
biases occurred in next-generation sequencing (Gibbs et al. 2015). It is very useful
for removing false positive somatic variants (Bae et al. 2018). Masking the
reference genome would create coverage depressions around the masked
segments, which can lower variant discovering power. Therefore, we used the
mask to filter variants after calling. False positive calls accumulate at these
regions, but at the cost of it removing a big proportion of the genome – about a
fifth of the genome or a tenth of the exome – where no variants can be discovered.
The mask was derived from low depth samples, and probably less regions would
be affected at higher depths. Since somatic variant discovery requires deeper
coverages, the sequencing of panels of samples at high depths can be used to
produce a new more exact mask, allowing for the discovery of somatic variants in,
hopefully, many of these regions. Alternatively, third generation sequencing
technologies, with different error patterns (Laver et al. 2015), could be used as
orthogonal methods to interrogate these regions, which as of now, are
inaccessible to somatic variant calling from next-generation sequencing data.

121
In a similar way, the WGAC segmental duplications track (Bailey et al. 2001)
defines regions where copy-unspecific mapping errors may arise. However,
because non-allelic homologous recombination is much more probable in these
regions, a portion of the cells could carry a genuine somatic variant there. Long
reads or linked reads could be the solution to differentiate between these
scenarios, since they can be used to distinguish between the copies accurately. If
a somatic variant is present, a proportion of the long or phased reads will properly
span the flanking regions and carry the variant.
Besides technological limitations, study design is also crucial for exploring somatic
mutations. Analyses of trios, where both parents and one or several children are
sequenced (Rahbari et al. 2016; Jónsson et al. 2017), can be very informative to
gain insight on how to distinguish germline from somatic variants and can be used
to train calling algorithms. Twin studies where only somatic mutations are different
between the individuals can be helpful not only as a ground truth set but also to
associate genes or genomic regions to discordant diseases (Vadgama et al. 2019)
Finally, mixing experiments are an alternative strategy to formally address the
issues we encountered and develop more accurate approaches for somatic
variant calling (J. Kim et al. 2019).
Once many variants from different individuals have been identified, we will have
more power to expand on the studies analyzing mutational signatures (Rahbari et
al. 2016; Bae et al. 2018) which can help us understand how mutations occur
during the development of different tissues. Once enough clinical data is obtained,
we will be able to explore their relationship with diagnosis, treatment effectiveness
or prognosis of different diseases. Since the first cell divisions seem to be
especially mutagenic (Yizhak et al. 2019), we could also test whether any
controllable factors at fertilization or during pregnancy can affect their burden.
The challenges of studying somatic mutations in neurodegenerative diseases
Neuronal death is the main pathological feature of neurodegenerative diseases. If
a somatic mutation is the cause of their death, neurons carrying the variant would
be depleted in the tissue remaining at the time of the autopsy. Therefore, the
analysis of the extant tissue can be a limited approach to discover the responsible
variants. However, this death is selective, that is, it affects only certain cell types.
It is then reasonable to believe that this susceptibility depends on features of the
affected cells. As an example, the death of dopaminergic neurons in drug induced
Parkinson is caused by the high affinity of MPP+ to the dopamine transporter

122
(Shen et al. 1985). Changes affecting this protein could result in the preferential
death of this type of neurons. On the other hand, we know that low frequency
somatic variants are present in other tissues even if they come from different germ
layers (Lodato et al. 2015). Hence, we can make use of samples from different
tissues of the same individual to retrieve the causing variant, as most probably
cells in different organs will not be affected by those mutations and remain at the
time of the autopsy.
Indeed, most of the somatic mutations we found in the Parkinson patients, 12 out
of 16, are exclusive to blood. Thus, the relevance of these variants being related
to nervous system functions or even to Parkinson disease genes, as we found,
can be questioned. It has to be taken into account that the nervous system and
neurodegenerative diseases are studied more than others. Hence, comparing
these results to those obtained from a panel of healthy people could help us
determine not only if the apparent enrichment on neurological genes is meaningful
but also if there is a higher burden of somatic mutations in our patients as it has
been found for other complex neurological diseases (E. T. Lim et al. 2017; Dou et
al. 2017).
Moreover, it could be argued that it is likely that variants appearing to be blood-
exclusive are present in many other tissues in frequencies below our detection
limit, which at 60x is higher than 1%, something that could be resolved with
amplicon sequencing of the central nervous system samples. Cells carrying these
mutations could have been present in a higher proportion of the founder cell
population of blood or, more probably, drift could have resulted in higher clonal
expansion on this lineage in blood. Determining the dynamics of progenitor cells
in development as well as understanding adult tissue maintenance is key to set
expectations and to find the anomalies linked to disease, which can in turn point
towards therapeutic targets.
The relevance of cell lineage research
The expected scenario in normal tissues is derived from what we know about
embryonic development and mutation in the first embryonic divisions. We still have
to simplify our calculations, assuming equal contribution from cells to the tissues.
However, in the first embryo divisions not all cells contribute to the inner cell mass
and the trophoblast, (Kelly, Mulnard, and Graham 1978; Balakier and Pedersen
1982) but the differentiation into epiblast and hypoblast is stochastic (Schrode et
al. 2014). Details on the successive cleavages and divisions are not clear, but we

123
have some hints from classic C. elegans (Sulston et al. 1983) and modern lineage
tracing studies (McKenna et al. 2016) as well as evidence from humans (Lodato
et al. 2015) that lineages present before gastrulation contribute to multiple tissues
from different germ layers.
Until this gap in our knowledge is closed, we cannot accurately infer the division a
variant occurred at just from its frequency, but we still can make an approximation.
Since already very early differentiations are known to be stochastic, if later lineage
divisions are too, it would only be the first few divisions that do not contribute to
the embryo symmetrically. In fact, at the earliest stages cells also contribute to the
extra-embryonic tissues, so this could be the sole reason for their unequal
contribution to adult tissues (Ju et al. 2017). Nonetheless, with our analyses we
are not trying to infer the exact division when a variant occurred, but just to
question the logic of it appearing in multiple tissues given its frequency, that is, if
it makes sense that a mutation is present where it is given its frequency.
Theories explaining the observed patterns are just beginning to be formulated
(Arendt et al. 2016). I would argue that if the first cell divisions are particularly
mutagenic, once there are enough cells to enter gastrulation, it would make sense
that they are somehow shuffled or mixed, since this would produce an individual
whose organs have only a proportion of mutant cells instead of having all the cells
in all organs deriving from one germ layer being affected. If the somatic mutation
is deleterious, the individual would have a higher fitness in the first scenario, not
only because we expect a partially affected organ to function sufficiently but,
perhaps more importantly, because their germline would be mosaic, making them
able to produce offspring without the mutation. Following this line of thought, since
somatic mutations constitute part of the variants being incorporated into the
population through the germline, in a similar way that selection has favored
recombination in sexual organisms to shuffle variants in the offspring, it is
reasonable to think that it would also favor this cell shuffling in the germ cell
lineage. Once more is known about cell migration during embryonic development
and the responsible mechanisms are discovered, we will be able to test this
hypothesis.
The role of non-coding variants in disease
The variants we found in a dataset of Parkinson disease (PD) patients are in many
cases missense mutations in genes found to be affected in PD or PD models. The
relevance of missense mutations for disease is clear, including Parkinson disease

124
(Polymeropoulos et al. 1997; Valente et al. 2004). A few others overlap 5′ and 3′ UTR regions instead. The implication of mutations in these regions in disease has
also been known for a long time (Chen et al. 2006; Miyamoto et al. 2007). This is
because proteins regulating translation bind to them (Wilkie, Dickson, and Gray
2003) and because they are targets of miRNAs (Ørom, Nielsen, and Lund 2008).
The relevance of all types of non-coding sequences is becoming clearer the more
we learn about genomic regulation. For many years, loci associated to diseases
through GWAs that were not in the exome were inexplicable. After the expansion
of epigenomic studies many of them were linked to genes or cell types and this led
to more information on the variables and processes involved in certain conditions
(Ernst et al. 2011; M. C. King et al. 2012). Nevertheless, many studies are still
focused on the exome or even perform target sequencing of a just a few genes.
Although this can be useful in monogenic highly penetrant sporadic diseases, this
is a limiting approach for complex diseases. It is reasonable to assume that
deleterious mutations can be better tolerated in a somatic state, pointing at their
putative relevance for understanding complex diseases. Furthermore, depending
on the approach used, only a handful of somatic mutations, those that appeared
in the first cell divisions, can be discovered. Restricting the analysis to a small
region of the genome, specially one less tolerant to change makes their discovery
even more challenging. GC content and repair mechanisms are different in the
exome than the rest of the genome, so the extrapolation of the observed patterns
and conclusions made from this data is restricted. Economic limitations are of
course practical limits to whole genome sequencing, more so with high coverage,
but it seems probable that the field will move towards it as it becomes cheaper.
Other implications of understanding somatic mutation
Cancer is by far the most studied somatic mutation disease. Once cancer driving
mutations occur clonal expansion increases the number of cells, so these
mutations are expected to be in the whole population of tumor cells. Variants that
appear after this stage can also be recovered by the comparison to the normal
tissue, so the impact of improving somatic calling would be small in this context.
Nevertheless, the field is moving towards understanding clonal expansion and
mutation in healthy tissues , so that the differences between normal cells and those
that originate tumors can be found (Martincorena et al. 2015; Martincorena and
Campbell 2015; Martincorena et al. 2017). Potentially this will help us to
understand the disease and which mechanisms are behind cancer appearance.

125
On a totally different context, all germline mutations were somatic mutations when
they first appeared, so how somatic variants originate, and which factors are
involved are fundamental questions for understanding and inferring mutation rates
along evolution. The molecular clock assumes that the mutation rate is constant
in a lineage. However, it correlates with life history traits such as lower body size
and lower generation time (Nikolaev et al. 2007; G. W. C. Thomas et al. 2018). It
can be hypothesized that the embryonic developmental stages where fast cell
division occurs are mutagenic because the repair machinery has very limited time
to act. Since shorter generation time species experience more generations and
hence more of such mutagenic divisions in the same period of time, this could
explain their higher rates. It has been suggested that the development of the
circulatory system can shift the mutational signatures at different developmental
stages (Bae et al. 2018). Moreover, it has been proposed that mammalian
embryonic development is not properly aligned to other animal groups
development, and the fast division periods could happen at different stages
(O’Farrell, Stumpff, and Tin Su 2004), explaining more of these differences. A
complete understanding of these processes can be used to infer the past events
from the sequences of present individuals in population genetics.

126

127
CONCLUSIONS
1. Accurate detection of somatic mutations from sequencing data requires
careful consideration of the noise sources that can particularly hinder their
identification
2. A considerable proportion of sporadic Parkinson disease patients carry
somatic single nucleotide variants whose germline mutation has been
linked to the disease
3. Array CGH lacks the sensitivity needed to identify somatic copy number
variants
4. Similar approaches are efficient to identify somatic mutations in
sequencing data with different depths.
5. Sequencing multiple tissues or replicates increases the power to
discriminate germline and somatic mutations

128

129
METHODS

130

131
Somatic mutations in Parkinson disease patients 1. Experimental methods
DNA collection and extraction
Tissue samples from cerebellum, neocortex, striatum and substantia nigra were
obtained from the biobank HCB-IDIBAPS. They were collected at autopsies of ten
Parkinson’s disease patients with a short time between death and time of
collection (6 to 18 hours). Blood samples from the same individuals were also
obtained. DNA extractions were carried out with the Qiagen DNeasy Blood &
Tissue Kit.
Exome sequencing
Library preparation and sequencing were performed by BGI. Genomic DNA
samples were randomly fragmented into 150-200 bp fragments. Adapters were
ligated and the resulting templates purified by the AgencourtAMPure SPRI beads.
Libraries were amplified by ligation-mediated polymerase chain reaction (LM-
PCR). The exome was captured with the Exon Focus SureSelect kit from Agilent.
Paired-end 100 bp sequencing was performed on an Illumina Hiseq2000 platform.
2. Computational methods
Mapping and processing
The resulting FASTQ files were inspected with FASTQC v0.11.4 (Andrews 2010)
and mapped with BWA v0.7.8 mem (Heng Li 2013) to the human hs37d5
assembly. Lane-specific read groups were added with Picard Tools v1.95 (Broad
Institute 2013). AddOrReplaceReadGroups and bams were merged by sample
with samtools v1.9 (H. Li et al. 2009). Read duplicates were removed with Picard
Tools v1.95 MarkDuplicates REMOVE_DUPLICATES=true. Base quality score
recalibration and indel realignment were applied following GATK’s best practices
(DePristo et al. 2011) with GATK v3.6 (McKenna et al. 2010). Secondary
alignments were also excluded with samtools view -F 256 and exome coverage
was calculated with BEDTools v2.26 (Quinlan and Hall 2010).

132
Germline genotyping
Germline variants were called with GATK v3.6. First, GVCFs were obtained for
each sample independently with -T HaplotypeCaller –emitRefConfidence GVCF.
Then, all samples were genotyped together with -T GenotypeGVCFs and a
standard hard filter was applied with -T VariantFiltration --filterExpression "QD <
2.0 || FS > 60.0 || MQ < 40.0 || MQRankSum < -12.5 || ReadPosRankSum < -8.0".
Principal component analysis (PCA)
A PCA of the hard-filtered genotypes was performed with EIGENSOFT v7.2.1
(Price et al. 2006) and samples were plotted according to the resulting
eigenvectors with ggplot2 (Wickham 2009).
Germline annotation
Information on type of variants and gene affected was annotated with snpEff 4.3t
(Cingolani, Platts, et al. 2012) eff. SnpSift 4.3t (Cingolani, Patel, et al. 2012) dbnsfp
was used to add population frequencies, effect prediction and conservation
information.
Enrichment analysis
Overrepresentation enrichment analysis was performed with WebGestalt (B.
Zhang, Kirov, and Snoddy 2005) using the geneontology database (Carbon et al.
2009) for molecular functions and genome protein coding genes as background.
Somatic genotyping
For Varscan 2 (Koboldt et al. 2012) somatic variant calling, mpileup files were
obtained with samtools mpileup per each individual’s group of bams. Then, single
nucleotide variants were called with Varscan v2.3.2 mpileup2snp with lax
parameters: --min-coverage 1 --min-reads2 1 --p-value 1 --min-var-freq 0.000001
--output-vcf. Indels were called with mpileup2indel with the same parameters.
For HaplotypeCaller somatic variant calling, GVCFs per sample were obtained
with GATK -T HaplotypeCaller -ploidy 10 -A StrandAlleleCountsBySample --

133
emitRefConfidence GVCF. Then, all GVCFs were genotyped together per
chromosome with -T GenotypeGVCFs -L chr -ploidy 10 -A
StrandAlleleCountsBySample to obtain somatic SNV and indel calls.
Copy number variant calling
Depth of coverage files were obtained with GATK v3.6 DepthOfCoverage and GC
content per target was calculated with GCContentByInterval. Then, CNVs were
called jointly for all samples with XHMM v1.0 (Fromer et al. 2012b) with standard
parameters following its recommended best practices.
Short tandem repeats
Short tandem repeats in hs37d5 were determined with Tandem Repeats Finder
v.4.09 (Benson 1999) and parameters 2 7 7 80 10 12 500 -h. Homopolymers
were extracted with a custom bash script based on their homogeneous repeat
motif.
Reference genome annotation BED files
The 1000G strict mask FASTA files were obtained from the 1000G project FTP
(ftp://ftp.1000genomes.ebi.ac.uk/vol1/ftp/release/20130502/supporting/accessib
le_genome_masks/) and were transformed into a BED file using a custom python3
script. BED files for WGAC segmental duplications, common dbSNP SNPs and
mappability for 100mers for hg19 were obtained from the UCSC table browser
(Karolchik et al. 2004).
VCF custom annotation and filtering
Both types of VCF files were annotated from BED files with BCFtools (H. Li et al.
2009) and from BAM files with a custom Python script using pysam (Pysam-
developers 2009). Variants were explored with IGV (J. T. Robinson et al. 2011)
and filtered with custom awk scripts.
Clustering heatmap
The R package pheatmap was used to obtain heatmap of the variant allele
frequency of somatic mutations at each tissue of the individual carrying the
mutation. Tissues were clustered by Pearson correlation.

134

135
Exploring somatic copy number variants in Alzheimer disease with array CGH data 1. Experimental methods DNA collection and extraction
Matched brain and blood samples were obtained from the brain banks Banco de
Tejidos CIEN and Banco de Cerebros de la Región de Murcia whose ethical
committees approved all protocols. In short, whole brains were obtained by
neuropathological autopsy shortly after death. They were then divided into two
symmetrical halves through a midsagittal section and cut into coronal, sagittal and
transversal slices. Tissue slices were frozen by immersion in isopentane at -50°C
and transferred to -80°C for long term storage. Selected sections were
immunostained to confirm the diagnosis. Classification and staging of Alzheimer
were performed according to the CERAD criteria as well as Braak staging of
neurofibrillary pathology. The hippocampus regions CA1-CA3 were later
dissected from the frozen slices by means of a stereomicroscope.
Samples for total of 26 individuals, including 21 Alzheimer’s disease (AD) patients,
2 vascular dementia (VaD) patients and 3 controls were obtained. Additionally, 3
cerebellum samples were obtained from the dissections for 3 of the AD patients.
DNA extractions were performed with the Qiagen DNeasy Blood & Tissue Kit.
Comparative genomic hybridisation (CGH) array
The resulting 55 DNA samples were hybridized in two different batches to the
NimbleGen Human CGH 3x720K Whole Genome Exon-Focused Array CGH from
Roche Diagnostics together with the commercially available control genome Male
Human Genomic DNA from Promega. The test samples were labelled with cyanine
3, a dye that upon excitation with ~500 nm light emits at 532 nm which
corresponds to green, whereas the control genome was labelled with cyanine 5,
whose excitation wavelength is ~600 nm and emits at 635 nm, which is associated
with red.
Whole genome sequencing

136
Libraries were prepared from the hippocampus and blood DNA samples from five
of the AD patients with the TruSeq Nano DNA kit with a fragment size. Then they
were sequenced in a HiSeqX machine at a mean coverage of 20x.
2. Computational methods Normalization
Raw light intensities for both test and control emission colors at each probe from
each batch were normalized by quantile normalization with normalize.quantiles
from the preprocessCore R package (Bolstad 2016). Then, log2 ratios between
test and control intensities were taken.
Copy number segmentation and calling
Normalized log2 ratios were segmented with segmentData from the R package
CGHcall (van de Wiel et al. 2007) with parameters method="DNAcopy",
undo.splits="sdundo", undo.SD=3. Copy numbers were then called with CGHcall
nclass=5 and ExpandCGHcall was used to get the final object.
Whole genome sequencing processing
FASTQ files were inspected with FASTQC v0.11.4 (Andrews 2010). Reads were
trimmed with Trimmomatic 0.36 (Bolger, Lohse, and Usadel 2014) TruSeq3-PE-
2.fa:2:30:10:8:false LEADING:20 TRAILING:20 MAXINFO:131:0.9 MINLEN:36
and mapped with BWA v0.7.8 mem (Heng Li 2013) to the human hg19 assembly.
Lane-specific read groups were added with Picard Tools v1.95 (Broad Institute
2013). Read duplicates were removed with Picard Tools v1.95 MarkDuplicates
REMOVE_DUPLICATES=true. Base quality score recalibration and indel
realignment were applied following GATK’s best practices (DePristo et al. 2011)
with GATK v3.6 (McKenna et al. 2010).
Copy number variant calling from whole genome sequencing data
Copy number variants were called with CNVnator 8.17 (Abyzov et al. 2011) with
a bin size of 100 bp, as recommended for 20-30x coverage data. Also, mrCanavar
0.51 (Alkan et al. 2009) was used to call copy number variants. First, the human
reference hg19 was kmer-masked to avoid getting calls at repetitive regions in the

137
reference. To do this, the assembly was split into 36 bp-long kmers with a sliding
window of 5 bp. The resulting sequences were mapped to the same assembly with
GEM v2 (Marco-Sola et al. 2012) and kmers mapping more than 20 times were
masked from the reference. Then, processed sample reads were split into 75-mers
and mapped to the masked reference with GEM. Finally, mrCanavar was used to
call copy number variants for each patient’s tissue. The same process was
followed with 10 Spanish samples from 1000 Genomes Project to serve as control.

138

139
Somatic mutations in a neurotypical individual 1. Experimental methods
DNA extraction and sequencing
A prefrontal cortex piece of the common experiment brain was obtained. DNA
extraction was performed at the ancient DNA laboratory to avoid contamination.
All the tools used in the procedure were sterilized under a UV light for at least 30
minutes. The surface of the tissue sample was scrapped off by means of a surgical
scalpel while on a container resting on dry ice. Smaller samples were cut from the
tissue piece and placed into a 1.5 ml tube. DNeasy Blood & Tissue Kit for DNA
extraction was used. A DNA library was prepared with the NebNext Ultra II kit and
sequenced on an Illumina HiSeq4000 machine for 2x150 cycles resulting in a 90x
mean coverage. Other samples from the sample prefrontal cortex as well as from
expanded fibroblasts from the same individual were sequenced by our
collaborators (unpublished data).
2. Computational methods
Mapping and processing
FASTQ files from all samples were uniformly mapped with BWA v0.7.16 mem
(Heng Li 2013) to the human hs37d5 assembly. Read duplicates were removed
with Picard Tools v2.12.2 MarkDuplicates REMOVE_DUPLICATES=true. Base
quality score recalibration and indel realignment were applied following GATK’s
best practices (DePristo et al. 2011) with GATK v3.7 (McKenna et al. 2010).
Somatic genotyping
The bam from each sample was separated in chromosomes. Samples were then
genotyped with HaplotypeCaller -ploidy 10 -A StrandBiasBySample from GATK
4.1.2 (McKenna et al. 2010) in 5 Mb windows overlapping 600 bp with the
surrounding windows when they belonged to the same chromosome.

140
Copy number variant calling
Copy number variants were called with CNVnator 8.17 (Abyzov et al. 2011) per
chromosome with a bin size of 50 bp.
Reference genome annotation BED files
The 1000G strict mask FASTA files were obtained from the 1000G project FTP
(ftp://ftp.1000genomes.ebi.ac.uk/vol1/ftp/release/20130502/supporting/accessib
le_genome_masks/) and were transformed into a BED file using a custom python3
script. BED files for WGAC segmental duplications and common dbSNP SNPs
were obtained from the UCSC table browser (Karolchik et al. 2004). Mappability
for 150-mers was calculated with GEM v2 gem-mappability.
Short tandem repeats in hs37d5 were determined with Tandem Repeats Finder
v.4.09 (Benson 1999) and parameters 2 7 7 80 10 12 500 -h. Homopolymers
were extracted with a custom bash script based on their homogeneous repeat
motif.
VCF custom annotation and filtering
VCF files were annotated from BED files with BCFtools (H. Li et al. 2009) and from
BAM files as well as CNVnator output with a custom Python script using pysam
(Pysam-developers 2009). Variants were filtered with custom awk scripts.

141
“The owl of Minerva spreads its wings only with the falling of the dusk”
G.W.F. Hegel, Philosophy of Right (1820)

142

143
BIBLIOGRAPHY

144
Abou-Sleiman, Patrick M., Miratul M. K. Muqit, and Nicholas W. Wood. 2006. “Expanding Insights of Mitochondrial Dysfunction in Parkinson’s Disease.” Nature Reviews Neuroscience 7 (3). Nature Publishing Group: 207–19. doi:10.1038/nrn1868.
Abyzov, A., A. E. Urban, M. Snyder, and M. Gerstein. 2011. “CNVnator: An Approach to Discover, Genotype, and Characterize Typical and Atypical CNVs from Family and Population Genome Sequencing.” Genome Research 21 (6): 974–84. doi:10.1101/gr.114876.110.
Abyzov, Alexej, Livia Tomasini, Bo Zhou, Nikolaos Vasmatzis, Gianfilippo Coppola, Mariangela Amenduni, Reenal Pattni, et al. 2017. “One Thousand Somatic SNVs per Skin Fibroblast Cell Set Baseline of Mosaic Mutational Load with Patterns That Suggest Proliferative Origin.” Genome Research 27 (4). Cold Spring Harbor Laboratory Press: 512–23. doi:10.1101/gr.215517.116.
Afifi, Adel K. 1994. “Topical Review: Basal Ganglia: Functional Anatomy and Physiology. Part 2.” Journal of Child Neurology 9 (4). Sage PublicationsSage CA: Thousand Oaks, CA: 352–61. doi:10.1177/088307389400900403.
Agarwal, Sunita K., Larisa V. Debelenko, Mary Beth Kester, Siradanahalli C. Guru, Pachiappan Manickam, Shodimu-Emmanuel Olufemi, Monica C. Skarulis, et al. 1998. “Analysis of Recurrent Germline Mutations in TheMEN1 Gene Encountered in Apparently Unrelated Families.” Human Mutation 12 (2). John Wiley & Sons, Ltd: 75–82. doi:10.1002/(SICI)1098-1004(1998)12:2<75::AID-HUMU1>3.0.CO;2-T.
Ågren, J. Arvid, and Andrew G. Clark. 2018. “Selfish Genetic Elements.” PLOS Genetics 14 (11). Public Library of Science: e1007700. doi:10.1371/journal.pgen.1007700.
Agris, Paul F., Franck A.P. Vendeix, and William D. Graham. 2007. “TRNA’s Wobble Decoding of the Genome: 40 Years of Modification.” Journal of Molecular Biology 366 (1). Academic Press: 1–13. doi:10.1016/J.JMB.2006.11.046.
Alexandrov, Ludmil B., Serena Nik-Zainal, David C. Wedge, Peter J. Campbell, and Michael R. Stratton. 2013. “Deciphering Signatures of Mutational Processes Operative in Human Cancer.” Cell Reports 3 (1). Cell Press: 246–59. doi:10.1016/J.CELREP.2012.12.008.
Alexandrov, Ludmil B., Serena Nik-Zainal, David C. Wedge, Samuel A. J. R. Aparicio, Sam Behjati, Andrew V. Biankin, Graham R. Bignell, et al. 2013. “Signatures of Mutational Processes in Human Cancer.” Nature 500 (7463). Nature Publishing Group: 415–21. doi:10.1038/nature12477.
Alkan, Can, Jeffrey M Kidd, Tomas Marques-Bonet, Gozde Aksay, Francesca Antonacci, Fereydoun Hormozdiari, Jacob O Kitzman, et al. 2009. “Personalized Copy Number and Segmental Duplication Maps Using Next-Generation Sequencing.” Nature Genetics 41 (10). Nature Publishing Group: 1061–67. doi:10.1038/ng.437.
Alonso, Alejandra del C., Inge Grundke-Iqbal, and Khalid Iqbal. 1996. “Alzheimer’s Disease Hyperphosphorylated Tau Sequesters Normal Tau into Tangles of Filaments and Disassembles Microtubules.” Nature Medicine 2 (7). Nature Publishing Group: 783–87. doi:10.1038/nm0796-783.
Alt, Frederick W, Eugene M Oltz, Faith Young, James Gorman, Guillermo Taccioli, and Jianzhu Chen. 1992. “VDJ Recombination.” Immunology Today 13 (8). Elsevier Current Trends: 306–14. doi:10.1016/0167-5699(92)90043-7.
Alzheimer, A. 1907. “On a Peculiar Disease of the Cerebral Cortex.” Allgemeine Zeitschrift Fur Psychiatrie Und Psychisch-Gerichtliche Medizin.
Anderson, J A, A L Lewellyn, and J L Maller. 1997. “Ionizing Radiation Induces Apoptosis and Elevates Cyclin A1-Cdk2 Activity before but Not after the Midblastula Transition in Xenopus.” Molecular Biology of the Cell 8 (7): 1195–1206. doi:10.1091/mbc.8.7.1195.
Andrews, S. 2010. “FastQC: A Quality Control Tool for High Throughput Sequence Data.” http://www.bioinformatics.babraham.ac.uk/projects/fastqc.
Arendt, Detlev, Jacob M. Musser, Clare V. H. Baker, Aviv Bergman, Connie Cepko,

145
Douglas H. Erwin, Mihaela Pavlicev, et al. 2016. “The Origin and Evolution of Cell Types.” Nature Reviews Genetics 17 (12). Nature Publishing Group: 744–57. doi:10.1038/nrg.2016.127.
Armitage, P, and R Doll. 1957. “A Two-Stage Theory of Carcinogenesis in Relation to the Age Distribution of Human Cancer.” British Journal of Cancer 11 (2). Nature Publishing Group: 161–69. http://www.ncbi.nlm.nih.gov/pubmed/13460138.
Aschner, Michael, Keith M. Erikson, Elena Herrero Hernández, Ronald Tjalkens, and Ronald Tjalkens. 2009. “Manganese and Its Role in Parkinson’s Disease: From Transport to Neuropathology.” NeuroMolecular Medicine 11 (4): 252–66. doi:10.1007/s12017-009-8083-0.
Ashley, D J. 1969. “The Two ‘Hit’ and Multiple ‘Hit’ Theories of Carcinogenesis.” British Journal of Cancer 23 (2). Nature Publishing Group: 313–28. http://www.ncbi.nlm.nih.gov/pubmed/5788039.
Astbury, Caroline, Laurie A Christ, David J Aughton, Suzanne B Cassidy, Arun Kumar, Evan E Eichler, and Stuart Schwartz. 2004. “Detection of Deletions in de Novo ‘Balanced’ Chromosome Rearrangements: Further Evidence for Their Role in Phenotypic Abnormalities.” Genetics in Medicine 6 (2). Nature Publishing Group: 81–89. doi:10.1097/01.GIM.0000117850.04443.C9.
Auerbach, C, and B J Kilbey. 1971. “Mutation in Eukaryotes.” www.annualreviews.org. Aziz, N A, C K Jurgens, G B Landwehrmeyer, on behalf of the EHDN Registry Study
EHDN Registry Study Group, W M C van Roon-Mom, G J B van Ommen, T Stijnen, and R A C Roos. 2009. “Normal and Mutant HTT Interact to Affect Clinical Severity and Progression in Huntington Disease.” Neurology 73 (16). Wolters Kluwer Health, Inc. on behalf of the American Academy of Neurology: 1280–85. doi:10.1212/WNL.0b013e3181bd1121.
Azizan, Elena A B, Hanne Poulsen, Petronel Tuluc, Junhua Zhou, Michael V Clausen, Andreas Lieb, Carmela Maniero, et al. 2013. “Somatic Mutations in ATP1A1 and CACNA1D Underlie a Common Subtype of Adrenal Hypertension.” Nature Genetics 45 (9). Nature Publishing Group: 1055–60. doi:10.1038/ng.2716.
Bae, Taejeong, Livia Tomasini, Jessica Mariani, Bo Zhou, Tanmoy Roychowdhury, Daniel Franjic, Mihovil Pletikos, et al. 2018. “Different Mutational Rates and Mechanisms in Human Cells at Pregastrulation and Neurogenesis.” Science (New York, N.Y.) 359 (6375). American Association for the Advancement of Science: 550–55. doi:10.1126/science.aan8690.
Bailey, J A, A M Yavor, H F Massa, B J Trask, and E E Eichler. 2001. “Segmental Duplications: Organization and Impact within the Current Human Genome Project Assembly.” Genome Research 11 (6). Cold Spring Harbor Laboratory Press: 1005–17. doi:10.1101/gr.gr-1871r.
Bailey, Matthew H., Collin Tokheim, Eduard Porta-Pardo, Sohini Sengupta, Denis Bertrand, Amila Weerasinghe, Antonio Colaprico, et al. 2018. “Comprehensive Characterization of Cancer Driver Genes and Mutations.” Cell 173 (2). Cell Press: 371–385.e18. doi:10.1016/J.CELL.2018.02.060.
Balakier, H., and R.A. Pedersen. 1982. “Allocation of Cells to Inner Cell Mass and Trophectoderm Lineages in Preimplantation Mouse Embryos.” Developmental Biology 90 (2). Academic Press: 352–62. doi:10.1016/0012-1606(82)90384-0.
Ballard, Clive, Serge Gauthier, Anne Corbett, Carol Brayne, Dag Aarsland, and Emma Jones. 2011. “Alzheimer’s Disease.” The Lancet 377 (9770). Elsevier: 1019–31. doi:10.1016/S0140-6736(10)61349-9.
Ballard, P A, J W Tetrud, and J W Langston. 1985. “Permanent Human Parkinsonism Due to 1-Methyl-4-Phenyl-1,2,3,6-Tetrahydropyridine (MPTP): Seven Cases.” Neurology 35 (7): 949–56. http://www.ncbi.nlm.nih.gov/pubmed/3874373.
Bamshad, Michael J., Sarah B. Ng, Abigail W. Bigham, Holly K. Tabor, Mary J. Emond, Deborah A. Nickerson, and Jay Shendure. 2011. “Exome Sequencing as a Tool for

146
Mendelian Disease Gene Discovery.” Nature Reviews Genetics 12 (11). Nature Publishing Group: 745–55. doi:10.1038/nrg3031.
Bar, Daniel Z, Martin F Arlt, Joan F Brazier, Wendy E Norris, Susan E Campbell, Peter Chines, Delphine Larrieu, et al. 2017. “A Novel Somatic Mutation Achieves Partial Rescue in a Child with Hutchinson-Gilford Progeria Syndrome.” Journal of Medical Genetics 54 (3). BMJ Publishing Group Ltd: 212–16. doi:10.1136/jmedgenet-2016-104295.
Barton, Nicholas H. 2007. Evolution. Cold Spring Harbor Laboratory Press. https://www.cshlpress.com/default.tpl?cart=1556645006597082545&fromlink=T&linkaction=full&linksortby=oop_title&--eqSKUdatarq=540.
Barton, Nick, Joachim Hermisson, and Magnus Nordborg. 2019. “Why Structure Matters.” ELife 8 (March). doi:10.7554/eLife.45380.
Batistela, Meire Silva, Nalini Drieli Josviak, Carla Daniela Sulzbach, and Ricardo Lehtonen Rodrigues de Souza. 2017. “An Overview of Circulating Cell-Free MicroRNAs as Putative Biomarkers in Alzheimer’s and Parkinson’s Diseases.” International Journal of Neuroscience 127 (6). Taylor & FrancisNew York: 547–58. doi:10.1080/00207454.2016.1209754.
Belinky, Frida, Noam Nativ, Gil Stelzer, Shahar Zimmerman, Tsippi Iny Stein, Marilyn Safran, and Doron Lancet. 2015. “PathCards: Multi-Source Consolidation of Human Biological Pathways.” Database : The Journal of Biological Databases and Curation 2015. Oxford University Press. doi:10.1093/database/bav006.
Belkadi, Aziz, Alexandre Bolze, Yuval Itan, Aurélie Cobat, Quentin B Vincent, Alexander Antipenko, Lei Shang, Bertrand Boisson, Jean-Laurent Casanova, and Laurent Abel. 2015. “Whole-Genome Sequencing Is More Powerful than Whole-Exome Sequencing for Detecting Exome Variants.” Proceedings of the National Academy of Sciences of the United States of America 112 (17). National Academy of Sciences: 5473–78. doi:10.1073/pnas.1418631112.
Bender, Andreas, Kim J Krishnan, Christopher M Morris, Geoffrey A Taylor, Amy K Reeve, Robert H Perry, Evelyn Jaros, et al. 2006. “High Levels of Mitochondrial DNA Deletions in Substantia Nigra Neurons in Aging and Parkinson Disease.” Nature Genetics 38 (5). Nature Publishing Group: 515–17. doi:10.1038/ng1769.
Benjamini, Yuval, and Terence P. Speed. 2012. “Summarizing and Correcting the GC Content Bias in High-Throughput Sequencing.” Nucleic Acids Research 40 (10). Oxford University Press: e72–e72. doi:10.1093/nar/gks001.
Benson, G. 1999. “Tandem Repeats Finder: A Program to Analyze DNA Sequences.” Nucleic Acids Research 27 (2). Narnia: 573–80. doi:10.1093/nar/27.2.573.
Bentley, David R., Shankar Balasubramanian, Harold P. Swerdlow, Geoffrey P. Smith, John Milton, Clive G. Brown, Kevin P. Hall, et al. 2008. “Accurate Whole Human Genome Sequencing Using Reversible Terminator Chemistry.” Nature 456 (7218). NIH Public Access: 53. doi:10.1038/NATURE07517.
Berg, Jeremy J, Arbel Harpak, Nasa Sinnott-Armstrong, Anja Moltke Joergensen, Hakhamanesh Mostafavi, Yair Field, Evan August Boyle, et al. 2019. “Reduced Signal for Polygenic Adaptation of Height in UK Biobank.” ELife 8 (March). doi:10.7554/eLife.39725.
Bernheimer, H., W. Birkmayer, O. Hornykiewicz, K. Jellinger, and F. Seitelberger. 1973. “Brain Dopamine and the Syndromes of Parkinson and Huntington Clinical, Morphological and Neurochemical Correlations.” Journal of the Neurological Sciences 20 (4). Elsevier: 415–55. doi:10.1016/0022-510X(73)90175-5.
Bernstein, Bradley E, John A Stamatoyannopoulos, Joseph F Costello, Bing Ren, Aleksandar Milosavljevic, Alexander Meissner, Manolis Kellis, et al. 2010. “The NIH Roadmap Epigenomics Mapping Consortium.” Nature Biotechnology 28 (10): 1045–48. doi:10.1038/nbt1010-1045.
Beysen, Diane, Anne De Paepe, and Elfride De Baere. 2009. “FOXL2 Mutations and

147
Genomic Rearrangements in BPES.” Human Mutation 30 (2). John Wiley & Sons, Ltd: 158–69. doi:10.1002/humu.20807.
Bignell, Graham R., Chris D. Greenman, Helen Davies, Adam P. Butler, Sarah Edkins, Jenny M. Andrews, Gemma Buck, et al. 2010. “Signatures of Mutation and Selection in the Cancer Genome.” Nature 463 (7283). Nature Publishing Group: 893–98. doi:10.1038/nature08768.
Birney, Ewan, John A. Stamatoyannopoulos, Anindya Dutta, Roderic Guigó, Thomas R. Gingeras, Elliott H. Margulies, Zhiping Weng, et al. 2007. “Identification and Analysis of Functional Elements in 1% of the Human Genome by the ENCODE Pilot Project.” Nature 447 (7146). Nature Publishing Group: 799–816. doi:10.1038/nature05874.
Boda, Enrica, Eriola Hoxha, Alessandro Pini, Francesca Montarolo, and Filippo Tempia. 2012. “Brain Expression of Kv3 Subunits During Development, Adulthood and Aging and in a Murine Model of Alzheimer’s Disease.” Journal of Molecular Neuroscience 46 (3). Humana Press Inc: 606–15. doi:10.1007/s12031-011-9648-6.
Bolger, Anthony M., Marc Lohse, and Bjoern Usadel. 2014. “Trimmomatic: A Flexible Trimmer for Illumina Sequence Data.” Bioinformatics 30 (15). Narnia: 2114–20. doi:10.1093/bioinformatics/btu170.
Bolstad, Benjamin Milo. 2016. “PreprocessCore: A Collection of Pre-Processing Functions.” https://github.com/bmbolstad/preprocessCore.
Bonifati, V., Patrizia Rizzu, Marijke J van Baren, Onno Schaap, Guido J Breedveld, Elmar Krieger, Marieke C J Dekker, et al. 2003. “Mutations in the DJ-1 Gene Associated with Autosomal Recessive Early-Onset Parkinsonism.” Science 299 (5604): 256–59. doi:10.1126/science.1077209.
Borgström, Erik, Marta Paterlini, Jeff E. Mold, Jonas Frisen, and Joakim Lundeberg. 2017. “Comparison of Whole Genome Amplification Techniques for Human Single Cell Exome Sequencing.” Edited by Yun Li. PLOS ONE 12 (2). Public Library of Science: e0171566. doi:10.1371/journal.pone.0171566.
Botstein, David, and Neil Risch. 2003. “Discovering Genotypes Underlying Human Phenotypes: Past Successes for Mendelian Disease, Future Approaches for Complex Disease.” Nature Genetics 33 (S3). Nature Publishing Group: 228–37. doi:10.1038/ng1090.
Botta-Orfila, Teresa, Xavier Morató, Yaroslau Compta, Juan José Lozano, Neus Falgàs, Francesc Valldeoriola, Claustre Pont-Sunyer, et al. 2014. “Identification of Blood Serum Micro-RNAs Associated with Idiopathic and LRRK2 Parkinson’s Disease.” Journal of Neuroscience Research 92 (8). John Wiley & Sons, Ltd: 1071–77. doi:10.1002/jnr.23377.
Bourque, Guillaume, Bernard Leong, Vinsensius B Vega, Xi Chen, Yen Ling Lee, Kandhadayar G Srinivasan, Joon-Lin Chew, et al. 2008. “Evolution of the Mammalian Transcription Factor Binding Repertoire via Transposable Elements.” Genome Research 18 (11). Cold Spring Harbor Laboratory Press: 1752–62. doi:10.1101/gr.080663.108.
Bovee, Donald, Yang Zhou, Eric Haugen, Zaining Wu, Hillary S Hayden, Will Gillett, Eray Tuzun, et al. 2008. “Closing Gaps in the Human Genome with Fosmid Resources Generated from Multiple Individuals.” Nature Genetics 40 (1). Nature Publishing Group: 96–101. doi:10.1038/ng.2007.34.
Braak, Heiko, Irina Alafuzoff, Thomas Arzberger, Hans Kretzschmar, and Kelly Del Tredici. 2006. “Staging of Alzheimer Disease-Associated Neurofibrillary Pathology Using Paraffin Sections and Immunocytochemistry.” Acta Neuropathologica 112 (4). Springer: 389–404. doi:10.1007/s00401-006-0127-z.
Braak, Heiko, Kelly Del Tredici, Udo Rüb, Rob A.I de Vos, Ernst N.H Jansen Steur, and Eva Braak. 2003. “Staging of Brain Pathology Related to Sporadic Parkinson’s

148
Disease.” Neurobiology of Aging 24 (2). Elsevier: 197–211. doi:10.1016/S0197-4580(02)00065-9.
Brenner, David, Rüstem Yilmaz, Kathrin Müller, Torsten Grehl, Susanne Petri, Thomas Meyer, Julian Grosskreutz, et al. 2018. “Hot-Spot KIF5A Mutations Cause Familial ALS.” Brain 141 (3). Narnia: 688–97. doi:10.1093/brain/awx370.
Brichta, Lars, William Shin, Vernice Jackson-Lewis, Javier Blesa, Ee-Lynn Yap, Zachary Walker, Jack Zhang, et al. 2015. “Identification of Neurodegenerative Factors Using Translatome–Regulatory Network Analysis.” Nature Neuroscience 18 (9). Nature Publishing Group: 1325–33. doi:10.1038/nn.4070.
Broad Institute. 2013. “Picard: A Set of Command Line Tools (in Java) for Manipulating High-Throughput Sequencing (HTS) Data and Formats Such as SAM/BAM/CRAM and VCF.” https://broadinstitute.github.io/picard/.
Brodin, Johanna, Mattias Mild, Charlotte Hedskog, Ellen Sherwood, Thomas Leitner, Björn Andersson, and Jan Albert. 2013. “PCR-Induced Transitions Are the Major Source of Error in Cleaned Ultra-Deep Pyrosequencing Data.” Edited by Patrick Tan. PLoS ONE 8 (7). Public Library of Science: e70388. doi:10.1371/journal.pone.0070388.
Burn, D J, M H Mark, E D Playford, D M Maraganore, T R Zimmerman, R C Duvoisin, A E Harding, C D Marsden, and D J Brooks. 1992. “Parkinson’s Disease in Twins Studied with 18F-Dopa and Positron Emission Tomography.” Neurology 42 (10). Wolters Kluwer Health, Inc. on behalf of the American Academy of Neurology: 1894–1900. doi:10.1212/WNL.42.10.1894.
Buzsáki, György, and Edvard I Moser. 2013. “Memory, Navigation and Theta Rhythm in the Hippocampal-Entorhinal System.” Nature Neuroscience 16 (2). Nature Publishing Group: 130–38. doi:10.1038/nn.3304.
Campbell, Catarina D, and Evan E Eichler. 2013. “Properties and Rates of Germline Mutations in Humans.” Trends in Genetics : TIG 29 (10). NIH Public Access: 575–84. doi:10.1016/j.tig.2013.04.005.
Carbon, Seth, Amelia Ireland, Christopher J. Mungall, ShengQiang Shu, Brad Marshall, and Suzanna Lewis. 2009. “AmiGO: Online Access to Ontology and Annotation Data.” Bioinformatics 25 (2). Narnia: 288–89. doi:10.1093/bioinformatics/btn615.
Carlson, Bruce M. 2014. Human Embryology and Developmental Biology. Elsevier/Saunders.
Carneiro, Mauricio O, Carsten Russ, Michael G Ross, Stacey B Gabriel, Chad Nusbaum, and Mark A DePristo. 2012. “Pacific Biosciences Sequencing Technology for Genotyping and Variation Discovery in Human Data.” BMC Genomics 13 (1): 375. doi:10.1186/1471-2164-13-375.
Carson, Dennis A., Shiro Seto, D.Bruce Wasson, and Carlos J. Carrera. 1986. “DNA Strand Breaks, NAD Metabolism, and Programmed Cell Death.” Experimental Cell Research 164 (2). Academic Press: 273–81. doi:10.1016/0014-4827(86)90028-5.
Cavalli-Sforza, L. L. (Luigi Luca), and W. F. (Walter Fred) Bodmer. 1971. The Genetics of Human Populations. Dover Publications. https://books.google.es/books?hl=en&lr=&id=rdZNbApUGUsC&oi=fnd&pg=PP1&dq=Cavalli-Sforza+and+Bodmer+(1971)&ots=iONuAuDEvx&sig=DBTpcMOtRvNGnedK4JT6Uy12EWA#v=onepage&q=Cavalli-Sforza and Bodmer (1971)&f=false.
Celestino-Soper, Patricia B.S., Chad A. Shaw, Stephan J. Sanders, Jian Li, Michael T. Murtha, A. Gulhan Ercan-Sencicek, Lea Davis, et al. 2011. “Use of Array CGH to Detect Exonic Copy Number Variants throughout the Genome in Autism Families Detects a Novel Deletion in TMLHE.” Human Molecular Genetics 20 (22). Narnia: 4360–70. doi:10.1093/hmg/ddr363.
Champion, Kim M., James G. R. Gilbert, Fotios A. Asimakopoulos, Stephen Hinshelwood, and Anthony R. Green. 1997. “Clonal Haemopoiesis in Normal Elderly Women:

149
Implications for the Myeloproliferative Disorders and Myelodysplastic Syndromes.” British Journal of Haematology 97 (4). John Wiley & Sons, Ltd (10.1111): 920–26. doi:10.1046/j.1365-2141.1997.1933010.x.
Chartier-Harlin, Marie-Christine, Fiona Crawford, Henry Houlden, Andrew Warren, David Hughes, Liana Fidani, Alison Goate, et al. 1991. “Early-Onset Alzheimer’s Disease Caused by Mutations at Codon 717 of the β-Amyloid Precursor Protein Gene.” Nature 353 (6347). Nature Publishing Group: 844–46. doi:10.1038/353844a0.
Chaudhuri, Jayanta, Chan Khuong, and Frederick W. Alt. 2004. “Replication Protein A Interacts with AID to Promote Deamination of Somatic Hypermutation Targets.” Nature 430 (7003). Nature Publishing Group: 992–98. doi:10.1038/nature02821.
Check Hayden, Erika. 2014. “Technology: The $1,000 Genome.” Nature 507 (7492): 294–95. doi:10.1038/507294a.
Chen, Chiung-Mei, Yi-Chun Chen, Mu-Chun Chiang, Hon-Chung Fung, Kuo-Hsuan Chang, Guey-Jen Lee-Chen, and Yih-Ru Wu. 2016. “Association of GCH1 and MIR4697, but Not SIPA1L2 and VPS13C Polymorphisms, with Parkinson’s Disease in Taiwan.” Neurobiology of Aging 39 (March). Elsevier: 221.e1-221.e5. doi:10.1016/J.NEUROBIOLAGING.2015.12.016.
Chen, Jian-Min, Claude Férec, and David N. Cooper. 2006. “A Systematic Analysis of Disease-Associated Variants in the 3′ Regulatory Regions of Human Protein-Coding Genes II: The Importance of MRNA Secondary Structure in Assessing the Functionality of 3′ UTR Variants.” Human Genetics 120 (3). Springer-Verlag: 301–33. doi:10.1007/s00439-006-0218-x.
Chen, Lixin, Pingfang Liu, Thomas C Evans, and Laurence M Ettwiller. 2017. “DNA Damage Is a Pervasive Cause of Sequencing Errors, Directly Confounding Variant Identification.” Science (New York, N.Y.) 355 (6326). American Association for the Advancement of Science: 752–56. doi:10.1126/science.aai8690.
Chen, Rui, Hogune Im, and Michael Snyder. 2015. “Whole-Exome Enrichment with the Agilent SureSelect Human All Exon Platform.” Cold Spring Harbor Protocols 2015 (7). Cold Spring Harbor Laboratory Press: 626–33. doi:10.1101/pdb.prot083659.
Chiquoine, A D. 1954. “The Identification, Origin, and Migration of the Primordial Germ Cells in the Mouse Embryo.” The Anatomical Record 118 (2): 135–46. http://www.ncbi.nlm.nih.gov/pubmed/13138919.
Chorev, Michal, Alan Joseph Bekker, Jacob Goldberger, and Liran Carmel. 2017. “Identification of Introns Harboring Functional Sequence Elements through Positional Conservation.” Scientific Reports 7 (1). Nature Publishing Group: 4201. doi:10.1038/s41598-017-04476-0.
Chronister, William D., Ian E. Burbulis, Margaret B. Wierman, Matthew J. Wolpert, Mark F. Haakenson, Aiden C.B. Smith, Joel E. Kleinman, et al. 2019. “Neurons with Complex Karyotypes Are Rare in Aged Human Neocortex.” Cell Reports 26 (4). Cell Press: 825–835.e7. doi:10.1016/J.CELREP.2018.12.107.
Chuang, Yu-Hsuan, Kimberly C. Paul, Jeff M. Bronstein, Yvette Bordelon, Steve Horvath, and Beate Ritz. 2017. “Parkinson’s Disease Is Associated with DNA Methylation Levels in Human Blood and Saliva.” Genome Medicine 9 (1). BioMed Central: 76. doi:10.1186/s13073-017-0466-5.
Cibulskis, Kristian, Michael S Lawrence, Scott L Carter, Andrey Sivachenko, David Jaffe, Carrie Sougnez, Stacey Gabriel, Matthew Meyerson, Eric S Lander, and Gad Getz. 2013. “Sensitive Detection of Somatic Point Mutations in Impure and Heterogeneous Cancer Samples.” Nature Biotechnology 2013 31:3 31 (3). Nature Publishing Group: 213. doi:10.1038/nbt.2514.
Cingolani, Pablo, Viral M Patel, Melissa Coon, Tung Nguyen, Susan J Land, Douglas M Ruden, and Xiangyi Lu. 2012. “Using Drosophila Melanogaster as a Model for Genotoxic Chemical Mutational Studies with a New Program, SnpSift.” Frontiers in Genetics 3. Frontiers Media SA: 35. doi:10.3389/fgene.2012.00035.
150
Cingolani, Pablo, Adrian Platts, Le Lily Wang, Melissa Coon, Tung Nguyen, Luan Wang, Susan J. Land, Xiangyi Lu, and Douglas M. Ruden. 2012. “A Program for Annotating and Predicting the Effects of Single Nucleotide Polymorphisms, SnpEff.” Fly 6 (2): 80–92. doi:10.4161/fly.19695.
Clark, Robin Dawn, Dian Donnai, John Rogers, Jane Cooper, and Michael Baraitser. 1987. “Proteus Syndrome: An Expanded Phenotype.” American Journal of Medical Genetics 27 (1): 99–117. doi:10.1002/ajmg.1320270111.
Cognata, Valentina La, Giovanna Morello, Velia D’Agata, and Sebastiano Cavallaro. 2017. “Copy Number Variability in Parkinson’s Disease: Assembling the Puzzle through a Systems Biology Approach.” Human Genetics 136 (1). Springer Berlin Heidelberg: 13–37. doi:10.1007/s00439-016-1749-4.
Cornutiu, Gavril. 2015. “The Epidemiological Scale of Alzheimer’s Disease.” Journal of Clinical Medicine Research 7 (9). Elmer Press: 657–66. doi:10.14740/jocmr2106w.
Costello, Maura, Trevor J. Pugh, Timothy J. Fennell, Chip Stewart, Lee Lichtenstein, James C. Meldrim, Jennifer L. Fostel, et al. 2013. “Discovery and Characterization of Artifactual Mutations in Deep Coverage Targeted Capture Sequencing Data Due to Oxidative DNA Damage during Sample Preparation.” Nucleic Acids Research 41 (6). Narnia: e67–e67. doi:10.1093/nar/gks1443.
Coufal, Nicole G., José L. Garcia-Perez, Grace E. Peng, Gene W. Yeo, Yangling Mu, Michael T. Lovci, Maria Morell, K. Sue O’Shea, John V. Moran, and Fred H. Gage. 2009. “L1 Retrotransposition in Human Neural Progenitor Cells.” Nature 460 (7259). Nature Publishing Group: 1127–31. doi:10.1038/nature08248.
Cowley, Michael, and Rebecca J. Oakey. 2013. “Transposable Elements Re-Wire and Fine-Tune the Transcriptome.” Edited by Elizabeth M. C. Fisher. PLoS Genetics 9 (1). Public Library of Science: e1003234. doi:10.1371/journal.pgen.1003234.
Cremer, T., and C. Cremer. 2001. “Chromosome Territories, Nuclear Architecture and Gene Regulation in Mammalian Cells.” Nature Reviews Genetics 2 (4). Nature Publishing Group: 292–301. doi:10.1038/35066075.
Cross, J C, Z Werb, and S J Fisher. 1994. “Implantation and the Placenta: Key Pieces of the Development Puzzle.” Science (New York, N.Y.) 266 (5190). American Association for the Advancement of Science: 1508–18. doi:10.1126/SCIENCE.7985020.
D’haene, Barbara, Catia Attanasio, Diane Beysen, Josée Dostie, Edmond Lemire, Philippe Bouchard, Michael Field, et al. 2009. “Disease-Causing 7.4 Kb Cis-Regulatory Deletion Disrupting Conserved Non-Coding Sequences and Their Interaction with the FOXL2 Promotor: Implications for Mutation Screening.” Edited by Marshall S. Horwitz. PLoS Genetics 5 (6). Public Library of Science: e1000522. doi:10.1371/journal.pgen.1000522.
Davie, C A. 2019. “A Review of Parkinson’s Disease.” Accessed April 18. doi:10.1093/bmb/ldn013.
Dawbarn, D., and S. J. Allen. 2003. “Neurotrophins and Neurodegeneration.” Neuropathology and Applied Neurobiology 29 (3). John Wiley & Sons, Ltd (10.1111): 211–30. doi:10.1046/j.1365-2990.2003.00487.x.
Dean, F B, J R Nelson, T L Giesler, and R S Lasken. 2001. “Rapid Amplification of Plasmid and Phage DNA Using Phi 29 DNA Polymerase and Multiply-Primed Rolling Circle Amplification.” Genome Research 11 (6). Cold Spring Harbor Laboratory Press: 1095–99. doi:10.1101/gr.180501.
Dekker, Job, Karsten Rippe, Martijn Dekker, and Nancy Kleckner. 2002. “Capturing Chromosome Conformation.” Science (New York, N.Y.) 295 (5558). American Association for the Advancement of Science: 1306–11. doi:10.1126/science.1067799.
Deng, Lian, and Shuhua Xu. 2018. “Adaptation of Human Skin Color in Various Populations.” Hereditas 155 (1). BioMed Central: 1. doi:10.1186/s41065-017-

151
0036-2. Denissenko, Mikhail F., Annie Pao, Moon-shong Tang, and Gerd P. Pfeifer. 1996.
“Preferential Formation of Benzo[a]Pyrene Adducts at Lung Cancer Mutational Hotspots in P53.” Science 274 (5286). American Association for the Advancement of Science: 430–32. doi:10.1126/SCIENCE.274.5286.430.
DePristo, Mark A, Eric Banks, Ryan Poplin, Kiran V Garimella, Jared R Maguire, Christopher Hartl, Anthony A Philippakis, et al. 2011. “A Framework for Variation Discovery and Genotyping Using Next-Generation DNA Sequencing Data.” Nature Genetics 43 (5). Nature Publishing Group: 491–98. doi:10.1038/ng.806.
Dijk, Karin D. van, Henk W. Berendse, Benjamin Drukarch, Silvina A. Fratantoni, Thang V. Pham, Sander R. Piersma, Evelien Huisman, et al. 2012. “The Proteome of the Locus Ceruleus in Parkinson’s Disease: Relevance to Pathogenesis.” Brain Pathology 22 (4). John Wiley & Sons, Ltd (10.1111): 485–98. doi:10.1111/j.1750-3639.2011.00540.x.
Dixon, Jesse R., Siddarth Selvaraj, Feng Yue, Audrey Kim, Yan Li, Yin Shen, Ming Hu, Jun S. Liu, and Bing Ren. 2012. “Topological Domains in Mammalian Genomes Identified by Analysis of Chromatin Interactions.” Nature 485 (7398). Nature Publishing Group: 376–80. doi:10.1038/nature11082.
Do, Chuong B., Joyce Y. Tung, Elizabeth Dorfman, Amy K. Kiefer, Emily M. Drabant, Uta Francke, Joanna L. Mountain, et al. 2011. “Web-Based Genome-Wide Association Study Identifies Two Novel Loci and a Substantial Genetic Component for Parkinson’s Disease.” Edited by Greg Gibson. PLoS Genetics 7 (6). Public Library of Science: e1002141. doi:10.1371/journal.pgen.1002141.
Dong, Xiao, Lei Zhang, Brandon Milholland, Moonsook Lee, Alexander Y Maslov, Tao Wang, and Jan Vijg. 2017. “Accurate Identification of Single-Nucleotide Variants in Whole-Genome-Amplified Single Cells.” Nature Methods 14 (5). Nature Publishing Group: 491–93. doi:10.1038/nmeth.4227.
Doolittle, W. Ford, and Carmen Sapienza. 1980. “Selfish Genes, the Phenotype Paradigm and Genome Evolution.” Nature 284 (5757). Nature Publishing Group: 601–3. doi:10.1038/284601a0.
Dou, Yanmei, Xiaoxu Yang, Ziyi Li, Sheng Wang, Zheng Zhang, Adam Yongxin Ye, Linlin Yan, et al. 2017. “Postzygotic Single-Nucleotide Mosaicisms Contribute to the Etiology of Autism Spectrum Disorder and Autistic Traits and the Origin of Mutations.” Human Mutation 38 (8). Wiley-Blackwell: 1002–13. doi:10.1002/humu.23255.
Ducibella, Thomas, and Everett Anderson. 1975. “Cell Shape and Membrane Changes in the Eight-Cell Mouse Embryo: Prerequisites for Morphogenesis of the Blastocyst.” Developmental Biology 47 (1). Academic Press: 45–58. doi:10.1016/0012-1606(75)90262-6.
Durbin, Richard M., David L. Altshuler, Richard M. Durbin, Gonçalo R. Abecasis, David R. Bentley, Aravinda Chakravarti, Andrew G. Clark, et al. 2010. “A Map of Human Genome Variation from Population-Scale Sequencing.” Nature 467 (7319): 1061–73. doi:10.1038/nature09534.
Duvoisin, R C. 1996. “Recent Advances in the Genetics of Parkinson’s Disease.” Advances in Neurology 69: 33–40. http://www.ncbi.nlm.nih.gov/pubmed/8615148.
Ehringer, H., and O. Hornykiewicz. 1960. “Verteilung Von Noradrenalin Und Dopamin (3-Hydroxytyramin) Im Gehirn Des Menschen Und Ihr Verhalten Bei Erkrankungen Des Extrapyramidalen Systems.” Klinische Wochenschrift 38 (24). Springer-Verlag: 1236–39. doi:10.1007/BF01485901.
Elowitz, Michael B, Arnold J Levine, Eric D Siggia, and Peter S Swain. 2002. “Stochastic Gene Expression in a Single Cell.” Science (New York, N.Y.) 297 (5584). American Association for the Advancement of Science: 1183–86. doi:10.1126/science.1070919.

152
Elstner, Matthias, Christopher M. Morris, Katharina Heim, Peter Lichtner, Andreas Bender, Divya Mehta, Claudia Schulte, et al. 2009. “Single-Cell Expression Profiling of Dopaminergic Neurons Combined with Association Analysis Identifies Pyridoxal Kinase as Parkinson’s Disease Gene.” Annals of Neurology 66 (6). John Wiley & Sons, Ltd: 792–98. doi:10.1002/ana.21780.
Enders, Allen C., and Sandra Schlafke. 1969. “Cytological Aspects of Trophoblast-Uterine Interaction in Early Implantation.” American Journal of Anatomy 125 (1). John Wiley & Sons, Ltd: 1–29. doi:10.1002/aja.1001250102.
Ernst, Jason, Pouya Kheradpour, Tarjei S. Mikkelsen, Noam Shoresh, Lucas D. Ward, Charles B. Epstein, Xiaolan Zhang, et al. 2011. “Mapping and Analysis of Chromatin State Dynamics in Nine Human Cell Types.” Nature 473 (7345). Nature Publishing Group: 43–49. doi:10.1038/nature09906.
Ezkurdia, Iakes, David Juan, Jose Manuel Rodriguez, Adam Frankish, Mark Diekhans, Jennifer Harrow, Jesus Vazquez, Alfonso Valencia, and Michael L. Tress. 2014. “Multiple Evidence Strands Suggest That There May Be as Few as 19 000 Human Protein-Coding Genes.” Human Molecular Genetics 23 (22). Narnia: 5866–78. doi:10.1093/hmg/ddu309.
Fan, Hao, and Jia-You Chu. 2007. “A Brief Review of Short Tandem Repeat Mutation.” Genomics, Proteomics & Bioinformatics 5 (1). Elsevier: 7. doi:10.1016/S1672-0229(07)60009-6.
Federoff, Monica, Belen Jimenez-Rolando, Michael A. Nalls, and Andrew B. Singleton. 2012. “A Large Study Reveals No Association between APOE and Parkinson’s Disease.” Neurobiology of Disease 46 (2). Academic Press: 389–92. doi:10.1016/J.NBD.2012.02.002.
Feng, Jianchi, Chunming Bi, Brian S Clark, Rina Mady, Palak Shah, and Jhumku D Kohtz. 2006. “The Evf-2 Noncoding RNA Is Transcribed from the Dlx-5/6 Ultraconserved Region and Functions as a Dlx-2 Transcriptional Coactivator.” Genes & Development 20 (11). Cold Spring Harbor Laboratory Press: 1470–84. doi:10.1101/gad.1416106.
Ferese, Rosangela, Nicola Modugno, Rosa Campopiano, Marco Santilli, Stefania Zampatti, Emiliano Giardina, Annamaria Nardone, et al. 2015. “Four Copies of SNCA Responsible for Autosomal Dominant Parkinson’s Disease in Two Italian Siblings.” Parkinson’s Disease 2015 (November). Hindawi: 1–6. doi:10.1155/2015/546462.
Ferrer, Isidro, Conxita Marín, Ma Jesús Rey, Teresa Ribalta, Esther Goutan, Rosa Blanco, Eduard Tolosa, and Eulalia Martí. 1999. “BDNF and Full-Length and Truncated TrkB Expression in Alzheimer Disease. Implications in Therapeutic Strategies.” Journal of Neuropathology and Experimental Neurology 58 (7). Narnia: 729–39. doi:10.1097/00005072-199907000-00007.
Flatz, G. 1984. “Gene-Dosage Effect on Intestinal Lactase Activity Demonstrated in Vivo.” American Journal of Human Genetics 36 (2). Elsevier: 306–10. http://www.ncbi.nlm.nih.gov/pubmed/6424439.
Franklin, Rosalind E., and R. G. Gosling. 1953. “Molecular Configuration in Sodium Thymonucleate.” Nature 171 (4356). Nature Publishing Group: 740–41. doi:10.1038/171740a0.
Friend, Stephen H., Rene Bernards, Snezna Rogelj, Robert A. Weinberg, Joyce M. Rapaport, Daniel M. Albert, and Thaddeus P. Dryja. 1986. “A Human DNA Segment with Properties of the Gene That Predisposes to Retinoblastoma and Osteosarcoma.” Nature 323 (6089): 643–46. doi:10.1038/323643a0.
Frigola, Joan, Radhakrishnan Sabarinathan, Loris Mularoni, Ferran Muiños, Abel Gonzalez-Perez, and Núria López-Bigas. 2017. “Reduced Mutation Rate in Exons Due to Differential Mismatch Repair.” Nature Genetics 49 (12). Nature Publishing Group: 1684–92. doi:10.1038/ng.3991.

153
Fromer, Menachem, Jennifer L. Moran, Kimberly Chambert, Eric Banks, Sarah E. Bergen, Douglas M. Ruderfer, Robert E. Handsaker, et al. 2012a. “Discovery and Statistical Genotyping of Copy-Number Variation from Whole-Exome Sequencing Depth.” The American Journal of Human Genetics 91 (4). Cell Press: 597–607. doi:10.1016/J.AJHG.2012.08.005.
———. 2012b. “Discovery and Statistical Genotyping of Copy-Number Variation from Whole-Exome Sequencing Depth.” The American Journal of Human Genetics 91 (4). Cell Press: 597–607. doi:10.1016/J.AJHG.2012.08.005.
Frumkin, Dan, Adam Wasserstrom, Shai Kaplan, Uriel Feige, and Ehud Shapiro. 2005. “Genomic Variability within an Organism Exposes Its Cell Lineage Tree.” PLoS Computational Biology 1 (5). Public Library of Science: e50. doi:10.1371/journal.pcbi.0010050.
Gao, Li, Chao Li, Ran-Yao Yang, Wen-Wen Lian, Jian-Song Fang, Xiao-Cong Pang, Xue-Mei Qin, Ai-Lin Liu, and Guan-Hua Du. 2015. “Ameliorative Effects of Baicalein in MPTP-Induced Mouse Model of Parkinson’s Disease: A Microarray Study.” Pharmacology Biochemistry and Behavior 133 (June). Elsevier: 155–63. doi:10.1016/J.PBB.2015.04.004.
Gao, Ziyue, Priya Moorjani, Thomas Sasani, Brent Pedersen, Aaron Quinlan, Lynn Jorde, Guy Amster, and Molly Przeworski. 2018. “Overlooked Roles of DNA Damage and Maternal Age in Generating Human Germline Mutations.” BioRxiv, October. Cold Spring Harbor Laboratory, 327098. doi:10.1101/327098.
García Ruiz, P J. 2004. “[Prehistory of Parkinson’s Disease] Prehistoria de La Enfermedad de Parkinson.” Neurología (Barcelona, Spain) 19 (10): 735–37. http://www.ncbi.nlm.nih.gov/pubmed/15568171.
Gartler, S M, and U Francke. 1975. “Half Chromatid Mutations: Transmission in Humans?” American Journal of Human Genetics 27 (2). Elsevier: 218–23. http://www.ncbi.nlm.nih.gov/pubmed/1124765.
Gerlinger, Marco, Andrew J. Rowan, Stuart Horswell, James Larkin, David Endesfelder, Eva Gronroos, Pierre Martinez, et al. 2012. “Intratumor Heterogeneity and Branched Evolution Revealed by Multiregion Sequencing.” New England Journal of Medicine 366 (10). Massachusetts Medical Society : 883–92. doi:10.1056/NEJMoa1113205.
Gibbs, Richard A., Eric Boerwinkle, Harsha Doddapaneni, Yi Han, Viktoriya Korchina, Christie Kovar, Sandra Lee, et al. 2015. “A Global Reference for Human Genetic Variation.” Nature 526 (7571). Nature Publishing Group: 68–74. doi:10.1038/nature15393.
Gleeson, J G, S Minnerath, R I Kuzniecky, W B Dobyns, I D Young, M E Ross, and C A Walsh. 2000. “Somatic and Germline Mosaic Mutations in the Doublecortin Gene Are Associated with Variable Phenotypes.” American Journal of Human Genetics 67 (3). Elsevier: 574–81. doi:10.1086/303043.
Goate, Alison, Marie-Christine Chartier-Harlin, Mike Mullan, Jeremy Brown, Fiona Crawford, Liana Fidani, Luis Giuffra, et al. 1991. “Segregation of a Missense Mutation in the Amyloid Precursor Protein Gene with Familial Alzheimer’s Disease.” Nature 349 (6311). Nature Publishing Group: 704–6. doi:10.1038/349704a0.
Gonzalez-Perez, Abel, Radhakrishnan Sabarinathan, and Nuria Lopez-Bigas. 2019. “Local Determinants of the Mutational Landscape of the Human Genome.” Cell 177 (1). Cell Press: 101–14. doi:10.1016/J.CELL.2019.02.051.
González, Josefa, Talia L. Karasov, Philipp W. Messer, and Dmitri A. Petrov. 2010. “Genome-Wide Patterns of Adaptation to Temperate Environments Associated with Transposable Elements in Drosophila.” Edited by Harmit S. Malik. PLoS Genetics 6 (4). Public Library of Science: e1000905. doi:10.1371/journal.pgen.1000905.
Goode, David L, Sally M Hunter, Maria A Doyle, Tao Ma, Simone M Rowley, David Choong, Georgina L Ryland, and Ian G Campbell. 2013. “A Simple Consensus

154
Approach Improves Somatic Mutation Prediction Accuracy.” Genome Medicine 5 (9). BioMed Central: 90. doi:10.1186/gm494.
Grondin, Richard, Zhiming Zhang, Ai Yi, Wayne A. Cass, Navin Maswood, Anders H. Andersen, Dennis D. Elsberry, Michael C. Klein, Greg A. Gerhardt, and Don M. Gash. 2002. “Chronic, Controlled GDNF Infusion Promotes Structural and Functional Recovery in Advanced Parkinsonian Monkeys.” Brain 125 (10). Narnia: 2191–2201. doi:10.1093/brain/awf234.
Gu, Wenli, Feng Zhang, and James R Lupski. 2008. “Mechanisms for Human Genomic Rearrangements.” PathoGenetics 1 (1): 4. doi:10.1186/1755-8417-1-4.
Gudbjartsson, Daniel F, G Bragi Walters, Gudmar Thorleifsson, Hreinn Stefansson, Bjarni V Halldorsson, Pasha Zusmanovich, Patrick Sulem, et al. 2008. “Many Sequence Variants Affecting Diversity of Adult Human Height.” Nature Genetics 40 (5). Nature Publishing Group: 609–15. doi:10.1038/ng.122.
Guella, Ilaria, Rosanna Asselta, Silvana Tesei, Michela Zini, Gianni Pezzoli, and Stefano Duga. 2010. “The PDXK Rs2010795 Variant Is Not Associated with Parkinson Disease in Italy.” Annals of Neurology 67 (3). John Wiley & Sons, Ltd: 411–12. doi:10.1002/ana.21964.
Guo, Yan, Jiang Li, Chung-I Li, Jirong Long, David C Samuels, and Yu Shyr. 2012. “The Effect of Strand Bias in Illumina Short-Read Sequencing Data.” BMC Genomics 13 (1). BioMed Central: 666. doi:10.1186/1471-2164-13-666.
Gymrek, Melissa, David Golan, Saharon Rosset, and Yaniv Erlich. 2012. “LobSTR: A Short Tandem Repeat Profiler for Personal Genomes.” Genome Research 22 (6). Cold Spring Harbor Laboratory Press: 1154–62. doi:10.1101/gr.135780.111.
Haber, Daniel A., and Jeff Settleman. 2007. “Drivers and Passengers.” Nature 446 (7132). Nature Publishing Group: 145–46. doi:10.1038/446145a.
Haber, James E. 1999. “DNA Recombination: The Replication Connection.” Trends in Biochemical Sciences 24 (7). Elsevier Current Trends: 271–75. doi:10.1016/S0968-0004(99)01413-9.
Hall, J G. 1988. “Review and Hypotheses: Somatic Mosaicism: Observations Related to Clinical Genetics.” American Journal of Human Genetics 43 (4). Elsevier: 355–63. http://www.ncbi.nlm.nih.gov/pubmed/3052049.
Hamilton, A J, and D C Baulcombe. 1999. “A Species of Small Antisense RNA in Posttranscriptional Gene Silencing in Plants.” Science (New York, N.Y.) 286 (5441): 950–52. http://www.ncbi.nlm.nih.gov/pubmed/10542148.
Hancks, Dustin C., and Haig H. Kazazian. 2016. “Roles for Retrotransposon Insertions in Human Disease.” Mobile DNA 7 (1). BioMed Central: 9. doi:10.1186/s13100-016-0065-9.
Happle, R. 1986a. “The McCune-Albright Syndrome: A Lethal Gene Surviving by Mosaicism.” Clinical Genetics 29 (4): 321–24. doi:10.1111/j.1399-0004.1986.tb01261.x.
Happle, R. 1985. “Lyonization and the Lines of Blaschko.” Human Genetics 70 (3): 200–206. http://www.ncbi.nlm.nih.gov/pubmed/3894210.
———. 1986b. “Cutaneous Manifestation of Lethal Genes.” Human Genetics 72 (3): 280. http://www.ncbi.nlm.nih.gov/pubmed/3957353.
Hardy, John A., and Gerald A. Higgins. 1992. “Alzheimer’s Disease: The Amyloid Cascade Hypothesis.” Science 256 (5054). American Association for the Advancement of Science: 184–86. https://go.galegroup.com/ps/anonymous?id=GALE%7CA12207965&sid=googleScholar&v=2.1&it=r&linkaccess=abs&issn=00368075&p=HRCA&sw=w.
Hardy, Kathy, and Philip John Hardy. 2015. “1(St) Trimester Miscarriage: Four Decades of Study.” Translational Pediatrics 4 (2). AME Publications: 189–200. doi:10.3978/j.issn.2224-4336.2015.03.05.
Harst, Pim van der, Leon J. de Windt, and John C. Chambers. 2017. “Translational

155
Perspective on Epigenetics in Cardiovascular Disease.” Journal of the American College of Cardiology 70 (5). Journal of the American College of Cardiology: 590–606. doi:10.1016/j.jacc.2017.05.067.
Hazen, Jennifer L., Gregory G. Faust, Alberto R. Rodriguez, William C. Ferguson, Svetlana Shumilina, Royden A. Clark, Michael J. Boland, et al. 2016. “The Complete Genome Sequences, Unique Mutational Spectra, and Developmental Potency of Adult Neurons Revealed by Cloning.” Neuron 89 (6). Elsevier: 1223–36. doi:10.1016/J.NEURON.2016.02.004.
Heckman, Michael G., Koji Kasanuki, Nancy N. Diehl, Shunsuke Koga, Alexandra Soto, Melissa E. Murray, Dennis W. Dickson, and Owen A. Ross. 2017. “Parkinson’s Disease Susceptibility Variants and Severity of Lewy Body Pathology.” Parkinsonism & Related Disorders 44 (November). Elsevier: 79–84. doi:10.1016/J.PARKRELDIS.2017.09.009.
Hegarty, Shane V., Sean L. Wyatt, Laura Howard, Elke Stappers, Danny Huylebroeck, Aideen M. Sullivan, and Gerard W. O’Keeffe. 2017. “Zeb2 Is a Negative Regulator of Midbrain Dopaminergic Axon Growth and Target Innervation.” Scientific Reports 7 (1). Nature Publishing Group: 8568. doi:10.1038/s41598-017-08900-3.
Heisler, Frank F., Han Kyu Lee, Kira V. Gromova, Yvonne Pechmann, Beate Schurek, Laura Ruschkies, Markus Schroeder, Michaela Schweizer, and Matthias Kneussel. 2014. “GRIP1 Interlinks N-Cadherin and AMPA Receptors at Vesicles to Promote Combined Cargo Transport into Dendrites.” Proceedings of the National Academy of Sciences 111 (13): 5030–35. doi:10.1073/pnas.1304301111.
Hiom, Kevin. 1999. “DNA Repair: Rad52 – the Means to an End.” Current Biology 9 (12). Cell Press: R446–48. doi:10.1016/S0960-9822(99)80278-4.
Hirokawa, Nobutaka, Yasuko Noda, Yosuke Tanaka, and Shinsuke Niwa. 2009. “Kinesin Superfamily Motor Proteins and Intracellular Transport.” Nature Reviews Molecular Cell Biology 10 (10). Nature Publishing Group: 682–96. doi:10.1038/nrm2774.
Ho Kim, Jae, Julien Franck, Taewook Kang, Helmut Heinsen, Rivka Ravid, Isidro Ferrer, Mi Hee Cheon, et al. 2015. “Proteome-Wide Characterization of Signalling Interactions in the Hippocampal CA4/DG Subfield of Patients with Alzheimer’s Disease.” Scientific Reports 5 (1). Nature Publishing Group: 11138. doi:10.1038/srep11138.
Hodgkinson, Alan, Ying Chen, and Adam Eyre-Walker. 2012. “The Large-Scale Distribution of Somatic Mutations in Cancer Genomes.” Human Mutation 33 (1). John Wiley & Sons, Ltd: 136–43. doi:10.1002/humu.21616.
Hodgson, Graeme, Jeffrey H. Hager, Stas Volik, Sujatmi Hariono, Meredith Wernick, Dan Moore, Donna G. Albertson, et al. 2001. “Genome Scanning with Array CGH Delineates Regional Alterations in Mouse Islet Carcinomas.” Nature Genetics 29 (4). Nature Publishing Group: 459–64. doi:10.1038/ng771.
Hoehn, M. M., and M. D. Yahr. 1967. “Parkinsonism: Onset, Progression, and Mortality.” Neurology 17 (5): 427–427. doi:10.1212/WNL.17.5.427.
Holman, C. D. J., B. K. Armstrong, P. J. Heenan, J. B. Blackwell, F. J. Cumming, D. R. English, S. Holland, et al. 1986. “The Causes of Malignant Melanoma: Results from the West Australian Lions Melanoma Research Project.” In , 18–37. Springer, Berlin, Heidelberg. doi:10.1007/978-3-642-82641-2_3.
Holmqvist, Mats H, Jie Cao, Ricardo Hernandez-Pineda, Michael D Jacobson, Karen I Carroll, M Amy Sung, Maria Betty, et al. 2002. “Elimination of Fast Inactivation in Kv4 A-Type Potassium Channels by an Auxiliary Subunit Domain.” Proceedings of the National Academy of Sciences of the United States of America 99 (2). National Academy of Sciences: 1035–40. doi:10.1073/pnas.022509299.
Holtz, P. 1939. “Dopadecarboxylase.” Die Naturwissenschaften 27 (43). Springer-Verlag: 724–25. doi:10.1007/BF01494245.
Hoogendijk, J E, G W Hensels, A A Gabreëls-Festen, F J Gabreëls, E A Janssen, P de

156
Jonghe, J J Martin, C van Broeckhoven, L J Valentijn, and F Baas. 1992. “De-Novo Mutation in Hereditary Motor and Sensory Neuropathy Type I.” Lancet (London, England) 339 (8801): 1081–82. http://www.ncbi.nlm.nih.gov/pubmed/1349106.
Horai, Makiko, Hiroyuki Mishima, Chisa Hayashida, Akira Kinoshita, Yoshibumi Nakane, Tatsuki Matsuo, Kazuto Tsuruda, et al. 2018. “Detection of de Novo Single Nucleotide Variants in Offspring of Atomic-Bomb Survivors Close to the Hypocenter by Whole-Genome Sequencing.” Journal of Human Genetics 63 (3): 357–63. doi:10.1038/s10038-017-0392-9.
Houtgraaf, Jaco H., Jorie Versmissen, and Wim J. van der Giessen. 2006. “A Concise Review of DNA Damage Checkpoints and Repair in Mammalian Cells.” Cardiovascular Revascularization Medicine 7 (3). Elsevier: 165–72. doi:10.1016/J.CARREV.2006.02.002.
Hsia, A Y, E Masliah, L McConlogue, G Q Yu, G Tatsuno, K Hu, D Kholodenko, R C Malenka, R A Nicoll, and L Mucke. 1999. “Plaque-Independent Disruption of Neural Circuits in Alzheimer’s Disease Mouse Models.” Proceedings of the National Academy of Sciences of the United States of America 96 (6). National Academy of Sciences: 3228–33. doi:10.1073/PNAS.96.6.3228.
Huang, August Yue, Zheng Zhang, Adam Yongxin Ye, Yanmei Dou, Linlin Yan, Xiaoxu Yang, Yuehua Zhang, and Liping Wei. 2017. “MosaicHunter: Accurate Detection of Postzygotic Single-Nucleotide Mosaicism through next-Generation Sequencing of Unpaired, Trio, and Paired Samples.” Nucleic Acids Research 45 (10). Oxford University Press: e76. doi:10.1093/nar/gkx024.
Huang, X., P. C. Chen, and C. Poole. 2004. “APOE- 2 Allele Associated with Higher Prevalence of Sporadic Parkinson Disease.” Neurology 62 (12): 2198–2202. doi:10.1212/01.WNL.0000130159.28215.6A.
Hunt, Sarah E, William McLaren, Laurent Gil, Anja Thormann, Helen Schuilenburg, Dan Sheppard, Andrew Parton, et al. 2018. “Ensembl Variation Resources.” Database : The Journal of Biological Databases and Curation 2018. Oxford University Press. doi:10.1093/database/bay119.
Inoue, Ken, Ken Dewar, Nicholas Katsanis, Lawrence T. Reiter, Eric S. Lander, Keri L. Devon, Dudley W. Wyman, James R. Lupski, and Bruce Birren. 2001. “The 1.4-Mb CMT1A Duplication/HNPP Deletion Genomic Region Reveals Unique Genome Architectural Features and Provides Insights into the Recent Evolution of New Genes.” Genome Research 11 (6). Cold Spring Harbor Laboratory Press: 1018–33. doi:10.1101/GR.180401.
International Human Genome Sequencing Consortium. 2001. “Initial Sequencing and Analysis of the Human Genome.” Nature 409 (6822). Nature Publishing Group: 860–921. doi:10.1038/35057062.
International Parkinson Disease Genomics Consortium. 2011. “Imputation of Sequence Variants for Identification of Genetic Risks for Parkinson’s Disease: A Meta-Analysis of Genome-Wide Association Studies.” The Lancet 377 (9766). Elsevier: 641–49. doi:10.1016/S0140-6736(10)62345-8.
International Parkinson Disease Genomics Consortium, and Wellcome Trust Case Control Consortium 2. 2011. “A Two-Stage Meta-Analysis Identifies Several New Loci for Parkinson’s Disease.” Edited by Greg Gibson. PLoS Genetics 7 (6). Public Library of Science: e1002142. doi:10.1371/journal.pgen.1002142.
Jellinger, Kurt A. 2009. “A Critical Evaluation of Current Staging of α-Synuclein Pathology in Lewy Body Disorders.” Biochimica et Biophysica Acta (BBA) - Molecular Basis of Disease 1792 (7). Elsevier: 730–40. doi:10.1016/J.BBADIS.2008.07.006.
Jinn, Sarah, Robert E. Drolet, Paige E. Cramer, Andus Hon-Kit Wong, Dawn M. Toolan, Cheryl A. Gretzula, Bhavya Voleti, et al. 2017. “TMEM175 Deficiency Impairs Lysosomal and Mitochondrial Function and Increases α-Synuclein Aggregation.” Proceedings of the National Academy of Sciences 114 (9). National Academy of

157
Sciences: 2389–94. doi:10.1073/PNAS.1616332114. Jónsson, Hákon, Patrick Sulem, Birte Kehr, Snaedis Kristmundsdottir, Florian Zink, Eirikur
Hjartarson, Marteinn T. Hardarson, et al. 2017. “Parental Influence on Human Germline de Novo Mutations in 1,548 Trios from Iceland.” Nature 549 (7673). Nature Publishing Group: 519–22. doi:10.1038/nature24018.
Ju, Young Seok, Inigo Martincorena, Moritz Gerstung, Mia Petljak, Ludmil B. Alexandrov, Raheleh Rahbari, David C. Wedge, et al. 2017. “Somatic Mutations Reveal Asymmetric Cellular Dynamics in the Early Human Embryo.” Nature 543 (7647). Nature Publishing Group: 714–18. doi:10.1038/nature21703.
Kallioniemi, A, O P Kallioniemi, D Sudar, D Rutovitz, J W Gray, F Waldman, and D Pinkel. 1992. “Comparative Genomic Hybridization for Molecular Cytogenetic Analysis of Solid Tumors.” Science (New York, N.Y.) 258 (5083). American Association for the Advancement of Science: 818–21. doi:10.1126/SCIENCE.1359641.
Karolchik, D., Angela S Hinrichs, Terrence S Furey, Krishna M Roskin, Charles W Sugnet, David Haussler, and W James Kent. 2004. “The UCSC Table Browser Data Retrieval Tool.” Nucleic Acids Research 32 (90001): 493D–496. doi:10.1093/nar/gkh103.
Karran, Peter. 2000. “DNA Double Strand Break Repair in Mammalian Cells.” Current Opinion in Genetics & Development 10 (2). Elsevier Current Trends: 144–50. doi:10.1016/S0959-437X(00)00069-1.
Kasuga, K, T Shimohata, A Nishimura, A Shiga, T Mizuguchi, J Tokunaga, T Ohno, et al. 2009. “Identification of Independent APP Locus Duplication in Japanese Patients with Early-Onset Alzheimer Disease.” Journal of Neurology, Neurosurgery, and Psychiatry 80 (9). BMJ Publishing Group Ltd: 1050–52. doi:10.1136/jnnp.2008.161703.
Kato, T, T Todo, H Ayaki, K Ishizaki, T Morita, S Mitra, and M Ikenaga. 1994. “Cloning of a Marsupial DNA Photolyase Gene and the Lack of Related Nucleotide Sequences in Placental Mammals.” Nucleic Acids Research 22 (20): 4119–24. http://www.ncbi.nlm.nih.gov/pubmed/7937136.
Kedmi, Merav, Anat Bar-Shira, Tanya Gurevich, Nir Giladi, and Avi Orr-Urtreger. 2011. “Decreased Expression of B Cell Related Genes in Leukocytes of Women with Parkinson’s Disease.” Molecular Neurodegeneration 6 (1). BioMed Central: 66. doi:10.1186/1750-1326-6-66.
Keller, M. F., M. Saad, J. Bras, F. Bettella, N. Nicolaou, J. Simon-Sanchez, F. Mittag, et al. 2012. “Using Genome-Wide Complex Trait Analysis to Quantify ‘missing Heritability’ in Parkinson’s Disease.” Human Molecular Genetics 21 (22). Narnia: 4996–5009. doi:10.1093/hmg/dds335.
Kelly, S. J., J. G. Mulnard, and C. F. Graham. 1978. “Cell Division and Cell Allocation in Early Mouse Development.” Development 48 (1).
Khan Academy. 2019. “Base and Nucleotide Excision Repair.” https://www.khanacademy.org/science/biology/dna-as-the-genetic-material/dna-replication/a/dna-proofreading-and-repair.
Kim, J.-M., K.-H. Lee, Y.-J. Jeon, J.-H. Oh, S.-Y. Jeong, I.-S. Song, J.-M. Kim, D.-S. Lee, and N.-S. Kim. 2006. “Identification of Genes Related to Parkinson’s Disease Using Expressed Sequence Tags.” DNA Research 13 (6). Narnia: 275–86. doi:10.1093/dnares/dsl016.
Kim, Junho, Dachan Kim, Jae Seok Lim, Ju Heon Maeng, Hyeonju Son, Hoon-Chul Kang, Hojung Nam, Jeong Ho Lee, and Sangwoo Kim. 2019. “The Use of Technical Replication for Detection of Low-Level Somatic Mutations in next-Generation Sequencing.” Nature Communications 10 (1). Nature Publishing Group: 1047. doi:10.1038/s41467-019-09026-y.
Kim, Tae-Kyung, Martin Hemberg, Jesse M. Gray, Allen M. Costa, Daniel M. Bear, Jing Wu, David A. Harmin, et al. 2010. “Widespread Transcription at Neuronal Activity-

158
Regulated Enhancers.” Nature 465 (7295). Nature Publishing Group: 182–87. doi:10.1038/nature09033.
King, Daniel A, Alejandro Sifrim, Tomas W Fitzgerald, Raheleh Rahbari, Emma Hobson, Tessa Homfray, Sahar Mansour, et al. 2017. “Detection of Structural Mosaicism from Targeted and Whole-Genome Sequencing Data.” Genome Research 27 (10). Cold Spring Harbor Laboratory Press: 1704–14. doi:10.1101/gr.212373.116.
King, M. C., A. C. Wilson, Eric Rynes, Robert E. Thurman, Eric Haugen, Hao Wang, Alex P. Reynolds, et al. 2012. “Evolution at Two Levels in Humans and Chimpanzees.” Science 188 (4184). American Association for the Advancement of Science: 107–16. doi:10.1126/science.1090005.
Kirk, Isa Kristina, Nils Weinhold, Kirstine Belling, Niels Erik Skakkebæk, Thomas Skøt Jensen, Henrik Leffers, Anders Juul, and Søren Brunak. 2017. “Chromosome-Wise Protein Interaction Patterns and Their Impact on Functional Implications of Large-Scale Genomic Aberrations.” Cell Systems 4 (3). Cell Press: 357–364.e3. doi:10.1016/J.CELS.2017.01.001.
Kitada, Tohru, Shuichi Asakawa, Nobutaka Hattori, Hiroto Matsumine, Yasuhiro Yamamura, Shinsei Minoshima, Masayuki Yokochi, Yoshikuni Mizuno, and Nobuyoshi Shimizu. 1998. “Mutations in the Parkin Gene Cause Autosomal Recessive Juvenile Parkinsonism.” Nature 392 (6676). Nature Publishing Group: 605–8. doi:10.1038/33416.
Kitzman, Jacob O. 2016. “Haplotypes Drop by Drop.” Nature Biotechnology 34 (3). Nature Publishing Group: 296–98. doi:10.1038/nbt.3500.
Kliman, Harvey Jon. 2000. “Uteroplacental Blood Flow.” The American Journal of Pathology 157 (6): 1759–68. doi:10.1016/S0002-9440(10)64813-4.
Knudson, A G, and Jr. 1971. “Mutation and Cancer: Statistical Study of Retinoblastoma.” Proceedings of the National Academy of Sciences of the United States of America 68 (4). National Academy of Sciences: 820–23. http://www.ncbi.nlm.nih.gov/pubmed/5279523.
Koboldt, D. C., Q. Zhang, D. E. Larson, D. Shen, M. D. McLellan, L. Lin, C. A. Miller, E. R. Mardis, L. Ding, and R. K. Wilson. 2012. “VarScan 2: Somatic Mutation and Copy Number Alteration Discovery in Cancer by Exome Sequencing.” Genome Research 22 (3): 568–76. doi:10.1101/gr.129684.111.
Kohlhammer, Holger, Carsten Schwaenen, Swen Wessendorf, Karlheinz Holzmann, Hans A Kestler, Dirk Kienle, Thomas F E Barth, et al. 2004. “Genomic DNA-Chip Hybridization in t(11;14)-Positive Mantle Cell Lymphomas Shows a High Frequency of Aberrations and Allows a Refined Characterization of Consensus Regions.” Blood 104 (3). American Society of Hematology: 795–801. doi:10.1182/blood-2003-12-4175.
Koller, W, B Vetere-Overfield, C Gray, C Alexander, T Chin, J Dolezal, R Hassanein, and C Tanner. 1990. “Environmental Risk Factors in Parkinson’s Disease.” Neurology 40 (8). Wolters Kluwer Health, Inc. on behalf of the American Academy of Neurology: 1218–21. doi:10.1212/wnl.0b013e318294b3c8.
Kolodner, Richard D, and Gerald T Marsischky. 1999. “Eukaryotic DNA Mismatch Repair.” Current Opinion in Genetics & Development 9 (1). Elsevier Current Trends: 89–96. doi:10.1016/S0959-437X(99)80013-6.
Kong, Ping, Ping Lei, Shishuang Zhang, Dai Li, Jing Zhao, and Benshu Zhang. 2018. “Integrated Microarray Analysis Provided a New Insight of the Pathogenesis of Parkinson’s Disease.” Neuroscience Letters 662 (January). Elsevier: 51–58. doi:10.1016/J.NEULET.2017.09.051.
Korlach, Jonas, Keith P. Bjornson, Bidhan P. Chaudhuri, Ronald L. Cicero, Benjamin A. Flusberg, Jeremy J. Gray, David Holden, Ravi Saxena, Jeffrey Wegener, and Stephen W. Turner. 2010. “Real-Time DNA Sequencing from Single Polymerase Molecules.” In Methods in Enzymology, 472:431–55. doi:10.1016/S0076-

159
6879(10)72001-2. Kornberg, A, L L Bertsch, J F Jackson, and H G Khorana. 1964. “Enzymatic Synthesis of
Deoxyribonucleic Acid, XVI. Oligonucleotides as Templates and the Mechanism of Their Replication.” Proceedings of the National Academy of Sciences of the United States of America 51 (2). National Academy of Sciences: 315–23. http://www.ncbi.nlm.nih.gov/pubmed/14124330.
Krøigård, Anne Bruun, Mads Thomassen, Anne-Vibeke Lænkholm, Torben A. Kruse, and Martin Jakob Larsen. 2016. “Evaluation of Nine Somatic Variant Callers for Detection of Somatic Mutations in Exome and Targeted Deep Sequencing Data.” Edited by I. King Jordan. PLOS ONE 11 (3). Public Library of Science: e0151664. doi:10.1371/journal.pone.0151664.
Krüger, Rejko, Wilfried Kuhn, Thomas Müller, Dirk Woitalla, Manuel Graeber, Sigfried Kösel, Horst Przuntek, Jörg T. Epplen, Ludger Schols, and Olaf Riess. 1998. “AlaSOPro Mutation in the Gene Encoding α-Synuclein in Parkinson’s Disease.” Nature Genetics 18 (2). Nature Publishing Group: 106–8. doi:10.1038/ng0298-106.
Kurotaki, Naohiro, Joseph J Shen, Mayumi Touyama, Tatsuro Kondoh, Remco Visser, Takao Ozaki, Junji Nishimoto, et al. 2005. “Phenotypic Consequences of Genetic Variation at Hemizygous Alleles: Sotos Syndrome Is a Contiguous Gene Syndrome Incorporating Coagulation Factor Twelve (FXII) Deficiency.” Genetics in Medicine 7 (7). Nature Publishing Group: 479–83. doi:10.1097/01.GIM.0000177419.43309.37.
Kuzuhara, S., H. Mori, N. Izumiyama, M. Yoshimura, and Y. Ihara. 1988. “Lewy Bodies Are Ubiquitinated.” Acta Neuropathologica 75 (4). Springer-Verlag: 345–53. doi:10.1007/BF00687787.
Laat, W L de, N G Jaspers, and J H Hoeijmakers. 1999. “Molecular Mechanism of Nucleotide Excision Repair.” Genes & Development 13 (7). Cold Spring Harbor Laboratory Press: 768–85. http://www.ncbi.nlm.nih.gov/pubmed/10197977.
Lam, Jenny K W, Michael Y T Chow, Yu Zhang, and Susan W S Leung. 2015. “SiRNA Versus MiRNA as Therapeutics for Gene Silencing.” Molecular Therapy - Nucleic Acids 4 (January). Cell Press: e252. doi:10.1038/MTNA.2015.23.
Lassmann, Silke, Roland Weis, Frank Makowiec, Jasmine Roth, Mihai Danciu, Ulrich Hopt, and Martin Werner. 2007. “Array CGH Identifies Distinct DNA Copy Number Profiles of Oncogenes and Tumor Suppressor Genes in Chromosomal- and Microsatellite-Unstable Sporadic Colorectal Carcinomas.” Journal of Molecular Medicine 85 (3). Springer-Verlag: 293–304. doi:10.1007/s00109-006-0126-5.
Lau, Lonneke M L de, and Monique M B Breteler. 2006. “Epidemiology of Parkinson’s Disease.” The Lancet. Neurology 5 (6). Elsevier: 525–35. doi:10.1016/S1474-4422(06)70471-9.
Lau, N. C., L P Lim, E G Weinstein, and D P Bartel. 2001. “An Abundant Class of Tiny RNAs with Probable Regulatory Roles in Caenorhabditis Elegans.” Science 294 (5543): 858–62. doi:10.1126/science.1065062.
Laver, T., J. Harrison, P.A. O’Neill, K. Moore, A. Farbos, K. Paszkiewicz, and D.J. Studholme. 2015. “Assessing the Performance of the Oxford Nanopore Technologies MinION.” Biomolecular Detection and Quantification 3 (March). Elsevier: 1–8. doi:10.1016/J.BDQ.2015.02.001.
Lavialle, Christian, Guillaume Cornelis, Anne Dupressoir, Cécile Esnault, Odile Heidmann, Cécile Vernochet, and Thierry Heidmann. 2013. “Paleovirology of ‘Syncytins’, Retroviral Env Genes Exapted for a Role in Placentation.” Philosophical Transactions of the Royal Society of London. Series B, Biological Sciences 368 (1626). The Royal Society: 20120507. doi:10.1098/rstb.2012.0507.
Lawley, P.D., and P. Brookes. 1967. “Interstrand Cross-Linking of DNA by Difunctional Alkylating Agents.” Journal of Molecular Biology 25 (1). Academic Press: 143–60.

160
doi:10.1016/0022-2836(67)90285-9. Lázaro, J.M., L. Blanco, and M. Salas. 1995. “Purification of Bacteriophage Φ29 DNA
Polymerase.” Methods in Enzymology 262 (January). Academic Press: 42–49. doi:10.1016/0076-6879(95)62007-9.
Lebedev, I. 2011. “Mosaic Aneuploidy in Early Fetal Losses.” Cytogenetic and Genome Research 133 (2–4). Karger Publishers: 169–83. doi:10.1159/000324120.
Lee-Six, Henry, Peter Ellis, Robert J. Osborne, Mathijs A Sanders, Luiza Moore, Nikitas Georgakopoulos, Franco Torrente, et al. 2018. “The Landscape of Somatic Mutation in Normal Colorectal Epithelial Cells.” BioRxiv, September. Cold Spring Harbor Laboratory, 416800. doi:10.1101/416800.
Lee-Six, Henry, Nina Friesgaard Øbro, Mairi S. Shepherd, Sebastian Grossmann, Kevin Dawson, Miriam Belmonte, Robert J. Osborne, et al. 2018. “Population Dynamics of Normal Human Blood Inferred from Somatic Mutations.” Nature 561 (7724). Nature Publishing Group: 473–78. doi:10.1038/s41586-018-0497-0.
Lee, Hyung Chul, Junho Choe, Sung-Gil Chi, and Yoon Ki Kim. 2009. “Exon Junction Complex Enhances Translation of Spliced MRNAs at Multiple Steps.” Biochemical and Biophysical Research Communications 384 (3). Academic Press: 334–40. doi:10.1016/J.BBRC.2009.04.123.
Lenz, W. 1975. “Letter: Half Chromatid Mutations May Explain Incontinentia Pigmenti in Males.” American Journal of Human Genetics 27 (5). Elsevier: 690–91. http://www.ncbi.nlm.nih.gov/pubmed/1163541.
Leroy, Elisabeth, Rebecca Boyer, Georg Auburger, Barbara Leube, Gudrun Ulm, Eva Mezey, Gyongyi Harta, et al. 1998. “The Ubiquitin Pathway in Parkinson’s Disease.” Nature 395 (6701): 451–52. doi:10.1038/26652.
Lesage, Suzanne, Valérie Drouet, Elisa Majounie, Vincent Deramecourt, Maxime Jacoupy, Aude Nicolas, Florence Cormier-Dequaire, et al. 2016. “Loss of VPS13C Function in Autosomal-Recessive Parkinsonism Causes Mitochondrial Dysfunction and Increases PINK1/Parkin-Dependent Mitophagy.” The American Journal of Human Genetics 98 (3). Cell Press: 500–513. doi:10.1016/J.AJHG.2016.01.014.
Lewin, R. 1984. “Trail of Ironies to Parkinson’s Disease.” Science (New York, N.Y.) 224 (4653). American Association for the Advancement of Science: 1083–85. doi:10.1126/SCIENCE.6426059.
Li, H., B. Handsaker, A. Wysoker, T. Fennell, J. Ruan, N. Homer, G. Marth, G. Abecasis, R. Durbin, and 1000 Genome Project Data Processing Subgroup. 2009. “The Sequence Alignment/Map Format and SAMtools.” Bioinformatics 25 (16): 2078–79. doi:10.1093/bioinformatics/btp352.
Li, Heng. 2013. “Aligning Sequence Reads, Clone Sequences and Assembly Contigs with BWA-MEM,” March. http://arxiv.org/abs/1303.3997.
Li, Jiao, Jennifer A. Ruskey, Isabelle Arnulf, Yves Dauvilliers, Michele T.M. Hu, Birgit Högl, Claire S. Leblond, et al. 2018. “Full Sequencing and Haplotype Analysis of MAPT in Parkinson’s Disease and Rapid Eye Movement Sleep Behavior Disorder.” Movement Disorders 33 (6). John Wiley & Sons, Ltd: 1016–20. doi:10.1002/mds.27385.
Li, Li, Huizhen Chen, Fangfang Chen, Feng Li, Meng Wang, Li Wang, Yunqing Li, and Dianshuai Gao. 2013. “Effects of Glial Cell Line-Derived Neurotrophic Factor on MicroRNA Expression in a 6-Hydroxydopamine-Injured Dopaminergic Cell Line.” Journal of Neural Transmission 120 (11). Springer Vienna: 1511–23. doi:10.1007/s00702-013-1031-z.
Li, Z, W Zhang, Y Chen, W Guo, J Zhang, H Tang, Z Xu, et al. 2016. “Impaired DNA Double-Strand Break Repair Contributes to the Age-Associated Rise of Genomic Instability in Humans.” Cell Death & Differentiation 23 (11). Nature Publishing Group: 1765–77. doi:10.1038/cdd.2016.65.
Liachko, Nicole F., Pamela J. McMillan, Timothy J. Strovas, Elaine Loomis, Lynne

161
Greenup, Jill R. Murrell, Bernardino Ghetti, et al. 2014. “The Tau Tubulin Kinases TTBK1/2 Promote Accumulation of Pathological TDP-43.” Edited by George Robert Jackson. PLoS Genetics 10 (12). Public Library of Science: e1004803. doi:10.1371/journal.pgen.1004803.
Licht, C., S. Heinen, M. Józsi, I. Löschmann, R.E. Saunders, S.J. Perkins, R. Waldherr, et al. 2006. “Deletion of Lys224 in Regulatory Domain 4 of Factor H Reveals a Novel Pathomechanism for Dense Deposit Disease (MPGN II).” Kidney International 70 (1). Elsevier: 42–50. doi:10.1038/SJ.KI.5000269.
Lieberman-Aiden, Erez, Nynke L van Berkum, Louise Williams, Maxim Imakaev, Tobias Ragoczy, Agnes Telling, Ido Amit, et al. 2009. “Comprehensive Mapping of Long-Range Interactions Reveals Folding Principles of the Human Genome.” Science (New York, N.Y.) 326 (5950). American Association for the Advancement of Science: 289–93. doi:10.1126/science.1181369.
Lill, Christina M., Johannes T. Roehr, Matthew B. McQueen, Fotini K. Kavvoura, Sachin Bagade, Brit-Maren M. Schjeide, Leif M. Schjeide, et al. 2012. “Comprehensive Research Synopsis and Systematic Meta-Analyses in Parkinson’s Disease Genetics: The PDGene Database.” Edited by Amanda J. Myers. PLoS Genetics 8 (3). Public Library of Science: e1002548. doi:10.1371/journal.pgen.1002548.
Lim, Elaine T, Mohammed Uddin, Silvia De Rubeis, Yingleong Chan, Anne S Kamumbu, Xiaochang Zhang, Alissa M D’Gama, et al. 2017. “Rates, Distribution and Implications of Postzygotic Mosaic Mutations in Autism Spectrum Disorder.” Nature Neuroscience 20 (9). Nature Publishing Group: 1217–24. doi:10.1038/nn.4598.
Lim, Jae Seok, Ramu Gopalappa, Se Hoon Kim, Suresh Ramakrishna, Minji Lee, Woo-Il Kim, Junho Kim, et al. 2017. “Somatic Mutations in TSC1 and TSC2 Cause Focal Cortical Dysplasia.” American Journal of Human Genetics 100 (3). Elsevier: 454–72. doi:10.1016/j.ajhg.2017.01.030.
Lim, Jae Seok, Woo-il Kim, Hoon-Chul Kang, Se Hoon Kim, Ah Hyung Park, Eun Kyung Park, Young-Wook Cho, et al. 2015. “Brain Somatic Mutations in MTOR Cause Focal Cortical Dysplasia Type II Leading to Intractable Epilepsy.” Nature Medicine 21 (4). Nature Publishing Group: 395–400. doi:10.1038/nm.3824.
Lin, L F, D H Doherty, J D Lile, S Bektesh, and F Collins. 1993. “GDNF: A Glial Cell Line-Derived Neurotrophic Factor for Midbrain Dopaminergic Neurons.” Science (New York, N.Y.) 260 (5111). American Association for the Advancement of Science: 1130–32. doi:10.1126/SCIENCE.8493557.
Lindahl, T, and B Nyberg. 1972. “Rate of Depurination of Native Deoxyribonucleic Acid.” Biochemistry 11 (19): 3610–18. http://www.ncbi.nlm.nih.gov/pubmed/4626532.
Lindahl, Tomas. 1982. “DNA REPAIR ENZYMES.” www.annualreviews.org. ———. 1993. “Instability and Decay of the Primary Structure of DNA.” Nature 362
(6422): 709–15. doi:10.1038/362709a0. Liu, Wenqiang, Kunming Li, Dandan Bai, Jiqing Yin, Yuanyuan Tang, Fengli Chi, Linfeng
Zhang, et al. 2017. “Dosage Effects of ZP2 and ZP3 Heterozygous Mutations Cause Human Infertility.” Human Genetics 136 (8). Springer Berlin Heidelberg: 975–85. doi:10.1007/s00439-017-1822-7.
Liu, Yo-Tsen, Matilde Laurá, Joshua Hersheson, Alejandro Horga, Zane Jaunmuktane, Sebastian Brandner, Alan Pittman, et al. 2014. “Extended Phenotypic Spectrum of KIF5A Mutations: From Spastic Paraplegia to Axonal Neuropathy.” Neurology 83 (7). Wolters Kluwer Health, Inc. on behalf of the American Academy of Neurology: 612–19. doi:10.1212/WNL.0000000000000691.
Lodato, Michael A, Rachel E Rodin, Craig L Bohrson, Michael E Coulter, Alison R Barton, Minseok Kwon, Maxwell A Sherman, et al. 2018. “Aging and Neurodegeneration Are Associated with Increased Mutations in Single Human Neurons.” Science (New York, N.Y.) 359 (6375). American Association for the Advancement of Science: 555–59. doi:10.1126/science.aao4426.
162
Lodato, Michael A, Mollie B Woodworth, Semin Lee, Gilad D Evrony, Bhaven K Mehta, Amir Karger, Soohyun Lee, et al. 2015. “Somatic Mutation in Single Human Neurons Tracks Developmental and Transcriptional History.” Science (New York, N.Y.) 350 (6256). American Association for the Advancement of Science: 94–98. doi:10.1126/science.aab1785.
Loots, Gabriela G, Michaela Kneissel, Hansjoerg Keller, Myma Baptist, Jessie Chang, Nicole M Collette, Dmitriy Ovcharenko, Ingrid Plajzer-Frick, and Edward M Rubin. 2005. “Genomic Deletion of a Long-Range Bone Enhancer Misregulates Sclerostin in Van Buchem Disease.” Genome Research 15 (7). Cold Spring Harbor Laboratory Press: 928–35. doi:10.1101/gr.3437105.
Lott, Ira T., and Elizabeth Head. 2005. “Alzheimer Disease and Down Syndrome: Factors in Pathogenesis.” Neurobiology of Aging 26 (3). Elsevier: 383–89. doi:10.1016/J.NEUROBIOLAGING.2004.08.005.
Lu, Yuan, Yingjia Shen, Wesley C. Warren, and Ronald B. Walter. 2017. “Next Generation Sequencing in Aquatic Models.” https://www.semanticscholar.org/paper/Chapter-2-Next-Generation-Sequencing-in-Aquatic-Lu-Shen/f567f797332eea01bbce13b6af9cd2f38668fac4.
Lucas-Lledó, José Ignacio, and Michael Lynch. 2009. “Evolution of Mutation Rates: Phylogenomic Analysis of the Photolyase/Cryptochrome Family.” Molecular Biology and Evolution 26 (5). Oxford University Press: 1143–53. doi:10.1093/molbev/msp029.
Lumen Learning. 2019. “DNA Structure.” https://courses.lumenlearning.com/microbiology/chapter/structure-and-function-of-dna/.
Lupiáñez, Darío G., Malte Spielmann, and Stefan Mundlos. 2016. “Breaking TADs: How Alterations of Chromatin Domains Result in Disease.” Trends in Genetics 32 (4). Elsevier Current Trends: 225–37. doi:10.1016/J.TIG.2016.01.003.
Lupski, James R., Carol A. Wise, Akira Kuwano, Liu Pentao, Julie T. Parke, Daniel G. Glaze, David H. Ledbetter, Frank Greenberg, and Pragna I. Patel. 1992. “Gene Dosage Is a Mechanism for Charcot-Marie-Tooth Disease Type 1A.” Nature Genetics 1 (1). Nature Publishing Group: 29–33. doi:10.1038/ng0492-29.
Lupski, James R. 2007. “Genomic Rearrangements and Sporadic Disease.” Nature Genetics 39 (7s). Nature Publishing Group: S43–47. doi:10.1038/ng2084.
Lynch, M., and B. Walsh. 1998. Genetics and Analysis of Quantitative Traits. Sunderland, MA: Sinauer.
Lynch, Michael. 2010. “Evolution of the Mutation Rate.” Trends in Genetics 26 (8). Elsevier Current Trends: 345–52. doi:10.1016/J.TIG.2010.05.003.
Lyon, Mary F. 1961. “Gene Action in the X-Chromosome of the Mouse (Mus Musculus L.).” Nature 190 (4773). Nature Publishing Group: 372–73. doi:10.1038/190372a0.
MacDonald, Marcy E., Christine M. Ambrose, Mabel P. Duyao, Richard H. Myers, Carol Lin, Lakshmi Srinidhi, Glenn Barnes, et al. 1993. “A Novel Gene Containing a Trinucleotide Repeat That Is Expanded and Unstable on Huntington’s Disease Chromosomes.” Cell 72 (6). Cell Press: 971–83. doi:10.1016/0092-8674(93)90585-E.
Madabhushi, Ram, Fan Gao, Andreas R. Pfenning, Ling Pan, Satoko Yamakawa, Jinsoo Seo, Richard Rueda, et al. 2015a. “Activity-Induced DNA Breaks Govern the Expression of Neuronal Early-Response Genes.” Cell 161 (7). Cell Press: 1592–1605. doi:10.1016/J.CELL.2015.05.032.
Madabhushi, Ram, Fan Gao, Andreas R Pfenning, Ling Pan, Satoko Yamakawa, Jinsoo Seo, Richard Rueda, et al. 2015b. “Activity-Induced DNA Breaks Govern the Expression of Neuronal Early-Response Genes.” Cell 161 (7). Elsevier: 1592–1605. doi:10.1016/j.cell.2015.05.032.
Maele-Fabry, Geneviève Van, Perrine Hoet, Fabienne Vilain, and Dominique Lison. 2012.

163
“Occupational Exposure to Pesticides and Parkinson’s Disease: A Systematic Review and Meta-Analysis of Cohort Studies.” Environment International 46 (October). Pergamon: 30–43. doi:10.1016/J.ENVINT.2012.05.004.
Maes, Tamara, Anna Barceló, and Carlos Buesa. 2002. “Neuron Navigator: A Human Gene Family with Homology to Unc-53, a Cell Guidance Gene from Caenorhabditis Elegans.” Genomics 80 (1). Academic Press: 21–30. doi:10.1006/GENO.2002.6799.
Maher, Brendan. 2008. “Personal Genomes: The Case of the Missing Heritability.” Nature 456 (7218). Nature Publishing Group: 18–21. doi:10.1038/456018a.
Manejwala, Fazal M., Edward J. Cragoe, and Richard M. Schultz. 1989. “Blastocoel Expansion in the Preimplantation Mouse Embryo: Role of Extracellular Sodium and Chloride and Possible Apical Routes of Their Entry.” Developmental Biology 133 (1): 210–20. doi:10.1016/0012-1606(89)90312-6.
Marchini, Jonathan, Lon R Cardon, Michael S Phillips, and Peter Donnelly. 2004. “The Effects of Human Population Structure on Large Genetic Association Studies.” Nature Genetics 36 (5). Nature Publishing Group: 512–17. doi:10.1038/ng1337.
Marco-Sola, Santiago, Michael Sammeth, Roderic Guigó, and Paolo Ribeca. 2012. “The GEM Mapper: Fast, Accurate and Versatile Alignment by Filtration.” Nature Methods 9 (12). Nature Publishing Group: 1185–88. doi:10.1038/nmeth.2221.
Marcy, Yann, Cleber Ouverney, Elisabeth M Bik, Tina Lösekann, Natalia Ivanova, Hector Garcia Martin, Ernest Szeto, et al. 2007. “Dissecting Biological Dark Matter; with Single-Cell Genetic Analysis of Rare and Uncultivated TM7 Microbes from the Human Mouth.” Proceedings of the National Academy of Sciences of the United States of America 104 (29). National Academy of Sciences: 11889–94. doi:10.1073/pnas.0704662104.
Marieb, Elaine Nicpon, and Katja. Hoehn. 2013. Human Anatomy & Physiology. Martikainen, Mika H., Markku Päivärinta, Marja Hietala, and Valtteri Kaasinen. 2015.
“Clinical and Imaging Findings in Parkinson Disease Associated with the A53E SNCA Mutation.” Neurology Genetics 1 (4): e27. doi:10.1212/NXG.0000000000000027.
Martin, E R, W K Scott, M A Nance, R L Watts, J P Hubble, W C Koller, K Lyons, et al. 2001. “Association of Single-Nucleotide Polymorphisms of the Tau Gene with Late-Onset Parkinson Disease.” JAMA 286 (18): 2245–50. http://www.ncbi.nlm.nih.gov/pubmed/11710889.
Martincorena, Iñigo, and Peter J. Campbell. 2015. “Somatic Mutation in Cancer and Normal Cells.” Science 349 (6255). American Association for the Advancement of Science: 1483–89. doi:10.1126/SCIENCE.AAB4082.
Martincorena, Iñigo, Joanna C Fowler, Agnieszka Wabik, Andrew R J Lawson, Federico Abascal, Michael W J Hall, Alex Cagan, et al. 2018. “Somatic Mutant Clones Colonize the Human Esophagus with Age.” Science (New York, N.Y.) 362 (6417). American Association for the Advancement of Science: 911–17. doi:10.1126/science.aau3879.
Martincorena, Iñigo, Keiran M. Raine, Moritz Gerstung, Kevin J. Dawson, Kerstin Haase, Peter Van Loo, Helen Davies, Michael R. Stratton, and Peter J. Campbell. 2017. “Universal Patterns of Selection in Cancer and Somatic Tissues.” Cell 171 (5). Cell Press: 1029–1041.e21. doi:10.1016/J.CELL.2017.09.042.
Martincorena, Iñigo, Amit Roshan, Moritz Gerstung, Peter Ellis, Peter Van Loo, Stuart McLaren, David C Wedge, et al. 2015. “Tumor Evolution. High Burden and Pervasive Positive Selection of Somatic Mutations in Normal Human Skin.” Science (New York, N.Y.) 348 (6237). American Association for the Advancement of Science: 880–86. doi:10.1126/science.aaa6806.
Masters, C L, G Simms, N A Weinman, G Multhaup, B L McDonald, and K Beyreuther. 1985. “Amyloid Plaque Core Protein in Alzheimer Disease and Down Syndrome.”

164
Proceedings of the National Academy of Sciences of the United States of America 82 (12). National Academy of Sciences: 4245–49. doi:10.1073/PNAS.82.12.4245.
Mata, Ignacio F., Ali Samii, Seth H. Schneer, John W. Roberts, Alida Griffith, Berta C. Leis, Gerard D. Schellenberg, et al. 2008. “Glucocerebrosidase Gene Mutations.” Archives of Neurology 65 (3). American Medical Association: 379–82. doi:10.1001/archneurol.2007.68.
Matharu, Navneet, and Nadav Ahituv. 2015. “Minor Loops in Major Folds: Enhancer–Promoter Looping, Chromatin Restructuring, and Their Association with Transcriptional Regulation and Disease.” Edited by Elizabeth M. C. Fisher. PLOS Genetics 11 (12). Public Library of Science: e1005640. doi:10.1371/journal.pgen.1005640.
Mathieson, Iain, and David Reich. 2017. “Differences in the Rare Variant Spectrum among Human Populations.” Edited by Santhosh Girirajan. PLOS Genetics 13 (2). Public Library of Science: e1006581. doi:10.1371/journal.pgen.1006581.
Maurano, M. T., R. Humbert, E. Rynes, R. E. Thurman, E. Haugen, H. Wang, A. P. Reynolds, et al. 2012. “Systematic Localization of Common Disease-Associated Variation in Regulatory DNA.” Science 337 (6099): 1190–95. doi:10.1126/science.1222794.
McClintock, B. 1950. “The Origin and Behavior of Mutable Loci in Maize.” Proceedings of the National Academy of Sciences of the United States of America 36 (6). National Academy of Sciences: 344–55. doi:10.1073/PNAS.36.6.344.
McConnell, Michael J., John V. Moran, Alexej Abyzov, Schahram Akbarian, Taejeong Bae, Isidro Cortes-Ciriano, Jennifer A. Erwin, et al. 2017. “Intersection of Diverse Neuronal Genomes and Neuropsychiatric Disease: The Brain Somatic Mosaicism Network.” Science 356 (6336): eaal1641. doi:10.1126/science.aal1641.
McKenna, Aaron, Gregory M Findlay, James A Gagnon, Marshall S Horwitz, Alexander F Schier, and Jay Shendure. 2016. “Whole-Organism Lineage Tracing by Combinatorial and Cumulative Genome Editing.” Science (New York, N.Y.) 353 (6298). American Association for the Advancement of Science: aaf7907. doi:10.1126/science.aaf7907.
McKenna, Aaron, Matthew Hanna, Eric Banks, Andrey Sivachenko, Kristian Cibulskis, Andrew Kernytsky, Kiran Garimella, et al. 2010. “The Genome Analysis Toolkit: A MapReduce Framework for Analyzing next-Generation DNA Sequencing Data.” Genome Research 20 (9). Cold Spring Harbor Laboratory Press: 1297–1303. doi:10.1101/gr.107524.110.
McKinsey, Gabriel L., Susan Lindtner, Brett Trzcinski, Axel Visel, Len A. Pennacchio, Danny Huylebroeck, Yujiro Higashi, and John L.R. Rubenstein. 2013. “Dlx1&2-Dependent Expression of Zfhx1b (Sip1, Zeb2) Regulates the Fate Switch between Cortical and Striatal Interneurons.” Neuron 77 (1). Cell Press: 83–98. doi:10.1016/J.NEURON.2012.11.035.
Meacham, Frazer, Dario Boffelli, Joseph Dhahbi, David IK Martin, Meromit Singer, and Lior Pachter. 2011. “Identification and Correction of Systematic Error in High-Throughput Sequence Data.” BMC Bioinformatics 12 (1). BioMed Central: 451. doi:10.1186/1471-2105-12-451.
Mensa-Vilaró, Anna, María Bravo García-Morato, Oscar de la Calle-Martin, Clara Franco-Jarava, María Teresa Martínez-Saavedra, Luis I. González-Granado, Eva González-Roca, et al. 2019. “Unexpected Relevant Role of Gene Mosaicism in Patients with Primary Immunodeficiency Diseases.” Journal of Allergy and Clinical Immunology 143 (1). Mosby: 359–68. doi:10.1016/J.JACI.2018.09.009.
Merkenschlager, Matthias, and Duncan T. Odom. 2013. “CTCF and Cohesin: Linking Gene Regulatory Elements with Their Targets.” Cell 152 (6). Cell Press: 1285–97. doi:10.1016/J.CELL.2013.02.029.
Messiaen, Ludwine, Julia Vogt, Kathrin Bengesser, Chuanhua Fu, Fady Mikhail, Eduard

165
Serra, Carles Garcia-Linares, David N. Cooper, Conxi Lazaro, and Hildegard Kehrer-Sawatzki. 2011. “Mosaic Type-1 NF1 Microdeletions as a Cause of Both Generalized and Segmental Neurofibromatosis Type-1 (NF1).” Human Mutation 32 (2). John Wiley & Sons, Ltd: 213–19. doi:10.1002/humu.21418.
Michaelson, Daniel M. 2014. “APOE Ε4: The Most Prevalent yet Understudied Risk Factor for Alzheimer’s Disease.” Alzheimer’s & Dementia 10 (6). Elsevier: 861–68. doi:10.1016/J.JALZ.2014.06.015.
Minelli, E, C Buchi, P Granata, E Meroni, R Righi, P Portentoso, A Giudici, A Ercoli, M G Sartor, and A Rossi. 1993. “Cytogenetic Findings in Echographically Defined Blighted Ovum Abortions.” Annales de Genetique 36 (2): 107–10. http://www.ncbi.nlm.nih.gov/pubmed/8215215.
Miyamoto, Yoshinari, Akihiko Mabuchi, Dongquan Shi, Toshikazu Kubo, Yoshio Takatori, Susumu Saito, Mikihiro Fujioka, et al. 2007. “A Functional Polymorphism in the 5′ UTR of GDF5 Is Associated with Susceptibility to Osteoarthritis.” Nature Genetics 39 (4). Nature Publishing Group: 529–33. doi:10.1038/2005.
Mokretar, Katya, Daniel Pease, Jan-Willem Taanman, Aynur Soenmez, Ayesha Ejaz, Tammaryn Lashley, Helen Ling, et al. 2018. “Somatic Copy Number Gains of α-Synuclein (SNCA) in Parkinson’s Disease and Multiple System Atrophy Brains.” Brain 141 (8). Narnia: 2419–31. doi:10.1093/brain/awy157.
Moore, J K, and J E Haber. 1996. “Cell Cycle and Genetic Requirements of Two Pathways of Nonhomologous End-Joining Repair of Double-Strand Breaks in Saccharomyces Cerevisiae.” Molecular and Cellular Biology 16 (5). American Society for Microbiology (ASM): 2164–73. http://www.ncbi.nlm.nih.gov/pubmed/8628283.
Moore, Luiza, Daniel Leongamornlert, Tim HH Coorens, Mathijs A Sanders, Peter Ellis, Kevin Dawson, Franscesco Maura, et al. 2018. “The Mutational Landscape of Normal Human Endometrial Epithelium.” BioRxiv, December. Cold Spring Harbor Laboratory, 505685. doi:10.1101/505685.
Morley, Alexander A. 1995. “The Somatic Mutation Theory of Ageing.” Mutation Research/DNAging 338 (1–6). Elsevier: 19–23. doi:10.1016/0921-8734(95)00007-S.
Morrow, Eric M., Seung-Yun Yoo, Steven W. Flavell, Tae-Kyung Kim, Yingxi Lin, Robert Sean Hill, Nahit M. Mukaddes, et al. 2008. “Identifying Autism Loci and Genes by Tracing Recent Shared Ancestry.” Science 321 (5886). American Association for the Advancement of Science: 218–23. doi:10.1126/SCIENCE.1157657.
Mortensen, Ólavur, Leivur Nattestad Lydersen, Katrin Didriksen Apol, Guðrið Andorsdóttir, Bjarni á Steig, and Noomi Oddmarsdóttir Gregersen. 2019. “Using Dried Blood Spot Samples from a Trio for Linked-Read Whole-Exome Sequencing.” European Journal of Human Genetics, February. Nature Publishing Group, 1. doi:10.1038/s41431-019-0343-3.
Muotri, Alysson R., and Fred H. Gage. 2006. “Generation of Neuronal Variability and Complexity.” Nature 441 (7097). Nature Publishing Group: 1087–93. doi:10.1038/nature04959.
Muotri, Alysson R., Chunmei Zhao, Maria C.N. Marchetto, and Fred H. Gage. 2009. “Environmental Influence on L1 Retrotransposons in the Adult Hippocampus.” Hippocampus 19 (10). John Wiley & Sons, Ltd: 1002–7. doi:10.1002/hipo.20564.
Nalls, Mike A, Nathan Pankratz, Christina M Lill, Chuong B Do, Dena G Hernandez, Mohamad Saad, Anita L DeStefano, et al. 2014a. “Large-Scale Meta-Analysis of Genome-Wide Association Data Identifies Six New Risk Loci for Parkinson’s Disease.” Nature Genetics 46 (9). Nature Publishing Group: 989–93. doi:10.1038/ng.3043.
———. 2014b. “Large-Scale Meta-Analysis of Genome-Wide Association Data Identifies Six New Risk Loci for Parkinson’s Disease.” Nature Genetics 46 (9). Nature
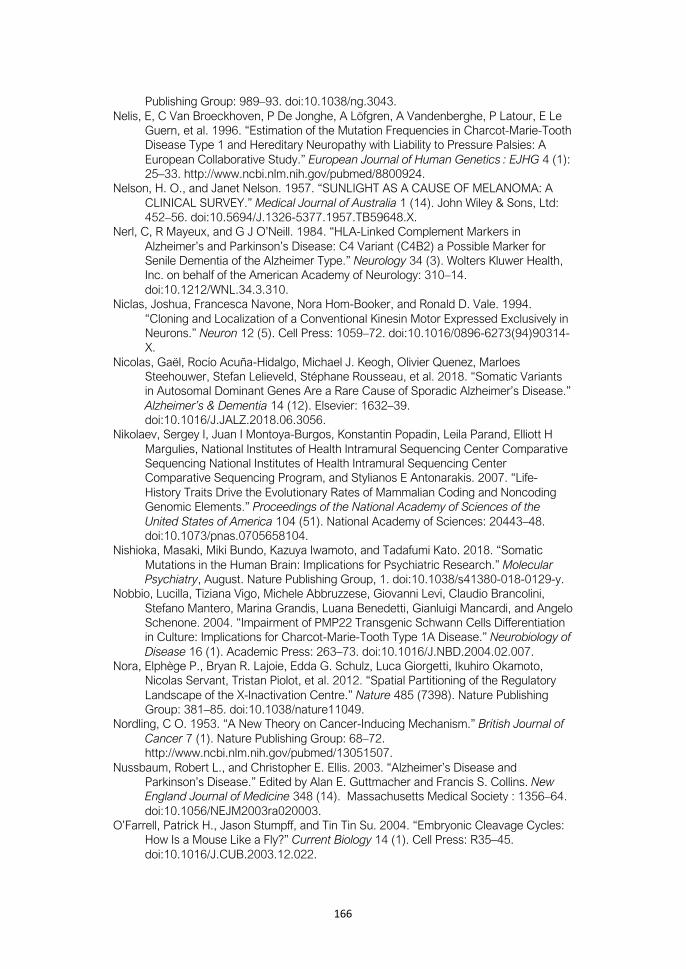
166
Publishing Group: 989–93. doi:10.1038/ng.3043. Nelis, E, C Van Broeckhoven, P De Jonghe, A Löfgren, A Vandenberghe, P Latour, E Le
Guern, et al. 1996. “Estimation of the Mutation Frequencies in Charcot-Marie-Tooth Disease Type 1 and Hereditary Neuropathy with Liability to Pressure Palsies: A European Collaborative Study.” European Journal of Human Genetics : EJHG 4 (1): 25–33. http://www.ncbi.nlm.nih.gov/pubmed/8800924.
Nelson, H. O., and Janet Nelson. 1957. “SUNLIGHT AS A CAUSE OF MELANOMA: A CLINICAL SURVEY.” Medical Journal of Australia 1 (14). John Wiley & Sons, Ltd: 452–56. doi:10.5694/J.1326-5377.1957.TB59648.X.
Nerl, C, R Mayeux, and G J O’Neill. 1984. “HLA-Linked Complement Markers in Alzheimer’s and Parkinson’s Disease: C4 Variant (C4B2) a Possible Marker for Senile Dementia of the Alzheimer Type.” Neurology 34 (3). Wolters Kluwer Health, Inc. on behalf of the American Academy of Neurology: 310–14. doi:10.1212/WNL.34.3.310.
Niclas, Joshua, Francesca Navone, Nora Hom-Booker, and Ronald D. Vale. 1994. “Cloning and Localization of a Conventional Kinesin Motor Expressed Exclusively in Neurons.” Neuron 12 (5). Cell Press: 1059–72. doi:10.1016/0896-6273(94)90314-X.
Nicolas, Gaël, Rocío Acuña-Hidalgo, Michael J. Keogh, Olivier Quenez, Marloes Steehouwer, Stefan Lelieveld, Stéphane Rousseau, et al. 2018. “Somatic Variants in Autosomal Dominant Genes Are a Rare Cause of Sporadic Alzheimer’s Disease.” Alzheimer’s & Dementia 14 (12). Elsevier: 1632–39. doi:10.1016/J.JALZ.2018.06.3056.
Nikolaev, Sergey I, Juan I Montoya-Burgos, Konstantin Popadin, Leila Parand, Elliott H Margulies, National Institutes of Health Intramural Sequencing Center Comparative Sequencing National Institutes of Health Intramural Sequencing Center Comparative Sequencing Program, and Stylianos E Antonarakis. 2007. “Life-History Traits Drive the Evolutionary Rates of Mammalian Coding and Noncoding Genomic Elements.” Proceedings of the National Academy of Sciences of the United States of America 104 (51). National Academy of Sciences: 20443–48. doi:10.1073/pnas.0705658104.
Nishioka, Masaki, Miki Bundo, Kazuya Iwamoto, and Tadafumi Kato. 2018. “Somatic Mutations in the Human Brain: Implications for Psychiatric Research.” Molecular Psychiatry, August. Nature Publishing Group, 1. doi:10.1038/s41380-018-0129-y.
Nobbio, Lucilla, Tiziana Vigo, Michele Abbruzzese, Giovanni Levi, Claudio Brancolini, Stefano Mantero, Marina Grandis, Luana Benedetti, Gianluigi Mancardi, and Angelo Schenone. 2004. “Impairment of PMP22 Transgenic Schwann Cells Differentiation in Culture: Implications for Charcot-Marie-Tooth Type 1A Disease.” Neurobiology of Disease 16 (1). Academic Press: 263–73. doi:10.1016/J.NBD.2004.02.007.
Nora, Elphège P., Bryan R. Lajoie, Edda G. Schulz, Luca Giorgetti, Ikuhiro Okamoto, Nicolas Servant, Tristan Piolot, et al. 2012. “Spatial Partitioning of the Regulatory Landscape of the X-Inactivation Centre.” Nature 485 (7398). Nature Publishing Group: 381–85. doi:10.1038/nature11049.
Nordling, C O. 1953. “A New Theory on Cancer-Inducing Mechanism.” British Journal of Cancer 7 (1). Nature Publishing Group: 68–72. http://www.ncbi.nlm.nih.gov/pubmed/13051507.
Nussbaum, Robert L., and Christopher E. Ellis. 2003. “Alzheimer’s Disease and Parkinson’s Disease.” Edited by Alan E. Guttmacher and Francis S. Collins. New England Journal of Medicine 348 (14). Massachusetts Medical Society : 1356–64. doi:10.1056/NEJM2003ra020003.
O’Farrell, Patrick H., Jason Stumpff, and Tin Tin Su. 2004. “Embryonic Cleavage Cycles: How Is a Mouse Like a Fly?” Current Biology 14 (1). Cell Press: R35–45. doi:10.1016/J.CUB.2003.12.022.
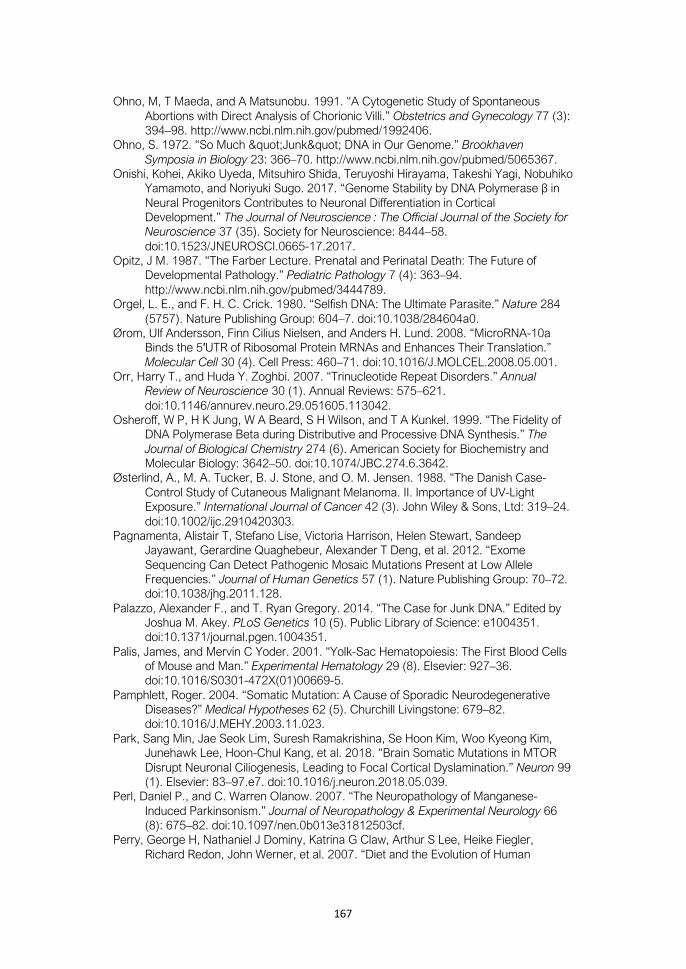
167
Ohno, M, T Maeda, and A Matsunobu. 1991. “A Cytogenetic Study of Spontaneous Abortions with Direct Analysis of Chorionic Villi.” Obstetrics and Gynecology 77 (3): 394–98. http://www.ncbi.nlm.nih.gov/pubmed/1992406.
Ohno, S. 1972. “So Much "Junk" DNA in Our Genome.” Brookhaven Symposia in Biology 23: 366–70. http://www.ncbi.nlm.nih.gov/pubmed/5065367.
Onishi, Kohei, Akiko Uyeda, Mitsuhiro Shida, Teruyoshi Hirayama, Takeshi Yagi, Nobuhiko Yamamoto, and Noriyuki Sugo. 2017. “Genome Stability by DNA Polymerase β in Neural Progenitors Contributes to Neuronal Differentiation in Cortical Development.” The Journal of Neuroscience : The Official Journal of the Society for Neuroscience 37 (35). Society for Neuroscience: 8444–58. doi:10.1523/JNEUROSCI.0665-17.2017.
Opitz, J M. 1987. “The Farber Lecture. Prenatal and Perinatal Death: The Future of Developmental Pathology.” Pediatric Pathology 7 (4): 363–94. http://www.ncbi.nlm.nih.gov/pubmed/3444789.
Orgel, L. E., and F. H. C. Crick. 1980. “Selfish DNA: The Ultimate Parasite.” Nature 284 (5757). Nature Publishing Group: 604–7. doi:10.1038/284604a0.
Ørom, Ulf Andersson, Finn Cilius Nielsen, and Anders H. Lund. 2008. “MicroRNA-10a Binds the 5′UTR of Ribosomal Protein MRNAs and Enhances Their Translation.” Molecular Cell 30 (4). Cell Press: 460–71. doi:10.1016/J.MOLCEL.2008.05.001.
Orr, Harry T., and Huda Y. Zoghbi. 2007. “Trinucleotide Repeat Disorders.” Annual Review of Neuroscience 30 (1). Annual Reviews: 575–621. doi:10.1146/annurev.neuro.29.051605.113042.
Osheroff, W P, H K Jung, W A Beard, S H Wilson, and T A Kunkel. 1999. “The Fidelity of DNA Polymerase Beta during Distributive and Processive DNA Synthesis.” The Journal of Biological Chemistry 274 (6). American Society for Biochemistry and Molecular Biology: 3642–50. doi:10.1074/JBC.274.6.3642.
Østerlind, A., M. A. Tucker, B. J. Stone, and O. M. Jensen. 1988. “The Danish Case-Control Study of Cutaneous Malignant Melanoma. II. Importance of UV-Light Exposure.” International Journal of Cancer 42 (3). John Wiley & Sons, Ltd: 319–24. doi:10.1002/ijc.2910420303.
Pagnamenta, Alistair T, Stefano Lise, Victoria Harrison, Helen Stewart, Sandeep Jayawant, Gerardine Quaghebeur, Alexander T Deng, et al. 2012. “Exome Sequencing Can Detect Pathogenic Mosaic Mutations Present at Low Allele Frequencies.” Journal of Human Genetics 57 (1). Nature Publishing Group: 70–72. doi:10.1038/jhg.2011.128.
Palazzo, Alexander F., and T. Ryan Gregory. 2014. “The Case for Junk DNA.” Edited by Joshua M. Akey. PLoS Genetics 10 (5). Public Library of Science: e1004351. doi:10.1371/journal.pgen.1004351.
Palis, James, and Mervin C Yoder. 2001. “Yolk-Sac Hematopoiesis: The First Blood Cells of Mouse and Man.” Experimental Hematology 29 (8). Elsevier: 927–36. doi:10.1016/S0301-472X(01)00669-5.
Pamphlett, Roger. 2004. “Somatic Mutation: A Cause of Sporadic Neurodegenerative Diseases?” Medical Hypotheses 62 (5). Churchill Livingstone: 679–82. doi:10.1016/J.MEHY.2003.11.023.
Park, Sang Min, Jae Seok Lim, Suresh Ramakrishina, Se Hoon Kim, Woo Kyeong Kim, Junehawk Lee, Hoon-Chul Kang, et al. 2018. “Brain Somatic Mutations in MTOR Disrupt Neuronal Ciliogenesis, Leading to Focal Cortical Dyslamination.” Neuron 99 (1). Elsevier: 83–97.e7. doi:10.1016/j.neuron.2018.05.039.
Perl, Daniel P., and C. Warren Olanow. 2007. “The Neuropathology of Manganese-Induced Parkinsonism.” Journal of Neuropathology & Experimental Neurology 66 (8): 675–82. doi:10.1097/nen.0b013e31812503cf.
Perry, George H, Nathaniel J Dominy, Katrina G Claw, Arthur S Lee, Heike Fiegler, Richard Redon, John Werner, et al. 2007. “Diet and the Evolution of Human

168
Amylase Gene Copy Number Variation.” Nature Genetics 39 (10). Nature Publishing Group: 1256–60. doi:10.1038/ng2123.
Pfeifer, G P. 2006. “Mutagenesis at Methylated CpG Sequences.” Current Topics in Microbiology and Immunology 301: 259–81. http://www.ncbi.nlm.nih.gov/pubmed/16570852.
Pfeifer, Gerd P., Young-Hyun You, and Ahmad Besaratinia. 2005. “Mutations Induced by Ultraviolet Light.” Mutation Research/Fundamental and Molecular Mechanisms of Mutagenesis 571 (1–2): 19–31. doi:10.1016/j.mrfmmm.2004.06.057.
Piccini, P., P. K. Morrish, N. Turjanski, G. V. Sawle, D. J. Burn, R. A. Weeks, M. H. Mark, D. M. Maraganore, A. J. Lees, and D. J. Brooks. 1997. “Dopaminergic Function in Familial Parkinson’s Disease: A Clinical And18F-Dopa Positron Emission Tomography Study.” Annals of Neurology 41 (2). John Wiley & Sons, Ltd: 222–29. doi:10.1002/ana.410410213.
Pich, Oriol, Ferran Muiños, Radhakrishnan Sabarinathan, Iker Reyes-Salazar, Abel Gonzalez-Perez, and Nuria Lopez-Bigas. 2018. “Somatic and Germline Mutation Periodicity Follow the Orientation of the DNA Minor Groove around Nucleosomes.” Cell 175 (4). Cell Press: 1074–1087.e18. doi:10.1016/J.CELL.2018.10.004.
Pleasance, Erin D., R. Keira Cheetham, Philip J. Stephens, David J. McBride, Sean J. Humphray, Chris D. Greenman, Ignacio Varela, et al. 2010. “A Comprehensive Catalogue of Somatic Mutations from a Human Cancer Genome.” Nature 463 (7278): 191–96. doi:10.1038/nature08658.
Pleasance, Erin D., Philip J. Stephens, Sarah O’Meara, David J. McBride, Alison Meynert, David Jones, Meng-Lay Lin, et al. 2010. “A Small-Cell Lung Cancer Genome with Complex Signatures of Tobacco Exposure.” Nature 463 (7278): 184–90. doi:10.1038/nature08629.
Poduri, Annapurna, Gilad D. Evrony, Xuyu Cai, Princess Christina Elhosary, Rameen Beroukhim, Maria K. Lehtinen, L. Benjamin Hills, et al. 2012. “Somatic Activation of AKT3 Causes Hemispheric Developmental Brain Malformations.” Neuron 74 (1). Cell Press: 41–48. doi:10.1016/J.NEURON.2012.03.010.
Polymeropoulos, M H, C Lavedan, E Leroy, S E Ide, A Dehejia, A Dutra, B Pike, et al. 1997. “Mutation in the Alpha-Synuclein Gene Identified in Families with Parkinson’s Disease.” Science (New York, N.Y.) 276 (5321). American Association for the Advancement of Science: 2045–47. doi:10.1126/SCIENCE.276.5321.2045.
Price, Alkes L, Nick J Patterson, Robert M Plenge, Michael E Weinblatt, Nancy A Shadick, and David Reich. 2006. “Principal Components Analysis Corrects for Stratification in Genome-Wide Association Studies.” Nature Genetics 38 (8): 904–9. doi:10.1038/ng1847.
Priest, James Rush, Charles Gawad, Kristopher M Kahlig, Joseph K Yu, Thomas O’Hara, Patrick M Boyle, Sridharan Rajamani, et al. 2016. “Early Somatic Mosaicism Is a Rare Cause of Long-QT Syndrome.” Proceedings of the National Academy of Sciences of the United States of America 113 (41). National Academy of Sciences: 11555–60. doi:10.1073/pnas.1607187113.
Proukakis, Christos, Maryiam Shoaee, James Morris, Timothy Brier, Eleanna Kara, Una-Marie Sheerin, Gavin Charlesworth, et al. 2014. “Analysis of Parkinson’s Disease Brain-Derived DNA for Alpha-Synuclein Coding Somatic Mutations.” Movement Disorders 29 (8). John Wiley & Sons, Ltd: 1060–64. doi:10.1002/mds.25883.
Prud’homme, N, M Gans, M Masson, C Terzian, and A Bucheton. 1995. “Flamenco, a Gene Controlling the Gypsy Retrovirus of Drosophila Melanogaster.” Genetics 139 (2): 697–711. http://www.ncbi.nlm.nih.gov/pubmed/7713426.
Psychoyos, D, and C D Stern. 1996. “Fates and Migratory Routes of Primitive Streak Cells in the Chick Embryo.” Development (Cambridge, England) 122 (5): 1523–34. http://www.ncbi.nlm.nih.gov/pubmed/8625839.
Pushkarev, Dmitry, Norma F Neff, and Stephen R Quake. 2009. “Single-Molecule

169
Sequencing of an Individual Human Genome.” Nature Biotechnology 27 (9). Nature Publishing Group: 847–50. doi:10.1038/nbt.1561.
Pysam-developers. 2009. “Pysam.” https://github.com/pysam-developers/pysam. Quinlan, Aaron R., and Ira M. Hall. 2010. “BEDTools: A Flexible Suite of Utilities for
Comparing Genomic Features.” Bioinformatics 26 (6). Narnia: 841–42. doi:10.1093/bioinformatics/btq033.
Rahbari, Raheleh, Arthur Wuster, Sarah J Lindsay, Robert J Hardwick, Ludmil B Alexandrov, Saeed Al Turki, Anna Dominiczak, et al. 2016. “Timing, Rates and Spectra of Human Germline Mutation.” Nature Genetics 48 (2). Nature Publishing Group: 126–33. doi:10.1038/ng.3469.
Ramakrishnan, V., T. Alu Alphonsa, RS Akram Husain, Shiek SSJ Ahmed, K. Subramaniyan, and Suresh Kumar. 2016. “Association of Rs1801582 and Rs1801334 PARK2 Polymorphisms with Risk of Parkinson’s Disease: A Case-Control Study in South India and Meta-Analysis.” Meta Gene 10 (December). Elsevier: 32–38. doi:10.1016/J.MGENE.2016.09.007.
Rao, Suhas S.P., Miriam H. Huntley, Neva C. Durand, Elena K. Stamenova, Ivan D. Bochkov, James T. Robinson, Adrian L. Sanborn, et al. 2014. “A 3D Map of the Human Genome at Kilobase Resolution Reveals Principles of Chromatin Looping.” Cell 159 (7). Cell Press: 1665–80. doi:10.1016/J.CELL.2014.11.021.
Rastan, Sohaila. 1994. “X Chromosome Inactivation and the Xist Gene.” Current Opinion in Genetics & Development 4 (2). Elsevier Current Trends: 292–97. doi:10.1016/S0959-437X(05)80056-5.
Rehen, Stevens K., Yun C. Yung, Matthew P. McCreight, Dhruv Kaushal, Amy H. Yang, Beatriz S. V. Almeida, Marcy A. Kingsbury, et al. 2005. “Constitutional Aneuploidy in the Normal Human Brain.” Journal of Neuroscience 25 (9). Society for Neuroscience: 2176–80. doi:10.1523/JNEUROSCI.4560-04.2005.
Reid, Evan, Mark Kloos, Allison Ashley-Koch, Lori Hughes, Simon Bevan, Ingrid K. Svenson, Felicia Lennon Graham, et al. 2002. “A Kinesin Heavy Chain (KIF5A) Mutation in Hereditary Spastic Paraplegia (SPG10).” The American Journal of Human Genetics 71 (5). Cell Press: 1189–94. doi:10.1086/344210.
Rentzsch, Philipp, Daniela Witten, Gregory M Cooper, Jay Shendure, and Martin Kircher. 2019. “CADD: Predicting the Deleteriousness of Variants throughout the Human Genome.” Nucleic Acids Research 47 (D1). Narnia: D886–94. doi:10.1093/nar/gky1016.
Rickman, L., H. Fiegler, N.P. Carter, and M. Bobrow. 2005. “Prenatal Diagnosis by Array-CGH.” European Journal of Medical Genetics 48 (3). Elsevier Masson: 232–40. doi:10.1016/J.EJMG.2005.03.003.
Ridge, Perry G., Shubhabrata Mukherjee, Paul K. Crane, John S. K. Kauwe, and Alzheimer’s Disease Genetics Consortium. 2013. “Alzheimer’s Disease: Analyzing the Missing Heritability.” Edited by Hemant K. Paudel. PLoS ONE 8 (11). Public Library of Science: e79771. doi:10.1371/journal.pone.0079771.
Rimoin, David L., Reed E. Pyeritz, and Bruce R. Korf. 2019. Emery and Rimoin’s Principles and Practice of Medical Genetics. Accessed April 25. https://www.sciencedirect.com/book/9780123838346/emery-and-rimoins-principles-and-practice-of-medical-genetics.
Riordan, J R, J M Rommens, B Kerem, N Alon, R Rozmahel, Z Grzelczak, J Zielenski, et al. 1989. “Identification of the Cystic Fibrosis Gene: Cloning and Characterization of Complementary DNA.” Science (New York, N.Y.) 245 (4922). American Association for the Advancement of Science: 1066–73. doi:10.1126/SCIENCE.2475911.
Robinson, H P. 1975. “The Diagnosis of Early Pregnancy Failure by Sonar.” British Journal of Obstetrics and Gynaecology 82 (11): 849–57. http://www.ncbi.nlm.nih.gov/pubmed/1191598.

170
Robinson, James T, Helga Thorvaldsdóttir, Wendy Winckler, Mitchell Guttman, Eric S Lander, Gad Getz, and Jill P Mesirov. 2011. “Integrative Genomics Viewer.” Nature Biotechnology 29 (1): 24–26. doi:10.1038/nbt.1754.
Romiguier, Jonathan, Vincent Ranwez, Emmanuel J P Douzery, and Nicolas Galtier. 2010. “Contrasting GC-Content Dynamics across 33 Mammalian Genomes: Relationship with Life-History Traits and Chromosome Sizes.” Genome Research 20 (8). Cold Spring Harbor Laboratory Press: 1001–9. doi:10.1101/gr.104372.109.
Ross, Michael G, Carsten Russ, Maura Costello, Andrew Hollinger, Niall J Lennon, Ryan Hegarty, Chad Nusbaum, and David B Jaffe. 2013. “Characterizing and Measuring Bias in Sequence Data.” Genome Biology 14 (5). BioMed Central: R51. doi:10.1186/gb-2013-14-5-r51.
Safaralizadeh, Tannaz, Javad Jamshidi, Ehsan Esmaili Shandiz, Abolfazl Movafagh, Atena Fazeli, Babak Emamalizadeh, Navid Manafi, Shaghayegh Taghavi, Abbas Tafakhori, and Hossein Darvish. 2016. “SIPA1L2, MIR4697, GCH1 and VPS13C Loci and Risk of Parkinson’s Diseases in Iranian Population: A Case-Control Study.” Journal of the Neurological Sciences 369 (October). Elsevier: 1–4. doi:10.1016/J.JNS.2016.08.001.
Sagoo, Gurdeep S, Adam S Butterworth, Simon Sanderson, Charles Shaw-Smith, Julian P T Higgins, and Hilary Burton. 2009. “Array CGH in Patients with Learning Disability (Mental Retardation) and Congenital Anomalies: Updated Systematic Review and Meta-Analysis of 19 Studies and 13,926 Subjects.” Genetics in Medicine 11 (3). Nature Publishing Group: 139–46. doi:10.1097/GIM.0b013e318194ee8f.
Sahu, Monalisha, and Josyula G Prasuna. 2016. “Twin Studies: A Unique Epidemiological Tool.” Indian Journal of Community Medicine : Official Publication of Indian Association of Preventive & Social Medicine 41 (3). Wolters Kluwer -- Medknow Publications: 177–82. doi:10.4103/0970-0218.183593.
Saleh-Gohari, Nasrollah, Helen E Bryant, Niklas Schultz, Kayan M Parker, Tobias N Cassel, and Thomas Helleday. 2005. “Spontaneous Homologous Recombination Is Induced by Collapsed Replication Forks That Are Caused by Endogenous DNA Single-Strand Breaks.” Molecular and Cellular Biology 25 (16). American Society for Microbiology Journals: 7158–69. doi:10.1128/MCB.25.16.7158-7169.2005.
Samarsky, D A, M J Fournier, R H Singer, and E Bertrand. 1998. “The SnoRNA Box C/D Motif Directs Nucleolar Targeting and Also Couples SnoRNA Synthesis and Localization.” The EMBO Journal 17 (13). European Molecular Biology Organization: 3747–57. doi:10.1093/emboj/17.13.3747.
Samorodnitsky, Eric, Benjamin M. Jewell, Raffi Hagopian, Jharna Miya, Michele R. Wing, Ezra Lyon, Senthilkumar Damodaran, et al. 2015. “Evaluation of Hybridization Capture Versus Amplicon-Based Methods for Whole-Exome Sequencing.” Human Mutation 36 (9). John Wiley & Sons, Ltd: 903–14. doi:10.1002/humu.22825.
Sancar, A. 1994. “Structure and Function of DNA Photolyase.” Biochemistry 33 (1): 2–9. http://www.ncbi.nlm.nih.gov/pubmed/8286340.
Sanger, F, S Nicklen, and A R Coulson. 1977. “DNA Sequencing with Chain-Terminating Inhibitors.” Proceedings of the National Academy of Sciences of the United States of America 74 (12). National Academy of Sciences: 5463–67. http://www.ncbi.nlm.nih.gov/pubmed/271968.
Saunders, A M, W J Strittmatter, D Schmechel, P H George-Hyslop, M A Pericak-Vance, S H Joo, B L Rosi, et al. 1993. “Association of Apolipoprotein E Allele Epsilon 4 with Late-Onset Familial and Sporadic Alzheimer’s Disease.” Neurology 43 (8). Wolters Kluwer Health, Inc. on behalf of the American Academy of Neurology: 1467–72. doi:10.1212/WNL.43.8.1467.
Schellenberg, G., T. Bird, E. Wijsman, H. Orr, L Anderson, E Nemens, J. White, et al. 1992. “Genetic Linkage Evidence for a Familial Alzheimer’s Disease Locus on

171
Chromosome 14.” Science 258 (5082). American Association for the Advancement of Science: 668–71. doi:10.1126/science.1411576.
Schluth-Bolard, Caroline, Bruno Delobel, Damien Sanlaville, Odile Boute, Jean-Marie Cuisset, Sylvie Sukno, Audrey Labalme, et al. 2009. “Cryptic Genomic Imbalances in de Novo and Inherited Apparently Balanced Chromosomal Rearrangements: Array CGH Study of 47 Unrelated Cases.” European Journal of Medical Genetics 52 (5). Elsevier Masson: 291–96. doi:10.1016/J.EJMG.2009.05.011.
Schormair, B., D. Kemlink, B. Mollenhauer, O. Fiala, G. Machetanz, J. Roth, R. Berutti, et al. 2018. “Diagnostic Exome Sequencing in Early-Onset Parkinson’s Disease Confirms VPS13C as a Rare Cause of Autosomal-Recessive Parkinson’s Disease.” Clinical Genetics 93 (3). John Wiley & Sons, Ltd (10.1111): 603–12. doi:10.1111/cge.13124.
Schrode, Nadine, Néstor Saiz, Stefano Di Talia, and Anna-Katerina Hadjantonakis. 2014. “GATA6 Levels Modulate Primitive Endoderm Cell Fate Choice and Timing in the Mouse Blastocyst.” Developmental Cell 29 (4). Cell Press: 454–67. doi:10.1016/J.DEVCEL.2014.04.011.
Schuster-Böckler, Benjamin, and Ben Lehner. 2012. “Chromatin Organization Is a Major Influence on Regional Mutation Rates in Human Cancer Cells.” Nature 488 (7412): 504–7. doi:10.1038/nature11273.
Seeberg, Erling, Lars Eide, and Magnar Bjørås. 1995. “The Base Excision Repair Pathway.” Trends in Biochemical Sciences 20 (10). Elsevier Current Trends: 391–97. doi:10.1016/S0968-0004(00)89086-6.
Sender, Ron, Shai Fuchs, and Ron Milo. 2016. “Revised Estimates for the Number of Human and Bacteria Cells in the Body.” PLOS Biology 14 (8). Public Library of Science: e1002533. doi:10.1371/journal.pbio.1002533.
Setlow, R.B., and W.L. Carrier. 1966. “Pyrimidine Dimers in Ultraviolet-Irradiated DNA’s.” Journal of Molecular Biology 17 (1): 237–54. doi:10.1016/S0022-2836(66)80105-5.
Sexton, Tom, Eitan Yaffe, Ephraim Kenigsberg, Frédéric Bantignies, Benjamin Leblanc, Michael Hoichman, Hugues Parrinello, Amos Tanay, and Giacomo Cavalli. 2012. “Three-Dimensional Folding and Functional Organization Principles of the Drosophila Genome.” Cell 148 (3). Cell Press: 458–72. doi:10.1016/J.CELL.2012.01.010.
Shankar, Ganesh M, Shaomin Li, Tapan H Mehta, Amaya Garcia-Munoz, Nina E Shepardson, Imelda Smith, Francesca M Brett, et al. 2008. “Amyloid-β Protein Dimers Isolated Directly from Alzheimer’s Brains Impair Synaptic Plasticity and Memory.” Nature Medicine 14 (8). Nature Publishing Group: 837–42. doi:10.1038/nm1782.
Shaw-Smith, C. 2004. “Microarray Based Comparative Genomic Hybridisation (Array-CGH) Detects Submicroscopic Chromosomal Deletions and Duplications in Patients with Learning Disability/Mental Retardation and Dysmorphic Features.” Journal of Medical Genetics 41 (4): 241–48. doi:10.1136/jmg.2003.017731.
Shearman, Clyde W., and Lawrence A. Loeb. 1977. “Depurination Decreases Fidelity of DNA Synthesis in Vitro.” Nature 270 (5637). Nature Publishing Group: 537–38. doi:10.1038/270537a0.
Shen, Jiang-Cheng, William M. Rideout, and Peter A. Jones. 1994. “The Rate of Hydrolytic Deamination of 5-Methylcytosine in Double-Stranded DNA.” Nucleic Acids Research 22 (6). Narnia: 972–76. doi:10.1093/nar/22.6.972.
Shen, R S, C W Abell, W Gessner, and A Brossi. 1985. “Serotonergic Conversion of MPTP and Dopaminergic Accumulation of MPP+.” FEBS Letters 189 (2): 225–30. http://www.ncbi.nlm.nih.gov/pubmed/3876242.
Shen, Yin, Feng Yue, David F. McCleary, Zhen Ye, Lee Edsall, Samantha Kuan, Ulrich Wagner, et al. 2012. “A Map of the Cis-Regulatory Sequences in the Mouse

172
Genome.” Nature 488 (7409). Nature Publishing Group: 116–20. doi:10.1038/nature11243.
Shibutani, Shinya, Masaru Takeshita, and Arthur P. Grollman. 1991. “Insertion of Specific Bases during DNA Synthesis Past the Oxidation-Damaged Base 8-OxodG.” Nature 349 (6308). Nature Publishing Group: 431–34. doi:10.1038/349431a0.
Simmons, A. D., M. M. Musy, C. S. Lopes, L.-Y. Hwang, Y.-P. Yang, and M. Lovett. 1999. “A Direct Interaction Between EXT Proteins and Glycosyltransferases Is Defective in Hereditary Multiple Exostoses.” Human Molecular Genetics 8 (12). Narnia: 2155–64. doi:10.1093/hmg/8.12.2155.
Singer, Tatjana, Michael J. McConnell, Maria C.N. Marchetto, Nicole G. Coufal, and Fred H. Gage. 2010. “LINE-1 Retrotransposons: Mediators of Somatic Variation in Neuronal Genomes?” Trends in Neurosciences 33 (8). Elsevier Current Trends: 345–54. doi:10.1016/J.TINS.2010.04.001.
Singleton, A. B., M. Farrer, J. Johnson, A. Singleton, S. Hague, J. Kachergus, M. Hulihan, et al. 2003. “α-Synuclein Locus Triplication Causes Parkinson’s Disease.” Science 302 (5646).
Siomi, Mikiko C., Kaoru Sato, Dubravka Pezic, and Alexei A. Aravin. 2011. “PIWI-Interacting Small RNAs: The Vanguard of Genome Defence.” Nature Reviews Molecular Cell Biology 12 (4). Nature Publishing Group: 246–58. doi:10.1038/nrm3089.
Sippel, Kimberly C., Rebecca E. Fraioli, Gary D. Smith, Mary E. Schalkoff, Joanne Sutherland, Brenda L. Gallie, and Thaddeus P. Dryja. 1998. “Frequency of Somatic and Germ-Line Mosaicism in Retinoblastoma: Implications for Genetic Counseling.” The American Journal of Human Genetics 62 (3). Cell Press: 610–19. doi:10.1086/301766.
Sironi, Francesca, Luca Trotta, Angelo Antonini, Michela Zini, Roberto Ciccone, Erika Della Mina, Nicoletta Meucci, et al. 2010. “α-Synuclein Multiplication Analysis in Italian Familial Parkinson Disease.” Parkinsonism & Related Disorders 16 (3). Elsevier: 228–31. doi:10.1016/J.PARKRELDIS.2009.09.008.
Sleegers, K., N. Brouwers, I. Gijselinck, J. Theuns, D. Goossens, J. Wauters, J. Del-Favero, M. Cruts, C. M. v. Duijn, and C. V. Broeckhoven. 2006. “APP Duplication Is Sufficient to Cause Early Onset Alzheimer’s Dementia with Cerebral Amyloid Angiopathy.” Brain 129 (11). Narnia: 2977–83. doi:10.1093/brain/awl203.
Slegtenhorst, M van, J Lewis, and M Hutton. 2000. “The Molecular Genetics of the Tauopathies.” Experimental Gerontology 35 (4). Pergamon: 461–71. doi:10.1016/S0531-5565(00)00114-5.
Snow, M. H. L. 1977. “Gastrulation in the Mouse: Growth and Regionalization of the Epiblast.” Development 42 (1).
Sohail, Mashaal, Robert M Maier, Andrea Ganna, Alex Bloemendal, Alicia R Martin, Michael C Turchin, Charleston WK Chiang, et al. 2019. “Polygenic Adaptation on Height Is Overestimated Due to Uncorrected Stratification in Genome-Wide Association Studies.” ELife 8 (March). doi:10.7554/eLife.39702.
Solinas-Toldo, S, S Lampel, S Stilgenbauer, J Nickolenko, A Benner, H Döhner, T Cremer, and P Lichter. 1997. “Matrix-Based Comparative Genomic Hybridization: Biochips to Screen for Genomic Imbalances.” Genes, Chromosomes & Cancer 20 (4): 399–407. http://www.ncbi.nlm.nih.gov/pubmed/9408757.
Song, Gwan Gyu, and Young Ho Lee. 2013. “Pathway Analysis of Genome-Wide Association Studies for Parkinson’s Disease.” Molecular Biology Reports 40 (3). Springer Netherlands: 2599–2607. doi:10.1007/s11033-012-2346-9.
Sørensen, Danny Mollerup, Tine Holemans, Sarah van Veen, Shaun Martin, Tugce Arslan, Ida Winther Haagendahl, Henrik Waldal Holen, et al. 2018. “Parkinson Disease Related ATP13A2 Evolved Early in Animal Evolution.” Edited by Darren J. Moore. PLOS ONE 13 (3). Public Library of Science: e0193228.

173
doi:10.1371/journal.pone.0193228. Spataro, Nino, Francesc Calafell, Laura Cervera-Carles, Ferran Casals, Javier
Pagonabarraga, Berta Pascual-Sedano, Antònia Campolongo, et al. 2015. “Mendelian Genes for Parkinson’s Disease Contribute to the Sporadic Forms of the Disease†.” Human Molecular Genetics 24 (7). Narnia: 2023–34. doi:10.1093/hmg/ddu616.
Spillantini, Maria Grazia, Marie Luise Schmidt, Virginia M.-Y. Lee, John Q. Trojanowski, Ross Jakes, and Michel Goedert. 1997. “α-Synuclein in Lewy Bodies.” Nature 388 (6645). Nature Publishing Group: 839–40. doi:10.1038/42166.
Srinivasan, Gayathri, Carey M James, and Joseph A Krzycki. 2002. “Pyrrolysine Encoded by UAG in Archaea: Charging of a UAG-Decoding Specialized TRNA.” Science (New York, N.Y.) 296 (5572): 1459–62. doi:10.1126/science.1069588.
St George-Hyslop, P., R. Tanzi, R. Polinsky, J. Haines, L Nee, P. Watkins, R. Myers, et al. 1987. “The Genetic Defect Causing Familial Alzheimer’s Disease Maps on Chromosome 21.” Science 235 (4791). American Association for the Advancement of Science: 885–90. doi:10.1126/science.2880399.
Staaf, Johan, Goran Jonsson, Markus Ringner, and Johan Vallon-Christersson. 2007. “Normalization of Array-CGH Data: Influence of Copy Number Imbalances.” BMC Genomics 8 (1). BioMed Central: 382. doi:10.1186/1471-2164-8-382.
Stamatoyannopoulos, John A, Ivan Adzhubei, Robert E Thurman, Gregory V Kryukov, Sergei M Mirkin, and Shamil R Sunyaev. 2009. “Human Mutation Rate Associated with DNA Replication Timing.” Nature Genetics 41 (4). Nature Publishing Group: 393–95. doi:10.1038/ng.363.
Stamper, Chelsea, Andrew Siegel, Winnie S. Liang, John V. Pearson, Dietrich A. Stephan, Holly Shill, Don Connor, et al. 2008. “Neuronal Gene Expression Correlates of Parkinson’s Disease with Dementia.” Movement Disorders 23 (11). John Wiley & Sons, Ltd: 1588–95. doi:10.1002/mds.22184.
Stankiewicz, Paweł, and James R. Lupski. 2010. “Structural Variation in the Human Genome and Its Role in Disease.” Annual Review of Medicine 61 (1). Annual Reviews : 437–55. doi:10.1146/annurev-med-100708-204735.
Stankiewicz, Paweł, and James R Lupski. 2002. “Genome Architecture, Rearrangements and Genomic Disorders.” Trends in Genetics : TIG 18 (2): 74–82. http://www.ncbi.nlm.nih.gov/pubmed/11818139.
Steen Steenken*, † and, and Slobodan V. Jovanovic‡. 1997. “How Easily Oxidizable Is DNA? One-Electron Reduction Potentials of Adenosine and Guanosine Radicals in Aqueous Solution.” American Chemical Society . doi:10.1021/JA962255B.
Stoddart, D., A. J. Heron, E. Mikhailova, G. Maglia, and H. Bayley. 2009. “Single-Nucleotide Discrimination in Immobilized DNA Oligonucleotides with a Biological Nanopore.” Proceedings of the National Academy of Sciences 106 (19): 7702–7. doi:10.1073/pnas.0901054106.
Strand, Micheline, Tomas A. Prolla, R. Michael Liskay, and Thomas D. Petes. 1993. “Destabilization of Tracts of Simple Repetitive DNA in Yeast by Mutations Affecting DNA Mismatch Repair.” Nature 365 (6443). Nature Publishing Group: 274–76. doi:10.1038/365274a0.
Su, Lining, Chunjie Wang, Chenqing Zheng, Huiping Wei, and Xiaoqing Song. 2018. “A Meta-Analysis of Public Microarray Data Identifies Biological Regulatory Networks in Parkinson’s Disease.” BMC Medical Genomics 11 (1). BioMed Central: 40. doi:10.1186/s12920-018-0357-7.
Sulston, J.E., E. Schierenberg, J.G. White, and J.N. Thomson. 1983. “The Embryonic Cell Lineage of the Nematode Caenorhabditis Elegans.” Developmental Biology 100 (1). Academic Press: 64–119. doi:10.1016/0012-1606(83)90201-4.
Sun, Jianlong, Azucena Ramos, Brad Chapman, Jonathan B. Johnnidis, Linda Le, Yu-Jui Ho, Allon Klein, Oliver Hofmann, and Fernando D. Camargo. 2014. “Clonal

174
Dynamics of Native Haematopoiesis.” Nature 514 (7522). Nature Publishing Group: 322–27. doi:10.1038/nature13824.
Supek, Fran, and Ben Lehner. 2015. “Differential DNA Mismatch Repair Underlies Mutation Rate Variation across the Human Genome.” Nature 521 (7550). Nature Publishing Group: 81–84. doi:10.1038/nature14173.
———. 2017. “Clustered Mutation Signatures Reveal That Error-Prone DNA Repair Targets Mutations to Active Genes.” Cell 170 (3). Elsevier: 534–547.e23. doi:10.1016/j.cell.2017.07.003.
Swinburne, Ian A., and Pamela A. Silver. 2008. “Intron Delays and Transcriptional Timing during Development.” Developmental Cell 14 (3). Cell Press: 324–30. doi:10.1016/J.DEVCEL.2008.02.002.
Tam, P P, and M H Snow. 1981. “Proliferation and Migration of Primordial Germ Cells during Compensatory Growth in Mouse Embryos.” Journal of Embryology and Experimental Morphology 64 (August): 133–47. http://www.ncbi.nlm.nih.gov/pubmed/7310300.
Tan, E-K, H-H Kwok, H-K Kwok, L C Tan, W-T Zhao, K M Prakash, W-L Au, et al. 2010. “Analysis of GWAS-Linked Loci in Parkinson Disease Reaffirms PARK16 as a Susceptibility Locus.” Neurology 75 (6). Wolters Kluwer Health, Inc. on behalf of the American Academy of Neurology: 508–12. doi:10.1212/WNL.0b013e3181eccfcd.
Tanzi, R., J. Gusella, P. Watkins, G. Bruns, P St George-Hyslop, M. Van Keuren, D Patterson, S Pagan, D. Kurnit, and R. Neve. 1987. “Amyloid Beta Protein Gene: CDNA, MRNA Distribution, and Genetic Linkage near the Alzheimer Locus.” Science 235 (4791). American Association for the Advancement of Science: 880–84. doi:10.1126/science.2949367.
Taub, Margaret A, Hector Corrada Bravo, and Rafael A Irizarry. 2010. “Overcoming Bias and Systematic Errors in next Generation Sequencing Data.” Genome Medicine 2 (12). BioMed Central: 87. doi:10.1186/gm208.
Tautz, Diethard. 1989. “Hypervariability of Simple Sequences as a General Source for Polymorphic DNA Markers.” Nucleic Acids Research 17 (16). Narnia: 6463–71. doi:10.1093/nar/17.16.6463.
The GTEx Consortium. 2013. “The Genotype-Tissue Expression (GTEx) Project.” Nature Genetics 45 (6). NIH Public Access: 580. doi:10.1038/NG.2653.
Thomas, David C, John D Roberts, Ralph D Sabatino, Thomas W Myers, Cheng-Keat Tan, Kathleen M Downey, Antero G So, Robert A Bambara, and Thomas A Kunkel. 1991. “Fidelity of Mammalian DNA Replication and Replicative DNA Polymerases1"” Biochemistry. Vol. 30. https://pubs.acs.org/sharingguidelines.
Thomas, Gregg W.C., Richard J. Wang, Arthi Puri, R. Alan Harris, Muthuswamy Raveendran, Daniel S.T. Hughes, Shwetha C. Murali, et al. 2018. “Reproductive Longevity Predicts Mutation Rates in Primates.” Current Biology 28 (19). Cell Press: 3193–3197.e5. doi:10.1016/J.CUB.2018.08.050.
Tilgner, Katarzyna, Stuart P. Atkinson, Anna Golebiewska, Miodrag Stojković, Majlinda Lako, and Lyle Armstrong. 2008. “Isolation of Primordial Germ Cells from Differentiating Human Embryonic Stem Cells.” STEM CELLS 26 (12): 3075–85. doi:10.1634/stemcells.2008-0289.
Vadgama, Nirmal, Alan Pittman, Michael Simpson, Niranjanan Nirmalananthan, Robin Murray, Takeo Yoshikawa, Peter De Rijk, et al. 2019. “De Novo Single-Nucleotide and Copy Number Variation in Discordant Monozygotic Twins Reveals Disease-Related Genes.” European Journal of Human Genetics, March. Nature Publishing Group, 1. doi:10.1038/s41431-019-0376-7.
Vaidya, Amita, Zhiyong Mao, Xiao Tian, Brianna Spencer, Andrei Seluanov, and Vera Gorbunova. 2014. “Knock-In Reporter Mice Demonstrate That DNA Repair by Non-Homologous End Joining Declines with Age.” Edited by Paul Hasty. PLoS Genetics 10 (7). Public Library of Science: e1004511. doi:10.1371/journal.pgen.1004511.

175
Valencia, Patricia, Anusha P Dias, and Robin Reed. 2008. “Splicing Promotes Rapid and Efficient MRNA Export in Mammalian Cells.” PNAS March. Vol. 4. https://www.pnas.org/content/pnas/105/9/3386.full.pdf.
Valente, Enza Maria, Patrick M Abou-Sleiman, Viviana Caputo, Miratul M K Muqit, Kirsten Harvey, Suzana Gispert, Zeeshan Ali, et al. 2004. “Hereditary Early-Onset Parkinson’s Disease Caused by Mutations in PINK1.” Science (New York, N.Y.) 304 (5674). American Association for the Advancement of Science: 1158–60. doi:10.1126/science.1096284.
Veeck, Lucinda L., and Nikica. Zaninovic. 2003. An Atlas of Human Blastocysts. Parthenon Pub. Group. https://www.crcpress.com/An-Atlas-of-Human-Blastocysts/Veeck-Zaninovic/p/book/9781842141694.
Visscher, Peter M., William G. Hill, and Naomi R. Wray. 2008. “Heritability in the Genomics Era — Concepts and Misconceptions.” Nature Reviews Genetics 9 (4). Nature Publishing Group: 255–66. doi:10.1038/nrg2322.
Vissers, Lisenka E L M, Bert B A de Vries, Kazutoyo Osoegawa, Irene M Janssen, Ton Feuth, Chik On Choy, Huub Straatman, et al. 2003. “Array-Based Comparative Genomic Hybridization for the Genomewide Detection of Submicroscopic Chromosomal Abnormalities.” American Journal of Human Genetics 73 (6). Elsevier: 1261–70. doi:10.1086/379977.
Vorsanova, Svetlana G., Alexei D. Kolotii, Ivan Y. Iourov, Viktor V. Monakhov, Elena A. Kirillova, Ilia V. Soloviev, and Yuri B. Yurov. 2005. “Evidence for High Frequency of Chromosomal Mosaicism in Spontaneous Abortions Revealed by Interphase FISH Analysis.” Journal of Histochemistry & Cytochemistry 53 (3). SAGE PublicationsSage CA: Los Angeles, CA: 375–80. doi:10.1369/jhc.4A6424.2005.
Wahls, W P, L J Wallace, and P D Moore. 1990. “The Z-DNA Motif d(TG)30 Promotes Reception of Information during Gene Conversion Events While Stimulating Homologous Recombination in Human Cells in Culture.” Molecular and Cellular Biology 10 (2). American Society for Microbiology Journals: 785–93. doi:10.1128/MCB.10.2.785.
Wang, K. S., J. E. Mullersman, and X. F. Liu. 2010. “Family-Based Association Analysis of TheMAPT Gene in Parkinson.” Journal of Applied Genetics 51 (4): 509–14. doi:10.1007/BF03208881.
Wang, Xiangting, Shigeki Arai, Xiaoyuan Song, Donna Reichart, Kun Du, Gabriel Pascual, Paul Tempst, Michael G Rosenfeld, Christopher K Glass, and Riki Kurokawa. 2008. “Induced NcRNAs Allosterically Modify RNA-Binding Proteins in Cis to Inhibit Transcription.” Nature 454 (7200). NIH Public Access: 126–30. doi:10.1038/nature06992.
Wang, Y H, and J Griffith. 1995. “Expanded CTG Triplet Blocks from the Myotonic Dystrophy Gene Create the Strongest Known Natural Nucleosome Positioning Elements.” Genomics 25 (2): 570–73. http://www.ncbi.nlm.nih.gov/pubmed/7789994.
Wang, Yiqin, Martin Picard, and Zhenglong Gu. 2016. “Genetic Evidence for Elevated Pathogenicity of Mitochondrial DNA Heteroplasmy in Autism Spectrum Disorder.” Edited by Santhosh Girirajan. PLOS Genetics 12 (10). Public Library of Science: e1006391. doi:10.1371/journal.pgen.1006391.
Wapner, Ronald J., Christa Lese Martin, Brynn Levy, Blake C. Ballif, Christine M. Eng, Julia M. Zachary, Melissa Savage, et al. 2012. “Chromosomal Microarray versus Karyotyping for Prenatal Diagnosis.” New England Journal of Medicine 367 (23). Massachusetts Medical Society : 2175–84. doi:10.1056/NEJMoa1203382.
Ward, Lucas D, and Manolis Kellis. 2012. “Interpreting Noncoding Genetic Variation in Complex Traits and Human Disease.” Nature Biotechnology 30 (11). Nature Publishing Group: 1095–1106. doi:10.1038/nbt.2422.
Watson, J. D., and F. H. C. Crick. 1953. “Molecular Structure of Nucleic Acids: A

176
Structure for Deoxyribose Nucleic Acid.” Nature 171 (4356). Nature Publishing Group: 737–38. doi:10.1038/171737a0.
Weinstein, E. David, and Josef Warkany. 1963. “Maternal Mosaicism and Down’s Syndrome (Mongolism).” The Journal of Pediatrics 63 (4). Mosby: 599–604. doi:10.1016/S0022-3476(63)80370-4.
Weiss, Lauren A., Yiping Shen, Joshua M. Korn, Dan E. Arking, David T. Miller, Ragnheidur Fossdal, Evald Saemundsen, et al. 2008. “Association between Microdeletion and Microduplication at 16p11.2 and Autism.” New England Journal of Medicine 358 (7). Massachusetts Medical Society : 667–75. doi:10.1056/NEJMoa075974.
Weng, Qinjie, Ying Chen, Haibo Wang, Xiaomei Xu, Bo Yang, Qiaojun He, Weinian Shou, et al. 2012. “Dual-Mode Modulation of Smad Signaling by Smad-Interacting Protein Sip1 Is Required for Myelination in the Central Nervous System.” Neuron 73 (4). Cell Press: 713–28. doi:10.1016/J.NEURON.2011.12.021.
West, Andrew B., Paul J. Lockhart, Casey O’Farell, and Matthew J. Farrer. 2003. “Identification of a Novel Gene Linked to Parkin via a Bi-Directional Promoter.” Journal of Molecular Biology 326 (1). Academic Press: 11–19. doi:10.1016/S0022-2836(02)01376-1.
Wickham, Hadley. 2009. Ggplot2 : Elegant Graphics for Data Analysis. Springer. Wiel, Mark A. van de, Kyung In Kim, Sjoerd J. Vosse, Wessel N. van Wieringen, Saskia M.
Wilting, and Bauke Ylstra. 2007. “CGHcall: Calling Aberrations for Array CGH Tumor Profiles.” Bioinformatics 23 (7): 892–94. doi:10.1093/bioinformatics/btm030.
Wilcox, Allen J., Clarice R. Weinberg, John F. O’Connor, Donna D. Baird, John P. Schlatterer, Robert E. Canfield, E. Glenn Armstrong, and Bruce C. Nisula. 1988. “Incidence of Early Loss of Pregnancy.” New England Journal of Medicine 319 (4): 189–94. doi:10.1056/NEJM198807283190401.
Wilkie, Gavin S., Kirsten S. Dickson, and Nicola K. Gray. 2003. “Regulation of MRNA Translation by 5′- and 3′-UTR-Binding Factors.” Trends in Biochemical Sciences 28 (4). Elsevier Current Trends: 182–88. doi:10.1016/S0968-0004(03)00051-3.
Will, Cindy L, and Reinhard Lührmann. 2011. “Spliceosome Structure and Function.” Cold Spring Harbor Perspectives in Biology 3 (7). Cold Spring Harbor Laboratory Press. doi:10.1101/cshperspect.a003707.
Williams-Gray, C. H., A. Goris, M. Saiki, T. Foltynie, D. A. S. Compston, S. J. Sawcer, and R. A. Barker. 2009. “Apolipoprotein E Genotype as a Risk Factor for Susceptibility to and Dementia in Parkinson’s Disease.” Journal of Neurology 256 (3). Steinkopff-Verlag: 493–98. doi:10.1007/s00415-009-0119-8.
Williams, Margot, Carol Burdsal, Ammasi Periasamy, Mark Lewandoski, and Ann Sutherland. 2012. “Mouse Primitive Streak Forms in Situ by Initiation of Epithelial to Mesenchymal Transition without Migration of a Cell Population.” Developmental Dynamics : An Official Publication of the American Association of Anatomists 241 (2). NIH Public Access: 270–83. doi:10.1002/dvdy.23711.
Williamson, Scott H., Melissa J. Hubisz, Andrew G. Clark, Bret A. Payseur, Carlos D. Bustamante, and Rasmus Nielsen. 2007. “Localizing Recent Adaptive Evolution in the Human Genome.” PLoS Genetics 3 (6): e90. doi:10.1371/journal.pgen.0030090.
Wingo, Thomas S, James J Lah, Allan I Levey, and David J Cutler. 2012. “Autosomal Recessive Causes Likely in Early-Onset Alzheimer Disease.” Archives of Neurology 69 (1). NIH Public Access: 59–64. doi:10.1001/archneurol.2011.221.
Wislocki, George B., and Edward W. Dempsey. 1948. “The Chemical Histology of the Human Placenta and Decidua with Reference to Mucopolysaccharides, Glycogen, Lipids and Acid Phosphatase.” American Journal of Anatomy 83 (1). John Wiley & Sons, Ltd: 1–41. doi:10.1002/aja.1000830102.
Xu, Bin, J Louw Roos, Phillip Dexheimer, Braden Boone, Brooks Plummer, Shawn Levy,

177
Joseph A Gogos, and Maria Karayiorgou. 2011. “Exome Sequencing Supports a de Novo Mutational Paradigm for Schizophrenia.” Nature Genetics 43 (9). Nature Publishing Group: 864–68. doi:10.1038/ng.902.
Xu, Chang. 2018. “A Review of Somatic Single Nucleotide Variant Calling Algorithms for Next-Generation Sequencing Data.” Computational and Structural Biotechnology Journal 16. Research Network of Computational and Structural Biotechnology: 15. doi:10.1016/J.CSBJ.2018.01.003.
Xu, Juanjuan, Rui Fang, Li Chen, Daozhen Chen, Jian-Ping Xiao, Weimin Yang, Honghua Wang, et al. 2016. “Noninvasive Chromosome Screening of Human Embryos by Genome Sequencing of Embryo Culture Medium for in Vitro Fertilization.” Proceedings of the National Academy of Sciences 113 (42): 11907–12. doi:10.1073/pnas.1613294113.
Xu, Yuan-Yuan, Song-Cun Wang, Da-Jin Li, and Mei-Rong Du. 2017. “Co-Signaling Molecules in Maternal–Fetal Immunity.” Trends in Molecular Medicine 23 (1). Elsevier Current Trends: 46–58. doi:10.1016/J.MOLMED.2016.11.001.
Yarosh, Daniel B., Mary Rice, Rufus S. Day, Robert S. Foote, and Sankar Mitra. 1984. “O6-Methylguanine-DNA Methyltransferase in Human Cells.” Mutation Research/DNA Repair Reports 131 (1). Elsevier: 27–36. doi:10.1016/0167-8817(84)90044-0.
Yengo, Loic, Julia Sidorenko, Kathryn E Kemper, Zhili Zheng, Andrew R Wood, Michael N Weedon, Timothy M Frayling, Joel Hirschhorn, Jian Yang, and Peter M Visscher. 2018. “Meta-Analysis of Genome-Wide Association Studies for Height and Body Mass Index in ∼700000 Individuals of European Ancestry.” Human Molecular Genetics 27 (20). Narnia: 3641–49. doi:10.1093/hmg/ddy271.
Yizhak, Keren, François Aguet, Jaegil Kim, Julian M Hess, Kirsten Kübler, Jonna Grimsby, Ruslana Frazer, et al. 2019. “RNA Sequence Analysis Reveals Macroscopic Somatic Clonal Expansion across Normal Tissues.” Science (New York, N.Y.) 364 (6444). American Association for the Advancement of Science: eaaw0726. doi:10.1126/science.aaw0726.
Yokota, Takanori, Kanako Sugawara, Kaoru Ito, Ryosuke Takahashi, Hiroyoshi Ariga, and Hidehiro Mizusawa. 2003. “Down Regulation of DJ-1 Enhances Cell Death by Oxidative Stress, ER Stress, and Proteasome Inhibition.” Biochemical and Biophysical Research Communications 312 (4): 1342–48. http://www.ncbi.nlm.nih.gov/pubmed/14652021.
Yu, Lan, James T Bennett, Julia Wynn, Gemma L Carvill, Yee Him Cheung, Yufeng Shen, George B Mychaliska, et al. 2014. “Whole Exome Sequencing Identifies de Novo Mutations in GATA6 Associated with Congenital Diaphragmatic Hernia.” Journal of Medical Genetics 51 (3). BMJ Publishing Group Ltd: 197–202. doi:10.1136/jmedgenet-2013-101989.
Yuan, Bo, Tamar Harel, Shen Gu, Pengfei Liu, Lydie Burglen, Sandra Chantot-Bastaraud, Violet Gelowani, et al. 2015. “Nonrecurrent 17p11.2p12 Rearrangement Events That Result in Two Concomitant Genomic Disorders: The PMP22-RAI1 Contiguous Gene Duplication Syndrome.” The American Journal of Human Genetics 97 (5). Cell Press: 691–707. doi:10.1016/J.AJHG.2015.10.003.
Zernicka-Goetz, Magdalena. 2006. “The First Cell-Fate Decisions in the Mouse Embryo: Destiny Is a Matter of Both Chance and Choice.” Current Opinion in Genetics & Development 16 (4). Elsevier Current Trends: 406–12. doi:10.1016/J.GDE.2006.06.011.
Zernicka-Goetz, Magdalena, Samantha A. Morris, and Alexander W. Bruce. 2009. “Making a Firm Decision: Multifaceted Regulation of Cell Fate in the Early Mouse Embryo.” Nature Reviews Genetics 10 (7). Nature Publishing Group: 467–77. doi:10.1038/nrg2564.
Zhang, B., S. Kirov, and J. Snoddy. 2005. “WebGestalt: An Integrated System for

178
Exploring Gene Sets in Various Biological Contexts.” Nucleic Acids Research 33 (Web Server). Narnia: W741–48. doi:10.1093/nar/gki475.
Zhang, J., and Simon N Powell. 2005. “The Role of the BRCA1 Tumor Suppressor in DNA Double-Strand Break Repair.” Molecular Cancer Research 3 (10): 531–39. doi:10.1158/1541-7786.MCR-05-0192.
Zink, Florian, Simon N Stacey, Gudmundur L Norddahl, Michael L Frigge, Olafur T Magnusson, Ingileif Jonsdottir, Thorgeir E Thorgeirsson, et al. 2017. “Clonal Hematopoiesis, with and without Candidate Driver Mutations, Is Common in the Elderly.” Blood 130 (6). American Society of Hematology: 742–52. doi:10.1182/blood-2017-02-769869.

179
SUPPLEMENTARY FIGURES

180

181
Figure S1. Per base sequence content at DV1C L3 FASTQ. FASTQC output plot for percentage of base pairs carrying each nucleotide (Y axis and the different colours) at each read position (X axis). DV1C L3 is shown as a representative example of every library.
Figure S2. Kmer profiles at DV1C L3 FASTQ. FASTQC output plot for kmer enrichment per read position.

182
Figure S3. Exome coverage distributions. Histograms showing the number of base pairs of the target region covered by each depth per sample. Tissues are on the X axis facets, blood (B), cerebellum (C), striatum (E), neocortex (N) and substantia nigra (S).
Figure S4. DV2C shares variants with DV8C. IGV screenshot showing a region where at one variant, DV8 is homozygous for the alternative allele while DV2 is heterozygous. For the other variant, DV2 is homozygous for the reference allele while DV8 is heterozygous. Vertical bars indicate the coverage per base pair and horizontal grey lines denote reads aligned to the region. Coloured bars indicate variants, with colour depending on the alleles: A (green), C (blue), G (brown) and T (red).
B C E N S
DV1DV2
DV3DV4
DV5DV6
DV7DV8
DV9DV10
0 30 60 90 120 150 180 0 30 60 90 120 150 180 0 30 60 90 120 150 180 0 30 60 90 120 150 180 0 30 60 90 120 150 180
0e+002e+054e+056e+058e+05
0e+002e+054e+056e+058e+05
0e+002e+054e+056e+058e+05
0e+002e+054e+056e+058e+05
0e+002e+054e+056e+058e+05
0e+002e+054e+056e+058e+05
0e+002e+054e+056e+058e+05
0e+002e+054e+056e+058e+05
0e+002e+054e+056e+058e+05
0e+002e+054e+056e+058e+05
Depth of coverage
Num
ber o
f bp
Exome coverage
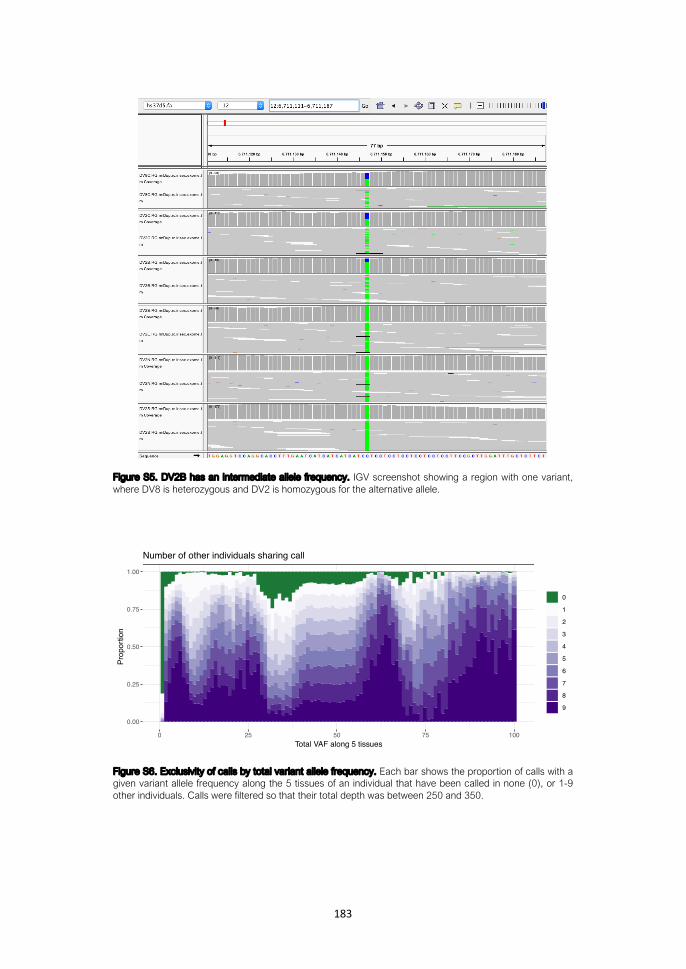
183
Figure S5. DV2B has an intermediate allele frequency. IGV screenshot showing a region with one variant, where DV8 is heterozygous and DV2 is homozygous for the alternative allele.
Figure S6. Exclusivity of calls by total variant allele frequency. Each bar shows the proportion of calls with a given variant allele frequency along the 5 tissues of an individual that have been called in none (0), or 1-9 other individuals. Calls were filtered so that their total depth was between 250 and 350.
0.00
0.25
0.50
0.75
1.00
0 25 50 75 100Total VAF along 5 tissues
Prop
ortio
n
0
1
2
3
4
5
6
7
8
9
Number of other individuals sharing call

184
Figure S7. Read pair ratio distribution. R1 depth to R1 + R2 depth ratio at positions with depth from 20 to 100 and alternative depth >4 (green). A binomial distribution with p=0.5 is shown in grey for comparison.
Figure S8. Intersection of calls filtered by number of variants within read length with other filters. Horizontal bars represent the number of variants that do not pass each filter at sample DV1S. Vertical bars correspond to the number of variants in the intersection indicated by the dots. ONT: not on target, BIN: failed binominal test, allBIN: failed binomial test at some tissues, NCALL: non-callable tracks, STB: strand bias, DP: depth <20 or >100, R1R2: read pair bias, OTHER: called in more than 1 other individuals’ tissue, PIR: biased position in read, AD: alternative allele depth <5, nRL: more than 3 variants within read length.
0e+00
1e+05
2e+05
3e+05
4e+05
0.0 0.1 0.2 0.3 0.4 0.5 0.6 0.7 0.8 0.9 1.0Read pair ratio
coun
t
Binomial
Empirical
1429 1410
507
377 365338 336 327
301243 224 218 210 187 173 158 150 148 142 128 120 111 108 99 99
0
500
1000
1500
Inte
rsec
tion
Size
nRL AD PIR
OTHER R1R2 DP STB
NCALL allBIN BIN ONT
02500500075001000012500Set Size

185
Figure S9. Log2 ratios by position for several samples. Log2 of red/green light intensities per probe (M, in the Y axis) by genomic position (X axis). Blood samples are tagged with “B” and hippocampus samples with “H”. Grey lines show limits between chromosomes. Colored bars mark deletions specific of an individual and shared between the tissues, two in individual 2M in blue and one in 1G in green.

186
Figure S10. Log2 ratio density at sex chromosomes. Log2 ratios of red to green light intensities at the X chromosome (blue) and the Y chromosome (red) for each individual and tissue.
Blood Hippocampus
1A1D
1E1G
2A2B
2C2G
2I2J
2L2M
2NC
T1AC
T1C
−2 −1 0 1 2 −2 −1 0 1 2Log2 ratio
dens
ityBlood Hippocampus
1B1F
1H2D
2E2F
2H2K
2O2P
CT1B
−2 −1 0 1 2 −2 −1 0 1 2Log2 ratio
dens
ity

187
Figure S11. MA plots for all arrays. Mean intensity of both channels (A) against log2 ratio (M) at each probe for each array. Blue lines are at M 0 of no copy number change and red lines are the regression lines.

188
Figure S12. MA plot after batch correction. MA plot of 1GB as an example of the dolphin distribution found after batch correction in some of the arrays.
Figure S13. Number of samples called for genes with 360 to 370 filtered probes. The number of samples were HFE, with 365 filtered probes, was called at is represented by the red line.
0
2
4
6
0 10 20 30 40Number of samples with filtered call overlapping the gene
coun
t

189
Figure S14. Filtered calls disease enrichment analysis. Overrepresentation enrichment analysis for OMIM genes of all filtered calls in the Alzheimer patients.
Figure S15. Copy number at control regions. mrCanavar copy number at control regions for each sample (solid lines) compared to a normal distribution with the same mean and standard deviation (dotted lines).
0 2 4 6 8 10 12 14 16 18 20 22Enrichment ratio
VELOCARDIOFACIAL SYNDROME
HYPERCHOLESTEROLEMIA, FAMILIAL
CENTRAL HYPOVENTILATION SYNDROME, CONGENITAL
ALCOHOL DEPENDENCE
SCHIZOPHRENIA
LEIGH SYNDROME
DIABETES MELLITUS, NONINSULIN-DEPENDENT
MITOCHONDRIAL COMPLEX I DEFICIENCY
TRACHEOESOPHAGEAL FISTULA WITH OR WITHOUT ESOPHAGEAL ATRESIA
LEUKEMIA, ACUTE MYELOID
FDR ≤ 0.05 FDR > 0.05
0.0
0.5
1.0
1.5
2.0
1.0 1.5 2.0 2.5 3.0Copy number
Dens
ity
Sample1BB
1BH
2NB
2NH
2MB
2MH
2KB
2KH
2OB
2OH
Copy number distribution on control regions

190
Figure S16. Copy number in and out of control regions. mrCanavar copy number distribution at control regions for each sample (colored violins) and outside control regions (grey violins).
Figure S17. aCGH segmented ratio distribution at WGS calls. Dark colors indicate log2 ratios are from the sample were the WGS call was made, whereas lighter colors show the log2 ratios of the other sequenced samples at those same calls.
0.0
0.5
1.0
1.5
2.0
Deletions Duplications
aCG
H ra
tio
0
1
2
3
4
5
6
7
1BB 1BH 2NB 2NH 2MB 2MH 2KB 2KH 2OB 2OHSample
Copy
Num
ber
Copy number at control vs non−control regions
Sample1BB
1BH
2KB
2KH
2MB
2MH
2NB
2NH
2OB
2OH
Non−control

191
SUPPLEMENTARY TABLES

192

193
Supplementary table 1. Genes reported at OMIM as involved in Parkinson disease. For each of the loci coordinates in hg19 (same as in hs37d5), the locus and gene names, if appropriate, are reported. Also, the inheritance reported at OMIM: Autosomal dominant (AD), autosomal recessive (AR) or association (AS).
Coordinates in hg19 Locus Gene name Inheritance
4:90645250-90759447 PARK1 SNCA AD
6:161768590-163148834 PARK2 PRKN AR
2:73114512-73119289 PARK3 SPR AR
4:90645250-90759447 PARK4 SNCA AD
4:41258898-41270446 PARK5 UCHL1 AD
1:20959948-20978004 PARK6 PINK1 AR
1:8021714-8045342 PARK7 DJ-1 AR
12:40618813-40763086 PARK8 LRRK2 AD
1:17312453-17338423 PARK9 ATP13A2 AR
- PARK10 - -
2:233562015-233725289 PARK11 GIGYF2 AD
- PARK12 - -
2:74756532-74760683 PARK13 HTRA2 AD
22:38507502-38577761 PARK14 PLA2G6 AR
22:32870707-32894818 PARK15 FBXO7 AR
- PARK16 - -
16:46693589-46723144 PARK17 VPS35 AD
3:184032283-184053146 PARK18 EIF4G1 AD
1:65775218-65881552 PARK19 DNAJC6 AR
21:34001069-34100351 PARK20 SYNJ1 AR
3:132136553-132257876 PARK21 DNAJC13 AD
7:56169266-56174187 PARK22 CHCHD2 AD
15:62144590-62352664 PARK23 VPS13C AR
1:155204239-155214653 - GBA AS
4:100257649-100273917 - ADH1C AS
6:170863421-170881958 - TBP AS
12:111890018-112037480 - ATXN2 AS
13:70681345-70713885 - ATXN8OS AS
17:43971748-44105699 - MAPT AS
X:120181462-120183796 - GLUD2 AS
16:89984287-89987385 - MC1R AS
6:28477797-33448354 - HLA AS
14:92524896-92572965 - ATXN3 AS

194
Supplementary table 2. SNPs associated to PD. List of SNPs previously associated to PD in GWAS.
dnSNP ID hg19 coordinates
rs797906 1:54190695
rs114138760 1:154898185
rs10737170 1:156063880
rs6710823 2:135592381
rs4954218 2:135803425
rs2390669 2:169091942
rs2102808 2:169117025
rs9917256 2:169143035
rs7617877 3:28705764
rs34016896 3:160992864
rs11248051 4:858332
rs6599389 4:939113
rs34884217 4:944210
rs11248060 4:964359
rs1596117 4:77151490
rs356219 4:90637601
rs356220 4:90641340
rs356165 4:90646886
rs2736990 4:90678541
rs13201101 6:32343604
rs3129882 6:32409530
rs1801582 6:161807855
rs12718379 8:16860077
rs1805874 8:91082062
rs2205108 8:91136078
rs7077361 10:15561543
rs10886515 10:121343589
rs1079597 11:113296286
rs1994090 12:40428561
rs1491923 12:40591117
rs1491942 12:40620808
rs11175655 12:40623727
rs34637584 12:40734202
rs10847864 12:123326598
rs4889603 16:30982225
rs12456492 18:40673380
rs4130047 18:40678235
rs117022814 19:2209647
rs7412 19:45412079
rs2823357 21:16914905
rs2010795 21:45172628

195
Supplementary table 3. Samples hybridized in array CGH.
Codes Diagnosis Braak Stage
1G Alzheimer II
1A Alzheimer III
2G Alzheimer III
2A Alzheimer IV
2J Alzheimer IV
2I Alzheimer V
2L Alzheimer V
1D Alzheimer V
2C Alzheimer VI
2N Alzheimer VI
2M Alzheimer VI
2B Vascular Dementia I
1EH Vascular Dementia II
CT1A Control -
CT1C Control -
1B Alzheimer III
1F Alzheimer V
1H Alzheimer IV
2D Alzheimer VI
2F Alzheimer V
2E Alzheimer III
2H Alzheimer VI
2K Alzheimer IV
2O Alzheimer VI
2P Alzheimer NA
CT1B Control -
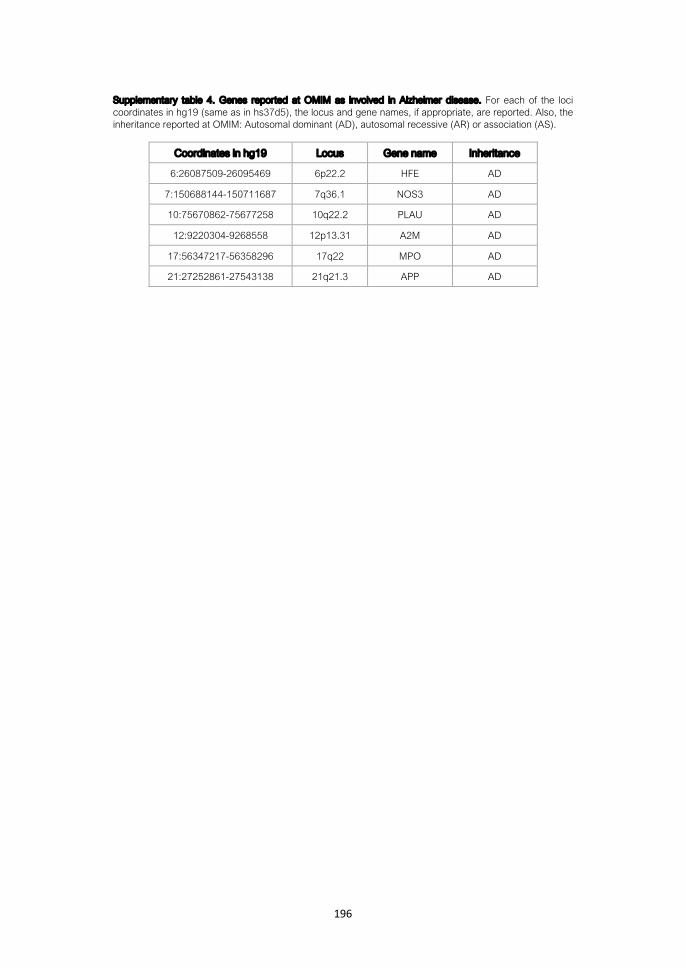
196
Supplementary table 4. Genes reported at OMIM as involved in Alzheimer disease. For each of the loci coordinates in hg19 (same as in hs37d5), the locus and gene names, if appropriate, are reported. Also, the inheritance reported at OMIM: Autosomal dominant (AD), autosomal recessive (AR) or association (AS).
Coordinates in hg19 Locus Gene name Inheritance
6:26087509-26095469 6p22.2 HFE AD
7:150688144-150711687 7q36.1 NOS3 AD
10:75670862-75677258 10q22.2 PLAU AD
12:9220304-9268558 12p13.31 A2M AD
17:56347217-56358296 17q22 MPO AD
21:27252861-27543138 21q21.3 APP AD

197
List of publications
Lobon, I., S. Tucci, M. De Manuel, S. Ghirotto, A. Benazzo, J. Prado-Martinez, B. Lorente-Galdos, et al. 2016. “Demographic History of the Genus Pan Inferred from Whole Mitochondrial Genome Reconstructions.” Genome Biology and Evolution 8 (6). doi:10.1093/gbe/evw124. Olalde, I., H. Schroeder, M. Sandoval-Velasco, L. Vinner, I. Lobón, O. Ramirez, S. Civit, et al. 2015. “A Common Genetic Origin for Early Farmers from Mediterranean Cardial and Central European LBK Cultures.” Molecular Biology and Evolution 32 (12). doi:10.1093/molbev/msv181. Xue, Y., J. Prado-Martinez, P.H. Sudmant, V. Narasimhan, Q. Ayub, M. Szpak, P. Frandsen, Y. Chen, B. Yngvadottir, D. N. Cooper, M. de Manuel, J. Hernandez-Rodriguez, I. Lobon, et al. 2015. “Mountain Gorilla Genomes Reveal the Impact of Long-Term Population Decline and Inbreeding.” Science 348 (6231). doi:10.1126/science.aaa3952.