Embed Size (px)
Citation preview

P1: NTAP1: NTA
Journal of Sol-Gel Science and Technology KL545-08-INOUE January 20, 1998 9:5
Journal of Sol-Gel Science and Technology 11, 67–86 (1998)c© 1998 Kluwer Academic Publishers. Manufactured in The Netherlands.
Detection of Gaseous Molecules by Capacitance Variationin Organically Modified Silicate (Ormosil) Films
HIROYUKI INOUE∗, SUNG-SOON PARK†, ERIC P. BESCHER, YUHUAN XU AND JOHN D. MACKENZIEDepartment of Materials Science and Engineering, University of California, Los Angeles, CA 90025, U.S.A.
Received May 14, 1997; Accepted October 23, 1997
Abstract. The sorption properties of organically modified silicates (Ormosil) and Ormosil/TEOS films wereinvestigated using a capacitor system. The accuracy of the capacitance measurement was less than 0.05 pF. Thecapacitance variation obtained was converted to a form of the partition coefficient which is related to the sorptionproperty of the detector materials. The sorption properties can be explained by the reactivity of hydrogen-bonds ofthe chemical groups in Ormosils.
The Karhunen-Loeve expansion, which is a pattern recognition technique, was used to obtain information onthe hydrogen-bonding interaction between Ormosils, Ormosil/TEOS and four different gases. The character of thesorption properties of Ormosils varied widely from basic (amino and cyano groups) to acidic (silanol group). Thepatterns of 4 Ormosils and TEOS from the viewpoint of the acidity and basicity are similar to those shown by otherorganic detection-coatings.
Keywords: gas sensor, capacitor system, Ormosil film, Karhunen-Loeve expansion
1. Introduction
Gas sensor systems with sensor arrays in conjunctionwith pattern recognition or neural networks have sev-eral advantages for the identification and quantitativeanalysis of gases in contrast to the use of individ-ual sensor elements [1–4]. One typical sensor array,known as the “electronic nose”, utilizes tin oxide [5–9].The requirement for the sensitivities of sensor ele-ments in the array is that they broadly overlap eachother. The selectivity of tin oxide gas sensors can becontrolled by various factors including the operatingtemperature, the particle size of the sintered tin ox-ide and the choice of the dopant materials [10]. Inthe field of sensor arrays, many types of materialscan be used to detect gaseous molecules and a num-
∗Present address: Department of Materials Science, School ofEngineering, University of Tokyo, Tokyo 113, Japan.†Present address: Technology Division, Samsung Display DevicesCo., Ltd., Kyungki-Do, 442-390, Korea.
ber of transducers can be used to convert reaction orphysicochemical interactions to electrical or opticalsignals. Surface acoustic wave (SAW) devices [11–15]have also been used in this field. The transducer actsas a highly sensitive microbalance which measuresthe mass increase of a coating film due to adsorbedor absorbed gaseous molecules. Selectivity and sensi-tivity are achieved by dipole/dipole and/or hydrogen-bonding interactions of the organic detector coatingswith the gaseous molecules. Numerous organic poly-mers have various kinds of chemical groups, which ex-hibit a variety of selectivity and sensitivity. Therefore,organic polymers are most suitable materials for SAWdevices.
Organically modified silicates (Ormosils) whichhave organic groups covalently bonded to a Si atom,should also have sensitivity and selectivity for gaseousmolecules. Indeed, Schmidt [16] has reported that Or-mosils which have secondary or tertiary amino groupshave high sensitivity for gaseous SO2 by means of SAWdevices and interdigitated capacitors. The objective of

P1: NTAP1: NTA
Journal of Sol-Gel Science and Technology KL545-08-INOUE January 20, 1998 9:5
68 Inoue et al.
this research is to further study the behavior of Ormosilsand to evaluate the capability of the materials for sensorarrays, especially through a capacitance variation ap-proach.
The partition coefficient,K = Cs/Cv, which is de-fined as the ratio of the concentration of the adsorbedand absorbed molecules in the detector coating,Cs, tothe concentration of the gaseous molecule in the va-por phase,Cv, is an important parameter to representthe individual sorption properties of the materials. Thepartition coefficient can be estimated using linear sol-vation energy relationships (LSER) [17]:
log K = c+ r R2+ sπ∗2 +aαH2 + bβH
2 + l log L16 (1)
where the variablesR2, π∗2 , α
H2 , β
H2 and logL16 are the
parameters of an individual gaseous molecule.R2 andπ∗2 , indicate polarizability and dipolarity,αH
2 andβH2
describe the abilities to donate and accept a proton,respectively. logL16 is the dispersion parameter. Theconstantc arises from the method of multiple linearregression. The coefficientsr, s,a, b andl indicate the
Figure 1. Apparatus of gas detection by capacitance variation.
ability of the detector coatings to interact with a gaseousmolecule by various mechanisms. The partition coef-ficient, K , are converted from the capacitance varia-tion and the sorption properties of several Ormosilsand their patterns of the responses are discussed.
2. Experimental
2.1. Detection Method
The organic materials or Ormosils were deposited onITO coated substrates purchased from Asahi Glass Co.,Ltd. Four pieces of microscope cover glass of thick-ness about 100µm, were held between two coatedITO-substrates. A pair of ITO thin films worked aselectrodes with 33× 33 mm2 area and the capacitanceof the cell was around 100 pF. The cell was connectedto an impedance analyzer (HP 4192A) and was set in a200 ml vessel as shown Fig. 1. The complex impedancewas measured from 10 to 100 kHz. In a typical experi-ment, the cell was exposed to dry air flow (400 ml/min)for 1 hour to remove the adsorbed gaseous molecules

P1: NTAP1: NTA
Journal of Sol-Gel Science and Technology KL545-08-INOUE January 20, 1998 9:5
Detection of Gaseous Molecules 69
Table 1. The parameters,π∗2 , βH2 andαH
2 in LSER [17], boiling point, b.p., permanent dipolemoment,µ, and molecular polarizability,α, of the gasses used.
Boiling Permanent Molecularpoint dipole moment polarizability
b.p. (◦C) µ (D) α (a.u.) π∗2 βH2 αH
2
Water H2O 100 1.87 9.82 1.09 0.18 1.17
Methanol Methanol 65 1.70 21.9 0.60 0.62 0.93
1-Butanol 1-BTL 117.7 1.66 — 0.47 0.88 0.79
2-Butanone 2-BTN 80 2.78 — 0.67 0.48 0.0
and to establish a base line response. After the air flowwas stopped, gaseous samples for the sorption wereintroduced as liquids by a microliter syringe. The re-sponse of the cell was recorded every 2 min for 1 hourand the saturated value of the complex impedance wasobtained.
2.2. Films and Gases
This study was divided into two parts: (a) collectionof sorption properties of organic materials which havebeen already reported by means of SAW devices [11]and (b) application of the system to Ormosil films.Gases used are listed in Table 1 together with theirsolubility parameters [17] and other physical proper-ties.
(a) A list of the coating organic materials and their ab-breviations used are given in Table 2. The coatingmaterials poly(vinlypyrrolidone) (PVP), poly(epi-chlorohydrin) (PECH), abietic acid (ABACD) and
Table 2. Coating organic materials and rawmaterials of Ornosils.
Organic materials
Poly(vinylpyrrolidone) PVP
Poly(epichlorohydrin) PECH
Abietic acid ABACD
Poly(isoprene) PIP
Ormosils
3-Aminopropyl triethoxy silane A0750
2-Cyanoethyl triethoxy silane C3433
Phenyl triethoxy silane P0320
Vinyl triethoxy silane V4910
Tetraethoxysilane TEOS
poly(isoprene) (PIP) were purchased from AldrichChemical Company, Inc. Dilute solutions of thecoating materials were prepared in chloroform ortetrahydrofuran. Organic films were prepared onthe ITO-substrates by dip-coating and the thick-ness of the films was about 1µm and dried at 60◦Cfor 12 h.
(b) Raw materials of Ormosils and the abbreviationsused are listed in Table 2. Organically modifiedsilanes were purchased from United ChemicalTechnologies, Inc. Starting solutions of organicmodified silane (or mixture of the silane andTEOS), ethanol, water and HCl with a molar ratioof 1 : 2 : 4 : 0.01 were prepared. After fixed periodsat room temperature, for example 10 days and 100days, films were prepared by dip- or spin-coatingand heat-treated at 150◦C for 10 min. The thick-ness of the Ormosil films was from 0.5 to 5µm.
3. Results
3.1. Measurement System and Sorption Propertiesof Organic Materials
These gases listed in Table 1 were selected to com-pare their solubility properties in the detector coatings.The complex impedance of the cell with the organicand Ormosil films could be measured from 2 or 3 kHzto 13 MHz. Figure 2(a) shows the observed compleximpedance,Z = Z′ −i Z ′′, with i = √−1 . The re-actance,Z′′, increased with decreasing the frequencyand at low frequency the magnitude of the reactancereached more than two orders of magnitude larger thanthe resistance,Z′. As a first approximation the equiv-alent electrical circuit shown in Fig. 2(b) was adoptedto analyze the complex impedance and response of thecell for the exposure of the gaseous molecules. The

P1: NTAP1: NTA
Journal of Sol-Gel Science and Technology KL545-08-INOUE January 20, 1998 9:5
70 Inoue et al.
Figure 2(a). The observed complex impedance plot of the cell to-gether with the calculated one from the equivalent electrical circuitdescribed in Fig. 2(b).
Figure 2(b). The equivalent electrical circuit.
capacitance,C2, on the basis of the equivalent electri-cal circuit is given by
C2 = Z′′
ω(Z′2+ Z′′2)(2)
whereω is an angular frequency. Figure 3 shows thatthe values ofC2 were independent on the frequency intwo frequency regions, one was lower than 100 kHzand the other was from 200 kHz to 1 MHz. This curvewas considered that at least two different time con-stant,τi = Ci Ri , existed though the practical mean-ing of them could not be understood. Figure 4 showsthe change of theC2 for the sorption of Methanolmolecules observed several frequencies. The actualvalue of theC2 had a little discrepancy for each fre-quency but the variation of the capacitance,1C2, wasapproximately same and indicated the response of the
exposure of the gaseous molecule. The variation ofthe capacitance of the cell was defined as an aver-age of seven values of the1C2 measured at 10, 15,20, 30, 50, 70 and 100 kHz and the error bar wasdescribed by the maximum and minimum values ofthe1C2. Figures 5(a) and (b) show the typical res-ponses for Methanol/PVP and H2O/PVP pairs. Severalµl of Methanol or H2O were injected in the vessel attime 0. The capacitance of the cell increased graduallyand saturated values were reached in about 10 min-utes. The values decreased gradually and returned tothe baseline values after air flow started at 60 min.The responses,1C2, increased almost linearly withincreasing concentrations of the gaseous molecules.Figure 6 shows the relationship between the1C2 andthe concentration of the gaseous molecules. The datatreatment and the comparison with the results of SAWdevices are discussed in Section 4.1. A linear relation-ship was also observed for other combinations of thegaseous molecules and detector coatings. As can beseen from the figures, the error of the capacitance mea-surement was around±0.03 pF. The detection limits ofH2O and Methanol estimated for the system using PVPfilm from Fig. 6 were about 2000 and 3000 ppm, res-pectively. 1-BTL was not easy to detect because of itshigher boiling point and lower vapor pressure at roomtemperature.
The response times of our systems were much longerthan those reported by Ballantine et al. [11] for a SAWdevice. For example, in their systems the response usu-ally reached 90% for total response within 1 min, whileour system needed about 10 min. The response timesfor the same material in our system were in the orderof the boiling point of the gaseous samples. The longerresponse time was due to the introduction of the sampleas a liquid phase and the narrow gap between the twocoatings of our system.
3.2. Adsorption Behaviors of Ormosils
Figures 7(a)–(d) show the typical responses of thecombination of gaseous molecules and pure Ormosilfilms. The films were prepared from the sol solutionwhich were aged less than 10 days. The responseswere normalized at 1000 ppm of the concentrationof the gaseous molecules. A0750 exhibited muchhigher sensitivity to H2O and Methanol than the otherOrmosils. C3433 exhibited high sensitivity to 1-BTL.P0320 and V4910 were sensitive to 1-BTL and 2-BTN.The variation of the responses for each coating material

P1: NTAP1: NTA
Journal of Sol-Gel Science and Technology KL545-08-INOUE January 20, 1998 9:5
Detection of Gaseous Molecules 71
Figure 3. The calculated capacitanceC2 from the complex impedance curve.
indicated that the response was caused by the sorptionof the gaseous molecules.
The nature of the observed responses can be ex-plained by the surface and interior the chemical groupsof the films. WhileαH
2 andβH2 in LSERs indicate the
abilities of the hydrogen-bonddonorandacceptorofgaseous molecules,a andb indicate those ofacceptoranddonor of the detector coatings, respectively. Asaliphatic amines have strong basicity,βH
2 ∼ 0.7, andnegligible acidity,αH
2 ∼ 0. A0750 has the aliphaticamine group, NH2, which accepts the hydrogen-bond. Therefore, A0750 has a large value of the pa-rameter,a, and indicated high sensitivities for H2Oand Methanol which have relatively largeαH
2 parame-ters. Nitrils, which have a cyano group, have weakerbasicity,βH
2 ∼ 0.4, than animes. C3433 which hascyano group, C N, indicated less sensitivities forH2O and Methanol than A0750. On the contrary, silaneis hydrolyzed to form a silanol group,Si OH, whichnow acts as a weak acid. Therefore, the frameworkof Ormosils have larger values of parameter,b, thanthe above two chemical groups. The high sensitivity
of C3433 for 1-BTL, of whichβH2 is the highest in
the four gases, indicated that the silanol group inter-act with the gaseous molecule. The organic groups inP0320 and V4910 are phenyl and vinyl groups. Thesechemical groups have little influence on the hydrogen-bond. The responses of the P0320 and V4910 are dueto the silanol groups, which interacted with gaseousmolecules with higherβH
2 parameter. These featuresof the sorption properties can be explained by the re-activity of hydrogen-bond of the chemical groups inOrmosils. The concentration of the chemical groupsvary with a progress of the hydrolysis and condensationreactions. The influence of aging precursor solutionsare described in Section 4.2.
4. Discussion
4.1. Partition Coefficients of Organic Materials
The capacitance of the cell,C2, can be simply con-sidered on the basis of a layer structure parallel to the

P1: NTAP1: NTA
Journal of Sol-Gel Science and Technology KL545-08-INOUE January 20, 1998 9:5
72 Inoue et al.
Figure 4. The variation of the capacitance,1C2, of the cell measured using (a) 10 kHz, (b) 50 kHz and (c) 100 kHz. At time 0 min 1.5µlMethanol was injected and at 60 min air flow was started.
applied field. Thus
C2 = Aε1ε2
ε1d2+ ε2d1ε0 (3)
whereA is an area of electrodes andd1 andd2 are thegap distance between two films and the total thicknessof the films, respectively.ε1 andε2 are the permittiv-ities of the gap and the films, respectively, andε0 isthe permittivity of vacuum. Assuming that the vari-ation of the capacitance,1C2, is approximately dueto the change of the permittivity,1ε, of the detectorcoating by the adsorption of the gaseous molecules the
variation of the capacitance is given by
1C2 = Aε1(ε2+1ε)ε1d2+ (ε2+1ε)d1
ε0− C2
= Aε21d21ε
(ε1d2+ ε2d1)[ε1d2+ (ε2+1ε)d1]ε0. (4)
If we assume for simplicity that the permittivity of theadsorbed gaseous molecule is the same as that in thevapor phase,1ε is given by
(1+1ε)− 1
(1+1ε)+ 2= ρm
(Nα
3+ Nµ2
9kT
)/ε0 (5)

P1: NTAP1: NTA
Journal of Sol-Gel Science and Technology KL545-08-INOUE January 20, 1998 9:5
Detection of Gaseous Molecules 73
Figure 5(a). Response curves for Methanol/PVP pairs. The maximum and minimum values of the variation of the capacitance were describedby the error bar [(a) 5× 10³ ppm, (b) 1.0× 10⁴ ppm, (c) 1.5× 10⁴ ppm, (d) 2.0× 10⁴ ppm].
whereρm is a molar density,α is a molecular po-larizability, µ is a permanent dipole moment of agaseous molecule,N is the Avogadro constant,k isthe Boltzman’s constant andT is the absolute temper-ature. Inserting1ε in Eq. (5) into Eq. (4), the densityof the molecule in the film,ρm, is given by
ρm=(
Nα
3+ Nµ2
9kT
)−1
× ε2(ε1d2+ ε2d1)1C2
3C2ε1d2+ ε2(ε1d2+ ε2d1− 3d1)1C2ε0. (6)
As an example, let us calculate the capacitance change.Using typical valuesε1 ∼ 1, ε2 = 2.8, d1 = 100µmandd2 = 0.5 µm,1C2 = 0.05 pF at 2500 ppm H2O,we obtainC2 = 96.3 pF,ρm = 3.69×10³ mol/m3 andpartition coefficient,K = 3.31× 10⁴, respectively.
In this experimental condition, it is difficult to measurebothε2 andd1 accurately. Therefore, ifd1 is eliminatedin Eq. (6), we obtain
ρm =(
Nα
3+ Nµ2
9kT
)−1
× Aε221C2
3d2(C2+1C2)C2+ Aε2(ε2− 3)ε01C2ε2
0.
(7)
In the denominator in Eq. (7), the first term, 3d2C22, is
dominant in this condition. Therefore,ρm andK is ap-proximately proportional to the square ofε2. Althoughthe absolute value ofK cannot be obtained withoutthe permittivity of the film,ε2, the centralized logK ,log Ki − 1
n
∑ni=1 log Ki , is independent on the value of
theε2. The partition coefficient can be estimated from

P1: NTAP1: NTA
Journal of Sol-Gel Science and Technology KL545-08-INOUE January 20, 1998 9:5
74 Inoue et al.
Figure 5(b). Response curves for H2O/PVP pairs [(a) 2.5× 10³ ppm, (b) 5.0× 10³ ppm, (c) 7.5× 10³ ppm, (d) 1.0× 10⁴ ppm].
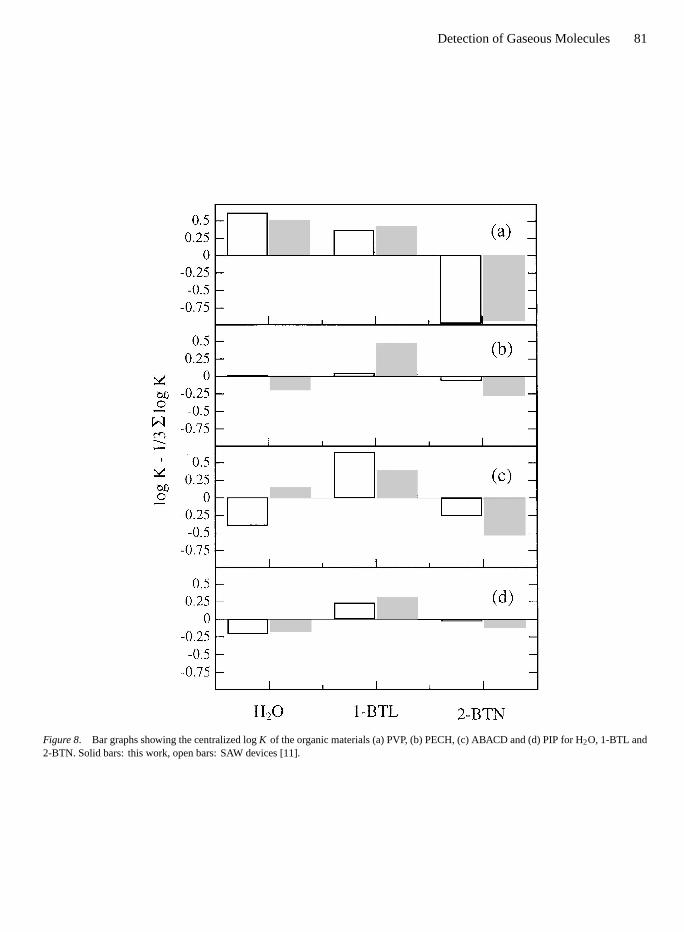
the result of SAW device, assuming that the densitiesof the detector coatings are 1.0 g/cm3. Even if thereare both unknown parameter in the data conversion,that is, the permittivities and the densities of the de-tector coatings, it is found that the centralized logKestimated from both measurements are independent onthe measurement methods and its condition. Figure 8shows the comparison of the both centralized logK ofH2O, 1-BTL and 2-BTN. The values of the centralizedlog K for PVP and PIP agreed well with the results fromSAW devices. For PECH the variations were larger butthe order of the partition coefficients agreed with them.The partition coefficient of the H2O/ABACD pair waslarger than others. Assuming theε2 = 1.2, 1.6, 2.8 and2.0 for PVP, PECH, ABACD and PIP, the values ofKagreed substantially with those estimated form SAWdevices and are listed in Table 3.
4.2. Response Patterns of Ormosil Films
The partition coefficients of the Ormosil films esti-mated fromε2 = 2.8 are listed in Table 4. Films frommixtures of A0750 and TEOS could not be preparedsince the mixture gelled too rapidly. The precursor so-lution of C3433 and TEOS gelled in less than 100 days.On the basis of the LSER equation (1) the several pa-rameters can be estimated using the multiple linear re-gression. Unfortunately the parametersR2 and logL16
of the gaseous molecules used are unknown and thevariation of the values of theπ∗2 are resemble to thatof theαH
2 . If the effects ofr R2, l log L16 andsπ∗2 arenegligible to logK andε2 = 2.8, the parametera, bandc of the Ormosil films can be estimated. The val-ues ofa, the ability of hydrogen-bondacceptor, andb,hydrogen-bonddonor, obtained are listed in Table 5.

P1: NTAP1: NTA
Journal of Sol-Gel Science and Technology KL545-08-INOUE January 20, 1998 9:5
Detection of Gaseous Molecules 75
Table 3. The partition coefficients,K , and logK of the organic materials con-verted from the capacitance variation and results of SAW devices [11].
Partition coefficientK (log K )
H2O Methanol 1-BTL 2-BTN
Capacitance variation
PVP 5680 (3.75) 3940 (3.60) 4520 (3.66) 210 (2.31)
PECH 720 (2.86) 420 (2.63) 3320 (3.52) 610 (2.78)
ABACD 3120 (3.49) 2130 (3.33) 5380 (3.73) 660 (2.82)
PIP 150 (2.18) 60 (1.78) 460 (2.67) 180 (2.24)
SAW device [11]
PVP 5970 (3.78) — 3320 (3.52) 160 (2.19)
PECH 750 (2.87) — 790 (2.90) 620 (2.79)
ABACD 500 (2.70) — 5440 (3.74) 680 (2.83)
PIP 110 (2.05) — 300 (2.48) 170 (2.23)
Table 4. The partition coefficients,K , of Ormosils and Ormosil/TEOS cal-culated usingε2 = 2.8 and logK (A and B indicate that the aging times wereless than 10 days and 100 days, respectively).
Ormosil orOrmosil/TEOS H2O Methanol 1-BTL 2-BTN
A0750
A 8340 (3.92) 4400 (3.64) 1870 (3.27) 250 (2.40)
B 7220 (3.86) 4250 (3.63) 3940 (3.60) 580 (2.76)
C3433
A 1840 (3.27) 2020 (3.30) 9260 (3.97) 610 (2.79)
B 3590 (3.56) 4000 (3.60) 5710 (3.76) 890 (2.95)
C3433/50
A 2420 (3.38) 1710 (3.23) 1450 (3.16) 280 (2.45)
P0320
A 1880 (3.27) 3590 (3.56) 22060 (4.34) 4810 (3.68)
B 840 (2.92) 1050 (3.02) 1280 (3.11) 460 (2.66)
P0320/50
A 4360 (3.64) 6010 (3.78) 32030 (4.51) 4650 (3.67)
B 4930 (3.69) 4660 (3.67) 2340 (4.36) 3830 (3.58)
V4910
A 1820 (3.26) 7410 (3.87) 49960 (4.70) 6130 (3.79)
B 10 (0.91) 60 (1.78) 940 (2.97) 90 (1.97)
V4910/50
A 7230 (3.86) 9330 (3.97) 33630 (4.53) 7610 (3.88)
B 3510 (3.54) 4420 (3.65) 16150 (4.21) 3620 (3.60)
The partition coefficients of the A0750 films forMethanol and H2O almost unchanged and for 1-BTLand 2-BTN increased with aging of the precursor so-lution. The values ofa decreased from 1.27 to 0.96
andb increased from−0.21 to 0.13. It correspondedto a decrease of the activity and/or density of aminogroups and an increase of the density of silanol groupsduring aging. However, the amino group retained its

P1: NTAP1: NTA
Journal of Sol-Gel Science and Technology KL545-08-INOUE January 20, 1998 9:5
76 Inoue et al.
Figure 6. Relationship between capacitance change and the con-centration of gaseous molecules (◦: H2O,•: Methanol,M: 1-BTL,N: 2-BTN).
activity andb= 0.96 was still larger than those of otherOrmosils. The partition coefficients of the C3433 filmsfor Methanol and H2O were lower than those of theA0750 ones and for 1-BTL was higher. From the val-ues ofa andb parameters in Table 5 the C3433 filmshad lower abilities of hydrogen-bondacceptorthan theA0750. The cyano group is possible to hydrolyze un-der heat treatment with acid and form a carboxyl group,which is generally stronger acid than the silanol group.The responses indicated that the C3433 films wereweaker acid, lowerb values, than P0320 and V4910films. Therefore, the responses of the C3433 films aremainly due to the cyano groups. The lowerb valueof the C3433 films added 50 mol% TEOS, C3433/50,indicated that the condensation reaction of the silanolgroup in the C3433/50 precursor solution was fasterthan those in the P0320/50 and V4910/50 solutions. Itwas consistent to shorter gelation time of the C3433/50precursor solution. The partition coefficients of theP0320/50 and V4910/50 films were resemble and typi-cal hydrogen-bonddonor. The addition of TEOS gen-erated an increase of partition coefficients and retainedthem after aging for 100 days. It seems that the addi-tion of TEOS influences not only the chemical groups
Table 5. The parametersa, b and c inlog K = c+ aαH
2 + bβH2 obtained from the
method of multiple linear regression and thepartition coefficients,K , listed in Table 4.
Ormosil orOrmosil/TEOS a b c
A0750
A 1.27 −0.21 2.50
B 0.96 0.13 2.70
C3433
A 0.65 1.25 2.19
B 0.66 0.63 2.65
C3433/50
A 0.83 0.13 2.39
P0320
A −0.08 1.40 3.01
B 0.33 0.45 2.45
P0320/50
A 0.21 1.26 3.06
B 0.26 0.99 3.10
V4910
A −0.01 1.98 2.84
B −0.31 2.67 0.69
V4910/50
A 0.17 0.97 3.41
B 0.13 0.95 3.14
but also the structure of the films, such as porosityand relative surface area. The P0320 and V4910 filmsprepared from the aged solutions have lower partitioncoefficients. It indicated that the activities or densitiesof the chemical groups decreased during aging and thepermeability of the gaseous molecules decreased. Thelarge values ofb for the V4910 films are consideredto be slow condensation reaction of silanol groups be-cause the product of the addition reaction of the vinylgroup is not strong acid.
The sorption measurement of N2 gas is a powerfultechnique to investigate the microstructure of the gel.The sorption of the other gaseous molecules providesinformation not only on the microstructure but on thenature of their chemical groups as well. It should benoted that a few of the organic polymers in the ma-terials for SAW devices are available for detecting agreat variety of organic bases. Basically the sorptionproperties of Ormosils are acidic due to silanol groupsand they can be modified easily by their chemical

P1: NTAP1: NTA
Journal of Sol-Gel Science and Technology KL545-08-INOUE January 20, 1998 9:5
Detection of Gaseous Molecules 77
Figure 7(a). Response curves of A0750 for (a) H2O, (b) Methanol, (c) 1-BTL and (d) 2-BTN.

P1: NTAP1: NTA
Journal of Sol-Gel Science and Technology KL545-08-INOUE January 20, 1998 9:5
78 Inoue et al.
Figure 7(b). Response curves of C3433 for (a) H2O, (b) Methanol, (c) 1-BTL and (d) 2-BTN.

P1: NTAP1: NTA
Journal of Sol-Gel Science and Technology KL545-08-INOUE January 20, 1998 9:5
Detection of Gaseous Molecules 79
Figure 7(c). Response curves of P0320 for (a) H2O, (b) Methanol, (c) 1-BTL and (d) 2-BTN.

P1: NTAP1: NTA
Journal of Sol-Gel Science and Technology KL545-08-INOUE January 20, 1998 9:5
80 Inoue et al.
Figure 7(d). Response curves of V4910 for (a) H2O, (b) Methanol, (c) 1-BTL and (d) 2-BTN.
P1: NTAP1: NTA
Journal of Sol-Gel Science and Technology KL545-08-INOUE January 20, 1998 9:5
Detection of Gaseous Molecules 81
Figure 8. Bar graphs showing the centralized logK of the organic materials (a) PVP, (b) PECH, (c) ABACD and (d) PIP for H2O, 1-BTL and2-BTN. Solid bars: this work, open bars: SAW devices [11].

P1: NTAP1: NTA
Journal of Sol-Gel Science and Technology KL545-08-INOUE January 20, 1998 9:5
82 Inoue et al.
Figure 9(a). The discriminant plane created from the partition coefficients of imaginary acid and base. (a, b) indicates the basicity and acidity.

P1: NTAP1: NTA
Journal of Sol-Gel Science and Technology KL545-08-INOUE January 20, 1998 9:5
Detection of Gaseous Molecules 83
Figure 9(b). The feature of the centralized logK of the organic materials on the discriminant plane.

P1: NTAP1: NTA
Journal of Sol-Gel Science and Technology KL545-08-INOUE January 20, 1998 9:5
84 Inoue et al.
Figure 9(c). The centralized logK of Ormosils and Ormosil/TEOS on the discriminant plane. 1 & 2: A0750, 3 & 4: C3433, 5: C3433/50,6 & 7: P0320, 8 & 9: P0320/50, 10 & 11: V4910, 12 & 13: V4910/50.

P1: NTAP1: NTA
Journal of Sol-Gel Science and Technology KL545-08-INOUE January 20, 1998 9:5
Detection of Gaseous Molecules 85
groups. Therefore, these Ormosils should be suitablefor the detection of bases, especially, toxic organophos-phorus compounds.
In order to classify the sorption properties of thedetector coatings, the Karhunen-Loeve (K-L) trans-formation [19] was used. K-L expansion is one ofthe pattern recognition methods using the eigenvectorsof the covariance matrix obtained from a centralizedobservation. The partition coefficients obtained weredependent on the value ofε2, which could not be ob-tained. However, the centralized logK was uniquein these experiments. Two patterns of the centralizedlog K calculated from the LSER equation, of which thedetector coatings are pure acid and base, were utilizedin order to determine the two deterministic vectors.The four-dimensional feature vectors of the central-ized logK can be projected without losing discrimi-native information on the plane which is created bythe above two deterministic vectors. The parametersof (a, b) for the imaginary pure acid, A, is(0, 1) andthe imaginary pure base, B, is(1, 0). Therefore, thepartition coefficients, logK , of A is 0.18, 0.62, 0.88and 0.48 for H2O, Methanol, 1-BTL and 2-BTN, res-pectively. The logK of B is 1.17, 0.93, 0.79 and 0.0,respectively. Figure 9(a) shows the discriminant planetogether with the coordinates of imaginary propertiesand their parameters (a, b) are denoted. As can beseen from the figure, axis-a and axis-b indicate theacidity and basicity of the detector coatings, respec-tively. Figure 9(b) shows the coordinates of four or-ganic materials on the discriminant plane. As PVPcan accept the hydrogen-bond, PVP is the strongestbase of the four. As ABACD has a carboxyl group,it can donate and accept the hydrogen-bond, the pointof ABACD is located between PVP and other detec-tor coatings. If the partition coefficient of ABACD iscorrected on basis of the result of the SAW devices,the coordinate of ABACD will move toward axis-a,that is, larger acidity and weaker basicity. Figure 9(c)shows the coordinates of the Ormosils on the discrim-inant plane. Each ellipse indicates the position of eachOrmosil and Ormosil/TEOS pairs. The values of theaxis-b increased in the order of the strength of thebasicity. As can be seen from the figure and also de-scribed above, it is found that A0750 is a strong baseand C3433 is weaker base than A0750. The distri-bution of P0320 and V4910 indicated stronger acidand weaker base. Comparing Fig. 9(b) with Fig. 9(c),The pattern of the centralized logK of A0750 in-clude the base of which the strength was compara-
ble to PVP. Moreover, the pattern of A0750 is almostpure base. The results from the SAW devices reportedby Ballantine et al. [11] indicated that PVP was thestrongest base in 12 typical organic materials. On thecontrary, P0320 and V4910 surpassed the organic ma-terials in acidic strength. It is concluded that the pat-tern of 4 Ormosils and TEOS from the viewpoint of theacidity and basicity covered the area of typical organicmaterials.
5. Conclusion
The sorption properties of Ormosil and Ormosil/TEOSfilms were investigated using a capacitor system whichconsisted of films on a pair of electrodes. The capa-citance variation obtained was converted to the central-ized logK which indicated the sorption property. Thefeatures of the sorption properties could be explainedfrom the activities of hydrogen-bonds of the chemicalgroups in Ormosils.
The Karhunen-Loeve expansion, which is one of thepattern recognition techniques, was useful in extract-ing information regarding the hydrogen-bonding inter-action. The character of the sorption properties of Or-mosils was widely spread from pure base of an aminogroup in A0750 to acid of silanol groups. The pattern of4 Ormosils and TEOS from the viewpoint of the acidityand basicity covered the area of typical organic mate-rials. Ormosils are suitable materials for the detectionof the toxic organic bases, such as organophosphoruscompounds.
Acknowledgment
The authors thank the Air Force Office of ScientificResearch for support of this study.
References
1. G. Horner and C. Hierold, Gas analysis by partial model build-ing, Sensors and Actuators B2, 173–184 (1990).
2. H. Sundgren, F. Winquist, I. Lukkari, and I. Lundstrim, Arti-ficial neural networks and gas sensor arrays: Quantification ofindividual components in a gas mixture, Meas. Sci. Technol.2,461–469 (1991).
3. R. Miller, High electronic selectivity obtainable with nonselec-tive chemosensors, Sensors and Actuators B4, 35–39 (1991).
4. P.N. Bartlett and J.W. Gardner, Odour sensors for and electronicnose, inSensors and Sensory Systems for an Electronic Nose,edited by J.W. Gardner and P.N. Batlett (Kluwer Academic Pub-lishers, 1992), pp. 31–51.

P1: NTAP1: NTA
Journal of Sol-Gel Science and Technology KL545-08-INOUE January 20, 1998 9:5
86 Inoue et al.
5. H. Abe, T. Yoshimura, S. Kanaya, Y. Takahashi, Y. Miyashita,and S. Sasaki, Automated odor-sensing system based on pluralsemiconductor gas sensors and computerized pattern recognitiontechniques, Analytica Chimica Acta194, 1–9 (1987).
6. H. Abe, S. Kanaya, Y. Takahashi, and S. Sasaki, Extended stud-ies of the automated odor-sensing system based on plural semi-conductor gas sensors with computerized pattern recognitiontechniques, Analytica Chimica Acta215, 155–168 (1988) .
7. U. Weimar, K.D. Schierbaum, W. Gpel, and R. Kowalkowski,Pattern recognition methods for gas mixture analysis: Applica-tion to sensor arrays based on SnO2, Sensor and Actuators B1,93–96 (1990).
8. H.V. Shurmer, J.W. Gardner, and P. Corcoran, Intelligent vapourdiscrimination using a composite 12-element sensor array, Sen-sors and Actuators B1, 256–260 (1990).
9. H.V. Shurmer and J.W. Gardner, Odour discrimination with anelectronic nose, Sensors and Actuators B8, 1–11 (1992).
10. T. Maekawa, J. Tamaki, N. Miura, N. Yamazoe, and S. Mat-sushima, Development of SnO2-based ethanol gas sensor, Sen-sor and Actuators B9, 63–69 (1992).
11. D.S. Ballantine, Jr., S.L. Rose, J.W. Grate, and H. Wohltjen,Correlation of surface acoustic wave device coating responseswith solubility properties and chemical structure using patternrecognition, Anal. Chem.58, 3058–3066 (1986).
12. Y. Okahata, G. Enna, and H. Ebato, Synthetic chemoreceptivemembranes. Sensing bitter or ordorous substances on a synthetic
lipid multibilayer film by using quartz-crystal microbalances andelectric responses, Anal. Chem.62, 1431–1438 (1990).
13. J.W. Grate and M.H. Abraham, Solubility interactions and thedesign of chemically selective solvent coatings for chemical sen-sors and arrays, Sensors and Actuators B3, 85–111 (1991).
14. J.W. Grate and M. Klusty, Surface acoustic wave vapor sensorsbased on resonator devices, Anal. Chem.63, 1719–1727 (1991).
15. D. Amati, D. Arn, N. Blom, M. Ehrat, J. Saunois, and H.M.Widmer, Sensitivity and selectivity of surface acoustic wavesensors for organic solvent vapour detection, Sensors and Actu-ators B7, 587–591 (1992).
16. H.K. Schmidt, Aspects of chemistry and chemical processing oforganically modified ceramics, Mat. Res. Soc. Symp. Proc.180,961–973 (1990).
17. M.H. Abbraham, G.S. Whiting, R.M. Doherty, and W.J. Shuely,Hydrogen bonding. Part 13. A new method for the characteri-zation of GLC stationary phase—The Laffort data set, J. Chem.Soc., Perkin Trans.2, 1451–1460 (1990).
18. M.J. Kamlet, J.-L.M. Abbound, M.H. Abraham, and R.W. Taft,Linear salvation energy relationships: 23. A comprehensive col-lection of the solvatochromic parameters,π∗, α, and β, andsome methods for simplifying the generalized solvatochromicequation, J. Org. Chem.48, 2877–2887 (1983).
19. J. Kittler and P.C. Young, A new approach to feature selectionbased on the Karhunen-Loeve expansion, Pattern Recognition5, 335–352 (1973).