Embed Size (px)
Citation preview
Detection of Carbohydrate Binding Proteins UsingMagnetic Relaxation Switches
Ashish A. Kulkarni,† Alison A. Weiss,‡ and Suri S. Iyer*,†
Department of Chemistry, University of Cincinnati, Cincinnati, Ohio 45221-0172, and Department of MolecularGenetics, Biochemistry, and Microbiology, University of Cincinnati, Cincinnati, Ohio 45267-0524
We have developed a simple, rapid, and sensitive carbo-hydrate-based magnetic relaxation switch assay for thedetection of carbohydrate binding proteins. This techniquewas used to detect lectins and toxins that are known tobind to specific carbohydrates. Lectins that bind to thesame carbohydrate displayed differential aggregation pro-files because of differences in the structure and numberof binding sites of the lectins. We demonstrated thatselectivity and sensitivity can be enhanced using twodifferent recognition elements. We have also demon-strated that magnetic relaxation switch assays can be usedto detect toxins in a complex medium such as stool andenvironmental samples.
Nature’s third class of biopolymers, carbohydrates, are excel-lent recognition molecules that could be harnessed for a varietyof biotechnological applications that include targeted drug/genedelivery, therapeutics, and diagnostics.1,2 In addition to theirexcellent recognition capability, carbohydrates are highly robust,inexpensive, and require no refrigeration and manufacture canbe scaled up readily, qualities that make them uniquely suitableas recognition elements of biosensors.3,4 Carbohydrate basedbiosensors are particularly useful to detect antigenic variantsbecause carbohydrate based recognition is a receptor bindingstrategy that cannot be altered without loss of virulence.3,5
Additionally, the smaller size of carbohydrates provides them witha unique size advantage over larger recognition elements suchas antibodies or aptamers, and therefore, carbohydrates could finduse for potential applications in nanobiosensors, where size of therecognition element is a key requirement.
Several reports, including our own work, have reported severalapproaches to harness the recognition potential of carbohydratesfor biosensors. Carbohydrates attached to a variety of platforms
that include polymers,6 noble metal,7 magnetic,8,9 fluorescentnanoparticles,10 and dendrimers11 have been used to detectlectins,12,13 toxins,14 bacteria,15,16 viruses,17 and cancerous cells.18
Recently, we compared the recognition capabilities of carbohy-drate coated micrometer magnetic beads to antibody coatedmagnetic beads.3 In this study, we report a one step, no wash,magnetic relaxation assay that used carbohydrate coated mi-crometer magnetic beads to detect carbohydrate binding proteinswith high sensitivity and minimal sample preparation. Afteroptimizing conditions and developing this bioassay using modellectins, we used it to detect two different isoforms of Shiga toxins.The bioassay provides quantitative concentration data within 1 hwith an observed detection limit of 1 pg/mL of these toxins incomplex media such as stool samples. This simple “add andmeasure” assay could potentially be used by first responders todetect infectious agents.
EXPERIMENTAL SECTIONWe describe briefly the experimental procedures for the
synthesis of the carbohydrates, procedures for the attachment ofthe carbohydrate to the magnetic micrometer beads, completecharacterization of the carbohydrate coated magnetic microm-eter beads using multiple techniques, and measurement of thetransverse relaxation time under various conditions. Part of the
* To whom correspondence should be addressed. Address: Department ofChemistry, University of Cincinnati, P.O. Box 210172, Cincinnati, Ohio, 45221-0172. Phone: (513) 556-9273. Fax: (513) 556-9239. E-mail: [email protected].
† Department of Chemistry.‡ Department of Molecular Genetics, Biochemistry, and Microbiology.
(1) Bertozzi, C. R.; Freeze, H. H.; Varki, A.; Esko, J. D. In Essentials ofGlycobiology, 2nd ed.; Varki, A., Cummings, R. D., Esko, J. D., Freeze, H. H.,Stanley, P., Bertozzi, C. R., Hart, G. W., Etzler, M. E., Eds.; Cold SpringHarbor Laboratory Press Plainview: New York, 2008; pp 719-732.
(2) Seeberger, P. H.; Werz, D. B. Nature 2007, 446, 1046–1051.(3) Hatch, D. M.; Weiss, A. A.; Kale, R. R.; Iyer, S. S. ChemBioChem 2008,
2433–2442.(4) Disney, M. D.; Seeberger, P. H. Chem. Biol. 2004, 11, 1701–1707.(5) Kale, R. R.; McGannon, C. M.; Fuller-Schaefer, C.; Hatch, D. M.; Flagler,
M. J.; Gamage, S. D.; Weiss, A. A.; Iyer, S. S. Angew. Chem., Int. Ed. Engl.2008, 47, 1265–1268.
(6) Disney, M. D.; Zheng, J.; Swager, T. M.; Seeberger, P. H. J. Am. Chem.Soc. 2004, 126, 13343–13346.
(7) de la Fuente, J. M.; Penades, S. Biochim. Biophys. Acta 2006, 1760, 636–851.
(8) El-Boubbou, K.; Gruden, C.; Huang, X. J. Am. Chem. Soc. 2007, 129, 13392–13393.
(9) van Kasteren, S. I.; Campbell, S. J.; Serres, S.; Anthony, D. C.; Sibson, N. R.;Davis, B. G. Proc. Natl. Acad. Sci. U.S.A. 2009, 106, 18–23.
(10) Kikkeri, R.; Lepenies, B.; Adibekian, A.; Laurino, P.; Seeberger, P. H. J. Am.Chem. Soc. 2009, 131, 2110–2112.
(11) Kikkeri, R.; Hossain, L. H.; Seeberger, P. H. Chem. Commun. (Cambridge,U.K.) 2008, 2127–2129.
(12) Schofield, C. L.; Mukhopadhyay, B.; Hardy, S. M.; McDonnell, M. B.; Field,R. A.; Russell, D. A. Analyst 2008, 133, 626–634.
(13) Lin, C. C.; Yeh, Y. C.; Yang, C. Y.; Chen, G. F.; Chen, Y. C.; Wu, Y. C.;Chen, C. C. Chem. Commun. (Cambridge, U.K.) 2003, 2920–2921.
(14) Schofield, C. L.; Field, R. A.; Russell, D. A. Anal. Chem. 2007, 79, 1356–1361.
(15) Lin, C. C.; Yeh, Y. C.; Yang, C. Y.; Chen, C. L.; Chen, G. F.; Chen, C. C.;Wu, Y. C. J. Am. Chem. Soc. 2002, 124, 3508–3509.
(16) Xue, C.; Velayudham, S.; Johnson, S.; Saha, R.; Smith, A.; Brewer, W.;Murthy, P.; Bagley, S. T.; Liu, H. Chemistry 2009, 15, 2289–2295.
(17) Kale, R. R.; Mukundan, H.; Price, D. N.; Harris, J. F.; Lewallen, D. M.;Swanson, B. I.; Schmidt, J. G.; Iyer, S. S. J. Am. Chem. Soc. 2008, 130,8169–8171.
(18) El-Boubbou, K.; Zhu, D. C.; Vasileiou, C.; Borhan, B.; Prosperi, D.; Li, W.;Huang, X. J. Am. Chem. Soc. 2010, 132, 4490–4499.
Anal. Chem. 2010, 82, 7430–7435
10.1021/ac101579m 2010 American Chemical Society7430 Analytical Chemistry, Vol. 82, No. 17, September 1, 2010Published on Web 08/04/2010
experimental procedures can be found in the Supporting Informa-tion section. The major abbreviations used throughout the paperare GC1: biotinylated tetra-antennary R-mannoside; GC2: bioti-nylated monoantennary R-mannoside; GC3: biotinylated monoan-tennary �-galactoside, Pk: biotinylated biantennary trisaccharidespecific for Shiga toxin 1; NHAc-Pk: biotinylated biantennarytrisaccharide specific for Shiga toxin 2; GNL: Galanthus Nivalislectin; RCA120: Ricinus communis lectin; ConA: ConcanavalinA; Stx1: Shiga toxin 1; Stx2: Shiga toxin 2.
General Methods for the Synthesis of the Tailored Car-bohydrates. All chemical reagents were of analytical grade, usedas supplied without further purification unless indicated. Aceticanhydride and acetyl chloride were distilled under an inertatmosphere and stored under argon. Molecular sieves (4 Å) werestored in an oven (>130 °C) and cooled in vacuo. The acidic ion-exchange resin used was Dowex-50 and Amberlite (H+ form).Analytical thin layer chromatography (TLC) was conducted onsilica gel 60-F254 (Merck). Plates were visualized under UVlight and/or by treatment with acidic cerium ammoniummolybdate followed by heating. Column chromatography wasconducted using silica gel (230-400 mesh) from Qualigens.1H and 13C NMR spectra were recorded on Bruker AMX 400MHz spectrometer. Chemical shifts are reported in δ (ppm)units using 13C and residual 1H signals from deuterated solventsas references. Spectra were analyzed with Mest-Re-C Lite(Mestrelab Research) and/or XWinPlot (Bruker Biospin).Electrospray ionization mass spectra were recorded on aMicromass Q Tof 2 (Waters), and data were analyzed withMassLynx 4.0 (Waters) software.
Synthesis of Mannose Based Tetra-Antennary Carbohy-drates. Compound 6: 1-O-(6-t-Butylcarbamate-4-thiohexyl)-R-D-galactopyranoside. 1-O-(6-t-Butylcarbamate-4-thiohexyl)-2,3,4,6-tetra-O-acetyl-R-D-galactopyranoside19 (0.98 g, 2.5 mmol) was dissolvedin MeOH (20 mL) and cooled to 0 °C. A solution of NaOMe inMeOH (0.5M, 2.5 mL) was added via syringe, and the resultingmass was stirred at room temperature (RT) for 6 h. Uponcompletion (TLC), the reaction was neutralized by careful additionon Amberlite-15 H+ resin and filtered. The solvent was removedin vacuo, and the residue was purified by flash column chroma-tography, eluting with an 80:20 mixture of CH2Cl2 and methanolsystem to give 6 as white solid (0.61 g, 89%). Spectral datamatched reported values.20
Compound 7: 1-O-(6-t-Butylcarbamate-4-thiohexyl)-2,3,4,6-tetra-O-propargyl-R-D-galactopyranoside. NaH (60% in oil, 0.61 g, 6.93mmol) was washed with hexane. Compound 6 (0.61 g, 1.54 mmol)was dissolved in tetrahydrofuran (THF; 25 mL) and added to it.Next, propargyl bromide (0.60 g, 6.93 mol) was added via syringe,and the mixture was refluxed under an argon atmosphere for 1 h.Upon completion (TLC), the mass was cooled to 0 °C and carefullyquenched with ethanol. The reaction mixture was diluted with 30mL of water, and the organic layer was separated. The aqueousfraction was washed with 2 × 100 mL of EtOAc. The combinedorganic layer was dried over Na2SO4 and filtered, and the solventwas removed in vacuo. The crude product was purified by flashcolumn chromatography, eluting with 50:50 mixture of EtOAcand hexane, to give 7 as a white solid (0.43 g, 51%). 1H NMR
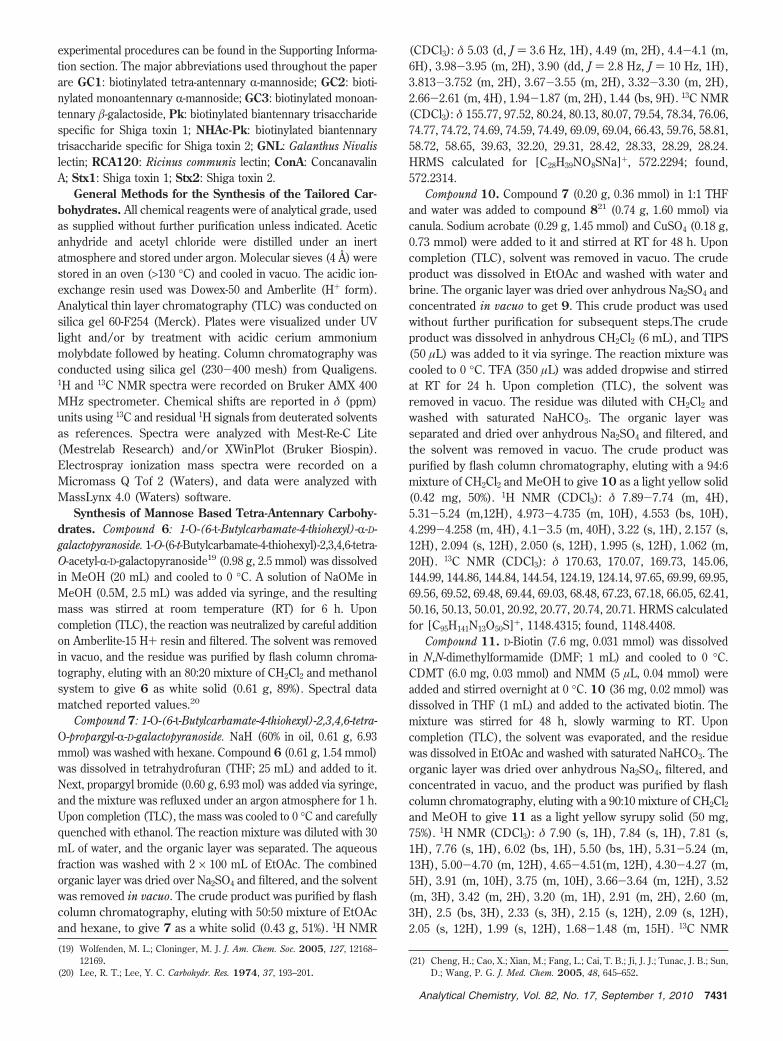
(CDCl3): δ 5.03 (d, J ) 3.6 Hz, 1H), 4.49 (m, 2H), 4.4-4.1 (m,6H), 3.98-3.95 (m, 2H), 3.90 (dd, J ) 2.8 Hz, J ) 10 Hz, 1H),3.813-3.752 (m, 2H), 3.67-3.55 (m, 2H), 3.32-3.30 (m, 2H),2.66-2.61 (m, 4H), 1.94-1.87 (m, 2H), 1.44 (bs, 9H). 13C NMR(CDCl3): δ 155.77, 97.52, 80.24, 80.13, 80.07, 79.54, 78.34, 76.06,74.77, 74.72, 74.69, 74.59, 74.49, 69.09, 69.04, 66.43, 59.76, 58.81,58.72, 58.65, 39.63, 32.20, 29.31, 28.42, 28.33, 28.29, 28.24.HRMS calculated for [C28H39NO8SNa]+, 572.2294; found,572.2314.
Compound 10. Compound 7 (0.20 g, 0.36 mmol) in 1:1 THFand water was added to compound 821 (0.74 g, 1.60 mmol) viacanula. Sodium acrobate (0.29 g, 1.45 mmol) and CuSO4 (0.18 g,0.73 mmol) were added to it and stirred at RT for 48 h. Uponcompletion (TLC), solvent was removed in vacuo. The crudeproduct was dissolved in EtOAc and washed with water andbrine. The organic layer was dried over anhydrous Na2SO4 andconcentrated in vacuo to get 9. This crude product was usedwithout further purification for subsequent steps.The crudeproduct was dissolved in anhydrous CH2Cl2 (6 mL), and TIPS(50 µL) was added to it via syringe. The reaction mixture wascooled to 0 °C. TFA (350 µL) was added dropwise and stirredat RT for 24 h. Upon completion (TLC), the solvent wasremoved in vacuo. The residue was diluted with CH2Cl2 andwashed with saturated NaHCO3. The organic layer wasseparated and dried over anhydrous Na2SO4 and filtered, andthe solvent was removed in vacuo. The crude product waspurified by flash column chromatography, eluting with a 94:6mixture of CH2Cl2 and MeOH to give 10 as a light yellow solid(0.42 mg, 50%). 1H NMR (CDCl3): δ 7.89-7.74 (m, 4H),5.31-5.24 (m,12H), 4.973-4.735 (m, 10H), 4.553 (bs, 10H),4.299-4.258 (m, 4H), 4.1-3.5 (m, 40H), 3.22 (s, 1H), 2.157 (s,12H), 2.094 (s, 12H), 2.050 (s, 12H), 1.995 (s, 12H), 1.062 (m,20H). 13C NMR (CDCl3): δ 170.63, 170.07, 169.73, 145.06,144.99, 144.86, 144.84, 144.54, 124.19, 124.14, 97.65, 69.99, 69.95,69.56, 69.52, 69.48, 69.44, 69.03, 68.48, 67.23, 67.18, 66.05, 62.41,50.16, 50.13, 50.01, 20.92, 20.77, 20.74, 20.71. HRMS calculatedfor [C95H141N13O50S]+, 1148.4315; found, 1148.4408.
Compound 11. D-Biotin (7.6 mg, 0.031 mmol) was dissolvedin N,N-dimethylformamide (DMF; 1 mL) and cooled to 0 °C.CDMT (6.0 mg, 0.03 mmol) and NMM (5 µL, 0.04 mmol) wereadded and stirred overnight at 0 °C. 10 (36 mg, 0.02 mmol) wasdissolved in THF (1 mL) and added to the activated biotin. Themixture was stirred for 48 h, slowly warming to RT. Uponcompletion (TLC), the solvent was evaporated, and the residuewas dissolved in EtOAc and washed with saturated NaHCO3. Theorganic layer was dried over anhydrous Na2SO4, filtered, andconcentrated in vacuo, and the product was purified by flashcolumn chromatography, eluting with a 90:10 mixture of CH2Cl2and MeOH to give 11 as a light yellow syrupy solid (50 mg,75%). 1H NMR (CDCl3): δ 7.90 (s, 1H), 7.84 (s, 1H), 7.81 (s,1H), 7.76 (s, 1H), 6.02 (bs, 1H), 5.50 (bs, 1H), 5.31-5.24 (m,13H), 5.00-4.70 (m, 12H), 4.65-4.51(m, 12H), 4.30-4.27 (m,5H), 3.91 (m, 10H), 3.75 (m, 10H), 3.66-3.64 (m, 12H), 3.52(m, 3H), 3.42 (m, 2H), 3.20 (m, 1H), 2.91 (m, 2H), 2.60 (m,3H), 2.5 (bs, 3H), 2.33 (s, 3H), 2.15 (s, 12H), 2.09 (s, 12H),2.05 (s, 12H), 1.99 (s, 12H), 1.68-1.48 (m, 15H). 13C NMR
(19) Wolfenden, M. L.; Cloninger, M. J. J. Am. Chem. Soc. 2005, 127, 12168–12169.
(20) Lee, R. T.; Lee, Y. C. Carbohydr. Res. 1974, 37, 193–201.(21) Cheng, H.; Cao, X.; Xian, M.; Fang, L.; Cai, T. B.; Ji, J. J.; Tunac, J. B.; Sun,
D.; Wang, P. G. J. Med. Chem. 2005, 48, 645–652.
7431Analytical Chemistry, Vol. 82, No. 17, September 1, 2010
(CDCl3): 173.23, 170.66, 170.09, 169.98, 169.75, 168.41, 163.84,159.59, 145.13, 145.00, 144.47, 124.22, 124.14, 124.04, 97.70,97.43, 74.79, 69.99, 69.56, 69.47, 69.14, 69.05, 68.52, 67.23, 66.58,66.33, 66.095, 65.81, 64.51, 64.41, 64.27, 62.44, 61.87, 60.191,55.95, 55.38, 55.15, 53.45, 50.16, 50.09, 46.11, 40.58, 38.70, 35.72,33.69, 31.93, 31.70, 30.16, 30.04, 29.71, 29.36, 29.32, 28.40, 28.02,26.71, 25.41, 22.70, 20.936, 20.75, 14.14. HRMS calculated for[C115H155N13O51S]+, 1261.4703; found, 1261.4248.
Compound GC1. 11 (30 mg, 0.012 mmol) was dissolved inMeOH (2 mL), and a solution of NaOMe in MeOH (0.5M, 0.5mL) was added; the reaction mixture was stirred at RT for 6 h.The reaction was neutralized by careful addition of Amberlite-15H+ resin, and the resin was filtered. The solvent was removed invacuo, and the residue was purified by Biogel P-2 gel columnchromatography, eluting with water, to give GC3 as a white solid(15 mg, 70%). 1H NMR (D2O): 8.44 (s, 1H), 8.11-8.06 (m, H),4.95 (d, 1H), 4.75-4.54 (m, 13H), 4.40-4.36 (m, 1H), 4.11 (bs,1H), 3.97-3.44 (m, 64H), 3.36-3.21 (m, 5H), 2.96-2.91 (m,2H), 2.74-2.57 (m, 5H), 2.25-2.22 (m, 3H), 1.92-1.80 (m, 6H),1.71-1.48 (m, 7H), 1.41-1.01 (m, 15H), 0.87 (bs, 5H). 13C NMR(D2O/CD3OD): 124.84, 100.21, 73.26, 71.16, 70.66, 69.76, 68.93,67.24, 66.18, 63.70, 61.54, 50.05, 48.23, 48.03, 47.82, 47.61, 47.39,47.19, 46.98, 46.43, 4.83. HRMS calculated for [C83H123N13-O35S]+, 924.8843; found, 924.8937.
Characterization of the Carbohydrate Coated MicrometerMagnetic Beads. The number of carbohydrates was determinedby an anthrone-sulfuric acid assay as previously described byLin et al.22 Briefly, carbohydrates (1-9 µg) were dissolved in 0.5mL of deionized water. Next, 1 mL of a freshly prepared solutionof 0.5% anthrone (w/w) in 95% sulfuric acid was added to 0.5 mLof ice cold sugar solution. The resulting solution was gently mixedand heated to 100 °C for 10 min and the allowed to cool to RT.The absorbance was recorded at 620 nm, and the plot ofabsorbance versus concentration of ligand resulted in a standardcurve (Figure 1, Supporting Information). Next, different concen-trations of the beads (0.5-2 mg) were subjected to the samemethod. From this concentration, the concentration of carbohy-drates in 1 mg of beads was obtained and the number ofcarbohydrates per bead was calculated (Table 1, SupportingInformation).
Transverse Relaxation Measurements. All measurementswere performed on a 1.41 T relaxometer (Minispec mq60, BrukerOptics Inc., The Woodlands, TX) according to manufacturer’sprotocols. The relaxivity values of the carbohydrate coatedmagnetic beads were determined as described previously. Thevalues are given in Table 1 (Supporting Information). The T2
measurements were performed at 40 °C. The experiments toobtain T2 for ConA are described (Figure 3A). Briefly, 1 mg ofstreptavidin coated micrometer magnetic beads (1 µm streptavidincoated Dynabeads MyOne, Invitrogen, Carlsbad, CA), which hasthe capacity to bind to ∼2500 pmol of free biotin, was washedthree times with phosphate buffered saline (PBS) buffer (pH 7.4).Next, beads were incubated with 50 µg (0.10 µmol, 40-fold excess)of biotinylated R-mannoside, GC2 for 1 h at RT, followed byextensive washing and blocking with 0.1% BSA in PBS. For T2
measurements, 10 µg of the carbohydrate coated micrometer
beads was incubated with ConA for 1 h at RT, incubated at 40°C for 10 min, and inserted into the relaxometer. In order toavoid increase in T2 induced by settling of magnetic beads,the beads were incubated with continuous stirring in thepresence or absence of ConA. The ∆T2 was calculated bysubtracting the T2 value in the presence of ConA from the T2
value in the absence of ConA at the indicated time intervals.The “Carr-Purcell-Meiboom-Gill” (CPMG) method wasused for all the T2 measurements. The signals were acquiredfrom 2 to 400 ms for the exponential decay profile from whichT2 was calculated. The parameters used for the instrument aregiven in Supporting Information.
Comparison of Different Concentrations of RCA120 inPresence and Absence of Antibody. To assess the ability ofantibody to increase sensitivity, the T2 values were obtained fordifferent concentrations of RCA120 lectin in the presence andabsence of antibody specific to RCA120 lectin using biotinylated�-galactoside (GC3) coated micrometer magnetic beads (Figure3). A graph of %∆T2 (% of maximum ∆T2) was plotted againstRCA120 concentrations and fitted into a four parameter equationto obtain the EC50 value, Hill coefficient, and projected sensitivityconcentration (minimum concentration detectable by the instru-ment) as described previously.23 The projected sensitivity con-centration for GC3 was calculated to be 27 pM, which decreasedto 4 pM using a combination of GC3 and antibody.
RESULTS AND DISCUSSIONTo develop this bioassay, we synthesized tailored carbohydrates
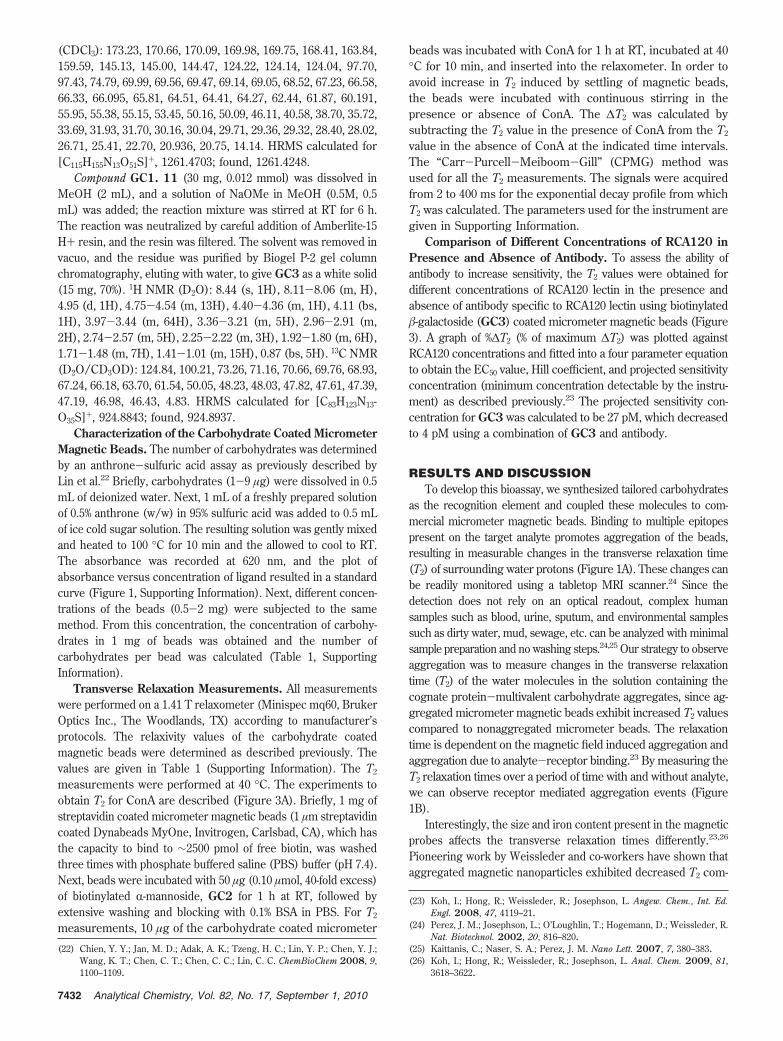
as the recognition element and coupled these molecules to com-mercial micrometer magnetic beads. Binding to multiple epitopespresent on the target analyte promotes aggregation of the beads,resulting in measurable changes in the transverse relaxation time(T2) of surrounding water protons (Figure 1A). These changes canbe readily monitored using a tabletop MRI scanner.24 Since thedetection does not rely on an optical readout, complex humansamples such as blood, urine, sputum, and environmental samplessuch as dirty water, mud, sewage, etc. can be analyzed with minimalsample preparation and no washing steps.24,25 Our strategy to observeaggregation was to measure changes in the transverse relaxationtime (T2) of the water molecules in the solution containing thecognate protein-multivalent carbohydrate aggregates, since ag-gregated micrometer magnetic beads exhibit increased T2 valuescompared to nonaggregated micrometer beads. The relaxationtime is dependent on the magnetic field induced aggregation andaggregation due to analyte-receptor binding.23 By measuring theT2 relaxation times over a period of time with and without analyte,we can observe receptor mediated aggregation events (Figure1B).
Interestingly, the size and iron content present in the magneticprobes affects the transverse relaxation times differently.23,26
Pioneering work by Weissleder and co-workers have shown thataggregated magnetic nanoparticles exhibited decreased T2 com-
(22) Chien, Y. Y.; Jan, M. D.; Adak, A. K.; Tzeng, H. C.; Lin, Y. P.; Chen, Y. J.;Wang, K. T.; Chen, C. T.; Chen, C. C.; Lin, C. C. ChemBioChem 2008, 9,1100–1109.
(23) Koh, I.; Hong, R.; Weissleder, R.; Josephson, L. Angew. Chem., Int. Ed.Engl. 2008, 47, 4119–21.
(24) Perez, J. M.; Josephson, L.; O’Loughlin, T.; Hogemann, D.; Weissleder, R.Nat. Biotechnol. 2002, 20, 816–820.
(25) Kaittanis, C.; Naser, S. A.; Perez, J. M. Nano Lett. 2007, 7, 380–383.(26) Koh, I.; Hong, R.; Weissleder, R.; Josephson, L. Anal. Chem. 2009, 81,
3618–3622.
7432 Analytical Chemistry, Vol. 82, No. 17, September 1, 2010
pared to dispersed magnetic nanoparticles, whereas aggregatedmagnetic microparticles exhibit increased T2 values. While thephysical nature of this differential behavior on the T2 values isstill under investigation, it is clear that the use of micrometerbeads improves the limit of detection significantly.23 Therefore,we used micrometer beads in this study.
For our initial studies, we synthesized carbohydrates that areknown to bind to well characterized lectins. We synthesized R-man-nosides, which bind to Concanavalin A (ConA) and Galanthus Nivalislectin (GNL), and �-galactoside, which bind to Ricinus communislectin (RCA120) and the plant toxin, ricin. Our previously describedmodular chemistry approach was used to construct the moleculesdepicted in Figure 2.3,5,17 The synthesis of one of the molecules, atetra antennary carbohydrate bearing four mannose residues, GC1,is shown in Scheme 1. First, the acetate groups in known tetra-acetate�-galactoside 5 were deprotected under Zemplen conditions to give
the deprotected product 6. Next, the hydroxyl groups were reactedwith propargyl bromide in the presence of NaH to afford compound7, which has four alkyne functionalities, in reasonable yield. The 1,3dipolar cycloaddition of four equivalents of the known carbohydratehaving azide functionality, 8 with 7 in the presence of sodiumascorbate and CuSO4, followed by deprotection of Boc groupafforded compound 10 in 50% yield over two steps. The final stepsincluded coupling of D-biotin to the free amine of 10 usingstandard coupling conditions followed by deprotection of acetateprotecting groups to afford GC1 in appreciable yield. Next, weattached the ligands to streptavidin coated micrometer beads (1.0µm streptavidin coated Dynabeads MyOne, Invitrogen, Carlsbad,CA). Incubation of the micrometer beads with excess biotinylatedcarbohydrates was followed by extensive washing and blockingwith 0.1% BSA in PBS to reduce nonspecific binding.
Next, we measured the relaxation properties of the carbohydratecoated magnetic beads to ensure that the integral properties did notchange because of the surface coating of organic material. We foundthat the magnetic properties of the carbohydrate encapsulatedmagnetic beads correlated very well to the beads without anycarbohydrate coating (Table 1, Supporting Information), indicatingthat carbohydrate coating does not perturb the magnetic propertiesof the beads. The relaxivity values of the magnetic beads weredetermined using the Bruker minispec 60 MHz mq60 (1.41 T) tabletop contrast agent analyzer as described previously.23,27 We alsoquantified the number of carbohydrates present on the bead usinga chemically destructive method (Figure 1, Supporting Information).We found that the number of carbohydrates on the surface correlates
(27) Hong, R.; Cima, M. J.; Weissleder, R.; Josephson, L. Magn. Reson. Med.2008, 59, 515–520.
Figure 1. (A) Schematic of the aggregation process caused by theinteraction between multivalent carbohydrates and protein. The browncircles and red polygons represent micrometer beads with carbohydratereceptors and proteins, respectively. (B) The transverse relaxation (T2)values of micrometer magnetic beads (Inset: Difference in T2 in presenceand absence of analyte is shown as ∆T2: red squares, in presence ofspecific analyte; blue triangles, in presence of nonspecific analyte). Themagnetic beads were incubated with continuous stirring in the presenceand absence of analyte to minimize settling. ∆T2 was calculated as adifference in T2 values in the presence and absence of analyte.
Figure 2. Structures of the biotinylated molecules used in this study.
Scheme 1. Synthesis of the BiotinylatedTetra-Antennary Carbohydratea
a Reagents and conditions. (a) NaOMe, MeOH, RT, 12 h, 89%; (b)propargyl bromide, NaH, THF, reflux, 1 h, 51%; (c) sodium ascorbate,CuSO4, THF, H2O, RT, 48 h; (d) TIPS, TFA, CH2Cl2, RT, 24 h, 50%over two steps; (e) D-biotin, NMM, CDMT, THF, DMF, 75%; (f)NaOMe, MeOH, 70%.
7433Analytical Chemistry, Vol. 82, No. 17, September 1, 2010
very well with the manufacturer’s specifications. However, coatingwith the tetra-antennary R-mannoside, GC1, was considerably lesscompared to the monoantennary R-mannoside GC2, presumablybecause of the larger size of the former.
Next, we tested the hypothesis that carbohydrate inducedaggregation could lead to measurable changes in T2 values.Addition of ConA to GC2 (R-mannoside coated beads) resultedin the expected increase in T2 (filled blue circles, Figure 3).All the data is represented as ∆T2, which represents thedifference in T2 values in between a control tube with no analyteand an experimental tube with the analyte incubated underidentical conditions. We found no increase in ∆T2 whenRCA120, the lectin that does not bind to R-mannosides, wasused, indicating specificity (filled green triangles, Figure 3A).GNL, a lectin that is also known to bind to R-mannosides, resultedin a different initial aggregation rates with GC2 (filled red squares,Figure 3A). Statistical analysis of the data at 85 min revealed thatthese differences are statistically significant as measured by thestudents t test. (Figure 4A Supporting Information) These differentaggregation rates are presumably due to differences in the affinity,number, and spatial arrangement of the binding sites in ConAand GNL (Figure 2, Supporting Information). At pH 7, ConA existsas a tetramer with four binding sites arranged at the apex of dome
shaped monomers,28 whereas the structure of GNL tetramerresembles a flattened crown with 12 mannose binding sites.29,30
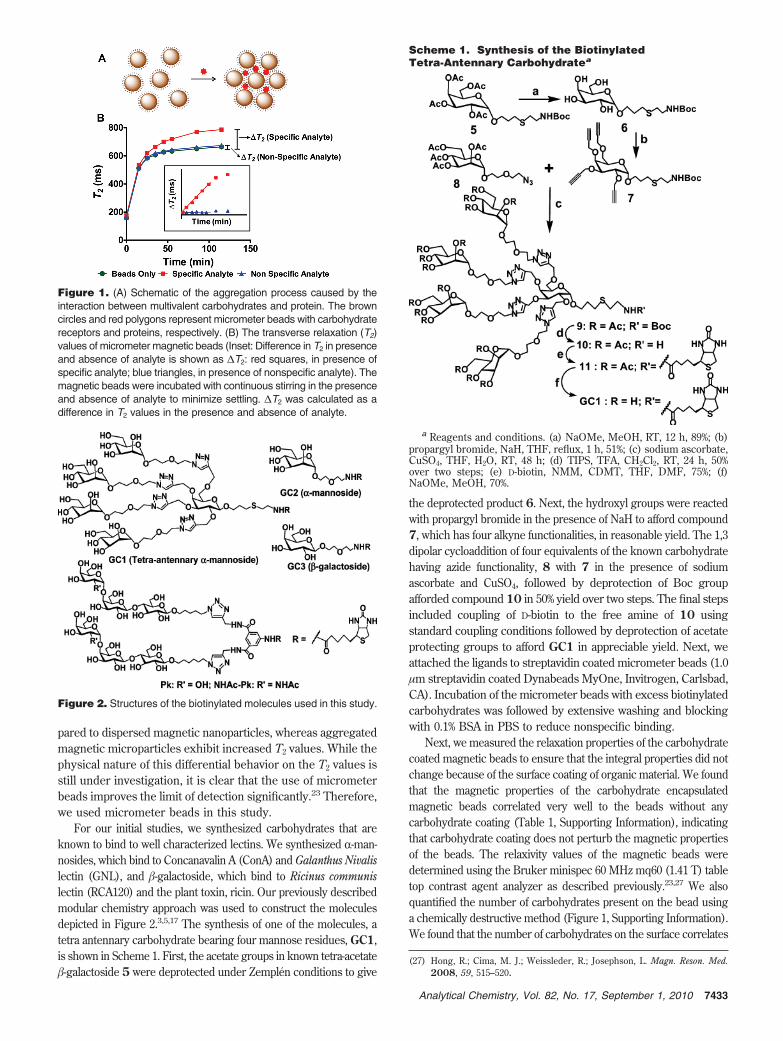
The binding of GC3 (�-galactoside coated beads) with RCA120lectin is shown in Figure 3B (filled green triangles). As expected,there is a significant increase in the ∆T2 values, whereas the controlanalyte, ConA, exhibited no binding (filled blue triangles, Figure3B). The initial aggregation rate of ricin, a protein that also recognizes�-galactosides, is depicted by the black filled squares (Figure 3B).As observed previously with the ConA and GNL system, RCA120and ricin, two proteins that bind to the same carbohydrate, displaydifferent initial aggregation rates, which are statistically significant(Figure 4B, Supporting Information).
We also studied the effect of increasing the number ofcarbohydrate receptors on the magnetic beads. ∆T2 values forGC1, which is the carbohydrate with four � mannosides (pinkline, Figure 3C) are larger than monomeric R-mannoside GC2(blue line, Figure 3C). Presumably, the increase in the numberof R-mannosides in GC1 leads to more rapid and larger ag-gregates. Next, we hypothesized that the use of an additionalrecognition molecule that recognized different epitopes of theprotein, for example antibody, would lead to increased aggregationthrough increased cross-linking, which could lead to increasedsensitivity. We also expected an increase in specificity since thetwo recognition elements bind to two different epitopes. To testthis hypothesis, we incubated GC3 (�-galactoside coated beads)coated beads with RCA120 for 1 h, followed by addition of antibodyto RCA120 or nonspecific antibody to Shiga toxin (Stx) andincubation for 1 h. As shown in Figure 3D, antibody to RCA120promoted a significant increase in the ∆T2 values, while poly-clonal antibody specific to Stx did not.
Quantitative analysis using different concentrations of RCA120lectin was performed to obtain the limit of detection. A graph of%∆T2 was plotted against RCA120 concentrations and fitted intoa four parameter equation to obtain EC50 value, Hill coefficient,and projected sensitivity concentration (PSC) (Figure 5).23 Theresults are summarized in Table 1. When GC3 (�-galactosidecoated beads) coated beads were used with only RCA120, the EC50
value was 0.62 nM, but when antibody was used, the EC50 valuedecreased to 0.12 nM. Thus, using a combination of recognitionmolecules, the sensitivity was increased 5-fold.
To demonstrate the versatility and scope of this assay, we usedour previously identified ligands to detect and differentiate betweenShiga toxin (Stx1 and 2) isoforms. The five identical subunits of Stxform a pentamer with superficial pentaradial symmetry. Each subunithas three binding sites, so there are total of 15 potential binding sitesper toxin. Stx1 binds to Pk trisaccharides and Stx2 prefers the
(28) Bouckaert, J.; Hamelryck, T. W.; Wyns, L.; Loris, R. J. Biol. Chem. 1999,274, 29188–29195.
(29) Hester, G.; Kaku, H.; Goldstein, I. J.; Wright, C. S. Nat. Struct. Biol. 1995,2, 472–479.
(30) Barre, A.; Bourne, Y.; Van Damme, E. J.; Peumans, W. J.; Rouge, P.Biochimie 2001, 83, 645–651.
Figure 3. (A) Differentiation of R-mannoside binding proteins usingGC2 coated micrometer magnetic beads: 1.9 nM GNL, 1.9 nM ConA,and 1.7 nM RCA120 were used. (B) Differentiation of �-galactosidebinding proteins using GC3 coated micrometer magnetic beads: 1.7 nMricin, 1.7 nM RCA120, and 1.9 nM ConA were used. (C) Increase in thesensitivity of the detection by increasing receptor density. TetramericGC1 and monomeric GC2 coated beads were incubated with 1.9 nMConA. (D) Increase in sensitivity and selectivity system using a combina-tion of carbohydrate and antibody. Orange squares: GC3 coated beadswith 0.85 nM RCA120 and 100 µL of antibody to RCA120 (2 µg in 5 mLof PBS buffer); green triangles: 0.85 nM RCA120; purple triangles: 0.85nM RCA120 and 100 µL of antibody to Stx1 (2 µg in 5 mL PBS of buffer).∆T2 represents the difference in T2 values in between a control tube(no analyte) and an experimental tube. Results are the average of threeindependent trials. A linear increase in ∆T2 was observed for first 55min. This was used to compute the initial ∆T2/min. (Please see Table 2,Supporting Information.)
Table 1. Specific Antibody to RCA120 ImprovesSensitivity of GC3 (�-Galactoside Coated Beads)
EC50 [pM] Hill slope PSC [pM]
without antibody 620 1.00 27with antibody 120 0.91 4
7434 Analytical Chemistry, Vol. 82, No. 17, September 1, 2010
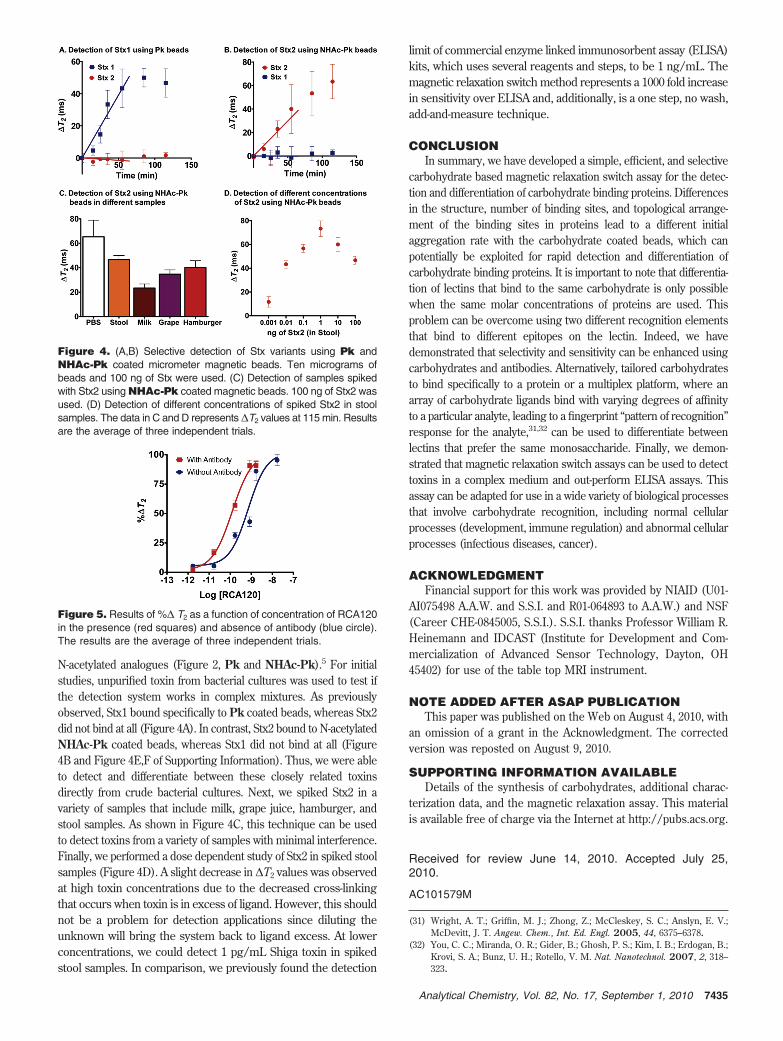
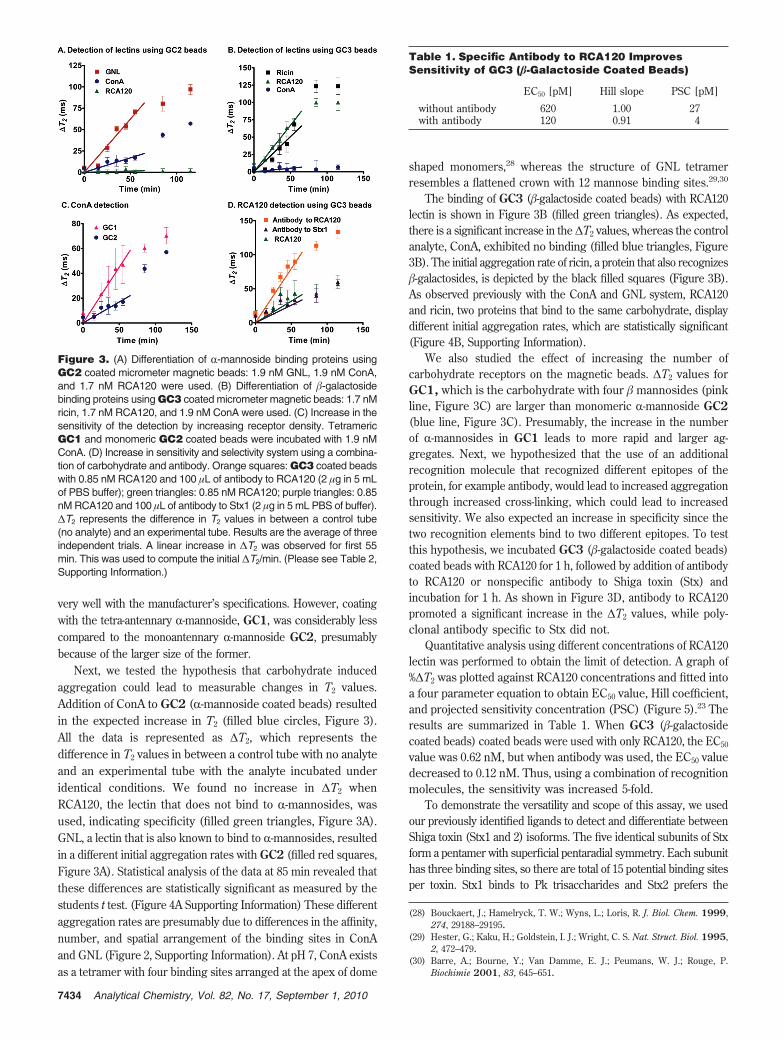
N-acetylated analogues (Figure 2, Pk and NHAc-Pk).5 For initialstudies, unpurified toxin from bacterial cultures was used to test ifthe detection system works in complex mixtures. As previouslyobserved, Stx1 bound specifically to Pk coated beads, whereas Stx2did not bind at all (Figure 4A). In contrast, Stx2 bound to N-acetylatedNHAc-Pk coated beads, whereas Stx1 did not bind at all (Figure4B and Figure 4E,F of Supporting Information). Thus, we were ableto detect and differentiate between these closely related toxinsdirectly from crude bacterial cultures. Next, we spiked Stx2 in avariety of samples that include milk, grape juice, hamburger, andstool samples. As shown in Figure 4C, this technique can be usedto detect toxins from a variety of samples with minimal interference.Finally, we performed a dose dependent study of Stx2 in spiked stoolsamples (Figure 4D). A slight decrease in ∆T2 values was observedat high toxin concentrations due to the decreased cross-linkingthat occurs when toxin is in excess of ligand. However, this shouldnot be a problem for detection applications since diluting theunknown will bring the system back to ligand excess. At lowerconcentrations, we could detect 1 pg/mL Shiga toxin in spikedstool samples. In comparison, we previously found the detection
limit of commercial enzyme linked immunosorbent assay (ELISA)kits, which uses several reagents and steps, to be 1 ng/mL. Themagnetic relaxation switch method represents a 1000 fold increasein sensitivity over ELISA and, additionally, is a one step, no wash,add-and-measure technique.
CONCLUSIONIn summary, we have developed a simple, efficient, and selective
carbohydrate based magnetic relaxation switch assay for the detec-tion and differentiation of carbohydrate binding proteins. Differencesin the structure, number of binding sites, and topological arrange-ment of the binding sites in proteins lead to a different initialaggregation rate with the carbohydrate coated beads, which canpotentially be exploited for rapid detection and differentiation ofcarbohydrate binding proteins. It is important to note that differentia-tion of lectins that bind to the same carbohydrate is only possiblewhen the same molar concentrations of proteins are used. Thisproblem can be overcome using two different recognition elementsthat bind to different epitopes on the lectin. Indeed, we havedemonstrated that selectivity and sensitivity can be enhanced usingcarbohydrates and antibodies. Alternatively, tailored carbohydratesto bind specifically to a protein or a multiplex platform, where anarray of carbohydrate ligands bind with varying degrees of affinityto a particular analyte, leading to a fingerprint “pattern of recognition”response for the analyte,31,32 can be used to differentiate betweenlectins that prefer the same monosaccharide. Finally, we demon-strated that magnetic relaxation switch assays can be used to detecttoxins in a complex medium and out-perform ELISA assays. Thisassay can be adapted for use in a wide variety of biological processesthat involve carbohydrate recognition, including normal cellularprocesses (development, immune regulation) and abnormal cellularprocesses (infectious diseases, cancer).
ACKNOWLEDGMENTFinancial support for this work was provided by NIAID (U01-
AI075498 A.A.W. and S.S.I. and R01-064893 to A.A.W.) and NSF(Career CHE-0845005, S.S.I.). S.S.I. thanks Professor William R.Heinemann and IDCAST (Institute for Development and Com-mercialization of Advanced Sensor Technology, Dayton, OH45402) for use of the table top MRI instrument.
NOTE ADDED AFTER ASAP PUBLICATIONThis paper was published on the Web on August 4, 2010, with
an omission of a grant in the Acknowledgment. The correctedversion was reposted on August 9, 2010.
SUPPORTING INFORMATION AVAILABLEDetails of the synthesis of carbohydrates, additional charac-
terization data, and the magnetic relaxation assay. This materialis available free of charge via the Internet at http://pubs.acs.org.
Received for review June 14, 2010. Accepted July 25,2010.
AC101579M
(31) Wright, A. T.; Griffin, M. J.; Zhong, Z.; McCleskey, S. C.; Anslyn, E. V.;McDevitt, J. T. Angew. Chem., Int. Ed. Engl. 2005, 44, 6375–6378.
(32) You, C. C.; Miranda, O. R.; Gider, B.; Ghosh, P. S.; Kim, I. B.; Erdogan, B.;Krovi, S. A.; Bunz, U. H.; Rotello, V. M. Nat. Nanotechnol. 2007, 2, 318–323.
Figure 4. (A,B) Selective detection of Stx variants using Pk andNHAc-Pk coated micrometer magnetic beads. Ten micrograms ofbeads and 100 ng of Stx were used. (C) Detection of samples spikedwith Stx2 using NHAc-Pk coated magnetic beads. 100 ng of Stx2 wasused. (D) Detection of different concentrations of spiked Stx2 in stoolsamples. The data in C and D represents ∆T2 values at 115 min. Resultsare the average of three independent trials.
Figure 5. Results of %∆ T2 as a function of concentration of RCA120in the presence (red squares) and absence of antibody (blue circle).The results are the average of three independent trials.
7435Analytical Chemistry, Vol. 82, No. 17, September 1, 2010