Embed Size (px)
Citation preview

DISEASES OF AQUATIC ORGANISMSDis Aquat Org
Vol. 116: 173–184, 2015doi: 10.3354/dao02912
Published October 27
INTRODUCTION
Infectious pancreatic necrosis (IPN) is a highly con-tagious disease that affects salmonid fish reared inintensive culture systems, causing high mortalityrates in first-feeding fry and in post-smolts shortlyafter transfer to sea water (Jarp et al. 1995, Evensen& Santi 2008). IPN is among the most important viraldiseases in Chile and is considered endemic in thecountry, causing great economic losses to the salmonaquaculture industry. Its etiological agent, infectiouspancreatic necrosis virus (IPNV), was first isolatedin Chile in the 1980s (McAllister & Reyes 1984,Espinoza et al. 1985), but the presence of IPN was notconfirmed until 1998 (Bluth et al. 2003). Since then,
official reports indicate a broad distribution of thedisease and a high incidence in its diagnosis, affect-ing mainly Atlantic salmon fry (Sernapesca 2007).IPNV is currently one of the most frequently detectedpathogens by diagnostic laboratories in both marineand freshwater farms, and the second cause of mor-tality by infection in adult Atlantic salmon in marinefarms in Chile (Sernapesca 2013). Given that IPNV isamong the most persistent salmonid pathogens pres-ent in the country, there is a need to complete thecurrent information available regarding diagnosticmethodologies, distribution of the virus, and types ofgenogroups present.
Historically, the recommended method for thediagnosis of IPN was based on the isolation of the
© The authors 2015. Open Access under Creative Commons byAttribution Licence. Use, distribution and reproduction are un -restricted. Authors and original publication must be credited.
Publisher: Inter-Research · www.int-res.com
*Corresponding author: [email protected]
Detection and phylogenetic analysis of infectiouspancreatic necrosis virus in Chile
D. Tapia1, Y. Eissler*, P. Torres, E. Jorquera, J. C. Espinoza, J. Kuznar
Centro de Investigación y Gestión de Recursos Naturales, Instituto de Química y Bioquímica, Facultad de Ciencias, Universidad de Valparaíso, Gran Bretaña 1111, Valparaíso 2360102, Chile
ABSTRACT: Infectious pancreatic necrosis virus (IPNV) is the etiological agent of a highly conta-gious disease that is endemic to salmon farming in Chile and causes great economic losses to theindustry. Here we compared different diagnostic methods to detect IPNV in field samples, includ-ing 3 real-time reverse transcription PCR (qRT-PCR) assays, cell culture isolation, and indirect flu-orescent antibody test (IFAT). Additionally, we performed a phylogenetic analysis to investigatethe genogroups prevailing in Chile, as well as their geographic distribution and virulence. The 3qRT-PCR assays used primers that targeted regions of the VP2 and VP1 genes of the virus andwere tested in 46 samples, presenting a fair agreement within their results. All samples were pos-itive for at least 2 of the qRT-PCR assays, 29 were positive for cell culture, and 23 for IFAT, show-ing less sensitivity for these latter 2 methods. For the phylogenetic analysis, portions of 1180 and523 bp of the VP2 region of segment A were amplified by RT-PCR, sequenced and compared withsequences from reference strains and from isolates reported by previous studies carried out inChile. Most of the sequenced isolates belonged to genogroup 5 (European origin), and 5 wereclassified within genogroup 1 (American origin). Chilean isolates formed clusters within each ofthe genogroups found, evidencing a clear differentiation from the reference strains. To our knowl-edge, this is the most extensive study completed for IPNV in Chile, covering isolates from sea- andfreshwater salmon farms and showing a high prevalence of this virus in the country.
KEY WORDS: IPNV · Cell culture · Indirect fluorescent antibody test · IFAT · Real-time reversetranscription PCR · qRT-PCR · Diagnostic assays · Phylogeny · VP2 gene
OPENPEN ACCESSCCESS

Dis Aquat Org 116: 173–184, 2015
virus in cell culture, followed by antibody-basedidentification of the agent (OIE 2006). The need for amore rapid screening procedure for the virus led tothe development of faster immunological assays,such as the indirect fluorescent antibody test (IFAT;Espinoza & Kuznar 2002), and molecular-based tech-niques such as conventional polymerase chain reac-tion (PCR) (Blake et al. 1995, Williams et al. 1999,Rodriguez Saint-Jean et al. 2001, Barlic-Maganja etal. 2002). At present, the real-time reverse transcrip-tion-PCR (qRT-PCR) method is widely used (Bowerset al. 2008, Ørpetveit et al. 2010, Bowers & Dhar2011, Eissler et al. 2011) because its application issimple, accurate, and offers fast results. In Chile,depending on the laboratory, different techniquesare used to diagnose IPN, the most common beingqRT-PCR and/or IFAT. Additionally, diagnosis of IPNmust also rely on the capacity of diagnostic methodsto detect the different strains of the virus.
IPNV is a non-enveloped virus that belongs to thefamily Birnaviridae, genus Aquabirnavirus (Dobos &Roberts 1983). Its genome holds 2 double-strandedRNA segments: segment A, which encodes a viralcapsid protein (VP2), an internal protein (VP3), aviral protease (VP4), and a non-structural protein(VP5); and segment B, which encodes the RNA poly-merase (VP1) (Dobos 1995). Aquatic birnaviruseswere originally divided into 2 serogroups based oncross-neutralization tests: serogroup A, which con-tains most of the IPNV isolates associated with thedisease grouped into 9 serotypes (A1−A9), andserogroup B, which includes serotype B1 (Hill & Way1995). More recently, phylogenetic analysis of theVP2 gene suggested that the 9 strains of serogroup Afall into 6 genogroups that correlated well with sero-logical classification and geographical origin (Blakeet al. 2001). The VP2 gene is also considered to playa significant role in virulence, with several aminoacid positions identified as possible molecular mark-ers for this characteristic in IPNV strains (Bruslind &Reno 2000, Santi et al. 2004, Shivappa et al. 2004,Song et al. 2005).
In Chile, the types of IPNV that are present andhave been genetically characterized to date belongonly to genogroups 1 and 5 (Mutoloki & Evensen2011, Eissler et al. 2011, Calleja et al. 2012). How-ever, the geographic zones examined have been lim-ited to very few locations, and the great majority ofsamples have been from freshwater outbreaks. Inorder to obtain a broader perspective about the IPNVsituation in Chile, a progressive expansion of thegeographic areas, host species, and environmentalorigin sampled is required. In addition, an appropri-
ate selection of diagnostic method(s) is necessary forthe control of the virus to prevent the escape of IPNVgenetic variants that are present in the country.
Accordingly, 2 main objectives were addressed inthis work: (1) to examine to which extent currentmethods used to diagnose IPN in Chile are consis-tently accurate and reliable as tools to implementcontrol measurements, and (2) to expand the geo-graphic range and source origin of the IPN virus sam-ples in order to increase the knowledge of thegenogroups and genotypes prevailing in Chile, aswell as their distribution and virulence.
MATERIALS AND METHODS
Fish samples
Samples from fry to adults of Atlantic salmonSalmo salar and rainbow trout Oncorhynchus mykisswere collected from different freshwater and sea -water fish farms in southern Chile during 2012 andthe beginning of 2013 (Table 1). In general, sampleswere obtained from sites where outbreaks hadrecently taken place or IPN infection had been diag-nosed. Pools of visceral organs (kidney and spleen)containing material usually from 3 fish were stored inL-15 (Leibovitz) medium supplemented with 10%fetal bovine serum (FBS, HyClone) and 50 µg ml−1
gentamicin, and in parallel in 95% ethanol. Samplesstored in L-15 medium were used for immunofluores-cence detection and virus isolation, whereas thosestored in 95% ethanol were used for qRT-PCRassays. The former were homogenized in approxi-mately 5 volumes of L-15 medium, and the latter inphosphate-buffered saline (PBS) 1× buffer. Both sam-ples were pelleted at 2000 × g (15 min at 4°C) in aMIKRO 22R centrifuge (Hettich Zentrifugen). Thesupernatants were collected and used directly for cellculture inoculation (homogenates in L-15 medium) orfor RNA extraction (homogenates in PBS).
Virus isolation in cell culture and immunofluores-cence detection
For the virus isolation and immunofluorescenceassay, Chinook salmon embryo cells (CHSE-214),derived from O. tshawtyscha embryonic tissue, weregrown as monolayers at 17°C in L-15 medium sup-plemented with 10% FBS and 50 µg ml−1 gentamicinon 24-well plastic plates with 12 mm circular glasscoverslips, or 33 mm diameter plastic petri dishes.
174

Tapia et al.: Diagnostic and genetic analysis of IPNV
The immunofluorescence assay wasdone following the methodology de-scribed by Espinoza & Kuznar (2002)with slight modifications. Briefly, cells inthe 24-well plastic plates were inoculatedwith 10 µl of the supernatant from theL-15 medium homogenate of the sal -monid samples. After 48 h, cell monolay-ers were fixed with cold methanol for10 min, rinsed with PBS 1× buffer, and incubated with a monoclonal antibody(IB3/ E10, GrupoBios) against VP2 pro -tein (final concentration: 2 µg ml−1) dur-ing 1 h at room temperature. Cells wererinsed again, and a secondary anti-mouse antibody (Sigma) conjugated withfluore scein isothiocyanate (FITC) wasused to label the infected cells (1/100in PBS). Finally, after rinsing the cellsfor a third time, the circular glass cover-slips containing the cell monolayers weremounted on glass slides using an anti -fade mounting solution (DakoCytoma-tion) and were visualized using an epiflu-orescence microscope (Olympus BX60).
For virus isolation in cell culture, 20 µlof the supernatant from the L-15 medi -um homogenate were inoculated intoCHSE-214 cells, on 33 mm diameterplastic petri dishes. Cells were incubatedat 17°C and examined daily for cyto-pathic effect (CPE) with a light micro-scope. Cells cultures showing CPE weresubjected to 2 cycles of freezing andthawing and were then centrifuged at3000 × g (15 min at 4°C). Supernatantswere collected and stored at −20°C untiluse. If no clear CPE was detected after7 d of inoculation, the inoculation pro-cess was repeated in a new culture ofcells and maintained for another week toensure development of CPE.
RNA extraction and real-time RT-PCRassays
Viral RNA from the supernatant ofthe PBS homogenate of the salmonidsamples was extracted according tothe manufacturer’s instructions with anE.Z.N.A.™ Total RNA Kit I (Omega Bio-tek). The extracted RNA was eluted with
175
Sam
ple
ID
Dat
e of
Hos
t sp
ecie
sS
tag
e of
En
viro
nm
enta
lG
eog
rap
hic
Eg
g52
3 b
p s
egm
ent
1180
bp
seg
men
tsa
mp
lin
gg
row
thor
igin
orig
inso
urc
eac
cess
ion
nu
mb
erac
cess
ion
nu
mb
er
AL
KA
(1,2
,3)
May
201
2A
tlan
tic
salm
onF
ryF
resh
wat
erR
io M
aull
ín, P
uer
to V
aras
Ch
ile
KF
7358
89/
KF
7358
90/
KF
7358
91K
F95
4910
/ K
F95
4911
/ K
F95
4912
Sal
mo
sala
rB
LC
O(1
,2,3
)M
ay 2
012
Atl
anti
c sa
lmon
F
ryF
resh
wat
erL
ago
Ch
apo
Au
stra
lia
KF
7358
94/
KF
7358
95/
KF
7358
96K
F95
4913
/ K
F95
4914
IHJS
(1,3
)M
ay 2
012
Rai
nb
ow t
rou
tF
ryF
resh
wat
erR
io P
atas
, Coc
ham
óD
enm
ark
KF
7359
04/
KF
7359
05K
F95
4926
/ K
F95
4927
On
corh
ynch
us
myk
iss
KJK
B(1
,2,3
)M
ay 2
012
Atl
anti
c sa
lmon
Fry
Fre
sh w
ater
Rio
Ch
apar
ano
Ch
ile
KF
7359
06/
KF
7359
07/
KF
7359
08K
F95
4917
/ K
F95
4918
NG
RO
(1,2
,3)
May
201
2R
ain
bow
tro
ut
Fry
Fre
sh w
ater
Cu
raca
utí
nC
hil
eK
F73
5913
HP
2CC
(1,2
,3)
Jun
201
2A
tlan
tic
salm
onF
ryF
resh
wat
erH
ual
aih
ue,
Hor
nop
iren
nr
KF
7359
03A
YN
T(4
03A
, 403
BA
ug
201
2A
tlan
tic
salm
onn
rn
rR
io U
nió
n, P
uyu
hu
api
Ch
ile
KF
7358
92/
KF
7358
93K
F95
4915
/ K
F95
4916
409A
,409
B)
OE
A(0
4,05
,06)
Oct
201
2A
tlan
tic
salm
onA
du
ltS
ea w
ater
Est
ero
Poc
a E
sper
anza
,n
rn
sIs
las
Wag
ner
RV
(02,
04,0
6)N
ov 2
012
Atl
anti
c sa
lmon
Fry
Fre
sh w
ater
Nor
ther
n P
un
ta A
ren
asIc
elan
dK
F73
5914
/ K
F73
5915
/ K
F73
5916
KF
9549
28/
KF
9549
29/
KF
9549
30R
V(1
6)N
ov 2
012
Atl
anti
c sa
lmon
Ad
ult
Sea
wat
erS
eno
Sk
yrin
g, R
ío V
erd
eIm
por
ted
ns
MA
DA
(1,2
,3)
Nov
201
2A
tlan
tic
salm
onF
ryF
resh
wat
erP
arg
ua,
Ch
ayah
ué
Ch
ile
KF
7359
12C
NJJ
(1,2
,3)
Nov
201
2A
tlan
tic
salm
onF
ryF
resh
wat
erP
arg
ua,
Ch
ayah
ué
Icel
and
KF
7358
97/
KF
7358
98/
KF
7358
99K
F95
4919
AT
S3
Dec
201
2A
tlan
tic
salm
onA
du
ltS
ea w
ater
Pu
nta
Ch
apar
ano,
Ch
ile
ns
Est
ero
Rel
onca
víA
YN
TK
R(1
03,
Dec
201
2A
tlan
tic
salm
onA
du
ltS
ea w
ater
Est
ero
Pu
yuh
uap
in
rn
s11
2 m
ix)
JVC
Z1
Dec
201
2A
tlan
tic
salm
onA
du
ltS
ea w
ater
Qu
eilé
nC
hil
en
sD
AN
N3
Dec
201
2A
tlan
tic
salm
onA
du
ltS
ea w
ater
Pu
nta
Pom
pon
, Isl
a T
ran
qu
iC
hil
eK
F73
5900
KO
MA
(4,5
,6)
Dec
201
2A
tlan
tic
salm
onF
ryF
resh
wat
erR
ío P
esca
do,
Pu
erto
Var
asC
hil
eK
F73
5909
/ K
F73
5910
/ K
F73
5911
KF
9549
20 /
KF
9549
21/
KF
9549
22A
DM
V(1
,2,3
)M
ar 2
013
Rai
nb
ow t
rou
tS
mol
tF
resh
wat
erR
ío M
aull
ín, C
hu
yaq
uen
Ch
ile
KF
7358
86/
KF
7358
87/
KF
7358
88K
F95
4924
/ K
F95
4925
Tab
le 1
. Des
crip
tion
of
infe
ctio
us
pan
crea
tic
nec
rosi
s vi
rus
(IP
NV
) sa
mp
les
anal
ysed
in t
his
stu
dy.
nr:
not
rep
orte
d; n
s: n
ot s
equ
ence
d

Dis Aquat Org 116: 173–184, 2015
molecular biology grade water and stored at −80°C.Concentration and purity of the extracted total RNAwas determined by measuring the absorbance ratioat 260 nm over 280 nm using a spectrophotometer(Nanodrop ND-1000 UV/VIS). To ensure that con-tamination remained strictly controlled during theRNA extraction process, a negative control usingmolecular biology grade water was always included.
The extracted RNA was reverse transcribed andamplified by a 1-step RT-PCR using the Step-One 48-well plate real-time PCR system (Applied Bio systems).Three sets of primers designed to detect aquatic birnaviruses were used in the TaqMan™ and SYBR®
green qRT-PCR assays. The first set of primers, VP1Fand VP1R, and their appropriate probe, recognize aconserved region within the VP1 gene of segment B(qRT-PCR 1; Eissler et al. 2011); the second set ofprimers, WB1 and WB2, recognize a 206 bp fragmentof the VP2 region of segment A (qRT-PCR 2; Williamset al. 1999); and the third set of primers tested recog-nize a 164 bp portion of the same region (qRT-PCR 3;Table 2).
The AgPath-ID™ One-Step RT-PCR Kit (AppliedBiosystems) was used for amplification with the firstset of primers that recognize segment B of the virus(qRT-PCR 1). This reaction was carried out in a 15 µlreaction volume containing 7.5 µl of RT-PCR Buffer(2×), 0.9 µM each of forward and reverse primers,0.2 µM of the VP1 Taqman probe, 0.6 µl of RT-PCREnzyme Mix (25×), and 2 µl of total RNA. The ther-mal profile used was 48°C for 10 min for reverse tran-scription, pre-denaturation at 95°C for 10 min; fol-lowed by 40 cycles of denaturation at 95°C for 15 sand annealing/extension at 59°C for 45 s.
The reaction for the amplification with the sets ofprimers that recognize segment A of the virus (qRT-PCR 2 and 3) was carried out in a 15 µl reaction vol-ume containing 7.5 µl of 2× Brilliant III Ultra-FastSYBR® Green QRT-PCR Master Mix (Stratagene),0.5 µM each of forward and reverse primers, 0.8 µl ofRT/RNAse block, 0.3 µM of ROX as a passive refer-ence, and 2 µl of total RNA. The thermal profile usedwas 50°C for 5 min for reverse transcription, pre-denaturation at 95°C for 3 min; followed by 40 cyclesof denaturation at 95°C for 5 s and annealing/exten-sion at 60°C for 10 s. Finally, a melting curve analysisfrom 70 to 95°C was performed.
The detection limit, efficiency, and sensitivity ofthe qRT-PCR assays were evaluated several timesusing 10-fold dilutions of RNA extracted from a virusreference strain, VUV-84 (Eissler et al. 2011). Theamplification efficiency (%) was calculated based onthe formula (10(−1/slope) − 1) × 100, and varied from 99to 108% for all the standard curves performed. Thecut-off threshold cycle (Ct) values were 30.8, 32.0,and 32.3, for qRT-PCR 1, 2, and 3, respectively, andthe 3 assays were able to detect up to 105 dilution,showing the same level of sensitivity.
For each set of samples, all assays were performedon the same day, and a positive control, consisting ofthe virus strain VUV-84, was always used as a refer-ence sample. No-template controls, consisting of areaction mixture without template, and negative con-trols from the RNA extraction were also used in allreactions.
In order to compare the results and evaluatethe agreement among the diagnostic methods used,the Kappa statistic was calculated. To assess the
176
Primers/ Sequence Segment: Amplicon Codingprobe amplicon position size (bp) region
qRT-PCR 1Probe VP1 56FAM-TACATAGGC-ZEN-AAAACCAAAGGAGACAC-IABkFQ B: 668−820 152 VP1VP1F GTTGATMMASTACACCGGAGVP1R AGGTCHCKTATGAAGGAGTC
qRT-PCR 2WB1 CCGCAACTTACTTGAGATCCATTATGC A: 139−344 206 VP2WB2 CGTCTGGTTCAGATTCCACCTGTAGTG
qRT-PCR 3VP2F TCCAACTACGAGCTGATCCC A: 1227−1390 164 VP2VP2R GTCCTCTCCTTGTACTCCTC
For sequencingA1F TGAGATCCATTATGCTTCCAGA A: 151−1330 1180 VP2A2R GACAGGATCATCTTGGCATAGT
WB1 CCGCAACTTACTTGAGATCCATTATGC A: 139−661 523 VP2AIR GTCTCGTCC TCWAGBCGGACGTATG
Table 2. Primers and probes used for qRT-PCR assays and sequencing

Tapia et al.: Diagnostic and genetic analysis of IPNV
agreement among the 3 qRT-PCR techniques, aFleiss Kappa from rating scores was calculated usingthe online computer program StatsToDo (www.statstodo. com/CohenKappa_Pgm.php); whereas therest of the Kappa statistics were calculated usingGraphPad Software, also available online (http://graphpad. com/ quickcalcs/). The scale used to inter-pret the Kappa statistic was as follows: <0.01: lessthan chance agreement; 0.01−0.20: slight agreement;0.21−0.40: fair agreement; 0.41−0.60: moderateagreement; 0.61−0.80: substantial agreement; and0.81−0.99: almost perfect agreement (Viera & Garrett2005).
RT-PCR amplification and purification of cDNAproducts for sequencing analysis
Two fragments of the VP2 gene-coding regionwere amplified for sequencing, viz. a 1180 bp frag-ment via conventional PCR and a 523 bp fragmentusing a nested PCR technique. RNA extractions fromviral isolates in cell culture and directly from fish tis-sue samples were used as templates for the amplifi-cation of the 1180 bp fragment, in order to sequencethe majority of the positive samples detected for atleast 1 of the diagnostic methods used. The productof this amplification was used as template in the sec-ond round of amplification for the nested PCR toobtain the 523 bp fragment. This fragment was usedto determine the genogroup to which the samplesbelonged when sequence for the 1180 bp fragmentwas not obtained. The reactions were carried outusing PCR Multigene (Labnet) equipment. First, thefragment of 1180 bp was obtained through RT-PCRas follows: 3 µl of viral RNA were mixed with A1Fand A2R primers (Table 2, Blake et al. 1995) at a finalconcentration of 0.5 µM, 10 µl of 2× Brilliant III Ultra-Fast SYBR® Green QRT-PCR Master Mix (Strata-gene), 0.8 µl of RT/RNAse block, and 4.2 µl of theRNase free water in a 20 µl reaction volume. Theconditions for the reaction were 42°C for 30 min forreverse transcription, pre-denaturation at 95°C for3 min; 35 cycles of denaturation at 95°C for 30 s,annealing at 58°C for 30 s, and extension at 72°C for100 s; and a final extension at 72°C for 10 min. Ampli-fied PCR product (1.5 µl) was used to carry out thenested PCR using WB1 and AIR primers (Table 2) ata final concentration of 0.5 µM, 15 µl of 2× Dream-Taq™ Green PCR Master Mix (Fermentas), and10.5 µl of the RNase free water in a 30 µl reaction vol-ume. The reaction was performed as follows: pre-denaturation at 95°C for 5 min; 35 cycles of denatura-
tion at 95°C for 30 s, annealing at 60°C for 30 s, andextension at 72°C for 45 s; and a final extension at72°C for 10 min.
The amplified fragments resulting from the nestedPCR of the expected length were cut out of the geland transferred to a microcentrifuge tube and puri-fied using a E.Z.N.A.™ Gel Extraction Kit (OmegaBio-tek), and the PCR products obtained for the1180 bp fragment were purified using an E.Z.N.A.CYCLE PURE KIT (Omega Bio-tek), following themanufacturer’s instructions. The cDNA obtained foreach sample was eluted with 55 µl of molecular biol-ogy grade water. Purified duplicates of the PCR prod-ucts were sequenced by Macrogene (Korea) using anABI3730XL DNA Analyzer.
Phylogenetic analysis
The sequences obtained were analysed andcompared with reference strains of aquatic bir-naviruses and other Chilean IPNV isolates avail-able in GenBank (Blake et al. 2001, Eissler et al.2011, Mutoloki & Evensen 2011, Calleja et al.2012) using the software Bioedit version 7.1.9 (Hall1999). Multiple sequence alignments were per-formed using the ClustalW algorithm for sequencesof 523 and 1180 bp separately. Phylogenetic treeswere constructed for both the 523 and 1180 bpfragment sequences, using the neighbor-joiningmethod with p-distance and 1000 bootstrap repli-cates with the MEGA 5.22 software (Tamura et al.2011). The cladogram constructed with the 1180 bpsequences is shown here (see Fig. 1), while the523 bp cladogram was only used to determine thegenogroups in the samples when 1180 bp se -quencing was not achieved. In addition, the pair-wise distances were calculated for the 1180 bpsequences at the amino acid level to evaluate thedegree of sequence similarity. The nucleotidesequences used in this paper were deposited inGenBank, and their respective accession numbersare listed in Table 1.
RESULTS
During 2012 and the beginning of 2013, a total of46 field samples of fish organs covering a wide rangeof geographical locations were processed and ana-lysed to compare different diagnostic methods forIPNV. Table 3 shows the results of 3 qRT-PCR assays,IFAT, and virus isolation in cell culture, according to
177
Dis Aquat Org 116: 173–184, 2015
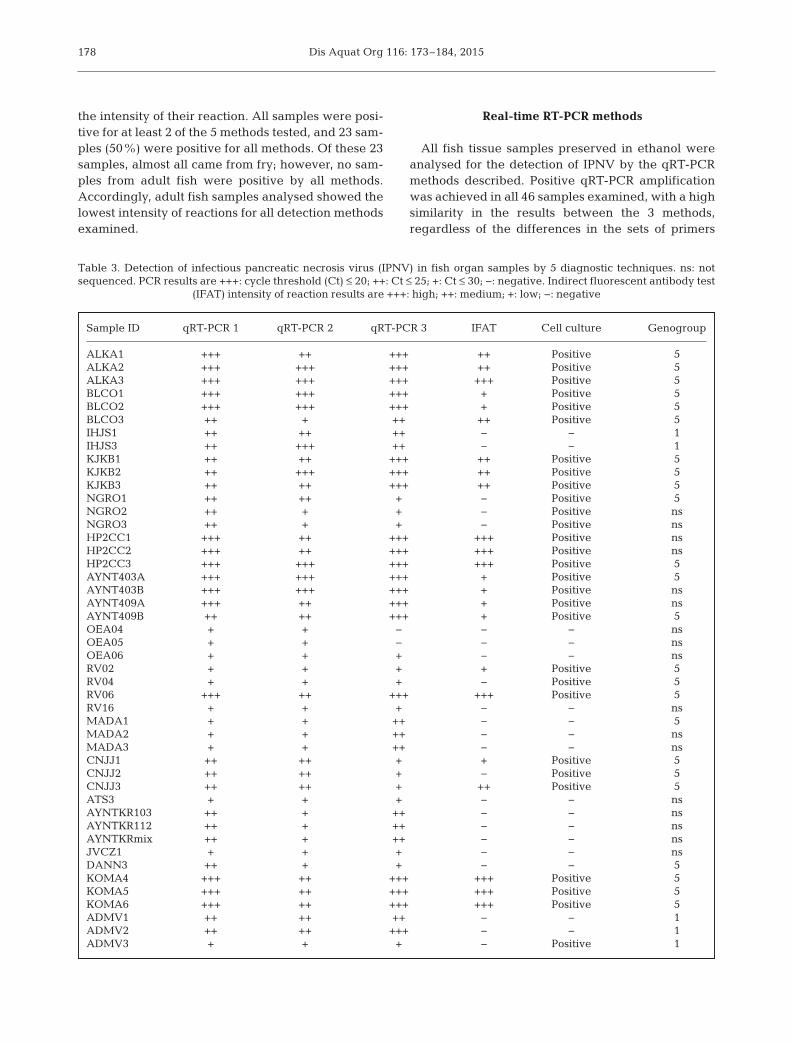
the intensity of their reaction. All samples were posi-tive for at least 2 of the 5 methods tested, and 23 sam-ples (50%) were positive for all methods. Of these 23samples, almost all came from fry; however, no sam-ples from adult fish were positive by all methods.Accordingly, adult fish samples analysed showed thelowest intensity of reactions for all detection methodsexamined.
Real-time RT-PCR methods
All fish tissue samples preserved in ethanol wereanalysed for the detection of IPNV by the qRT-PCRmethods described. Positive qRT-PCR amplificationwas achieved in all 46 samples examined, with a highsimilarity in the results between the 3 methods,regardless of the differences in the sets of primers
178
Sample ID qRT-PCR 1 qRT-PCR 2 qRT-PCR 3 IFAT Cell culture Genogroup
ALKA1 +++ ++ +++ ++ Positive 5ALKA2 +++ +++ +++ ++ Positive 5ALKA3 +++ +++ +++ +++ Positive 5BLCO1 +++ +++ +++ + Positive 5BLCO2 +++ +++ +++ + Positive 5BLCO3 ++ + ++ ++ Positive 5IHJS1 ++ ++ ++ − − 1IHJS3 ++ +++ ++ − − 1KJKB1 ++ ++ +++ ++ Positive 5KJKB2 ++ +++ +++ ++ Positive 5KJKB3 ++ ++ +++ ++ Positive 5NGRO1 ++ ++ + − Positive 5NGRO2 ++ + + − Positive nsNGRO3 ++ + + − Positive nsHP2CC1 +++ ++ +++ +++ Positive nsHP2CC2 +++ ++ +++ +++ Positive nsHP2CC3 +++ +++ +++ +++ Positive 5AYNT403A +++ +++ +++ + Positive 5AYNT403B +++ +++ +++ + Positive nsAYNT409A +++ ++ +++ + Positive nsAYNT409B ++ ++ +++ + Positive 5OEA04 + + − − − nsOEA05 + + − − − nsOEA06 + + + − − nsRV02 + + + + Positive 5RV04 + + + − Positive 5RV06 +++ ++ +++ +++ Positive 5RV16 + + + − − nsMADA1 + + ++ − − 5MADA2 + + ++ − − nsMADA3 + + ++ − − nsCNJJ1 ++ ++ + + Positive 5CNJJ2 ++ ++ + − Positive 5CNJJ3 ++ ++ + ++ Positive 5ATS3 + + + − − nsAYNTKR103 ++ + ++ − − nsAYNTKR112 ++ + ++ − − nsAYNTKRmix ++ + ++ − − nsJVCZ1 + + + − − nsDANN3 ++ + + − − 5KOMA4 +++ ++ +++ +++ Positive 5KOMA5 +++ ++ +++ +++ Positive 5KOMA6 +++ ++ +++ +++ Positive 5ADMV1 ++ ++ ++ − − 1ADMV2 ++ ++ +++ − − 1ADMV3 + + + − Positive 1
Table 3. Detection of infectious pancreatic necrosis virus (IPNV) in fish organ samples by 5 diagnostic techniques. ns: not sequenced. PCR results are +++: cycle threshold (Ct) ≤ 20; ++: Ct ≤ 25; +: Ct ≤ 30; −: negative. Indirect fluorescent antibody test
(IFAT) intensity of reaction results are +++: high; ++: medium; +: low; −: negative

Tapia et al.: Diagnostic and genetic analysis of IPNV
and chemistries used SYBR® Green and TaqMan®
probe (Table 3). Only 2 samples (OEA04, OEA05)were reported negative by 1 of the 3 methods, viz.qRT-PCR 3, probably due to the low viral load ofthese samples, since the other 2 methods showedhigh Ct values. Some differences were found in theintensity of the reactions between the techniques,but in all of the cases, at least 2 of the 3 methodsshowed results within the same range of Ct values forthe same sample. The Fleiss Kappa analysis indi-cated a fair agreement between the 3 techniques(Kappa = 0.35). All samples from adult fish showedhigh Ct values (>25) for the 3 assays performed,whereas the majority of the samples from fry showedlow Ct values (<20), indicating a higher viral load insamples from younger fish.
IFAT and virus isolation from fish samples
Virus isolation and IFAT assays were carried outusing the fish tissue samples preserved in culturemedium. Virus isolation resulted in 29 positive sam-ples showing CPE after 1 or 2 wk of infection inCHSE-214 cells, while analysis by the IFAT assayrevealed 23 positive samples after 2 d of inoculationon cell culture (Table 3). Samples positive by IFATvaried in the intensity of the reaction, from highlypositive, with many fluorescent cells visualized afterthe 2 d of infection, to low intensity in the reaction,with only a few cells showing signs of infection. Asexpected, all samples that were positive by IFATalso caused CPE on cell culture; nevertheless, 6samples that showed CPE did not give a positivereaction when assayed by IFAT. When compared bythe Kappa statistic, the agreement between virusisolation and IFAT results was considered to be sub-stantial (Kappa = 0.7); however, when virus isola-tion or IFAT were compared to qRT-PCR, there wasonly a slight agreement (Kappa = 0.14 and 0.08, respectively).
VP2 gene sequencing
Results of the VP2 gene sequence comparisonrevealed 2 distinct genomic groups present in thesamples analysed, with 86.2% similarity between the2 groups at the amino acid level (data not shown).Phylogenetic analysis revealed that most of the sam-ples (24) were closely related to the reference strainSp (96.2−97.6% similarity) belonging to genogroup5. Only 5 samples were related to the reference strain
WB (96.8% similarity) and were thus classified ingenogroup 1 according to the genogroups proposedby Blake et al. (2001) (Table 3, Fig. 1). All samplesbelonging to genogroup 5 were almost identical to(97.1−99.5% similarity) and clustered together withpreviously classified Chilean isolates (Eissler et al.2011, Mutoloki & Evensen 2011, Calleja et al. 2012),forming a subgroup within the genogroup (Fig. 1).The 5 samples classified in genogroup 1 were clus-tered in genotype 4 along with the American refer-ence strains WB, DM, and Ja-ATTC; however, theyalso formed a subgroup, or subtype, with anotherChilean isolate previously classified within this geno-type (VCh32523, Calleja et al. 2012) (Fig. 1). Only thefirst strain of IPNV isolated in Chile (Espinoza et al.1985; here VUV/84), later classified within geno -group 1, genotype 3 (Eissler et al. 2011), remainedseparated from the rest of the Chilean isolates clus-tered in genotype 4.
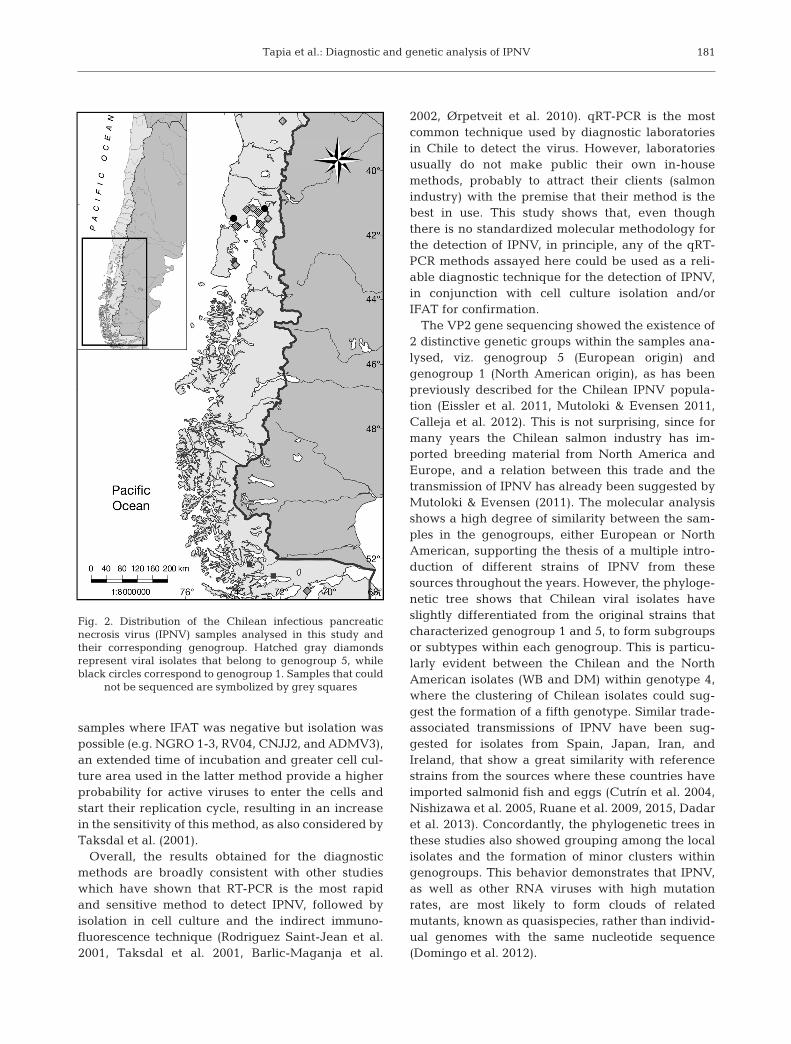
Regarding geographic distribution, environmentalorigin, and host species, genogroup 5 was the mostwidely distributed and was present in all regionsexamined, in both marine and freshwater farms, inAtlantic salmon as well as in rainbow trout (Fig. 2,Table 1). On the other hand, genogroup 1 wasobserved only in the Región de Los Lagos (Region X,around 41° S), in freshwater farms from the area ofCochamó and Chuyaquen, and only in rainbow trout.
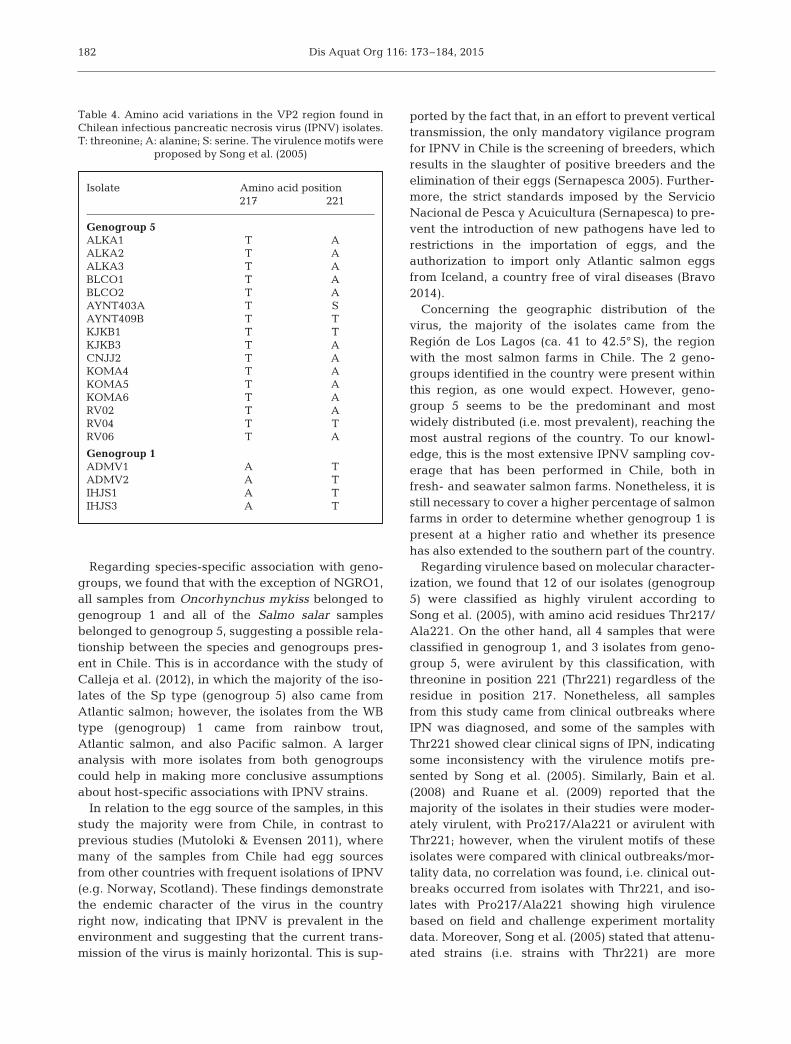
Table 4 shows the amino acid residues present atthe positions identified as major determinants of vir-ulence in the isolates and samples sequenced. Six-teen isolates from genogroup 5 presented threonineat position 217, while the 4 samples from genogroup1 presented alanine at this position. At the residue221, the majority of the isolates from genogroup 5had alanine, and all of the samples from genogroup 1presented threonine.
DISCUSSION
The high persistency and broad distribution of IPNin Chile requires that diagnostic laboratories use reli-able and accurate methods for the detection and con-trol of the virus. We compared different diagnosticmethods to detect IPNV in field samples from fish indifferent stages of growth and from both freshwaterand marine farms.
Results obtained from the 3 qRT-PCR methodsassayed were consistent. Thus these methods wereable to detect the virus in all the samples analysed,with no significant differences between the differenttechniques applied, whether SYBR-Green or Taq-
179

Dis Aquat Org 116: 173–184, 2015
man chemistry, nor between the differentsets of primers used. To increase the cover-age of the diagnostics for American andEuropean genogroups already present inChile, the primers used in this study weredesigned to detect aquatic birnaviruses tar-geting segment A (qRT-PCR 2, Williams etal. 1999; and qRT-PCR 3) or B (qRT-PCR 1,Eissler et al. 2011), in order to incorporateany possible variant of these strains or theemergence of new ones.
As expected, cell culture isolation andIFAT assays showed less sensitivity thanqRT-PCR, being able to detect fewer posi-tive samples, but were confirmatory forsamples with high titers, and thereforedetected the majority of the samples withlow Ct values. This is probably due to thefact that qRT-PCR quantifies the viralnucleic acid present in the sample, withoutdifferentiating whether it comes from anactive or inactive virus particle. Virus iso -lation and IFAT, on the other hand, arerestricted to the detection of only biologi-cally active viral particles in the sample, i.e.infectious virus. These methods, based onthe capacity of the virus to replicate in cellculture, are known to work well in acutecases of the disease, but are less effective inthe detection of virus in subclinical orlatently infected fish (asymptomatic carri-ers), where the viral titers can reach theirlimits of detection (Rodriguez Saint-Jean etal. 2001, Taksdal et al. 2001, Barlic-Maganjaet al. 2002, Munro & Midtlyng 2011). Con-cordantly, all samples from adult fish (po -tentially asymptomatic carriers) were belowdetection levels for cell culture methods butwere positive by qRT-PCR, with high Ct values. This is consistent with previousreports which showed that PCR-positivesamples from persistently IPNV-infectedfish may remain undetected when exam-ined in cell culture (Taksdal et al. 2001,Ørpetveit et al. 2010). In the cases of the
180
91-137
Buhl
91-114
64-93
90-11
Reno
VUV/84
Ja-Dobos
VR299
IHJS1
IHJS3
ADMV2
ADMV1
VCh32523
WB
DM
Ja-ATCC
C2
C3
C1
ASV
Te
EEV
PV1
E1S
Ab
CV-HB1
AYNT403A
AYNT409B
KJKB1
KJKB3
CNJJ2
BLCO1
BLCO2
RV04
RV02
RV06
KOMA6
KOMA4
KOMA5
VCh3372
C-5
VCh3351
VCh3371
VCh3228
VCh499-5
VCh3315
ALKA3
C-10
ALKA1
ALKA2
C-1.9
C-2.6
C-2.10
C-3.1
C-1
C-1.3
C-3.3
C-3.4
Fr10
N1
Fr21
OV2
DPL
Sp
He
100
74
89
99
75
92
99
88
81
100
100
98
100
98
73
88
94
91
100
0.01
Genogroup 2
Genogroup 1
Genotype 1
Genotype 2
Genotype 3
Genotype 4
Genogroup 3
Genogroup 4
Genogroup 6
Genogroup 5
Fig. 1. Phylogenetic tree based on amino acid sequence compar-isons of the VP2 gene segment (1180 bp), showing relationshipsbetween infectious pancreatic necrosis virus (IPNV) samplesanalysed in this study (black circles) and reference strains de-tailed by Blake et al. (2001) and other Chilean isolates (Mutoloki& Evensen 2011, Calleja et al. 2012). Analyses were conductedusing the neighbor-joining method; confidence on tree construc-
tion was assessed using 1000 bootstrap replicates
Tapia et al.: Diagnostic and genetic analysis of IPNV
samples where IFAT was negative but isolation waspossible (e.g. NGRO 1-3, RV04, CNJJ2, and ADMV3),an extended time of incubation and greater cell cul-ture area used in the latter method provide a higherprobability for active viruses to enter the cells andstart their replication cycle, resulting in an increasein the sensitivity of this method, as also considered byTaksdal et al. (2001).
Overall, the results obtained for the diagnosticmethods are broadly consistent with other studieswhich have shown that RT-PCR is the most rapidand sensitive method to detect IPNV, followed byisolation in cell culture and the indirect immuno -fluorescence technique (Rodri guez Saint-Jean et al.2001, Taksdal et al. 2001, Barlic-Maganja et al.
2002, Ørpetveit et al. 2010). qRT-PCR is the mostcommon technique used by diagnostic laboratoriesin Chile to detect the virus. However, laboratoriesusually do not make public their own in-housemethods, probably to attract their clients (salmonindustry) with the premise that their method is thebest in use. This study shows that, even thoughthere is no standardized molecular methodology forthe detection of IPNV, in principle, any of the qRT-PCR methods assayed here could be used as a reli-able diagnostic technique for the detection of IPNV,in conjunction with cell culture isolation and/orIFAT for confirmation.
The VP2 gene sequencing showed the existence of2 distinctive genetic groups within the samples ana-lysed, viz. genogroup 5 (European origin) andgenogroup 1 (North American origin), as has beenpreviously described for the Chilean IPNV popula-tion (Eissler et al. 2011, Mutoloki & Even sen 2011,Calleja et al. 2012). This is not surprising, since formany years the Chilean salmon industry has im -ported breeding material from North America andEurope, and a relation between this trade and thetransmission of IPNV has already been suggested byMutoloki & Evensen (2011). The molecular analysisshows a high degree of similarity between the sam-ples in the genogroups, either European or NorthAmerican, supporting the thesis of a multiple intro-duction of different strains of IPNV from thesesources throughout the years. However, the phyloge-netic tree shows that Chilean viral isolates haveslightly differentiated from the original strains thatcharacterized genogroup 1 and 5, to form subgroupsor subtypes within each genogroup. This is particu-larly evident between the Chilean and the NorthAmerican isolates (WB and DM) within genotype 4,where the clustering of Chilean isolates could sug-gest the formation of a fifth genotype. Similar trade-associated transmissions of IPNV have been sug-gested for isolates from Spain, Japan, Iran, andIreland, that show a great similarity with referencestrains from the sources where these countries haveimported salmonid fish and eggs (Cutrín et al. 2004,Nishizawa et al. 2005, Ruane et al. 2009, 2015, Dadaret al. 2013). Concordantly, the phylogenetic trees inthese studies also showed grouping among the localisolates and the formation of minor clusters withingenogroups. This behavior demonstrates that IPNV,as well as other RNA viruses with high mutationrates, are most likely to form clouds of relatedmutants, known as quasispecies, rather than individ-ual gen omes with the same nucleotide sequence(Domingo et al. 2012).
181
Fig. 2. Distribution of the Chilean infectious pancreaticnecrosis virus (IPNV) samples analysed in this study andtheir corresponding genogroup. Hatched gray diamondsrepresent viral isolates that belong to genogroup 5, whileblack circles correspond to genogroup 1. Samples that could
not be sequenced are symbolized by grey squares
Dis Aquat Org 116: 173–184, 2015
Regarding species-specific association with geno -groups, we found that with the exception of NGRO1,all samples from Oncorhynchus mykiss belonged togenogroup 1 and all of the Salmo salar samplesbelonged to genogroup 5, suggesting a possible rela-tionship between the species and geno groups pres-ent in Chile. This is in accordance with the study ofCalleja et al. (2012), in which the majority of the iso-lates of the Sp type (genogroup 5) also came fromAtlantic salmon; however, the isolates from the WBtype (genogroup) 1 came from rainbow trout,Atlantic salmon, and also Pacific salmon. A largeranalysis with more isolates from both geno groupscould help in making more conclusive assumptionsabout host-specific associations with IPNV strains.
In relation to the egg source of the samples, in thisstudy the majority were from Chile, in contrast toprevious studies (Mutoloki & Evensen 2011), wheremany of the samples from Chile had egg sourcesfrom other countries with frequent isolations of IPNV(e.g. Norway, Scotland). These findings demonstratethe endemic character of the virus in the countryright now, indicating that IPNV is prevalent in theenvironment and suggesting that the current trans-mission of the virus is mainly horizontal. This is sup-
ported by the fact that, in an effort to prevent verticaltransmission, the only mandatory vigilance programfor IPNV in Chile is the screening of breeders, whichresults in the slaughter of positive breeders and theelimination of their eggs (Sernapesca 2005). Further-more, the strict standards imposed by the ServicioNacional de Pesca y Acuicultura (Sernapesca) to pre-vent the introduction of new pathogens have led torestrictions in the importation of eggs, and theauthorization to import only Atlantic salmon eggsfrom Iceland, a country free of viral diseases (Bravo2014).
Concerning the geographic distribution of thevirus, the majority of the isolates came from theRegión de Los Lagos (ca. 41 to 42.5° S), the regionwith the most salmon farms in Chile. The 2 geno -groups identified in the country were present withinthis region, as one would expect. However, geno -group 5 seems to be the predominant and mostwidely distributed (i.e. most prevalent), reaching themost austral regions of the country. To our knowl-edge, this is the most extensive IPNV sampling cov-erage that has been performed in Chile, both infresh- and seawater salmon farms. Nonetheless, it isstill necessary to cover a higher percentage of salmonfarms in order to determine whether genogroup 1 ispresent at a higher ratio and whether its presencehas also extended to the southern part of the country.
Regarding virulence based on molecular character-ization, we found that 12 of our isolates (genogroup5) were classified as highly virulent according toSong et al. (2005), with amino acid residues Thr217/Ala221. On the other hand, all 4 samples that wereclassified in genogroup 1, and 3 isolates from geno -group 5, were avirulent by this classification, withthreonine in position 221 (Thr221) regardless of theresidue in position 217. Nonetheless, all samplesfrom this study came from clinical outbreaks whereIPN was diagnosed, and some of the samples withThr221 showed clear clinical signs of IPN, indicatingsome inconsistency with the virulence motifs pre-sented by Song et al. (2005). Similarly, Bain et al.(2008) and Ruane et al. (2009) reported that themajority of the isolates in their studies were moder-ately virulent, with Pro217/Ala221 or avirulent withThr221; however, when the virulent motifs of theseisolates were compared with clinical outbreaks/mor-tality data, no correlation was found, i.e. clinical out-breaks occurred from isolates with Thr221, and iso-lates with Pro217/Ala221 showing high virulencebased on field and challenge experiment mortalitydata. Moreover, Song et al. (2005) stated that attenu-ated strains (i.e. strains with Thr221) are more
182
Isolate Amino acid position217 221
Genogroup 5ALKA1 T AALKA2 T AALKA3 T ABLCO1 T ABLCO2 T AAYNT403A T SAYNT409B T TKJKB1 T TKJKB3 T ACNJJ2 T AKOMA4 T AKOMA5 T AKOMA6 T ARV02 T ARV04 T TRV06 T A
Genogroup 1ADMV1 A TADMV2 A TIHJS1 A TIHJS3 A T
Table 4. Amino acid variations in the VP2 region found inChilean infectious pancreatic necrosis virus (IPNV) isolates.T: threonine; A: alanine; S: serine. The virulence motifs were
proposed by Song et al. (2005)

Tapia et al.: Diagnostic and genetic analysis of IPNV
adapted to CHSE-214 cells, thus replicate faster andproduce larger plaques, as opposed to what we foundin the samples with Thr221 from genogroup 1, whichcould not be isolated in the cell line and sequencinghad to be done directly from the virus present in thetissue sample. Since Song et al. (2005) only workedwith isolates from the Sp strain (genogroup 5), thesefindings suggest that IPNV virulence motifs coulddiffer between genogroups and that other geneticsand/or environmental factors may be crucial in deter-mining the outcome of an outbreak of the disease.Mortality data associated with sampling conditionswould help correlate virulence motifs to actual viru-lence patterns for the Chilean IPNV isolates. In addi-tion, experimental challenge studies using recombi-nant viruses from both genogroups are also neededto identify possible molecular markers of virulencefor strains other than Sp.
In conclusion, according to our findings, IPNVseems to be prevalent in Chile, and genogroup 5appears to be more abundant and widely distributedthan genogroup 1, showing the most virulent isolatesregarding the previously described amino acids viru-lence motifs. An apparent relationship between hostspecies and the genogroups was identified; however,to obtain a conclusive answer, more data should bemade available. In addition, there is no apparent spe-cific relationship between stage of growth, environ-mental origin, and the presence of any of these 2genogroups. Further research is needed to establishwhether the genetic variability of IPNV is related toany of these variables or whether other factors are inplay. A more extensive number of samples, charac-terization of outbreaks, and area coverage could helpclarify patterns of IPNV strain prevalence and viru-lence. It is important to point out that Chilean IPNviruses have mutated over time to form geneticallydifferentiated strains. Therefore, the qRT-PCR meth-ods analysed here are suitable to obtain fast and reli-able results to diagnose IPN, regardless of thegenogroup. To date this is the most extensive studycompleted on Chilean IPNV isolates with regard toarea coverage, number of isolates, molecular analy-sis, and related epidemiological variables.
Acknowledgements. We gratefully acknowledge the finan-cial support provided by the following grants: ServicioNacional de Pesca y Acuicultura (Sernapesca) R.E. No. 1090,‘Estudio evaluación y estan darización de métodos diagnósti-cos para la determinación del Virus de la Necrosis Pan-creática Infecciosa (IPNV)’ and Subsecretaría de Pesca yAcuicultura (Subpesca) R.EX No. 1548, código 2013-32-17,‘Identificación de cepas y nuevas variantes de IPNV y eval-uación del impacto de éstas en atención a su distribucióngeográfica y características de cuadros clínicos’.
LITERATURE CITED
Bain N, Gregory A, Raynard RS (2008) Genetic analysis ofinfectious pancreatic necrosis virus from Scotland. J FishDis 31: 37−47
Barlic-Maganja D, Strancar M, Hostnik P, Jencic V, Grom J(2002) Comparison of the efficiency and sensitivity ofvirus isolation and molecular methods for routine diag-nosis of infectious haematopoietic necrosis virus andinfectious pancreatic necrosis virus. J Fish Dis 25: 73−80
Blake SL, Schill WB, McAllister PE, Lee MK, Singer JT,Nicholson BL (1995) Detection and identification ofaquatic birnaviruses by PCR assay. J Clin Microbiol 33: 835−839
Blake S, Ma JY, Caporale DA, Jairath S, Nicholson BL (2001)Phylogenetic relationships of aquatic birnaviruses basedon deduced amino acid sequences of genome segment AcDNA. Dis Aquat Org 45: 89−102
Bluth A, Espinosa L, Guzmán C, Hidalgo C and others (2003)La acuicultura en Chile. Technopress, Santiago de Chile
Bowers RM, Dhar AK (2011) Effect of template on generat-ing a standard curve for absolute quantification of anRNA virus by real-time reverse transcriptase-polymerasechain reaction. Mol Cell Probes 25: 60−64
Bowers RM, Lapatra SE, Dhar AK (2008) Detection andquantitation of infectious pancreatic necrosis virus byreal-time reverse transcriptase-polymerase chain reac-tion using lethal and non-lethal tissue sampling. J VirolMethods 147: 226−234
Bravo S (2014) Riesgos sanitarios en la importación de ovas.Mundo Acuícola 97: 16−17
Bruslind LD, Reno PW (2000) Virulence comparison of threeBuhl-subtype isolates of infectious pancreatic necrosisvirus in brook trout fry. J Aquat Anim Health 12: 301−315
Calleja F, Godoy MG, Cárcamo JG, Bandín I and others(2012) Use of reverse transcription-real time polymerasechain reaction (real time RT-PCR) assays with universalprobe library (UPL) probes for the detection and geno-typing of infectious pancreatic necrosis virus strains iso-lated in Chile. J Virol Methods 183: 80−85
Cutrín JM, Barja JL, Nicholson BL, Bandín I, Blake S,Dopazo CP (2004) Restriction fragment length polymor-phisms and sequence analysis: an approach for genotyp-ing infectious pancreatic necrosis virus reference strainsand other aquabirnaviruses isolated from northwesternSpain. Appl Environ Microbiol 70: 1059−1067
Dadar M, Peyghan R, Memari HR, Shapouri MR, Hasan-zadeh R, Goudarzi LM, Vakharia VN (2013) Sequenceanalysis of infectious pancreatic necrosis virus isolatedfrom Iranian reared rainbow trout (Oncorhynchusmykiss) in 2012. Virus Genes 47: 574−578
Dobos P (1995) The molecular biology of infectious pancre-atic necrosis virus (IPNV). Annu Rev Fish Dis 5: 25−54
Dobos P, Roberts TE (1983) The molecular biology of infec-tious pancreatic necrosis virus: a review. Can J Microbiol29: 377−384
Domingo E, Sheldon J, Perales C (2012) Viral quasispeciesevolution. Microbiol Mol Biol Rev 76: 159−216
Eissler Y, Pavlov MS, Conejeros P, Espinoza JC, Kuznar J(2011) Detection and quantification of Chilean strains ofinfectious pancreatic necrosis virus by real-time RT-PCRassays using Segment B as a target. Lat Am J Aquat Res39: 544−552
Espinoza JC, Kuznar J (2002) Rapid simultaneous detectionand quantitation of infectious pancreatic necrosis virus
183

Dis Aquat Org 116: 173–184, 2015
(IPNV). J Virol Methods 105: 81−85Espinoza E, Farias G, Soler M, Juan K (1985) Identity
between infectious pancreatic necrosis virus VR-299 anda Chilean isolate. Intervirology 24: 58−60
Evensen Ø, Santi N (2008) Infectious pancreatic necrosisvirus. In: Mahy BWJ, van Regenmortel MHV (ed) Ency-clopedia of virology (3rd edn). Academic Press, Oxford,p 83−89
Hall TA (1999) Bioedit: a user-friendly biological sequencealignment editor and analysis program for Windows95/98/nt. Nucleic Acids Symp Ser 41: 95−98
Hill BJ, Way K (1995) Serological classification of infectiouspancreatic necrosis (IPN) virus and other aquatic bir-naviruses. Annu Rev Fish Dis 5: 55−77
Jarp J, Gjevre AG, Olsen AB, Bruheim T (1995) Risk-factorsfor furunculosis, infectious pancreatic necrosis and mortality in post-smolt of Atlantic salmon, Salmo salarL. J Fish Dis 18: 67−78
McAllister PE, Reyes X (1984) Infectious pancreatic necrosisvirus: isolation from rainbow trout, Salmo gairdneriRichardson, imported into Chile. J Fish Dis 7: 319−322
Munro ES, Midtlyng PJ (2011) Infectious pancreatic necrosisand associated aquatic birnaviruses. In: Woo PTK, BrunoDW (eds) Fish diseases and disorders, Vol 3: viral, bacte-rial and fungal infections, 2nd edn. CABI, Wallingford,p 1−65
Mutoloki S, Evensen O (2011) Sequence similarities of thecapsid gene of Chilean and European isolates of infec-tious pancreatic necrosis virus point towards a commonorigin. J Gen Virol 92: 1721−1726
Nishizawa T, Kinoshita S, Yoshimizu M (2005) An approachfor genogrouping of Japanese isolates of aquabir-naviruses in a new genogroup, VII, based on the VP2/NSjunction region. J Gen Virol 86: 1973−1978
OIE (World Organisation for Animal Health) (2006) Manualof diagnostic tests for aquatic animals. OIE, Paris
Ørpetveit I, Mikalsen AB, Sindre H, Evensen O, DannevigBH, Midtlyng PJ (2010) Detection of infectious pancre-atic necrosis virus in subclinically infected Atlanticsalmon by virus isolation in cell culture or real-timereverse transcription polymerase chain reaction: influ-ence of sample preservation and storage. J Vet DiagnInvest 22: 886−895
Rodriguez Saint-Jean S, Borrego JJ, Perez-Prieto SI (2001)Comparative evaluation of five serological methods andRT-PCR assay for the detection of IPNV in fish. J VirolMethods 97: 23−31
Ruane NM, McCarthy LJ, Swords D, Henshilwood K (2009)Molecular differentiation of infectious pancreatic necro-sis virus isolates from farmed and wild salmonids in Ire-land. J Fish Dis 32: 979−987
Ruane NM, McCleary SJ, McCarthy LJ, Henshilwood K(2015) Phylogenetic analysis of infectious pancreaticnecrosis virus in Ireland reveals the spread of a virulentgenogroup 5 subtype previously associated with imports.Arch Virol 160: 817−824
Santi N, Vakharia VN, Evensen Ø (2004) Identification ofputative motifs involved in the virulence of infectiouspancreatic necrosis virus. Virology 322: 31−40
Sernapesca (Servicio Nacional de Pesca y Acuicultura)(2005) Programa de vigilancia epidemiológica. Normatécnica sección 2. Programas sanitarios generales parapeces. Servicio Nacional de Pesca y Acuicultura, Val-paraíso
Sernapesca (2007) Informe sanitario de la acuicultura enchile año 2006. Servicio Nacional de Pesca y Acuicultura,Valparaíso
Sernapesca (2013) Informe sanitario de salmonicultura encentros marinos año 2012. Servicio Nacional de Pesca yAcuicultura, Valparaíso
Shivappa RB, Song H, Yao K, Aas-Eng A, Evensen Ø,Vakharia VN (2004) Molecular characterization of Spserotype strains of infectious pancreatic necrosis virusexhibiting differences in virulence. Dis Aquat Org 61: 23−32
Song H, Santi N, Evensen O, Vakharia VN (2005) Molecu-lar determinants of infectious pancreatic necrosis virusvirulence and cell culture adaptation. J Virol 79: 10289−10299
Taksdal T, Dannevig BH, Rimstad E (2001) Detection ofinfectious pancreatic necrosis (IPN)-virus in experimen-tally infected Atlantic salmon parr by RT-PCR and cellculture isolation. Bull Eur Assoc Fish Pathol 21: 214−219
Tamura K, Peterson D, Peterson N, Stecher G, Nei M, KumarS (2011) MEGA5: molecular evolutionary genetics analy-sis using maximum likelihood, evolutionary distance,and maximum parsimony methods. Mol Biol Evol 28: 2731−2739
Viera AJ, Garrett JM (2005) Understanding interobserveragreement: the kappa statistic. Fam Med 37: 360−363
Williams K, Blake S, Sweeney A, Singer JT, Nicholson BL(1999) Multiplex reverse transcriptase PCR assay forsimultaneous detection of three fish viruses. J ClinMicrobiol 37: 4139−4141
184
Editorial responsibility: Anindo Choudhury,De Pere, Wisconsin, USA
Submitted: January 6, 2015; Accepted: August 2, 2015Proofs received from author(s): October 14, 2015
➤
➤
➤
➤
➤
➤
➤
➤
➤
➤
➤
➤
➤
➤
➤
➤