Embed Size (px)
Citation preview

Lebanese Science Journal, Vol. 15, No. 2, 2014 119
DETECTION AND MAPPING OF LONG-TERM
LAND DEGRADATION AND DESERTIFICATION
IN ARAB REGION USING MODESERT
Ghaleb Faour
National Center for Remote Sensing, National Council for Scientific Research, Beirut, Lebanon
(Received 17 June 2014 - Accepted 12 August 2014)
ABSTRACT
This paper presents the definition and formulation of a remotely sensed based
monitoring system for land degradation and desertification. The main objective of this system
is to identify processes of land degradation and desertification sensitive areas at regional
scale. The proposed methodology relies on the use of time series NDVI images generated
from remote sensing satellites for the regional assessment and monitoring of vegetation
dynamics. Parametric model based on ordinary least-squares regression was developed and
implemented through the use of MODESERT, an open-source software developed by the
National Council for Scientific Research in Lebanon (CNRS). The study area covers the entire
Arab World. Long term trends were derived using the GIMMS NDVI data set over the time
period between 1982 and 2006. It is the longest series of NDVI product covering our regions.
Three main classes, subdivided into seven groups, were established representing: moderately
to highly sensitive areas, areas with no-significant change, moderately to highly developed
areas. Mean absolute percentage error (MAPE) was used to estimate the accuracy of the
trend model; it generated a mean error at 5-10%. Results indicated that more than 40% of the
total MENA region were sensitive to land degradation and desertification. In contrast, only
less than 5% of the region had witnessed positive changes in vegetation cover. The major
drivers of land degradation were mainly linked to climate variability and recurring drought
and to less extent their sub-drivers such as forest fires and the poor socioeconomic
development. Development in vegetation cover was found to occur at larger scales in
Southern Somalia, Sudan and Southern Iraq marshlands. This method could be applied to
national scale assessment. Using others satellites images (e.g. SPOT Vegetation, MOD13Q1,
etc…) has also potential. This monitoring system is operational since 2007 and was validated
through the publication of the biennial Arab Desertification Bulletin.
Keywords: land degradation, sensitivity assessment, trend analysis, NDVI, MENA, monito-
ring system, MODESERT
INTRODUCTION
The United Nations Convention to Combat Desertification (UNCCD) defines land
degradation as “the reduction or loss in the capability of the land to support biological or
economic productivity and complexity of rain-fed cropland, irrigated cropland, or range,
pasture, forest, and woodlands”. Desertification, on the other hand, depicts "land degradation
in arid, semiarid, and dry sub-humid areas resulting from various factors, including climatic

Lebanese Science Journal, Vol. 15, No. 2, 2014 120
variations and human activities” (UNCCD, 1994). Processes of land degradation and
desertification are considered among the most serious, widespread and complex
environmental problems of the 21st century.
The main driving forces for land degradation and desertification are associated with
climate variability and anthropogenic factors. Usually these processes occur simultaneously or
as a combination of processes, such as:
(i) Extended droughts, attributed to shifts in precipitation and increased temperature, influence
the distribution of vegetation and constitute the main driver for initiating or exacerbating
desertification;
(ii) Soil erosion caused by wind and/or water and the deterioration of the physical, chemical,
and biological soil properties;
(iii) Poor land use practices and human activities such as unsustainable agricultural practices,
overgrazing, and deforestation.
Despite the impact of land degradation and desertification on the environment and
the sustainability of life, estimates of land degradation are generally presented in separate
contexts. It remains difficult to present the extent and severity of land degradation in a single
framework for regional scale. Broad approximations are generally presented due to the lack of
unified local and regional monitoring networks. In fact, few countries have sound information
on the progress of land degradation and desertification. So far, most research on the status of
land degradation has involved local investigation for the exploration of specific driving
forces. Other research had focused on investigating vegetation dynamics as they are
considered the key components for the understanding of land surface models, especially when
assessing and monitoring land degradation and desertification (Symeonakis & Drake, 2004;
Tian et al., 2013). The combination of vegetation dynamic models and remote sensing time-
series images is being used in the assessment of land use, land cover, vegetation changes as
well as in the prediction of temporal variations in canopy cover, primary production, crop
yield, crop growth, and crop production. Among most important remote sensing products is
the normalized differentiated vegetation index (NDVI) data sets used for large-area mapping
and monitoring (Diouf & Lambin, 2001; Bestelmeyera et al., 2006; Hill et al., 2008; Giannini
et al., 2008; Luo et al., 2013; Tian et al., 2013). The main advantages of NDVI are associated
with its global coverage, high temporal resolution (daily to monthly), and their availability at
medium spatial resolution (1 to 10 km) suitable for regional mapping. Many researchers using
NDVI emphasize on quantifying spectral characteristics and include phonological analysis of
vegetation cover (Zhou et al., 2001; Julien & Sobrino, 2009), land-cover mapping and
classification (DeFries & Townshend, 1994; Friedl et al., 2002; Tucker et al., 2005) crop
yield forecasting (Benedetti & Rossini, 1993; Quarmby et al., 1993). The assessment of time
series NDVI data sets is mainly used for capturing seasonal, inter-seasonal and annual
variability (Rasmussen, 1997; Balaghi et al., 2008). Few researchers had focused on
formulating a methodology for quantifying land degradation and desertification risk areas,
which are approaches less proposed for the evaluation of trend of changes.
GIS and allied technologies, namely RS, contributions in the field of vegetation
exploitation and forecasting are not only due to their capabilities to support spatial dimension
but also to their ability to capture, store, organize, process, analyze, and create outputs. In this
context, MODESERT software was developed to fulfill the necessity to integrate a variety of
data sources (time series and geospatial data), parameters, and outputs. The main objective
behind MODESERT is to create an integrated monitoring, modeling, and assessment system.
Lebanese Science Journal, Vol. 15, No. 2, 2014 121
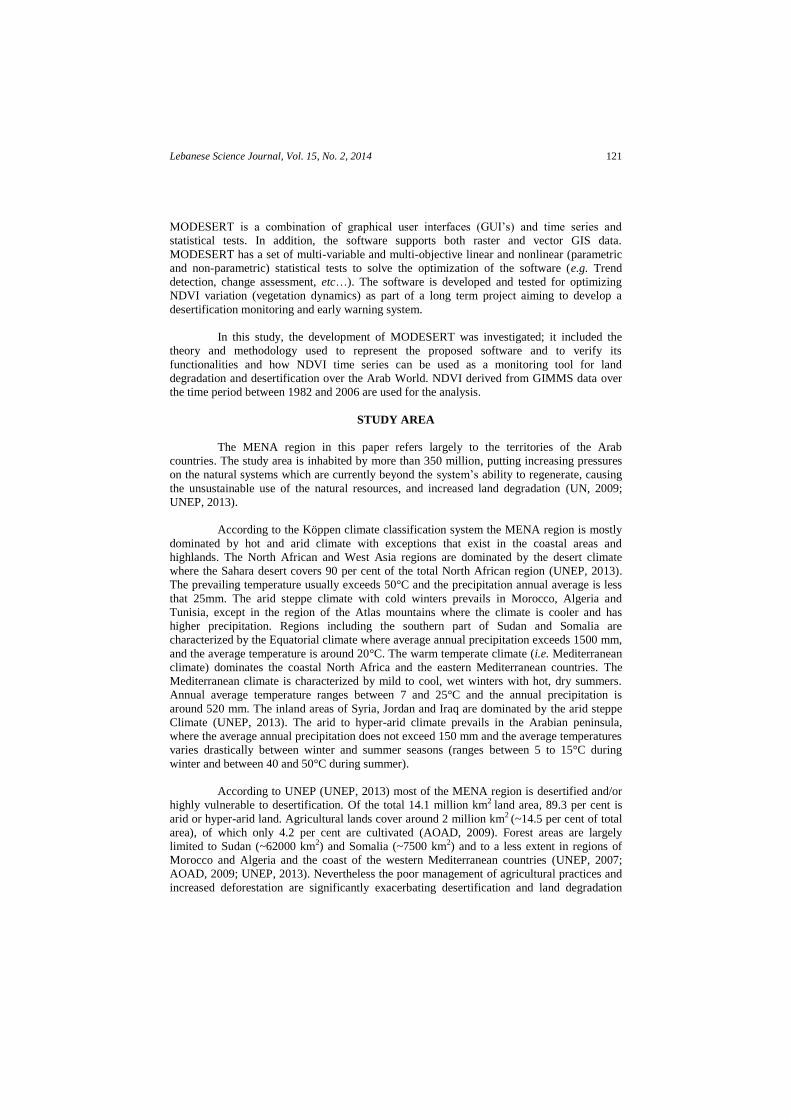
MODESERT is a combination of graphical user interfaces (GUI’s) and time series and
statistical tests. In addition, the software supports both raster and vector GIS data.
MODESERT has a set of multi-variable and multi-objective linear and nonlinear (parametric
and non-parametric) statistical tests to solve the optimization of the software (e.g. Trend
detection, change assessment, etc…). The software is developed and tested for optimizing
NDVI variation (vegetation dynamics) as part of a long term project aiming to develop a
desertification monitoring and early warning system.
In this study, the development of MODESERT was investigated; it included the
theory and methodology used to represent the proposed software and to verify its
functionalities and how NDVI time series can be used as a monitoring tool for land
degradation and desertification over the Arab World. NDVI derived from GIMMS data over
the time period between 1982 and 2006 are used for the analysis.
STUDY AREA
The MENA region in this paper refers largely to the territories of the Arab
countries. The study area is inhabited by more than 350 million, putting increasing pressures
on the natural systems which are currently beyond the system’s ability to regenerate, causing
the unsustainable use of the natural resources, and increased land degradation (UN, 2009;
UNEP, 2013).
According to the Köppen climate classification system the MENA region is mostly
dominated by hot and arid climate with exceptions that exist in the coastal areas and
highlands. The North African and West Asia regions are dominated by the desert climate
where the Sahara desert covers 90 per cent of the total North African region (UNEP, 2013).
The prevailing temperature usually exceeds 50°C and the precipitation annual average is less
that 25mm. The arid steppe climate with cold winters prevails in Morocco, Algeria and
Tunisia, except in the region of the Atlas mountains where the climate is cooler and has
higher precipitation. Regions including the southern part of Sudan and Somalia are
characterized by the Equatorial climate where average annual precipitation exceeds 1500 mm,
and the average temperature is around 20°C. The warm temperate climate (i.e. Mediterranean
climate) dominates the coastal North Africa and the eastern Mediterranean countries. The
Mediterranean climate is characterized by mild to cool, wet winters with hot, dry summers.
Annual average temperature ranges between 7 and 25°C and the annual precipitation is
around 520 mm. The inland areas of Syria, Jordan and Iraq are dominated by the arid steppe
Climate (UNEP, 2013). The arid to hyper-arid climate prevails in the Arabian peninsula,
where the average annual precipitation does not exceed 150 mm and the average temperatures
varies drastically between winter and summer seasons (ranges between 5 to 15°C during
winter and between 40 and 50°C during summer).
According to UNEP (UNEP, 2013) most of the MENA region is desertified and/or
highly vulnerable to desertification. Of the total 14.1 million km2 land area, 89.3 per cent is
arid or hyper-arid land. Agricultural lands cover around 2 million km2 (~14.5 per cent of total
area), of which only 4.2 per cent are cultivated (AOAD, 2009). Forest areas are largely
limited to Sudan (~62000 km2) and Somalia (~7500 km2) and to a less extent in regions of
Morocco and Algeria and the coast of the western Mediterranean countries (UNEP, 2007;
AOAD, 2009; UNEP, 2013). Nevertheless the poor management of agricultural practices and
increased deforestation are significantly exacerbating desertification and land degradation

Lebanese Science Journal, Vol. 15, No. 2, 2014 122
(UNEP, 2006). Based on the past 30 year trends, it is expected that the MENA region will
continue to suffer from severe degradation of lands resulting from anthropogenic drivers,
namely from deforestation, agricultural and industrial pollution, and the increase in urban and
infrastructural development at the expense of agricultural lands (UNEP, 2013). Existing
natural hazards contribute further to land degradation and desertification in the MENA region.
Currently drought is the most prevailing natural hazard in the MENA region. Extreme
temperatures, wildfires, flooding, landslides, sand and dust storms are also among the natural
events that negatively impact land and contribute to its degradation. Climate change further
impacts vegetation in the region. According to IPCC (IPCC, 2008) it is expected that
precipitation will decrease and temperature will increase, as well as the magnitude and
frequency of drought that will consequently increase over the MENA region over the coming
decades.
At present many countries in the MENA region are aware of the status of land
degradation and desertification. Different measures are being proposed to adapt and mitigate
their adverse impact. Despite this fact, little knowledge on the regional scale is available as
many countries are oriented towards addressing local and site specific problems. There is a
necessity for a regional monitoring system that highlights the land scarcity and establishes the
link between land degradation and land vulnerability to desertification and the main driving
forces.
METHODOLOGY
Data Background
NDVI trend maps were generated for the period extending from 1982 to 2006 as
derived from the National Oceanic and Atmospheric Administration–Advanced Very High
Resolution Radiometer NOAA/AVHRR NDVI satellite imageries. This long-term bimonthly
global NDVI data sets are available from the University of Maryland Global Land Cover
Facility (GLCF). The GIMMS NDVI product is comparable to other global data sets, despite
fundamental issues with the sensor (spectral, spatial, atmospheric correction, etc…) compared
to MODIS and SPOT. However, it remains the only long term data sets available for NDVI
calculation and assessment.
Model
Time series NDVI variable exhibit a trend when there is a significant change in
vegetation over time. Long term NDVI time series function is a combination of trend line
component, stochastic component, seasonal component and noise. The effects of annual
vegetation cycles (crop yields, cultivated lands, etc…) are reduced in this case due to the long
duration.
Therefore NDVI model is written as follows:
∑( )
With “ ” and “ ” representing the coefficients of the linear trend component, “t”
the corresponding time, “n” is the duration of time-lag and “ ” the lag coefficient.
“ ” is the NDVI for the time-lag i months, respectively.

Lebanese Science Journal, Vol. 15, No. 2, 2014 123
Parametric approach based on ordinary least-squares (OLS) regression was used to
estimate the trend of NDVI slope ( ). Jarque-Bera (JB) test (Jarque & Bera, 1987) was used
to verify the normality of data, with an assumption that the error terms are independent.
Significant slope was tested by a t-test to show if the trend exists.
To validate our model, mean absolute percentage error (MAPE) was applied. It was
calculated using over 100 specific points over different countries such as Lebanon, Syria,
Yemen and Iraq. The outcome generated a mean error between 5 and 10% (Fig. 1-A). Figure
1-B illustrates an approximately normal distribution of residuals produced by a model for a
calibration process.
Figure 1. Calculation of the mean absolute percentage error (MAPE) (A) and
residual error (B).
B
A

Lebanese Science Journal, Vol. 15, No. 2, 2014 124
The NDVI trend maps are categorized in several classes, which are subdivided into
other categories as follows:
1- Moderately to highly sensitive areas (vegetation decrease from -5% to less than
-25%). The expression “hot spot” is used to flag areas which are suffering from
various types of degradation processes; subcategories are moderate decrease
(vegetation decrease between -15% and -5%), severe decrease (between -25% and
-15%) and hot spot (less than -25%);
2- Areas with no-significant change (-5% < vegetation values < +5%);
3- Moderately to highly developed areas or bright spot (vegetation increase between
5% and 25%); Subclasses are moderate increase (vegetation increase between 5%
and 15%), advanced increase (between 15% and 25%) and bright spot (between
15% and 25%).
Software development
MODESERT (monitoring desertificiation) allows for the assessment of parametric
models for trend detection over the entire time series spatial images. It is basically conceived
as a tool for monitoring land degradation and desertification. This software is built using
ArcObjects and thus it has one advantage over other software such as Timestat that it supports
GIS analysis, including the support of GIS data (both raster and vector data) and data editing
in a GIS environment.
The main objective of this software is to deliver operationally feasible algorithms
and statistical tests to assess large NDVI data set in the framework of a monitoring system for
the assessment of land degradation and desertification on a regional scale (i.e. MENA region).
In particular, the software embraces: (i) A number of mathematical models for the adjustment
of time series data; (ii) Statistical properties and tests for the assessment of seasonality and
trends; (iii) Coupled methods for the analysis of time series data; (iv) Ability to evaluate the
performance NDVI data sets for the assessment of vegetation dynamics based on major land
type classes and/or geographic regions; and (v) Detection of land degradation and
desertification on regional scale. MODESERT capabilities: (i) allows easy statistical testing
using different tests; (ii) supports various raster image time series data input formats; (iii)
provides outputs in raster format of trends and tests; (iv) provides simple statement of the test
result; (v) displays statistical test and critical values for various statistical significance levels.
MODESERT (Figure 2) allows visual interpretation of time-series trend images and
time series data (i.e. signals for each pixel) and statistical characteristics of each time series.
Visual interpretation using images and graphs to explore, understand, and present data offer a
greate advantage in the field of remote sensing image processing and the assessment of trend
and statistical significance level.
RESULTS AND DISCUSSIONS
Analysis of the GIMMS NDVI (1982 - 2006) data allowed for the assessment of
long term changes in land degradation and desertification vulnerability. The results obtained
through the interpretation over the time period between 1982 and 2006 revealed a critical
increase in land degradation in northern African countries especially along the coastline
extending from Morocco to Egypt.

Lebanese Science Journal, Vol. 15, No. 2, 2014 125
IDispatchExtracted Trend Map
Clip Rasters Command
Copy and Save Signals
Create New Project
New-Open-Close-Delete Zooming Commands Rectangular
Selection
Tool
Clear
Selection
Signal
Selection
Selection
Tool
Identification
Tool
Statistics
Help
Exit
Figure 2. MODESERT main frame and toolbars.
As illustrated in Figures 3 and 4, land degradation accounted for 45% to 60%
decrease in Morocco, Algeria, Libya, and Egypt (land improvement accounted for around 5%
on average for most countries). The situation is most noticeable in the northwestern parts of
Morocco, the northern part of Algeria, and the northern part of Libya. Tunisia experienced
less degradation estimated at around 25% (with an estimated increase of around 6%).The
southern and northern parts of Tunisia showed an important increase in vegetation cover.
Same applies to the Western African region of Mauritania where the land degradation
impacted around 63% of the country’s total area. In Egypt, parts in the eastern part of the
country, at the Nile banks and delta showed land development. East African countries
experienced less land degradation among African countries where it was estimated that land
degradation and land development in Sudan were between -38% and 25% respectively, for
Djibouti the situation was not better (-42% decrease and 4% increase in vegetation covers), in
Somalia vegetation showed much more development (-13% land degradation and around 26%
increase in vegetation cover). In the Middle East, the situation was characterized by mutual

Lebanese Science Journal, Vol. 15, No. 2, 2014 126
changes in vegetation covers. It was clear that Lebanon is undergoing moderate land
degradation estimated at 32% versus 10% in land development. In Syria, the situation was
much more critical, especially in the northern part of the country where drought prevails. It
was estimated that around 57% of the country’s area were subject to degradation versus
around 5% land development. The same applies to Iraq, where land degradation accounted for
around 35% especially in the southern parts of the country and more precisely in the
Mesopotamian wetlands (Iraq’s marshlands). The northern part of the country experienced
land development of around 8%. In Jordan the situation is critical where it was estimated that
around 81% of the country’s total area is subject to land degradation. Stabilizing trends are
more common in the Arabian Peninsula. The region had witnessed several developments in
irrigation practices at the expense of the overuse of the groundwater resources for desert
agricultural projects. Land development accounted for around 5 to less than 10% in most
countries (Figures 3, 4). Despite this development part, land degradation remains the most
dominant factor in this particularly arid to hyper arid region of the MENA region. Land
degradation was estimated at around 35% in Saudi Arabia (KSA) and Yemen and to a less
extent in Kuwait, Qatar and Emirates (around 5%).
Figure 3. Hot spot, bright spot and no change vegetation areas derived from long time
GIMMS data (1982-2006).
-120
-100
-80
-60
-40
-20
0
20
40
60
80
Alg
eria
Lib
ya
Mau
rita
nia
Mo
rocc
o
Tun
isia
Djib
ou
ti
Egyp
t
Som
alia
Sud
an
Iraq
Jord
an
Leb
ano
n
Syri
a
Pal
esti
ne
Emir
ates
KSA
Ku
wai
t
Om
an
Qat
ar
Yem
en
No Change Hot Spot Bright Spot

Lebanese Science Journal, Vol. 15, No. 2, 2014 127
Figure 4. Monitoring vegetation changes in the Arab world using GIMMS NDVI images
during the period extending from 1982 to 2006.
Among the most vulnerable lands in the MENA region are the wetlands of
Mesopotamia (Iraq’s marshlands). It is believed that these wetlands have been decimated
between the 1970’s and throughout the 21 century through damming and the development of
canals and reservoirs for agricultural irrigation across the Tigris and Euphrates Rivers and for
a political pawn in the 1990’s. In the 1970s, the marshland covered up to 9000 square
kilometers (Figure 5, Plate A1 top). However, by the early 2000 the marshlands were reduced
to around few hundred square kilometers (Figure 5, Plate A1 bottom). The overexploitation of
natural water resources is among the key drivers of land degradation in the MENA region.
Starting early 2004 different efforts have been made to restore the Iraqi marshlands to its
former extent. Despite the fact that marshes were recovering over the last 10 years they now
face new threats, including new dam construction upstream and increased vulnerability to
drought as illustrated in the MODIS Image of February 2005 (Figure 5, Plate A2 top) and the
drought during 2009 (Figure 5, Plate A2 bottom). It is now believed that the marshes are
shrinking again at the expense of extensive irrigated agricultural areas.
Regions where natural water resources have been over-exploited at the expense of
agriculture development are mostly established in many parts of the MENA region. In the

Lebanese Science Journal, Vol. 15, No. 2, 2014 128
Sahara where rainfall is only a few centimeters a year, water available in aquifers is a non-
renewable resource (take thousands of years, or longer, to recharge). Despite this fact, many
countries such as Tunisia, Morocco, Algeria, Sudan, Libya, Jordan, and Saudi Arabia are
among the nations irrigating with fossil water.
1 2 3
A
B
C
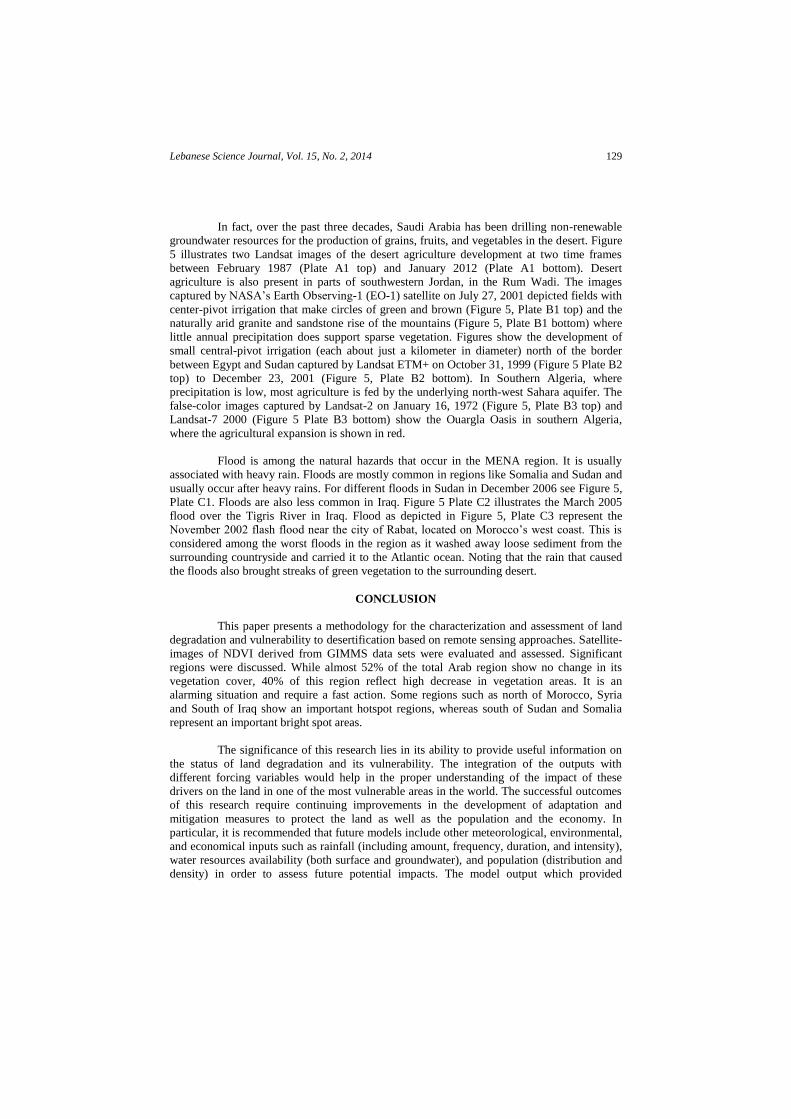
Figure 5. Main drivers of land degradation in the MENA region (courtesy of NASA
Earth Observatory).
Lebanese Science Journal, Vol. 15, No. 2, 2014 129
In fact, over the past three decades, Saudi Arabia has been drilling non-renewable
groundwater resources for the production of grains, fruits, and vegetables in the desert. Figure
5 illustrates two Landsat images of the desert agriculture development at two time frames
between February 1987 (Plate A1 top) and January 2012 (Plate A1 bottom). Desert
agriculture is also present in parts of southwestern Jordan, in the Rum Wadi. The images
captured by NASA’s Earth Observing-1 (EO-1) satellite on July 27, 2001 depicted fields with
center-pivot irrigation that make circles of green and brown (Figure 5, Plate B1 top) and the
naturally arid granite and sandstone rise of the mountains (Figure 5, Plate B1 bottom) where
little annual precipitation does support sparse vegetation. Figures show the development of
small central-pivot irrigation (each about just a kilometer in diameter) north of the border
between Egypt and Sudan captured by Landsat ETM+ on October 31, 1999 (Figure 5 Plate B2
top) to December 23, 2001 (Figure 5, Plate B2 bottom). In Southern Algeria, where
precipitation is low, most agriculture is fed by the underlying north-west Sahara aquifer. The
false-color images captured by Landsat-2 on January 16, 1972 (Figure 5, Plate B3 top) and
Landsat-7 2000 (Figure 5 Plate B3 bottom) show the Ouargla Oasis in southern Algeria,
where the agricultural expansion is shown in red.
Flood is among the natural hazards that occur in the MENA region. It is usually
associated with heavy rain. Floods are mostly common in regions like Somalia and Sudan and
usually occur after heavy rains. For different floods in Sudan in December 2006 see Figure 5,
Plate C1. Floods are also less common in Iraq. Figure 5 Plate C2 illustrates the March 2005
flood over the Tigris River in Iraq. Flood as depicted in Figure 5, Plate C3 represent the
November 2002 flash flood near the city of Rabat, located on Morocco’s west coast. This is
considered among the worst floods in the region as it washed away loose sediment from the
surrounding countryside and carried it to the Atlantic ocean. Noting that the rain that caused
the floods also brought streaks of green vegetation to the surrounding desert.
CONCLUSION
This paper presents a methodology for the characterization and assessment of land
degradation and vulnerability to desertification based on remote sensing approaches. Satellite-
images of NDVI derived from GIMMS data sets were evaluated and assessed. Significant
regions were discussed. While almost 52% of the total Arab region show no change in its
vegetation cover, 40% of this region reflect high decrease in vegetation areas. It is an
alarming situation and require a fast action. Some regions such as north of Morocco, Syria
and South of Iraq show an important hotspot regions, whereas south of Sudan and Somalia
represent an important bright spot areas.
The significance of this research lies in its ability to provide useful information on
the status of land degradation and its vulnerability. The integration of the outputs with
different forcing variables would help in the proper understanding of the impact of these
drivers on the land in one of the most vulnerable areas in the world. The successful outcomes
of this research require continuing improvements in the development of adaptation and
mitigation measures to protect the land as well as the population and the economy. In
particular, it is recommended that future models include other meteorological, environmental,
and economical inputs such as rainfall (including amount, frequency, duration, and intensity),
water resources availability (both surface and groundwater), and population (distribution and
density) in order to assess future potential impacts. The model output which provided

Lebanese Science Journal, Vol. 15, No. 2, 2014 130
valuable information on the regional scale should be used as valuable indicator for land
management and improved decision making.
REFERENCES
AOAD 2009. Arab agriculture statistics year book, Arab Organization for Agriculture
Development (AOAD), Khartoum.
Balaghi, R., Tychon, B., Eerens, H., Jlibene, M. 2008. Empirical regression models using
NDVI, rainfall and temperature data for the early prediction of wheat grain yields in
Morocco. International Journal of Applied Earth Observation and Geoinformation,
10(4): 438-452.
Benedetti, R., Rossinni, P. 1993. On the use of NDVI profiles as a tool for agricultural
statistics: case study of wheat yield estimate and forecast in Emilia Romagna.
Remote Sens. Environ., 45: 311– 326.
Bestelmeyera, B.T., Trujillob, D.A., Tugela, A.J., and Havstad, K.M. 2006. A multi-scale
classification of vegetation dynamics in arid lands: What is the right scale for
models, monitoring, and restoration? Journal of Arid Environments, 65: 296-318.
DeFries, R.S. and Townshend, J.R.G. 1994. NDVI-derived land cover classifications at a
global scale. Int. J. Remote Sensing, 15: 3567-3586.
Diouf, A. and Lambin, E.F. 2001. Monitoring land-cover changes in semi-arid regions:
remote sensing data and field observations in the Ferlo, Senegal. Journal of Arid
Environments, 48(2): 129-148.
Friedl, M.A., McIver, D.K., Hodges, J.C.F., Zhang, X.Y., Muchoney, D., Strahler, A.H.,
Woodcock, C.E., Gopal, S., Schneider, A., Cooper, A., Baccini, A., Gao, F. and
Schaaf, C. 2002. Global land cover mapping from MODIS: algorithms and early
results. Remote Sens. Environ., 83(1-2): 287–302.
Giannini, A., Biasutti, M., and Verstraete, M.M. 2008. A climate model-based review of
drought in the Sahel: Desertification, the re-greening and climate change. Global
and Planetary Change, 64(3): 119-128.
Hill, J., Stellmes, M., Udelhoven, Th., Röder, A., Sommer, S. 2008. Mediterranean
desertification and land degradation. Global and Planetary Change, 64(3): 146-157.
IPCC 2008. I.P Climate Change, IPCC technical paper. Accessed on 6 July 2013, url:
http://www.ipcc.ch/
Jarque, C.M. and Bera, A.K. 1987. A test for normality of observations and
regression residuals. International Statistical Review,163-172.
Julien Y. and Sobrino J.A. 2009. Global land surface phenology trends from GIMMS
database. Int. J. Remote Sensing, 30(13): 3495-3513.
Luo, X., Chen, X., Xu, L., Myneni, R. and Zhu, Z. 2013. Assessing performance of NDVI
and NDVI3g in monitoring leaf unfolding dates of the deciduous broadleaf forest in
Northern China. Remote Sens., 5: 845-861.
Quarmby, N.A., Milnes, M., Hindle, T.L., Silicos, N. 1993. The use of multitemporal NDVI
measurements from AVHRR data for crop yield estimation and prediction. Int. J.
Remote Sens., 14: 199–210.
Rasmussen, J. 1997. Risk management in a dynamic society: a modelling problem. Safety
Science, 27(2-3): 183-213.
Symeonakis, E. and Drake N. 2004. Monitoring desertification and land degradation over
sub Saharan Africa. Int. J. Remote Sensing, 25(3): 573-592.
Tian, F., Wang, Y., Fensholt, R., Wang, K., Zhang, L. and Huang, Y. 2013. Mapping and

Lebanese Science Journal, Vol. 15, No. 2, 2014 131
evaluation of NDVI trends from synthetic time series obtained by blending Landsat
and MODIS data around a coalfield on the Loess plateau. Remote Sens., 5: 4255-
4279.
Tucker, C.J., Pinzon, J.E., Brown, M.E., Slayback, D., Pak, E.W., Mahoney, R., Vermote,
E. and Saleous, N. 2005. An extended AVHRR 8-km NDVI data set compatible
with MODIS and SPOT vegetation NDVI data. Int. J. Remote Sensing, 26(20):
4485-4498.
UN 2009. Fertility prospects in the Arab Region. United Nations expert group meeting on
recent and future trends in fertility, 2-4 December 2009. Population Division,
United Nations Department of Social and Economic Affairs, New York.
UNCCD 1994. Article 2 of the text of the United Nations Convention to Combat
Desertification.
http:// www.unccd.int/Lists/SiteDocumentLibrary/conventionText/conv-eng.pdf
UNEP 2006. Africa environment outlook 2. United Nations Environment Programme,
Nairobi.
UNEP 2007. Global environment outlook 4. United Nations Environment Programme,
Nairobi.
UNEP 2013. Arab region: atlas of our changing environment. United Nations
Environment Programme (UNEP), ISBN 978-92-807-3158-3.
Zhou, L., Tucker, C.J., Kaufmann, R.K., Slayback, D., Shabanov, N.V. and Myneni, R.B.
2001. Variations in Northern vegetation activity inferred from satellite data of
vegetation index during 1981 to 1999. J. Geophys. Res., 106(20): 69-83.