Embed Size (px)
Citation preview
Biophysical Journal Volume 101 September 2011 1529–1538 1529
Detection and Imaging of Superoxide in Roots by an Electron SpinResonance Spin-Probe Method
Nasim Warwar,† Avishai Mor,‡ Robert Fluhr,‡ Ramasamy P. Pandian,§ Periannan Kuppusamy,§
and Aharon Blank†*†Schulich Faculty of Chemistry Technion, Israel Institute of Technology, Haifa, Israel; ‡Department of Plant Sciences, Weizmann Institute ofScience, Rehovot, Israel; and §Center for Biomedical EPR Spectroscopy and Imaging, Davis Heart and Lung Research Institute, Departmentof Internal Medicine, The Ohio State University, Columbus, Ohio
ABSTRACT The detection, quantification, and imaging of short-lived reactive oxygen species, such as superoxide, in live bio-logical specimens have always been challenging and controversial. Fluorescence-based methods are nonspecific, and electronspin resonance (ESR) spin-trapping methods require high probe concentrations and lack the capability for sufficient image reso-lution. In this work, a novel (to our knowledge), sensitive, small ESR imaging resonator was used together with a stable spinprobe that specifically reacts with superoxide with a high reaction rate constant. This ESR spin-probe-based methodologywas used to examine superoxide generated in a plant root as a result of an apical leaf injury. The results show that the spin proberapidly permeated the plant’s extracellular space. Upon injury of the plant tissue, superoxide was produced and the ESR signaldecreased rapidly in the injured parts as well as in the distal part of the root. This is attributed to superoxide production and thusprovides a means of quantifying the level of superoxide in the plant. The spin probe’s narrow single-line ESR spectrum, togetherwith the sensitive imaging resonator, facilitates the quantitative measurement of superoxide in small biological samples, such asthe plant’s root, as well as one-dimensional imaging along the length of the root. This type of methodology can be used to resolvemany questions involving the production of apoplastic superoxide in plant biology.
INTRODUCTION
Superoxide anion radical, O2��, is an important member of
the reactive oxygen species (ROS) class. Under normalconditions, it is generated in cells as a byproduct of mito-chondrial respiration. In plants, it may also be formed inthe chloroplasts during photosynthesis. In addition to beinga byproduct of metabolism, superoxide has a wide variety offunctions and effects in stress biology. For example, it isused by the immune system to kill invading microorgan-isms, and it plays an important role in signaling by acti-vating metabolic pathways and controlling growth (1–3).Superoxide radicals also appear in response to pathogenand wound stresses (4–7). The formation of ROS in a cellularcontext may be destructive in terms of membrane integrity,DNA damage, and protein homeostasis. Therefore, cellsemploy efficient scavenging systems to control the levelsof ROS during normal metabolism as well as in responseto different stresses (8).
In view of the importance of superoxide, investigatorshave made many efforts to develop reliable and usefulmethods for accurate detection and imaging of this speciesin its biological arena. Because of its low steady-state con-centration (~10�10 M (9)) and short lifetime, as well as thepresence of competing intra- and extracellular oxidants andenzymes, such as superoxide dismutases (SOD), it is chal-lenging to measure superoxide levels. Several publicationshave reviewed many of these methods (10–13), and it is
Submitted May 17, 2011, and accepted for publication July 22, 2011.
*Correspondence: [email protected]
Editor: Betty J. Gaffney.
� 2011 by the Biophysical Society
0006-3495/11/09/1529/10 $2.00
important to appreciate the scope of use and limitations ofeach approach, as briefly summarized below:
1. A common method to evaluate superoxide levels insidecells is to look at the ratio of active to inactive aconitase,because superoxide inactivates this enzyme by fast reac-tion (9). The method makes assumptions about the super-oxide-aconitase second-order reaction rate constant andthe constant activation rate. Because of these and otherdifficulties, the method can only provide a rough esti-mate of the total superoxide levels in the cell (10,11).The method does not involve any exogenous probe, butrequires cell harvesting and thus lacks any time-resolvedand imaging capabilities (10,11). Other methods that canperform imaging in a time-resolve manner make use ofexogenous probes and can be divided into several groupsaccording to the basic physical principle of detection.
2. Chemiluminescent detection relies on light being gener-ated by reactions of exogenous molecular probes andsuperoxide. For example, lucigenin (bis-N-methylacridi-nium) is used for luminescent detection of the superoxideradical by means of a xanthine oxidase/hypoxanthine(XO/HX) system or by activated phagocytes (10). How-ever, the lucigenin monocation radical has been shownto autoxidize and produce superoxide in the absence ofO2
�� (11). Luminol, another chemiluminescent reporter,must be univalently oxidized to the luminol radical, whichreacts with O2
�� emitting light. However, the luminolradical can spontaneously reduce O2 to O2
�� (11). Othercompounds that have been used for chemiluminescentdetection of O2
�� but display similar limitations include
doi: 10.1016/j.bpj.2011.07.029
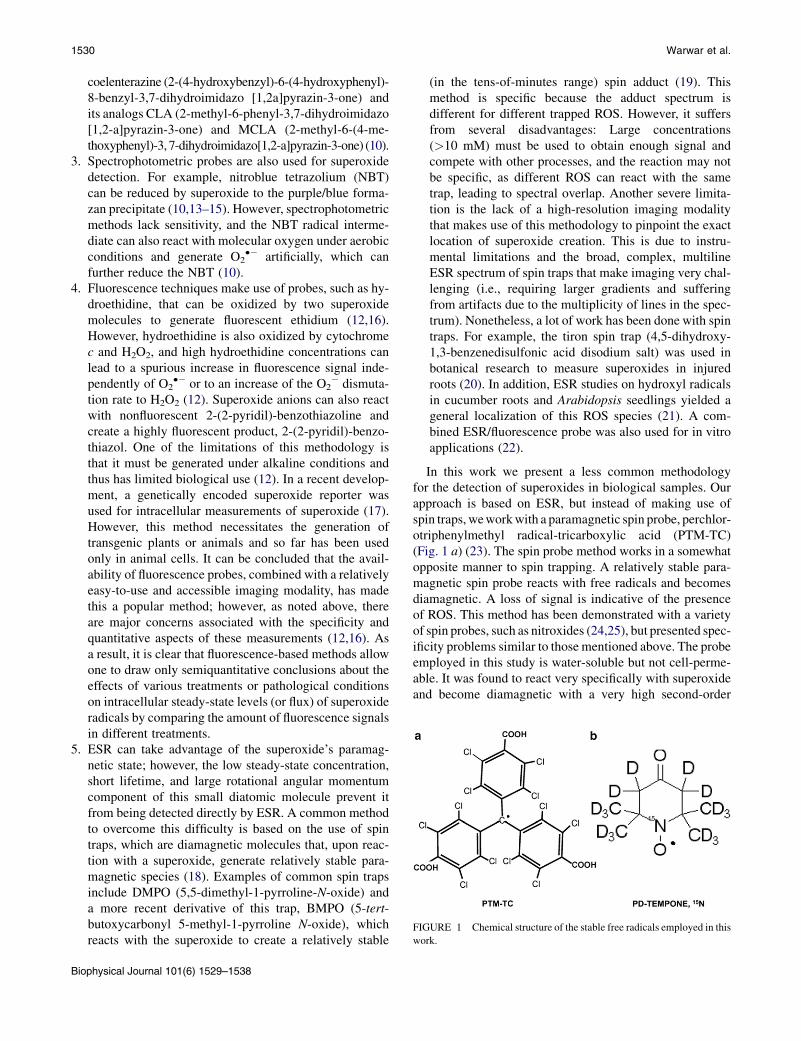
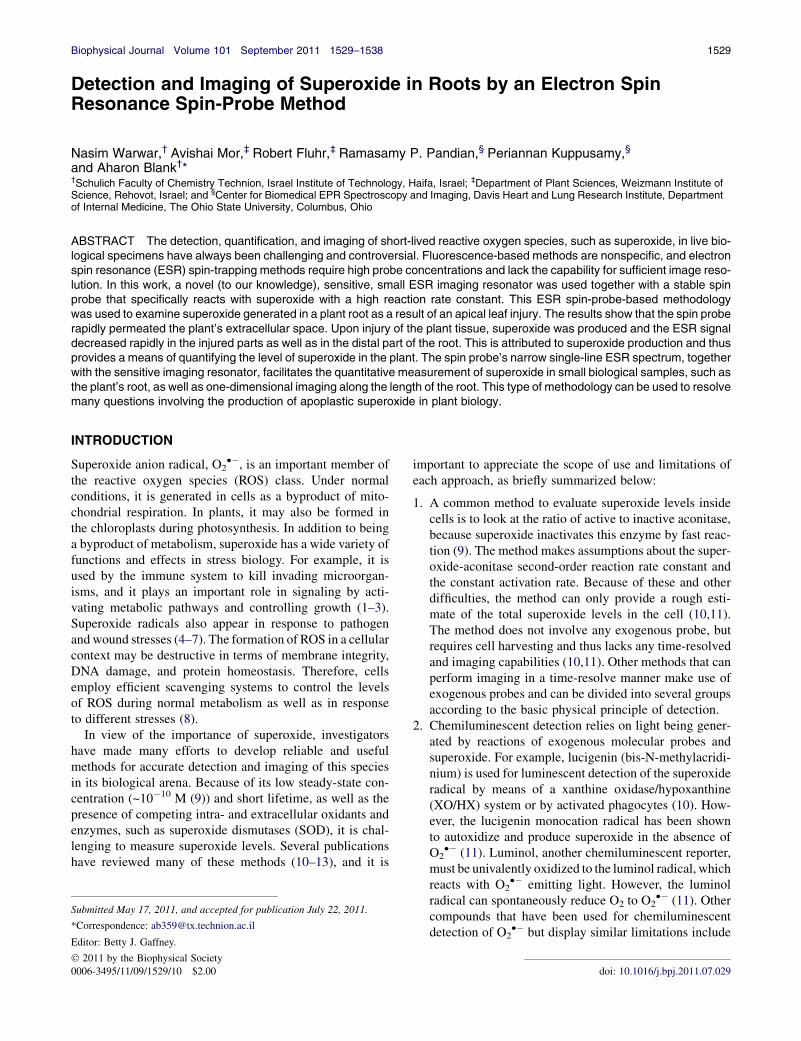
FIGURE 1 Chemical structure of the stable free radicals employed in this
work.
1530 Warwar et al.
coelenterazine (2-(4-hydroxybenzyl)-6-(4-hydroxyphenyl)-8-benzyl-3,7-dihydroimidazo [1,2a]pyrazin-3-one) andits analogs CLA (2-methyl-6-phenyl-3,7-dihydroimidazo[1,2-a]pyrazin-3-one) and MCLA (2-methyl-6-(4-me-thoxyphenyl)-3, 7-dihydroimidazo[1,2-a]pyrazin-3-one) (10).
3. Spectrophotometric probes are also used for superoxidedetection. For example, nitroblue tetrazolium (NBT)can be reduced by superoxide to the purple/blue forma-zan precipitate (10,13–15). However, spectrophotometricmethods lack sensitivity, and the NBT radical interme-diate can also react with molecular oxygen under aerobicconditions and generate O2
�� artificially, which canfurther reduce the NBT (10).
4. Fluorescence techniques make use of probes, such as hy-droethidine, that can be oxidized by two superoxidemolecules to generate fluorescent ethidium (12,16).However, hydroethidine is also oxidized by cytochromec and H2O2, and high hydroethidine concentrations canlead to a spurious increase in fluorescence signal inde-pendently of O2
�� or to an increase of the O2� dismuta-
tion rate to H2O2 (12). Superoxide anions can also reactwith nonfluorescent 2-(2-pyridil)-benzothiazoline andcreate a highly fluorescent product, 2-(2-pyridil)-benzo-thiazol. One of the limitations of this methodology isthat it must be generated under alkaline conditions andthus has limited biological use (12). In a recent develop-ment, a genetically encoded superoxide reporter wasused for intracellular measurements of superoxide (17).However, this method necessitates the generation oftransgenic plants or animals and so far has been usedonly in animal cells. It can be concluded that the avail-ability of fluorescence probes, combined with a relativelyeasy-to-use and accessible imaging modality, has madethis a popular method; however, as noted above, thereare major concerns associated with the specificity andquantitative aspects of these measurements (12,16). Asa result, it is clear that fluorescence-based methods allowone to draw only semiquantitative conclusions about theeffects of various treatments or pathological conditionson intracellular steady-state levels (or flux) of superoxideradicals by comparing the amount of fluorescence signalsin different treatments.
5. ESR can take advantage of the superoxide’s paramag-netic state; however, the low steady-state concentration,short lifetime, and large rotational angular momentumcomponent of this small diatomic molecule prevent itfrom being detected directly by ESR. A common methodto overcome this difficulty is based on the use of spintraps, which are diamagnetic molecules that, upon reac-tion with a superoxide, generate relatively stable para-magnetic species (18). Examples of common spin trapsinclude DMPO (5,5-dimethyl-1-pyrroline-N-oxide) anda more recent derivative of this trap, BMPO (5-tert-butoxycarbonyl 5-methyl-1-pyrroline N-oxide), whichreacts with the superoxide to create a relatively stable
Biophysical Journal 101(6) 1529–1538
(in the tens-of-minutes range) spin adduct (19). Thismethod is specific because the adduct spectrum isdifferent for different trapped ROS. However, it suffersfrom several disadvantages: Large concentrations(>10 mM) must be used to obtain enough signal andcompete with other processes, and the reaction may notbe specific, as different ROS can react with the sametrap, leading to spectral overlap. Another severe limita-tion is the lack of a high-resolution imaging modalitythat makes use of this methodology to pinpoint the exactlocation of superoxide creation. This is due to instru-mental limitations and the broad, complex, multilineESR spectrum of spin traps that make imaging very chal-lenging (i.e., requiring larger gradients and sufferingfrom artifacts due to the multiplicity of lines in the spec-trum). Nonetheless, a lot of work has been done with spintraps. For example, the tiron spin trap (4,5-dihydroxy-1,3-benzenedisulfonic acid disodium salt) was used inbotanical research to measure superoxides in injuredroots (20). In addition, ESR studies on hydroxyl radicalsin cucumber roots and Arabidopsis seedlings yielded ageneral localization of this ROS species (21). A com-bined ESR/fluorescence probe was also used for in vitroapplications (22).
In this work we present a less common methodologyfor the detection of superoxides in biological samples. Ourapproach is based on ESR, but instead of making use ofspin traps, weworkwith a paramagnetic spin probe, perchlor-otriphenylmethyl radical-tricarboxylic acid (PTM-TC)(Fig. 1 a) (23). The spin probe method works in a somewhatopposite manner to spin trapping. A relatively stable para-magnetic spin probe reacts with free radicals and becomesdiamagnetic. A loss of signal is indicative of the presenceof ROS. This method has been demonstrated with a varietyof spin probes, such as nitroxides (24,25), but presented spec-ificity problems similar to those mentioned above. The probeemployed in this study is water-soluble but not cell-perme-able. It was found to react very specifically with superoxideand become diamagnetic with a very high second-order
Superoxide in Roots by ESR 1531
reaction rate constant of 8.3 � 108 M�1s�1. On the otherhand, in vitro tests showed that other common free radicalspecies, such as OH, ROO$, H2O2, NO, GSH, and L-ascor-bate, have little effect on the PTM-TC spin probe signal(23). This specificity, along with the relatively sharp anddistinct single-line ESR spectrum of the spin probe, also rai-ses the possibility of one-dimensional (1D) high-resolutionimaging. We implemented this methodology in a test caseof superoxide generated in Arabidopsis thaliana plants afterinjury of the apical seedling area. Measurements were madeat the whole plant level and on a more distal root tip region.We developed a novel (to our knowledge) small imagingresonator, a specialized sample holder, and sample prepara-tion procedures to support the measurement of these chal-lenging biological samples.
ba
Coupling
Inner
shield
MATERIALS AND METHODS
Plant materials
Wild-type A. thaliana (ecotype Colombia) was used in this research. Seeds
of A. thaliana were surface-sterilized with 6% sodium hypochlorite and
0.02% triton X-100 for 1 min. They were then transferred to 75% ethanol
with 1.5% sodium hypochlorite and 0.02% triton X-100 for an additional
1-min wash. The seeds were then dried and sown in round Petri dishes
containing half-strength Murashige-Skoog medium (26) in 0.8% agar.
The plates were placed vertically in a growth chamber at 22�C under a
16-h photoperiod and ~50 mmol m� 2 s�1 of light intensity. The plants in
the experiments were 4–6 days old, with a typical length of ~20–30 mm
and root diameter of ~0.2–0.4 mm.
Coupling
screw
screw
Dielectric
resonator
PlantCoupling
iris
dresonator
zy
zCoupling
iris
c
Pl t
x y xy
DielectricPlant
e
ESR spin probes
The ESR spin probe, PTM-TC (Fig. 1 a) (23), was prepared in a 1-mM
water solution and sonicated for 5 min. The solubility of this spin probe
in open-air distilled water is slightly less than 1 mM; sonication expedites
the solution preparation process and ensures solution saturation. The stable
free radical PD-TEMPONE 15N was 4-Oxo-2,2,6,6-tetramethylpiperidine-
d16,1-15N-1-oxyl, TEMPONE-d16,1-
15N obtained from Aldrich (St. Louis,
MO) and prepared in a 1-mM water solution that served as a reference
signal in some of the ESR measurements.
resonatorResonatorholder
Rexolite
capPlant
holder
Modulation and
gradient connectors
Frequency
tuning
screw
FIGURE 2 The imaging resonator for small plants that was developed in
this work. (a) Isometric picture of the apparatus showing the coupling screw
Sample preparation
The A. thaliana plants were gently lifted from the agar with the use of fine
tweezers and rinsed twice in water. The whole plant was immersed in 100 ml
of the PTM-TC solution for an incubation period of 30 min in the dark.
Upon removal from the solution, the seedlings showed a very light red
tan stain (the PTM-TC solution is red). They were washed in water for
15 s to remove the excess probe and then used immediately.
and coupling iris, when the waveguide transmission line (which is con-nected to the Bruker bridge on the other side) is disconnected. (b) A trans-
parent view along the x axis, showing the position of the coupling screw
with respect to the DR. The DR can be moved slightly (~1 mm) up and
down to optimize coupling. The coupling screw is 1 mm in diameter, and
the iris is 2 mm wide and 6 mm long. The larger depression between the
waveguide and the iris has a width of 8 mm and height of 23 mm. (c) Cross
section of the imaging probe in the central yz plane. (d) A broader view of
the apparatus. (e) The distribution of the microwave magnetic field in the
resonator’s yz plane (calculated with finite element software; CST Micro-
wave Studio).
ESR system
All ESR experiments were carried out with a Bruker EMX continuous-
wave (CW) system (Bruker Biospin, GmbH Rheinstetten, Germany)
operating at an X-band frequency range (~9.3 GHz). Experiments in-
volving measurements of whole plants were conducted with the original
Bruker rectangular cavity (ER-4119HS). Experiments focusing on parts
of the roots and 1D imaging experiments were performed with an in-
house-built imaging dielectric resonator (DR; see below) that was
attached to the Bruker system’s microwave bridge, replacing the original
cavity.
Imaging resonator and sample holder
The measurements and 1D imaging of the distal root tip region in the plant
were carried out with an in-house-made imaging resonator, depicted in
Fig. 2. The DR, located at the center of the apparatus, is made of a high-
permittivity (ε ¼ 35) ceramic material (3500 series from Trans-Tech,
Adamstown, MD) machined to the following dimensions: 5.84 mm o.d.,
2.1 mm i.d., and 2.68 mm high. The resonance frequency was measured
as ~9.4 GHz with a quality factor (Q) of ~1500. The resonator is glued to
a Rexolite holder and placed in a cylindrical, solid brass shield (12 mm
i.d.). It focuses the microwave magnetic field on a relatively small volume
at its center (see Fig. 2 e), thereby increasing the filling factor (27) that
contributes to the sensitivity of the measurement of small, thin root samples
(as described above). This compact resonator’s geometry also makes it
possible to place the gradient coils relatively close to the imaged object,
thereby increasing their effectiveness for a given current drive. A pair of
modulation coils and a set of 1D gradient coils are added to the structure
(not shown in Fig. 2) to provide static field modulation (as required for
CW ESR) and gradient encoding along the z axis of the imaging resonator,
respectively. The gradient coils’ typical electrical parameters are as follows:
resistance of 1 U, inductance of 5 mH, and gradient efficiency of
0.36 T/m$A. The gradient coils are placed on a cylinder with a diameter
of 10 mm around the resonator. They are driven by a current-controlled
regulated power supply (E3640A from Agilent, Santa, Clara, CA) that
can deliver 3 A to the coils. The probe’s interfaces to the microwave bridge
(WR-90 waveguide) and the Bruker modulation source (BNC twinax
Biophysical Journal 101(6) 1529–1538
1532 Warwar et al.
connector) are identical to those of the original Bruker rectangular cavity
(see Fig. 2, c and d). Iris matching is controlled manually by means of
the coupling screw (Fig. 2 a).
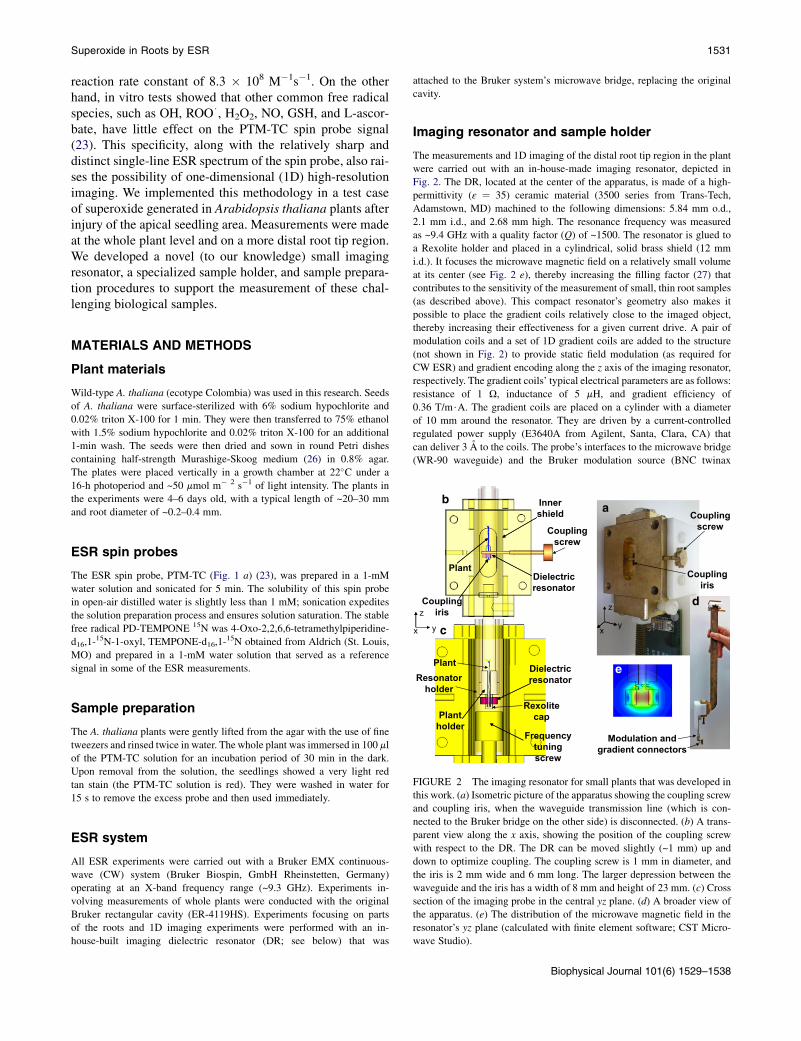
We compared the sensitivity of the new imaging resonator with that of
the Bruker cavity by measuring the ESR signal of a capillary tube
(0.5-mm i.d.) filled with a 1-mM PTM-TC water solution. The use of
a thin tube does not degrade much the quality factor,Q, of the Bruker cavity
(Q ¼ ~2000 with the tube) or the DR (Q ¼ ~1400 with the tube). Fig. 3 a
shows the ESR signal for the same tube in both resonators under the same
modulation conditions (modulation amplitude and frequency ¼ 0.7 G and
20 kHz, respectively). Microwave power was adjusted in the two measure-
ments to obtain a maximal signal just below saturation condition (~8 mW
for the Bruker cavity and ~0.7 mW for the DR). The signal in the DR is
broader due to magnetic impurities in the brass and aluminum material
from which it is made. Despite this broadening, it is evident that the signal
is stronger than the one obtained from the Bruker cavity. Furthermore, it
should be noted that for imaging applications in small, elongated biological
samples, we are interested in the signal per unit of length and not in the total
signal of the sample in the resonator. Thus, because the Bruker cavity is
23.5 mm long and the DR is ~4 mm long (note that the fields extend beyond
the z axis of the DR; Fig. 2 e), it can be calculated that the DR is ~13.2 times
more sensitive per unit of length. In addition to the whole-tube measure-
ments, we carried out 1D imaging experiments with the same test sample.
A typical result is shown in Fig. 3 b. In this case, the current in the gradient
coils is 0.6 A, and it generates a gradient of ~0.21 T/m. Hence, the available
resolution with gradient Gz can be calculated by the expression (28):
Dz ¼ 2DB1=2
Gz
(1)
where DB1=2 is the peak-to-peak linewidth of the ESR signal (~0.11 mT in
the imaging resonator), leading to Dz ¼ 1 mm. A deconvolution process
(see below) further enhances the resolution by a factor of up to 2, so that
1 DRBruker
0
0.5
bitra
ry s
cale
) Bruker
a
-1
-0.5
SR
Sig
nal (
arb
-5 -4 -3 -2 -1 0 1 2 3 4 5
Magnetic field [G] (from center field)
ES
6
3
4
5
(arb
. sca
le)
b
1
2
3
ES
R S
igna
l
-50
Distance along the resonator [mm]-4 -3 -2 -1 0 1 2 3
FIGURE 3 (a) ESR signal from a test sample of 1-mM PTM-TC water
solution in a thin capillary tube as measured in the new DR (solid line)
and Bruker (dashed line) cavity. (b) 1D ESR image of the sample placed
in the imaging DR. The results shown were obtained after deconvolution
of the original derivative ESR spectrum with the gradient by the spectrum
without such gradient. The signal is slightly asymmetric with respect to the
resonator’s center, probably due to the nonsymmetric position of the
coupling screw (Fig. 2), which is not exactly at the center of the resonator.
Biophysical Journal 101(6) 1529–1538
a 1D image resolution of ~0.5 mm can be obtained with this relatively
modest current. Higher currents can be supported but tend to create some
drifts in the resonator’s resonance frequency. This problem may be resolved
in future designs by more efficient heat removal.
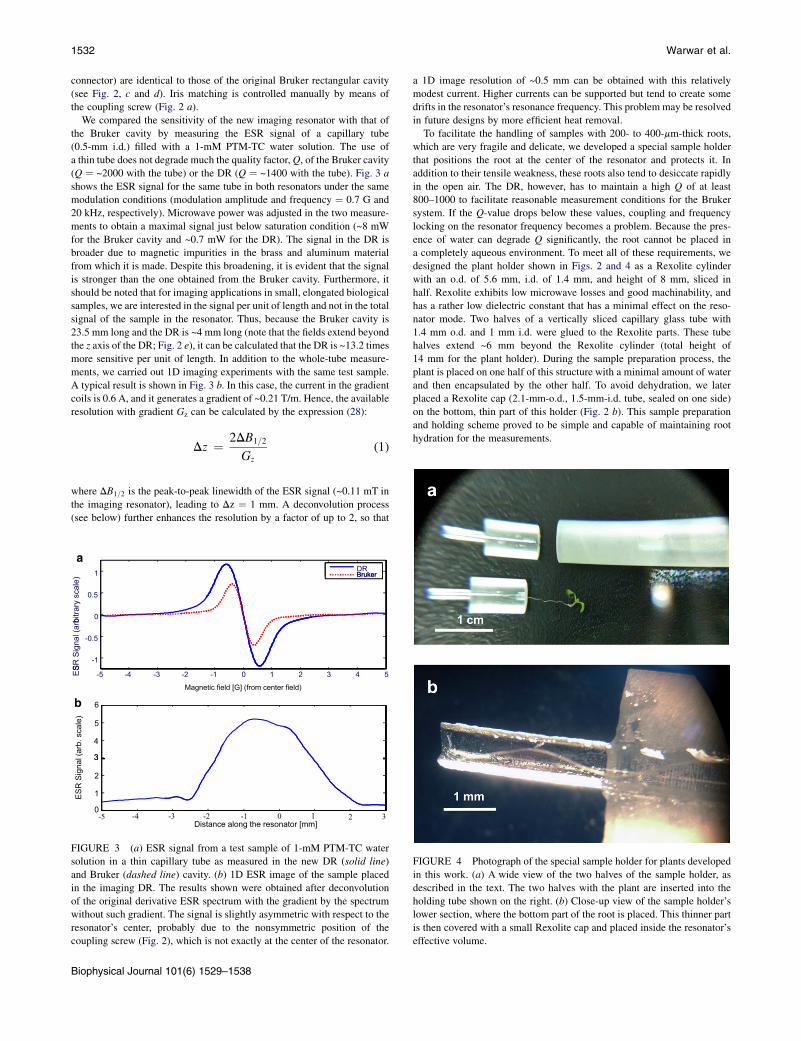
To facilitate the handling of samples with 200- to 400-mm-thick roots,
which are very fragile and delicate, we developed a special sample holder
that positions the root at the center of the resonator and protects it. In
addition to their tensile weakness, these roots also tend to desiccate rapidly
in the open air. The DR, however, has to maintain a high Q of at least
800–1000 to facilitate reasonable measurement conditions for the Bruker
system. If the Q-value drops below these values, coupling and frequency
locking on the resonator frequency becomes a problem. Because the pres-
ence of water can degrade Q significantly, the root cannot be placed in
a completely aqueous environment. To meet all of these requirements, we
designed the plant holder shown in Figs. 2 and 4 as a Rexolite cylinder
with an o.d. of 5.6 mm, i.d. of 1.4 mm, and height of 8 mm, sliced in
half. Rexolite exhibits low microwave losses and good machinability, and
has a rather low dielectric constant that has a minimal effect on the reso-
nator mode. Two halves of a vertically sliced capillary glass tube with
1.4 mm o.d. and 1 mm i.d. were glued to the Rexolite parts. These tube
halves extend ~6 mm beyond the Rexolite cylinder (total height of
14 mm for the plant holder). During the sample preparation process, the
plant is placed on one half of this structure with a minimal amount of water
and then encapsulated by the other half. To avoid dehydration, we later
placed a Rexolite cap (2.1-mm-o.d., 1.5-mm-i.d. tube, sealed on one side)
on the bottom, thin part of this holder (Fig. 2 b). This sample preparation
and holding scheme proved to be simple and capable of maintaining root
hydration for the measurements.
FIGURE 4 Photograph of the special sample holder for plants developed
in this work. (a) A wide view of the two halves of the sample holder, as
described in the text. The two halves with the plant are inserted into the
holding tube shown on the right. (b) Close-up view of the sample holder’s
lower section, where the bottom part of the root is placed. This thinner part
is then covered with a small Rexolite cap and placed inside the resonator’s
effective volume.
Superoxide in Roots by ESR 1533
Data analysis
The ESR signal amplitude in the whole-plant measurements (carried out
with the conventional Bruker rectangular cavity) was taken as the peak-
to-peak CW spectrum of the PTM-TC radical divided by the peak-to-
peak signal of a reference 1-mM sample of PD-TEMPONE 15N (Fig. 1).
We obtained the 1D spin probe concentration profiles by measuring the
CW ESR spectrum with and without a static gradient along the z axis of
the imaging resonator and then deconvoluting the former measurement
using the latter as a deconvolution kernel (28).
RESULTS
Whole-plant measurements
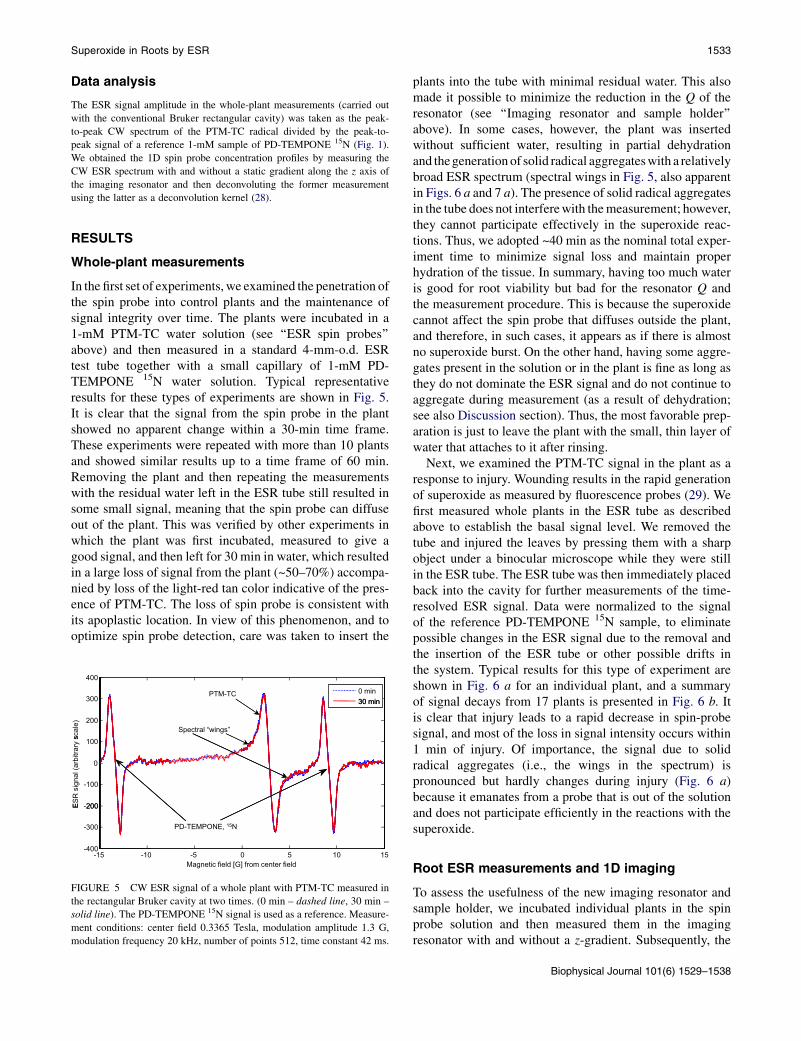
In the first set of experiments, we examined the penetration ofthe spin probe into control plants and the maintenance ofsignal integrity over time. The plants were incubated in a1-mM PTM-TC water solution (see ‘‘ESR spin probes’’above) and then measured in a standard 4-mm-o.d. ESRtest tube together with a small capillary of 1-mM PD-TEMPONE 15N water solution. Typical representativeresults for these types of experiments are shown in Fig. 5.It is clear that the signal from the spin probe in the plantshowed no apparent change within a 30-min time frame.These experiments were repeated with more than 10 plantsand showed similar results up to a time frame of 60 min.Removing the plant and then repeating the measurementswith the residual water left in the ESR tube still resulted insome small signal, meaning that the spin probe can diffuseout of the plant. This was verified by other experiments inwhich the plant was first incubated, measured to give agood signal, and then left for 30 min in water, which resultedin a large loss of signal from the plant (~50–70%) accompa-nied by loss of the light-red tan color indicative of the pres-ence of PTM-TC. The loss of spin probe is consistent withits apoplastic location. In view of this phenomenon, and tooptimize spin probe detection, care was taken to insert the
300
400
0 min30 min
PTM-TC
200
scal
e)
30 min
Spectral “wings”
0
100
(arb
itrar
ys
-200
-100
ES
R s
igna
l
-300
200E
PD-TEMPONE, 15N
-15 -10 -5 0 5 10 15-400
Magnetic field [G] from center field
FIGURE 5 CW ESR signal of a whole plant with PTM-TC measured in
the rectangular Bruker cavity at two times. (0 min – dashed line, 30 min –
solid line). The PD-TEMPONE 15N signal is used as a reference. Measure-
ment conditions: center field 0.3365 Tesla, modulation amplitude 1.3 G,
modulation frequency 20 kHz, number of points 512, time constant 42 ms.
plants into the tube with minimal residual water. This alsomade it possible to minimize the reduction in the Q of theresonator (see ‘‘Imaging resonator and sample holder’’above). In some cases, however, the plant was insertedwithout sufficient water, resulting in partial dehydrationand thegeneration of solid radical aggregateswith a relativelybroad ESR spectrum (spectral wings in Fig. 5, also apparentin Figs. 6 a and 7 a). The presence of solid radical aggregatesin the tube does not interferewith themeasurement; however,they cannot participate effectively in the superoxide reac-tions. Thus, we adopted ~40 min as the nominal total exper-iment time to minimize signal loss and maintain properhydration of the tissue. In summary, having too much wateris good for root viability but bad for the resonator Q andthe measurement procedure. This is because the superoxidecannot affect the spin probe that diffuses outside the plant,and therefore, in such cases, it appears as if there is almostno superoxide burst. On the other hand, having some aggre-gates present in the solution or in the plant is fine as long asthey do not dominate the ESR signal and do not continue toaggregate during measurement (as a result of dehydration;see also Discussion section). Thus, the most favorable prep-aration is just to leave the plant with the small, thin layer ofwater that attaches to it after rinsing.
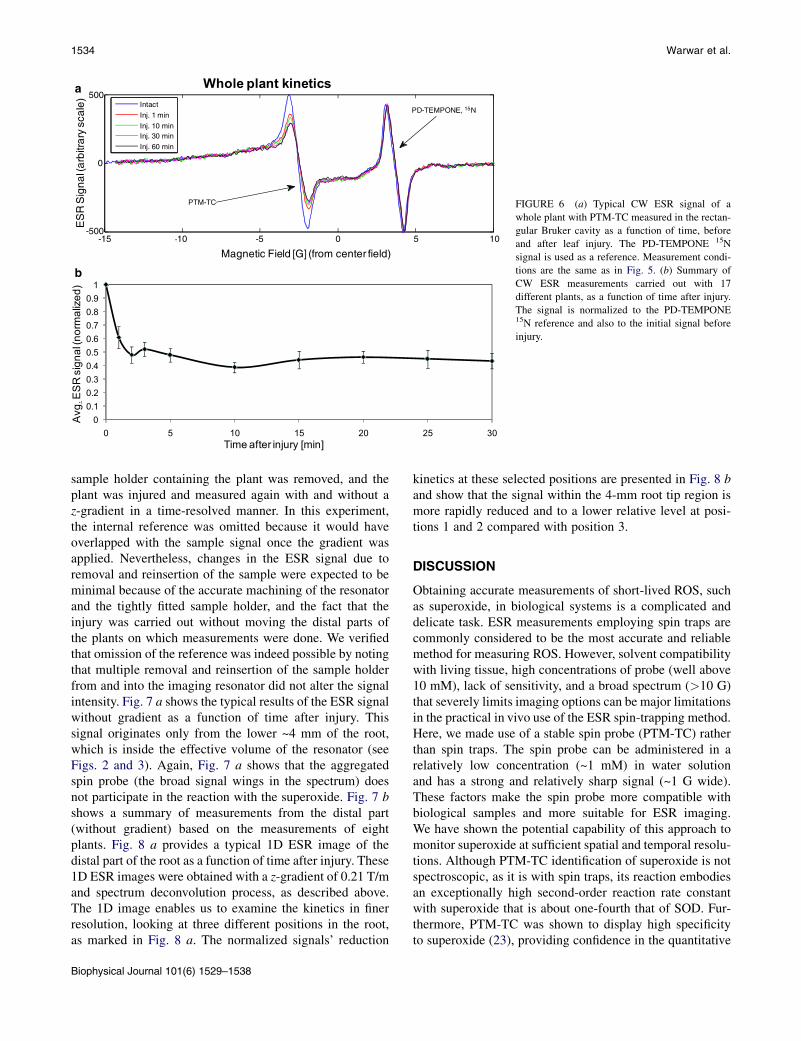
Next, we examined the PTM-TC signal in the plant as aresponse to injury. Wounding results in the rapid generationof superoxide as measured by fluorescence probes (29). Wefirst measured whole plants in the ESR tube as describedabove to establish the basal signal level. We removed thetube and injured the leaves by pressing them with a sharpobject under a binocular microscope while they were stillin the ESR tube. The ESR tube was then immediately placedback into the cavity for further measurements of the time-resolved ESR signal. Data were normalized to the signalof the reference PD-TEMPONE 15N sample, to eliminatepossible changes in the ESR signal due to the removal andthe insertion of the ESR tube or other possible drifts inthe system. Typical results for this type of experiment areshown in Fig. 6 a for an individual plant, and a summaryof signal decays from 17 plants is presented in Fig. 6 b. Itis clear that injury leads to a rapid decrease in spin-probesignal, and most of the loss in signal intensity occurs within1 min of injury. Of importance, the signal due to solidradical aggregates (i.e., the wings in the spectrum) ispronounced but hardly changes during injury (Fig. 6 a)because it emanates from a probe that is out of the solutionand does not participate efficiently in the reactions with thesuperoxide.
Root ESR measurements and 1D imaging
To assess the usefulness of the new imaging resonator andsample holder, we incubated individual plants in the spinprobe solution and then measured them in the imagingresonator with and without a z-gradient. Subsequently, the
Biophysical Journal 101(6) 1529–1538
-15 -10 -5 0 5 10-500
0
500
Magnetic Field [G] (from center field)
ES
R S
ign
al (
arbi
trar
y sc
ale
)
Intact
Inj. 1 min
Inj. 10 minInj. 30 min
Inj. 60 min
PTM-TC
PD-TEMPONE, 15N
00.10.20.30.40.50.60.70.80.9
1
0 5 10 15 20 25 30
Avg
.ES
R si
gnal
(nor
mal
ized
)
Time after injury [min]
Whole plant kineticsa
b
FIGURE 6 (a) Typical CW ESR signal of a
whole plant with PTM-TC measured in the rectan-
gular Bruker cavity as a function of time, before
and after leaf injury. The PD-TEMPONE 15N
signal is used as a reference. Measurement condi-
tions are the same as in Fig. 5. (b) Summary of
CW ESR measurements carried out with 17
different plants, as a function of time after injury.
The signal is normalized to the PD-TEMPONE15N reference and also to the initial signal before
injury.
1534 Warwar et al.
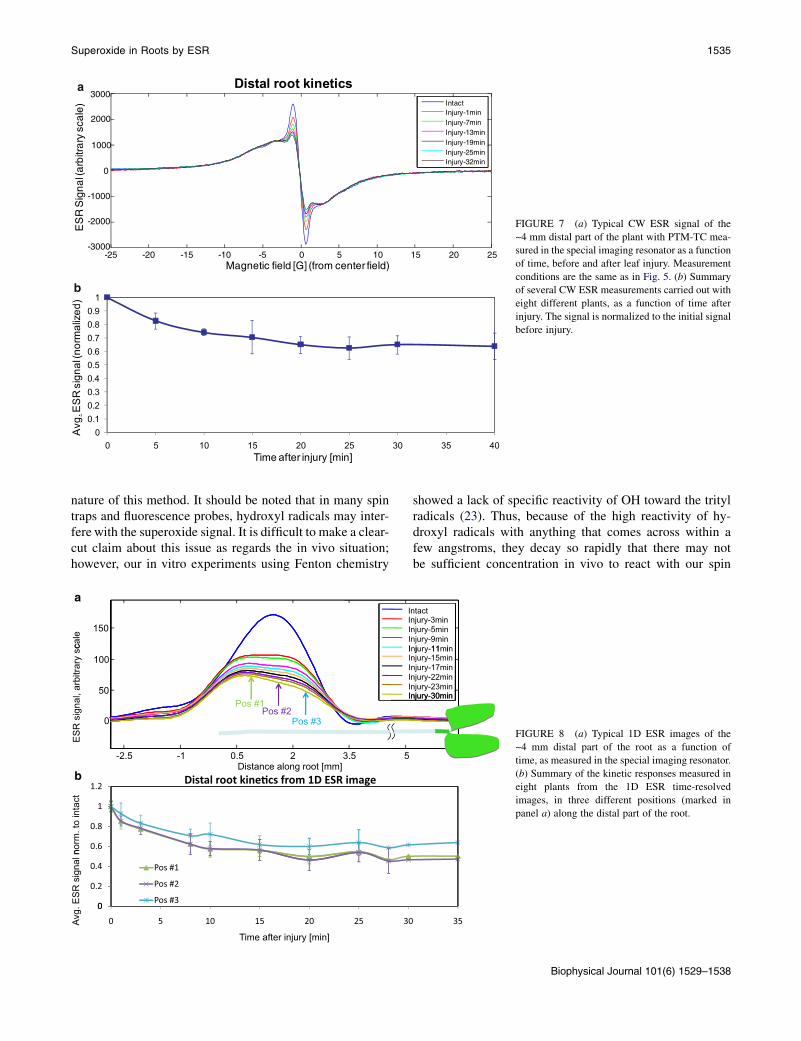
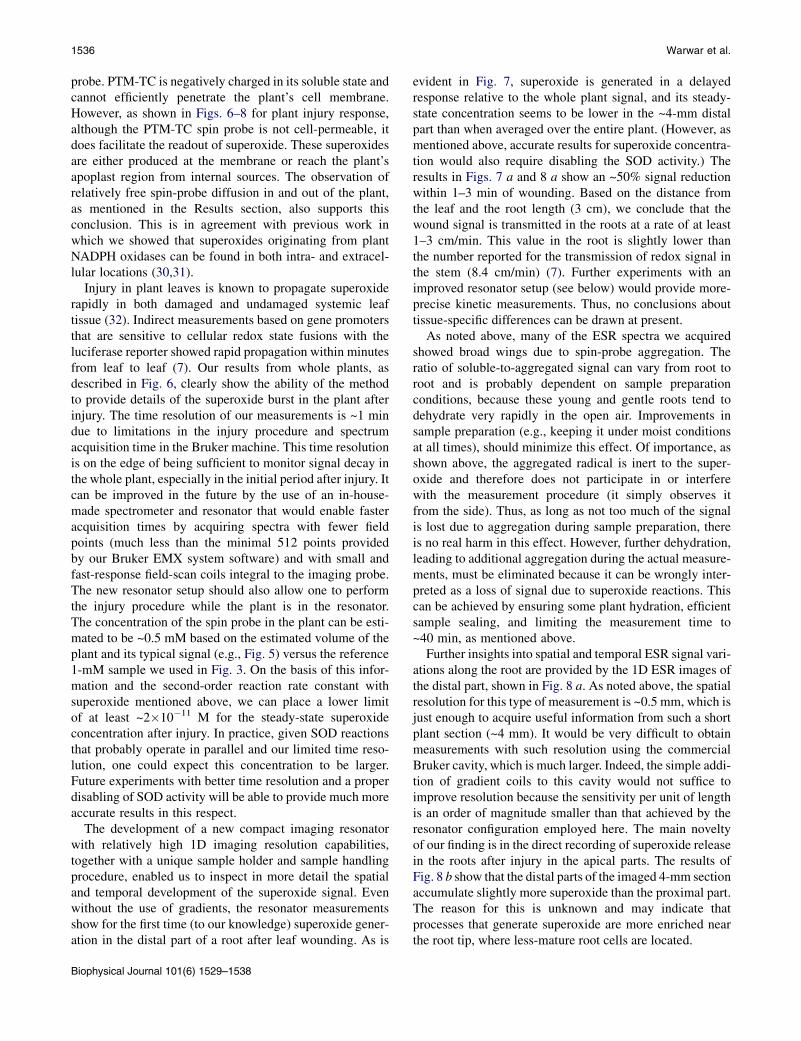
sample holder containing the plant was removed, and theplant was injured and measured again with and without az-gradient in a time-resolved manner. In this experiment,the internal reference was omitted because it would haveoverlapped with the sample signal once the gradient wasapplied. Nevertheless, changes in the ESR signal due toremoval and reinsertion of the sample were expected to beminimal because of the accurate machining of the resonatorand the tightly fitted sample holder, and the fact that theinjury was carried out without moving the distal parts ofthe plants on which measurements were done. We verifiedthat omission of the reference was indeed possible by notingthat multiple removal and reinsertion of the sample holderfrom and into the imaging resonator did not alter the signalintensity. Fig. 7 a shows the typical results of the ESR signalwithout gradient as a function of time after injury. Thissignal originates only from the lower ~4 mm of the root,which is inside the effective volume of the resonator (seeFigs. 2 and 3). Again, Fig. 7 a shows that the aggregatedspin probe (the broad signal wings in the spectrum) doesnot participate in the reaction with the superoxide. Fig. 7 bshows a summary of measurements from the distal part(without gradient) based on the measurements of eightplants. Fig. 8 a provides a typical 1D ESR image of thedistal part of the root as a function of time after injury. These1D ESR images were obtained with a z-gradient of 0.21 T/mand spectrum deconvolution process, as described above.The 1D image enables us to examine the kinetics in finerresolution, looking at three different positions in the root,as marked in Fig. 8 a. The normalized signals’ reduction
Biophysical Journal 101(6) 1529–1538
kinetics at these selected positions are presented in Fig. 8 band show that the signal within the 4-mm root tip region ismore rapidly reduced and to a lower relative level at posi-tions 1 and 2 compared with position 3.
DISCUSSION
Obtaining accurate measurements of short-lived ROS, suchas superoxide, in biological systems is a complicated anddelicate task. ESR measurements employing spin traps arecommonly considered to be the most accurate and reliablemethod for measuring ROS. However, solvent compatibilitywith living tissue, high concentrations of probe (well above10 mM), lack of sensitivity, and a broad spectrum (>10 G)that severely limits imaging options can be major limitationsin the practical in vivo use of the ESR spin-trapping method.Here, we made use of a stable spin probe (PTM-TC) ratherthan spin traps. The spin probe can be administered in arelatively low concentration (~1 mM) in water solutionand has a strong and relatively sharp signal (~1 G wide).These factors make the spin probe more compatible withbiological samples and more suitable for ESR imaging.We have shown the potential capability of this approach tomonitor superoxide at sufficient spatial and temporal resolu-tions. Although PTM-TC identification of superoxide is notspectroscopic, as it is with spin traps, its reaction embodiesan exceptionally high second-order reaction rate constantwith superoxide that is about one-fourth that of SOD. Fur-thermore, PTM-TC was shown to display high specificityto superoxide (23), providing confidence in the quantitative
-25 -20 -15 -10 -5 0 5 10 15 20 25-3000
-2000
-1000
0
1000
2000
3000
Magnetic field [G] (from center field)
ES
R S
igna
l (ar
bitr
ary
scal
e)
IntactInjury-1minInjury-7minInjury-13minInjury-19minInjury-25minInjury-32min
00.10.20.30.40.50.60.70.80.9
1
0 5 10 15 20 25 30 35 40
Avg
.ES
R si
gnal
(nor
mal
ized
)
Time after injury [min]
Distal root kineticsa
b
FIGURE 7 (a) Typical CW ESR signal of the
~4 mm distal part of the plant with PTM-TC mea-
sured in the special imaging resonator as a function
of time, before and after leaf injury. Measurement
conditions are the same as in Fig. 5. (b) Summary
of several CW ESR measurements carried out with
eight different plants, as a function of time after
injury. The signal is normalized to the initial signal
before injury.
Superoxide in Roots by ESR 1535
nature of this method. It should be noted that in many spintraps and fluorescence probes, hydroxyl radicals may inter-fere with the superoxide signal. It is difficult to make a clear-cut claim about this issue as regards the in vivo situation;however, our in vitro experiments using Fenton chemistry
150
cale
IIIII
a
50
100
l, ar
bitra
ry s
c IIIIII
0
ES
R s
igna
IPos #1
Pos #2Pos #3
1.2
ct
Distal root kine�cs from 1D ESR image
-2.5 -1 0.5 2 3.5 5Distance along root [mm]
b
0.6
0.8
1
norm
. to
inta
0
0.2
0.4
ES
R s
igna
l n
Pos #1
Pos #2
Pos #30
0 5 10 15 20 25 30Avg.
Time after injury [min]
showed a lack of specific reactivity of OH toward the tritylradicals (23). Thus, because of the high reactivity of hy-droxyl radicals with anything that comes across within afew angstroms, they decay so rapidly that there may notbe sufficient concentration in vivo to react with our spin
ntactnjury-3minnjury-5minnjury-9min
j 11 injury-11minnjury-15minnjury-17minnjury-22minnjury-23minnjury-30minnjury 30min
35
FIGURE 8 (a) Typical 1D ESR images of the
~4 mm distal part of the root as a function of
time, as measured in the special imaging resonator.
(b) Summary of the kinetic responses measured in
eight plants from the 1D ESR time-resolved
images, in three different positions (marked in
panel a) along the distal part of the root.
Biophysical Journal 101(6) 1529–1538
1536 Warwar et al.
probe. PTM-TC is negatively charged in its soluble state andcannot efficiently penetrate the plant’s cell membrane.However, as shown in Figs. 6–8 for plant injury response,although the PTM-TC spin probe is not cell-permeable, itdoes facilitate the readout of superoxide. These superoxidesare either produced at the membrane or reach the plant’sapoplast region from internal sources. The observation ofrelatively free spin-probe diffusion in and out of the plant,as mentioned in the Results section, also supports thisconclusion. This is in agreement with previous work inwhich we showed that superoxides originating from plantNADPH oxidases can be found in both intra- and extracel-lular locations (30,31).
Injury in plant leaves is known to propagate superoxiderapidly in both damaged and undamaged systemic leaftissue (32). Indirect measurements based on gene promotersthat are sensitive to cellular redox state fusions with theluciferase reporter showed rapid propagation within minutesfrom leaf to leaf (7). Our results from whole plants, asdescribed in Fig. 6, clearly show the ability of the methodto provide details of the superoxide burst in the plant afterinjury. The time resolution of our measurements is ~1 mindue to limitations in the injury procedure and spectrumacquisition time in the Bruker machine. This time resolutionis on the edge of being sufficient to monitor signal decay inthe whole plant, especially in the initial period after injury. Itcan be improved in the future by the use of an in-house-made spectrometer and resonator that would enable fasteracquisition times by acquiring spectra with fewer fieldpoints (much less than the minimal 512 points providedby our Bruker EMX system software) and with small andfast-response field-scan coils integral to the imaging probe.The new resonator setup should also allow one to performthe injury procedure while the plant is in the resonator.The concentration of the spin probe in the plant can be esti-mated to be ~0.5 mM based on the estimated volume of theplant and its typical signal (e.g., Fig. 5) versus the reference1-mM sample we used in Fig. 3. On the basis of this infor-mation and the second-order reaction rate constant withsuperoxide mentioned above, we can place a lower limitof at least ~2�10�11 M for the steady-state superoxideconcentration after injury. In practice, given SOD reactionsthat probably operate in parallel and our limited time reso-lution, one could expect this concentration to be larger.Future experiments with better time resolution and a properdisabling of SOD activity will be able to provide much moreaccurate results in this respect.
The development of a new compact imaging resonatorwith relatively high 1D imaging resolution capabilities,together with a unique sample holder and sample handlingprocedure, enabled us to inspect in more detail the spatialand temporal development of the superoxide signal. Evenwithout the use of gradients, the resonator measurementsshow for the first time (to our knowledge) superoxide gener-ation in the distal part of a root after leaf wounding. As is
Biophysical Journal 101(6) 1529–1538
evident in Fig. 7, superoxide is generated in a delayedresponse relative to the whole plant signal, and its steady-state concentration seems to be lower in the ~4-mm distalpart than when averaged over the entire plant. (However, asmentioned above, accurate results for superoxide concentra-tion would also require disabling the SOD activity.) Theresults in Figs. 7 a and 8 a show an ~50% signal reductionwithin 1–3 min of wounding. Based on the distance fromthe leaf and the root length (3 cm), we conclude that thewound signal is transmitted in the roots at a rate of at least1–3 cm/min. This value in the root is slightly lower thanthe number reported for the transmission of redox signal inthe stem (8.4 cm/min) (7). Further experiments with animproved resonator setup (see below) would provide more-precise kinetic measurements. Thus, no conclusions abouttissue-specific differences can be drawn at present.
As noted above, many of the ESR spectra we acquiredshowed broad wings due to spin-probe aggregation. Theratio of soluble-to-aggregated signal can vary from root toroot and is probably dependent on sample preparationconditions, because these young and gentle roots tend todehydrate very rapidly in the open air. Improvements insample preparation (e.g., keeping it under moist conditionsat all times), should minimize this effect. Of importance, asshown above, the aggregated radical is inert to the super-oxide and therefore does not participate in or interferewith the measurement procedure (it simply observes itfrom the side). Thus, as long as not too much of the signalis lost due to aggregation during sample preparation, thereis no real harm in this effect. However, further dehydration,leading to additional aggregation during the actual measure-ments, must be eliminated because it can be wrongly inter-preted as a loss of signal due to superoxide reactions. Thiscan be achieved by ensuring some plant hydration, efficientsample sealing, and limiting the measurement time to~40 min, as mentioned above.
Further insights into spatial and temporal ESR signal vari-ations along the root are provided by the 1D ESR images ofthe distal part, shown in Fig. 8 a. As noted above, the spatialresolution for this type of measurement is ~0.5 mm, which isjust enough to acquire useful information from such a shortplant section (~4 mm). It would be very difficult to obtainmeasurements with such resolution using the commercialBruker cavity, which is much larger. Indeed, the simple addi-tion of gradient coils to this cavity would not suffice toimprove resolution because the sensitivity per unit of lengthis an order of magnitude smaller than that achieved by theresonator configuration employed here. The main noveltyof our finding is in the direct recording of superoxide releasein the roots after injury in the apical parts. The results ofFig. 8 b show that the distal parts of the imaged 4-mm sectionaccumulate slightly more superoxide than the proximal part.The reason for this is unknown and may indicate thatprocesses that generate superoxide are more enriched nearthe root tip, where less-mature root cells are located.
Superoxide in Roots by ESR 1537
The 1D ESR image profiles shown in Fig. 8 a are gener-ated by a mathematical process of deconvolution using thespectrum with and without the gradient, and thereforeshould be viewed with caution. Although the mathematicalprocess in itself is reliable and well-established (28), duringprotracted measurements (>30 min), the ESR spectrum(without gradient) changes not only in magnitude but alsoin shape. In this work, we could not sample the ESR spec-trum with and without gradient at the same time. This meansthat deconvolution is carried out with a gradient-free spec-trum that may differ from the one relevant to the time inwhich the ESR spectrum was measured with the gradient.This could distort the deconvoluted 1D image and introduceartifacts. Another problem is that the deconvolution processassumes that the spectrum is similar throughout the sampleand only the spin-probe concentration changes. This is notnecessarily the case in our samples, because the aggregatedparts may be located at some specific point in the root, i.e.,the partition between the free and the aggregated spin probemay differ throughout the root. The ultimate solution tothese problems is to employ a faster imaging algorithmfor spectral-spatial imaging, which provides a spatiallyresolved ESR spectrum (33,34).
We are currently constructing a more advanced resonatorthat should be able to look at an entire root by combiningseveral DRs stacked one on top of the other (35,36). Thefuture incorporation of fast spectral-spatial imaging capabil-ities will also help investigators extract artifact-free spectral-spatial information that can be analyzed in a quantitativemanner and may shed light on superoxide signaling inplants. Another challenge will be to develop new spinprobes with membrane permeability and cellular retentioncapability. The progress shown here makes the developmentof such probes worthwhile and inviting.
This work was partially supported by grant 213/09 from the Israeli Science
Foundation, grant 2005258 from the Binational Science Foundation, and
grant 201665 from the European Research Council.
REFERENCES
1. Buetler, T. M., A. Krauskopf, and U. T. Ruegg. 2004. Role of super-oxide as a signaling molecule. News Physiol. Sci. 19:120–123.
2. Dunand, C., M. Crevecoeur, and C. Penel. 2007. Distribution of super-oxide and hydrogen peroxide in Arabidopsis root and their influence onroot development: possible interaction with peroxidases. New Phytol.174:332–341.
3. Tsukagoshi, H., W. Busch, and P. N. Benfey. 2010. Transcriptionalregulation of ROS controls transition from proliferation to differentia-tion in the root. Cell. 143:606–616.
4. Simon-Plas, F., T. Elmayan, and J.-P. Blein. 2002. The plasmamembrane oxidase NtrbohD is responsible for AOS production inelicited tobacco cells. Plant J. 31:137–147.
5. Bolwell, G. P., V. S. Butt, ., A. Zimmerlin. 1995. The origin of theoxidative burst in plants. Free Radic. Res. 23:517–532.
6. Bolwell, G. P., D. R. Davies, ., T. M. Murphy. 1998. Comparativebiochemistry of the oxidative burst produced by rose and french beancells reveals two distinct mechanisms. Plant Physiol. 116:1379–1385.
7. Miller, G., K. Schlauch, ., R. Mittler. 2009. The plant NADPHoxidase RBOHD mediates rapid systemic signaling in response todiverse stimuli. Sci. Signal. 2:ra45.
8. Miller, G., N. Suzuki, ., R. Mittler. 2010. Reactive oxygen specieshomeostasis and signalling during drought and salinity stresses. PlantCell Environ. 33:453–467.
9. Gardner, P. R. 2002. Aconitase: sensitive target and measure of super-oxide. Methods Enzymol. 349:9–23.
10. Armstrong, J. S., and M. Whiteman. 2007. Measurement of reactiveoxygen species in cells and mitochondria. Methods Cell Biol.80:355–377.
11. Fridovich, I. 1997. Superoxide anion radical (O2�.), superoxide dismu-
tases, and related matters. J. Biol. Chem. 272:18515–18517.
12. Gomes, A., E. Fernandes, and J. L. F. C. Lima. 2005. Fluorescenceprobes used for detection of reactive oxygen species. J. Biochem.Biophys. Methods. 65:45–80.
13. Tarpey, M. M., D. A. Wink, and M. B. Grisham. 2004. Methods fordetection of reactive metabolites of oxygen and nitrogen: in vitro andin vivo considerations. Am. J. Physiol. Regul. Integr. Comp. Physiol.286:R431–R444.
14. Jambunathan, N. 2010. Determination and detection of reactive oxygenspecies (ROS), lipid peroxidation, and electrolyte leakage in plants.Methods Mol. Biol. 639:292–298.
15. Liszkay, A., E. van der Zalm, and P. Schopfer. 2004. Production ofreactive oxygen intermediates (O(2)(.-), H(2)O(2), and (.)OH) bymaize roots and their role in wall loosening and elongation growth.Plant Physiol. 136:3114–3123, discussion 3001.
16. Georgiou, C. D., I. Papapostolou, and K. Grintzalis. 2008. Superoxideradical detection in cells, tissues, organisms (animals, plants, insects,microorganisms) and soils. Nat. Protoc. 3:1679–1692.
17. Wang, W., H. Q. Fang,., H. Cheng. 2008. Superoxide flashes in singlemitochondria. Cell. 134:279–290.
18. Khan, N., C. M. Wilmot, ., H. M. Swartz. 2003. Spin traps: in vitrotoxicity and stability of radical adducts. Free Radic. Biol. Med.34:1473–1481.
19. Zhao, H. T., J. Joseph, ., B. Kalyanaraman. 2001. Synthesis andbiochemical applications of a solid cyclic nitrone spin trap: a relativelysuperior trap for detecting superoxide anions and glutathiyl radicals.Free Radic. Biol. Med. 31:599–606.
20. Vylegzhanina, N. N., L. K. Gordon, ., O. P. Kolesnikov. 2001.Superoxide production as a stress response of wounded root cells:ESR spin-trap and acceptor methods. Appl. Magn. Reson. 21:63–70.
21. Renew, S., E. Heyno, ., A. Liszkay. 2005. Sensitive detection andlocalization of hydroxyl radical production in cucumber roots andArabidopsis seedlings by spin trapping electron paramagnetic reso-nance spectroscopy. Plant J. 44:342–347.
22. Likhtenshtein, G. I. 2009. Novel fluorescent methods for biotechnolog-ical and biomedical sensoring: assessing antioxidants, reactive radicals,NO dynamics, immunoassay, and biomembranes fluidity. Appl.Biochem. Biotechnol. 152:135–155.
23. Kutala, V. K., F. A. Villamena, ., P. Kuppusamy. 2008. Reactivity ofsuperoxide anion radical with a perchlorotriphenylmethyl (trityl)radical. J. Phys. Chem. B. 112:158–167.
24. Swartz, H. M., M. Sentjurc, and P. D. Morse, 2nd. 1986. Cellularmetabolism of water-soluble nitroxides: effect on rate of reduction ofcell/nitroxide ratio, oxygen concentrations and permeability of nitro-xides. Biochim. Biophys. Acta. 888:82–90.
25. Rizzi, C., A. Samouilov, ., P. Kuppusamy. 2003. Application of atrityl-based radical probe for measuring superoxide. Free Radic. Biol.Med. 35:1608–1618.
26. Murashige, T., and F. Skoog. 1962. A revised medium for rapid growthand bio assays with tobacco tissue cultures. Physiol. Plant. 15:473.
27. Poole, C. P. 1983. Electron Spin Resonance: A Comprehensive Treatiseon Experimental Techniques. Wiley, New York.
28. Eaton, G. R., S. S. Eaton, and K. Ohno. 1991. EPR Imaging and In VivoEPR. CRC Press, Boca Raton.
Biophysical Journal 101(6) 1529–1538
1538 Warwar et al.
29. Sagi, M., and R. Fluhr. 2006. Production of reactive oxygen species byplant NADPH oxidases. Plant Physiol. 141:336–340.
30. Ashtamker, C., V. Kiss, ., R. Fluhr. 2007. Diverse subcellular loca-tions of cryptogein-induced reactive oxygen species production intobacco Bright Yellow-2 cells. Plant Physiol. 143:1817–1826.
31. Sagi, M., and R. Fluhr. 2001. Superoxide production by plant homo-logues of the gp91(phox) NADPH oxidase. Modulation of activity bycalcium and by tobacco mosaic virus infection. Plant Physiol.126:1281–1290.
32. Sagi, M., O. Davydov, ., R. Fluhr. 2004. Plant respiratory burstoxidase homologs impinge on wound responsiveness and developmentin Lycopersicon esculentum. Plant Cell. 16:616–628.
Biophysical Journal 101(6) 1529–1538
33. Eaton, G. R., S. S. Eaton, and M. M. Maltempo. 1989. Threeapproaches to spectral spatial EPR imaging. Appl. Radiat. Isot.40:1227–1231.
34. Blank, A., R. Halevy, ., P. Kuppusamy. 2010. ESR micro-imaging ofLiNc-BuO crystals in PDMS: spatial and spectral grain distribution.J. Magn. Reson. 203:150–155.
35. Jaworski, M., A. Sienkiewicz, and C. P. Scholes. 1997. Double-stackeddielectric resonator for sensitive EPR measurements. J. Magn. Reson.124:87–96.
36. Karp, A., H. J. Shaw, and D. K. Winslow. 1968. Circuit properties ofmicrowave dielectric resonators. IEEE Trans. Microwave TheoryTech. 16:818–828.