Embed Size (px)
Citation preview
Abstract. The theoretical principles of the ESR technique and its application in the field of mol-ecular sieve science are reviewed. The first part of this chapter focuses on the basic principlesand instrumentation of the ESR, ENDOR, ESE and ESEEM techniques. Special attention will begiven to spectral simulation and quantitative analysis of ESR spectra. In the second part, thegeneral features of the ESR spectra of transition metal ions and paramagnetic clusters in molecular sieves are presented and discussed. In addition, some remarks will be made aboutthe use of paramagnetic molecules, such as NO.
1 Introduction . . . . . . . . . . . . . . . . . . . . . . . . . . . . . . . 296
2 Principles and Practice of ESR . . . . . . . . . . . . . . . . . . . . . 297
2.1 Basic Principles and Magnetic Interactions . . . . . . . . . . . . . . 2972.2 Instrumentation and Signal Generation . . . . . . . . . . . . . . . . 3002.3 Quantitative Analysis . . . . . . . . . . . . . . . . . . . . . . . . . . . 3042.4 Spectrum Simulation . . . . . . . . . . . . . . . . . . . . . . . . . . . 3062.5 Modern ESR-Related Techniques: ENDOR and Pulsed ESR . . . . . 3072.5.1 Electron Nuclear Double Resonance (ENDOR) . . . . . . . . . . . . 3082.5.2 Electron Spin Echo Spectroscopy (ESE and ESEEM) . . . . . . . . . 310
3 Application of ESR in Molecular Sieve Science . . . . . . . . . . . . 311
3.1 Transition Metal Ions . . . . . . . . . . . . . . . . . . . . . . . . . . . 3113.1.1 Cu2+ . . . . . . . . . . . . . . . . . . . . . . . . . . . . . . . . . . . . 3113.1.2 Fe3+ . . . . . . . . . . . . . . . . . . . . . . . . . . . . . . . . . . . . 3173.1.3 Cr5+ and Cr3+ . . . . . . . . . . . . . . . . . . . . . . . . . . . . . . . 3183.1.4 V4+ . . . . . . . . . . . . . . . . . . . . . . . . . . . . . . . . . . . . . 3223.2 Paramagnetic Clusters and Metallic Particles . . . . . . . . . . . . . 3233.3 Paramagnetic Molecules . . . . . . . . . . . . . . . . . . . . . . . . . 328
4 General Conclusions and Outlook . . . . . . . . . . . . . . . . . . . 332
5 References . . . . . . . . . . . . . . . . . . . . . . . . . . . . . . . . . 333
Electron Spin Resonance Spectroscopy
Bert M. Weckhuysen1 · Ralf Heidler2 · Robert A. Schoonheydt2
1 Departement Anorganische Chemie en Katalyse, Debye Instituut, Universiteit Utrecht,Sorbonnelaan 16, 3508 TB Utrecht, The Netherlands
2 Centrum voor Oppervlaktechemie en Katalyse, Departement Interfasechemie, K.U.Leuven, Kasteelpark Arenberg 22, 3001 Heverlee, Belgium
Mol. Sieves (2004) 4: 295–335DOI 10.1007/b94238
© Springer-Verlag Berlin Heidelberg 2004
1Introduction
Electron spin resonance (ESR) spectroscopy is a very powerful and sensitivemethod for the characterization of the electronic structures of materials withunpaired electrons. There is a variety of ESR techniques, each with its own advan-tages. In continuous wave ESR (CW-ESR), the sample is subjected to a continu-ous beam of microwave irradiation of fixed frequency and the magnetic field is swept. Different microwave frequencies may be used and they are denoted asS-band (3.5 GHz), X-band (9.25 GHz), K-band (20 GHz), Q-band (35 GHz) andW-band (95 GHz). Other techniques, such as electron nuclear double resonance(ENDOR) and electron spin echo envelope modulation (ESEEM) spectroscopies,record in essence the NMR spectra of paramagnetic species.
Electron spin resonance and related techniques have been applied in molec-ular sieve science for the characterization of transition metal ions that are pre-sent in the lattice and on the surface, coordinated to lattice oxygen atoms or toextra-lattice ligands. The technique is also applied to paramagnetic clusters,mainly of silver and alkaline metals and, in rare cases, to adsorbed paramagneticmolecules such as NO to probe defects and Lewis acidity. Because ESR spectra of transition metal ions are often characterized by interactions which are nolonger small compared with the electron Zeeman interaction, one cannot useperturbation theory of the first order to evaluate the spectra. Therefore, extensivespectral simulation is required to extract physically meaningful ESR para-meters. Such information is a necessity for a detailed description of the coordi-nation geometry of zeolitic transition metal ions. ESR is also a very sensitive technique, but quantitative analysis can only be done with good standards within10 to 20% accuracy.
This review deals with both the theoretical and practical aspects of the use ofESR spectroscopy in molecular sieve science. No attempt has been made to com-pile an exhaustive list of references to all the work that has been published so far.Rather, we have selected what, we feel, are the most important developments andalso, where possible, we have drawn examples from our own work. In a first part,the ESR technique and its extensions such as ENDOR and ESEEM, will be high-lighted with special emphasis on the principles of the techniques and the instru-mental requirements. Attention will also be given to spectral simulation and toquantitative analysis. In a second part, the general features of ESR spectra of tran-sition metal ions in molecular sieves are analyzed. In addition, some remarks willbe made on paramagnetic metal clusters and on paramagnetic molecules. Thechapter closes with general conclusions and an outlook into the future. Fordetailed explanations and discussions-in-depth, we refer to several excellent textbooks [1–9] and review papers [10–14].
296 B.M. Weckhuysen et al.
2Principles and Practice of ESR
2.1Basic Principles and Magnetic Interactions
Electron spin resonance is a magnetic resonance technique, based on the inter-action of unpaired electron spins with an external magnetic field. The essentialaspects of ESR may be illustrated by considering the hypothetical case of a sin-gle isolated electron. This electron is characterized by the quantum number S = 1/2 and possesses a magnetic moment:
mre= – ge · be · Sr (1)
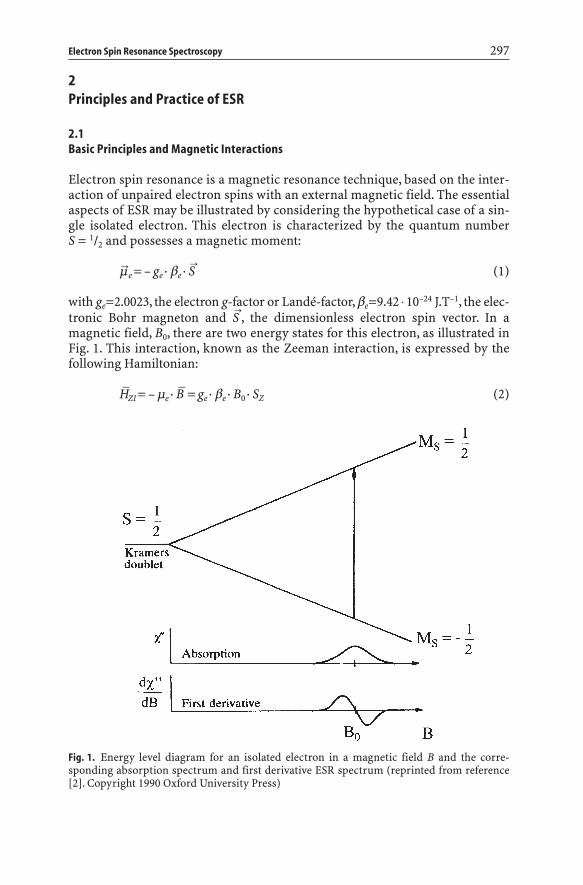
with ge=2.0023, the electron g-factor or Landé-factor, be=9.42 ◊ 10–24 J.T–1, the elec-tronic Bohr magneton and Sr, the dimensionless electron spin vector. In amagnetic field, B0, there are two energy states for this electron, as illustrated inFig. 1. This interaction, known as the Zeeman interaction, is expressed by the following Hamiltonian:
H2ZI= – me · B2 = ge · be · B0 · SZ (2)
Electron Spin Resonance Spectroscopy 297
Fig. 1. Energy level diagram for an isolated electron in a magnetic field B and the corre-sponding absorption spectrum and first derivative ESR spectrum (reprinted from reference[2]. Copyright 1990 Oxford University Press)
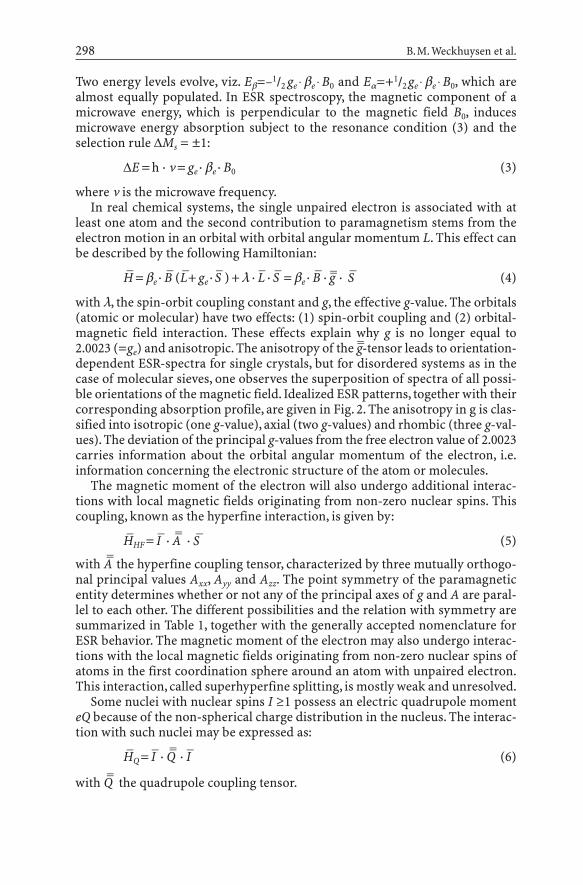
Two energy levels evolve, viz. Eb=–1/2 ge ◊ be ◊ B0 and Ea=+1/2ge ◊ be ◊ B0, which arealmost equally populated. In ESR spectroscopy, the magnetic component of amicrowave energy, which is perpendicular to the magnetic field B0, inducesmicrowave energy absorption subject to the resonance condition (3) and theselection rule DMs = ±1:
DE = h · n = ge · be · B0 (3)
where n is the microwave frequency.In real chemical systems, the single unpaired electron is associated with at
least one atom and the second contribution to paramagnetism stems from theelectron motion in an orbital with orbital angular momentum L. This effect canbe described by the following Hamiltonian:
H2 = be · B2 (L2+ ge · S2 ) + l · L2 · S2 = be · B2 · g22 · S2 (4)
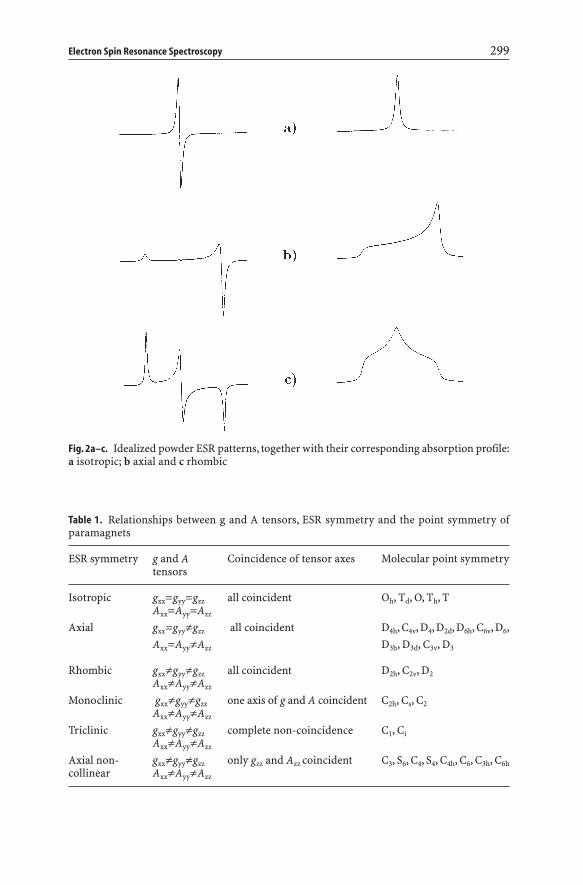
with l, the spin-orbit coupling constant and g, the effective g-value. The orbitals(atomic or molecular) have two effects: (1) spin-orbit coupling and (2) orbital-magnetic field interaction. These effects explain why g is no longer equal to2.0023 (=ge) and anisotropic. The anisotropy of the g22-tensor leads to orientation-dependent ESR-spectra for single crystals, but for disordered systems as in thecase of molecular sieves, one observes the superposition of spectra of all possi-ble orientations of the magnetic field. Idealized ESR patterns, together with theircorresponding absorption profile, are given in Fig. 2. The anisotropy in g is clas-sified into isotropic (one g-value), axial (two g-values) and rhombic (three g-val-ues). The deviation of the principal g-values from the free electron value of 2.0023carries information about the orbital angular momentum of the electron, i.e.information concerning the electronic structure of the atom or molecules.
The magnetic moment of the electron will also undergo additional interac-tions with local magnetic fields originating from non-zero nuclear spins. Thiscoupling, known as the hyperfine interaction, is given by:
H2HF= I2 · A22 · S2 (5)
with A22 the hyperfine coupling tensor, characterized by three mutually orthogo-nal principal values Axx, Ayy and Azz. The point symmetry of the paramagneticentity determines whether or not any of the principal axes of g and A are paral-lel to each other. The different possibilities and the relation with symmetry aresummarized in Table 1, together with the generally accepted nomenclature forESR behavior. The magnetic moment of the electron may also undergo interac-tions with the local magnetic fields originating from non-zero nuclear spins ofatoms in the first coordination sphere around an atom with unpaired electron.This interaction, called superhyperfine splitting, is mostly weak and unresolved.
Some nuclei with nuclear spins I ≥1 possess an electric quadrupole momenteQ because of the non-spherical charge distribution in the nucleus. The interac-tion with such nuclei may be expressed as:
H2Q= I2 · Q22 · I2 (6)
with Q22 the quadrupole coupling tensor.
298 B.M. Weckhuysen et al.
Electron Spin Resonance Spectroscopy 299
Fig. 2a–c. Idealized powder ESR patterns, together with their corresponding absorption profile:a isotropic; b axial and c rhombic
Table 1. Relationships between g and A tensors, ESR symmetry and the point symmetry ofparamagnets
ESR symmetry g and A Coincidence of tensor axes Molecular point symmetrytensors
Isotropic gxx=gyy=gzz all coincident Oh, Td, O, Th, TAxx=Ayy=Azz
Axial gxx=gyyπgzz all coincident D4h, C4v, D4, D2d, D6h, C6v, D6,Axx=AyyπAzz D3h, D3d, C3v, D3
Rhombic gxxπgyyπgzz all coincident D2h, C2v, D2AxxπAyyπAzz
Monoclinic gxxπgyyπgzz one axis of g and A coincident C2h, Cs, C2AxxπAyyπAzz
Triclinic gxxπgyyπgzz complete non-coincidence C1, CiAxxπAyyπAzz
Axial non- gxxπgyyπgzz only gzz and Azz coincident C3, S6, C4, S4, C4h, C6, C3h, C6hcollinear AxxπAyyπAzz
As in the case of the magnetic moment of the electron, also the magneticmoment of the nucleus interacts with the magnetic field Br. This causes a furtherterm in the spin Hamiltonian:
H2NZ= – gN · bN · B2 · I2 (7)
with bN the nuclear magneton and gN the nuclear g-factor which is characteris-tic for each isotope. Usually this term is negligible in regular ESR, but importantin ENDOR spectroscopy.
If two or more unpaired electrons are present, so that the total spin S of theelectron system is greater than 1/2, one has to take into account the interaction ofthe electrons with the electric field generated by the surrounding atoms (i.e. thecrystal field or ligand field). This interaction causes a splitting of the more thantwofold (Kramers-) degenerated ground state of the electron system even in theabsence of an external magnetic field (i.e. zero field splitting). This interactionresults in a line splitting in the ESR spectrum and this interaction can bedescribed by the following Hamiltonian:
H2FS= S2 · D22 · S2 (8)
with the fine structure tensor D22 . The Hamiltonian becomes [2–5]:
(9)
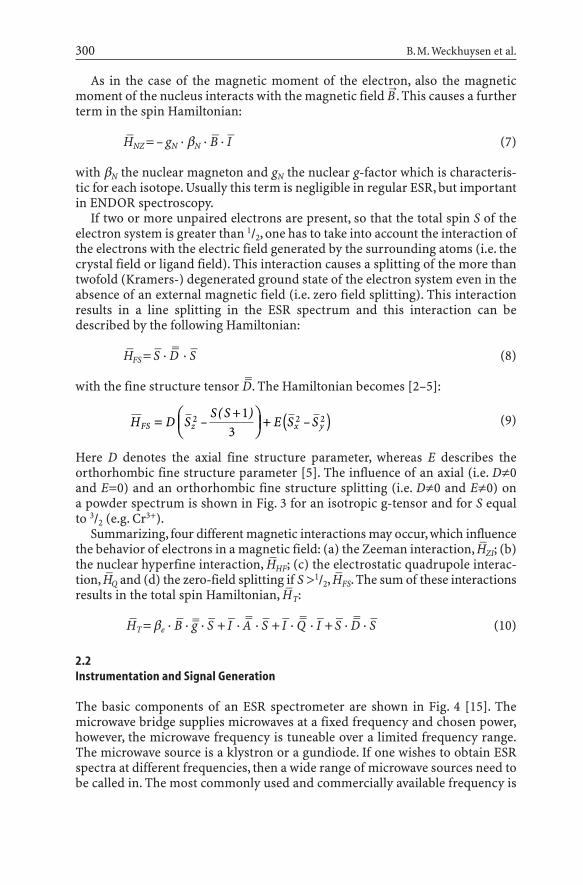
Here D denotes the axial fine structure parameter, whereas E describes theorthorhombic fine structure parameter [5]. The influence of an axial (i.e. Dπ0and E=0) and an orthorhombic fine structure splitting (i.e. Dπ0 and Eπ0) on a powder spectrum is shown in Fig. 3 for an isotropic g-tensor and for S equal to 3/2 (e.g. Cr3+).
Summarizing, four different magnetic interactions may occur, which influencethe behavior of electrons in a magnetic field: (a) the Zeeman interaction, H2ZI; (b)the nuclear hyperfine interaction, H2HF; (c) the electrostatic quadrupole interac-tion, H2Q and (d) the zero-field splitting if S >1/2, H2FS. The sum of these interactionsresults in the total spin Hamiltonian, H2 T:
H2T= be · B2 · g22 · S2 + I2 · A22 · S2 + I2 · Q22 · I2+ S2 · D22 · S2 (10)
2.2Instrumentation and Signal Generation
The basic components of an ESR spectrometer are shown in Fig. 4 [15]. Themicrowave bridge supplies microwaves at a fixed frequency and chosen power,however, the microwave frequency is tuneable over a limited frequency range.The microwave source is a klystron or a gundiode. If one wishes to obtain ESRspectra at different frequencies, then a wide range of microwave sources need tobe called in. The most commonly used and commercially available frequency is
H D SS S
E S SFS z x y=+Ê
ËÁˆ¯
+ ( )2 2 213
–( )
–
300 B.M. Weckhuysen et al.
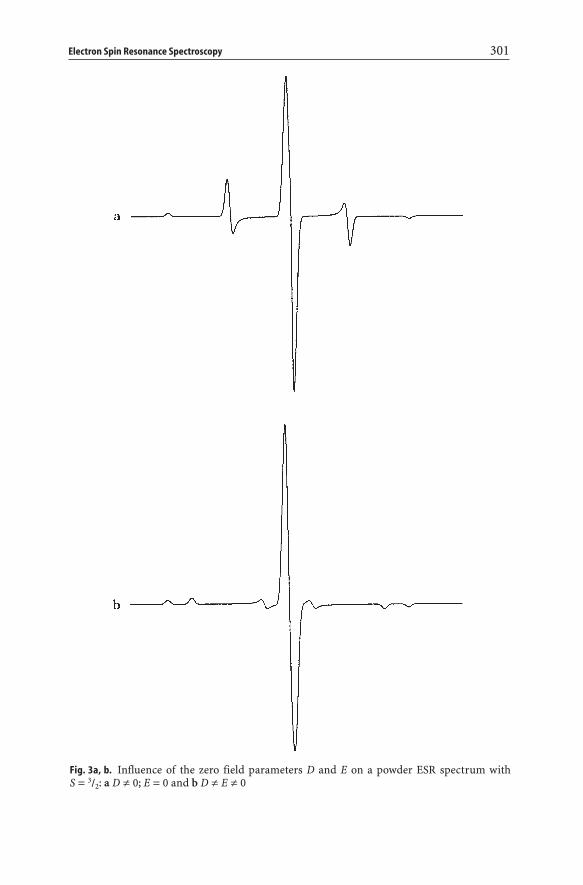
Fig. 3a, b. Influence of the zero field parameters D and E on a powder ESR spectrum with S = 3/2: a D π 0; E = 0 and b D π E π 0
Electron Spin Resonance Spectroscopy 301
302 B.M. Weckhuysen et al.
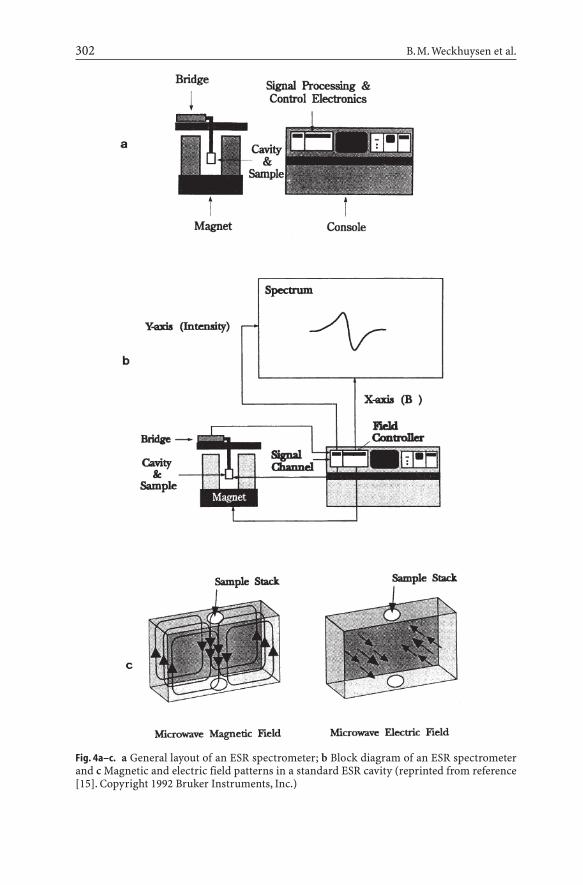
Fig. 4a–c. a General layout of an ESR spectrometer; b Block diagram of an ESR spectrometerand c Magnetic and electric field patterns in a standard ESR cavity (reprinted from reference[15]. Copyright 1992 Bruker Instruments, Inc.)
ca. 9.25 GHz (X-band) and the corresponding resonance field for g =2 is 0.3300 T.Q-band ESR, at ca. 35 GHz, is the next commonly used frequency, which givestransitions at 1.2500 T for g = 2.0. More recently, a commercial W-band ESR spec-trometer (ca. 90 GHz) became available and it is expected that it will add signif-icantly to our understanding of zeolite materials. The microwaves are transmit-ted to a sample cavity via a waveguide. The sample cavity is a device in which thesample can be irradiated with the microwave energy, but which is also capable ofbeing tuned so that microwave energy can be reflected back to a detector in themicrowave bridge. The design of the cavity depends mainly on the appliedmicrowave frequency because the dimensions of the cavity (and waveguide) mustmatch the wavelength of the microwaves. The wavelength (and cavity dimen-sions) for X- and Q-band are 3.24 and 0.86 cm, respectively. It is also clear thatthese size limitations have a strong influence on the maximum amount of sam-ple that a particular cavity will tolerate. For example, Q-band cavities permit onlythe use of very small amounts of samples. The sample cavity is then placed per-pendicular to the applied magnetic field, B0, which can be varied in a controlledway. B0 is generated by an electromagnet and should be as accurate and homo-geneous as possible. In addition to the main magnetic field a controlled butsmaller oscillating magnetic field is superimposed on the sample cavity via themodulation coils. Thus, the signal response from the cavity is modulated at themodulation frequency, and a first derivative ESR spectrum results. The ideal wayto perform an ESR experiment would be to apply a fixed magnetic field and tovary the microwave frequency. However, as discussed above, microwave sourcesare tunable only over limited ranges. Therefore, the microwave frequency is keptconstant and the applied magnetic field is varied over a field range in whichmicrowave absorption is expected. This is called continuous wave electron spinresonance (CW-ESR). At the stage of microwave absorption, a change of theintensity of the reflected microwave energy is detected by a detector and the sig-nal obtained is amplified, recorded and stored for further treatment.
The following parameters must be optimized to obtain a physically meaning-ful ESR spectrum:
(i) magnetic field scan range: If you do not know much about your sample,it is advisable to scan the widest magnetic field range available, i.e. from zero up to the maximum. Afterwards, one may pick up the scan range ofinterest;
(ii) modulation amplitude: An oscillating magnetic field at a fixed and stablefrequency (mostly 100 kHz) is applied to the sample cavity via coils. Themagnetic field is applied continuously throughout the experiment. Theamplitude of this modulation is very important because high modulationamplitudes may distort the individual lines in a spectrum so that valuableinformation is lost. This is especially important when the lines are sharp andweak.
(iii) sweep time: Short sweep times may significantly distort the ESR spectrumin that (a) the cross-over point of the first derivative spectrum may beshifted in the direction of the scan; (b) the spectrum becomes asymmetricor (c) the signal intensity reduces.
Electron Spin Resonance Spectroscopy 303
(iv) sample temperature: Low concentrations of paramagnetic entities may be-come only visible at low measuring temperature. Furthermore, measure-ments of the signal intensity as a function of the sample temperature allowone to distinguish different types of magnetic behavior (i.e. paramagnetism,anti-ferromagnetism, etc.);
(v) microwave power: At low values of the microwave power, the signal ampli-tude will increase in direct proportion to the square root of the microwavepower received by the sample. This relationship, however, is only obeyed upto a certain power level, beyond which the signal intensity levels off or evendecreases. This is known as microwave power saturation and no quantita-tive information can be extracted from saturated spectra. Saturation effectsare also more pronounced at low temperatures.
If one wants to determine g-values from ESR spectra, one has to know both thefield B0 and the microwave frequency (Eq. 3). There are two possible methods:One can use a Gaussmeter and a frequency counter, both of which are relativelyexpensive instruments; the second method is based on the use of a standard withaccurately known g-values.A double rectangular cavity (TE104) is very convenientin that the standard (REF) is placed in one half of the cavity and the (unknown)sample (M) in the other. Only one cavity tuning operation is necessary for both measurements. With DPPH (diphenylpicrylhydrazine) as standard with gREF = 2.0036, one has:
h · nREF= gREF · b · B0, REF (11)
h · nM= geff · b · B0, M (12)with
h · nREF= h · nM (13)or
geff = gREF · (B0, REF/B0, M) (14)
The resonance fields B0, REF and B0, M are read directly from the ESR spectra.
2.3Quantitative Analysis
The concentration, C, of a paramagnetic entity in a sample, subjected to an ESRexperiment, is given by Eq. (15) [5]:
(15)
with K, a proportionality constant; I, the ESR line intensity; G, the amplifier gainof the spectrometer and P, the ESR transition probability [5]. The proportional-ity constant K is dependent on (a) the properties of the sample cavity, (b) theapplied microwave power and (c) the applied modulation amplitude. The inten-sity I of the ESR signal must be obtained by working in the linear region of themicrowave detectors and in the absence of microwave power saturation (i.e. low
CK IG P
=◊◊
304 B.M. Weckhuysen et al.
paramagnetic concentrations). It is important to stress that an ESR signal consists of the first derivative of the absorption line and the ESR intensity mustbe related with the area under the absorption envelope. This is done by double integration of the recorded first derivative spectrum over a well-definedscan range.
If the number of spins in a standard is accurately known, its signal intensitycan be used to determine the number of spins in the unknown sample. It is clearthat K and P of Eq. (15) must be identical for the standard and the (unknown)sample. The related implications are that the conditions (a) to (c) should be iden-tical for the paramagnetic sample and for the standard. Condition (a) means thatthe sample container, the volume of sample, the positioning in the sample cavityand the dielectric properties of both samples are identical. In addition, the stan-dard should ideally have ESR properties (electronic structure, g-values, etc.) iden-tical to those of the studied paramagnetic entity. Because this is almost impos-sible, one should choose a standard which is as close as possible to that of theunknown (e.g. Cu2+ (d9) for Cr5+ (d1) -quantification) [16].
If the ESR spectra of the paramagnetic entity in the unknown sample (M) andof the standard or reference compound (REF) have the same number of featuresspread over the same magnetic field range and if these spectra are integrated overthe same scan range, then ESR allows the quantification of this paramagneticentity according to Eq. 16:
(16)
with: NM, NREF = amount of spins of M and reference compound, respectively;AM, AREF = intensity of the ESR signal of M and reference compound obtainedafter double integration, respectively; gM, gREF = g-value of M and reference com-pound, respectively and SM, SREF = spin quantum number of M and referencecompound, respectively. The last term in Eq. (16) corrects for the differencesbetween the spin quantum number of the unknown and that of the referencecompound.
Double integration of the ESR signal is not straightforward, especially in thecase of transition metal ions with their spectra smeared out over a broad mag-netic field range. The following parameters must be known or chosen:
(i) Lineshape: This can be Gaussian, Lorentzian or a combination of both.(ii) Baseline: Integration is always very sensitive to baseline effects. A constant
offset, for example, which means that the whole spectrum is shifted up ordown from zero, results in a quadratic baseline in the doubly integratedspectrum. If integration is carried out over a wide range, such effectbecomes large. This can be corrected by choosing a suitable baseline cor-rection (cubic, linear, etc.).
(iii) Integration width: Each spectrum must be integrated over the same scanrange so that the same features are taken into account. Furthermore, largeintegration widths are recommended because tailing effects may causeimportant contributions to the overall spectrum.
N NA
Agg
S SS SM REF
M
REF
REF
M
REF REF
M M= ◊ Ê
ËÁˆ¯
◊ÊËÁ
ˆ¯
◊◊ +( )◊ +( )
ÊËÁ
ˆ¯
11
Electron Spin Resonance Spectroscopy 305
It may be clear that a quantitative determination of paramagnetic species israther complicated and requires a great deal of experimental care. Therefore,absolute determination of paramagnetic entities, especially transition metal ions,can only be done within 10 to 20% accuracy and explains why the number ofquantitative ESR studies in molecular sieve science is rather limited [12,16].
2.4Spectrum Simulation
For the simulation of ESR spectra one has to solve the spin Hamiltonian ofEq. (10). The easiest way to do this is to regard all the different terms in the spinHamiltonian as small compared with the electron Zeeman interaction and to useperturbation theory of the first order. The Zeeman term can easily be solvedwithin the eigensystem of the SZ operator (in the main axis system of the g-tensor or SrZ= Br for isotropic cases), for instance in the isotropic case:
EZ= g · b · B · mS (17)
Unfortunately, in most cases this simplification is not applicable. Therefore, theuse of perturbation theory of higher order is recommended, or in more compli-cated situations, the diagonalization of the spin Hamiltonian within the eigen-system of its spin operators.
Because the ESR experiment does not measure the energy spectrum for onefixed magnetic field by scanning the frequency of the microwave, but scans themagnetic field, it is necessary to calculate the energy levels for each magnitudeof the magnetic field and to determine the resonance fields by comparing the dif-ferences of the energy levels with the applied microwave energy. Therefore, thespin Hamiltonian needs to be diagonalized very often and such calculations aretime consuming. For the calculated resonance positions, it is easy to determinethe appropriate intensities by evaluating the transition probabilities which can becalculated using the eigenfunctions of the spin Hamiltonian.
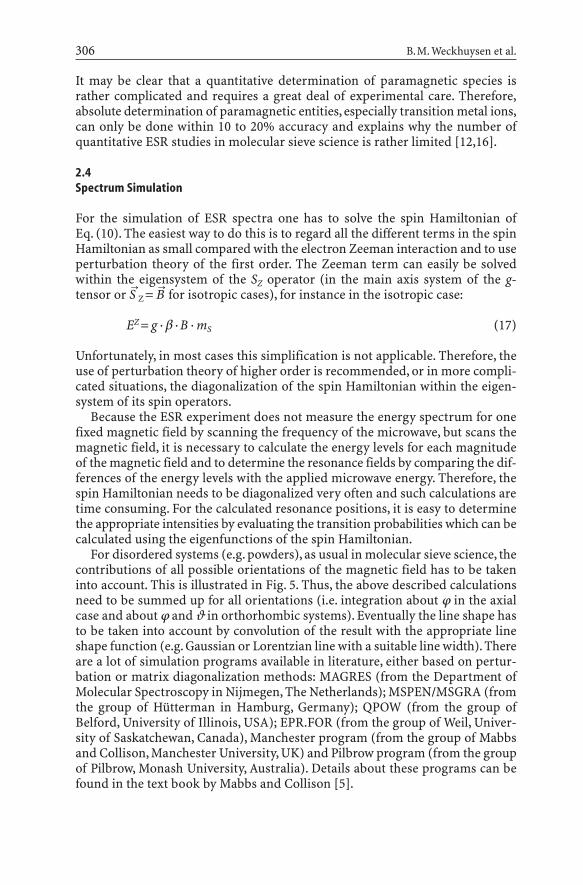
For disordered systems (e.g. powders), as usual in molecular sieve science, thecontributions of all possible orientations of the magnetic field has to be takeninto account. This is illustrated in Fig. 5. Thus, the above described calculationsneed to be summed up for all orientations (i.e. integration about j in the axialcase and about j and J in orthorhombic systems). Eventually the line shape hasto be taken into account by convolution of the result with the appropriate lineshape function (e.g. Gaussian or Lorentzian line with a suitable line width). Thereare a lot of simulation programs available in literature, either based on pertur-bation or matrix diagonalization methods: MAGRES (from the Department ofMolecular Spectroscopy in Nijmegen, The Netherlands); MSPEN/MSGRA (fromthe group of Hütterman in Hamburg, Germany); QPOW (from the group ofBelford, University of Illinois, USA); EPR.FOR (from the group of Weil, Univer-sity of Saskatchewan, Canada), Manchester program (from the group of Mabbsand Collison, Manchester University, UK) and Pilbrow program (from the groupof Pilbrow, Monash University, Australia). Details about these programs can befound in the text book by Mabbs and Collison [5].
306 B.M. Weckhuysen et al.
In practice one usually wishes to determine accurately the parameters of thespin Hamiltonian out of the measured spectrum. Therefore one has to estimatethe parameters (g, D, E, A, Q, the line shape and the line width) to simulate thespectrum and to compare the result with the experimental spectrum, eventuallyfollowed by re-estimation of the parameters and simulation.
2.5Modern ESR-Related Techniques: ENDOR and Pulsed ESR
The classic ESR technique, although very powerful, frequently suffers from inho-mogeneous line broadening as a consequence of dipolar interactions and givesrise to poorly resolved ESR spectra. A considerable enhancement in resolutionmay be obtained by applying modern ESR-related techniques, which are capableof measuring nuclear magnetic transition frequencies in paramagnetic systems.In this paragraph two of these more advanced techniques will be discussed, i.e.electron nuclear double resonance (ENDOR) and a pulse variant of CW-ESR,electron spin echo spectroscopy (ESE). Detailed reviews on these techniques andtheir applications are available in the literature [17–24].
Electron Spin Resonance Spectroscopy 307
Fig. 5. Definition of the polar angles of the applied magnetic field, B0, with their respect to theprincipal axes
2.5.1Electron Nuclear Double Resonance (ENDOR)
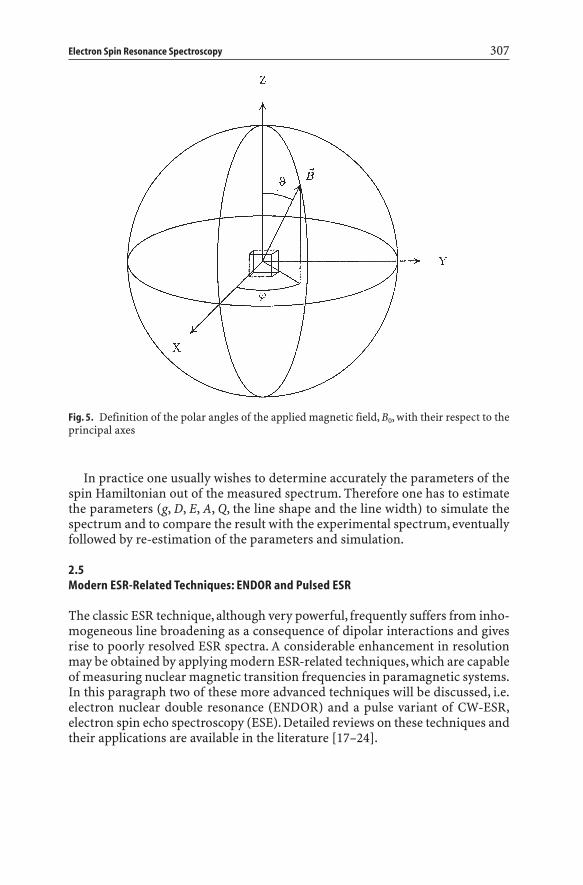
In ENDOR spectroscopy, one measures the NMR spectrum of nuclei which inter-act with a paramagnetic center. The principle of ENDOR spectroscopy is illus-trated by Fig. 6 for a system with both S and I equal to 1/2 (consider, e.g., a oneelectron – one proton two spin system, i.e. with one electron and one nuclearspin). The Hamiltonian operator, which is appropriate for this case (I=1/2, i.e.eQ=0; S=1/2, i.e. D=0; HNZ non-negligible; see Eqs. (1), (2), (5), (7), (10)) is givenby
H2T= be · B2 · g22e · S– + I–· A22 · S– – gN · bN · B2 · I2 (18)
This operator has to be applied on the eigenfunctions of the spin system,(one electron-one proton two-spin system), i.e. on j4=|ae · anÒ, j2=|ae · bnÒ,j2=|be · bnÒ, j1=|be · anÒ; with ae, be, an, bn indicating the eigenfunctions of theelectron (e) spin or nuclear (n) spin with the eigenvalues ms=1/2, ms=–1/2, mI=+1/2and mI=–1/2, respectively. This application provides the energy of levels 1 to 4 ofFig. 6 as follows (compare, e.g., Ref [23] or Ref. [24]):
(19)
To detect an ENDOR signal one has to record the ESR spectrum and to choosean appropriate line which has to be (at least partially) saturated (vide infra).
E g B a g B
E g B a g B
E g B a g B
E g B a g B
e e N N
e e N N
e e N N
e e N N
412
14
12
312
14
12
212
14
12
112
14
12
= ◊ ◊ + ◊ ◊
= ◊ ◊ + ◊ ◊
= ◊ ◊ + + ◊ ◊
= ◊ ◊ ◊ ◊
b b
b b
b b
b b
–
–
–
– – –
308 B.M. Weckhuysen et al.
Fig. 6. Energy level scheme for ENDOR
For instance, the allowed ESR transition 1 (1 ´ 4) can be saturated by applica-tion of a sufficiently high microwave power (vide infra) so that the levels 1 and4 are equally populated and consequently no ESR signal is observed. Now, astrong radiofrequecny field is applied with a frequency, nN, given by the energydifference between the levels 3 and 4, i.e.
Thus, NMR transitions D (4 ´ 3) will be stimulated until the populations oflevels 3 and 4 will be equalized. As a consequence, the population of level 4 willslightly decrease. This desaturation enables the ESR signal to re-appear.
Similarly, if a radiofrequency, nN, corresponding to the energy differencebetween levels 1 and 2, i.e.
were employed, NMR transitions C between these levels would be stimulated,again with the result of disturbing the equalized populations of levels 4 and 1,and thus, de-saturating of the electron resonance signal would again occur. In an experiment, where the electron resonance frequency, ne, is kept constant and the radiofrequency swept around nrf = 1/2h, the ESR signal will re-appeartwice, viz. at
From the ENDOR spectrum with these two lines, one can derive both the hyper-fine splitting constant, A, and the nuclear factor, gN (characteristic of givennucleus) with high accuracy.
Though the ENDOR method is a very powerful tool, there are several draw-backs to this method, which sometimes prohibits a successful application. ForENDOR spectroscopy in general an advanced equipment is necessary. Especiallythe generation of a sufficiently high radiofrequency power and the coils to generate the appropriate magnetic field on the sample are often problematic.Furthermore, the ENDOR effect is usually smaller than the ESR effect (mostlyless than one tenth of the ESR intensity) and a sensitive ESR spectrometer isrequired. In addition, an ENDOR signal can only be detected if one is able to saturate the ESR line at least partially. This means that a low measurement tem-perature is recommended, usually using liquid helium (4.2 K). Furthermore, thenuclear relaxation time must not be too long to avoid saturation of the NMRtransition. The last restrictions can sometimes be circumvented by using pulsedESR techniques.
n b
n b
N N N
N N N
hg B
hg B
= ◊ ◊ÊËÁ
ˆ¯
¢ = + ◊ ◊ÊËÁ
ˆ¯
1 12
1 12
–
h a g BN N Nn b= + ◊ ◊12
h a g BN N Nn b= ◊ ◊12
–
Electron Spin Resonance Spectroscopy 309
2.5.2Electron Spin Echo Spectroscopy (ESE and ESEEM)
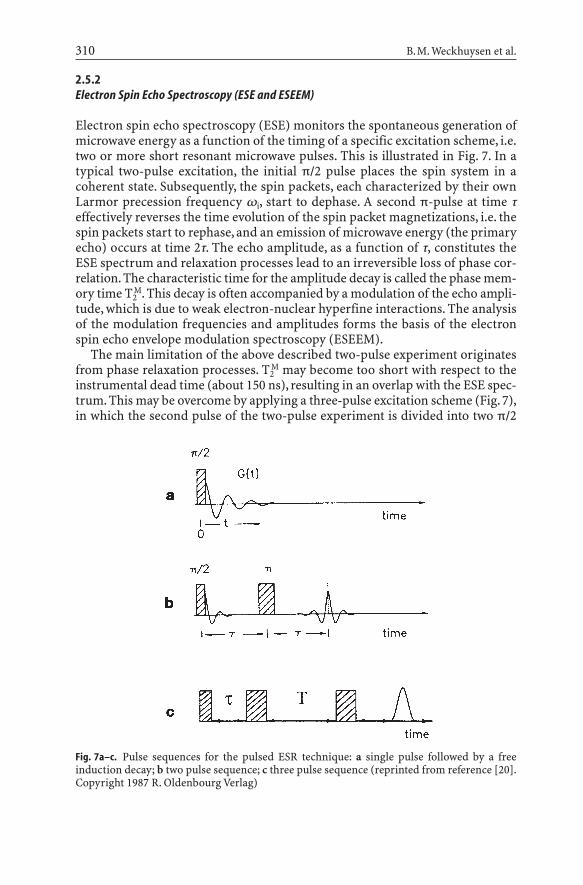
Electron spin echo spectroscopy (ESE) monitors the spontaneous generation ofmicrowave energy as a function of the timing of a specific excitation scheme, i.e.two or more short resonant microwave pulses. This is illustrated in Fig. 7. In atypical two-pulse excitation, the initial p/2 pulse places the spin system in acoherent state. Subsequently, the spin packets, each characterized by their ownLarmor precession frequency wi, start to dephase. A second p-pulse at time teffectively reverses the time evolution of the spin packet magnetizations, i.e. thespin packets start to rephase, and an emission of microwave energy (the primaryecho) occurs at time 2t. The echo amplitude, as a function of t, constitutes theESE spectrum and relaxation processes lead to an irreversible loss of phase cor-relation. The characteristic time for the amplitude decay is called the phase mem-ory time T2
M. This decay is often accompanied by a modulation of the echo ampli-tude, which is due to weak electron-nuclear hyperfine interactions. The analysisof the modulation frequencies and amplitudes forms the basis of the electronspin echo envelope modulation spectroscopy (ESEEM).
The main limitation of the above described two-pulse experiment originatesfrom phase relaxation processes. T2
M may become too short with respect to theinstrumental dead time (about 150 ns), resulting in an overlap with the ESE spec-trum. This may be overcome by applying a three-pulse excitation scheme (Fig. 7),in which the second pulse of the two-pulse experiment is divided into two p/2
310 B.M. Weckhuysen et al.
Fig. 7a–c. Pulse sequences for the pulsed ESR technique: a single pulse followed by a free induction decay; b two pulse sequence; c three pulse sequence (reprinted from reference [20].Copyright 1987 R. Oldenbourg Verlag)
pulses. The echo can now be followed over a time of the order of magnitudeT1oT2
M. With the separation between the first and the second pulse denoted as tand the one between the second and the third as T, the stimulated echo, occur-ring at 2t+T, is monitored in the T-space. Thus, there are two experimentally con-trollable times t and T. It is therefore possible to suppress one nuclear modula-tion frequency by appropriate selection of one of these times. The analysis of thismodulation provides a way to measure the weak electron-nuclear hyperfineinteractions. In addition, it is possible to determine both the number and the dis-tance of magnetic nuclei, surrounding a paramagnetic center.
Three-pulse experiments are well suited for studying the interaction ofadsorbed molecules with paramagnetic centers. For example, by selecting theappropriate pulse amplitude, it is possible to observe deuterium modulation,while suppressing proton modulation for adsorbed methanol. This is possiblebecause of the difference in the nuclear frequencies of protons and deuterons.This allows the determination of the orientation of this adsorbed molecule withrespect to a paramagnetic center by selective deuteration.
To extract detailed hyperfine information from an ESE spectrum, however, itis necessary to calculate the expected modulation pattern for a certain assumednuclear geometry. By varying the assumed hyperfine interaction for a simulatedmodulation pattern until it fits the observed modulation pattern, the weak hyper-fine parameters may be determined. The general analysis procedure is to analyzethe ESE spectrum in terms of a number of equivalent nuclei located at an aver-age distance from the paramagnetic center. The assumption is then that there isa small overlap of the unpaired electron wave function on the closest nuclei togive an isotropic hyperfine coupling constant Aiso.
3Applications of ESR in Molecular Sieve Science
3.1Transition Metal Ions
Transition metal ions (TMIs) coordinate to lattice oxygen atoms, form complexesinside the cages and/or channels or occupy framework sites. Classical ESR techniques as well as pulsed ESR, and in particular the analysis of the modula-tion of the echo envelope signal (ESEEM) has been used extensively to gatherdetailed information about the coordination environment of TMIs.
3.1.1Cu2+
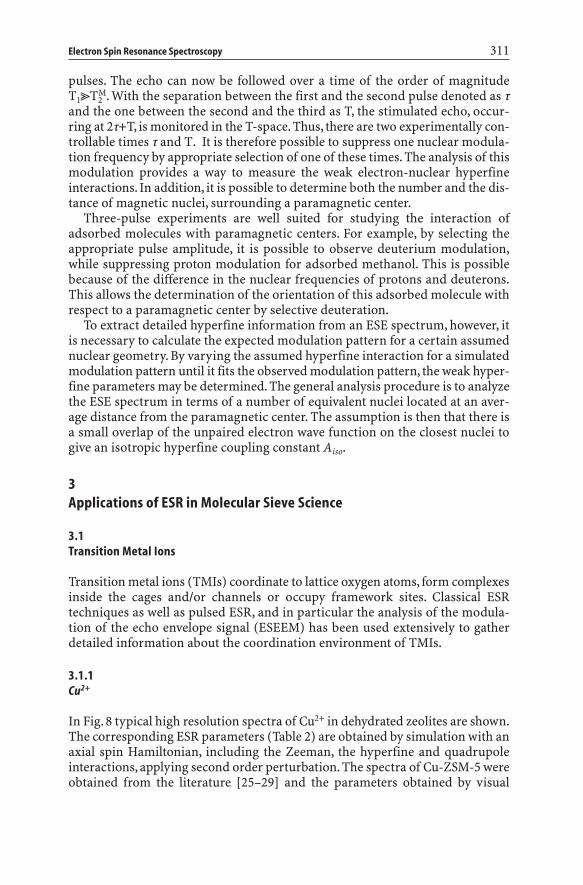
In Fig. 8 typical high resolution spectra of Cu2+ in dehydrated zeolites are shown.The corresponding ESR parameters (Table 2) are obtained by simulation with anaxial spin Hamiltonian, including the Zeeman, the hyperfine and quadrupoleinteractions, applying second order perturbation. The spectra of Cu-ZSM-5 wereobtained from the literature [25–29] and the parameters obtained by visual
Electron Spin Resonance Spectroscopy 311
312 B.M. Weckhuysen et al.
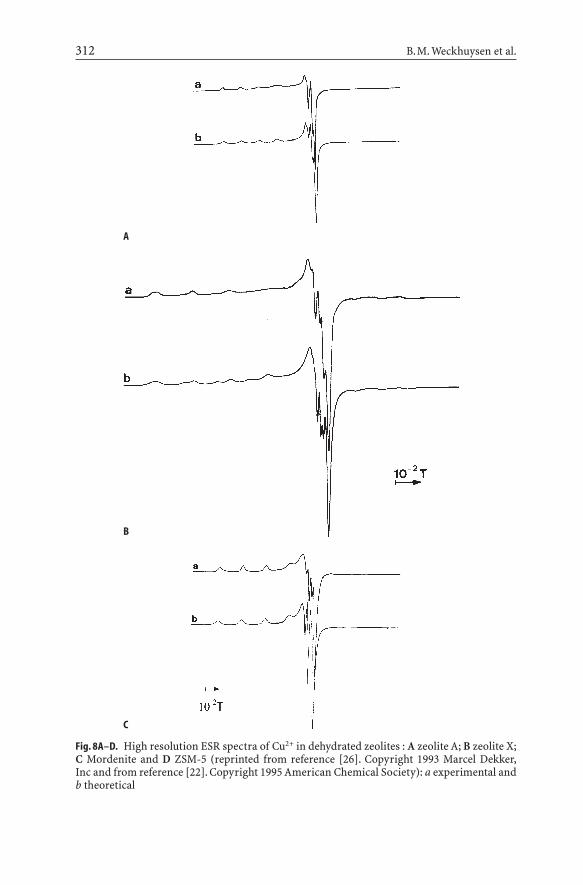
Fig. 8A–D. High resolution ESR spectra of Cu2+ in dehydrated zeolites : A zeolite A; B zeolite X;C Mordenite and D ZSM-5 (reprinted from reference [26]. Copyright 1993 Marcel Dekker,Inc and from reference [22]. Copyright 1995 American Chemical Society): a experimental andb theoretical
A
B
C
inspection. Similar spectra are obtained on Cu2+-loaded SAPO’s [30-35]. Thereare several remarks to be made about the spectra and their simulation:
(1) While a very good guess of the parameters of the parallel region can beobtained from the spectra by visual inspection, this is certainly not the casefor the perpendicular region. The reason is that in the parallel region for-bidden transitions (DmI=±1, ±2) do not contribute to the spectrum, while inthe perpendicular region they come into play. They are negligibly small aslong as the quadrupole coupling constant Q is small, but become important,as the ratio ΩQΩ/ΩAΩincreases. This is illustrated in Fig. 9, showing the perpendicular region of the Cu2+-mordenite spectrum with g||=2.327,A||=15.5 mT, g^= 2.068 and A^=1.5 mT. In the first case Q=0.2 mT, in the second case Q=0.5 mT. In the latter case, one notices the increased contri-bution of the DmI=±1 and DmI=±2 contributions between 0.32 and 0.33 T.
Electron Spin Resonance Spectroscopy 313
Fig. 8 (continued)
Table 2. ESR parameters of Cu2+ in dehydrated zeolites
Zeolite g A (mT) g^ A^ (mT) Q (mT) Assignment/Location
A 2.386 12.6 2.064 0.25 0.50 A2.386 12.6 2.063 1.57 0 re-simulated
X (1) 2.384 12.7 2.074 1.20 0.33 II2.386 12.5 2.069 1.33 0.14 re-simulated
(2) 2.354 14.3 2.068 1.50 0.35 III’2.353 14.4 2.064 1.64 0.00 re-simulated
Y (1) 2.397 11.9 2.070 1.50 0.30 II
(2) 2.328 15.5 2.065 1.90 0.32 I’
Mordenite (1) 2.327 15.4 2.062 1.49 0.26 A(2) 2.277 16.8 2.057 1.19 0.28 E
ZSM-5 (1) 2.310 15.0–16.0 – – – square pyramidal(2) 2.330 15.0–16.0 – – – square pyramidal(3) 2.280 18.0 – – – square planar
D
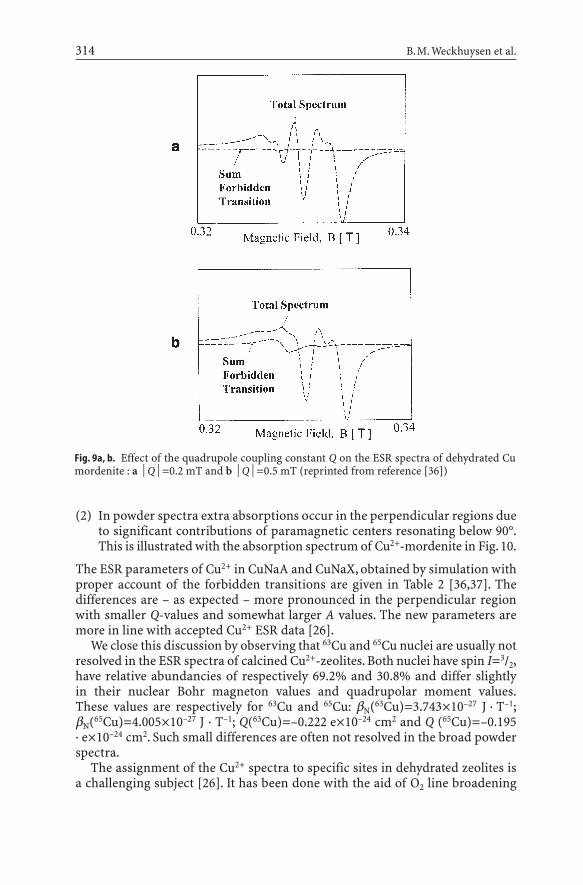
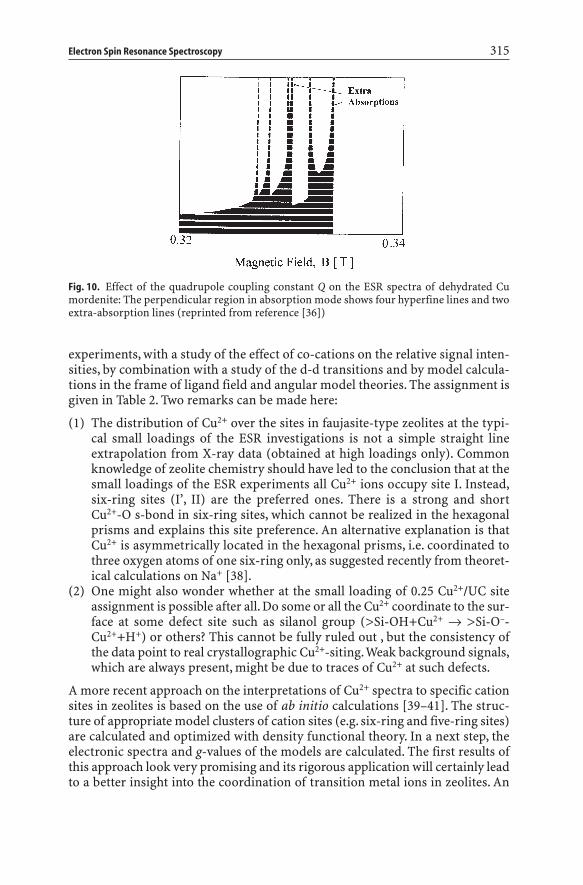
(2) In powder spectra extra absorptions occur in the perpendicular regions dueto significant contributions of paramagnetic centers resonating below 90°.This is illustrated with the absorption spectrum of Cu2+-mordenite in Fig. 10.
The ESR parameters of Cu2+ in CuNaA and CuNaX, obtained by simulation withproper account of the forbidden transitions are given in Table 2 [36,37]. The differences are – as expected – more pronounced in the perpendicular regionwith smaller Q-values and somewhat larger A values. The new parameters aremore in line with accepted Cu2+ ESR data [26].
We close this discussion by observing that 63Cu and 65Cu nuclei are usually notresolved in the ESR spectra of calcined Cu2+-zeolites. Both nuclei have spin I=3/2,have relative abundancies of respectively 69.2% and 30.8% and differ slightly in their nuclear Bohr magneton values and quadrupolar moment values.These values are respectively for 63Cu and 65Cu: bN(63Cu)=3.743¥10–27 J · T–1;bN(65Cu)=4.005¥10–27 J · T–1; Q(63Cu)=–0.222 e¥10–24 cm2 and Q (65Cu)=–0.195 · e¥10–24 cm2. Such small differences are often not resolved in the broad powder spectra.
The assignment of the Cu2+ spectra to specific sites in dehydrated zeolites isa challenging subject [26]. It has been done with the aid of O2 line broadening
314 B.M. Weckhuysen et al.
Fig. 9a, b. Effect of the quadrupole coupling constant Q on the ESR spectra of dehydrated Cu mordenite : a ΩQΩ=0.2 mT and b ΩQΩ=0.5 mT (reprinted from reference [36])
experiments, with a study of the effect of co-cations on the relative signal inten-sities, by combination with a study of the d-d transitions and by model calcula-tions in the frame of ligand field and angular model theories. The assignment isgiven in Table 2. Two remarks can be made here:
(1) The distribution of Cu2+ over the sites in faujasite-type zeolites at the typi-cal small loadings of the ESR investigations is not a simple straight lineextrapolation from X-ray data (obtained at high loadings only). Commonknowledge of zeolite chemistry should have led to the conclusion that at thesmall loadings of the ESR experiments all Cu2+ ions occupy site I. Instead,six-ring sites (I’, II) are the preferred ones. There is a strong and short Cu2+-O s-bond in six-ring sites, which cannot be realized in the hexagonalprisms and explains this site preference. An alternative explanation is thatCu2+ is asymmetrically located in the hexagonal prisms, i.e. coordinated tothree oxygen atoms of one six-ring only, as suggested recently from theoret-ical calculations on Na+ [38].
(2) One might also wonder whether at the small loading of 0.25 Cu2+/UC siteassignment is possible after all. Do some or all the Cu2+ coordinate to the sur-face at some defect site such as silanol group (>Si-OH+Cu2+ Æ >Si-O–-Cu2++H+) or others? This cannot be fully ruled out , but the consistency ofthe data point to real crystallographic Cu2+-siting.Weak background signals,which are always present, might be due to traces of Cu2+ at such defects.
A more recent approach on the interpretations of Cu2+ spectra to specific cationsites in zeolites is based on the use of ab initio calculations [39–41]. The struc-ture of appropriate model clusters of cation sites (e.g. six-ring and five-ring sites)are calculated and optimized with density functional theory. In a next step, theelectronic spectra and g-values of the models are calculated. The first results ofthis approach look very promising and its rigorous application will certainly leadto a better insight into the coordination of transition metal ions in zeolites. An
Electron Spin Resonance Spectroscopy 315
Fig. 10. Effect of the quadrupole coupling constant Q on the ESR spectra of dehydrated Cu mordenite: The perpendicular region in absorption mode shows four hyperfine lines and twoextra-absorption lines (reprinted from reference [36])
important conclusions from these studies is that transition metal ions, in par-ticularly Cu2+ and Co2+, are able to distort the local environment of a cation sitein order to increase their coordination number.
In some cases, especially that of zeolites with high Al content, superhyperfineinteraction of Cu2+ with the 27Al nucleus (I=5/2) has been observed. Here, ESEEMis particularly useful [42–44].When Cu2+ is complexed with extra-lattice ligandssuch as H2O, methanol, NH3, ethylenediamine or pyridine, its magnetic momentis effectively screened from the environment. Well resolved spectra can beobtained at much higher Cu2+ loadings than for dehydrated zeolites. The ESEEMtechnique has been pioneered by Kevan and co-workers to detect the weak mag-netic interactions between transition metal ions and surrounding nuclei such asH, D and Al. For example, deuterated and 13C-labelled adsorbates have been stud-ied in H-, Na-, K- and Ca-ZSM-5 zeolites by ESR and ESEEM [42]. Simulation ofthe obtained signals show a fourfold methanol and ethanol coordination of Cu2+
in H-ZSM-5, whereas only a threefold coordination is observed in Cu2+
exchanged Na-, K- and Ca-ZSM-5. The use of deuterated molecules, such as D2Oand CD3OH, was also useful in determining the location and structure of Cu2+ inzeolites as a function of the co-cation [43–44]. Recently, the technique has beenextended to characterize Cu2+ complexes in mesoporous MCM-41 [45–46].Surprisingly, Cu2+ was found to bind strongly with surface oxygen atoms andonly 2 H2O, 2 MeOH or 2 NH3 could enter the coordination sphere, the larger mol-ecules pyridine and benzene being excluded.
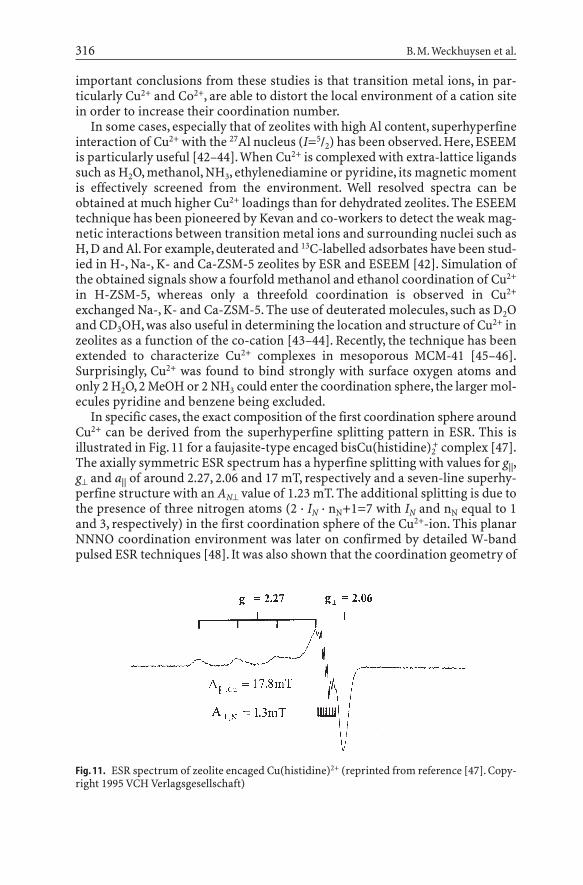
In specific cases, the exact composition of the first coordination sphere aroundCu2+ can be derived from the superhyperfine splitting pattern in ESR. This isillustrated in Fig. 11 for a faujasite-type encaged bisCu(histidine)2
+ complex [47].The axially symmetric ESR spectrum has a hyperfine splitting with values for g||,g^ and a|| of around 2.27, 2.06 and 17 mT, respectively and a seven-line superhy-perfine structure with an AN^ value of 1.23 mT. The additional splitting is due tothe presence of three nitrogen atoms (2 · IN · nN+1=7 with IN and nN equal to 1and 3, respectively) in the first coordination sphere of the Cu2+-ion. This planarNNNO coordination environment was later on confirmed by detailed W-bandpulsed ESR techniques [48]. It was also shown that the coordination geometry of
316 B.M. Weckhuysen et al.
Fig. 11. ESR spectrum of zeolite encaged Cu(histidine)2+ (reprinted from reference [47]. Copy-right 1995 VCH Verlagsgesellschaft)
these zeolite-encapsulated copper-histidine complexes depend on the Cu2+-load-ing and, at low Cu2+-loading, a mono Cu(his)+ complex could be formed insidethe cages of zeolite Y. ESEEM indicates that this mono-complex is in close con-tact with the zeolite framework since strong 27Al modulations were observed.
3.1.2Fe3+
The detection and characterization of Fe3+ in molecular sieves by ESR and Möss-bauer spectroscopies is almost as old as spectroscopy of molecular sieves itself.Three signals are invariably reported [49–57]:
- a sharp line around g=4.3, interpreted as Fe3+ in a tetrahedral environment withstrong rhombic distortion;
– a broad line around g=2.3 due to oxidic Fe species;– a line around g=2, interpreted as Fe3+ in (distorted) octahedral environment.
The chemical interpretation of these signals is Fe3+ in the lattice, extra-frame-work Fe2O3, Fe3+ at exchange sites, respectively. There are many reports in the lit-erature that these interpretations, especially that of the g=4.3 signal and that ofthe g=2.0 signal, are not the only possible ones.An alternative interpretation wasput forward by Lin et al. in that the three signals were assigned to three differenttypes of framework sites in FAPO-5 [52]. This interpretation has become unlikelyin the light of the results of Goldfarb et al. [53–54]. Their interpretation is that thesignal at g=4.3 is due to Fe3+ at defect sites, e.g. silanol groups and that at g=2.0to framework Fe3+ and/or Fe3+ in exchange sites. The latter signal is ascribed tothe |–1/2Ò ´ |1/2Ò transition of tetrahedral Fe3+. At the lowest substitution levels(Fe/(Fe+Al)=0.001) the g=2 line is sharp and has a weak, broad side-band at lowand high fields due to singularities of the other transitions |–5/2Ò ´ |–3/2Ò, |–3/2Ò´ |–1/2Ò, |1/2Ò ´ |3/2Ò, |3/2Ò ´ |5/2Ò. If there is more than one crystallographical Tsite or if the Fe3+ content is slightly increased, the g =2 line broadens and the weakside bands are not observed anymore.When Fe-sodalite was synthesized with anFe source enriched in 57Fe, the 57Fe hyperfine splitting constant of 28.7 MHz(10–3 T or 9.6¥10–4 cm–1) was determined by ENDOR.
Several other lines were also reported in the Fe3+ ESR spectra of molecularsieves. After solid-state ion exchange of FeCl3-HZSM-5 Kucherov and Slinkinobserved up to 7 different signals in the low field region with g-values in therange 9.1–3.4 [55]. In a ferrisilicate three signals with g=4.25, 5.2 and 7.9 wereobserved. When FAPO-5 and ferrisilicalite are hydrothermally synthesized withvery low Fe contents (Fe/(Al+P)=1/1000–1/2000; Fe/Si=1/200–1/100) in order to avoidFe3+-Fe3+ interactions, the uptake of Fe in the solid, as measured by ESR matchesthe development of the crystallinity measured by XRD. Under these conditionsat least 5 different signals were observed in X-band ESR and only the relativeintensities of the signals vary upon reductive or oxidative treatments [56].
It is impossible to advance an interpretation for all these signals. Computerprograms are now available which allow full matrix analysis of the ESR problemof Fe3+ instead of the usual perturbative approach. A set of theoretical spectracould be generated for comparison with experimental data [57]. On the other
Electron Spin Resonance Spectroscopy 317
hand, it is clear that the chemistry of Fe3+ in molecular sieves is extremely com-plicated, both in the synthesis mixtures and on ion exchange sites.We must strivetowards very simple chemistry so as to obtain relatively simple spectra which areamenable to theoretical analysis or detailed spectroscopic analysis. Goldfarb etal. [53, 54] have shown the way.
3.1.3Cr5+ and Cr3+
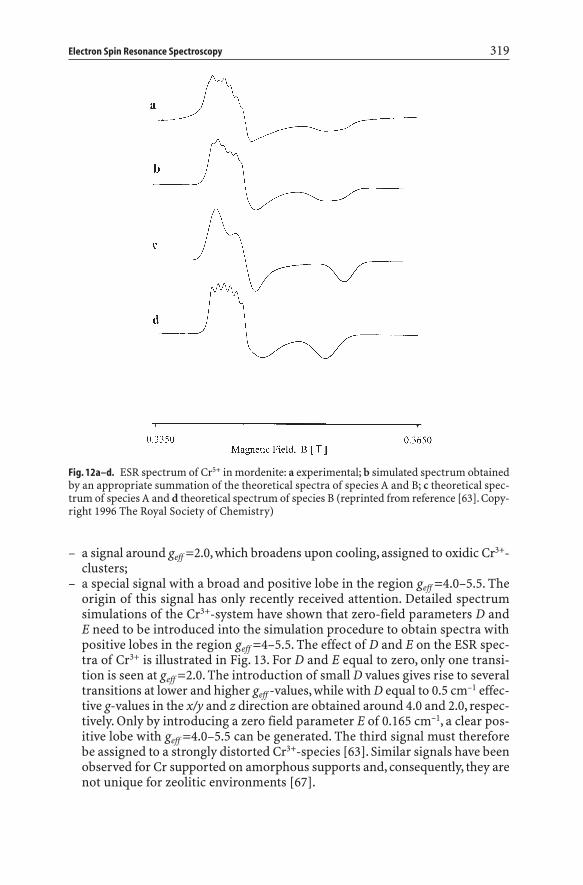
Cr5+ (d1) ESR signals have always axial or rhombic symmetry and typical g-val-ues of zeolitic Cr5+ are given in Table 3. On this basis, the signals are assigned tosquare pyramidal and pseudo-tetrahedral chromyl cations on well-defined ionexchange sites [58–62]. Cr5+ in mordenite-type molecular sieves is an interestingexample since it is characterized by a complex ESR spectrum (Fig. 12) possess-ing two rhombic signals with one exhibiting Al superhyperfine splitting(species B). The simulated spectrum, together with the individual components Aand B, is also shown in Fig. 12, and is very close to the experimental one [63].Species A is assigned to Cr5+-ions present at the junction of the main channel andthe side pocket, while species B is located near framework aluminum in the mainchannel of mordenite molecular sieves [64]. Such detailed level of understand-ing can only be obtained by using specific probe molecules, such as ammonia andpyridine, and also underlines the important role of spectrum simulations.
Three distinguished Cr3+ (d3) ESR signals are observed in molecular sieves,independently of their type and composition [63–66]:
– a broad signal around geff =2.0, which follows the Curie-Weiss law, assigned tohexaquo Cr3+ complexes;
318 B.M. Weckhuysen et al.
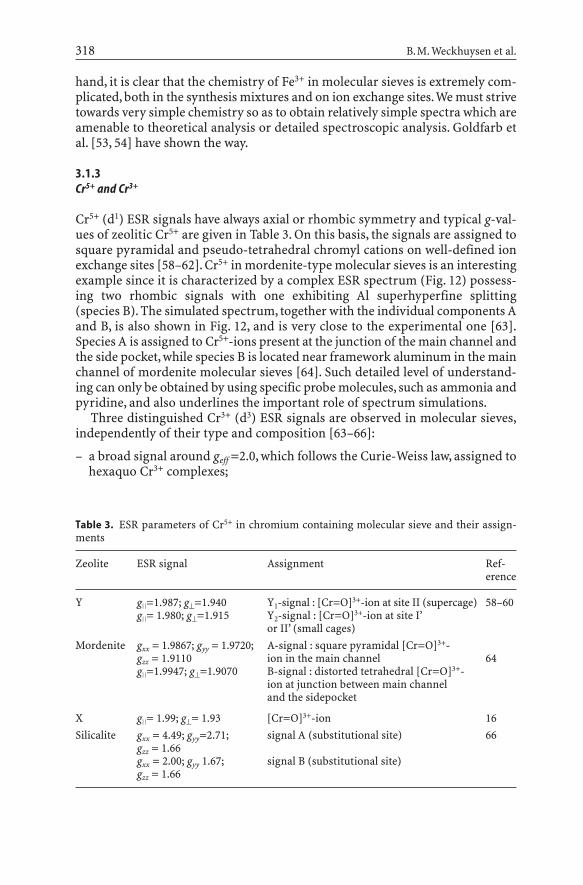
Table 3. ESR parameters of Cr5+ in chromium containing molecular sieve and their assign-ments
Zeolite ESR signal Assignment Ref-erence
Y g=1.987; g^=1.940 Y1-signal : [Cr=O]3+-ion at site II (supercage) 58–60g= 1.980; g^=1.915 Y2-signal : [Cr=O]3+-ion at site I’
or II’ (small cages)Mordenite gxx = 1.9867; gyy = 1.9720; A-signal : square pyramidal [Cr=O]3+-
gzz = 1.9110 ion in the main channel 64g=1.9947; g^=1.9070 B-signal : distorted tetrahedral [Cr=O]3+-
ion at junction between main channel and the sidepocket
X g= 1.99; g^= 1.93 [Cr=O]3+-ion 16Silicalite gxx = 4.49; gyy=2.71; signal A (substitutional site) 66
gzz = 1.66gxx = 2.00; gyy 1.67; signal B (substitutional site)gzz = 1.66
– a signal around geff =2.0, which broadens upon cooling, assigned to oxidic Cr3+-clusters;
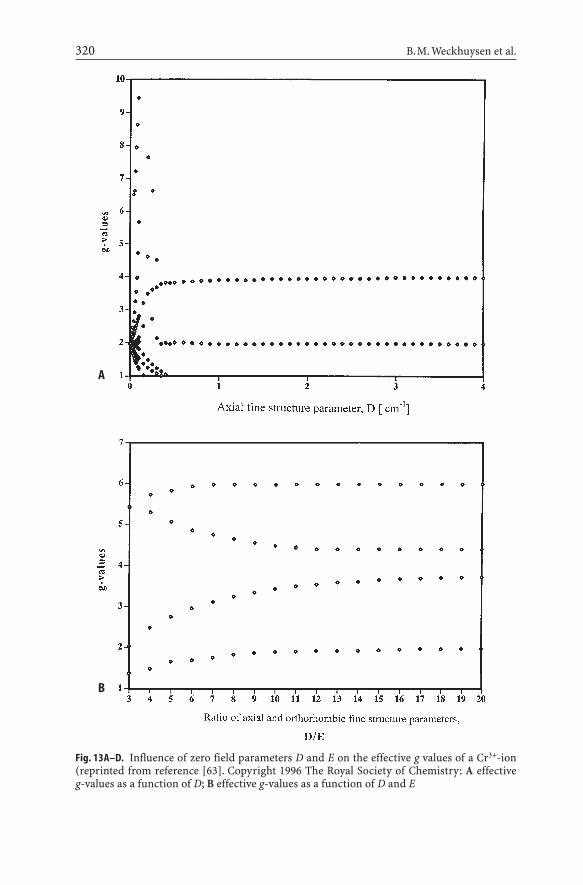
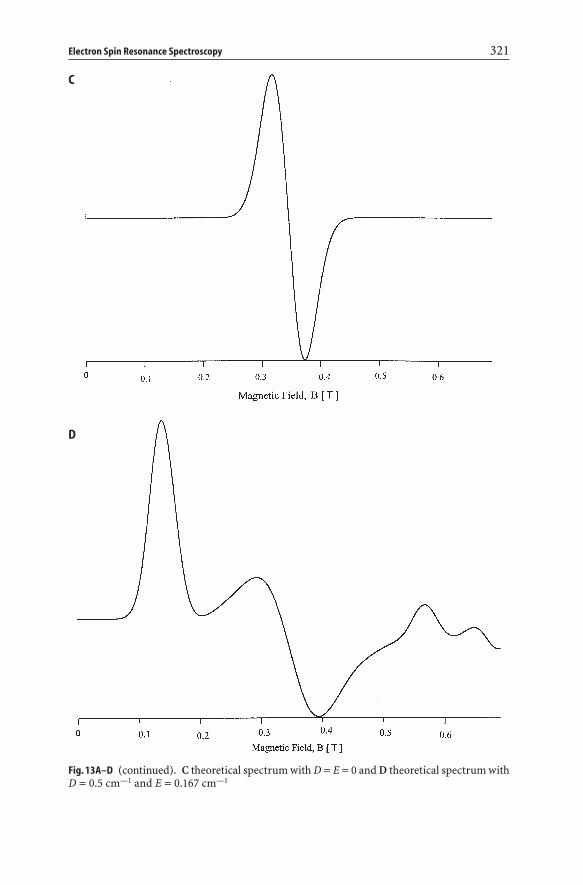
– a special signal with a broad and positive lobe in the region geff =4.0–5.5. Theorigin of this signal has only recently received attention. Detailed spectrumsimulations of the Cr3+-system have shown that zero-field parameters D andE need to be introduced into the simulation procedure to obtain spectra withpositive lobes in the region geff =4–5.5. The effect of D and E on the ESR spec-tra of Cr3+ is illustrated in Fig. 13. For D and E equal to zero, only one transi-tion is seen at geff =2.0. The introduction of small D values gives rise to severaltransitions at lower and higher geff -values, while with D equal to 0.5 cm–1 effec-tive g-values in the x/y and z direction are obtained around 4.0 and 2.0, respec-tively. Only by introducing a zero field parameter E of 0.165 cm–1, a clear pos-itive lobe with geff =4.0–5.5 can be generated. The third signal must thereforebe assigned to a strongly distorted Cr3+-species [63]. Similar signals have beenobserved for Cr supported on amorphous supports and, consequently, they arenot unique for zeolitic environments [67].
Electron Spin Resonance Spectroscopy 319
Fig. 12a–d. ESR spectrum of Cr5+ in mordenite: a experimental; b simulated spectrum obtainedby an appropriate summation of the theoretical spectra of species A and B; c theoretical spec-trum of species A and d theoretical spectrum of species B (reprinted from reference [63]. Copy-right 1996 The Royal Society of Chemistry)
320 B.M. Weckhuysen et al.
A
Fig. 13A–D. Influence of zero field parameters D and E on the effective g values of a Cr3+-ion(reprinted from reference [63]. Copyright 1996 The Royal Society of Chemistry: A effective g-values as a function of D; B effective g-values as a function of D and E
B
Electron Spin Resonance Spectroscopy 321
Fig. 13A–D (continued). C theoretical spectrum with D = E = 0 and D theoretical spectrum withD = 0.5 cm—1 and E = 0.167 cm—1
C
D
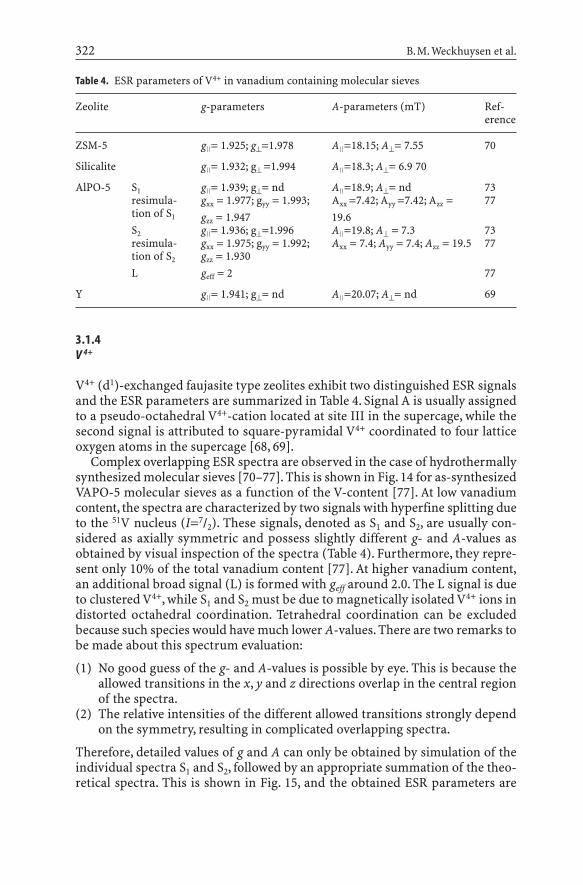
3.1.4V 4+
V4+ (d1)-exchanged faujasite type zeolites exhibit two distinguished ESR signalsand the ESR parameters are summarized in Table 4. Signal A is usually assignedto a pseudo-octahedral V4+-cation located at site III in the supercage, while thesecond signal is attributed to square-pyramidal V4+ coordinated to four latticeoxygen atoms in the supercage [68, 69].
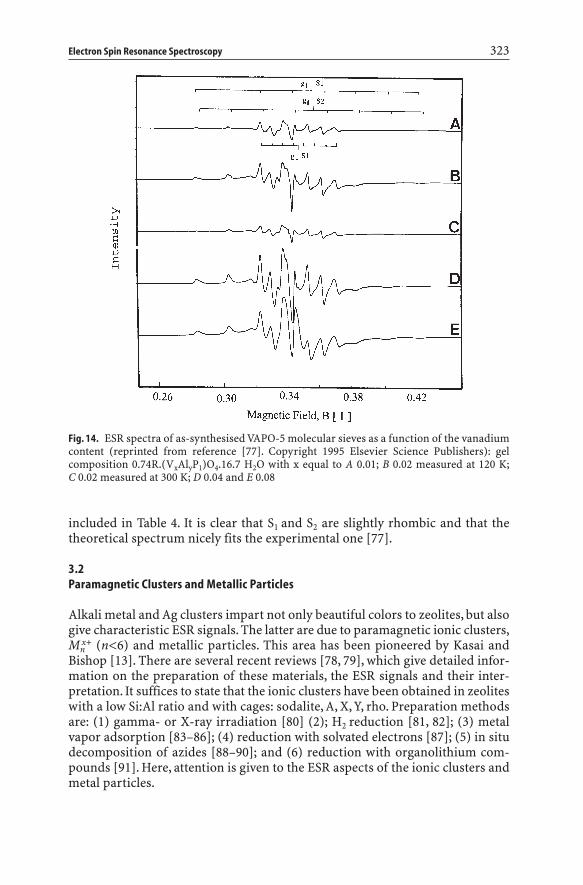
Complex overlapping ESR spectra are observed in the case of hydrothermallysynthesized molecular sieves [70–77]. This is shown in Fig. 14 for as-synthesizedVAPO-5 molecular sieves as a function of the V-content [77]. At low vanadiumcontent, the spectra are characterized by two signals with hyperfine splitting dueto the 51V nucleus (I=7/2). These signals, denoted as S1 and S2, are usually con-sidered as axially symmetric and possess slightly different g- and A-values asobtained by visual inspection of the spectra (Table 4). Furthermore, they repre-sent only 10% of the total vanadium content [77]. At higher vanadium content,an additional broad signal (L) is formed with geff around 2.0. The L signal is dueto clustered V4+, while S1 and S2 must be due to magnetically isolated V4+ ions indistorted octahedral coordination. Tetrahedral coordination can be excludedbecause such species would have much lower A-values. There are two remarks tobe made about this spectrum evaluation:
(1) No good guess of the g- and A-values is possible by eye. This is because theallowed transitions in the x, y and z directions overlap in the central regionof the spectra.
(2) The relative intensities of the different allowed transitions strongly dependon the symmetry, resulting in complicated overlapping spectra.
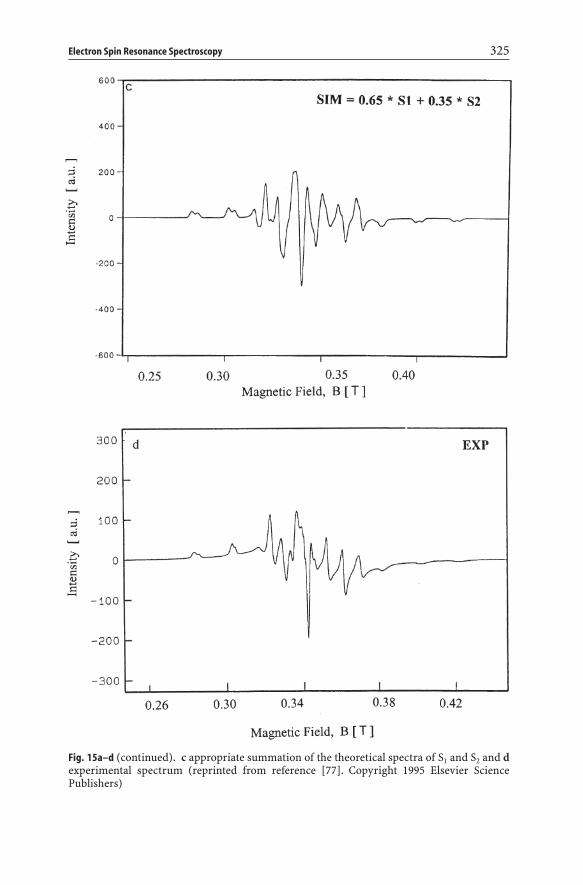
Therefore, detailed values of g and A can only be obtained by simulation of theindividual spectra S1 and S2, followed by an appropriate summation of the theo-retical spectra. This is shown in Fig. 15, and the obtained ESR parameters are
322 B.M. Weckhuysen et al.
Table 4. ESR parameters of V4+ in vanadium containing molecular sieves
Zeolite g-parameters A-parameters (mT) Ref-erence
ZSM-5 g= 1.925; g^=1.978 A=18.15; A^= 7.55 70
Silicalite g= 1.932; g^ =1.994 A=18.3; A^= 6.9 70
AlPO-5 S1 g= 1.939; g^= nd A=18.9; A^= nd 73resimula- gxx = 1.977; gyy = 1.993; Axx =7.42; Ayy =7.42; Azz = 77tion of S1 gzz = 1.947 19.6S2 g= 1.936; g^=1.996 A=19.8; A^ = 7.3 73resimula- gxx = 1.975; gyy = 1.992; Axx = 7.4; Ayy = 7.4; Azz = 19.5 77tion of S2 gzz = 1.930L geff = 2 77
Y g= 1.941; g^= nd A=20.07; A^= nd 69
included in Table 4. It is clear that S1 and S2 are slightly rhombic and that the theoretical spectrum nicely fits the experimental one [77].
3.2Paramagnetic Clusters and Metallic Particles
Alkali metal and Ag clusters impart not only beautiful colors to zeolites, but alsogive characteristic ESR signals. The latter are due to paramagnetic ionic clusters,Mn
x+ (n<6) and metallic particles. This area has been pioneered by Kasai andBishop [13]. There are several recent reviews [78, 79], which give detailed infor-mation on the preparation of these materials, the ESR signals and their inter-pretation. It suffices to state that the ionic clusters have been obtained in zeoliteswith a low Si:Al ratio and with cages: sodalite, A, X, Y, rho. Preparation methodsare: (1) gamma- or X-ray irradiation [80] (2); H2 reduction [81, 82]; (3) metalvapor adsorption [83–86]; (4) reduction with solvated electrons [87]; (5) in situdecomposition of azides [88–90]; and (6) reduction with organolithium com-pounds [91]. Here, attention is given to the ESR aspects of the ionic clusters andmetal particles.
Electron Spin Resonance Spectroscopy 323
Fig. 14. ESR spectra of as-synthesised VAPO-5 molecular sieves as a function of the vanadiumcontent (reprinted from reference [77]. Copyright 1995 Elsevier Science Publishers): gel composition 0.74R.(VxAlyP1)O4.16.7 H2O with x equal to A 0.01; B 0.02 measured at 120 K;C 0.02 measured at 300 K; D 0.04 and E 0.08
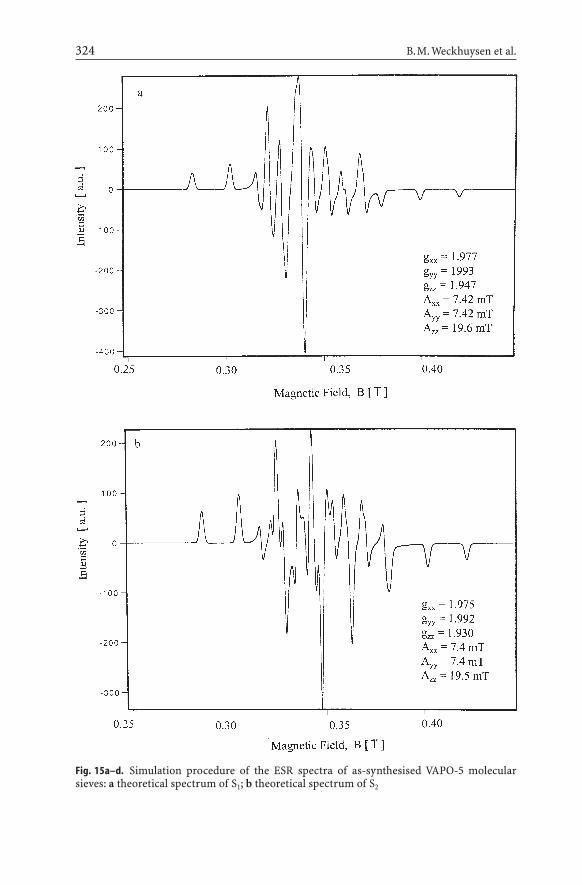
Fig. 15a–d. Simulation procedure of the ESR spectra of as-synthesised VAPO-5 molecularsieves: a theoretical spectrum of S1; b theoretical spectrum of S2
324 B.M. Weckhuysen et al.
Electron Spin Resonance Spectroscopy 325
Fig. 15a–d (continued). c appropriate summation of the theoretical spectra of S1 and S2 and dexperimental spectrum (reprinted from reference [77]. Copyright 1995 Elsevier Science Publishers)
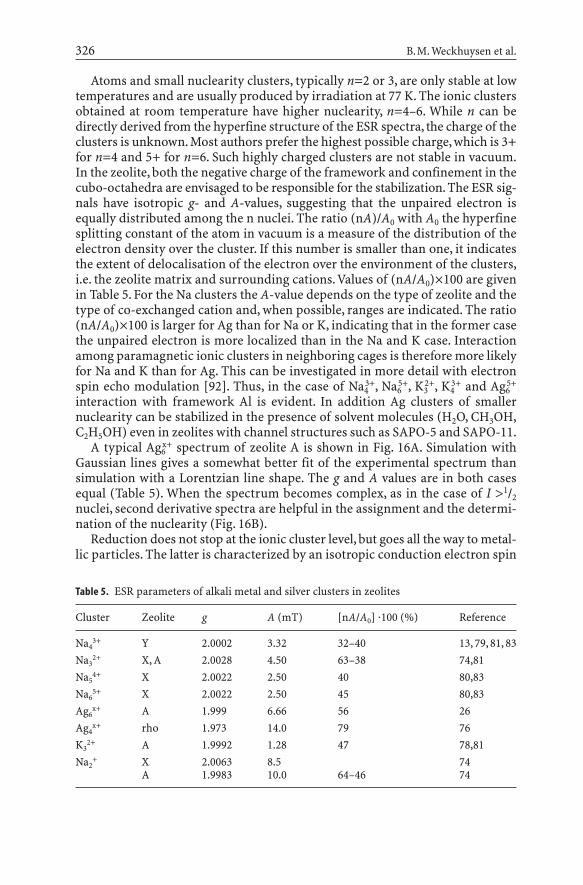
Atoms and small nuclearity clusters, typically n=2 or 3, are only stable at lowtemperatures and are usually produced by irradiation at 77 K. The ionic clustersobtained at room temperature have higher nuclearity, n=4–6. While n can bedirectly derived from the hyperfine structure of the ESR spectra, the charge of theclusters is unknown. Most authors prefer the highest possible charge, which is 3+for n=4 and 5+ for n=6. Such highly charged clusters are not stable in vacuum.In the zeolite, both the negative charge of the framework and confinement in thecubo-octahedra are envisaged to be responsible for the stabilization. The ESR sig-nals have isotropic g- and A-values, suggesting that the unpaired electron isequally distributed among the n nuclei. The ratio (nA)/A0 with A0 the hyperfinesplitting constant of the atom in vacuum is a measure of the distribution of theelectron density over the cluster. If this number is smaller than one, it indicatesthe extent of delocalisation of the electron over the environment of the clusters,i.e. the zeolite matrix and surrounding cations.Values of (nA/A0)¥100 are givenin Table 5. For the Na clusters the A-value depends on the type of zeolite and thetype of co-exchanged cation and, when possible, ranges are indicated. The ratio(nA/A0)¥100 is larger for Ag than for Na or K, indicating that in the former casethe unpaired electron is more localized than in the Na and K case. Interactionamong paramagnetic ionic clusters in neighboring cages is therefore more likelyfor Na and K than for Ag. This can be investigated in more detail with electronspin echo modulation [92]. Thus, in the case of Na4
3+, Na65+, K3
2+, K43+ and Ag6
5+
interaction with framework Al is evident. In addition Ag clusters of smallernuclearity can be stabilized in the presence of solvent molecules (H2O, CH3OH,C2H5OH) even in zeolites with channel structures such as SAPO-5 and SAPO-11.
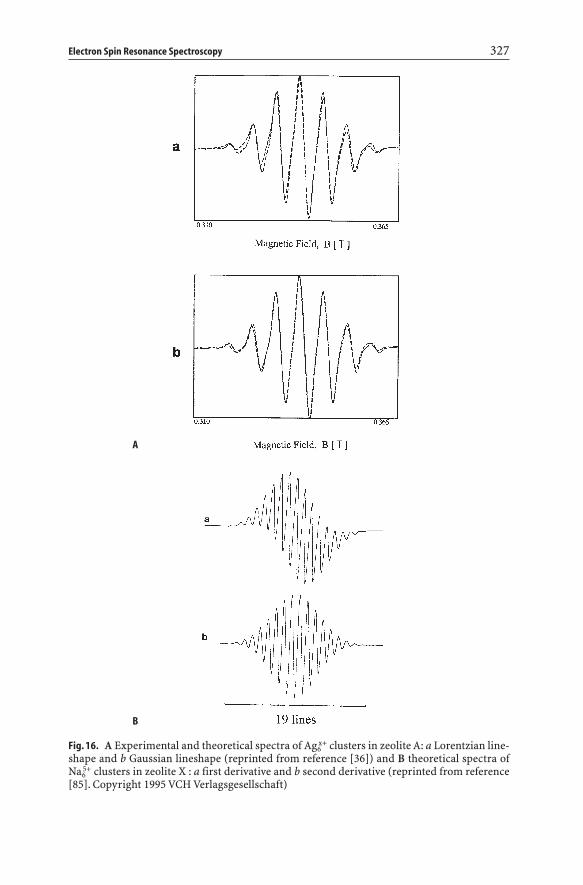
A typical Ag6x+ spectrum of zeolite A is shown in Fig. 16A. Simulation with
Gaussian lines gives a somewhat better fit of the experimental spectrum thansimulation with a Lorentzian line shape. The g and A values are in both casesequal (Table 5). When the spectrum becomes complex, as in the case of I >1/2nuclei, second derivative spectra are helpful in the assignment and the determi-nation of the nuclearity (Fig. 16B).
Reduction does not stop at the ionic cluster level, but goes all the way to metal-lic particles. The latter is characterized by an isotropic conduction electron spin
326 B.M. Weckhuysen et al.
Table 5. ESR parameters of alkali metal and silver clusters in zeolites
Cluster Zeolite g A (mT) [nA/A0] ·100 (%) Reference
Na43+ Y 2.0002 3.32 32–40 13, 79, 81, 83
Na32+ X, A 2.0028 4.50 63–38 74,81
Na54+ X 2.0022 2.50 40 80,83
Na65+ X 2.0022 2.50 45 80,83
Ag6x+ A 1.999 6.66 56 26
Ag4x+ rho 1.973 14.0 79 76
K32+ A 1.9992 1.28 47 78,81
Na2+ X 2.0063 8.5 74
A 1.9983 10.0 64–46 74
Electron Spin Resonance Spectroscopy 327
Fig. 16. A Experimental and theoretical spectra of Ag6x+ clusters in zeolite A: a Lorentzian line-
shape and b Gaussian lineshape (reprinted from reference [36]) and B theoretical spectra ofNa6
5+ clusters in zeolite X : a first derivative and b second derivative (reprinted from reference[85]. Copyright 1995 VCH Verlagsgesellschaft)
A
B
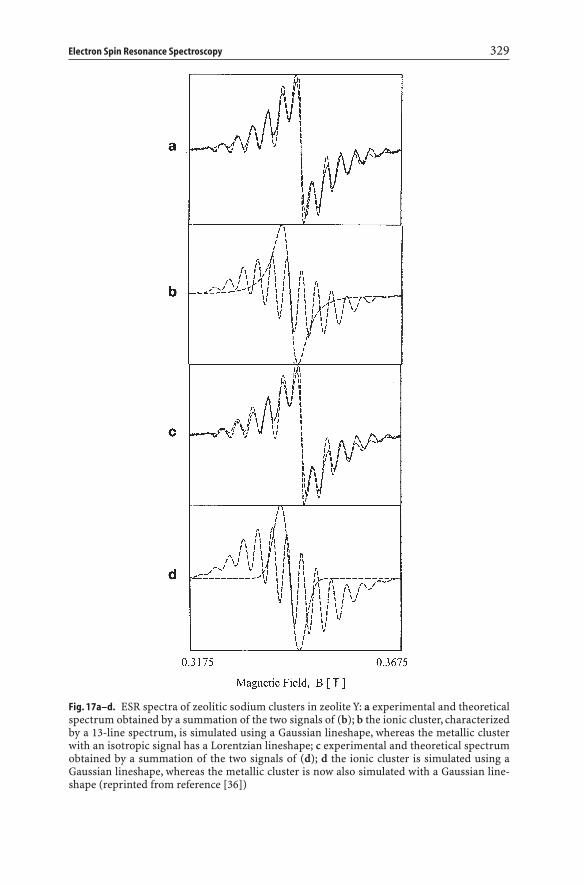
resonance (cesr) line. In many cases this line overlaps with that of the ionic clus-ters. A quantitative separation of both lines is only possible by simulation. Thisis illustrated in Fig. 17 for the sodium case. The spectra are composed of Na4
3+ andthe cesr signal of metallic Na particles. In one case the relative contribution of theisotropic signal is 47%, in the other case 17%. The g and A values are tabulatedin Table 6. It is clear that such data can only be obtained by spectral simulation,as visual inspection of the experimental spectra hardly reveals any differences.
The interpretation of the cesr signals in terms of particle size has not beenattempted. All the authors notice Curie-Weiss behavior, which is indicative ofquantum-sized particles [87, 89]. One is tempted to locate these particles in thesupercages. The maximum diameter is then around 1.2 nm, which correspondsto 630 Li, 252 Na, 88 K, 71 Rb or 48 Cs atoms in a closed packed spherical arrange-ment. The line width, increasing with the size of the atom, is qualitativelyexplained by this decrease of the number of atoms per cluster. The g values areequal to or somewhat lower than the free electron values. The deviation isexplained by spin-orbit coupling effects and thus is more pronounced for theheavier elements (Table 6).
Edwards et al. have criticized the interpretation of the g=2 signal in terms ofquantum-sized metallic particles [78, 79, 84]. The Na signal can also be generatedby exchange coupling of unpaired electrons of Na4
3+ clusters in neighboring cubo-octahedra. This is not unreasonable in view of the small [nA/A0] values of Table 5.The g=2 signal is seen at a sodium loading below occupation of all cubo-octa-hedra with Na4
3+, suggesting a clustering of Na43+ instead of random distribution
over available cubo-octahedra. Even Li-atoms cannot freely migrate through asix-ring into the cubo-octahedra to form the paramagnetic ionic clusters [87].Thus, formation of an ionic cluster requires electron transfer from an atom in thesupercage via the zeolitic lattice to the cations in the sodalite cage. Secondly, theremust be enough cations present in the cubo-octahedra to form the cluster. If thelatter is not the case, cations must migrate to the sodalite cage and this cationmigration will be the rate-determining step in the ionic cluster formation.Schoonheydt and Leeman found an activation energy of 47–63 kJ · mol–1 for Ag6
x+
formation in zeolite A [81]. Kuranova produced the same clusters by g-irradia-tion and found a complex cluster formation mechanism with activation energiesin the range 19–30 kJ · mol–1 and rate constants of 58–5300¥10–6 s–1 at 293 K [91].Because of the two different cluster production techniques the activation ener-gies might not be comparable, but both point to cationic migration [93]. Clearly,research into the mechanism and kinetics of cluster formation is valuable andpromising.
3.3Paramagnetic Molecules
Molecular sieves can be used to isolate and to store stable paramagnetic mole-cules. These stable radicals can then be used to study Lewis acidity and exchange-able cations. We will limit our discussion to ESR studies of NO as a probe mole-cule. Details about the ESR results of other paramagnetic molecules, like NO2, NF2and ClO2 can be found in a review of Kasai and Bishop [13].
328 B.M. Weckhuysen et al.
Electron Spin Resonance Spectroscopy 329
Fig. 17a–d. ESR spectra of zeolitic sodium clusters in zeolite Y: a experimental and theoreticalspectrum obtained by a summation of the two signals of (b); b the ionic cluster, characterizedby a 13-line spectrum, is simulated using a Gaussian lineshape, whereas the metallic clusterwith an isotropic signal has a Lorentzian lineshape; c experimental and theoretical spectrumobtained by a summation of the two signals of (d); d the ionic cluster is simulated using aGaussian lineshape, whereas the metallic cluster is now also simulated with a Gaussian line-shape (reprinted from reference [36])
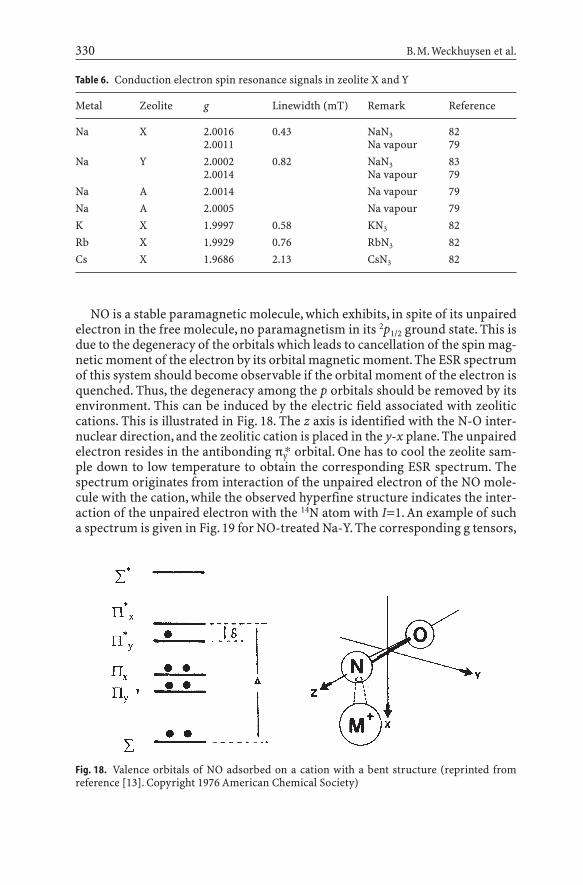
NO is a stable paramagnetic molecule, which exhibits, in spite of its unpairedelectron in the free molecule, no paramagnetism in its 2p1/2 ground state. This isdue to the degeneracy of the orbitals which leads to cancellation of the spin mag-netic moment of the electron by its orbital magnetic moment. The ESR spectrumof this system should become observable if the orbital moment of the electron isquenched. Thus, the degeneracy among the p orbitals should be removed by itsenvironment. This can be induced by the electric field associated with zeoliticcations. This is illustrated in Fig. 18. The z axis is identified with the N-O inter-nuclear direction, and the zeolitic cation is placed in the y-x plane. The unpairedelectron resides in the antibonding py* orbital. One has to cool the zeolite sam-ple down to low temperature to obtain the corresponding ESR spectrum. Thespectrum originates from interaction of the unpaired electron of the NO mole-cule with the cation, while the observed hyperfine structure indicates the inter-action of the unpaired electron with the 14N atom with I=1. An example of sucha spectrum is given in Fig. 19 for NO-treated Na-Y. The corresponding g tensors,
330 B.M. Weckhuysen et al.
Table 6. Conduction electron spin resonance signals in zeolite X and Y
Metal Zeolite g Linewidth (mT) Remark Reference
Na X 2.0016 0.43 NaN3 822.0011 Na vapour 79
Na Y 2.0002 0.82 NaN3 832.0014 Na vapour 79
Na A 2.0014 Na vapour 79Na A 2.0005 Na vapour 79K X 1.9997 0.58 KN3 82Rb X 1.9929 0.76 RbN3 82Cs X 1.9686 2.13 CsN3 82
Fig. 18. Valence orbitals of NO adsorbed on a cation with a bent structure (reprinted from reference [13]. Copyright 1976 American Chemical Society)
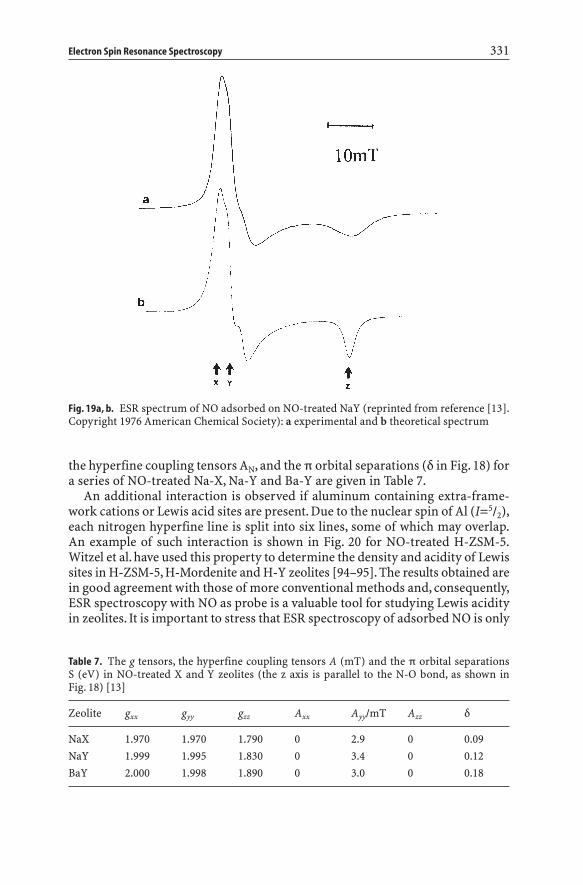
the hyperfine coupling tensors AN, and the p orbital separations (d in Fig. 18) fora series of NO-treated Na-X, Na-Y and Ba-Y are given in Table 7.
An additional interaction is observed if aluminum containing extra-frame-work cations or Lewis acid sites are present. Due to the nuclear spin of Al (I=5/2),each nitrogen hyperfine line is split into six lines, some of which may overlap.An example of such interaction is shown in Fig. 20 for NO-treated H-ZSM-5.Witzel et al. have used this property to determine the density and acidity of Lewissites in H-ZSM-5, H-Mordenite and H-Y zeolites [94–95]. The results obtained arein good agreement with those of more conventional methods and, consequently,ESR spectroscopy with NO as probe is a valuable tool for studying Lewis acidityin zeolites. It is important to stress that ESR spectroscopy of adsorbed NO is only
Electron Spin Resonance Spectroscopy 331
Fig. 19a, b. ESR spectrum of NO adsorbed on NO-treated NaY (reprinted from reference [13].Copyright 1976 American Chemical Society): a experimental and b theoretical spectrum
Table 7. The g tensors, the hyperfine coupling tensors A (mT) and the p orbital separations S (eV) in NO-treated X and Y zeolites (the z axis is parallel to the N-O bond, as shown in Fig. 18) [13]
Zeolite gxx gyy gzz Axx Ayy/mT Azz d
NaX 1.970 1.970 1.790 0 2.9 0 0.09NaY 1.999 1.995 1.830 0 3.4 0 0.12BaY 2.000 1.998 1.890 0 3.0 0 0.18
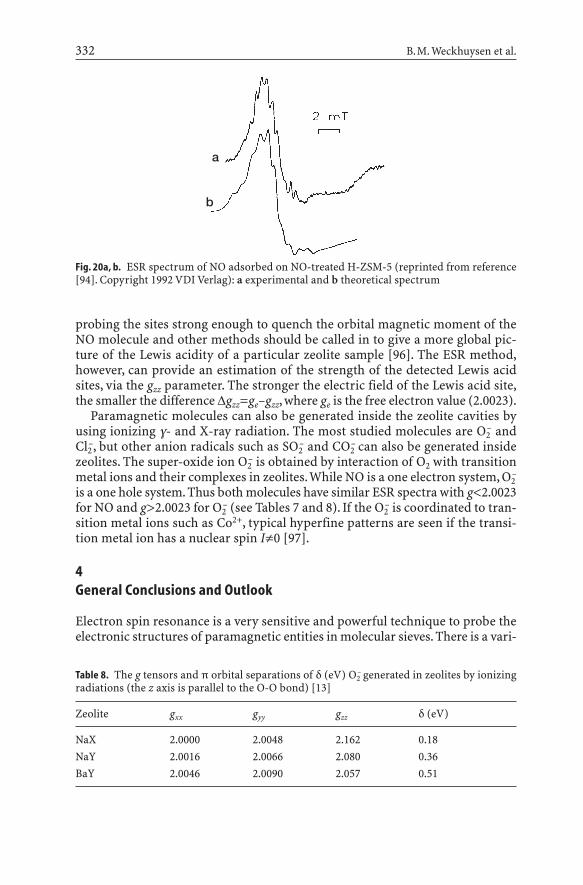
probing the sites strong enough to quench the orbital magnetic moment of theNO molecule and other methods should be called in to give a more global pic-ture of the Lewis acidity of a particular zeolite sample [96]. The ESR method,however, can provide an estimation of the strength of the detected Lewis acidsites, via the gzz parameter. The stronger the electric field of the Lewis acid site,the smaller the difference Dgzz=ge–gzz, where ge is the free electron value (2.0023).
Paramagnetic molecules can also be generated inside the zeolite cavities byusing ionizing g- and X-ray radiation. The most studied molecules are O2
– andCl2
–, but other anion radicals such as SO2– and CO2
– can also be generated insidezeolites. The super-oxide ion O2
– is obtained by interaction of O2 with transitionmetal ions and their complexes in zeolites.While NO is a one electron system, O2
–
is a one hole system. Thus both molecules have similar ESR spectra with g<2.0023for NO and g>2.0023 for O2
– (see Tables 7 and 8). If the O2– is coordinated to tran-
sition metal ions such as Co2+, typical hyperfine patterns are seen if the transi-tion metal ion has a nuclear spin Iπ0 [97].
4General Conclusions and Outlook
Electron spin resonance is a very sensitive and powerful technique to probe theelectronic structures of paramagnetic entities in molecular sieves. There is a vari-
332 B.M. Weckhuysen et al.
Fig. 20a, b. ESR spectrum of NO adsorbed on NO-treated H-ZSM-5 (reprinted from reference[94]. Copyright 1992 VDI Verlag): a experimental and b theoretical spectrum
Table 8. The g tensors and p orbital separations of d (eV) O2– generated in zeolites by ionizing
radiations (the z axis is parallel to the O-O bond) [13]
Zeolite gxx gyy gzz d (eV)
NaX 2.0000 2.0048 2.162 0.18NaY 2.0016 2.0066 2.080 0.36BaY 2.0046 2.0090 2.057 0.51
a
b
ety of ESR techniques available, each with their particular advantages and limi-tations. CW X-band ESR spectroscopy is the most popular technique because ofits availability, although there is now an increasing use of more advanced tech-niques such as ENDOR and ESEEM. In addition, multi-frequency and high fre-quency ESR, such as CW W-band ESR, will be very useful in detailed analysis ofcoordination environments of transition metal ions.
The various ESR techniques can be applied at different levels of sophistication:from merely detecting the presence of paramagnetic species over the determi-nation of the first coordination sphere around the paramagnetic center up to adetailed description of the electronic structure. Whatever level is being consid-ered, it is important that the user realizes both the potential and the limitationsof the particular technique. Over-interpretation should certainly be avoided. Thisholds equally so for under-interpretation, if with some extra effort (e.g. spectrumsimulations), more physically meaningful information can be extracted from theexperimental spectra. The systematic and intelligent application of ESR and itsrelated techniques will therefore lead in the future to a better understanding ofparamagnetic entities in molecular sieves.
Acknowledgments. BMW acknowledges the Fund for Scientific Research – Flanders (FWO-Flanders) for financial support over the past years. Part of the work reported was supportedby the Concerted Research Action and by research grants from the FWO-Flanders.
5References
1. Abragam A, Bleaney B (1970) Electron paramagnetic resonance of transition metal ions.Clarendon Press, Oxford
2. Pilbrow JR (1990) Transition Ion Electron Paramagnetic Resonance. Clarendon Press,Oxford
3. Atherton NM (1973) Electron spin resonance, theory and applications. Ellis Horwood,Chichester
4. Wertz JE, Bolton JR (1986) Electron spin resonance, elementary theory and practical appli-cations. Chapman and Hall, New York
5. Mabbs FE, Collison D (1992) Electron Paramagnetic Resonance of Transition Metal Compounds. Elsevier, Amsterdam
6. Poole CP (1967) Electron spin resonance: a comprehensive treatise on experimental techniques. Interscience Publishers, a division of John Wiley, New York
7. Wilmshurst TH (1967) Electron spin resonance spectrometers. Hilger, London8. Weckhuysen BM,Van Der Voort P, Catana G (eds) (2000) Spectroscopy of transition metal
ions on surfaces. Leuven University Press, Leuven9. Hyde JS, Froncisz W (1981) Specialist Periodical Reports: Electron Spin Resonance. Royal
Society of Chemistry, Vol 1010. Vedrine JC (1984) In: Delannay F (ed) Characterization of Heterogeneous Catalysts.
Marcel Dekker, New York, p 16111. Mabbs FE (1993) Chem Soc Rev: 31412. Lunsford JH (1972) Adv Catal 22:26513. Kasai PH., Bishop RJ (1976) In: Rabo JA (ed) Zeolite Chemistry and Catalysis. ACS Mono-
graph 171, American Chemical Society, Washington, DC, p 35014. McGarvey BR (1966) Transit Metal Chem 3:8915. Weber RT (1992) ESP 300 E EPR Spectrometer User’s Manual, Bruker Instruments, Inc,
Billerica, Massachusetts, USA
Electron Spin Resonance Spectroscopy 333
16. Weckhuysen BM, Schoonheydt RA (1994) Stud Surf Sci Catal 84:96517. Schweiger A (1991) Angew Chem 103:22318. Mims WB (1972) In: Geschwind S (ed) Electron Paramagnetic Resonance. Plenum Press,
New York 4:26319. Heming M (1987) Z Phys Chem Neue Folge 151:3520. Mehring M (1987) Z Phys Chem Neue Folge 151:121. Martini G (1990) Colloids and Surfaces 45:8322. Kevan L, Bowman MK (1990) Modern Pulsed and Continuous Wave Electron Spin Reso-
nance. Wiley, New York23. Drago RA (1997) Physical Methods in Chemistry. E.B. Saunders Comp., Philadelphia, p 31924. Ingram DJE (1956) Free Radicals Studied by Electron Spin Resonance. Butterworths, Lon-
don, p 9525. Dedecek J, Sobalik Z, Tvaruzkova Z, Kaucky D, Wichterlova B (1995) J Phys Chem 99:
1632726. Schoonheydt RA (1993) Catal Rev-Sci Eng 35:12927. Packet D (1987) PhD Thesis, Faculty of Applied Biological Sciences Nr 151, KULeuven28. De Tavernier S (1989) PhD Thesis, Faculty of Applied Biological Sciences Nr 182, KULeu-
ven29. Schoonheydt RA (1989) J Phys Chem Solids 50:52330. Chen X, Kevan L (1991) J. Am. Chem. Soc. 113:286131. Lee CW, Chen X, Kevan L (1992) Catal Lett 15:7532. Lee CW, Chen X, Kevan L (1991) J Phys Chem 95:862633. Lee CW, Chen X, Kevan L (1992) J Phys Chem 96:35834. Lee CW, Brouet G, Chen X, Kevan L (1993) Zeolites 13:56535. Lee CW, Kevan L (1994) Zeolites 14:26736. Uyttterhoeven M (1989) Optimalisatie van ESR poederspektra, Master of Engineering
thesis, KULeuven;37. Uytterhoeven MG, Schoonheydt RA (1991) In: Jacobs PA, Jaeger NI, Kubelkov, L,Wichterlov
B (eds) Zeolite Chemistry and Catalysis, Proc. Int. Symp., Prague, Szecho-Slovakia, Sept.8–13, 1991 Elsevier, Amsterdam, 1991; Stud Surf Sci Catal 69:443
38. Heidler R, Janssens GOA, Mortier WJ, Schoonheydt RA (1996) J Phys Chem 100:1972839. Pierloot K, Delabie A, Ribbing C,Verberckmoes AA, Schoonheydt RA (1998) J Phys Chem
102:1078940. Delabie A, Pierloot K, Groothaert MH,Weckhuysen BM, Schoonheydt RA (2000) Micropor
Mesopor Mater 37:20941. Pierloot K, Delabie A, Groothaert MH, Schoonheydt RA (2001) Phys Chem Chem Phys
3:217442. Sass CE, Kevan L (1988) J Phys Chem 32:519243. Anderson MW, Kevan L (1987) J Phys Chem 91:292644. Brown DR, Kevan L (1988) J Phys Chem 92:197145. Poppl A, Baglioni P, Kevan L (1995) J Phys Chem 99:1415646. Poppl A, Hartmann M, Kevan L (1995) J Phys Chem 99:1725147. Weckhuysen BM, Verberckmoes AA, Vannijvel IP, Pelgrims JA, Buskens PL, Jacobs PA,
Schoonheydt RA (1995) Angew Chem Int Ed Engl 34:2652; Weckhuysen BM,VerberckmoesAA, Fu L, Schoonheydt RA (1996) J Phys Chem 100:9456
48. Grommen R, Manikandan P, Gao Y, Shane T, Shane JJ, Schoonheydt RA, Weckhuysen BM,Goldfarb D (2000) J Am Chem Soc 122:11488
49. McNicol BD, Pott GT (1972) J Catal 25:22350. Derouane EG, Mestdagh M, Vielvoye I (1974) J Catal 33:16951. Ratnasami P, Kumar R (1991) Catal Today 9, 32852. Lin DH, Coudurier G,Vedrine J (1989) In: Jacobs PA, van Santen, R (eds) Zeolites: Facts, Fig-
ures and Future, Proc 8th Int Zeolite Conf, Amsterdam, The Netherlands, July 10–14 1989Elsevier, Amsterdam; Stud Surf Sci Catal 49:1431
53. Goldfarb D, Bernardo M, Strohmaier KG, Vaughan DEW, Thomann H (1994) J Am ChemSoc 116:6344
334 B.M. Weckhuysen et al.
54. Goldfarb D, Bernardo M, Strohmaier KG,Vaughan DEW, Thomann H (1994) Stud Surf SciCatal 84:403
55. Kucherov AV, Slinkin AA (1988) Zeolites 8:11056. Catana G, Pelgrims J, Schoonheydt RA (1995) Zeolites 15:47557. Uytterhoeven M (1995) PhD Thesis, Faculty of Applied Biological Sciences Nr 293, KU
Leuven58. Hemidy JF, Delavennat F, Cornet D (1973) J Chim Phys 11–12:171659. Hemidy JF, Goupil JM, Cornet D (1977) J Chim Phys 7:7160. Hemidy JF, Cornet D (1974) J Chim Phys 5:73961. Pearce JR, Sherwood DE, Hall MB, Lunsford JH (1980) J Phys Chem 84:321562. Kucherov AV, Slinkin AA (1994) J Mol Catal 90:32363. Weckhuysen BM, Schoonheydt RA, Mabbs FE, Collison D (1996) J Chem Soc Faraday Trans
92:243164. Huang M, Deng Z, Wang Q (1990) Zeolites 10:27265. Weckhuysen BM, Schoonheydt RA (1994) Zeolites 14:36066. Nakumura O, Mambrim JS, Pastore HO, Vichi EJS, Gandra FG, Silva EC, Vargas H, Pelzi J
(1992) J Chem Soc Faraday Trans 88:207167. Weckhuysen BM, Wachs IE, Schoonheydt RA (1996) Chem Rev 96:332768. Martini G, Ottaviani MF, Servavalli GL (1975) J Phys Chem 79:171669. Fricke R, Selenina M, Schnabel KH (1976) Z Phys Chemie, Leipzig Z57:96870. Whittington BI, Anderson JR (1993) J Phys Chem 97:103271. Centi G, Perathorer S, Trifiro F,Aboukais A,Aissi CF, Guelton M (1992) J Phys Chem 96:261772. Petras M, Wichterlova B (1992) J Phys Chem 96:180573. Rigutto MS, van Bekkum H (1993) J Mol Catal 81:7774. Montes C, Davis ME, Murray B, Naryana M (1990) J Phys Chem 94:642575. Jhung SH, Uh YS, Chon H (1990) Appl Catal 62:6176. Rao PRHP, Ramaswamy AV, Ratnasamy P (1992) J Catal 137:22577. Weckhuysen BM, Vannijvel IP, Schoonheydt RA (1995) Zeolites 15:48278. Edwards PP, Woodall LJ, Anderson PA, Armstrong AR, Slaski M (1993) Chem Soc Rev:30579. Edward PP, Anderson PA, Thomas JM (1996) Acc Chem Res 29:2380. Liu X, Thomas JK (1992) Chem Phys Lett 192:55581. Schoonheydt RA, Leeman H (1989) J Phys Chem 93:204882. Xu B, Kevan L (1991) J Phys Chem 95:114783. Anderson PA, Singer RJ, Edwards PP (1991) J Chem Soc Chem Commun: 91484. Anderson PA, Edwards PP (1992) J Am Chem Soc 114:1060885. Anderson PA, Edwards PP (1991) J Chem Soc Chem Comm:91586. Anderson PA, Barr D, Edwards PP (1991) Angew Chem 103:151187. Xu B, Kevan L (1992) J Phys Chem 96:264288. Grobet PJ, Martens LRM, Vermeiren WJH, Huybrechts, DRC, Jacobs PA (1989) Z Phys D –
Atoms, Molecules, Clusters 12:3789. Blazey KW, Muller KA, Blatter F, Schumacher E (1987) Europhysics Letters 4:85790. Yoon KB, Kochi JK (1988) J Chem Soc Chem Comm: 51091. Kuranova GA (1990) Russian J Phys Chem 64:83392. Michalik J, Wasowicz T, Sadlo J, Reijerse EJ, Kevan L (1995) Radiat Phys Chem 47:7593. Mortier WJ, Schoonheydt RA (1985) Progress Solid State Chem 16:194. Witzel F, Karge HG, Gutsze A (1993) Proc 9th Int Zeolite Conf, Montreal, Canada, July 5–10,
1992 (von Ballmoos R, Higgins JB, Treacy MMJ, eds) Butterworth-Heinemann, London, 28395. Gutsze A, Plato M, Karge HG, Witzel F (1996) J Chem Soc Faraday Trans 92:249596. Catana G, Baetens D, Mommaerts T, Schoonheydt RA,Weckhuysen BM (2001) J Phys Chem
B 105:490497. De Vos DE, Thibault-Starzyk F, Jacobs PA (1994) Angew Chem 106:447
Electron Spin Resonance Spectroscopy 335