Embed Size (px)
Citation preview

Source of Acquisition NASA Goddad Space Flight Center
DETECTING TRENDS IN TROPICAL RAINFALL CHARACTERISTICS, 1979-2003 K. M. Lau and H. T. Wu
Laboratory for Atmospheres NASNGoddard Space Flight Center
Popular Summary
The recent scientific debate on the relationship between increased hurricane intensity, such as Katrina, and global warming, stems mainly from the difficulty in detecting long-term trends from short-term climate records. It is noteworthy that this debate is raging on, amidst a backdrop of anecdotal evidences of increasing occurrence of a myriad of extreme weather and climate events from flash flood in East Asia, extreme heavy monsoon rainfall in South Asia, prolonged drought in Africa, and severe cold winters in North America, devastating heat wave and flooding in Europe, to reduction in cloud amount in the tropics, and radar observations of different drop size distributions in rainfall in the Asian Pacific. Are these changes real? Why are they showing up now? Do they happen just by chance? Or are they telling us about fundamental changes in our climate system. So far no studies have been able to connect all these changes in a coherent way
In this paper, we address the issue of extreme weather from the point of view of trends of rainfall characteristics, i.e., extreme light, intermediate to extremely heavy events, in the tropics. Because more than half of the total area of the tropics is covered by oceans, quantitative rainfall estimates have to rely on satellite observations. However, satellite rainfall estimates have inherent large errors, because of uncertainties in the retrieval algorithms. For multi-decadal datasets, the problem is compounded by the amalgamation of data from different satellites which have different orbits, instruments and retrieval algorithms, that have to be merged to produce the long- term record.
We use two state-of-the-art global multi-decadal rainfall data set to examine the long-term trend of rainfall characteristics in the tropics: The Climate-Prediction Center (CPC) Merged Analysis of Precipitation (CMAP) and the Global Precipitation Climatology Project (GPCP). In addition, we use the NASA TRMM dataset to provide interpretation of the results. Both the CMAP and GPCP are subject to the aforementioned problems regarding merged satellite data products. Using the concept of probability distribution function (PDF) which, simply put, is a measure of the rainfall amount as a function of the rain rate over the entire tropics, we find that the two data sets are quite consistent in showing : a) a relatively uniform increase in light (warm) rain over the tropical oceans, b) an increase in extreme heavy (ice-phase) rain over the near-equatorial oceans, and c) a reduced moderate (mixed-phase) rain over the tropical ocean and land regions. This means that instead of one, there are three distinct, highly detectable trends in tropical rainfall captured by both data sets. But because the exact amount of change with each trend differs between the two data sets due to measurement errors, the total tropical rainfall trend is still undetectable.
The results of this paper are paradigm shifting in demonstrating that global satellite rainfall datasets have come of age, and can be used meaningfully to detect trend signals in tropical rainfall. The results also provide new evidence indicating rainfall characteristic may be sensitive to global change, more so than the rainfall total. This paper also features a discussion on how microscopic changes in one end of the rain spectrum, i.e., drizzle, may need to be compensated by changes in the heavy downpour at the other end of the spectrum. This may explain fi-om a total system viewpoint, why increased extreme heavy rain events, i.e., those associated with hurricanes, may be a likely response in a warmer climate.
L
https://ntrs.nasa.gov/search.jsp?R=20070021534 2018-06-21T07:31:36+00:00Z

DETECTING TRENDS IN TROPICAL
RAINFALL CHARACTERISTICS
DURING 1979-2003
K. M. Lau and H. T. Wu*
Laboratory for Atmospheres
NASNGoddard Space Flight Center
Greenbelt, MD 20771
November 2005
* Science and Systems Application Inc., Lanham, Maryland
,
1

Abstract
From analyses of blended space-based and ground-based global rainfall data, we found
increasing trends in the occurrence of extreme heavy and light rain events, coupled to a
decreasing trend in moderate rain events in the tropics during 1979-2003. The trends are
consistent with a shift in the large-scale circulation associated with a) a relatively uniform
increase in warm rain over the tropical oceans, b) enhanced ice-phase rain over the near-
equatorial oceans, and c) reduced mixed-phase rain over the tropical ocean and land
regions. Due to the large compensation among different rain categories, the total tropical
rainfall trend remained undetectable.
One sentence summary: We found significant shifts in tropical rainfall characteristics
identified with an increase in the frequency of heavy and light rain events, and a decrease
in moderate rain events, but no detectable trend in total rainfall over the tropics during the
period 1979-2003.
,
2

1. Introduction
All water that sustains life on Earth ultimately comes from precipitation. Latent
heating from precipitation is the main driver of the atmospheric water cycle, which
determines earth’s weather and climate. Yet, contrary to the well-documented rapid rise
in global temperature in the last century, there has not been clear evidence of associated
change in global precipitation (1-3). Recent studies have shown an increase in
precipitation over high-latitude land, and a possible increase over the tropical oceans but
a reduction over tropical lands since the 1950’s (4-6). Over oceans where rainfall
estimates rely on satellite observations, the uncertainty in the estimate of total rainfall is
large. Since about two-third of the world is covered by oceans, the lack of reliable
oceanic rainfall estimates for long-term signal detection is a reason why no global rainfall
trend associated with climate change has been yet detected. A more fundamental reason,
however, is that rainfall is a chaotic quantity governed by non-equilibrium atmospheric
dynamics and convection, in contrast to temperature, which is a state variable subject to
equilibrium thermodynamical controls. This accounts for the intrinsic small scale and
noisy nature of rainfall, and hence the low signal-to-noise ratio relative to temperature in
climate change studies. Globally, the latent heat increase from enhanced convection and
increase rainfall in one region has to be balanced by radiative cooling in clear regions
elsewhere with compensating subsidence and suppressed rainfall. This means that in
response to long-term climate forcing, the global water cycle is likely to adjust not only
dynamically, but also structurally and this will be reflected in changes in rainfall
characteristics, such as fiequency of occurrence of intense events, persistence of wet and
dry spells, and changes in relative abundance of cold vs. warm rains, high vs. low cloud

types (4, 7-10). As a result, the trend in global total rainfall is likely to be relatively small
and probably w i t h satellite data errors. Even with the recent advances in space-based
rainfall measurements from the Tropical Rainfall Measuring Mission (TRMM), and the
reconstruction of state-of-the-art global datasets merging satellite and rain gauge
observations, estimating global rain amounts remains a major challenge.
In this study, we adopt a new strategy for the detection of long-term rainfall
changes using existing data. We hypothesize that (a) a shift in rainfall probability
distribution h c t i o n (PDF) associated with changing rainfall characteristics is likely to
be more sensitive to climate change than the global mean total rain amount, and hence
more detectable, and (b) current multi-decade merged satellite-gauge rainfall products
contain useful information on long-term change in rain characteristics, even though they
may differ in the assessment of total rain amount. We will focus on tropical rainfall,
because that is where most of the global rainfall occurs, and because tropical rainfall
estimates have seen significant improvements in the last decade and will continue to do
so in the next decade, thanks to NASA’s commitment to TRMM and the Global
Precipitation Mission (GPM).
2. Data description
For this study, we use two popular, state-of-the-art multi-decade (1979-present)
global rainfall data sets: the Global Precipitation Climatology Project (GPCP), and the
Climate Prediction Center (CPC) Merged Analysis of Precipitation (CMAP). Both have
monthly and pentad (5-day) products derived from a mix of satellite estimates over ocean
and land, rain gauge measurements from land and atolls, although the input data and
4

blending methodologies differ considerably (e.g., 11-13). We elect to use the GPCP and
CMAP pentad products to allow for more samples to define rainfall characteristics
temporally. The pentad CMAF’ data are produced similarly to the monthly CMAP, but
include daily data inputs. The pentad GPCP is derived from the pentad CMAP, but
additionally adjusted to the monthly GPCP-merged analysis and therefore has the same
long-term mean properties as the monthly GPCP (12-13). Because of the use of multiple
satellites and different retrieval algorithms, the use of these datasets for trend analysis has
to be taken with significant caution (12). We conducted identical analyses on both GPCP
and CMAP. For cross-checking results over land, we use the long-term Hadley Centre
Climate Research Unit (CRU) Time Series 2.0, global gridded land precipitation products
(14). For discussion, TRMM storm height data are used to define the rainfall
characteristics.
3. Results
We define a trend empirically as the linear regression fitted to the data for the
period 1979-2003. We caution that this definition does not necessarily imply a “real
trend” in the sense of long-term climate change (century) time scale. Here the trend only
represents a monotonic shift, which may be a part of a multi-decadal signal present in the
climate system.
a. Preliminary Trend Analysis
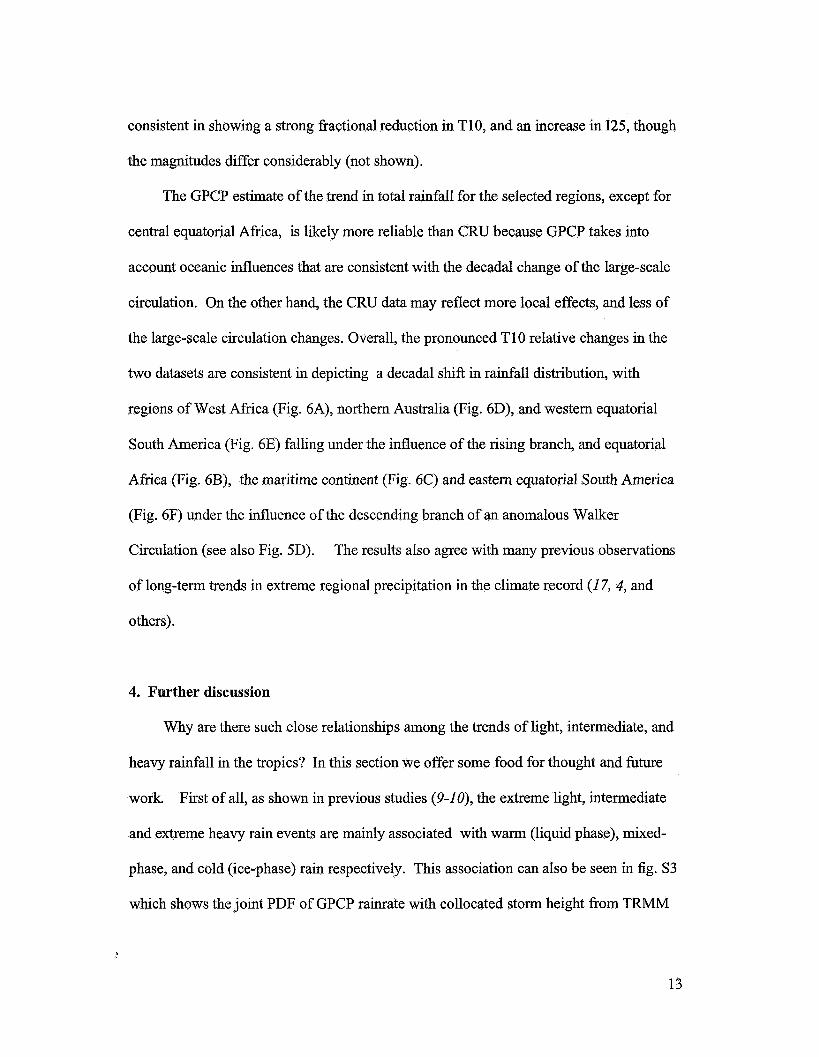
Figure 1 shows the time history of tropical (30”s - 30“N) pentad rainfall for GPCP
and CMAP. A 30-day running mean has been applied to both datasets to emphasize the
low-frequency variability. The discrepancy between GPCP and CMAP is obvious. The
,
5

long-term (1979-2003) mean rainfall of GPCP (2.9 mm day-') is significantly smaller
than that of CMAP (3.3 mm day-'). CMAP shows a clear decreasing trend compared
with GPCP which shows a slight increasing trend. The trend found in CMAP is known
to be contaminated by artifact due to discontinuity in inclusion of SSMA data after 1987,
and a change of quality of atoll data after 1996 (12). These account for the shift in the
apparent rainfall variability before and after 1987, and the closer agreement between
CMAP and GPCP after 1996 (GPCP does not use atoll data). In spite ofthe systematic
bias, and difference in the trend, both dataset capture major rainfall peaks associated with
El Nino, e.g. 1982, 1985, 1987, 1997, and exhibit strong interannual and some
interdecadal variations, albeit with different phases. Comparing with standard TRMM
rainfall products (not shown), we also note that the systematic bias between the tropical
mean GPCP and CMAP is comparable to that between Version 5 and Version 6 of the
TRMM rainfall data. Thus, the global trend in total rainfall, if present at all, is most likely
within the data error of current satellite estimates. Clearly, to extract useful information
on long-term change in rainfall, it is necessary to go beyond comparing global trends in
total rainfall.
As a first step in our new approach, we examine changes in extreme rain events.
For convenience, we shall henceforth denote extreme light rain as the category at the
lowest 5% rainfall accumulation (B5), extreme heavy rain as the top 10% (TlO), and
rainfall within the inter-quartile range as the intermediate rain (125). From Table 1, it is
evident that GPCP and CMAP describe similar rain characteristic in that for both
datasets, the threshold value is the same (=1 mm day-') for B5, and the range and
thresholds for I25 and T10 are similar. Figure 2 shows the time series of the yearly
,
6

accumulated rain amount averaged over the tropics, and the frequency of occurrence
(FOC) for the extreme light and heavy rain. In contrast to the total rainfall, both the
GPCP and C W data indicate clear increasing trends, in both rain amount and FOC of
extreme light, and heavy rain categories. Note that the trends in both light and heavy
rains are more prominent after 1986, indicating that they are not due to the inclusion of
SSMD data. The linear trend estimates exceed the 99% confidence level based on the R2 -
test (15). Table 1 shows that for extreme light rain in the tropics, the long-term (25 year)
annual mean is approximately 46 mm for GPCP and 49 mm for CMAP. Both show an
increasing trend in annual rainfall of about 4 mm over 25 years. The corresponding
increase in FOC is substantial, approximately 9% for CPCP, and 4 % for CMAP. The
increasing trend in annual rainfall in the extreme heavy rain category is quite large,
estimated to be around 81 mm for GPCP, and 44 mm for CMAP over 25 years. The
increasing trend in FOC of extreme heavy rain (Fig. 2D) is also evident in both datasets.
It is important to note that extreme heavy rain events are very rare, as indicated by the
FOC range of 0.8 -1.8 % (Fig. 2B), and that extreme light rains occur much more
frequently and widely spread, as evident in the 33 - 45 % FOC range (Fig. 2D). The
physical implication of this difference on the water and energy balance of the tropics will
be discussed in Section 4.
b. Probability Distribution Function (PDF)
The preliminary trend analysis for extreme rainfall categories suggests that there
may be a shift in the rainfall PDF during the data period. To examine such a shift, we
first bin the rainfall data according to rain rates, and construct the climatological rainfall
7

PDF for the tropics for both GPCP and CMAP, and then compute by linear regression the
trend for each binned rain rate. To reassure that the PDF and the estimated trend are not
sensitive to the data period, we have computed them for the entire data period and for the
post-SSM era (1988-2003). The results are essentially the same. Henceforth we only
show results for the entire period (1979-2003). The climatological PDFs of GPCP and
CMAP rainfall and FOC are shown in Figs. 3A and By respectively. Compared to GPCP,
CMAP overestimates rainfall in all categories, but maintains a very similar PDF structure
(Fig. 3A). Both PDFs show a maximum at the intermediate range of - 3-7 mm day -*.
The GPCP PDF tends to tail off toward high rainrates slightly faster than CMAP. The
FOC PDFs (Fig. 3B) of GPCP and CMAP agree well with each other, showing that B5
occurs far more frequently (- 40%) compared to all other rain events. The geographic
distribution of FOC for each rain category also shows reasonable agreement between the
two datasets. As shown in fig. S 1 , B5 rain is found over large expanse of the subtropical
ocean, with relatively low sea surface temperature i.e., eastern Pacific and Atlantic,
southeastern Indian Ocean, with frequent occurrence just off the west coast of
continents, most likely in conjunction with coastal upwelling and stratocumulus clouds;
I25 rain is found most frequently in the tropical warm pool regions, with strong signal
over the land masses of central and western Africa, the maritime continent and
Amazonia; T10 rain is found predominantly over the core convective region of the
western Pacific, eastern Indian Ocean and the Pacific and Atlantic ITCZ.
To quantify the shift of the rainfall PDF, we follow the same procedure to compute
the trend of rain amount, and FOC over the entire tropics (30"s to 30%) binned by rain
rates. Figures 4A and B show the linear trend increment of rain amount and FOC over
8
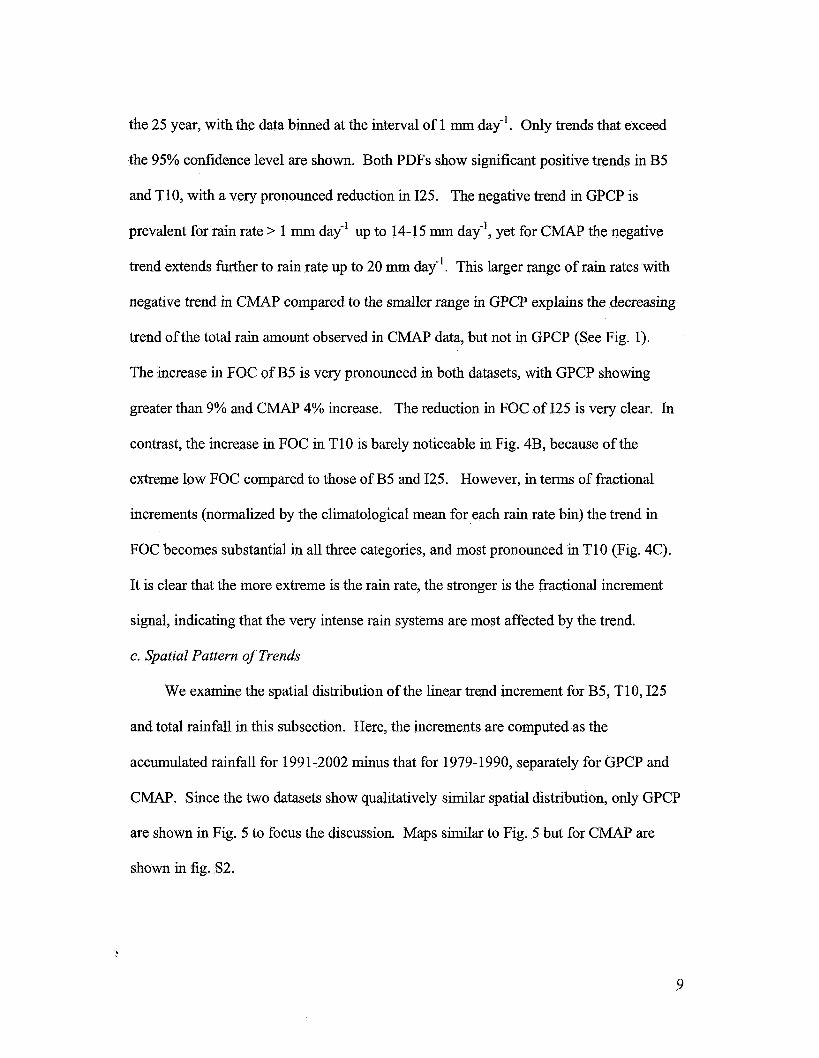
the 25 year, with the data binned at the interval of 1 mm day-'. Only trends that exceed
the 95% confidence level are shown. Both PDFs show significant positive trends in B5
and T10, with a very pronounced reduction in 125. The negative trend in GPCP is
prevalent for rain rate > 1 mm day-' up to 14-15 mm day-', yet for CMAP the negative
trend extends further to rain rate up to 20 mm day-'. This larger range of rain rates with
negative trend in CMAP compared to the smaller range in GPCP explains the decreasing
trend of the total rain amount observed in CMAP data, but not in GPCP (See Fig. 1).
The increase in FOC of B5 is very pronounced in both datasets, with GPCP showing
greater than 9% and CMAP 4% increase. The reduction in FOC of I25 is very clear. In
contrast, the increase in FOC in T10 is barely noticeable in Fig. 4B, because of the
extreme low FOC compared to those of €35 and 125. However, in terms of fractional
increments (normalized by the climatological mean for each rain rate bin) the trend in
FOC becomes substantial in all three categories, and most pronounced in T10 (Fig. 4C).
It is clear that the more extreme is the rain rate, the stronger is the fractional increment
signal, indicating that the very intense rain systems are most affected by the trend.
e. Spatial Pattern of Trends
We examine the spatial distribution of the linear trend increment for B5, T10, I25
and total rainfall in this subsection. Here, the increments are computed as the
accumulated rainfall for 199 1-2002 minus that for 1979- 1990, separately for GPCP and
CMAP. Since the two datasets show qualitatively similar spatial distribution, only GPCP
are shown in Fig. 5 to focus the discussion Maps similar to Fig. 5 but for CMAP are
shown in fig. S2.
9

Fig. 5A shows that, in recent decade (1991-2002) compared to previous (1979-
1990), there is an somewhat uniform increase in B5 rainfall over all tropical oceans, with
noticeable reduction at the areas off the west coast of continents, the subtropical
continental regions, and the maritime continent. The quasi-uniform pattern of the long-
term change in B5 rainfall over the ocean suggests that the increase may be
thermodynamic in origin, i.e., possibly due to the increasing warm rain efficiency
associated with shallow clouds, associated with global temperature rise, which is not
strongly affected by changes in large-scale circulation (9). In agreement with the PDF
analysis shown previously, I25 (Fig. 5B) shows reduction over a wide swath of the
tropical oceans, in broad regions encompassing the Pacific and Atlantic ITCZ, the
subtropics, and the eastern Indian Ocean. Exceptions are found over the maritime
continent, and northwestern South America where I25 is enhanced. As stated, B5 rain is
actually found to decrease over the maritime continent. Hence the opposite polarity of
long-term trend between B5 and I25 appears to hold up over the maritime continent as
well. Figure 5B also shows a large negative trend over equatorial central Africa. This
trend is also found in CMAP (see fig. S2B), but is not observed in the analysis of CRU
data (see discussion in Section 3d).
The trend pattern in Fig. 5C shows that TI0 rainfall over the tropical oceans
generally increases over the decades, consistent with PDF shift. The most pronounced
positive trends are found in deep convective cores in the ITCZ, and SPCZ, and in land-
anchored monsoon depressions. Substantial reductions in T10 are found over the
maritime continent, equatorial Central America and northeastern Brazil, and to a lesser
extent over central Africa. The concentrated regions of large positive and negative
,
10

anomalies reflect the centers of rising and sinking motion of an anomalous Walker
Circulation. This feature is also evident in the total rainfall trend (Fig. 5D). However,
comparing to the total rainfall trend (Fig. 5D), it is clear that each of the major rain
categories show a more uniform increase or decrease over the entire tropical oceans,
indicating a substantial change in the large-scale circulation, as well as a change in the
rainfall characteristics, associated with a long-term large-scale adjustment in the tropical
water cycle (see more detailed discussion in Section 4).
d. Comparison with independent data
In this subsection, we seek corroboration of our results with independent long-term
rainfall dataset. Since there is no other independent long-term rainfall dataset over the
ocean besides GPCP and CMAP, we can only compare our results with the CRU rainfall
which is based solely on rain gauge data over land. Because of different spatial and
temporal scales of the GPCP (pentad, 2.5 x 2.5 degree spatial resolution), compared with
CRU (monthly, 0.5 x 0.5 degree spatial resolution), the comparison presented here is
rather crude. Fig. 5E shows the spatial distribution of the quasi-decadal change (1 99 1 -
2002 minus 1979- 1990) of CRU rainfall. Similarities in the large-scale pattern between
the CRU and the GPCP (Fig. 5D) can be discerned, particularly over the tropical South
America, regions in South Asia and equatorial Africa. The magnitudes of the anomalies
differ between the two datasets, due in part to the different spatial and temporal
resolutions, and the fundamental differences in satellite rainfall estimate compared to rain
gauge observations (16). As noted, the negative anomaly over equatorial Africa seem to
be excessive for GPCP, compared to CRU.
11
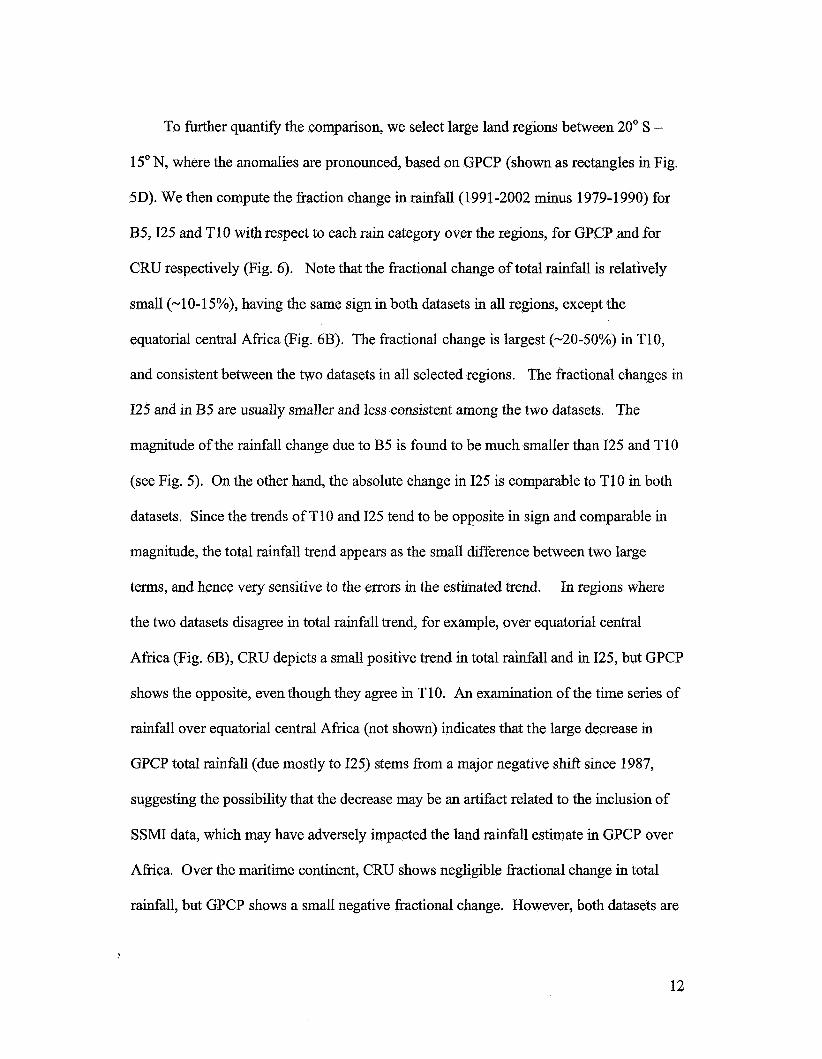
To further quantify the comparison, we select large land regions between 20" S -
15" N, where the anomalies are pronounced, based on GPCP (shown as rectangles in Fig.
5D). We then compute the fraction change in rainfall (1 99 1-2002 minus 1979-1 990) for
B5, I25 and T10 with respect to each rain category over the regions, for GPCP and for
CRU respectively (Fig. 6). Note that the fractional change of total rainfall is relatively
small (-10-1 5%), having the same sign in both datasets in all regions, except the
equatorial central Africa (Fig. 6B). The fractional change is largest (-20-50%) in T10,
and consistent between the two datasets in all selected regions. The fractional changes in
I25 and in B5 are usually smaller and less consistent among the two datasets. The
magnitude of the rainfall change due to B5 is found to be much smaller than I25 and T10
(see Fig. 5). On the other hand, the absolute change in I25 is comparable to T10 in both
datasets. Since the trends of T10 and I25 tend to be opposite in sign and comparable in
magnitude, the total rainfall trend appears as the small difference between two large
terms, and hence very sensitive to the errors in the estimated trend.
the two datasets disagree in total rainfall trend, for example, over equatorial central
Africa (Fig. 6B), CRU depicts a small positive trend in total rainfall and in 125, but GPCP
shows the opposite, even though they agree in T10. An examination of the time series of
rainfall over equatorial central Africa (not shown) indicates that the large decrease in
GPCP total rainfall (due mostly to 125) stems from a major negative shifi since 1987,
suggesting the possibility that the decrease may be an artifact related to the inclusion of
SSMI data, which may have adversely impacted the land rainfall estimate in GPCP over
Africa. Over the maritime continent, CRU shows negligible fractional change in total
rainfall, but GPCP shows a small negative fractional change. However, both datasets are
In regions where
,
12
consistent in showing a strong fractional reduction in T10, and an increase in 125, though
the magnitudes differ considerably (not shown).
The GPCP estimate of the trend in total rainfall for the selected regions, except for
central equatorial Africa, is likely more reliable than CRU because GPCP takes into
account oceanic influences that are consistent with the decadal change of the large-scale
circulation. On the other hand, the CRU data may reflect more local effects, and less of
the large-scale circulation changes. Overall, the pronounced T10 relative changes in the
two datasets are consistent in depicting a decadal shift in rainfall distribution, with
regions of West Africa (Fig. 6A), northern Australia (Fig. 6D), and western equatorial
South America (Fig. 6E) falling under the influence of the rising branch, and equatorial
Africa (Fig. 6B), the maritime continent (Fig. 6C) and eastern equatorial South America
(Fig. 6F) under the influence of the descending branch of an anomalous Walker
Circulation (see also Fig. 5D).
of long-term trends in extreme regional precipitation in the climate record (1 7, 4, and
others).
The results also agree with many previous observations
4. Further discussion
Why are there such close relationships among the trends of light, intermediate, and
heavy rainfall in the tropics? In this section we offer some food for thought and hture
work. First of all, as shown in previous studies (9-10), the extreme light, intermediate
and extreme heavy rain events are mainly associated with warm (liquid phase), mixed-
phase, and cold (ice-phase) rain respectively. This association can also be seen in fig. 53
which shows the joint PDF of GPCP rainrate with collocated storm height from TRMM
,
13

data. For B5 rain, the peak occurrence at found at 2-3 km, below the melting/fieezing
level (MFL) near 5 h, for 125, the peak is found near the MFL; for T10, the distribution
is more heavily weighted above the MFL. Given the aforementioned association, the
increase in light rain (B5) may be identified with increase in warm rain efficiency
associated with the rise in sea surface temperature in all tropical ocean basins in the last
several decades. As shown by Lau and Wu (9), the warm rain increase is due to
thermodynamic and microphysical effects associated with shallow convection, and/or
stratocumulus processes. They pointed out that the increased warm rain depletes low
and middle clouds, and deprives the upper atmosphere of available moisture for
condensation by deep convection. This may be a reason for the reduction in intermediate
rain (125) found here, and consistent with observations of large reduction of ISCCP
(International Satellite Cloud Climatology Project) clouds, as well as an increase in
outgoing longwave radiation in the last two decades (8). The substantial positive trend in
light rain frequency and possible induced reduction in cloudiness are important for the
overall energy balance of the tropics, because of the large area they occupy, i.e., greater
than 40% of the tropical area as estimated from GPCP. For the tropics as a whole, an
increased cooling (through heat loss) to space, due to the reduction of clouds stemming
from an increase in warm rain over large regions, needs to be balanced by increased
condensation heating elsewhere, generally over much smaller spatial scales because of
the strong control by moisture convergence and local topographic uplifting . This may be
the reason for the pronounced positive trend in intense rain (TlO), located in deep
convective cores of the ITCZ, SPCZ and the Indian Ocean, as well as increased
intermediate rain (125) in the maritime continent, and near steep topography of the Andes
,
14

(see Fig. 5B).
to higher altitudes, ice-phase rain (T10) dominates and mixed-phase 025) rain reduces,
and conversely in regions where mixed-phased rain dominates. In addition, anomalous
rising motions from increased convection over the central Pacific and the Indian Ocean
are known to drive compensating subsidence, through Walker- and Hadley-type large-
scale overturning suppressing rainfall over the maritime continent and northern South
America, and the subtropics. These anomalous overturnings can be mferred from Fig.
Locally, when penetrative deep convection occurs, the clouds are pushed
5D. Hence, the inter-relationship in the trends for extreme light, heavy and intermediate
rains and their preferred locations may be understood in terms of the interplay of
adjustment processes that involve dynamics and microphysics, as manifested in a spatial
redistribution of rainfall and characteristics change of tropical rain systems. Such
adjustment processes appear also to be captured in part in recent AGCM experiments as
responses of the tropical water cycle to changes in autoconversion rates, to indirect
aerosol effects, and in coupled model simulations from 20fh century simulation
experiments (IO, 18-19, 7).
5. Conclusion
Using GPCP and CMAP pentad rainfall data, we have analyzed trends of rainfall
characteristics for the entire tropics from 1979-2003. Although the linear trend signals
for total tropical rainfall differ considerably, the changes in their PDFs are highly
detectable, and qualitatively similar between the two datasets. Significant positive trends
are found in extreme light (bottom 5% by rain amount) and extreme heavy rain (top
1 O%), and negative trend are found in intermediate rain (inter-quartile range) categories.
15

Extreme light rains are found to have increased more or less uniformly over the tropical
oceans in the last two decades. Extreme heavy rain amounts and frequency of occurrence
are found to be on the rise since the early 1980’s in the cores of deep convection in the
ITCZ, SPCZ, the Indian Ocean, and monsoon regions, but reduced over the maritime
continent. Intermediate rain amount is reduced over the warm pool regions, the ITCZ
and SPCZ adjacent regions, but enhanced over the maritime continent. Both GPCP and
CMAP show consistent and comparable spatial and temporal signals in linear trends for
all three broad rain categories. The linear trends and inter-relationships among the
various rain components are found to be robust, in spite of uncertainties in total rainfall.
The shift in rainfall characteristics and the geographic redistribution of rain amount are
determined by the interplay of dynamical and microphysical adjustment processes of the
entire tropical convection and large-scale circulation system.
Our results show that while the atmospheric water cycle as measured by the long-
term change in total tropical rainfall may be resilient to climate change because of large
compensations, the structures of rain systems, especially the extreme rain events may be
more sensitive to a warming environment (20-22). The results will also provide a new
paradigm for climate model evaluation. More modeling and observational studies should
be devoted to document the changing characteristics of rainfall, and associated structural
changes in the global water cycle.
,
16

References and Notes
1. IPCC, Climate Change 2001: The Scientific Basis, Cambridge University Press, 870 pp
(2001).
2. Karl, T., and K. E. Trenberth, Science, 302,1719 (2003).
3. Allen, M. R., and W. J. Ingram, Nature, 419,224 (2002).
4. New, M., M. Todd, M. Hulme, and P. Jones, I. Journal ofclimatology, 21,1899
(2001).
5. Kumar, A., F. Yang, L. Goddard, and S. Schubert, J. Climate, 17, 653 (2003).
6. Bosilovich, M. G., S. Schubert, and G. Walker, J. Climate, 18, 1591 (2005).
7. Meehl, G. A., F. Zweiers, J. Evans, T. Knutson, L. Mearns, P. Whetton, Bull. Am.
Meteor. Soc., 81,427 (2000).
8. Weilicki, B. A., T. Wong, R. P. Allen, A. Slingo, J. T. Kiehl, B. J. Soden, C. T.
Gordon, A. J. Miller, S.-K. Yamng, D. Randall, F. Robertson, J. Susskind, and H.
Jacobowitz, Science, 295, 841 (2002).
9. Lau, K. M., and H. T. Wu, Geophys. Res. Lett. 30,2290 (2003).
10. Lau, K.M., H. T. Wu, Y. Sud and G. Walker, J. Climate (in press, 2005). 11. Yin,
X., A. Gruber, and P. Arkin, J. Hydrometeorology, 5, 1207 (2004).
12. Xie. P., J. E. Janowiak, P. A. Arkin, R. Ader, A. Gruber, R. Ferraro, G. J. Jufhan,
and S. Curties, J. Climate, 16,2197 (2003).
13. Adler, R. F., J. Suskind, G. Huffman, D. Bolvin,l E. Nelkin, A. Chang, R. Ferraro, A.
Gruber, P. Xie, J. Janowiak, B. Rudolf, UI. Shneider, S. Curtis, and P. Arkin, J.
Hydrometeorology, 4, 1147 (2003).
17

14. New, M., M. Huhne, P. D. Jones, J. Climate, 13,2217 (2000).
15. Wilks, D.S., Statistical Methods in the Atmospheric Sciences. Academic Press, 160-
176 (1995).
16. Nesbitt, S. W., E. Zipser, and C. K m e r o w , J. Appl. Meteorology, 43,1016 (2004).
17. Groisman, P. Ya., R. W. Knight, D. R. Easterling, T. R. Karl, G. Hegerl, V. N.
Razuvaev, J. Climate, 18, 1326 (2004).
18. Wang, H. and K. M. Lau, Int. J. Climatology (in press, 2005).
19. Rotstayn, L., and U. Lohmann, J. Climate, 15,2103 (2002.
20. Trenberth, K.E., A. Dai, R. Rasmussen, and D. B. Parsons, Bull. Amer. Meteor. SOC.,
94, 1205 (2003).
21. Emannuel, K., Nature, 436,686 (2005).
22. Webster, P. J., G. J. Holland, J. A. Cuny and H. R. Chang, Science, 309, 1844 (2005).
23. This work is supported by the Tropical Rainfall Measuring Mission (TRMM) of the
NASA Science Mission Directorate. Drs. Hailan Wang and K. M. Kim provided usefid
discussion and suggestions during the course of this work.
Supporting Online Material
www . sciencernap;.org/
Figs S1 to S3
,
18

Figure Captions
Fig. 1. Time series of pentad GPCP (thick line) and CMAP (thin line) tropical mean
rainfall from 1979-2003. A 30-day running mean filter has been applied to both
datasets. The straight lines are obtained from linear regression based on each
dataset.
Fig. 2. Time series of (A) yearly accumulated precipitation amount, and (B) frequency of
occurrence (FOC) for light rain (bottom 5% by precipitation amount), and similarly
for (C) and (D) but for heavy rain (top 10% by rain amount), for GPCP (closed
square) and CMAP (open circle) respectively.
Fig. 3. The climatological (1 979-2003) PDF for (A) yearly accumulated precipitation
amount, and (B) FOC, for GPCP (filled bar) and CMAP (outlined bar) respectively.
Fig. 4. Shift in PDF shown as linear trend increment over 25 years as a h c t i o n of rain
rate for (A) yearly accumulated precipitation amount, and (B) FOC; and (C) as in
(B) except normalized by mean in each rain rate bin.
Fig. 5. Difference patterns (1 99 1-2002 minus 1979- 1990) showing quasi-decadal shift in
accumulated precipitation amount for (A) B5, (B) 125, (C)T10 and @) total
rainfall for GPCP, and (E) total rainfall for CRU.
Fig. 6. Normalized change in area-averaged accumulated precipitation from 1979-1 990
to 1991-2002, in B5,125, T10 and total rainfall for (A) west Africa monsoon region
(0-15%, 0-15"E), (B) equatorial central Africa (15"S-5'%lY 20"E-30°E), (C)
maritime continent [1OoS-5ON, 105"E-160"E], (D) northern Australia [2O0S-10"S,
120%-150"E], (E) equatorial western South America [lO"S-lO%, 70W-60°W],
and (F) equatorial eastern South America [lo's - 0,60W-404ilv], for GPCP (filled
,
19

bar) and CRU (outlined bar) respectively. Here, the rainrate ranges for B5,125, and
T10 are defined based on rainfall over tropical land only.
20

Table 1. Threshold rain rate, climatological rain amount , frequency of occurrence and linear change (mm) over 25 years (1979-2003) averaged over the tropics, for light, intermediate and heavy rain defined as the bottom 5% (B5), inter-quartile range (I25), and top 10% (TlO), respectively for a) GPCP and b) CMAP.
(A) GPCP
(B) CMAP
21
Fig. 1
80 82 84 86 88 90 92 94 96 98 100102 Time (Year 1900+)
,
22

Fig. 2.
45
42
39 - 36
33
I 3 82 04 86 88 90 92 94 96 98 1W 102
C ::'.b d2 04 d6 68 S'O $2 94 98 d0 lh102 ' 16
1 .I
'12
1
0.8
I 0 8 1 0 82 k 86 d8 s0 d2 & 66 d8 lh 102 d0 d2 04 d6 d8 90 92 84 96 98 100 102
I
rima (Yaw 19W+) Time (Year 18OOt)
,
23

Fig. 3.
70 E 60
50 *$ 40 h 30 E * O
0 0
v
Q
: 10 0
0 5 10 15 20 25 30 35 40 35 m B
rainrate bin values (mm/day)
24

Fig. 4.
12 h
E a E - 4
n '3 -8 g -12
10
-2
A I
I 5 10 15 20 25 30 35,
- - I
-254 I 0 5 10 15 20 25 30 35
rainrate bin values (mm/day)
25

Fig. 5.
30N 25N 20N 15N 10N
5N EO 5s
1 os 15s 20s 25s 30s
-300 -200 -100 -50 0 50 100 200 300 400 (rnrn)
,
26

Fig. 6 .
"I' 1. 135 125 T10 Total
I [[T-
I
7 ~ 65 125 T i 0 Total
27

Fig. S1 Geographic distribution of FOC for different rain categories for (A) B5 , (B) 125, and (C) T10 for
GPCP and (D) B5, (E) I25 and (I?) T10 for CMAP, showing that B5 occurs widely over the tropics, with
maximum FOC in regions under the influence of the subtropical anticyclones of the Pacific, the Atlantic,
and the southern Indian Ocean (>50%). B5 is also prevalent in stratocumulus regimes off the west coasts
of continent (>70%), and along the coast of east Africa, and Saudi Arabia 070%). The distribution of I25
resembles a mirror image of B5, with highest FOC over a wide swath covering the warm pool regions, the
Intertropical Convergence Zone (ITCZ) and the South Pacific Convergence Zone (SPCZ). The maximum
FOG 060%) for I25 is found over the tropical forests of Amazonia, the Maritime Continent and central
Africa. Compared to B5 and 125, T10 occurs only rarely, with FOC greater than 5% found in the core of
the ITCZ of the Pacific and the Atlantic, and in deep convection anchored by the maritime continent, the
Bay of Bengal, and land regions of monsoons of Asian-Australia, West Africa, Mexico and South America.
28

30N 25N 20N 15N 1 ON 5N EO 5s
1 OS 15s 20s 25s 305
-300 -200 -100 -50 0 50 100 200 300 400 (mm)
Fig. S2. Difference patterns (1991-2002 minus 1979-1990) showing quasi-decadal shift in accumulated
precipitation amount for (A) B5, (B) 125, (C)TlO and (D) total rainfall for CMAP.
,
29

’ - I I
9 1 -------
0 1 2 3 4 5 6 7 8 9 1011 1213141516171819202122232425
rain rate (mm/day)
Fig. S3. Joint PDF of pentad rain rate from GPCP and storm height from TRMM data for 1998-1999, over
the tropics (30 O S to 30 O N ) . The mean melting-freezing level (MFL) at approximately 5 km is indicated by
the horizontal line. B5 rain can be identified as primarily warm, water-phase rain, as evidenced by the
peak concentration of B5 rain (< 1 mm day-’) at 2 -3 km, below the MFL; I25 rain with rain rate between 4
- 14 mm day -‘ is identified as mixed phase rain with approximately equal proportion above and below the
MFL; T10 (>20 mm day’) is associated with cold, primarily ice-phase rain with a distribution weighted
move above the MFL.
,
30