Embed Size (px)
Citation preview
Detecting Illegal Arms Trade∗
Stefano DellaVigna
UC Berkeley and NBER
Eliana La Ferrara
Universita’ Bocconi and IGIER
This version: August 15, 2007.
Abstract
Illegal arms are responsible for thousands of deaths in civil wars every year. Yet, their
trade is very hard to detect. We propose a method to statistically detect illegal arms
trade based on the investor knowledge embedded in financial markets. We focus on eight
countries under UN arms embargo in the period 1990-2005, and analyze eighteen events
during the embargo that suddenly increase or decrease conflict intensity. If the weapon-
making companies are not trading or are trading legally, an event worsening the hostilities
should not affect their stock prices or affect them adversely, since it delays the removal
of the embargo. Conversely, if the companies are trading illegally, the event may increase
stock prices, since it increases the demand for illegal weapons. We detect no significant
effect overall. However, we find a large and significant positive reaction for companies head-
quartered in countries where the legal and reputation costs of illegal trades are likely to be
lower. We identify such countries using measures of corruption and transparency in arms
trade. We also suggest a method to detect potential embargo violations based on stock
reactions by individual companies, including chains of reactions. The presumed violations
are higher for conflicts with more UN investigations and for companies with more Internet
stories regarding embargo.
∗Keith Chen, Lauren Cohen, Raymond Fisman, Mariassunta Giannetti, Michel Habib, Ben Hermalin, Chang-Tai Hsieh, Ethan Kaplan, Lawrence Katz, Ulrike Malmendier, Ted Miguel, Jesse Shapiro, Uri Simonsohn, Justin
Wolfers, and audiences at the Catholic University of Milan (Italy), Columbia University, Princeton University,
Stockholm (SITE), UC Berkeley, the University of Maryland-College Park, the University of Rome (Tor Vergata,
Italy), the University of Toulouse, ULB-Bruxelles, Yale University (SOM), the BREAD-CESIfo conference in
Venice, the NBER Labor Studies Spring Meeting, the NBER Political Economy Summer Meeting, the NEUDC
conference at Cornell, and the Inequality and Development conference at Namur provided useful comments. We
thank Loretta Bondi and Oliver Sprague for helpful discussions on arms embargoes. Maria Aleksynska, Scott
Baker, Thomas Barrios, and Silvia Redaelli provided excellent research assistance.
1 Introduction
Armed conflict is a leading cause of poverty and death in developing countries. In the Demo-
cratic Republic of Congo alone, violent conflict is considered responsible for about 3.8 million
deaths since 1998. (Small Arms Survey 2005) To curb the extent of conflict, the United Na-
tions has increasingly resorted to the imposition of arms embargoes, alongside peacekeeping
operations and humanitarian interventions. Yet, illegal arms trade undercuts the effectiveness
of the embargoes, as documented in investigative reports by advocacy groups such as Amnesty
International and Human Rights Watch.
The case-by-case evidence provided in these investigative reports, however, accounts only
for a limited fraction of the overall illegal arms trade, and mostly concerns brokers in arms
deals. More generally, quantitative information on the nature of illegal arms trade is hard
to come by. The most basic questions are still unanswered. Which countries illegally export
weapons in areas of civil conflict? Which types of companies are involved? A better answer to
these questions is a pre-condition for effective policies.
In this paper, we propose a method that can provide initial answers to these questions. We
detect illegal arms trade based on the investor knowledge embedded in financial markets. We
rely on the fact that company insiders and well-informed investors are likely to be aware of
illegal trades, even if the general public is not. We focus on eight countries that were under
UN arms embargo in the period 1990-2005: Angola, Ethiopia, Liberia, Rwanda, Sierra Leone,
Somalia, Sudan, and Yugoslavia. In these countries, we identify eighteen events during the
embargo that suddenly increase or decrease conflict intensity. To select the events, we use
historical information and counts of newswire stories in the event days. An example of an
event increasing hostilities is an unsuccessful coup attempt by the rebels in Sierra Leone on
January 6, 1999.
We examine the stock returns of companies producing weapons in a window around these
events. We identify weapon-making companies using the SIC code information in the Datastream-
Worldscope data set, supplemented with a list of the top-100 weapons companies (Dunne and
Surry, 2006). For these 153 companies, we consider the abnormal returns in the 3 days sur-
rounding the events. If the companies are not trading or trading legally, an event increasing
the hostilities should not affect stock prices or should affect them adversely, since it delays
the removal of the embargo and hence the re-establishment of legal sales. Conversely, if the
companies are trading illegally, the event should increase stock prices, since it increases the
demand for illegal weapons.
In Section 4 we present the results on average event returns. Over the whole sample, we
find no significant stock response to the events. The aggregate null effect, however, may mask
heterogeneity in the event returns. Hence, we separate companies on the basis of proxies for
the legal and reputational costs of illegal arms sales. We expect the cost of embargo violations
1

to be lower in countries where corruption is more commonplace and where transparency of
arms sales is lower. Further, we expect that lack of membership in a large organization like
the OECD, lower press freedom, higher bribe-paying, and lower participation by minority
shareholders would also lower the cost of illegal arms trading.
We find support for these predictions. Over the subset of companies head-quartered in
low-corruption countries, an event increasing conflict is associated with a significant decrease
in 3-day abnormal stock returns. For companies in high-corruption countries, instead, an event
increasing conflict is associated with over 1 percent increase in 3-day abnormal stock returns.
These findings suggest that companies head-quartered in high-corruption countries are more
likely to play a role in illegal arms trade, and hence benefit from the increase in hostilities.
Companies in low-corruption countries are more likely to engage in legal arms trade, and are
hurt by increases in hostilities that delay the re-establishment of legal trade. We find similar
results for the measures of transparency in arms sales and membership in the OECD, and
weaker evidence using measures of press freedom, bribe-payment, and shareholder protection.
We examine alternative specifications, as well as the effects by sub-groups of companies.
When considering the results event-by-event, we find the same pattern in 13 to 14 of the 18
events, indicating that the results are not due to an outlier. The event returns are larger for
events that are more unexpected or more significant according to news counts. The effect
for companies in high-corruption countries occurs for the most part on the day of the event,
suggesting that our identification of the event date is plausibly accurate. We use placebo
specifications on stock returns in the period before and after the event to argue that the effect
is unlikely to be spurious. We also consider the impact of two firm characteristics, firm size
and type of arms produced. The effects are stronger for smaller companies, for which the arms
sales in countries under embargo are likely to constitute a larger share of sales. Across types
of arms produced, the result is generally found in all categories, but is largest for companies
producing small arms and ammunitions, missiles, and explosives.
In Section 5, we present a calibration of the findings and interpretations. Our benchmark
interpretation is based on a simple model of conflict, embargo imposition, and firm profitability,
presented in Section 2. We assume two states of conflict, an Embargo state–with high intensity
of conflict–and a Non-Embargo state–with low intensity. Arms-producing companies differ
in the cost of violating an embargo. High-cost companies do not sell arms in the Embargo
state. As a consequence, profits for the low-cost companies are higher in the Embargo state.
In the model, increases in conflict have two effects: (i) they increase the contemporaneous
demand for arms, and (ii) they increase the future likelihood of the Embargo state. While
we cannot measure directly (i), we document (ii) showing that events increasing conflict are
associated with a higher probability of embargo the following year.
The model rationalizes the two main findings of the first part of the analysis. First, increases
in conflict during the embargo hurt companies with high legal and reputational cost of violation.
2
These companies do not benefit from the increased demand (since they are not trading), and
are hurt by the increased probability of the Embargo state in the future. Second, increases
in conflict during the embargo substantially benefit low-cost companies. The value of these
companies increases because of the current increase in demand, and because of the future
increase in the likelihood of the Embargo state. A calibrated version of the model using the
event returns yields estimates for the yearly profits for trade under embargo between $1m and
$3m for the median firm. The implied industry-level yearly profits are in the order of hundreds
of millions of dollars for a conflict.
The model also makes a second set of predictions. Events increasing hostility in the non-
Embargo state have an ambiguous effect on high-cost firms, since they increase contemporane-
ous profits but they hurt future profits through the increased likelihood of embargo imposition.
We test this prediction using events that occur before, or after, the imposition of an embargo in
the eight countries of our sample. We also consider events affecting the intensity of conflict in
countries experiencing hostilities but no arms embargo, such as Algeria, Congo, and Venezuela.
We find that events increasing conflict have a small positive (not significant) effect on the re-
turns of high-cost companies, as measured by corruption indicators. We find no difference in
the event returns between low- and high- corruption countries. These findings are consistent
with a calibrated version of the model.
We also consider alternative interpretations. The stock return effect could be due to an
increase in the worldwide demand for weapons. However, this interpretation does not explain
the difference in event returns for events under embargo and for events not under embargo.
The difference in the event returns between low- and high-cost companies could also be due
to differences in arms produced: low-cost companies may produce more of the weapons that
are demanded in the embargoes countries. This does not explain, though, why the returns of
high-cost companies respond negatively to increases in conflict. We also discuss interpretations
based on regional instability, product mix, and misinformed investors.
While the event studies identify average differences in returns across groups of companies,
in Section 6, we consider whether it is possible to detect individual firms violating the embargo.
We conduct separate event studies for each company-event pair, and isolate events in which the
abnormal returns of a company are statistically different from zero, in a direction consistent
with illegal arms trade. To reduce the number of false positives, we also analyze cases in which a
company has a chain of multiple significant reactions consistent with embargo violation within
the same conflict. We identify 23 such chains, corresponding to 19 different companies. Three
companies display chains of reactions for more than one conflict. Still, these results should be
considered as suggestive, because the uncertainty in the estimates is such that the detection
remains subject to high error margins.
In Section 7, we use external sources to validate the detection results. Unfortunately, there
is very little direct evidence from official UN investigations: the few detected violators do not
3

include publicly traded companies. (In fact, the lack of direct evidence is a motivation for our
return-based detection procedure). We use, instead, proxies for the seriousness of embargo
violations in a conflict or for company involvement in a conflict. We detect more predicted
violations in conflicts with more documents on embargo enforcement by the UN Panels of
Experts and Monitoring Groups. Also, we find more predicted violations for companies whose
name appears more often in association with the word ‘embargo’ on the Internet.
This paper is related to the literature on forensic economics. Papers in this literature take
advantage of large data sets to detect patterns of cheating and corruption. Examples include
detecting teacher cheating (Jacob and Levitt, 2003), tax evasion (Fisman and Wei, 2004), and
corruption in sports (Duggan and Levitt, 2002; Wolfers, 2006). Most closely related is Hsieh
and Moretti (2006), who use time-series changes in oil prices to infer whether the Iraq regime
violated the oil-for-food program. Compared to these papers, we rely on investor information
to detect illegal behavior, rather than on behavior of the agents committing the crime.
The paper also relates to the event studies of the effect of political events on stock prices.
These studies have explored the economic effects of political connections (Roberts, 1990; Fis-
man, 2001), of the party in power (Wolfers and Zitzewitz, 2007), and of civil conflict (Abadie
and Gardeazabal, 2003; Guidolin and La Ferrara, forthcoming). A difference relative to this
literature is that we do not know ex ante which companies are affected by the event, but rather
use the stock response to determine it.
The paper is also related to the literature on the determinants and consequences of violence
and conflict in developing countries (Collier and Hoeffler, 1998; Miguel, Satianath and Sergenti,
2003; Montalvo and Reynal-Querol, 2005). We suggest a methodology that exploits investor
information to measure the illegal trade of arms, a (proximate) determinant of conflict.
Finally, this paper also contributes to the literature on arms embargoes (Bondi, 2004; Wood
and Peleman, 2006; Control Arms Campaign, 2006). Our results suggest that violations spread
well beyond the list of actors identified by the UN Sanctions Committees and by advocacy
groups such as Amnesty International. However, our findings also suggest that the embargoes
are, at least partially, effective in constraining arms trade. The negative returns for events
during the embargo of companies in low-corruption countries indicate that the embargoes
limited sales from these countries: if the sanctions were completely ineffective, these companies
should not be hurt by events increasing conflict.
2 A Simple Model
We present a simple model of conflict, embargo imposition, and firm value. The model provides
testable predictions on the impact of events affecting the demand for arms on firm value. We
distinguish between periods of arms embargo, characterized by high conflict and by prohibition
to sell arms, and other periods, characterized by lower hostilities and unrestricted arms sales.
4
We also distinguish between companies that stand to lose more from violating embargoes (e.g.,
because of high legal or reputation costs), and companies that stand to lose less. We derive
predictions for events occurring during and outside the embargo for the two types of firms.
We consider an infinite-period model in which in every period firms produce arms and
sell them in a market with stochastic demand. There are two sources of stochasticity. First,
there are two states of the world–Embargo E and Non-Embargo N . The Embargo state E
is characterized by fixed costs of firm entry and higher demand for arms, as detailed below.
Second, within each state the demand for arms α is stochastic. The stochasticity in the demand
for weapons captures the uncertainty regarding the evolution of a conflict.
We model the transition probability between states E and N as a Markov chain. If the
country is in the Embargo state at time t, the probability to be in the Embargo state again at
time t+ 1 is PE,E (αt); the probability of a Non-Embargo state at t+ 1 is 1− PE,E (αt) . The
probability of embargo in the future depends positively on the current state of hostilities, that
is, P 0E,E (αt) > 0. An embargo is more likely to persist if the hostilities worsen.We model similarly the transition probability for the case of Non-Embargo. If the country
is in the Non-Embargo state at t, the probability to transition to the Embargo state at t+1 is
PN,E (αt) and the probability of the Non-Embargo state is 1−PN,E (αt) , with P0N,E (αt) > 0. If
hostilities increase, the transition to the Embargo state becomes more likely. We also assume a
form of state dependence: PE,E (αt) > PN,E (αt) for all αt. For given hostilities, the probability
of an embargo next period is higher if a country is currently under embargo.
In each period t, there is a stochastic realization of the demand for arms αt, distributed with
c.d.f. F. The demand for arms depends on the state at time t: the demand in the Embargo state
first-order stochastically dominates the demand in the Non-Embargo state: FE (αt) ≤ FN (αt)
for all αt. In addition, we make the simplifying assumption that, conditional on the state, the
demand for arms αt is i.i.d. over time. Hence, a higher demand for arms at time t increases
the likelihood of the Embargo state at t + 1 through PE,E and PN,E , but, conditional on the
state realization at t+ 1, it does not affect the realization of αt+1.1
We can now write the continuation payoff for the Embargo state and for the Non-Embargo
state. These continuation payoffs depend on time t only through the realization of the demand
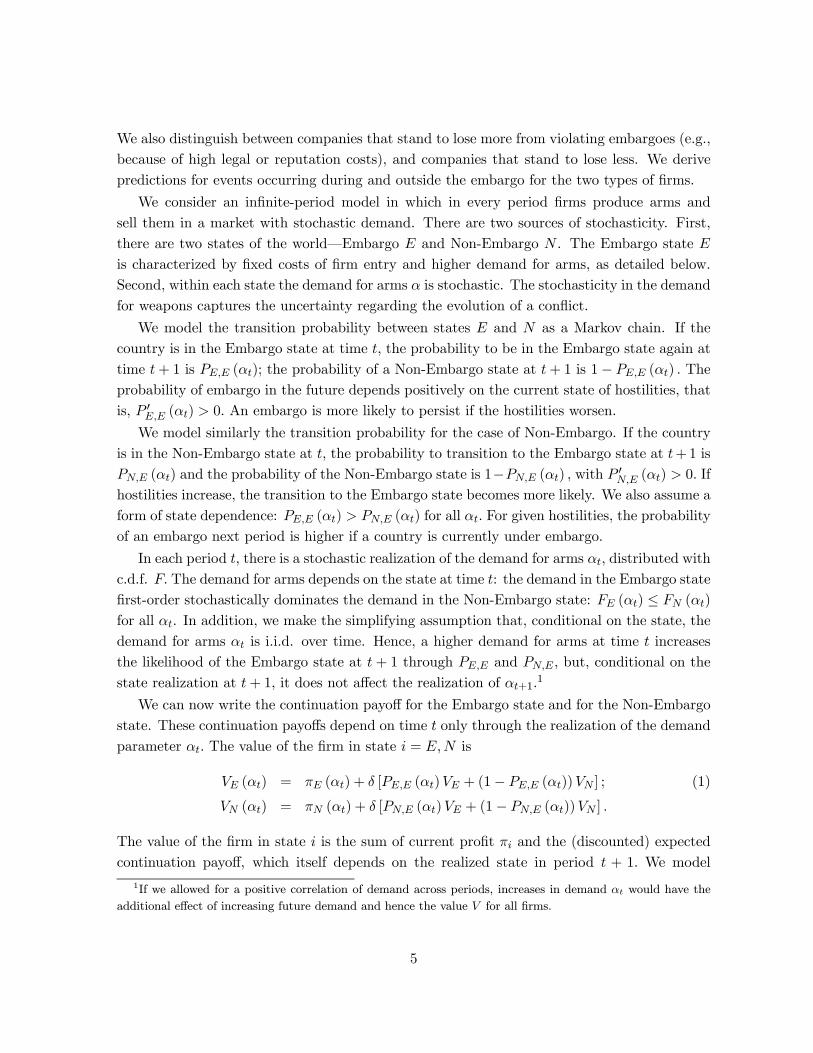
parameter αt. The value of the firm in state i = E,N is
VE (αt) = πE (αt) + δ [PE,E (αt)VE + (1− PE,E (αt))VN ] ; (1)
VN (αt) = πN (αt) + δ [PN,E (αt)VE + (1− PN,E (αt))VN ] .
The value of the firm in state i is the sum of current profit πi and the (discounted) expected
continuation payoff, which itself depends on the realized state in period t + 1. We model
1If we allowed for a positive correlation of demand across periods, increases in demand αt would have the
additional effect of increasing future demand and hence the value V for all firms.
5
profits πE and πN below. The expected continuation payoffs VE and VN are defined as VE =RVE (α) dFE (α) and VN =
RVN (α) dFN (α).
To solve for the unconditional continuation payoffs VE and VN , we integrate the first ex-
pression in (1) with respect to dFE and the second expression with respect to dFN . We get
VE = EπE + δ [EPE,EVE + (1−EPE,E)VN ] (2)
VN = EπN + δ [EPN,EVE + (1−EPN,E)VN ]
where we define the expected profits EπE =RπE (α) dFE (α) and EπN =
RπN (α) dFN (α), as
well as the expected probabilities of transition EPE,E =RPE,E (α) dFE (α) and EPN,E =R
PN,E (α) dFN (α) . Subtracting the second equation in (2) from the first and solving for
VE − VN , we obtain VE − VN = (EπE −EπN)/ [1− δ (EPE,E −EPN,E)].
We now compute the derivatives of VE (αt) and VN (αt) with respect to the contemporane-
ous demand for weapons αt. These derivatives capture the impact on the expected discounted
value of the company of a demand shift dαt due to a change in hostilities. Below, we relate
these derivatives to the event returns for arms companies. Differentiating (1) and substituting
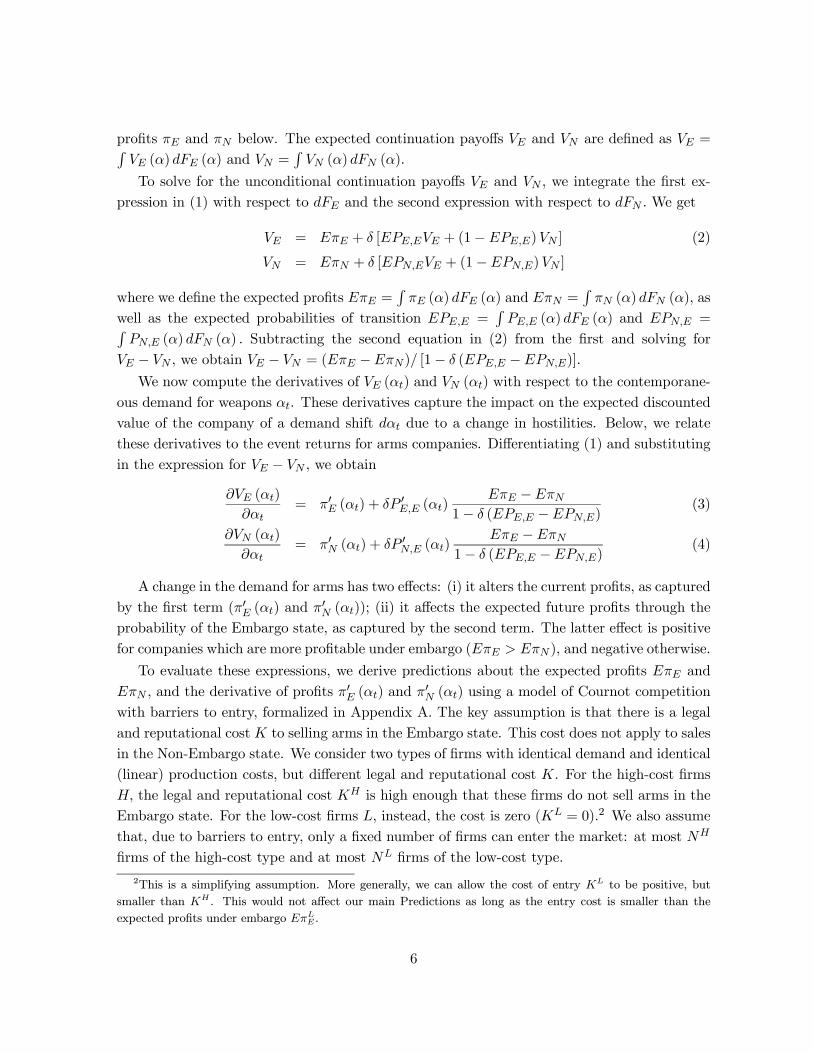
in the expression for VE − VN , we obtain
∂VE (αt)
∂αt= π0E (αt) + δP 0E,E (αt)
EπE −EπN1− δ (EPE,E −EPN,E)
(3)
∂VN (αt)
∂αt= π0N (αt) + δP 0N,E (αt)
EπE −EπN1− δ (EPE,E −EPN,E)
(4)
A change in the demand for arms has two effects: (i) it alters the current profits, as captured
by the first term (π0E (αt) and π0N (αt)); (ii) it affects the expected future profits through theprobability of the Embargo state, as captured by the second term. The latter effect is positive
for companies which are more profitable under embargo (EπE > EπN ), and negative otherwise.
To evaluate these expressions, we derive predictions about the expected profits EπE and
EπN , and the derivative of profits π0E (αt) and π0N (αt) using a model of Cournot competition
with barriers to entry, formalized in Appendix A. The key assumption is that there is a legal
and reputational cost K to selling arms in the Embargo state. This cost does not apply to sales
in the Non-Embargo state. We consider two types of firms with identical demand and identical
(linear) production costs, but different legal and reputational cost K. For the high-cost firms
H, the legal and reputational cost KH is high enough that these firms do not sell arms in the
Embargo state. For the low-cost firms L, instead, the cost is zero (KL = 0).2 We also assume
that, due to barriers to entry, only a fixed number of firms can enter the market: at most NH
firms of the high-cost type and at most NL firms of the low-cost type.
2This is a simplifying assumption. More generally, we can allow the cost of entry KL to be positive, but
smaller than KH . This would not affect our main Predictions as long as the entry cost is smaller than the
expected profits under embargo EπLE .
6

As we show in Appendix A, the results on profits are as follows. In the non-Embargo state,
the profits for the two types of firms are the same: πHN = πLN = πN ≥ 0. In the Embargo state,high-cost firms do not sell and have πHE = 0, while low-cost firms earn profits that are higher
than in the non-Embargo state (πLE > πN). In addition, the model yields an expression for the
derivative of profits with respect to the demand for arms: π0 (α) = π (α) /α.
We can thus obtain expressions for the change in company value in response to changes in
the demand for arms occurring during the Embargo. This is the basis for the empirical test of
the response of stock returns to conflict events during the embargo. For high-cost companies,
the expression for ∂V HE (αt) /∂αt follows from (3). For low-cost companies, we combine (3) and
(4) and derive the expression for ∂V LE (αt) /∂αt−∂V H
E (αt) /∂α. This matches the empirical test
in Section 4 which involves an interaction term with proxies of low-cost of embargo violation.
∂V HE (αt)
∂αt= −δP 0E,E (αt)
EπN1− δ (EPE,E −EPN,E)
≤ 0; (5)
∂V LE (αt)
∂αt− ∂V H
E (αt)
∂αt=
πLE (αt)
αt+ δP 0E,E (αt)
EπLE1− δ (EPE,E −EPN,E)
> 0 (6)
In the case of Embargo (expression (5)), an increase in demand αt unambiguously lowers
the value of high-cost companies. These companies do not reap the benefits of the increased
demand during the embargo since they do not enter the market. In addition, they are hurt by
the fact that increase in hostilities lower the probability that the embargo will be lifted in the
future. Compared to high-cost companies, low-cost ones respond substantially more positively
to a demand shift during embargo (expression (6)). First, these companies benefit from a
contemporaneous increase in profits, captured by πLE (αt) /αt. Second, they benefit from an
increased probability of embargo in the future, which, unlike for high-cost companies, leads to
higher profits. These results are summarized in Prediction 1, which we test in Tables 2-4.
Prediction 1 (Events in the Embargo State). Increases in conflict intensity in the
Embargo state (i) cause a decrease in value for companies with high cost of embargo violation;
(ii) cause an increase in value for companies with low cost of embargo violation (compared to
the high-cost companies).
We then obtain the corresponding predictions for events in the non-Embargo state:
∂V HN (αt)
∂αt=
πN (αt)
αt− δP 0N,E (αt)
EπN1− δ (EPE,E −EPN,E)
≷ 0. (7)
∂V LN (αt)
∂αt− ∂V H
N (αt)
∂αt= δP 0N,E (αt)
EπLE1− δ (EPE,E −EPN,E)
> 0 (8)
In the case of non-Embargo (expression (7)), an increase in demand αt has two opposing effects
on the value of high-cost companies: it increases current profits (as captured by πN (αt) /αt),
but it also increases the future likelihood of an embargo, reducing profits. The sign of expression
(7) is therefore ambiguous. Compared to high-cost companies, low-cost companies have the
7
same contemporaneous increase in profitability for events outside the embargo, and a positive
future expected increase in profitability (expression (8)). These results are summarized in
Prediction 2, which we test in Table 5.
Prediction 2 (Events in the Non-Embargo State). Increases in conflict intensity in
the Non-Embargo state (i) have an ambiguous effect on the value of companies with high cost
of embargo violation; (ii) cause an increase in value for companies with low cost of embargo
violation (compared to the high-cost companies).
We now turn to a description of the data that will be used to test these predictions.
3 Background and Data
Arms Embargoes. The imposition of arms embargoes is a relatively recent form of UN
sanctions. In its first forty-five years, the Security Council only introduced an arms embargo
twice: against South Africa and Southern Rhodesia. Starting in 1990, however, UN embargoes
were imposed against twelve countries. The increased reliance on arms embargoes is largely a
result of the dissatisfaction with the humanitarian consequences of other forms of sanctions.
Arms embargoes are viewed as “smart sanctions” since they target only the arms sector; hence,
they are less likely to harm the victims of warfare, unlike general trade sanctions.
Still, the imposition of arms embargoes is an imperfect policy tool. Investigations point to
several instances of violations of the embargoes (Control Arms Campaign, 2006). The viola-
tions are partly a consequence of imperfections in the way international legislation concerning
embargoes is translated into national laws, but are also a result of the difficulty of detect-
ing illegal arms transactions. The bodies that investigate the violations–the UN Sanction
Committees–have very limited power, and have to rely on the voluntary collaboration of na-
tional governments in providing information. As a consequence, systematic and quantitative
evidence of arms violations is lacking (Bondi, 2004). The lack of direct evidence on these
trades is a motivation for this paper. We suggest that the indirect evidence stemming from
our methodology can usefully complement the limited direct evidence from investigations.
We start by considering all arms embargoes imposed by the UN Security Council between
1975 and 2005, as listed in Appendix Table A1. We then restrict our attention to embargoes
satisfying four criteria. (i) The embargo imposition must date after 1980, so we can find stock
price data for a significant number of arms producing companies. (ii) The embargo must
occur in a country in which conflict took place, since our identification strategy relies on news
regarding the evolution of the conflict. (iii) The embargo must last long enough that we can
identify at least one salient and unexpected conflict event during the embargo period. (iv) No
massive UN or US intervention must have occurred in the conflict, because we want to rule out
the possibility that stock price effects reflect legal sales to these actors. 3 The final embargo
3From the full list of embargoes shown in Appendix Table 1, criterion (i) eliminates South Africa, criterion
8

data set includes seven African countries (Angola, Ethiopia and Eritrea, Liberia, Rwanda,
Sierra Leone, Somalia, Sudan) and Former Yugoslavia, as listed in Appendix Table A1.
Events. For each of these eight countries we search for events affecting the intensity of
conflict, occurring both inside the embargo and outside the embargo. We follow three criteria:
(i) the event is important enough to attract the interest of media and investors; (ii) the event is,
to a first approximation, unanticipated; (iii) the event unambiguously increases or diminishes
the intensity (and expected duration) of the conflict. To select the events, we combine a qual-
itative reading of the history with a quantitative evaluation of criteria (i) and (ii). We count
the newswire stories in Lexis-Nexis that mention the name of the country under embargo in
the days surrounding the event.4 As a measure of (i), we define the Event Importance it as the
average of the news stories on the day of and the day after the event: it = (nt + nt+1) /2, where
nt is the number of stories on day t, and t is the event day. As a measure of (ii), we define the
Event Surprise st as the ratio of the Event Importance to the average daily number of stories
in the four days preceding the event: st = [(nt + nt+1) /2]/[(nt−1 + nt−2 + nt−3 + nt−4) /4].We keep only events for which the number of stories increases significantly on the event day
(typically st ≥ 2) and is relatively large (taking into account the limited news attention dedi-cated to these countries, typically it ≥ 10). While the selection of the events in our benchmarkspecifications also takes into account qualitative factors, in Table 4 we examine the robustness
of the result to the use of purely quantitative event selection procedures.
Appendix Table A2 lists the events that satisfy these criteria, including the measures of
Event Surprise and Event Importance. The eighteen events occurring during the embargo
period are emphasized. We also list the fourteen events occurring outside the embargo, which
we use in Table 5. As an example, consider the case of Sierra Leone, a country under arms
embargo from October 8, 1997. Three significant events occurred in the pre-embargo period:
two coup attempts and an important election. In the embargo period, we identify four events.
First, on March 10, 1998, the elected president of Sierra Leone, Ahmad Kabbah, returned to
his country after being forced out by a coup. This event is likely to diminish the hostilities. A
few months later, on January 9, 1999, an unsuccessful coup attempt signalled an aggravation of
the hostilities. Third, on May 18, 1999, the government forces and the rebels signed a cease-fire
agreement, decreasing the hostilities. Finally, on May 17, 2000, the leader of the rebels was
captured, leading to diminished hostilities.
Companies. We use two sources of information on arms-producing companies. The first
and main source is the matched Datastream-Worldscope data set of daily stock returns for
companies traded in all major stock markets. We identify weapon-making companies as all
companies with the primary or one of the seven secondary SIC-codes in the weapon-making
(ii) eliminates Libya, criterion (iii) eliminates Haiti, and (iv) eliminates Afghanistan and Iraq.4For robustness, we also run searches in which we specify both the country name and a name for the event
(such as “Attack”, “Fighting”, and “Peace”), resulting in similar measures.
9

range. We include the SIC codes 3482-3484, and 3489 (small arms and ammunitions), 3761,
3764, and 3769 (missiles), 3795 (tanks), and 2892 (explosives).5
The second source is a list of top-100 weapon-making companies published by the Stockholm
International Peace Research Institute (SIPRI). This classification is based on sources such as
company websites and annual reports, a SIPRI questionnaire, news from military journals and
newspapers. We use the list compiled by Dunne and Surry (2006) for the year 2004 and include
in the sample all the traded companies in this list that are available in Datastream.6
Table 1 presents a list of the countries in which the companies in the sample are head-
quartered, as well as the number of companies in each country. Appendix Table A3 reports
the full list of companies with the number of non-missing observations and the source of data.
Measures of Cost of Embargo Violation. Following the model, we collect information
on company characteristics that affect the cost of embargo violation. In particular, we collect
proxies for the ease with which companies may circumvent international restrictions on the flow
of arms, for the likelihood that companies may be caught breaching the embargo, and for the
monetary and reputational costs of an embargo violation. Lacking company-level information,
we rely on indices pertaining to the countries where the companies are head-quartered, since the
countries are responsible for monitoring the companies. We use this information to construct
measures of low cost of embargo violation.
First, we use the Corruption Perception Index (CPI) of Transparency International for the
years 1995-2005. This index draws on expert surveys to measure the perception of corruption of
public officials and politicians in a country. We use a time-average of this index to construct a
discrete measure and a continuous measure of corruption (low cost of embargo violation). The
discrete measure is an indicator variable for a value of the corruption index above the median.
The continuous variable is constructed standardizing the time-averaged index to mean zero
and standard deviation one. For ease of interpretation, we use the indicator variable as our
benchmark measure, but also examine the robustness to using the continuous variable.
Second, we use the Small Arms Trade Transparency Barometer produced by the Small
Arms Survey over the years 2004-2006. This index measures the extent to which a country
provides transparent information on small arms exports. It is based on export reports by
exporting countries as well as international customs data. The index evaluates the timeliness,
access, clarity, and comprehensiveness of the information provided by countries regarding their
exports of small arms. In addition, it also verifies the information provided on granted and
5One limitation of the data is that the data set does not include a dynamic SIC code; hence, we classify
companies based on their SIC codes in 2005.6An accessory source of data is a list of 1,160 small-arm producing companies published by the non-profit
organization NISAT. Within this list, we identify the 53 publicly traded companies present in Datastream. Some
of them overlap with the sample constructed through SIC codes or SIPRI, others do not. Since NISAT does
not publish the exact criteria used to produce this list, we employ it only for a robustness check in Table 8.
10
denied licences, and on actual deliveries. We use the overall score that takes into account all
these components, and we average it across the years 2004-2006. We use this average score to
construct both a discrete and a continuous measure of low transparency (low cost of embargo
violation). This variable has the advantage of being closely linked to transparency in the arms
sector, and the disadvantage of not being available for some of the countries in our sample.
Third, we identify the countries that did not belong to the OECD in 1985. Membership in
an international organization is likely to raise the reputational costs of violating international
rules on arms embargo.
Fourth, we use the measure of press freedom provided by Freedom House for the years 1994-
2004. Countries with a less free press are less likely to monitor illegal transactions conducted
by companies head-quartered in their country. We average the measure across the years and
define an indicator variable for below-median press freedom and standardize the continuous
variable.
A fifth measure, also produced by Transparency International, is the Bribe Payers Index
(BPI). This index ranks the top 30 exporting countries according to their propensity to bribe
abroad, and is constructed from the opinions of business executives. We use the most accurate
and comprehensive definition of the index, that is the 2006 BPI.7 While the CPI measures
the likelihood that firms corrupt officials in their own countries (e.g., to obtain licenses), the
BPI captures the likelihood that firms bribe the officials of importing countries (either the
conflict countries or some third, transit country). One shortcoming of the BPI is that it is only
available for 30 countries and does not cover some of the countries in our sample. We define a
discrete and continuous variable using the same methodology as for the corruption variable.
Sixth, we use the self-dealing index of Djankov et al. (2006) as a measure of protection
of small shareholders. In countries where small shareholders have fewer control rights (high
self-dealing), they are also less likely to have access to information about illegal behavior by
the managers. We define a discrete and continuous variable of high self-dealing.
In Table 1 we list separately the companies in OECD markets and non-OECD markets, and
we indicate whether the countries where the companies are head-quartered belong to countries
with low cost of embargo violation according to the measures above.
Returns. For both the Datastream-Worldscope sample and the SIPRI sample, we down-
load the daily return data from Datastream for the years 1985-2005. We drop penny stocks
defined as stocks with price of less than 2 units in the local currency unit. We also trim the
top and bottom 2/10,000th of returns to avoid extreme outliers. Finally, we drop returns that
are zero for ten consecutive days, since this likely indicates a stale price series.
For our main specification, we correct for correlation with market returns using a market
7We do not average this measure with the previous years because the measure for 2006 is not comparable
with the measure for the previous years.
11
model. For each year, we estimate the market model
ri,t = αi + βirm(i),t + εi,t, (9)
where ri,t is the return of company i on day t and rm(i),t is the return of the value-weighted
market index for the country in which company i is traded. We then generate abnormal returns
ei,t = ri,t − αti,t − βi,trm(i),t where αi,t and βi,t are estimated on data for the previous year,
requiring a minimum of 40 return observations. In most specifications, we focus on 3-day
returns, since the exact day of the event is sometimes hard to determine. As an additional
reason to use a 3-day window, while we can measure when a piece of information emerges in the
news wires, we do not observe when the marginal investor learns the information, which could
occur earlier, or later. We compute the 3-day return e(−1,1)i,t as the cumulative abnormal return:
e(−1,1)i,t = ei,t−1+ei,t+ei,t+1.We show that the results are robust to using 3-day cumulative raw
returns (r(−1,1)i,t = ri,t−1 + ri,t + ri,t+1) and 3-day cumulative excess returns (r
(−1,1)i,t − r
(−1,1)m,t ).
We also show that our results are similar when we employ one-day abnormal returns ei,t.
Match events-returns. We match the events to returns on the same day.8 For events
occurring in the weekend, we shift the event date to the Monday following the weekend.
4 Event Studies
In this Section, using an event study methodology, we estimate whether on average conflict
events affect stock returns for all arms companies and for companies of a particular type.
Graphical evidence. In Figure 1a, we plot the average (equal-weighted) abnormal 3-day
return e(−1,1)i,t on days in which an event during an embargo diminishes the hostilities, in which
no event occurs, or in which an event during an embargo increases the hostilities. The number
of observation refers to the number of non-missing return observations.
In correspondence of the 10 events (996 return observations) diminishing hostilities, stock
returns increase on average by .03 percentage points, a small change. In correspondence of the
8 events (790 return observations) increasing hostilities, stock returns diminish by on average
.05 percentage points. Neither estimate is significantly different from zero9. On the remaining
trading days, returns are precisely estimated to be zero, as one would expect given that the
returns are market-corrected. Overall, therefore, arms-producing companies do not appear to
respond to events affecting conflicts during embargoes. Prima facie, we find no evidence on
aggregate of investor-backed illegal arms trading.
8In Column (4) of Table 2 we show that the results are similar if we shift the event date by one day for
companies traded in stock markets with more than an 8-hour difference (such as Asian markets or Australia).9The notes to Figures 1a-1c report the standard errors of the regressions of mean returns for the different
types of events on a constant, with standard errors clustered by date.
12
This pattern, however, could simply reflect the opposing effects outlined in Section 2.
Companies expecting to trade arms legally after the end of the embargo are hurt by increases
in conflicts, while companies trading illegally are benefited. To the extent that the expected
profits and gains average approximately to zero across the two types of companies, we would
indeed expect to find no impact of the events on stock returns.
If we knew which companies trade legally and which ones do not, we would simply separate
them into two groups, and estimate the returns separately. Since the identity of the companies
exporting illegally (if any) is unknown, we rely on variables that are likely to be correlated
with the cost of performing illegal trades and of violating the arms embargo, as presented
in Section 3. In particular, we separate companies by whether the market where they are
headquartered is in a country with above- or below-median corruption level according to the
Corruption Perceptions Index. In below-median corruption countries, such as USA, most of
Western Europe, or Australia, the legal and reputation cost of illegal trades is likely to loom
large that in above-median-corruption countries, such as Italy, Japan, China or South Africa.
Figure 1b presents the results of Figure 1a separately for the two groups of companies. For
the companies in low-corruption countries, the events diminishing hostilities have a (signifi-
cantly) positive impact on returns (.32 percentage points, 709 observations), while the events
increasing hostilities are associated with -.54 percentage point lower returns (576 observations).
The data provides some support for the hypothesis that on average companies in low-corruption
countries do not engage in illegal trading, and are somewhat hurt by hostilities, which nega-
tively affect their ability to trade legally. This is consistent with the predictions of the model
for companies with high cost of violating the embargo (Prediction 1.(i)).
For companies in high-corruption markets, the results are very different. The events di-
minishing the hostilities are associated with a -.49 percent decrease in stock return (287 obser-
vations). The events increasing hostilities are associated with a substantial (and significant)
positive return of 1.06 percentage points over three days (214 observations). The pattern for
these companies is consistent with illegal arms trading on average, and the magnitudes of the
effects are quite substantial. The larger returns for increases in hostilities can be explained by
the fact that events diminishing hostilities such as cease-fires are easier for investors to antic-
ipate, and hence are more likely to be priced by the time the cease-fire takes place. Overall,
this evidence is consistent with the predictions of the model for companies with low cost of
violating the embargo (Prediction 1.(ii)).
Finally, in Figure 1c we present evidence on the returns to events occurring in non-embargo
periods. The sample of events includes fourteen events occurring in the 8 countries of our
sample outside the embargo period (Appendix Table A2), as well as nineteen events in other
countries not subject to arms embargo (see below for additional details). The events decreasing
the hostilities are associated with a small decrease in returns and the events increasing the
hostilities are associated with a slight increase in returns. The patterns do not differ for
13

countries with corruption above and below the median. The flatter response compared to the
response to events inside the embargo is consistent with Prediction 2.(i) of the model: the
sign of the response to events outside the embargo is ambiguous for low-corruption companies.
These events increase the current demand (and profits) of arms sales, but they also increase
the probability of a future embargo, which hurts expected profits.
So far, we have aggregated all the events that increase or decrease the intensity of the
conflict. For the events occurring during the embargo (Figure 1b), we now present the disag-
gregated event-by-event returns. For ease of interpretation, we separate the 8 events increasing
conflict (Figure 2a) from the 10 events decreasing conflict (Figure 2b). Remarkably, for 7 out
of 8 events increasing conflict (Figure 2a) the abnormal returns are negative for companies in
low-corruption countries, and positive for companies in high-corruption countries. Among the
10 event decreasing conflict (Figure 2b), there is a correspondent, though less regular, pattern:
7 out of 10 events are associated with positive returns among the low-corruption countries,
and 6 out of 10 events with negative returns among the high-corruption countries.
These results indicate that the aggregate event returns in Figure 1b are not due to an
outlier, but instead hold for the large majority of events. For the companies in low-corruption
countries, in 14 out of 18 events the sign of the event returns is consistent with Prediction
1.(i). Using a binomial test, the probability of 14 or more consistent signs under the null of
equal probability of positive or negative signs is .0154, suggesting that this pattern is unlikely
to be due to chance. Similarly, for the companies in high-corruption countries, in 13 out of
18 events the sign of the returns is consistent with Prediction 1.(ii). The probability of 13 or
more consistent signs is .0481, again a pattern unlikely to be random. In the remainder of the
paper, to increase power we pool the events and consider aggregate event returns.
Benchmark Results. In Table 2, we present our main results for the event returns during
the embargo, as in Figure 1b. In Column (1) we estimate the benchmark specification
e(−1,1)i,t = α+ γEmbt + αDDi + γDEmbt ∗Di + ηi,t (10)
where e(−1,1)i,t is the 3-day abnormal return for company i on date t; Embt is a variable that
equals 1 if an event increasing conflict occurs during embargo at time t, -1 if an event decreasing
conflict occurs during embargo at time t, and 0 otherwise. The variable Di is an indicator for
whether the company is head-quartered in a high-corruption country, or for other proxies of low
cost of embargo violation. The standard errors are robust to heteroskedasticity and clustered
by date, so as to allow for arbitrary correlation of returns within a date across companies.
The estimates α = −.0001 and αD = −.0001 indicates that, in absence of events, theaverage return is zero for both types of companies. The key parameters are γ, capturing the
effect of an event during embargo for companies in low-corruption countries, and γD, capturing
the differential effect for companies in high-corruption countries. The estimate γ = −.0042implies that an event raising hostilities during embargo lowers stock returns significantly by
14

.42 percentage points for companies in low-corruption countries, and the converse for an event
decreasing hostilities. The estimate γD = .0115 indicates that, relative to the effect in low-
corruption countries, the effect of an event increasing hostilities in high-corruption countries
is 1.15 percentage points higher, a significant difference. The coefficient estimates bγ andbγ+bγD therefore capture the impact of events occurring during embargoes for the two types ofcompanies, as in Figure 1b, except for the additional restriction that increases and decreases
in conflict intensity have symmetric effects. This restriction, which we impose to increase the
power of the estimation, is not rejected by the data (see Figure 1b).
In Columns (2) and (3) we present two alternative estimation procedures. In Column (2),
we estimate specification (10) only on event days; this requires setting α = αD = 0.We obtain
essentially identical point estimates and standard errors for both coefficients of interest, γ and
γD. This is not surprising, since both α and αD are estimated to be essentially zero. Since
the results are identical, in the rest of the paper we use the whole sample, since this allows
us to test that the returns are on average zero on non-event days. In Column (3) we estimate
e(−1,1)i,t = α+ γEmbt ∗ (1−Di) + αDDi + γDEmbt ∗Di + ηi,t, so that γ
D captures the overall
return for high-corruption countries (that is, not compared to low-corruption countries). The
estimate γD = .0073 is positive and significant.
In Column (4) we examine the role of the time difference between the country of the event
and the stock market where the company is traded. We shift forward (or backward) by one
day events for companies that are traded in countries with a time difference of more than eight
hours in either direction. The results are very similar. In Column (5) we examine the role
of time-series correlation and show that the standard errors are somewhat smaller when we
cluster by company, and hence allow for arbitrary autocorrelation within a company over time.
Given this finding, in the next specifications we use the more conservative standard errors and
cluster standard errors by date. Then, we show that the results do not depend on the market
correction, since we obtain similar results using raw returns (r(−1,1)i,t , Column (6)) or using
returns net of the market (r(−1,1)i,t − r
(−1,1)m,t , Column (7)). Finally, the results are comparable
in the two (overlapping) samples of arms-producing companies: the companies in Worldscope
and the companies identified by SIPRI (not shown).
Overall, we find evidence suggesting that, on average, investors expect arms companies
in low-corruption countries to trade legally, but firms in high corruption countries to trade
illegally. The magnitudes of the coefficients are quite large.
Measures of Cost of Embargo Violation. So far, we examined the impact of above-
median corruption. In Panel A of Table 3, we re-estimate specification (10) using alternative
discrete measures Di of low cost of embargo violation, presented in Section 3. In addition, in
Panel B of Table 3, we estimate the alternative specification
e(−1,1)i,t = α+ γEmbt + αDSi + γDEmbtSi + ηi,t,
15
where Si is a continuous measure of the costs of embargo violation, standardized across coun-
tries with mean zero and standard deviation one (see Section 3). Higher values indicate lower
costs of embargo violation.
In Column (1), Panel A, we reproduce the baseline effect of the corruption measure of
Table 2. In Panel B, we obtain similar results using the continuous standardized measure of
corruption. A one-standard deviation increase in corruption significantly increases the return
response to a war event by .66 percentage points (αD = .0066).
In Column (2), we consider a measure that is more directly tied to arms production, the
index of transparency of small arms trade collected by the Small Arms Survey. The more easily
available is information on arms exports, the more difficult it is for a company to conceal illegal
arms trades. While the indicator Di for low transparency is correlated with the indicator of
corruption, the two variables differ in 7 of the 23 countries for which the transparency data
is available (Table 1). As Column (2) in Table 3 shows, companies in countries with less
transparent arms reports display 1.14 percentage points more reaction to the events during an
embargo (γ = .0114), a significant difference. The effect replicates using a continuous measure
of transparency in arms trade (Panel B). This suggests that availability of information about
arms trade is likely to be a determinant of embargo violations.
In Column (3) we use membership in the OECD in 1985, the beginning of the sample, as
an alternative proxy. Membership in an international organization like the OECD is likely to
raise the reputation costs of a violation of an embargo. Indeed, stock returns for non-OECD
companies respond significantly more to conflict events during an embargo. Illegal arms trade
appears to be more common on average for companies in non-OECD countries.
In Column (4), we attempt to capture the role of the media using the measure of press
freedom provided by Freedom House. The results for the low press freedom variable are
directionally similar as for the previous three measures, but the estimates are smaller and
not significant (marginally significant with the continuous variable). Taken at face value, this
suggests that the role of freedom of the media may not be as important, though we cannot
reject estimates of the size of Columns (1)-(3). We obtain similar results using a measure of
propensity of managers to pay bribes that we employ in Column (5).
Finally, in Column (6) we use the Djankov et al. (2006) measure of the control powers of
minority shareholders. To the extent that some minority shareholders are aware of and disagree
with illegal arms trades, this measure captures the extent to which these minority shareholders
may be able to question and block the arms trade. We do not find a significant impact of this
measure, although the point estimate for γD is positive as for the other measures.
In the rest of the paper, we use the discrete measure Di of corruption as the benchmark
measure, supplemented by the discrete measure of transparency in some of the specifications.
The findings in the paper are similar using the continuous measure of corruption, the arms
transparency proxy (discrete or continuous), and the measure of membership in the OECD.
16

Event Selection. As we discussed in Section 3, the selection of events during the embargo
is based on a qualitative evaluation of the history of the conflicts, complemented by quantitative
information on the number of news wire stories on days surrounding the events. In Table 4,
we examine the robustness of the results to the definition of the events.
In Column (1) of Table 4 we reproduce the benchmark results using the standard set of
18 events during the embargo. In Column (2) we present the results for a specification that
uses a broader set of 35 events during the embargo. This set includes, in addition to the 18
events in the standard definition, 17 other events that, while significant for the history of the
conflict, were not evaluated to be sufficiently unexpected or sufficiently salient. The results
are qualitatively similar to the ones in the benchmark specification, but the point estimates
are only about half as large. In Column (3) we estimate the impact of the events including
variables for both definitions. The results depend to a large extent on the events included
in the core, narrow definition. As expected, the core set of events appears to capture more
significant events. These events lead to larger changes in the demand for arms (αt in the
model), and hence larger impacts on firms value.
In Columns (4)-(7) we evaluate the results using a quantitative definition of the events. We
employ the measures of Event Importance ii (number of news stories) and of Event Surprise st
(increase in the number of news stories around the event), defined in Section 3.We estimate the
specification of Column (2) using the broad sample of 35 events, but we weigh the estimates
by the Event Importance (Column (4)) and by the Event Surprise (Column (5)). In both
specifications, the point estimate of the effect of high-corruption countries γD is larger than
in the unweighted regression (Column (2)). In Column (6) and (7) we estimate the impact
of events using an automated definition of events based on Event Importance it and Event
Surprise si. Out of the broad sample of events, in Column (6) we use the 21 events with
it ≥ 10 and si ≥ 2, and in Column (7) the 10 events with it ≥ 20 and si ≥ 3. As expected, theestimates of the coefficient γD using these cutoffs are larger than the estimates in the broad
sample (Column (2)) and, using the more restrictive set of events in Column (7), close to the
estimates with the core events (Column (1)). The fact that the estimates are largest using the
core sample of events suggests that the qualitative information used to choose the core events
is informative. Hence, we use the core set of 18 events in the remainder of the paper.
Events Outside the Embargo. The model in Section 2 yields predictions on the returns
associated with events outside the embargo. The response to events increasing hostilities
outside an embargo is ambiguous for high-cost companies (Prediction 2.(i)): these events lead
to a contemporaneous increase in profits, but also to an expected loss from the increased
likelihood of embargo imposition. Compared to the effect for high-cost companies, the effect
for low-cost companies is positive but it is arguably small, since changes in the probability of
embargo imposition are likely to be small. To test these predictions we estimate the following
17

augmented version of equation (10):
e(−1,1)i,t = α+ αDDi + γEmbt + γDEmbt ∗Di + δOutt + δDOutt ∗Di + ηi,t. (11)
The variable Outt equals 1 if an event increasing conflict occurs outside embargo at time t, -1
if an event decreasing conflict occurs outside embargo at time t, and 0 otherwise.
We construct the variable Outt using two sets of events: (i) 14 events occurring outside
the embargo period for the same eight countries in which embargoes were eventually imposed
(Appendix Table A2); (ii) 19 events affecting conflict for countries which experienced conflict
but not an arms embargo: Algeria, Haiti, Venezuela, Tajikistan, Central African Republic,
Ivory Coast, Democratic Republic of Congo, and Togo.10 We denote this second set of events
as “Events in countries without embargo”.
The results are displayed in Table 5. In Column (1) we estimate specification (11) on
the aggregate, without distinguishing between high- and low-cost companies (that is, we set
αD = γD = δD = 0). We find no effect for events occurring in embargoed countries, and we
find a small positive (not significant) effect for events in non-embargoed countries. The effect
does not differ between companies with high and low cost of embargo breach (Columns (2)
and (3)) in either data set of events. The small effect for firms with high cost of embargo
violation is consistent with Prediction 2.(i)) of the model. Events outside the embargo have
two opposing effects on profits, which can cancel out. The model, however, also predicts a more
positive response for firms with low costs of embargo violation (Prediction 2.(ii)), which we do
not find. However, as we document in the calibration in Section 5, the difference between high-
and low-cost firms is likely to be small, so that we may not be able to detect it empirically.
As we discuss in section 5, these results help us rule out several potential explanations of
our main result, such as the possibility that the higher demand for arms for low-cost companies
is the result of generalized political instability in the region, of the depletion of old stocks, or of
increased input prices. If this were the case, we should find similar effects for events occurring
outside the embargo. Table 5 shows that this is not the case.
Timing. In Table 6, we return to our main specification and investigate on which day the
stock returns incorporate the information of the event. We run specifications as in (10), except
that the dependent variable is a 1-day abnormal return at different windows around the event.
Half of the impact of the events for the high-corruption countries (γD) occurs on the day of
the event, and about one fourth of the impact each occurs on the day before and the day after
the event. This suggest that the coding is fairly accurate. Somewhat surprisingly, the impact
for the low-corruption countries (γ) occurs more on the day before than on the other days.
Placebos. An alternative interpretation of the results above is that an omitted variable
induces a correlation between the events and stock returns. While it is not clear why the
10While Haiti was subject to arms embargo in 1993 and 1994, the events we identify occur outside this period.
18
omitted variables would produce an effect only for companies in high-corruption markets, we
address this concern directly by presenting regressions at horizons for which, if the model is
correctly specified, we should observe no effect. Columns (1) through (6) of Table 7 present the
results of these placebo regressions. The specification is as in (10), except that the dependent
variables are 3-day abnormal stock returns at horizons (-10,-8), (-7,-5), (-4,-2), (2,4), (5,7), and
(8,10) around the event. At these horizons the events should have no effect on stock returns.
For example, Column (1) of Table 7 tests whether an increase in conflict on day t affects stock
returns between date t − 10 and date t − 8, which clearly should not be the case. The datapasses this placebo test. We reject the null hypothesis of no effect at the 10 percent level for
only one of twelve estimates for γ and γD in Columns (1) through (6).
While in Columns (1) through (6) we exploit the timing of the effects to generate placebo
treatments, in Column (7) we exploit market returns to present another placebo treatment.
We replicate the specification (10) with, as dependent variable, the 3-day return around the
event for the stock market index of the market in which each company is traded. Since arms-
producing companies are a small share of the stock market capitalization, this tests that war
events do not affect stock valuations in sectors like the food, engineering, and service sectors.
(Note that the stock markets chosen are the ones in which the arms-producing companies are
traded, not the ones in which the war events occur.) We do not find any significant effect of
the war events. The coefficient γ1 is essentially zero, suggesting no different response in high-
and low-corruption countries to events during embargo in this placebo treatment.
While one can never reject the possibility that an omitted variable is causing the findings
in Table 2, a systematic mis-specification of the model does not appear to be responsible for
the results.
Firm Characteristics. We now estimate how the event returns depend on firm size and
type of arms produced. In Columns (1) and (2) of Table 8 we split the sample into small
and large firms. This analysis addresses whether the positive returns for the companies in
high-corruption countries are mostly due to differences in firm size. Larger firms are less likely
to display significant event returns, since the profits from these trades are likely to be a smaller
share of the balance sheets. We define as “small” firms those in the bottom quartile of annual
revenue (in US dollars) in any given year. The remaining firms are classified as “large”. We
find that both the response of low-corruption countries (γ) and the differential response of
high-corruption countries (γD) are substantially higher (in absolute value) for small firms.
Size therefore does not explain the results, though it affects them.
Next, we estimate which types of weapons are mostly responsible for the results. We
estimate specification (10) separately for companies with SIC codes in the range 3482-3484,
and 3489 (small arms and ammunitions, Column (3)), 3761, 3764, and 3769 (missiles, Column
(4)), 3795 (tanks, Column (5)), and 2892 (explosives, Column (6)). In each specification,
we include companies that have one of the eight SIC codes in the required range; hence, the
19

samples in Columns (3) through (6) are not mutually exclusive. The estimate for γD is positive
in all types of arms, and it is marginally significant for companies producing small arms and
ammunitions, a category likely to be heavily used in this type of conflicts. Beyond small arms
and ammunitions, the estimate for γD is largest for consumable arms–explosives and missiles.
In Column (5), we provide a second test of the impact of war events for small arms. We
re-estimate specification (10) on the sample of companies that the non-profit organization
NISAT identifies as responsible for small arms sales. (Additional details are in the Section 3.)
The sample overlaps partially with the sample in Column (1), but it also includes additional
companies. Over this sample, the estimate of γ1 is positive, but not significant (γ1 = .0050).
5 Calibration and Explanations
Calibration. The event returns can be used to compute, under a set of assumptions, the
implied profits from legal and illegal arms trading. Before we proceed, we should note that
the calibration depends on parameters that are hard to estimate, such as the change in the
demand for arms. As such, the calibrated profits come with substantial uncertainty and are
meant to indicate an order of magnitude of the effects, as opposed to precise magnitudes.
Expressions (5)-(8) indicate the change in company value due to infinitesimal changes in
the demand of arms αt. Since the observed events involve discrete, as opposed to infinitesimal,
changes dαt, we use a linear approximation to obtain the resulting discrete change in value dV :
dV = ∂V/∂αt ∗ dαt. We note that the following calculations do not assume that companiesonly sell arms to countries under conflict. We can write the total company value V ALL as the
sum of V (the relevant value) and V OTH (the other company value). To the extent that V OTH
is orthogonal to shifts in demand due to conflict events (that is, ∂V OTH/∂αt = 0), ∂VALL/∂αt
equals ∂V/∂αt. Expressions (5) and (6) for the value under embargo VE imply
dV HE = −δ ¡P 0E,E (αt) dαt¢ EπN
1− δ (EPE,E −EPN,E), (12)
dV LE − dV H
E = πLE (αt)dαtαt
+ δ¡P 0E,E (αt) dαt
¢ EπLE1− δ (EPE,E −EPN,E)
. (13)
We assume time periods t corresponding to one year and a yearly discount factor δ = .95.
To calibrate the parameters, we use the broad sample of countries11 used for Table 5 over the
period 1985-2006. We compute EPE,E as the fraction of countries under arms embargo in (at
least a part of) year t that is still under arms embargo in year t+1 and obtain EPE,E = .928.
Similarly, we compute EPN,E as the fraction of countries that are not under arms embargo
in year t but that are under arms embargo in year t + 1: EPN,E = .043. As an illustration
11This avoids selecting only countries that are ultimately under arms embargo, which would bias the transition
probabilities.
20
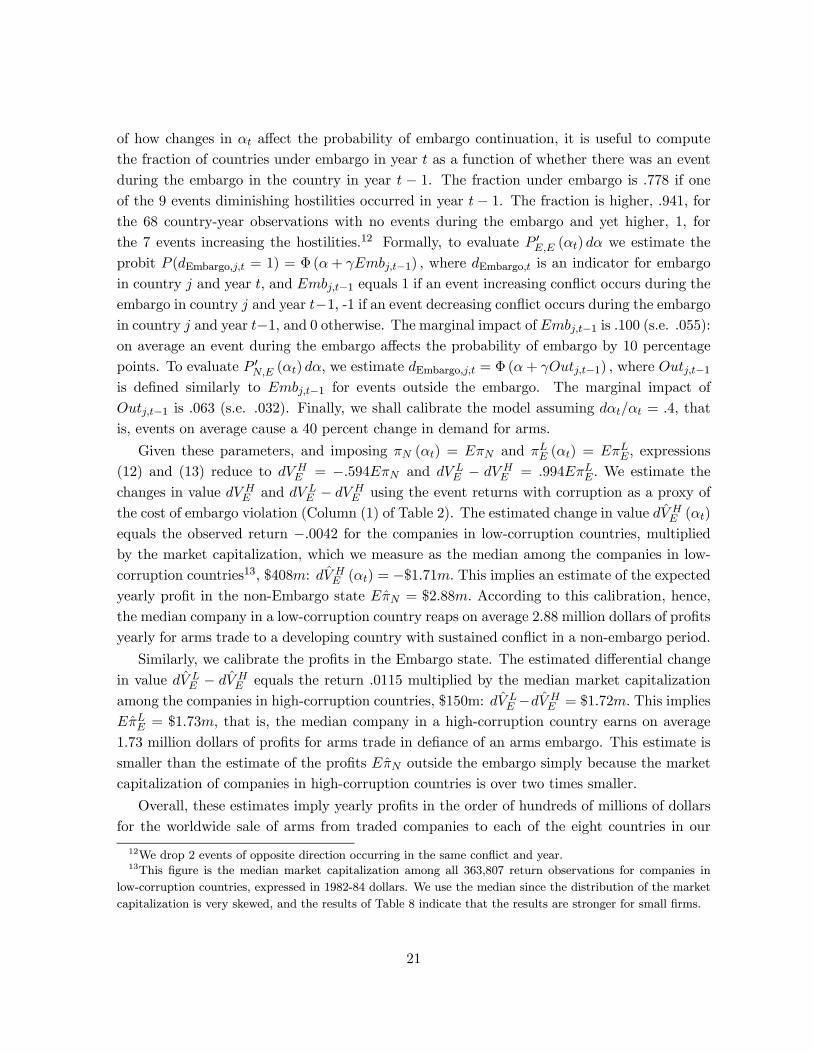
of how changes in αt affect the probability of embargo continuation, it is useful to compute
the fraction of countries under embargo in year t as a function of whether there was an event
during the embargo in the country in year t − 1. The fraction under embargo is .778 if oneof the 9 events diminishing hostilities occurred in year t− 1. The fraction is higher, .941, forthe 68 country-year observations with no events during the embargo and yet higher, 1, for
the 7 events increasing the hostilities.12 Formally, to evaluate P 0E,E (αt) dα we estimate theprobit P (dEmbargo,j,t = 1) = Φ (α+ γEmbj,t−1) , where dEmbargo,t is an indicator for embargoin country j and year t, and Embj,t−1 equals 1 if an event increasing conflict occurs during theembargo in country j and year t−1, -1 if an event decreasing conflict occurs during the embargoin country j and year t−1, and 0 otherwise. The marginal impact of Embj,t−1 is .100 (s.e. .055):on average an event during the embargo affects the probability of embargo by 10 percentage
points. To evaluate P 0N,E (αt) dα, we estimate dEmbargo,j,t = Φ (α+ γOutj,t−1) , where Outj,t−1is defined similarly to Embj,t−1 for events outside the embargo. The marginal impact of
Outj,t−1 is .063 (s.e. .032). Finally, we shall calibrate the model assuming dαt/αt = .4, that
is, events on average cause a 40 percent change in demand for arms.
Given these parameters, and imposing πN (αt) = EπN and πLE (αt) = EπLE, expressions
(12) and (13) reduce to dV HE = −.594EπN and dV L
E − dV HE = .994EπLE. We estimate the
changes in value dV HE and dV L
E − dV HE using the event returns with corruption as a proxy of
the cost of embargo violation (Column (1) of Table 2). The estimated change in value dV HE (αt)
equals the observed return −.0042 for the companies in low-corruption countries, multipliedby the market capitalization, which we measure as the median among the companies in low-
corruption countries13, $408m: dV HE (αt) = −$1.71m. This implies an estimate of the expected
yearly profit in the non-Embargo state EπN = $2.88m. According to this calibration, hence,
the median company in a low-corruption country reaps on average 2.88 million dollars of profits
yearly for arms trade to a developing country with sustained conflict in a non-embargo period.
Similarly, we calibrate the profits in the Embargo state. The estimated differential change
in value dV LE − dV H
E equals the return .0115 multiplied by the median market capitalization
among the companies in high-corruption countries, $150m: dV LE −dV H
E = $1.72m. This implies
EπLE = $1.73m, that is, the median company in a high-corruption country earns on average
1.73 million dollars of profits for arms trade in defiance of an arms embargo. This estimate is
smaller than the estimate of the profits EπN outside the embargo simply because the market
capitalization of companies in high-corruption countries is over two times smaller.
Overall, these estimates imply yearly profits in the order of hundreds of millions of dollars
for the worldwide sale of arms from traded companies to each of the eight countries in our
12We drop 2 events of opposite direction occurring in the same conflict and year.13This figure is the median market capitalization among all 363,807 return observations for companies in
low-corruption countries, expressed in 1982-84 dollars. We use the median since the distribution of the market
capitalization is very skewed, and the results of Table 8 indicate that the results are stronger for small firms.
21

sample. These are large numbers, but not inconceivable for economies with GDPs in the order
of (tens of) billions of dollars, and where defense expenditure is a large share of the economy.
As a consistency check, we use these parameters and the estimated values for EπN and
EπLE to predict the returns to events outside the embargo, estimated in Table 5. Multiplying
expressions (7) and (8) by dα and evaluating them at the parameters yields dV HN = .023EπN
and dV LN − dV H
N = .376EπLE. Using the estimated EπN and EπLE and the same market cap-
italization figures as above, the predicted returns are rHN = .0002 and rLN − rHN = .0043. We
compare these to the estimated returns in Table 5, Column (2). The returns to the two sets of
events outside the embargo in high-cost (low-corruption) companies are .0003 and .0023, close
to the predicted return. The differential returns for low-cost (high-corruption) companies are
-.0008 and .0008, none of which is significantly different from .0043. The parameters estimated
from the response to events during the embargo, therefore, are broadly consistent with the
observed response to events outside the embargo.
Explanations. Illegal trade. Our interpretation is that the abnormal returns in the
event window are evidence of profits due to legal and illegal arms trade. We should point out
that the findings up to this point only show an average effect across the companies. They do not
show that all, or even most, arms companies in high-corruption countries trade illegally. They
also do not rule out that some companies in low-corruption countries trade illegally. Moreover,
our interpretation does not imply that arms companies in high-corruption countries violate the
embargo directly. It is possible that the trade of arms flows through an intermediary, in a way
that still leaves the original company a substantial profit margin.
Depletion of old arms. An alternative interpretation is that the event returns indicate
increases in the world demand for arms due to depletion of old stocks. Even if the countries un-
der embargo do not import new weapons but just deplete existing ones, the increased depletion
will generate a positive demand shift for weapon companies at some point in the future, when
the depleted stock will have to be replenished. This explanation, however, does not explain
why the effect of the events is significant under embargo, but not outside the embargo, nor the
difference in response between companies with low- and high-cost of embargo violation.
Investor beliefs. Our detection procedure is based on the assumption of well-informed
investors. It is possible that there is no illegal arms trading, but the marginal investor is mis-
informed, and reacts as if there were trade. While we cannot test for investor rationality, it
is plausible that investors close to the top management would know if illegal arms trade takes
place, and they would have strong incentives to trade in the days of conflict events.
Composition of arms production. The difference in results between companies with
low and high cost of embargo violation may be due to differences in the type of arms they pro-
duce. Companies in high-cost countries may be less likely to produce arms used in developing
countries, and hence respond less to conflict events in these countries. This, however, does not
explain why companies in high-cost countries respond negatively to increases in conflict.
22

Regional Instability. The impact of events under the embargo may be due to the
destabilizing impact on neighboring countries. The impact on profits could then be due not to
illegal arms trades, but to legal arms trades to neighboring countries. However, the fact that we
find a different impact for events occurring outside the embargo is harder to reconcile–unless
one posits that events inside the embargo are more significant.
Input and Product Mix. An event may cause an increase in demand not only for the
weapons produced by low-cost companies, but also for the inputs used in the production of
arms in high-cost companies. Even if these latter companies do not trade in the conflict zone,
their returns may respond negatively, as we observe empirically. This would predict, though,
a similar finding for the events outside the embargo, which we do not observe.
6 Detecting Individual Violations
Our final set of empirical evidence is in the spirit of the detection of illegal behavior of the
forensic economics literature (Jacob and Levitt, 2003; Duggan and Levitt, 2002; Wolfers, 2006;
Hsieh and Moretti, 2006). While in Section 4 we examined average event returns across groups
of companies, in this Section we consider each company and event in isolation. We record
each time an ‘anomalous’ reaction occurs (see below for a definition) and generate a list of
companies and events that the returns suggest may be embargo violators. While we do not
reveal the identity of individual firms, we illustrate the characteristics of the firms that this
methodology singles out. Before detailing the procedure, we should note that, since we only
observe a small number of events, this detection procedure remains subject to substantial error
margins. Nevertheless, it provides an idea of a possible forensic application.
To estimate event reactions, we use cumulative abnormal 3-day returns e(−1,1)i,t = ei,t−1 +
ei,t + ei,t+1 computed using the market model (9) with an estimation window of 100 trading
days.14 For each company-event observation, we test the null that the event does not affect
the abnormal returns of the company. We use the parametric tests of Campbell et al. (1997)
with a 10 percent significance threshold.
Individual reactions. We first analyze reactions to individual events, and then combine
individual reactions into a measure of chains of reactions. As suggested by the model in Section
2, we isolate three types of reactions to individual events. The first two types of reaction are
to events inside the embargo. The first type of reaction is that of companies whose return
significantly increases (decreases) when conflict increases (decreases) during the embargo–a
14This procedure differs slightly from the market correction procedure adopted in the previous Section where,
for computational reasons, the market model is estimated over the previous year of data, instead of over the
previous 100 days. Because of this difference, the number of non-missing return observations for events during
the embargo is 1,838, compared to 1,786 in the previous Section (see Column (2) in Table 2). The results in
this Section are essentially identical if we restrict the sample to the 1,786 events.
23
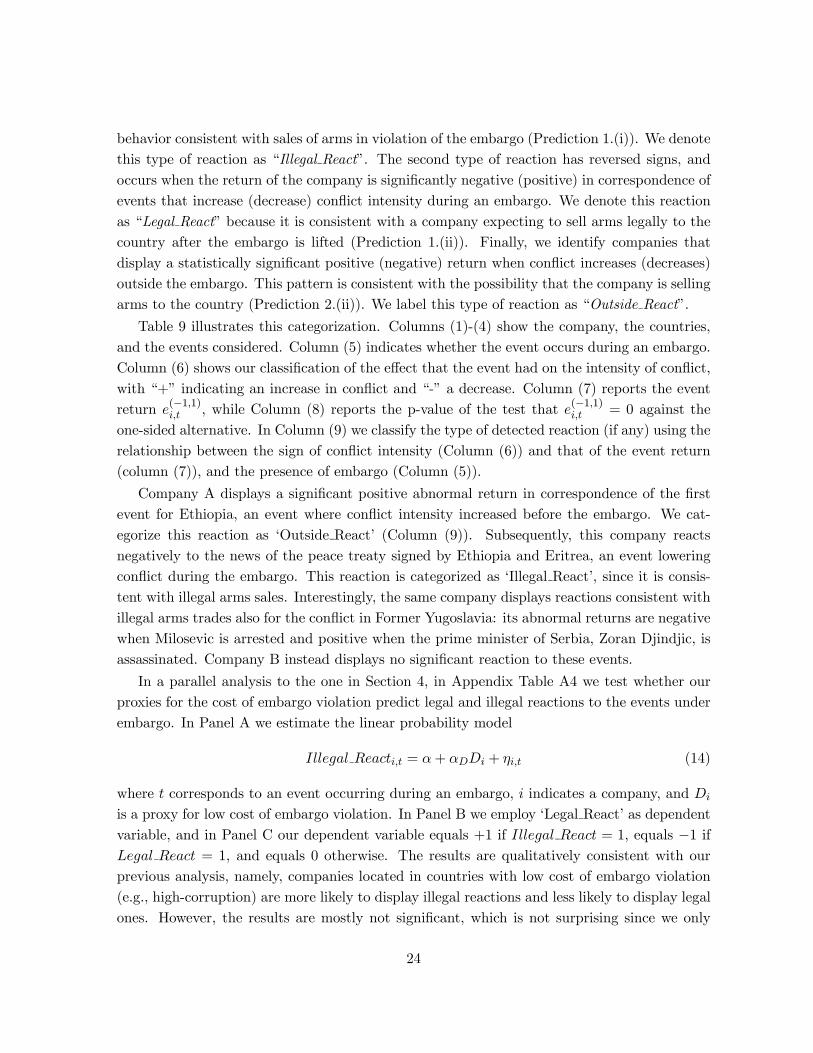
behavior consistent with sales of arms in violation of the embargo (Prediction 1.(i)). We denote
this type of reaction as “Illegal React”. The second type of reaction has reversed signs, and
occurs when the return of the company is significantly negative (positive) in correspondence of
events that increase (decrease) conflict intensity during an embargo. We denote this reaction
as “Legal React” because it is consistent with a company expecting to sell arms legally to the
country after the embargo is lifted (Prediction 1.(ii)). Finally, we identify companies that
display a statistically significant positive (negative) return when conflict increases (decreases)
outside the embargo. This pattern is consistent with the possibility that the company is selling
arms to the country (Prediction 2.(ii)). We label this type of reaction as “Outside React”.
Table 9 illustrates this categorization. Columns (1)-(4) show the company, the countries,
and the events considered. Column (5) indicates whether the event occurs during an embargo.
Column (6) shows our classification of the effect that the event had on the intensity of conflict,
with “+” indicating an increase in conflict and “-” a decrease. Column (7) reports the event
return e(−1,1)i,t , while Column (8) reports the p-value of the test that e
(−1,1)i,t = 0 against the
one-sided alternative. In Column (9) we classify the type of detected reaction (if any) using the
relationship between the sign of conflict intensity (Column (6)) and that of the event return
(column (7)), and the presence of embargo (Column (5)).
Company A displays a significant positive abnormal return in correspondence of the first
event for Ethiopia, an event where conflict intensity increased before the embargo. We cat-
egorize this reaction as ‘Outside React’ (Column (9)). Subsequently, this company reacts
negatively to the news of the peace treaty signed by Ethiopia and Eritrea, an event lowering
conflict during the embargo. This reaction is categorized as ‘Illegal React’, since it is consis-
tent with illegal arms sales. Interestingly, the same company displays reactions consistent with
illegal arms trades also for the conflict in Former Yugoslavia: its abnormal returns are negative
when Milosevic is arrested and positive when the prime minister of Serbia, Zoran Djindjic, is
assassinated. Company B instead displays no significant reaction to these events.
In a parallel analysis to the one in Section 4, in Appendix Table A4 we test whether our
proxies for the cost of embargo violation predict legal and illegal reactions to the events under
embargo. In Panel A we estimate the linear probability model
Illegal Reacti,t = α+ αDDi + ηi,t (14)
where t corresponds to an event occurring during an embargo, i indicates a company, and Di
is a proxy for low cost of embargo violation. In Panel B we employ ‘Legal React’ as dependent
variable, and in Panel C our dependent variable equals +1 if Illegal React = 1, equals −1 ifLegal React = 1, and equals 0 otherwise. The results are qualitatively consistent with our
previous analysis, namely, companies located in countries with low cost of embargo violation
(e.g., high-corruption) are more likely to display illegal reactions and less likely to display legal
ones. However, the results are mostly not significant, which is not surprising since we only
24
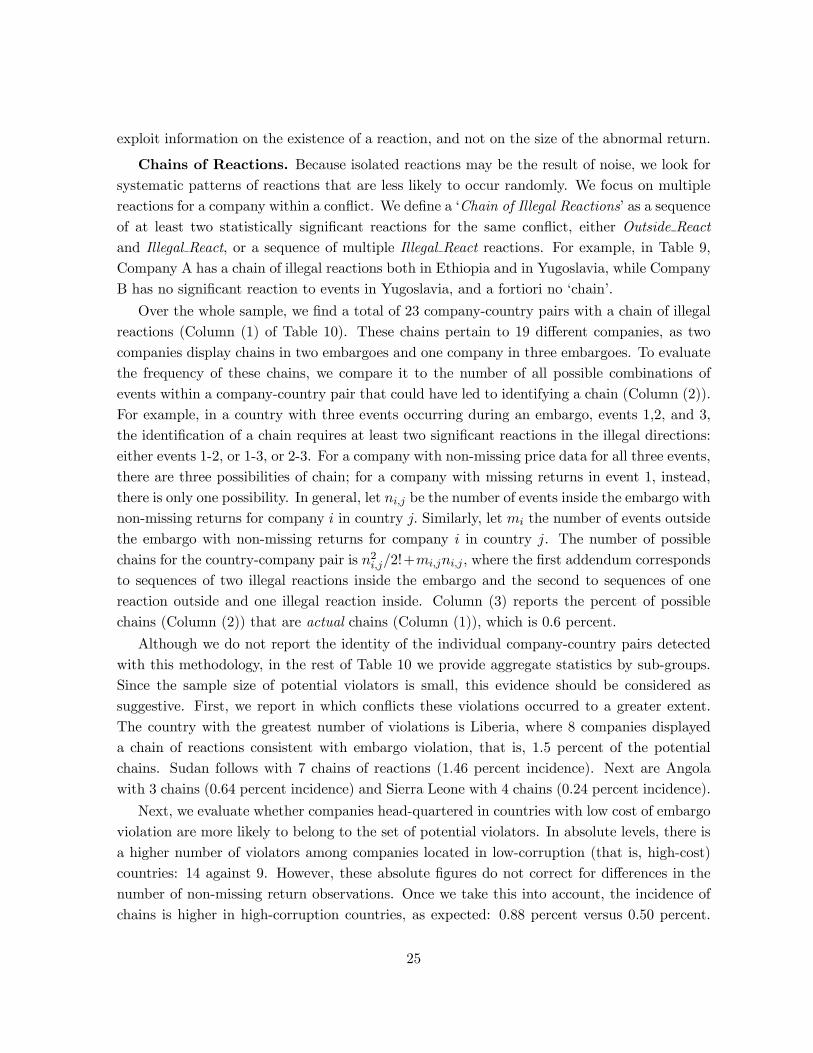
exploit information on the existence of a reaction, and not on the size of the abnormal return.
Chains of Reactions. Because isolated reactions may be the result of noise, we look for
systematic patterns of reactions that are less likely to occur randomly. We focus on multiple
reactions for a company within a conflict. We define a ‘Chain of Illegal Reactions’ as a sequence
of at least two statistically significant reactions for the same conflict, either Outside React
and Illegal React, or a sequence of multiple Illegal React reactions. For example, in Table 9,
Company A has a chain of illegal reactions both in Ethiopia and in Yugoslavia, while Company
B has no significant reaction to events in Yugoslavia, and a fortiori no ‘chain’.
Over the whole sample, we find a total of 23 company-country pairs with a chain of illegal
reactions (Column (1) of Table 10). These chains pertain to 19 different companies, as two
companies display chains in two embargoes and one company in three embargoes. To evaluate
the frequency of these chains, we compare it to the number of all possible combinations of
events within a company-country pair that could have led to identifying a chain (Column (2)).
For example, in a country with three events occurring during an embargo, events 1,2, and 3,
the identification of a chain requires at least two significant reactions in the illegal directions:
either events 1-2, or 1-3, or 2-3. For a company with non-missing price data for all three events,
there are three possibilities of chain; for a company with missing returns in event 1, instead,
there is only one possibility. In general, let ni,j be the number of events inside the embargo with
non-missing returns for company i in country j. Similarly, let mi the number of events outside
the embargo with non-missing returns for company i in country j. The number of possible
chains for the country-company pair is n2i,j/2!+mi,jni,j , where the first addendum corresponds
to sequences of two illegal reactions inside the embargo and the second to sequences of one
reaction outside and one illegal reaction inside. Column (3) reports the percent of possible
chains (Column (2)) that are actual chains (Column (1)), which is 0.6 percent.
Although we do not report the identity of the individual company-country pairs detected
with this methodology, in the rest of Table 10 we provide aggregate statistics by sub-groups.
Since the sample size of potential violators is small, this evidence should be considered as
suggestive. First, we report in which conflicts these violations occurred to a greater extent.
The country with the greatest number of violations is Liberia, where 8 companies displayed
a chain of reactions consistent with embargo violation, that is, 1.5 percent of the potential
chains. Sudan follows with 7 chains of reactions (1.46 percent incidence). Next are Angola
with 3 chains (0.64 percent incidence) and Sierra Leone with 4 chains (0.24 percent incidence).
Next, we evaluate whether companies head-quartered in countries with low cost of embargo
violation are more likely to belong to the set of potential violators. In absolute levels, there is
a higher number of violators among companies located in low-corruption (that is, high-cost)
countries: 14 against 9. However, these absolute figures do not correct for differences in the
number of non-missing return observations. Once we take this into account, the incidence of
chains is higher in high-corruption countries, as expected: 0.88 percent versus 0.50 percent.
25

The pattern is similar using the arms transparency index. The percentage of significant illegal
chains is instead about the same for low- and high-cost companies when we use the other proxies
of cost of embargo violation. The results using the corruption index and the arms transparency
index indicate a two-fold pattern of results. First, companies in low-cost countries appear more
likely to engage in illegal arms trading, consistent with Prediction 1.(ii) and with the findings
in Section 4. Second, a sizeable number of companies from high-cost countries are identified
as potential violators too. This clarifies that our earlier findings did not imply that only
companies from high-corruption countries were detected as violating embargoes.
7 External Validation
Our interpretation of the above results is that the abnormal returns provide information on the
incidence of legal and illegal arms trade, and on the types of companies most likely to engage
in this trade. In the spirit of the forensic economics literature, we would like to compare the
list of detected companies based on returns to outside evidence on legal and illegal arms trade.
Unfortunately, direct evidence on violations of arms embargoes is very hard to come by.
(The lack of such evidence is, in fact, a motivation for this study). A first source is the United
Nations itself. The UN attempts to monitor violations of the arms embargo for each conflict.
The known violations are organized in three main sources: the Reports of Panel of Experts,
the Reports of the Monitoring Groups, and Selected Documents.15 For all the eight countries
in the sample, we examined the three sets of documents. The violators named in the reports
are mostly brokers and intermediaries, such as Pecos (from Guinea) for Liberia (Report 1015e)
and Kas Engineering (Gibraltar) for Angola (Report 363e). No traded company in our sample
is mentioned in these reports. We interpret this as evidence that detection of trades by larger
companies is more difficult, and perhaps the political will for detection weaker.
While we cannot use the UN reports to validate the detection of individual companies,
we can use them to measure the seriousness of embargo violations for the 8 conflicts in the
sample. The number of UN reports devoted to embargo enforcement in a given conflict is likely
to reflect the seriousness of the violations in that conflict. We thus construct two quantitative
measures of the number of UN documents. We group together the reports by the Panel of
Experts and by the Monitoring Group, since these are comparable in nature and less frequent,
and define MGPEj as the total number of these reports concerning country j, divided by the
number of years of the embargo. The average incidence ofMGPE across the eight countries is
.75, with a minimum of 0 (Ethiopia, Rwanda, and Yugoslavia) and a maximum of 3 (Sudan).
Similarly, SELj is the number of Selected Documents concerning country j, divided by the
number of years of the embargo. The average incidence of Selected Documents is 1.07, with a
15The Selected Documents include for example letters written by local government authorities regarding
allegations of embargo violation, but also generic communications on administrative procedures.
26

minimum of 0 (Rwanda, Somalia, and Sudan) and a maximum of 3 (Liberia). The information
refers to the years of embargoes for which information is available on the UN website.16
In Table 11, we use this information to test if, in conflicts with higher incidence of UN
reports, companies are more likely to be detected as reacting to the conflict events. Similarly
to Appendix Table A5, in Panel A of Table 11 we follow the specification
Illegal Reacti,t = α+ αDMGPEj + ηi,t
in Column (1) and a similar specification in Column (2) using the incidence of Selected Doc-
uments SELj as independent variable. Using either measure, we find that a higher incidence
of UN reports increases the likelihood of an illegal reaction. The result is however significant
at the 5 percent level only for the MGPE variable. Official reports by Panel of Experts and
Monitoring Groups appear to be more informative of the seriousness of embargo breaches. In
Panel B, we examine whether the incidence of UN reports also affects the detection of legal
reactions. The incidence of Panel of Experts and Monitoring Group Reports significantly low-
ers the detection of legal reactions, while the incidence of Selected Documents has no effect.
These findings are consistent with our ex ante predictions: in conflicts with a higher share of
reports, and hence a likely higher number of violations, we detect a higher frequency of illegal
trades and a lower frequency of legal trades. In other words, the return-based detection and
the measures based on the number of UN reports are consistent. We should, however, point
out that the incidence of UN reports is a rough proxy for the severity of violations.
In addition to official UN documents, unofficial documents and journalistic pieces may also
provide evidence of arms trading. We take advantage of information on the Internet and
use counts of Google hits to provide a rough measure of the association of companies with
embargoes, with arms trading, and with a specific conflict. We follow a methodology similar
to Saiz and Simonsohn (2007), who show that Internet-based measures of corruption correlate
well with standard measures. The advantage of Internet counts is that they can be constructed
even when standard measures do not exist, such as for arms trade. For each company i, we
record four counts of Google hits: (i) ni for searches of the company name; (ii) embi for
searches of the company name AND “embargo”; (iii) armi for searches of the company name
AND “arms”; (iv) confli,j for searches of the company name AND the name of the country in
conflict (i.e., “Sudan”). We then compute the ratios of embi, armi, and confli,j to the total
number of hits ni to obtain a variable that is, to a first approximation, independent of the
scale of ni.17 Among the companies with at least 100 hits (ni > 100), we define an indicator
16The variables and the number of years of embargo covered by the data are: Angola (MGPE = .66, SE = 1,
9 years), Ethiopia/Eritrea (MGPE = 0, SE = 2, 1 year), Liberia (MGPE = 1.45, SE = 3, 11 years), Rwanda
(MGPE = 0, SE = 0, 2 years), Sierra Leone (MGPE = .33, SE = 1.89, 9 years), Somalia (MGPE = .57,
SE = 0, 14 years), Sudan (MGPE = 3, SE = 0, 1 year), and Yugoslavia (MGPE = 0, SE = .67, 3 years).17Two full searches were conducted by two independent teams of research assistants; we take the average of
the fractions computed according to each team’s counts.
27

variable for the companies (or company-country combinations in the case of confli,j) in the
top 10 percent. (We do not use the continuous variable because it is highly skewed.)
In Columns (3)-(5) of Table 11, Panel A we present the results of regressions of Illegal Reacti,t
on the top-10-percent Google indicators. Companies with high arms-related Google counts are
qualitatively more likely to display what we detect as illegal reactions. The result is statisti-
cally significant for the counts using the word “Embargo”, the wording most closely tied to
embargo violations. We do not find any significant evidence of an effect on the detection of
legal reactions (Panel B). These findings provide some external validation to the return-based
detection, albeit an indirect one, since we cannot examine the Internet content directly given
the number of the searches.
Finally, as a last form of validation we considered using information from ComTrade on
bilateral flows of goods categorized as arms. However, the ComTrade documentation warns
that, due to specific provisions related to national security, the coverage of goods for military
use is often not captured by customs authorities, and as such the data is less reliable.
8 Conclusion
Can stock prices help to detect illegal transactions? We have proposed a method to detect
illegal arms trade based on event returns for arms-producing companies. We focus on eight
countries under UN arms embargo in the period 1990-2005. We consider events during the
embargo that suddenly increase or decrease conflict intensity, and examine the contemporane-
ous stock returns of weapon-making companies. As our simple model predicts, for companies
trading legally, an event worsening the hostilities should affect stock prices adversely, since
it delays the removal of the embargo. Conversely, for companies trading illegally, the event
should increase stock prices, since it increases the demand for illegal weapons.
We estimate a large and significant positive reaction for weapon-making companies head-
quartered in countries where the legal and reputational costs of illegal trades are likely to be
lower. We interpret this as evidence that investors believe that some of these latter companies
are engaging in illegal arms trades. An event study analysis of individual companies and events
points to potential embargo violators, including companies displaying systematic patterns of
reactions. While the detection of individual companies is subject to substantial uncertainty,
the results of the detection procedure are corroborated by outside evidence from UN reports
and Google counts.
While in this paper we have focused on detection of illegal arms trades, the methodology
used in this paper has broader applications. For example, it could be used to detect violators of
other types of legislation. Unlike in most event studies that examine changes in legislation, the
idea would be to examine sudden events that will affect the enforcement of existing legislation.
We hope that follow-up work will pursue other examples of returns-based detection.
28

A Appendix A
We use a model of Cournot competition with barriers to entry to model the arms production. Inthe first stage of period t, the potential entrants observe the realization of the state —Embargoor not Embargo—, and then decide to enter or not enter the market. The firms that enter paya fixed cost K to sell arms in the Embargo state. This cost does not apply to sales in theNon-Embargo state. In the second stage of period t, the Nt firms that entered the marketobserve the demand realization αt and choose production levels qt in a Cournot game. Werule out repeated game strategies and assume that, in each time period t, firms play a staticequilibrium.We consider two types of firms with identical demand and identical (linear) production
costs c (qt) = cqt, with c > 0, but different legal and reputational cost K. For the high-costfirms H, the legal and reputational cost KH is high enough that these firms do not sell armsin the Embargo state. For the low-cost firms L, instead, the cost is zero (KL = 0). We alsoassume that, due to barriers to entry, only a fixed number of firms can enter the market: atmost NH firms of the high-cost type and at most NL firms of the low-cost type. We firstanalyze the competition in the second stage, and then characterize the entry decision in thefirst stage.Competition. We consider symmetric equilibria in the second stage of period t where all
firms choose the same quantity qt. Hence, aggregate supply Qt in period t is equal to Ntqt. Theaggregate demand function for the market is αtD(Pt) where αt is a demand shift capturingshifts in demand due to changes in conflict. We write the equilibrium inverse demand functionPt = P [Ntqt/αt]. We assume that P is twice-differentiable, with P 0(.) < 0 and P 00(.) ≤ 0,and limQ→∞ P (Q) < c < P (0). The assumption P 0(.) < 0 is simply a requirement thatdemand curves be downward-sloping. The other assumptions guarantee the existence and theuniqueness of the solution to the profit-maximization problem in the second stage.Let qt be the average production level of the N − 1 competitors, then the second-stage
maximization problem for the firm is
maxqtΠ(qt|αt,Nt) = P
∙(Nt − 1)qt + qt
αt
¸qt − cqt.
The first order condition for each firm in a symmetric equilibrium is:
P 0∙Ntq
∗t
αt
¸q∗tαt+ P
∙Ntq
∗t
αt
¸− c = 0. (15)
For a given αt and Nt, equation (15) has one and only one solution q∗t . This follows becausethe left-hand-side of equation (15) is decreasing in q∗t , is positive for q∗t = 0, and is negativein the limit as q∗t → ∞. Given a solution q∗t , we define the equilibrium profits Π∗(αt, Nt) =Π(q∗t |αt, Nt).We now derive the comparative statics of the equilibrium profits Π∗(αt, Nt) with respect to
demand shifts αt and with respect to the number of firms Nt. First, we consider the impact ofan increase in demand αt for given Nt. In a similar set-up, DellaVigna and Pollet (forthcoming)show that, with constant marginal cost, production increases proportionally with the demandshift: ∂q∗t (αt) /∂αt = q∗t (αt) /αt. Using this property, we solve for the derivative of equilibriumprofits Π∗(αt, Nt) with respect to the demand shift αt:
dΠ∗(αt, Nt)
dαt= P 0
∙Ntq
∗t
αt
¸µ∂q∗t∂αt− q∗t
αt
¶µNtq
∗t
αt
¶+
µP
∙Ntq
∗t
αt
¸− c
¶∂q∗t∂αt
= (16)
=
µP
∙Ntq
∗t
αt
¸− c
¶q∗tαt=Π∗ (αt, Nt)
αt,
29
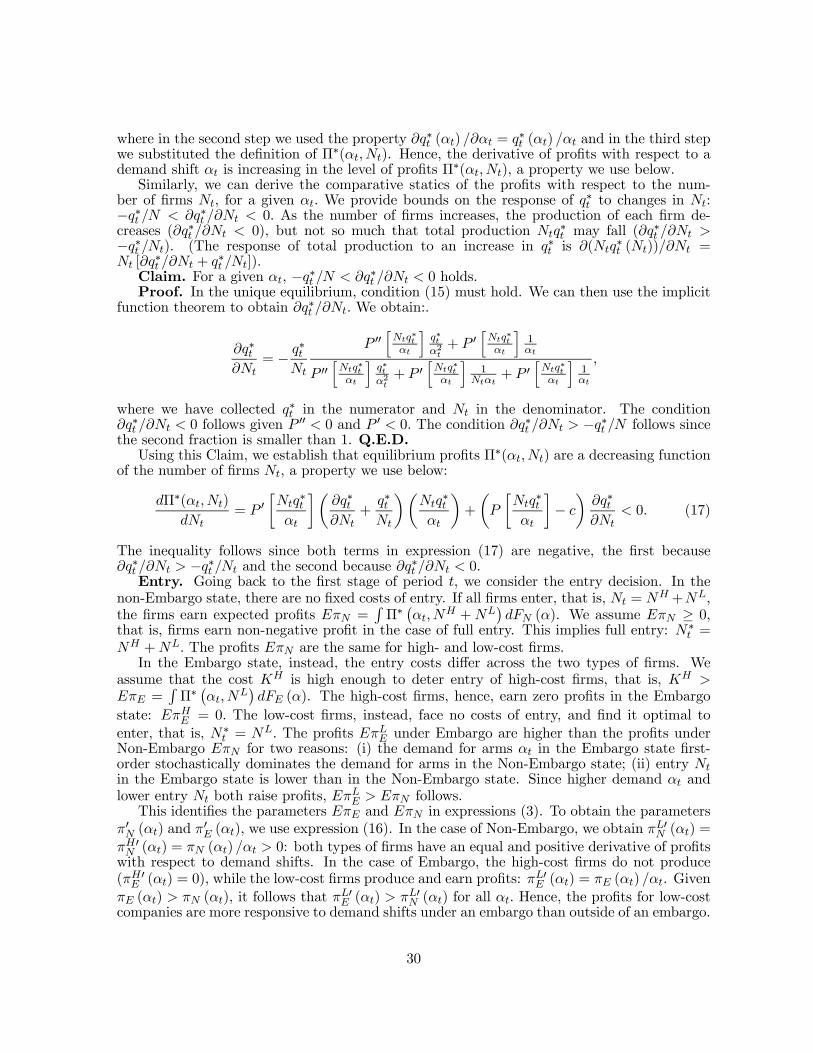
where in the second step we used the property ∂q∗t (αt) /∂αt = q∗t (αt) /αt and in the third stepwe substituted the definition of Π∗(αt, Nt). Hence, the derivative of profits with respect to ademand shift αt is increasing in the level of profits Π
∗(αt, Nt), a property we use below.Similarly, we can derive the comparative statics of the profits with respect to the num-
ber of firms Nt, for a given αt. We provide bounds on the response of q∗t to changes in Nt:
−q∗t /N < ∂q∗t /∂Nt < 0. As the number of firms increases, the production of each firm de-creases (∂q∗t /∂Nt < 0), but not so much that total production Ntq
∗t may fall (∂q
∗t /∂Nt >
−q∗t /Nt). (The response of total production to an increase in q∗t is ∂(Ntq∗t (Nt))/∂Nt =
Nt [∂q∗t /∂Nt + q∗t /Nt]).
Claim. For a given αt, −q∗t /N < ∂q∗t /∂Nt < 0 holds.Proof. In the unique equilibrium, condition (15) must hold. We can then use the implicit
function theorem to obtain ∂q∗t /∂Nt. We obtain:.
∂q∗t∂Nt
= − q∗tNt
P 00hNtq∗tαt
iq∗tα2t+ P 0
hNtq∗tαt
i1αt
P 00hNtq∗tαt
iq∗tα2t+ P 0
hNtq∗tαt
i1
Ntαt+ P 0
hNtq∗tαt
i1αt
,
where we have collected q∗t in the numerator and Nt in the denominator. The condition∂q∗t /∂Nt < 0 follows given P 00 < 0 and P 0 < 0. The condition ∂q∗t /∂Nt > −q∗t /N follows sincethe second fraction is smaller than 1. Q.E.D.Using this Claim, we establish that equilibrium profits Π∗(αt, Nt) are a decreasing function
of the number of firms Nt, a property we use below:
dΠ∗(αt,Nt)
dNt= P 0
∙Ntq
∗t
αt
¸µ∂q∗t∂Nt
+q∗tNt
¶µNtq
∗t
αt
¶+
µP
∙Ntq
∗t
αt
¸− c
¶∂q∗t∂Nt
< 0. (17)
The inequality follows since both terms in expression (17) are negative, the first because∂q∗t /∂Nt > −q∗t /Nt and the second because ∂q
∗t /∂Nt < 0.
Entry. Going back to the first stage of period t, we consider the entry decision. In thenon-Embargo state, there are no fixed costs of entry. If all firms enter, that is, Nt = NH+NL,the firms earn expected profits EπN =
RΠ∗¡αt, N
H +NL¢dFN (α). We assume EπN ≥ 0,
that is, firms earn non-negative profit in the case of full entry. This implies full entry: N∗t =
NH +NL. The profits EπN are the same for high- and low-cost firms.In the Embargo state, instead, the entry costs differ across the two types of firms. We
assume that the cost KH is high enough to deter entry of high-cost firms, that is, KH >EπE =
RΠ∗¡αt, N
L¢dFE (α). The high-cost firms, hence, earn zero profits in the Embargo
state: EπHE = 0. The low-cost firms, instead, face no costs of entry, and find it optimal toenter, that is, N∗
t = NL. The profits EπLE under Embargo are higher than the profits underNon-Embargo EπN for two reasons: (i) the demand for arms αt in the Embargo state first-order stochastically dominates the demand for arms in the Non-Embargo state; (ii) entry Ntin the Embargo state is lower than in the Non-Embargo state. Since higher demand αt andlower entry Nt both raise profits, Eπ
LE > EπN follows.
This identifies the parameters EπE and EπN in expressions (3). To obtain the parametersπ0N (αt) and π
0E (αt), we use expression (16). In the case of Non-Embargo, we obtain π
L0N (αt) =
πH0N (αt) = πN (αt) /αt > 0: both types of firms have an equal and positive derivative of profitswith respect to demand shifts. In the case of Embargo, the high-cost firms do not produce(πH0E (αt) = 0), while the low-cost firms produce and earn profits: π
L0E (αt) = πE (αt) /αt. Given
πE (αt) > πN (αt), it follows that πL0E (αt) > πL0N (αt) for all αt. Hence, the profits for low-cost
companies are more responsive to demand shifts under an embargo than outside of an embargo.
30
References
[1] Abadie, Alberto, and J. Gardeazabal. “The Economic Costs of Conflict: A Case-ControlStudy for the Basque Country,” American Economic Review, 93(1), 113-133, 2003.
[2] Bondi, Loretta. “Externalities of the Arms Trade”, in Passas N. and Goodwin N. (eds),It’s Legal but It Ain’t Right, University of Michigan Press, 2004.
[3] Campbell, John, Andrew Lo, and C., MacKinlay, The Econometrics of Financial Markets,Princeton University Press, 1997.
[4] Collier, Paul, and Anke Hoeffler. “On the Economic Causes of Civil War”, Oxford Eco-nomic Papers, 50, 563-573, 1998.
[5] Control Arms Campaign. “UN Arms Embargoes: An Overview of the Last Ten Years”,Briefing Note, March 2006.
[6] DellaVigna, Stefano and Joshua Pollet. “Demographics and Industry Returns” AmericanEconomic Review, forthcoming.
[7] Djankov, Simeon, Rafael La Porta, Florencio Lopez-de-Silanes, and Andrei Shleifer. “TheLaw and Economics of Self-Dealing”, mimeo, 2006.
[8] Duggan, Mark and Steven Levitt. “Winning Isn’t Everything: Corruption in SumoWrestling.” American Economic Review, Vol. 92, pp. 1594-605, 2002.
[9] Dunne, J.Paul and Eamon Surry. “Arms production”, SIPRI Yearbook 2006, Oxford:Oxford University Press, pp. 419-427, 2006.
[10] Fisman, Raymond. “Estimating the Value of Political Connections,” American EconomicReview, Vol. 91, pp. 1095-1102, 2001.
[11] Fisman, Raymond and Shang-Jin Wei. “Tax Rates and Tax Evasion: Evidence from‘Missing Imports’ in China”, Journal of Political Economy, Vol. 112, pp 471-500, 2004.
[12] Guidolin, Massimo, and Eliana La Ferrara. “Diamonds Are Forever, Wars Are Not. IsConflict Bad for Private Firms?”, American Economic Review, forthcoming.
[13] Hsieh, Chang-Tai, and Enrico Moretti. “Did Iraq Cheat the United Nations? Underpric-ing, Bribes, and the Oil for Food Program”, Quarterly Journal of Economics, Vol. 121,2006.
[14] Jacob, Brian A and Steven Levitt. “Rotten Apples: An Investigation of the Prevalence andPredictors of Teacher Cheating.” Quarterly Journal of Economics, Vol. 118, pp. 843-77,2003.
[15] Miguel, Edward, Shanker Satyanath, and Ernest Sergenti, “Economic Shocks and CivilConflict: An Instrumental Variables Approach”, Journal of Political Economy, Vol. 112,pp. 725-753, 2004.
[16] Montalvo, Jose G., and Marta Reynal-Querol. “Ethnic Polarization, Potential Conflictand Civil War”, American Economic Review, 95, 796-816, 2005.
[17] Roberts, Brian E. “A Dead Senator Tells No Lies: Seniority and the Distribution ofFederal Benefits,” American Journal of Political Science, 34, pp. 31-58, 1990.
31
[18] Saiz, Albert and Uri Simonsohn. “Downloading Wisdom from Online Crowds,” Workingpaper, 2007.
[19] Snowberg, Erik, Justin Wolfers, and Eric Zitzewitz. “Partisan Impacts on the Economy:Evidence from Prediction Markets and Close Elections.” Quarterly Journal of Economics,Vol. 122, pp. 807-829, 2007.
[20] Wolfers, Justin. “Point Shaving: Corruption in NCAA Basketball”. American EconomicReview, Papers and Proceedings, Vol. 96, 2006.
[21] Wood, Brian and Johan Peleman. The Arms Fixers. Controlling the Brokers and ShippingAgents. BASIC-NISAT-PRIO Report, 2006.
32

33
Figure 1a. Returns for Events During Embargo
-0.01
-0.005
0
0.005
0.01
0.015
Decrease War (N=996) No event (N=490,755) Increase War (N=790)
Event Type
3-D
ay A
bnor
mal
Ret
urn
All Companies
Figure 1b. Return for Events During Embargo: High- vs. Low-Corruption Countries
-0.01
-0.005
0
0.005
0.01
0.015
Decrease War (N=709(L), N=287(H))
No event (N=362,604(L),
N=128,151(H))
Increase War (N=576(L), N=214(H))
Event Type
3-D
ay A
bnor
mal
Ret
urn
Low-Corruption CountriesHigh-Corruption Countries
Note. Figures 1a and 1b display average 3-day abnormal cumulative returns separately for days with events decreasing hostilities, for days with no events, and for days with events increasing hostilities. The events are unexpected, significant occurrences affecting the hostilities during the arms embargo period in one of the 8 countries in the sample. The Figures also report the number of company-day observations over which the return is computed. Figure 1b presents the returns separately for companies headquartered in countries with corruption above- and below-median according to the Corruption-Perceptions Index of Transparency International. The average returns in Figure 1a (with standard errors in parenthesis) are 0.0009(0.0010), -0.0001(0.0001), and -0.0010(0.0031). The average returns in Figure 1b are 0.0032(0.0013)**, -0.0001(0.0001), and -0.0054(0.0037) for companies in low-corruption countries and -0.0049(0.0043), -0.0002(0.0002), and 0.0106(0.0053)** for companies in high-corruption countries.
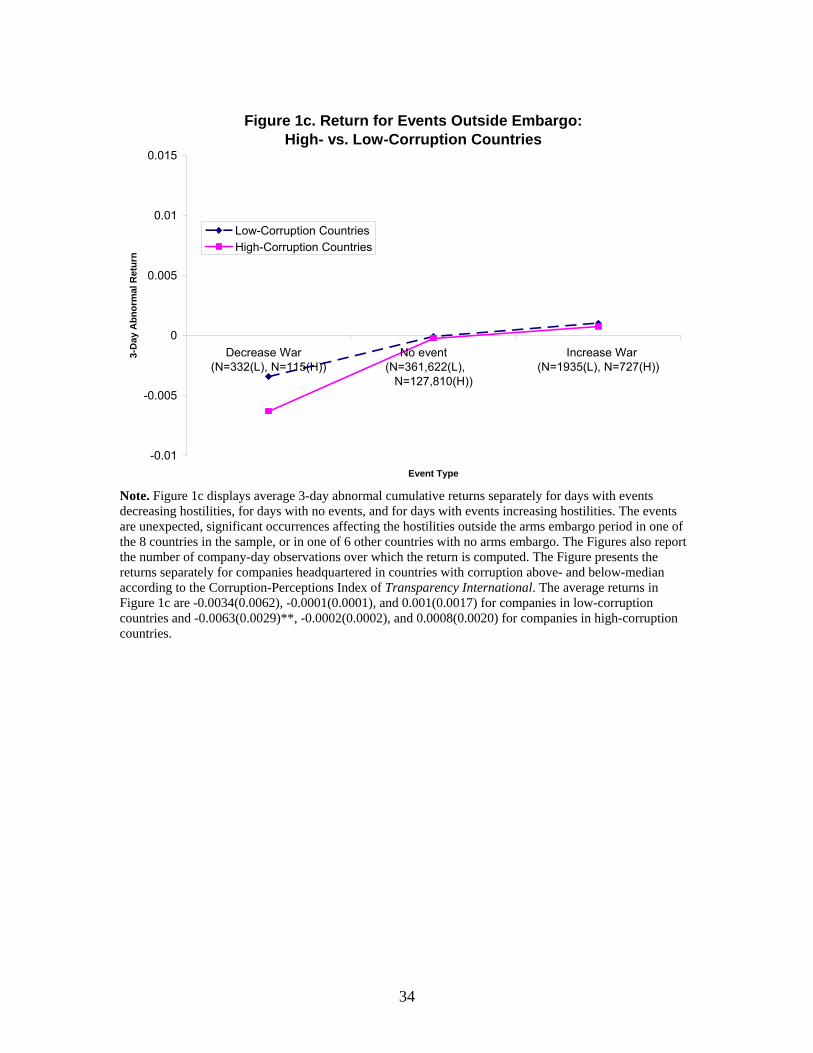
34
Figure 1c. Return for Events Outside Embargo: High- vs. Low-Corruption Countries
-0.01
-0.005
0
0.005
0.01
0.015
Decrease War (N=332(L), N=115(H))
No event (N=361,622(L),
N=127,810(H))
Increase War (N=1935(L), N=727(H))
Event Type
3-D
ay A
bnor
mal
Ret
urn
Low-Corruption CountriesHigh-Corruption Countries
Note. Figure 1c displays average 3-day abnormal cumulative returns separately for days with events decreasing hostilities, for days with no events, and for days with events increasing hostilities. The events are unexpected, significant occurrences affecting the hostilities outside the arms embargo period in one of the 8 countries in the sample, or in one of 6 other countries with no arms embargo. The Figures also report the number of company-day observations over which the return is computed. The Figure presents the returns separately for companies headquartered in countries with corruption above- and below-median according to the Corruption-Perceptions Index of Transparency International. The average returns in Figure 1c are -0.0034(0.0062), -0.0001(0.0001), and 0.001(0.0017) for companies in low-corruption countries and -0.0063(0.0029)**, -0.0002(0.0002), and 0.0008(0.0020) for companies in high-corruption countries.
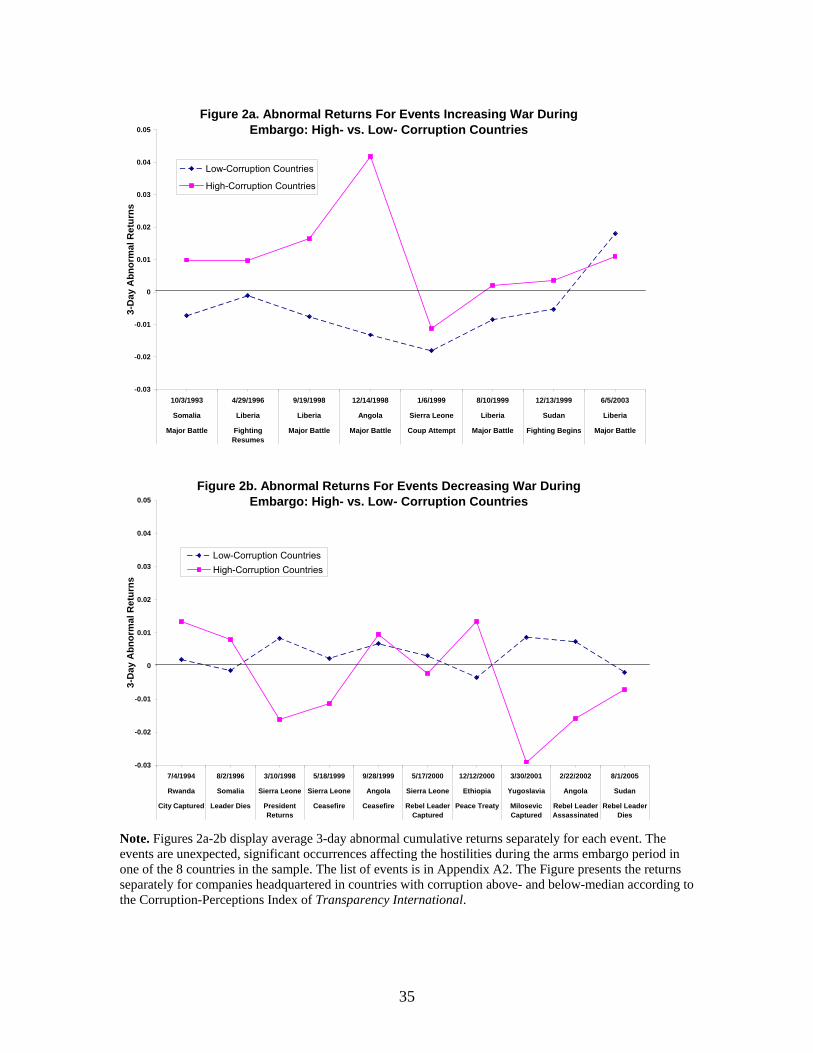
35
Figure 2a. Abnormal Returns For Events Increasing War During Embargo: High- vs. Low- Corruption Countries
-0.03
-0.02
-0.01
0
0.01
0.02
0.03
0.04
0.05
10/3/1993 4/29/1996 9/19/1998 12/14/1998 1/6/1999 8/10/1999 12/13/1999 6/5/2003
Somalia Liberia Liberia Angola Sierra Leone Liberia Sudan Liberia
Major Battle FightingResumes
Major Battle Major Battle Coup Attempt Major Battle Fighting Begins Major Battle
3-D
ay A
bnor
mal
Ret
urns
Low-Corruption Countries
High-Corruption Countries
Figure 2b. Abnormal Returns For Events Decreasing War During Embargo: High- vs. Low- Corruption Countries
-0.03
-0.02
-0.01
0
0.01
0.02
0.03
0.04
0.05
7/4/1994 8/2/1996 3/10/1998 5/18/1999 9/28/1999 5/17/2000 12/12/2000 3/30/2001 2/22/2002 8/1/2005
Rwanda Somalia Sierra Leone Sierra Leone Angola Sierra Leone Ethiopia Yugoslavia Angola Sudan
City Captured Leader Dies PresidentReturns
Ceasefire Ceasefire Rebel LeaderCaptured
Peace Treaty MilosevicCaptured
Rebel LeaderAssassinated
Rebel LeaderDies
3-D
ay A
bnor
mal
Ret
urns
Low-Corruption CountriesHigh-Corruption Countries
Note. Figures 2a-2b display average 3-day abnormal cumulative returns separately for each event. The events are unexpected, significant occurrences affecting the hostilities during the arms embargo period in one of the 8 countries in the sample. The list of events is in Appendix A2. The Figure presents the returns separately for companies headquartered in countries with corruption above- and below-median according to the Corruption-Perceptions Index of Transparency International.

36
Number Of Low High High Number Of Low High HighCompanies High Low Press Bribe- Self- Companies High Low Press Bribe- Self-
Country Headquart. Corruption Transp. Freedom Payer Dealing Country Headquart. Corruption Transp. Freedom Payer Dealing(1) (2) (3) (4) (5) (6) (7) (8) (9) (10) (11) (12) (13) (14)
Usa 53 No No No No No China 5 Yes Yes Yes Yes NoFrance 14 No No Yes Yes Yes Brazil 4 Yes Yes Yes Yes YesJapan 14 Yes Yes No No No South Korea 4 Yes Yes Yes Yes YesUk 10 No No No No No Malaysia 3 Yes Yes Yes NoGermany 7 No No No No Yes South Africa 3 Yes Yes Yes Yes NoAustralia 6 No No No No No Czech Rep. 2 Yes No No YesItaly 4 Yes No Yes Yes Yes India 2 Yes Yes Yes NoCanada 3 No No No No No Israel 2 No Yes Yes Yes NoSwitzerland 3 No Yes No No Yes Peru 2 Yes Yes YesNorway 2 No No No Yes Chile 1 No Yes NoSpain 2 Yes No No Yes Yes Russia 1 Yes Yes Yes Yes NoAustria 1 No Yes No No Yes Singapore 1 No Yes Yes No NoBelgium 1 Yes Yes No No No 30Greece 1 Yes Yes YesNetherlands 1 No No No No YesSweden 1 No No No No Yes
123
Table 1. Measures of Cost of Embargo Violation for Countries of Headquarter of Arms Companies
OECD Countries Non-OECD Countries
Notes: The Table lists all the countries in which the arms-producing companies are head-quartered. Columns (1) and (2) list the countries, and the number of companies in each country, for the OECD countries (OECDmembership is defined as of 1985, the beginning of our sample). Columns (3) through (7) present information on whether the country is above the median in the corruption level (according to the CPI index), Column (3)), inlow transparency (Column (4)), in low press freedom (Column (5), in high payment of bribes (BPI Index, Column (6)), in high self-dealing (Column (7)). Columns (8) though (14) present the same information for the non-OECDcountries. The measures of corruption are defined in the text.
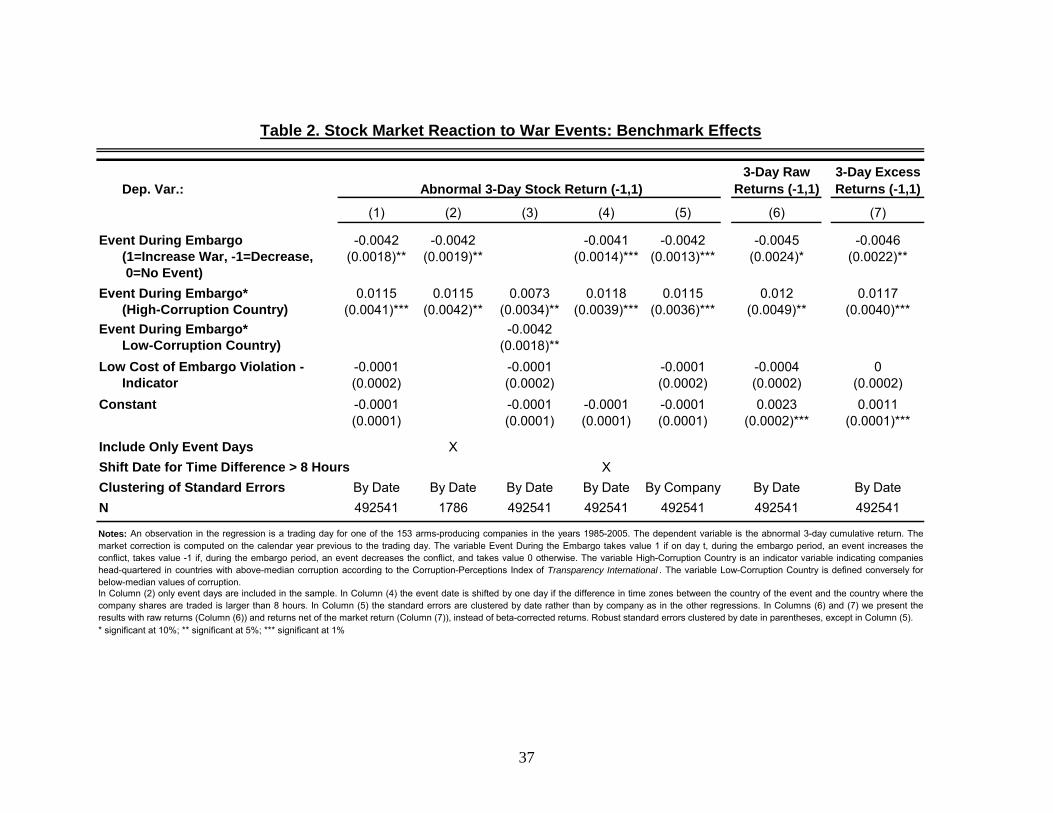
37
Dep. Var.:3-Day Raw
Returns (-1,1)3-Day Excess Returns (-1,1)
(1) (2) (3) (4) (5) (6) (7)
-0.0042 -0.0042 -0.0041 -0.0042 -0.0045 -0.0046(1=Increase War, -1=Decrease, (0.0018)** (0.0019)** (0.0014)*** (0.0013)*** (0.0024)* (0.0022)** 0=No Event)
0.0115 0.0115 0.0073 0.0118 0.0115 0.012 0.0117(High-Corruption Country) (0.0041)*** (0.0042)** (0.0034)** (0.0039)*** (0.0036)*** (0.0049)** (0.0040)***
-0.0042Low-Corruption Country) (0.0018)**
-0.0001 -0.0001 -0.0001 -0.0004 0Indicator (0.0002) (0.0002) (0.0002) (0.0002) (0.0002)
-0.0001 -0.0001 -0.0001 -0.0001 0.0023 0.0011(0.0001) (0.0001) (0.0001) (0.0001) (0.0002)*** (0.0001)***
XShift Date for Time Difference > 8 Hours XClustering of Standard Errors By Date By Date By Date By Date By Company By Date By Date
492541 1786 492541 492541 492541 492541 492541
Event During Embargo*
* significant at 10%; ** significant at 5%; *** significant at 1%
Abnormal 3-Day Stock Return (-1,1)
In Column (2) only event days are included in the sample. In Column (4) the event date is shifted by one day if the difference in time zones between the country of the event and the country where thecompany shares are traded is larger than 8 hours. In Column (5) the standard errors are clustered by date rather than by company as in the other regressions. In Columns (6) and (7) we present theresults with raw returns (Column (6)) and returns net of the market return (Column (7)), instead of beta-corrected returns. Robust standard errors clustered by date in parentheses, except in Column (5).
Notes: An observation in the regression is a trading day for one of the 153 arms-producing companies in the years 1985-2005. The dependent variable is the abnormal 3-day cumulative return. Themarket correction is computed on the calendar year previous to the trading day. The variable Event During the Embargo takes value 1 if on day t, during the embargo period, an event increases theconflict, takes value -1 if, during the embargo period, an event decreases the conflict, and takes value 0 otherwise. The variable High-Corruption Country is an indicator variable indicating companieshead-quartered in countries with above-median corruption according to the Corruption-Perceptions Index of Transparency International . The variable Low-Corruption Country is defined conversely forbelow-median values of corruption.
Table 2. Stock Market Reaction to War Events: Benchmark Effects
N
Include Only Event Days
Low Cost of Embargo Violation -
Constant
Event During Embargo
Event During Embargo*

38
Dep. Var.:Measure of Cost of Embargo High Low Non- Low High High Violation: Corruption Transparency OECD Press Bribe-Payer Self-Dealing
Percept. Index of Arms Trade Member Freedom Index Index(1) (2) (3) (4) (5) (6)
Panel A -- Indicators for Cost of Embargo Violation-0.0042 -0.0043 -0.0031 -0.0023 -0.0027 -0.0025
(1=Increase War, -1=Decrease, (0.0018)** (0.0020)** (0.0017)* (0.0017) (0.0017) (0.0016) 0=No Event)
0.0115 0.0114 0.015 0.0061 0.0058 0.0055(Low Cost of Embargo Violation, Indicator) (0.0041)*** (0.0042)*** (0.0056)*** (0.0045) (0.0046) (0.0040)
-0.0001 -0.0001 -0.0002 -0.0002 0 -0.0002Indicator (0.0002) (0.0002) (0.0003) (0.0002) (0.0002) (0.0002)
-0.0001 -0.0001 -0.0001 -0.0001 -0.0001 0(0.0001) (0.0001) (0.0001) (0.0001) (0.0001) (0.0001)
Panel B -- Standardized Continuous Variables for Cost of Embargo Violation0.0013 0.0025 . 0.0008 0.0007 -0.0005
(1=Increase War, -1=Decrease, (0.0018) (0.0025) . (0.0015) (0.0018) (0.0017) 0=No Event)
0.0066 0.0048 . 0.0039 0.005 0.0016(Low Cost of Embargo Violation, Continuous) (0.0028)** (0.0019)** . (0.0023)* (0.0026)* (0.0017)
-0.0002 0 . 0 0 -0.0001Continuous (0.0001) (0.0001) . (0.0001) (0.0001) (0.0001)
-0.0002 -0.0001 -0.0001 -0.0001 -0.0001(0.0001) (0.0001) (0.0001) (0.0001) (0.0001)
Source of Measures of Cost of Transparency Small Arms OECD Freedom Transparency Djankov etEmbargo Violation: International Survey House International al. (2006)
492541 475101 492541 492541 477881 492541
Table 3. Stock Market Reaction: Measures for Cost of Embargo Violation
Event During Embargo
Constant
Low Cost of Embargo Violation -
Abnormal 3-Day Stock Return (-1,1)
Event During Embargo*
Event During Embargo
* significant at 10%; ** significant at 5%; *** significant at 1%
N
Notes: An observation in the regression is a trading day for one of the 153 arms-producing companies in the years 1985-2005. The dependent variable is the abnormal 3-day cumulative return. Themarket correction is computed on the calendar year previous to the trading day. The variable Event During the Embargo takes value 1 if on day t, during the embargo period, an event increases theconflict, takes value -1 if, during the embargo period, an event decreases the conflict, and takes value 0 otherwise. In Columns (1)-(6) we use six different measures of the reputational and legal costs ofviolating an embargo for the country where the company is head-quartered (see Section 4 in the text). OECD membership is defined as of 1995, the first year of the sample. Panel A uses an indicatorvariable for below-median cost of embargo violation, while Panel B uses a standardized version of the continuous variable. Higher values indicate lower cost of embargo violation. Robust standard errorsclustered by date in parentheses.
Event During Embargo*
Constant
Low Cost of Embargo Violation -
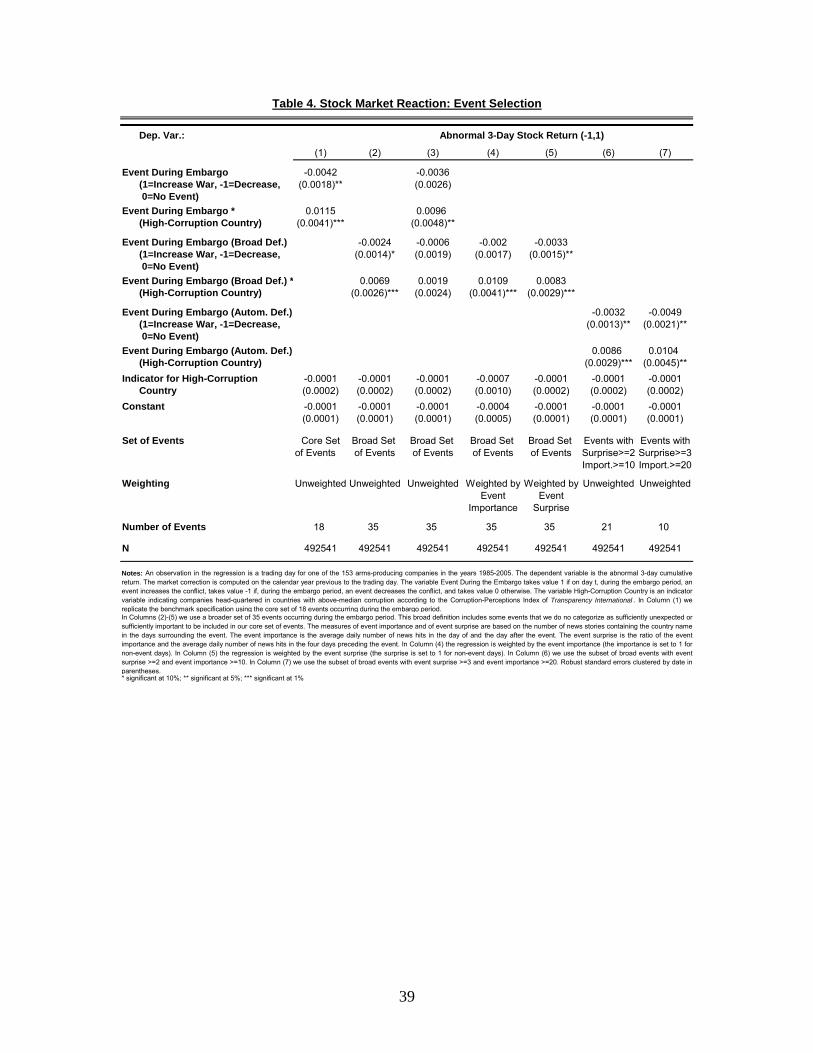
39
Dep. Var.:
(1) (2) (3) (4) (5) (6) (7)
-0.0042 -0.0036(1=Increase War, -1=Decrease, (0.0018)** (0.0026) 0=No Event)
0.0115 0.0096(High-Corruption Country) (0.0041)*** (0.0048)**
-0.0024 -0.0006 -0.002 -0.0033(1=Increase War, -1=Decrease, (0.0014)* (0.0019) (0.0017) (0.0015)** 0=No Event)
0.0069 0.0019 0.0109 0.0083(High-Corruption Country) (0.0026)*** (0.0024) (0.0041)*** (0.0029)***
-0.0032 -0.0049(1=Increase War, -1=Decrease, (0.0013)** (0.0021)** 0=No Event)
0.0086 0.0104(High-Corruption Country) (0.0029)*** (0.0045)**
-0.0001 -0.0001 -0.0001 -0.0007 -0.0001 -0.0001 -0.0001Country (0.0002) (0.0002) (0.0002) (0.0010) (0.0002) (0.0002) (0.0002)
-0.0001 -0.0001 -0.0001 -0.0004 -0.0001 -0.0001 -0.0001(0.0001) (0.0001) (0.0001) (0.0005) (0.0001) (0.0001) (0.0001)
Set of Events Core Set Broad Set Broad Set Broad Set Broad Set Events with Events withof Events of Events of Events of Events of Events Surprise>=2 Surprise>=3
Import.>=10 Import.>=20
Weighting Unweighted Unweighted Unweighted Weighted by Weighted by Unweighted UnweightedEvent Event
Importance Surprise
Number of Events 18 35 35 35 35 21 10
492541 492541 492541 492541 492541 492541 492541
Table 4. Stock Market Reaction: Event Selection
Event During Embargo (Autom. Def.)
Abnormal 3-Day Stock Return (-1,1)
Event During Embargo
Event During Embargo (Autom. Def.)
Event During Embargo *
* significant at 10%; ** significant at 5%; *** significant at 1%
N
Notes: An observation in the regression is a trading day for one of the 153 arms-producing companies in the years 1985-2005. The dependent variable is the abnormal 3-day cumulativereturn. The market correction is computed on the calendar year previous to the trading day. The variable Event During the Embargo takes value 1 if on day t, during the embargo period, anevent increases the conflict, takes value -1 if, during the embargo period, an event decreases the conflict, and takes value 0 otherwise. The variable High-Corruption Country is an indicatorvariable indicating companies head-quartered in countries with above-median corruption according to the Corruption-Perceptions Index of Transparency International . In Column (1) wereplicate the benchmark specification using the core set of 18 events occurring during the embargo period.
Constant
In Columns (2)-(5) we use a broader set of 35 events occurring during the embargo period. This broad definition includes some events that we do no categorize as sufficiently unexpected orsufficiently important to be included in our core set of events. The measures of event importance and of event surprise are based on the number of news stories containing the country namein the days surrounding the event. The event importance is the average daily number of news hits in the day of and the day after the event. The event surprise is the ratio of the eventimportance and the average daily number of news hits in the four days preceding the event. In Column (4) the regression is weighted by the event importance (the importance is set to 1 fornon-event days). In Column (5) the regression is weighted by the event surprise (the surprise is set to 1 for non-event days). In Column (6) we use the subset of broad events with eventsurprise >=2 and event importance >=10. In Column (7) we use the subset of broad events with event surprise >=3 and event importance >=20. Robust standard errors clustered by date inparentheses.
Event During Embargo (Broad Def.)
Event During Embargo (Broad Def.) *
Indicator for High-Corruption
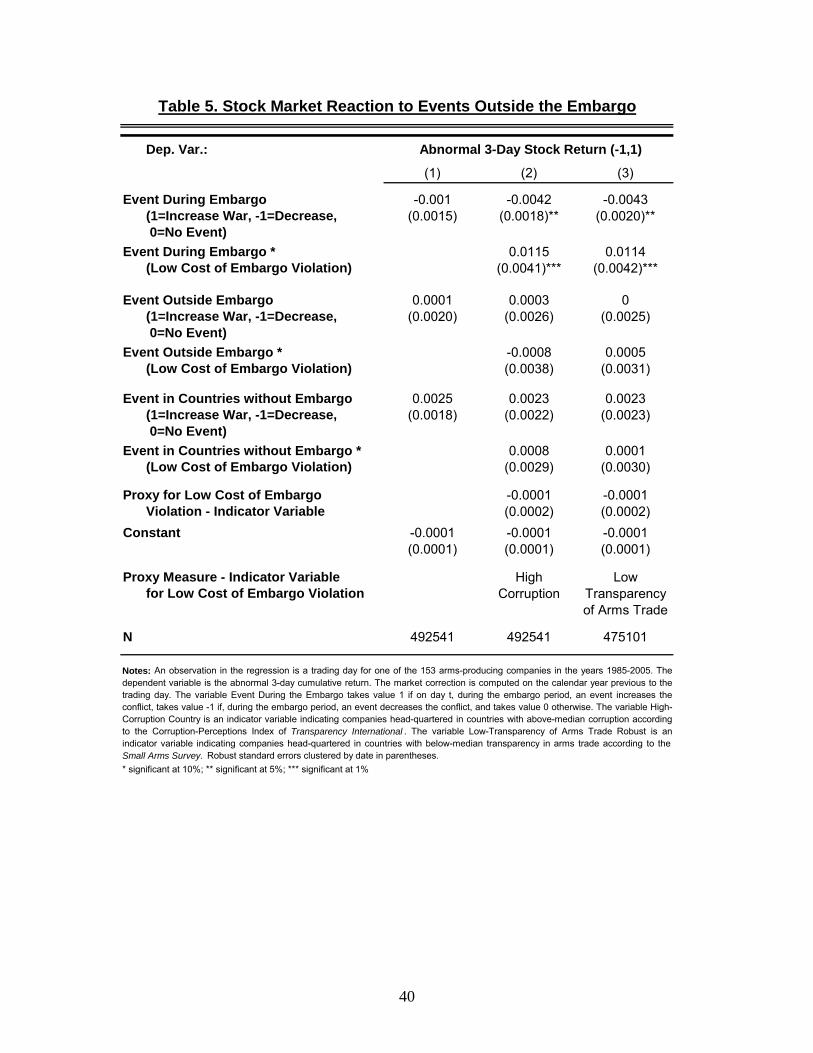
40
Dep. Var.:
(1) (2) (3)
-0.001 -0.0042 -0.0043(1=Increase War, -1=Decrease, (0.0015) (0.0018)** (0.0020)** 0=No Event)
0.0115 0.0114(Low Cost of Embargo Violation) (0.0041)*** (0.0042)***
0.0001 0.0003 0(1=Increase War, -1=Decrease, (0.0020) (0.0026) (0.0025) 0=No Event)
-0.0008 0.0005(Low Cost of Embargo Violation) (0.0038) (0.0031)
0.0025 0.0023 0.0023(1=Increase War, -1=Decrease, (0.0018) (0.0022) (0.0023) 0=No Event)
0.0008 0.0001(Low Cost of Embargo Violation) (0.0029) (0.0030)
-0.0001 -0.0001Violation - Indicator Variable (0.0002) (0.0002)
-0.0001 -0.0001 -0.0001(0.0001) (0.0001) (0.0001)
Proxy Measure - Indicator Variable High Lowfor Low Cost of Embargo Violation Corruption Transparency
of Arms Trade
492541 492541 475101
Event Outside Embargo
Proxy for Low Cost of Embargo
Event in Countries without Embargo *
Event Outside Embargo *
Event in Countries without Embargo
* significant at 10%; ** significant at 5%; *** significant at 1%
N
Notes: An observation in the regression is a trading day for one of the 153 arms-producing companies in the years 1985-2005. Thedependent variable is the abnormal 3-day cumulative return. The market correction is computed on the calendar year previous to thetrading day. The variable Event During the Embargo takes value 1 if on day t, during the embargo period, an event increases theconflict, takes value -1 if, during the embargo period, an event decreases the conflict, and takes value 0 otherwise. The variable High-Corruption Country is an indicator variable indicating companies head-quartered in countries with above-median corruption accordingto the Corruption-Perceptions Index of Transparency International . The variable Low-Transparency of Arms Trade Robust is anindicator variable indicating companies head-quartered in countries with below-median transparency in arms trade according to theSmall Arms Survey. Robust standard errors clustered by date in parentheses.
Constant
Table 5. Stock Market Reaction to Events Outside the Embargo
Event During Embargo
Event During Embargo *
Abnormal 3-Day Stock Return (-1,1)
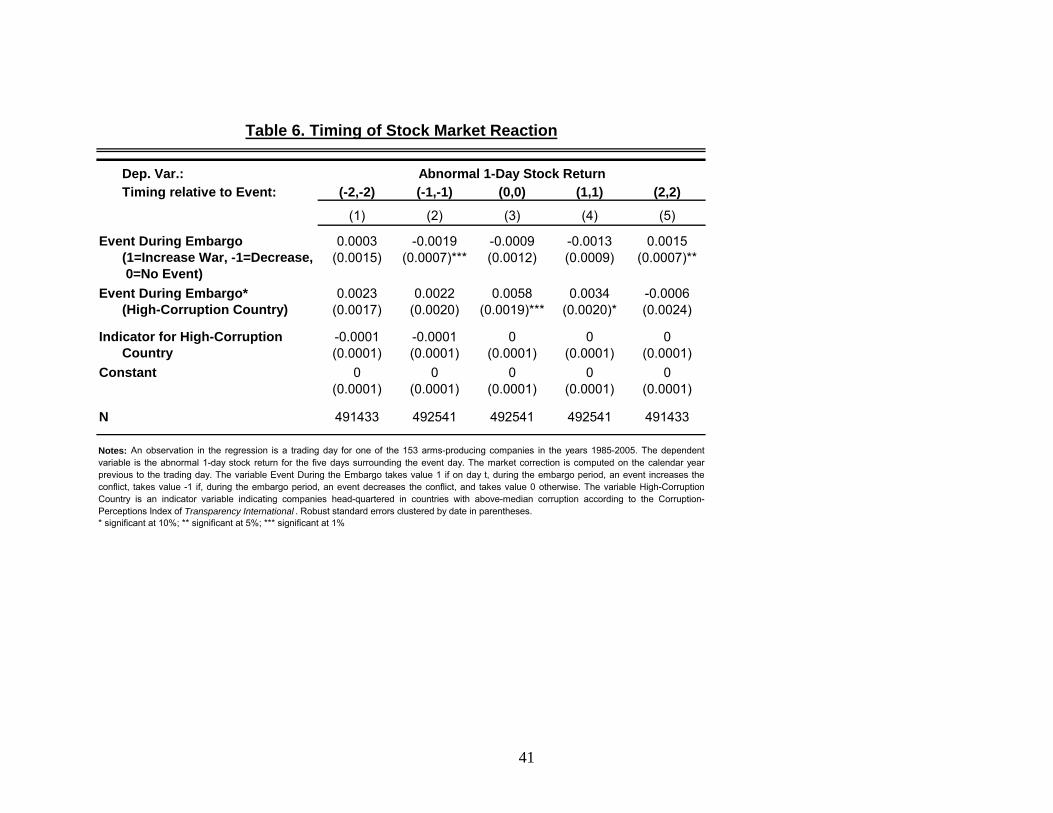
41
Dep. Var.:Timing relative to Event: (-2,-2) (-1,-1) (0,0) (1,1) (2,2)
(1) (2) (3) (4) (5)
0.0003 -0.0019 -0.0009 -0.0013 0.0015(1=Increase War, -1=Decrease, (0.0015) (0.0007)*** (0.0012) (0.0009) (0.0007)** 0=No Event)
0.0023 0.0022 0.0058 0.0034 -0.0006(High-Corruption Country) (0.0017) (0.0020) (0.0019)*** (0.0020)* (0.0024)
-0.0001 -0.0001 0 0 0Country (0.0001) (0.0001) (0.0001) (0.0001) (0.0001)
0 0 0 0 0(0.0001) (0.0001) (0.0001) (0.0001) (0.0001)
491433 492541 492541 492541 491433
Table 6. Timing of Stock Market Reaction
Abnormal 1-Day Stock Return
Event During Embargo
Event During Embargo*
N
Notes: An observation in the regression is a trading day for one of the 153 arms-producing companies in the years 1985-2005. The dependentvariable is the abnormal 1-day stock return for the five days surrounding the event day. The market correction is computed on the calendar yearprevious to the trading day. The variable Event During the Embargo takes value 1 if on day t, during the embargo period, an event increases theconflict, takes value -1 if, during the embargo period, an event decreases the conflict, and takes value 0 otherwise. The variable High-CorruptionCountry is an indicator variable indicating companies head-quartered in countries with above-median corruption according to the Corruption-Perceptions Index of Transparency International . Robust standard errors clustered by date in parentheses.* significant at 10%; ** significant at 5%; *** significant at 1%
Indicator for High-Corruption
Constant
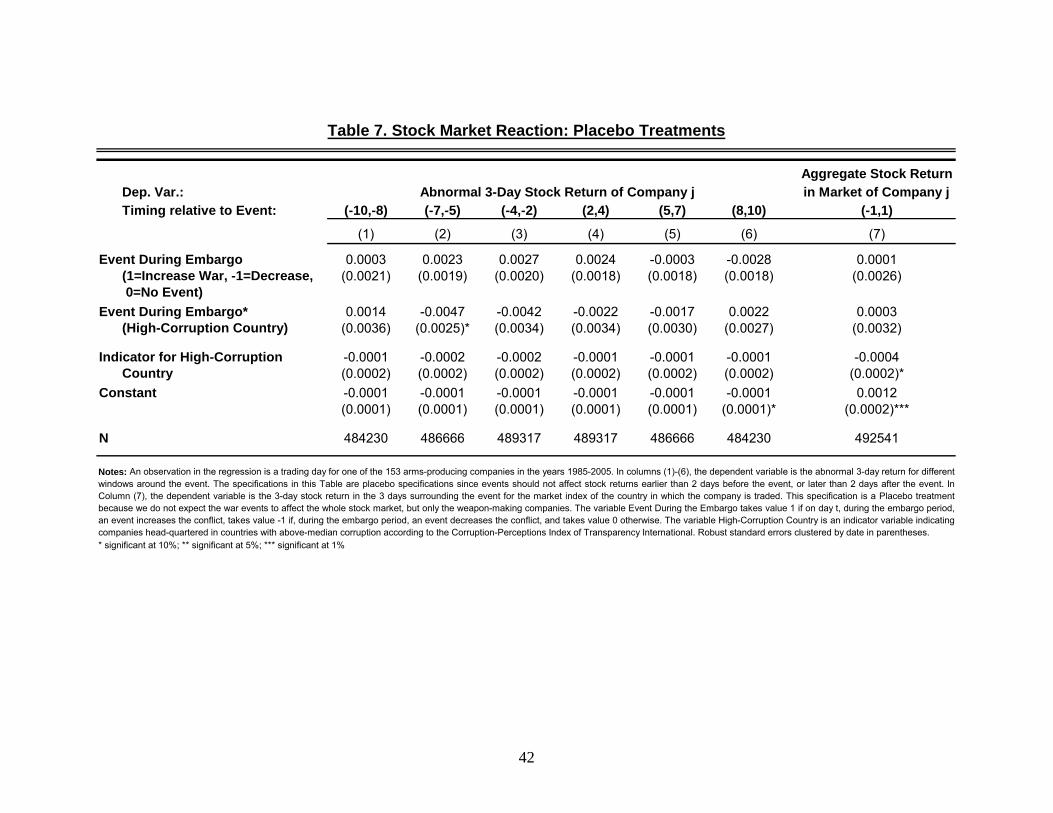
42
Aggregate Stock ReturnDep. Var.: in Market of Company jTiming relative to Event: (-10,-8) (-7,-5) (-4,-2) (2,4) (5,7) (8,10) (-1,1)
(1) (2) (3) (4) (5) (6) (7)
0.0003 0.0023 0.0027 0.0024 -0.0003 -0.0028 0.0001(1=Increase War, -1=Decrease, (0.0021) (0.0019) (0.0020) (0.0018) (0.0018) (0.0018) (0.0026) 0=No Event)
0.0014 -0.0047 -0.0042 -0.0022 -0.0017 0.0022 0.0003(High-Corruption Country) (0.0036) (0.0025)* (0.0034) (0.0034) (0.0030) (0.0027) (0.0032)
-0.0001 -0.0002 -0.0002 -0.0001 -0.0001 -0.0001 -0.0004Country (0.0002) (0.0002) (0.0002) (0.0002) (0.0002) (0.0002) (0.0002)*
-0.0001 -0.0001 -0.0001 -0.0001 -0.0001 -0.0001 0.0012(0.0001) (0.0001) (0.0001) (0.0001) (0.0001) (0.0001)* (0.0002)***
484230 486666 489317 489317 486666 484230 492541
Table 7. Stock Market Reaction: Placebo Treatments
Event During Embargo
Event During Embargo*
Abnormal 3-Day Stock Return of Company j
* significant at 10%; ** significant at 5%; *** significant at 1%
N
Notes: An observation in the regression is a trading day for one of the 153 arms-producing companies in the years 1985-2005. In columns (1)-(6), the dependent variable is the abnormal 3-day return for differentwindows around the event. The specifications in this Table are placebo specifications since events should not affect stock returns earlier than 2 days before the event, or later than 2 days after the event. InColumn (7), the dependent variable is the 3-day stock return in the 3 days surrounding the event for the market index of the country in which the company is traded. This specification is a Placebo treatmentbecause we do not expect the war events to affect the whole stock market, but only the weapon-making companies. The variable Event During the Embargo takes value 1 if on day t, during the embargo period,an event increases the conflict, takes value -1 if, during the embargo period, an event decreases the conflict, and takes value 0 otherwise. The variable High-Corruption Country is an indicator variable indicatingcompanies head-quartered in countries with above-median corruption according to the Corruption-Perceptions Index of Transparency International. Robust standard errors clustered by date in parentheses.
Indicator for High-Corruption
Constant

43
Dep. Var.:Firm Characteristics:
Small Large Small Arms & Small ArmsFirms Firms Ammunitions Missiles Tanks Explosives NISAT
(1) (2) (3) (4) (5) (6) (7)
-0.01 -0.0024 -0.0048 -0.0057 -0.0049 -0.0077 -0.0012(1=Increase War, -1=Decrease, (0.0029)*** (0.0018) (0.0035) (0.0036) (0.0042) (0.0048) (0.0038) 0=No Event)
0.02 0.0075 0.0099 0.029 0.0046 0.0137 0.0049(High-Corruption Country) (0.0052)*** (0.0042)* (0.0056)* (0.0186) (0.0046) (0.0084) (0.0044)
-0.0003 0 -0.0001 0.0004 0.0001 -0.0002 0.0006Country (0.0004) (0.0002) (0.0004) (0.0007) (0.0005) (0.0004) (0.0003)**
-0.0001 -0.0001 -0.0002 -0.0001 -0.0001 -0.0001 -0.0002(0.0003) (0.0001) (0.0002) (0.0002) (0.0002) (0.0003) (0.0002)
All All Worldscope Worldscope Worldscope Worldscope NISAT
132699 355898 133316 113998 43061 58395 139893
* significant at 10%; ** significant at 5%; *** significant at 1%
Constant
Sample of Companies
Event During Embargo
Event During Embargo*
Indicator for High-Corruption
N
Abnormal 3-Day Stock Return (-1,1)
Table 8. Stock Market Reaction by Firm Characteristics (Firm Size and Type of Arms)
Notes: An observation in the regression is a trading day for one of the 153 arms-producing companies in the years 1985-2005. The dependent variable is the abnormal 3-day cumulative return. InColumn (1)-(2) we estimate separately the results for small and large firms. We define as small firms those in the bottom quartile of annual revenue (in US dollars) in any given year. The remainingfirms are classified as large. In Columns (3)-(6), the sample includes only companies with one of the 8 SIC codes in the range of a particular type of arms, that is, 3482-3484, and 3489 for smallarms and ammunitions, 3761, 3764, and 3769 for missiles, 3795 for tanks, and 2892 for explosives. In Column (7), the sample includes the public companies listed in the sample of small armscompanies identified by NISAT. The variable Event During the Embargo takes value 1 if on day t, during the embargo period, an event increases the conflict, takes value -1 if, during the embargoperiod, an event decreases the conflict, and takes value 0 otherwise. The variable High-Corruption Country is an indicator variable indicating companies head-quartered in countries with above-median corruption according to the Corruption-Perceptions Index of Transparency International. Robust standard errors clustered by date in parentheses.
Type of Arms ProducedFirm Size
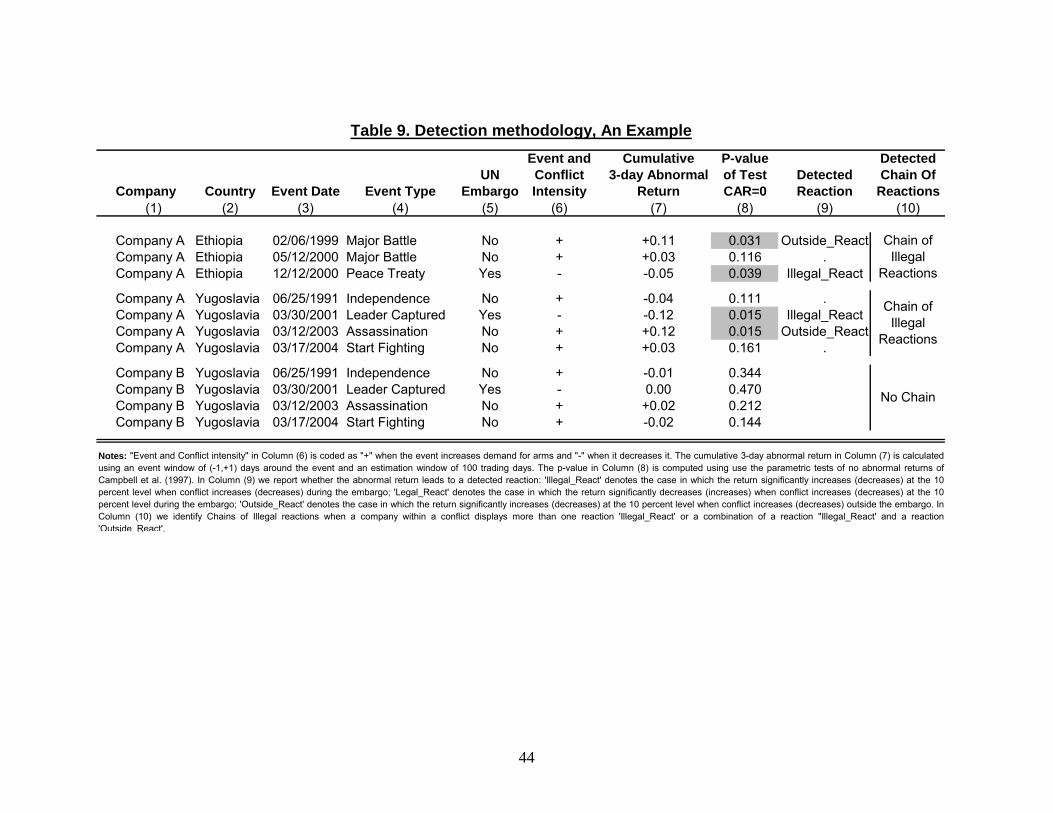
44
Event and Cumulative P-value DetectedUN Conflict 3-day Abnormal of Test Detected Chain Of
Company Country Event Date Event Type Embargo Intensity Return CAR=0 Reaction Reactions(1) (2) (3) (4) (5) (6) (7) (8) (9) (10)
Company A Ethiopia 02/06/1999 Major Battle No + +0.11 0.031 Outside_ReactCompany A Ethiopia 05/12/2000 Major Battle No + +0.03 0.116 .Company A Ethiopia 12/12/2000 Peace Treaty Yes - -0.05 0.039 Illegal_React
Company A Yugoslavia 06/25/1991 Independence No + -0.04 0.111 .Company A Yugoslavia 03/30/2001 Leader Captured Yes - -0.12 0.015 Illegal_ReactCompany A Yugoslavia 03/12/2003 Assassination No + +0.12 0.015 Outside_ReactCompany A Yugoslavia 03/17/2004 Start Fighting No + +0.03 0.161 .
Company B Yugoslavia 06/25/1991 Independence No + -0.01 0.344Company B Yugoslavia 03/30/2001 Leader Captured Yes - 0.00 0.470Company B Yugoslavia 03/12/2003 Assassination No + +0.02 0.212Company B Yugoslavia 03/17/2004 Start Fighting No + -0.02 0.144
Chain of Illegal
Reactions
Chain of Illegal
Reactions
Table 9. Detection methodology, An Example
Notes: "Event and Conflict intensity" in Column (6) is coded as "+" when the event increases demand for arms and "-" when it decreases it. The cumulative 3-day abnormal return in Column (7) is calculatedusing an event window of (-1,+1) days around the event and an estimation window of 100 trading days. The p-value in Column (8) is computed using use the parametric tests of no abnormal returns ofCampbell et al. (1997). In Column (9) we report whether the abnormal return leads to a detected reaction: 'Illegal_React' denotes the case in which the return significantly increases (decreases) at the 10percent level when conflict increases (decreases) during the embargo; 'Legal_React' denotes the case in which the return significantly decreases (increases) when conflict increases (decreases) at the 10percent level during the embargo; 'Outside_React' denotes the case in which the return significantly increases (decreases) at the 10 percent level when conflict increases (decreases) outside the embargo. InColumn (10) we identify Chains of Illegal reactions when a company within a conflict displays more than one reaction 'Illegal_React' or a combination of a reaction "Illegal_React' and a reaction'Outside React'.
No Chain
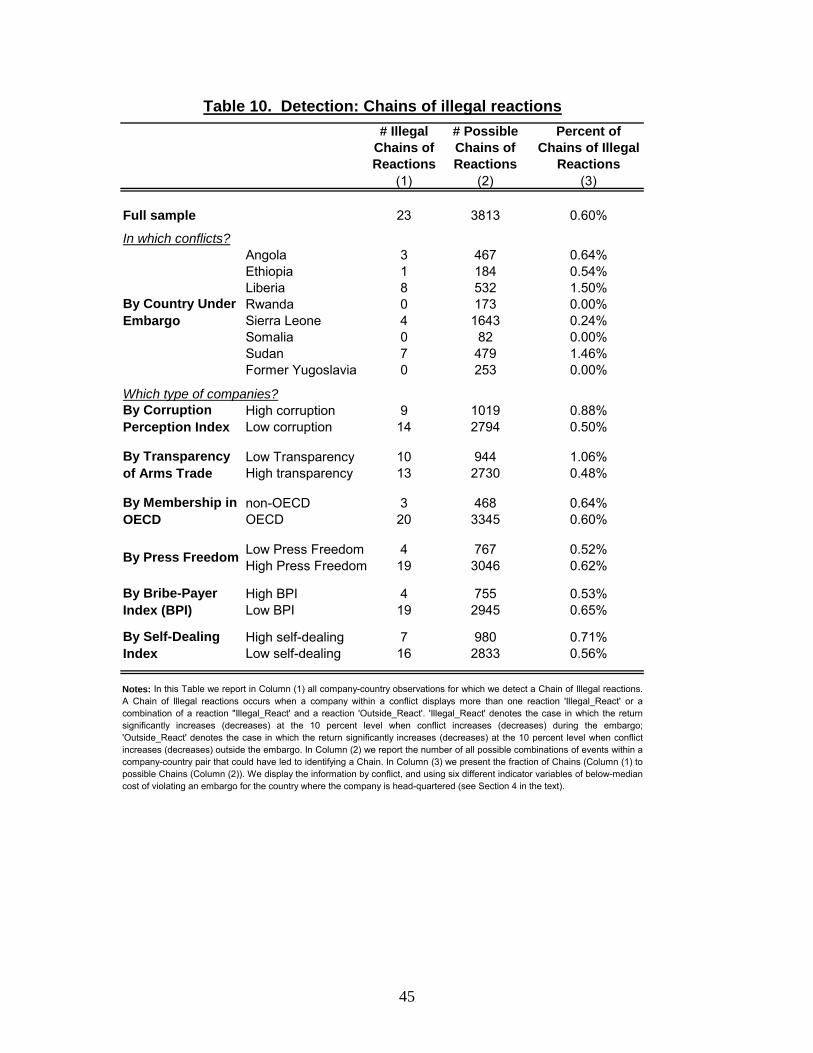
45
# Illegal # Possible Percent ofChains of Chains of Chains of IllegalReactions Reactions Reactions
(1) (2) (3)
Full sample 23 3813 0.60%
In which conflicts?Angola 3 467 0.64%Ethiopia 1 184 0.54%Liberia 8 532 1.50%Rwanda 0 173 0.00%Sierra Leone 4 1643 0.24%Somalia 0 82 0.00%Sudan 7 479 1.46%Former Yugoslavia 0 253 0.00%
Which type of companies?High corruption 9 1019 0.88%Low corruption 14 2794 0.50%
Low Transparency 10 944 1.06%High transparency 13 2730 0.48%
non-OECD 3 468 0.64%OECD 20 3345 0.60%
Low Press Freedom 4 767 0.52%High Press Freedom 19 3046 0.62%
High BPI 4 755 0.53%Low BPI 19 2945 0.65%
High self-dealing 7 980 0.71%Low self-dealing 16 2833 0.56%
Notes: In this Table we report in Column (1) all company-country observations for which we detect a Chain of Illegal reactions.A Chain of Illegal reactions occurs when a company within a conflict displays more than one reaction 'Illegal_React' or acombination of a reaction "Illegal_React' and a reaction 'Outside_React'. 'Illegal_React' denotes the case in which the returnsignificantly increases (decreases) at the 10 percent level when conflict increases (decreases) during the embargo;'Outside_React' denotes the case in which the return significantly increases (decreases) at the 10 percent level when conflictincreases (decreases) outside the embargo. In Column (2) we report the number of all possible combinations of events within acompany-country pair that could have led to identifying a Chain. In Column (3) we present the fraction of Chains (Column (1) topossible Chains (Column (2)). We display the information by conflict, and using six different indicator variables of below-mediancost of violating an embargo for the country where the company is head-quartered (see Section 4 in the text).
By Membership in OECD
By Press Freedom
By Bribe-Payer Index (BPI)
By Self-Dealing Index
Table 10. Detection: Chains of illegal reactions
By Country Under Embargo
By Corruption Perception Index
By Transparency of Arms Trade
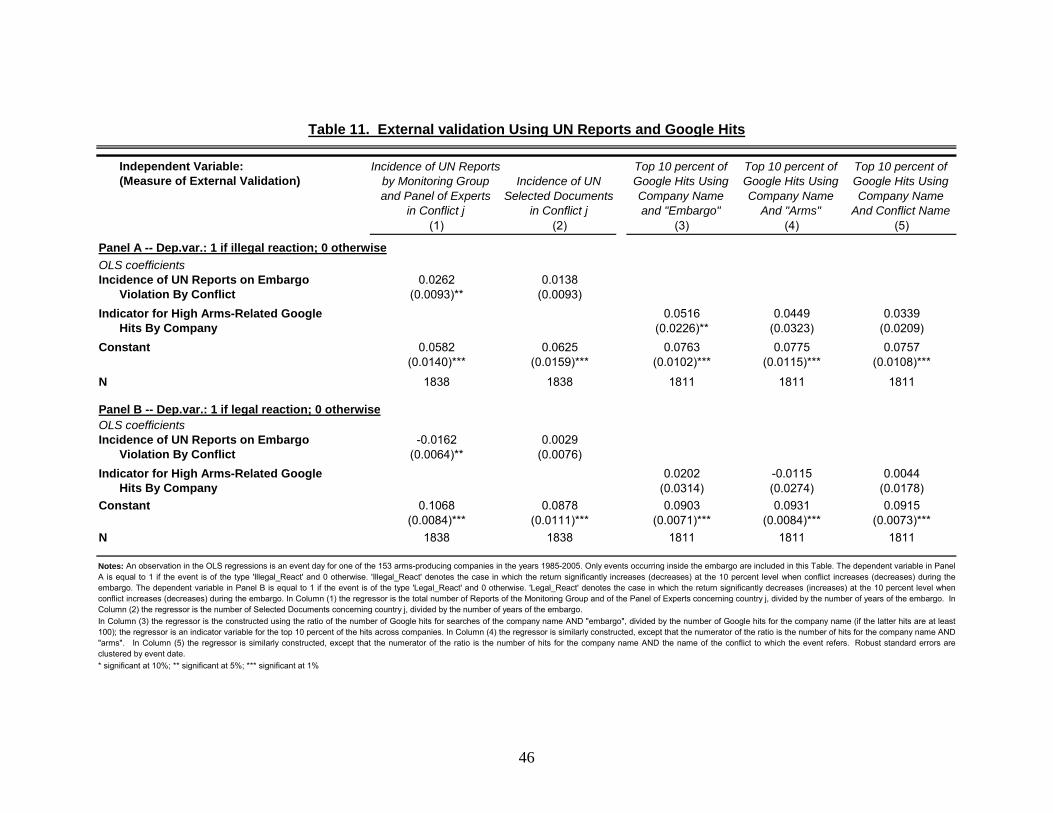
46
Independent Variable: Incidence of UN Reports Top 10 percent of Top 10 percent of Top 10 percent of(Measure of External Validation) by Monitoring Group Incidence of UN Google Hits Using Google Hits Using Google Hits Using
and Panel of Experts Selected Documents Company Name Company Name Company Namein Conflict j in Conflict j and "Embargo" And "Arms" And Conflict Name
(1) (2) (3) (4) (5)
Panel A -- Dep.var.: 1 if illegal reaction; 0 otherwiseOLS coefficients
0.0262 0.0138Violation By Conflict (0.0093)** (0.0093)
0.0516 0.0449 0.0339Hits By Company (0.0226)** (0.0323) (0.0209)
0.0582 0.0625 0.0763 0.0775 0.0757(0.0140)*** (0.0159)*** (0.0102)*** (0.0115)*** (0.0108)***
1838 1838 1811 1811 1811
Panel B -- Dep.var.: 1 if legal reaction; 0 otherwiseOLS coefficients
-0.0162 0.0029Violation By Conflict (0.0064)** (0.0076)
0.0202 -0.0115 0.0044Hits By Company (0.0314) (0.0274) (0.0178)
0.1068 0.0878 0.0903 0.0931 0.0915(0.0084)*** (0.0111)*** (0.0071)*** (0.0084)*** (0.0073)***
1838 1838 1811 1811 1811
In Column (3) the regressor is the constructed using the ratio of the number of Google hits for searches of the company name AND "embargo", divided by the number of Google hits for the company name (if the latter hits are at least100); the regressor is an indicator variable for the top 10 percent of the hits across companies. In Column (4) the regressor is similarly constructed, except that the numerator of the ratio is the number of hits for the company name AND"arms". In Column (5) the regressor is similarly constructed, except that the numerator of the ratio is the number of hits for the company name AND the name of the conflict to which the event refers. Robust standard errors areclustered by event date.* significant at 10%; ** significant at 5%; *** significant at 1%
N
Constant
N
Notes: An observation in the OLS regressions is an event day for one of the 153 arms-producing companies in the years 1985-2005. Only events occurring inside the embargo are included in this Table. The dependent variable in PanelA is equal to 1 if the event is of the type 'Illegal_React' and 0 otherwise. 'Illegal_React' denotes the case in which the return significantly increases (decreases) at the 10 percent level when conflict increases (decreases) during theembargo. The dependent variable in Panel B is equal to 1 if the event is of the type 'Legal_React' and 0 otherwise. 'Legal_React' denotes the case in which the return significantly decreases (increases) at the 10 percent level whenconflict increases (decreases) during the embargo. In Column (1) the regressor is the total number of Reports of the Monitoring Group and of the Panel of Experts concerning country j, divided by the number of years of the embargo. InColumn (2) the regressor is the number of Selected Documents concerning country j, divided by the number of years of the embargo.
Table 11. External validation Using UN Reports and Google Hits
Indicator for High Arms-Related Google
Incidence of UN Reports on Embargo
Indicator for High Arms-Related Google
Incidence of UN Reports on Embargo
Constant

47
Country Embargo Target Date Imposed Date Lifted Res. No. By Included(1) (2) (3) (4) (5) (6) (7)
South Africa 11/4/1977 5/24/1994 UNSCR 418 UN No (too early)Iraq 8/6/1990 -- UNSCR 661 UN No (Gulf War)
Former Yugoslavia 9/25/1991 10/1/1996 UNSCR 713 UN Yes3/31/1998 9/10/2001 UNSCR 1160 UN
Somalia 1/23/1992 -- UNSCR 733 UN YesLibya 3/31/1992 12/9/2003 UNSCR 748 UN No (no war)
Liberia 11/19/1992 -- UNSCR 788 UN Yes
Haiti 10/13/1993 10/15/1994 UNSCR 841 UN No (no event during embargo)
Angola UNITA 9/15/1993 12/9/2002 UNSCR 864 UN YesRwanda 5/17/1994 8/16/1995 UNSCR 918 UN Yes
Rebels 8/16/1995 -- UNSCR 1011 UNSudan 3/15/1994 9/28/2001 94/165/CFSP UN Yes
7/30/2004 -- UNSCR 1556 UNSierra Leone 10/8/1997 6/5/1998 UNSCR 1132 UN Yes
Rebels 6/5/1998 -- UNSCR 1171 UNEthiopia & Eritrea 5/17/2000 5/16/2001 UNSCR 1298 UN Yes
Afghanistan Taliban 12/19/2000 -- UNSCR 1267 UN No (Afghan War)
Notes: The Table lists all embargoes imposed from 1975 on by the United Nations. Column (1) and (2) list the country affectd and the embargo target, if differentfrom the whole nation. Columns (3) and (4) report the date the Embargo was imposed and the date the embargo was lifted, if any. Columns (5) and (6) report theresolution number and the organization issuing the embargo. Finally, Column (7) states whether the embargo is included in the data set in this paper, and if notwhy.
Appendix Table A1. List of Countries with Arms Embargoes

48
Country Date Event Type of Event Event Description Effect onHostilities
Event Surpr.
Event Import.
Angola 12/22/1988 Peace Agreement Angola, Cuba and, South Africa reach agreement. South Africa agrees towithdraw troops.
Decreases 2.84 32.00
12/14/1998 Major Battle UNITA attacks town of Cuito. Increases 1.67 28.0009/28/1999 Ceasefire Top UNITA general and 2,000 rebels surrendered in Bailundo. Decreases 2.32 21.5002/22/2002 Assassination Jonas Savimbi was killed on Feb. 22 by soldiers of the Angolan army. Decreases 3.69 54.50
Ethiopia 02/06/1999 Major Battle Fighting renews after a several month lull; heavy casualties. Increases 3.27 63.0005/12/2000 Major Battle Ethiopia launches major offensive against Eritrean positions. Increases 2.69 58.5012/12/2000 Peace Treaty Ethiopia and Eritrea sign a treaty formally ending their 2 year war. Decreases 1.87 35.50
Liberia 04/29/1996 Fighting Resumes Fighting resumes; Liberia's head of state, Wilton Sankawulo, and CharlesTaylor flee.
Increases 6.95 36.50
09/19/1998 Major Battle Fighting erupts in Monrovia between government forces and partisans offormer warlord Roosevelt Johnson.
Increases 4.59 19.50
08/10/1999 Major Battle Liberian president declares emergency. Fighting rages between governmenttroops and forces who seized the key town of Kolahun in northwest. State ofemergency declared.
Increases 3.68 28.50
06/05/2003 Major Battle LURD rebels launch attack on Monrovia, then withdraw. 300-400 people dieand others fled.
Increases 1.44 39.50
Rwanda 10/21/1993 Coup Burundi President Melchior Ndadaye executed by his captors after a coup. Increases 22.00 16.5004/06/1994 Assassination The airplane carrying President Habyarimana was shot down as it prepared
to land at Kigali. Military and militia groups began rounding up and killing allTutsis as well as political moderates irrespective of their ethnic backgrounds.
Increases 34.67 52.00
07/04/1994 Major Battle RPF capture Kigali. Decreases 1.68 59.50Sierra Leone
04/29/1992 Coup Captain Valentine Strasser stages a coup and removes President Momohfrom power.
Increases 17.33 13.00
02/26/1996 Elections Elections organized by the military junta give victory to the Sierra LeonePeople's Party.
Decreases 2.61 23.50
05/25/1997 Coup Major General Johnny Paul Koroma deposes President Kabbah in a militarycoup, suspends the constitution, bans demonstrations, and abolishes politicalparties. Kabbah flees to Guinea to mobilise international support.
Increases 16.67 50.00
03/10/1998 Return to power The elected president of Sierra Leone, Ahmad Tejan Kabbah, returns home -ten months after he was forced into exile by a military coup.
Decreases 2.67 40.00
01/06/1999 Coup Attempt Unsuccessful coup attempt by Revolutionary United Front. Increases 6.25 86.0005/18/1999 Ceasefire Tentative ceasefire between government forces and RUF. Decreases 2.26 21.5005/17/2000 Leader Captured Rebel leader Foday Sankoh captured. His capture came nine days after he
had disappeared from his home where he had been detained under housearrest.
Decreases 1.97 107.50
Somalia 10/03/1993 Major Battle Black Hawk Down Incident. 18 US troops killed leading immediately toincreased troops levels.
Increases 4.28 131.50
08/02/1996 Leader Dies Aidid, a Somali politician and the leader of the Habr Gidr clan, dies. He hadhindered international famine relief efforts in the early 1990s and challengedthe presence of United Nations and United States troops in the country.
Decreases 8.70 43.50
Sudan 04/06/1985 Coup Commander-in-Chief of the people's armed forces of Sudan, Abdel RahmanMohamed Hassan Suwar al Dahab, terminated the constitution andproclaimed martial law in the country.
Increases 2.25 22.50
06/30/1989 Coup National Salvation Revolution takes over in military coup. Increases 14.00 21.0012/13/1999 Fighting Begins President Bashir dissolves the National Assembly and declares a state of
emergency following a power struggle with parliamentary speaker, Hassan al-Turabi.
Increases 3.36 42.00
07/20/2002 Peace Agreement After talks in Kenya, government and SPLA sign Machakos Protocol onending 19-year civil war. Government accepts right of South to seek self-determination after six-year interim period. Southern rebels acceptapplication of Shariah law in North.
Decreases 2.03 31.50
07/31/2005 Death John Garang, leader of the rebel Sudan People's Liberation Army andSudanese First-Vice President, is killed in a helicopter crash.
Decreases 5.71 155.50
Yugoslavia 06/25/1991 Independence Croatia and Slovenia proclaim independence. Increases 3.13 47.0003/30/2001 Leader Captured Milošević arrested on charges of abuse of power and corruption Decreases 4.90 277.0003/12/2003 Assassination The prime minister of Serbia, Zoran Djindjic is assassinated. Increases 7.19 93.5003/17/2004 Start Fighting Mitrovica, in Kosovo, experiences the worst ethnic violence in the regions
since the 1999 war. At least 22 people are killed, and another 500 areinjured.
Increases 5.92 77.00
Appendix Table A2. List of Events (with Emphasis for Events under Embargo)
Notes: List of events affecting hostilities occurring inside the embargo period (emphasized) and outside the embargo period (not emphasized). The effect on hostilities is the presumed effect on hostilitiesof the event. The measures of event importance and of event surprise are based on the number of news stories containing the country name in the days surrounding the event. The event importance isthe average daily number of news hits in the day of and the day after the event. The event surprise is the ratio of the event importance and the average daily number of news hits in the four days preceding the event.
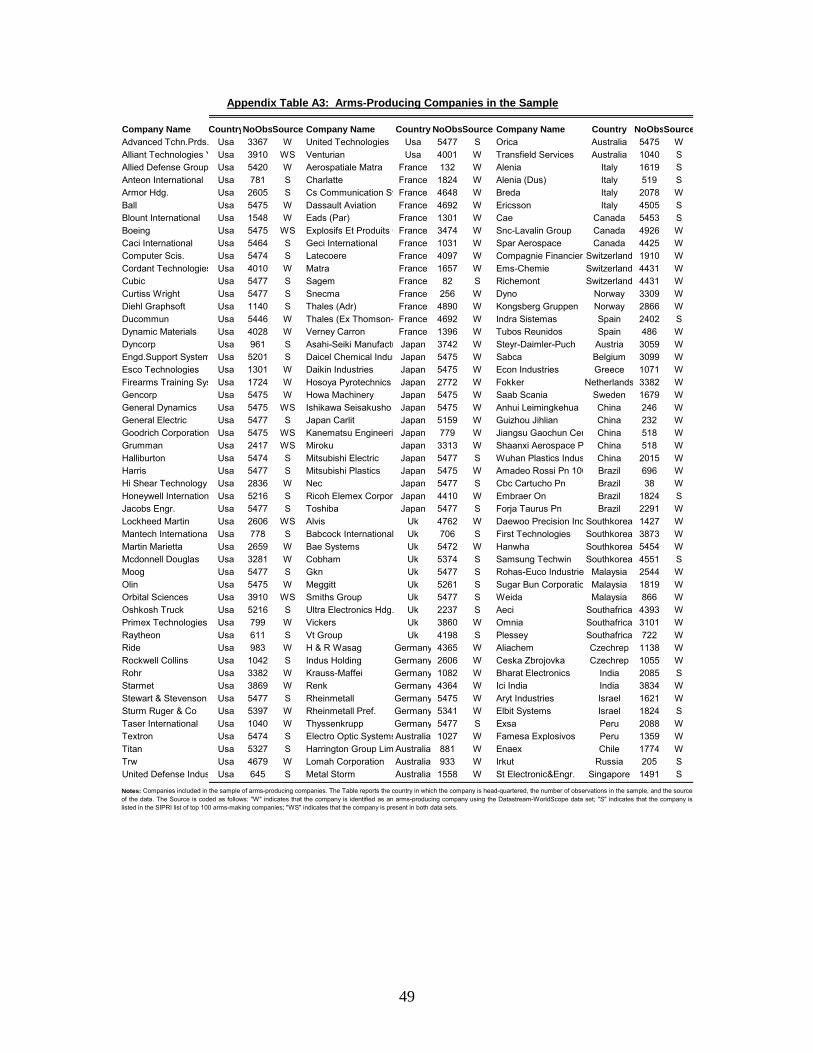
49
Company Name CountryNoObsSource Company Name Country NoObsSource Company Name Country NoObsSourceAdvanced Tchn.Prds. Usa 3367 W United Technologies Usa 5477 S Orica Australia 5475 WAlliant Technologies Y Usa 3910 WS Venturian Usa 4001 W Transfield Services Australia 1040 SAllied Defense Group Usa 5420 W Aerospatiale Matra France 132 W Alenia Italy 1619 SAnteon International Usa 781 S Charlatte France 1824 W Alenia (Dus) Italy 519 SArmor Hdg. Usa 2605 S Cs Communication Sy France 4648 W Breda Italy 2078 WBall Usa 5475 W Dassault Aviation France 4692 W Ericsson Italy 4505 SBlount International Usa 1548 W Eads (Par) France 1301 W Cae Canada 5453 SBoeing Usa 5475 WS Explosifs Et Produits CFrance 3474 W Snc-Lavalin Group Canada 4926 WCaci International Usa 5464 S Geci International France 1031 W Spar Aerospace Canada 4425 WComputer Scis. Usa 5474 S Latecoere France 4097 W Compagnie FinanciereSwitzerland 1910 WCordant Technologies Usa 4010 W Matra France 1657 W Ems-Chemie Switzerland 4431 WCubic Usa 5477 S Sagem France 82 S Richemont Switzerland 4431 WCurtiss Wright Usa 5477 S Snecma France 256 W Dyno Norway 3309 WDiehl Graphsoft Usa 1140 S Thales (Adr) France 4890 W Kongsberg Gruppen Norway 2866 WDucommun Usa 5446 W Thales (Ex Thomson- France 4692 W Indra Sistemas Spain 2402 SDynamic Materials Usa 4028 W Verney Carron France 1396 W Tubos Reunidos Spain 486 WDyncorp Usa 961 S Asahi-Seiki Manufactu Japan 3742 W Steyr-Daimler-Puch Austria 3059 WEngd.Support System Usa 5201 S Daicel Chemical Indus Japan 5475 W Sabca Belgium 3099 WEsco Technologies Usa 1301 W Daikin Industries Japan 5475 W Econ Industries Greece 1071 WFirearms Training Sys Usa 1724 W Hosoya Pyrotechnics Japan 2772 W Fokker Netherlands 3382 WGencorp Usa 5475 W Howa Machinery Japan 5475 W Saab Scania Sweden 1679 WGeneral Dynamics Usa 5475 WS Ishikawa Seisakusho Japan 5475 W Anhui Leimingkehua China 246 WGeneral Electric Usa 5477 S Japan Carlit Japan 5159 W Guizhou Jihlian China 232 WGoodrich Corporation Usa 5475 WS Kanematsu Engineeri Japan 779 W Jiangsu Gaochun Cer China 518 WGrumman Usa 2417 WS Miroku Japan 3313 W Shaanxi Aerospace P China 518 WHalliburton Usa 5474 S Mitsubishi Electric Japan 5477 S Wuhan Plastics Indus China 2015 WHarris Usa 5477 S Mitsubishi Plastics Japan 5475 W Amadeo Rossi Pn 100 Brazil 696 WHi Shear Technology Usa 2836 W Nec Japan 5477 S Cbc Cartucho Pn Brazil 38 WHoneywell Internation Usa 5216 S Ricoh Elemex Corpora Japan 4410 W Embraer On Brazil 1824 SJacobs Engr. Usa 5477 S Toshiba Japan 5477 S Forja Taurus Pn Brazil 2291 WLockheed Martin Usa 2606 WS Alvis Uk 4762 W Daewoo Precision Ind Southkorea 1427 WMantech International Usa 778 S Babcock International Uk 706 S First Technologies Southkorea 3873 WMartin Marietta Usa 2659 W Bae Systems Uk 5472 W Hanwha Southkorea 5454 WMcdonnell Douglas Usa 3281 W Cobham Uk 5374 S Samsung Techwin Southkorea 4551 SMoog Usa 5477 S Gkn Uk 5477 S Rohas-Euco Industrie Malaysia 2544 WOlin Usa 5475 W Meggitt Uk 5261 S Sugar Bun Corporatio Malaysia 1819 WOrbital Sciences Usa 3910 WS Smiths Group Uk 5477 S Weida Malaysia 866 WOshkosh Truck Usa 5216 S Ultra Electronics Hdg. Uk 2237 S Aeci Southafrica 4393 WPrimex Technologies Usa 799 W Vickers Uk 3860 W Omnia Southafrica 3101 WRaytheon Usa 611 S Vt Group Uk 4198 S Plessey Southafrica 722 WRide Usa 983 W H & R Wasag Germany 4365 W Aliachem Czechrep 1138 WRockwell Collins Usa 1042 S Indus Holding Germany 2606 W Ceska Zbrojovka Czechrep 1055 WRohr Usa 3382 W Krauss-Maffei Germany 1082 W Bharat Electronics India 2085 SStarmet Usa 3869 W Renk Germany 4364 W Ici India India 3834 WStewart & Stevenson Usa 5477 S Rheinmetall Germany 5475 W Aryt Industries Israel 1621 WSturm Ruger & Co Usa 5397 W Rheinmetall Pref. Germany 5341 W Elbit Systems Israel 1824 STaser International Usa 1040 W Thyssenkrupp Germany 5477 S Exsa Peru 2088 WTextron Usa 5474 S Electro Optic SystemsAustralia 1027 W Famesa Explosivos Peru 1359 WTitan Usa 5327 S Harrington Group Lim Australia 881 W Enaex Chile 1774 WTrw Usa 4679 W Lomah Corporation Australia 933 W Irkut Russia 205 SUnited Defense Indus Usa 645 S Metal Storm Australia 1558 W St Electronic&Engr. Singapore 1491 S
Appendix Table A3: Arms-Producing Companies in the Sample
Notes: Companies included in the sample of arms-producing companies. The Table reports the country in which the company is head-quartered, the number of observations in the sample, and the sourceof the data. The Source is coded as follows: "W" indicates that the company is identified as an arms-producing company using the Datastream-WorldScope data set; "S" indicates that the company islisted in the SIPRI list of top 100 arms-making companies; "WS" indicates that the company is present in both data sets.
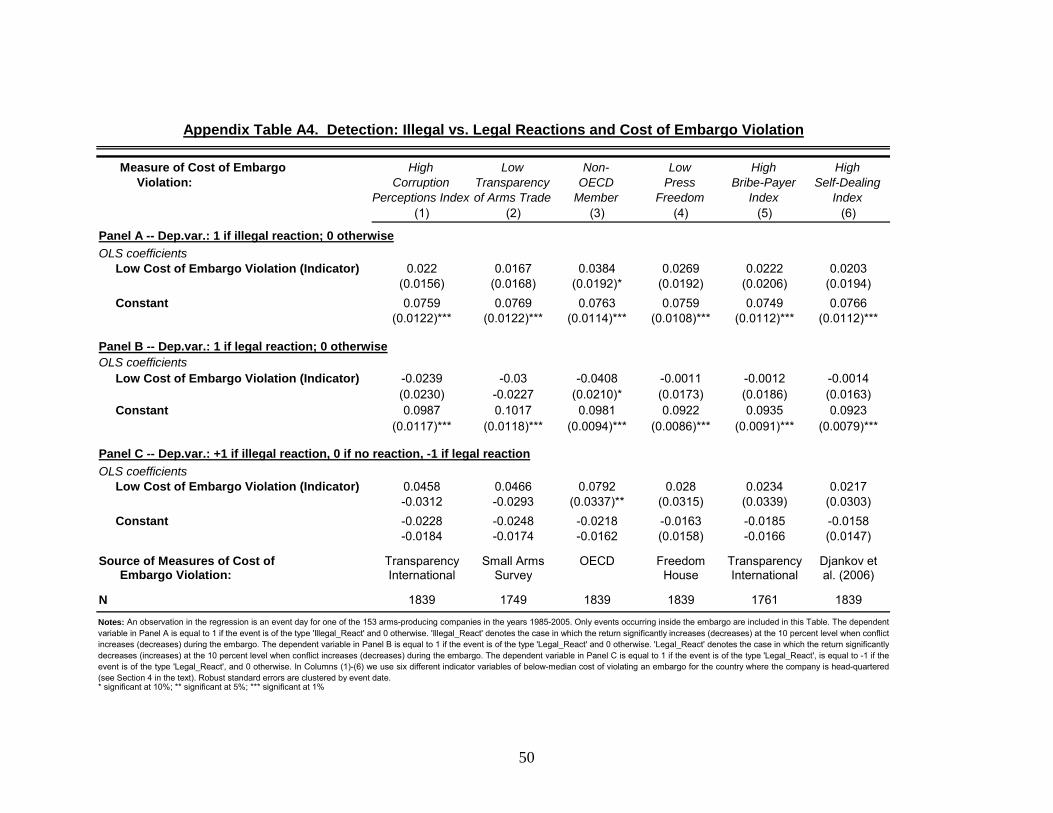
50
Measure of Cost of Embargo High Low Non- Low High High Violation: Corruption Transparency OECD Press Bribe-Payer Self-Dealing
Perceptions Index of Arms Trade Member Freedom Index Index(1) (2) (3) (4) (5) (6)
Panel A -- Dep.var.: 1 if illegal reaction; 0 otherwiseOLS coefficients
0.022 0.0167 0.0384 0.0269 0.0222 0.0203(0.0156) (0.0168) (0.0192)* (0.0192) (0.0206) (0.0194)0.0759 0.0769 0.0763 0.0759 0.0749 0.0766
(0.0122)*** (0.0122)*** (0.0114)*** (0.0108)*** (0.0112)*** (0.0112)***
Panel B -- Dep.var.: 1 if legal reaction; 0 otherwiseOLS coefficients
-0.0239 -0.03 -0.0408 -0.0011 -0.0012 -0.0014(0.0230) -0.0227 (0.0210)* (0.0173) (0.0186) (0.0163)0.0987 0.1017 0.0981 0.0922 0.0935 0.0923
(0.0117)*** (0.0118)*** (0.0094)*** (0.0086)*** (0.0091)*** (0.0079)***
Panel C -- Dep.var.: +1 if illegal reaction, 0 if no reaction, -1 if legal reactionOLS coefficients
0.0458 0.0466 0.0792 0.028 0.0234 0.0217-0.0312 -0.0293 (0.0337)** (0.0315) (0.0339) (0.0303)-0.0228 -0.0248 -0.0218 -0.0163 -0.0185 -0.0158-0.0184 -0.0174 -0.0162 (0.0158) -0.0166 (0.0147)
Source of Measures of Cost of Transparency Small Arms OECD Freedom Transparency Djankov etEmbargo Violation: International Survey House International al. (2006)
1839 1749 1839 1839 1761 1839
Appendix Table A4. Detection: Illegal vs. Legal Reactions and Cost of Embargo Violation
Low Cost of Embargo Violation (Indicator)
Constant
Low Cost of Embargo Violation (Indicator)
Constant
Low Cost of Embargo Violation (Indicator)
Constant
Notes: An observation in the regression is an event day for one of the 153 arms-producing companies in the years 1985-2005. Only events occurring inside the embargo are included in this Table. The dependentvariable in Panel A is equal to 1 if the event is of the type 'Illegal_React' and 0 otherwise. 'Illegal_React' denotes the case in which the return significantly increases (decreases) at the 10 percent level when conflictincreases (decreases) during the embargo. The dependent variable in Panel B is equal to 1 if the event is of the type 'Legal_React' and 0 otherwise. 'Legal_React' denotes the case in which the return significantlydecreases (increases) at the 10 percent level when conflict increases (decreases) during the embargo. The dependent variable in Panel C is equal to 1 if the event is of the type 'Legal_React', is equal to -1 if theevent is of the type 'Legal_React', and 0 otherwise. In Columns (1)-(6) we use six different indicator variables of below-median cost of violating an embargo for the country where the company is head-quartered(see Section 4 in the text). Robust standard errors are clustered by event date.* significant at 10%; ** significant at 5%; *** significant at 1%
N


![Detecting Carbon Monoxide Poisoning Detecting Carbon ...2].pdf · Detecting Carbon Monoxide Poisoning Detecting Carbon Monoxide Poisoning. Detecting Carbon Monoxide Poisoning C arbon](https://img.pdfslide.us/doc/110x75/5f551747b859172cd56bb119/detecting-carbon-monoxide-poisoning-detecting-carbon-2pdf-detecting-carbon.jpg)