Embed Size (px)
Citation preview

Detecting Depression from Speech withResidual Learning
MSc Research Project
Data Analytics
Donovan Michael JeremiahStudent ID: x18181562
School of Computing
National College of Ireland
Supervisor: Dr. Muhammad Iqbal
www.ncirl.ie

National College of IrelandProject Submission Sheet
School of Computing
Student Name: Donovan Michael Jeremiah
Student ID: x18181562
Programme: Data Analytics
Year: 2019-2020
Module: MSc Research Project
Supervisor: Dr. Muhammad Iqbal
Submission Due Date: 28/09/2020
Project Title: Detecting Depression from Speech with Residual Learning
Word Count: 6318
Page Count: 20
I hereby certify that the information contained in this (my submission) is informationpertaining to research I conducted for this project. All information other than my owncontribution will be fully referenced and listed in the relevant bibliography section at therear of the project.
ALL internet material must be referenced in the bibliography section. Students arerequired to use the Referencing Standard specified in the report template. To use otherauthor’s written or electronic work is illegal (plagiarism) and may result in disciplinaryaction.
Signature: Donovan Michael Jeremiah
Date: 27th September 2020
PLEASE READ THE FOLLOWING INSTRUCTIONS AND CHECKLIST:
Attach a completed copy of this sheet to each project (including multiple copies). �Attach a Moodle submission receipt of the online project submission, toeach project (including multiple copies).
�
You must ensure that you retain a HARD COPY of the project, both foryour own reference and in case a project is lost or mislaid. It is not sufficient to keepa copy on computer.
�
Assignments that are submitted to the Programme Coordinator office must be placedinto the assignment box located outside the office.
Office Use Only
Signature:
Date:
Penalty Applied (if applicable):
Detecting Depression from Speech with ResidualLearning
Donovan Michael Jeremiahx18181562
Abstract
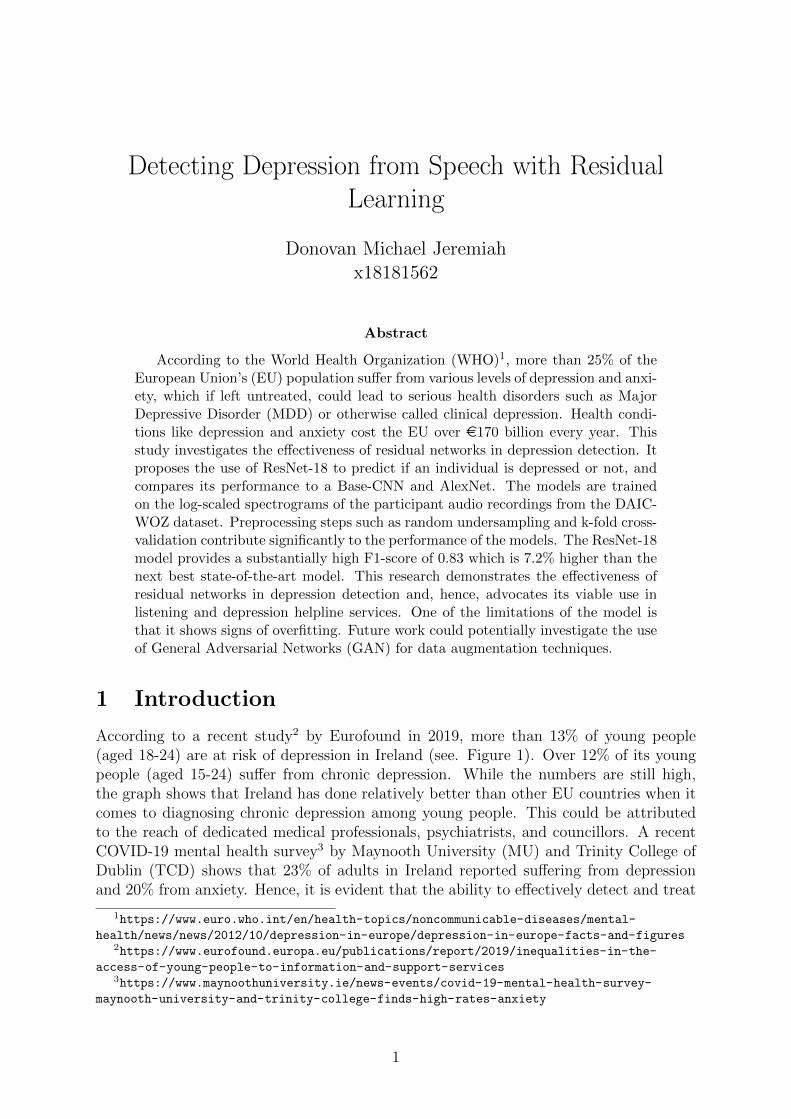
According to the World Health Organization (WHO)1, more than 25% of theEuropean Union’s (EU) population suffer from various levels of depression and anxi-ety, which if left untreated, could lead to serious health disorders such as MajorDepressive Disorder (MDD) or otherwise called clinical depression. Health condi-tions like depression and anxiety cost the EU over e170 billion every year. Thisstudy investigates the effectiveness of residual networks in depression detection. Itproposes the use of ResNet-18 to predict if an individual is depressed or not, andcompares its performance to a Base-CNN and AlexNet. The models are trainedon the log-scaled spectrograms of the participant audio recordings from the DAIC-WOZ dataset. Preprocessing steps such as random undersampling and k-fold cross-validation contribute significantly to the performance of the models. The ResNet-18model provides a substantially high F1-score of 0.83 which is 7.2% higher than thenext best state-of-the-art model. This research demonstrates the effectiveness ofresidual networks in depression detection and, hence, advocates its viable use inlistening and depression helpline services. One of the limitations of the model isthat it shows signs of overfitting. Future work could potentially investigate the useof General Adversarial Networks (GAN) for data augmentation techniques.
1 Introduction
According to a recent study2 by Eurofound in 2019, more than 13% of young people(aged 18-24) are at risk of depression in Ireland (see. Figure 1). Over 12% of its youngpeople (aged 15-24) suffer from chronic depression. While the numbers are still high,the graph shows that Ireland has done relatively better than other EU countries when itcomes to diagnosing chronic depression among young people. This could be attributedto the reach of dedicated medical professionals, psychiatrists, and councillors. A recentCOVID-19 mental health survey3 by Maynooth University (MU) and Trinity College ofDublin (TCD) shows that 23% of adults in Ireland reported suffering from depressionand 20% from anxiety. Hence, it is evident that the ability to effectively detect and treat
1https://www.euro.who.int/en/health-topics/noncommunicable-diseases/mental-
health/news/news/2012/10/depression-in-europe/depression-in-europe-facts-and-figures2https://www.eurofound.europa.eu/publications/report/2019/inequalities-in-the-
access-of-young-people-to-information-and-support-services3https://www.maynoothuniversity.ie/news-events/covid-19-mental-health-survey-
maynooth-university-and-trinity-college-finds-high-rates-anxiety
1
individuals suffering from clinical depression is paramount to the well-being of a country’ssociety.
While traditional methods of treatment such as Cognitive Behavioural Therapy (CBT),prescribed medication, and social interventions have been used to treat MDD, they firstrequire the concerned individual to be identified. This is done by putting them throughcertain invasive diagnostic procedures that are uncomfortable for those in need of help.This is where listening services (e.g. NiteLine4) and other depression helplines play animportant role with their non-invasive methods of identifying individuals with signs ofdepression.
Figure 1: Risk of depression (18-24 years, 2016) and reported chronic depression (15-24years, 2014), by country (%)
The current studies in depression detection use the Wizard-of-Oz interviews fromthe Distress Analysis Interview Corpus (DAIC-WOZ) to study depression among adults.Studies by Haque et al. (2018), Srimadhur and Lalitha (2020), and Yalamanchili et al.(2020), have shown the immense power of neural networks being applied to the field ofdepression detection. However, with the recent introduction of ResNets (He et al.; 2016a)in the computer vision domain, there has surprisingly been less research investigating theuse of residual networks in depression detection. ResNets are a type of Deep Convo-lutional Neural Network (DCNN) that achieved incredible success in computer vision’sprestigious competition ILSVRC 2015 (ImageNet Large-Scale Visual Recognition Chal-lenge). One of their main characteristics is their ability to solve the vanishing gradientproblem of deeper networks.
This research paper proposes the use of residual networks, more specifically theResNet-18 neural network, along with certain effective preprocessing techniques to in-crease the sample set and improve the model’s prediction performance. This researchuses log-scaled spectrograms of the participants’ speech as input features to ResNet-18.Two other Convolutional Neural Networks (CNN), Base-CNN and AlexNet, were em-
4NiteLine: https://niteline.ie/
2

ployed to use as baseline models to compare the performance of the ResNet. AlexNetwas employed for its promising use in audio classification.
Research Objective: To investigate the potential of residual networks in detectingif a person is depressed or not based on their PHQ-8 scores while using only their speechas input.
To investigate the above research objective, this study will implement various ResNetmodels including a standard CNN and AlexNet for comparison. They will be trained onspectrograms of audio recordings, and their effectiveness in prediction will then be eval-uated using interpretable metrics such as F1-score, precision, and recall. These metricswill then be compared with state-of-the-art research conducted in this domain using thesame DAIC-WOZ dataset. While this study uses the DIAC-WOZ corpus which consistsof American participants, it is possible that it might not fair well with other accents ofthe English language.
The rest of this research paper is organised as follows: Section 2 reviews state-of-the-art research performed in depression detection and provides the rationale for studyingresidual networks; Section 3 describes the methodology carried out in terms of dataacquisition and its preprocessing; Section 4 provides an overview of underlying designarchitecture of this research; Section 5 describes the implementation of the Base-CNN,AlexNet, and ResNet-18; Section 6 critically analyses the base models and ResNet-18,and provides a detailed discussion of its implications; finally, Section 7 provides a briefconclusion of this research study with viable areas of future work.
2 Related Work
2.1 Depression Detection Methods and Speech
In recent research, we have seen data from different domains be used to aid in depressiondetection. Traditional machine learning algorithms and, more recently, neural networkshave been used on a variety of data sources in attempts to study and predict the likelinessand severity of Major Depressive Disorder (MDD) from early signs of depression. Thisresearch has been conducted on datasets of posts from social media and online forums.Facial expressions (Zhu et al.; 2020) have also been used for prediction. Data of parti-cipants such as Electroencephalograms (EEG), Electrocardiograms (ECG) (Zhu et al.;2020), MRI scans (Mousavian et al.; 2019), and other physiological data (Zhang et al.;2020) have been regularly used in past research in depression detection.
The methods mentioned above use data that require obtrusive means of retrieval.This poses a difficulty in obtaining accurate data from clinically depressed individuals.Speech has recently been widely used in research to predict and analyze signs of depres-sion in individuals. This provides for a more unobtrusive way to detect signs of earlydepression which could ensure that appropriate attention and help are provided to at-riskindividuals. Moreover, it is cost-efficient to record speech than to require individuals toobtain physiological data such as ECGs, EEGs, and MRI scans.
One of the advantages is that the paralinguistic features of speech such as prosody,tone, and pitch make it easier to discriminate individuals diagnosed with clinical depres-sion from individuals who do not suffer from depression. Huang et al. (2020) proposes
3

a method that analyzes the acoustic features such as prosodic, spectral, and glottal fea-tures along with abrupt changes in speech articulation to detect depression in individuals.Such types of feature extraction have been proven to be the norm when using speech fordepression detection.
2.2 Use of Spectrograms
Spectrograms are a visual method of representing the amplitude of a signal (loudness)in various frequency spectrums as they vary with time. The amplitude of the signal isrepresented by the color intensity of the spectrogram. It is usually represented as a 2Dmatrix of a grayscale image where the values of the matrix represent the amplitude orintensity of the signal.
While prosodic features such as Mel-Frequency Cepstral Coefficients (MFCC), andZero Crossing Rate (ZCR) have been extensively used in past research we are seeing agrowing shift to using spectrograms for audio classification as they contain a high levelof detail rather than represent lower-level sound features like MFCCs and other prosodicfeatures. Spectrograms have been gaining traction and are being used increasingly inaudio classification. In this project, we will be using log-scaled spectrograms that havebeen extracted from a widely used signal transformation process called a Short-TimeFourier Transform (STFT) which is a specific type of Fourier transform.
Guzhov et al. (2020) advocate for the use of spectrograms in their research of clas-sifying environmental sounds using the UrbanSound8K dataset. They use pre-trainedResNets on spectrograms of clips of environmental sounds. It is found that using log-powered spectrograms is 10% more accurate than existing state-of-the-art approaches thatuse MFCCs and also Mel-spectrograms which are those that are Mel-scaled instead oflog-scaled. Esmaeili et al. (2018) achieves high sensitivity and specificity by using spec-trograms of patient breathing patterns to detect respiratory depression using trachealsound analysis.
Dinkel et al. (2019) also record the promising results in depression detection when us-ing log-scaled spectrograms while the Mel-scaled spectrograms perform slightly inferior.This could be attributed to the nature of the Mel-scaled spectrograms being less re-sponsive to changes in hyperparameters of the Bidirectional Long Short-Term Memory(BLSTM) model used. Choi et al. (2019) proposes a unique complex-valued spectrogramthat follows a different approach of spectrogram extraction from normal straightforwardSTFT log-scaled spectrograms commonly used in audio classification. They propose tonot ignore the phase information when extracting spectrograms from STFT. Magnitudeand phase can be accounted for by methods such as phase reconstruction.
Boddapati et al. (2017) also shows spectrograms perform better to MFCCs while us-ing them on popular neural network architectures like AlexNet and GoogLeNet to classifyenvironmental sounds. It is interesting to note that higher accuracy was obtained fromspectrograms that were created using a lower sample rate of 8 kHz and unsurprisinglya larger frame length. However, speech signals, unlike environmental sounds, are char-acterized by frequent abrupt changes in frequency and intuitively larger frame lengthswould mean that we lose the ability to analyze these abrupt changes.
4
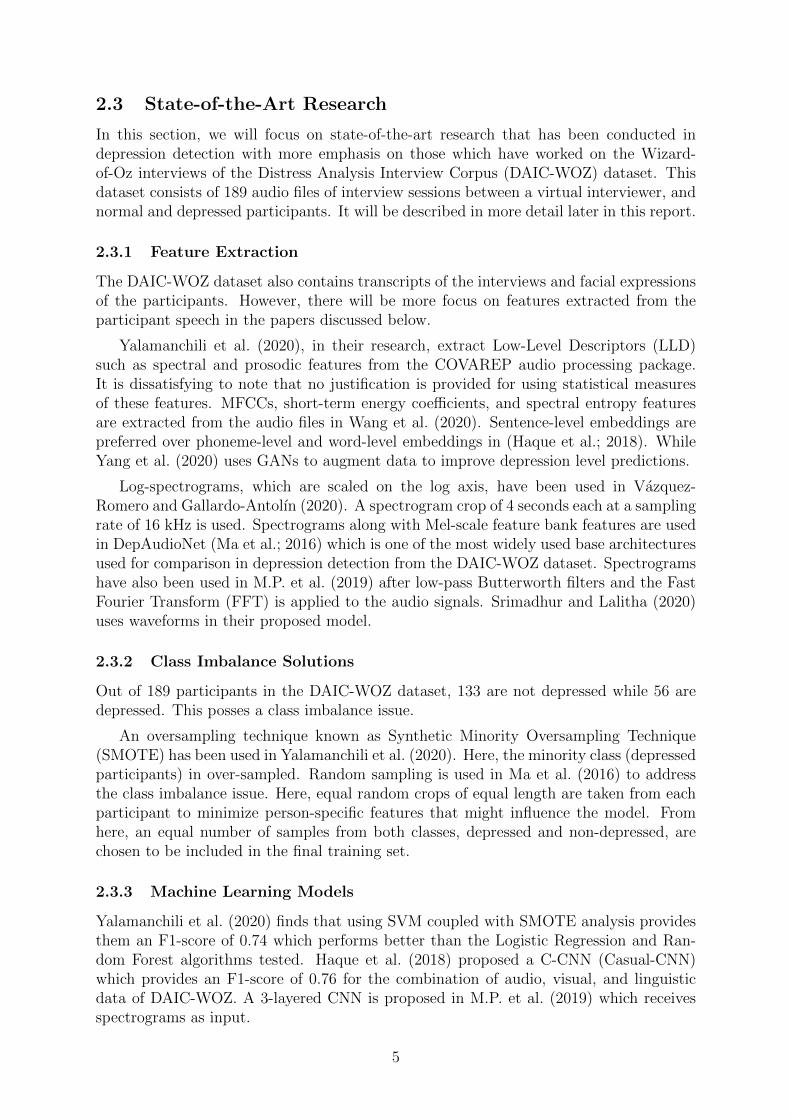
2.3 State-of-the-Art Research
In this section, we will focus on state-of-the-art research that has been conducted indepression detection with more emphasis on those which have worked on the Wizard-of-Oz interviews of the Distress Analysis Interview Corpus (DAIC-WOZ) dataset. Thisdataset consists of 189 audio files of interview sessions between a virtual interviewer, andnormal and depressed participants. It will be described in more detail later in this report.
2.3.1 Feature Extraction
The DAIC-WOZ dataset also contains transcripts of the interviews and facial expressionsof the participants. However, there will be more focus on features extracted from theparticipant speech in the papers discussed below.
Yalamanchili et al. (2020), in their research, extract Low-Level Descriptors (LLD)such as spectral and prosodic features from the COVAREP audio processing package.It is dissatisfying to note that no justification is provided for using statistical measuresof these features. MFCCs, short-term energy coefficients, and spectral entropy featuresare extracted from the audio files in Wang et al. (2020). Sentence-level embeddings arepreferred over phoneme-level and word-level embeddings in (Haque et al.; 2018). WhileYang et al. (2020) uses GANs to augment data to improve depression level predictions.
Log-spectrograms, which are scaled on the log axis, have been used in Vazquez-Romero and Gallardo-Antolın (2020). A spectrogram crop of 4 seconds each at a samplingrate of 16 kHz is used. Spectrograms along with Mel-scale feature bank features are usedin DepAudioNet (Ma et al.; 2016) which is one of the most widely used base architecturesused for comparison in depression detection from the DAIC-WOZ dataset. Spectrogramshave also been used in M.P. et al. (2019) after low-pass Butterworth filters and the FastFourier Transform (FFT) is applied to the audio signals. Srimadhur and Lalitha (2020)uses waveforms in their proposed model.
2.3.2 Class Imbalance Solutions
Out of 189 participants in the DAIC-WOZ dataset, 133 are not depressed while 56 aredepressed. This posses a class imbalance issue.
An oversampling technique known as Synthetic Minority Oversampling Technique(SMOTE) has been used in Yalamanchili et al. (2020). Here, the minority class (depressedparticipants) in over-sampled. Random sampling is used in Ma et al. (2016) to addressthe class imbalance issue. Here, equal random crops of equal length are taken from eachparticipant to minimize person-specific features that might influence the model. Fromhere, an equal number of samples from both classes, depressed and non-depressed, arechosen to be included in the final training set.
2.3.3 Machine Learning Models
Yalamanchili et al. (2020) finds that using SVM coupled with SMOTE analysis providesthem an F1-score of 0.74 which performs better than the Logistic Regression and Ran-dom Forest algorithms tested. Haque et al. (2018) proposed a C-CNN (Casual-CNN)which provides an F1-score of 0.76 for the combination of audio, visual, and linguisticdata of DAIC-WOZ. A 3-layered CNN is proposed in M.P. et al. (2019) which receivesspectrograms as input.
5
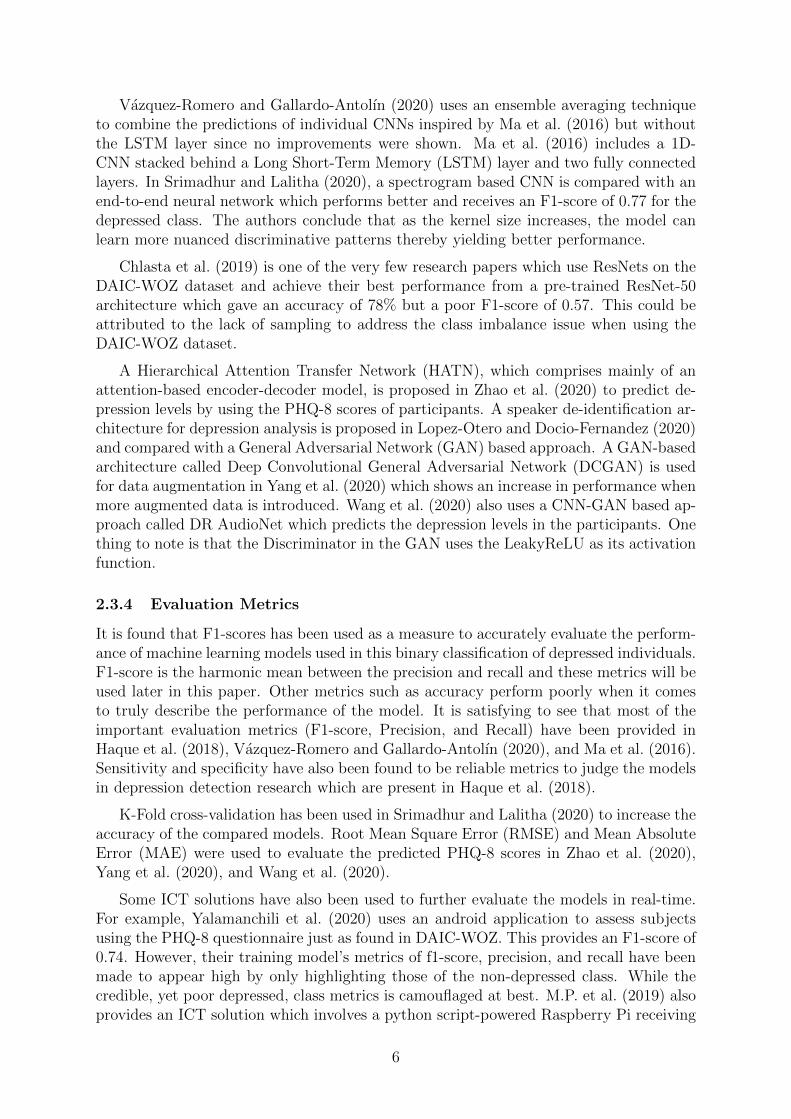
Vazquez-Romero and Gallardo-Antolın (2020) uses an ensemble averaging techniqueto combine the predictions of individual CNNs inspired by Ma et al. (2016) but withoutthe LSTM layer since no improvements were shown. Ma et al. (2016) includes a 1D-CNN stacked behind a Long Short-Term Memory (LSTM) layer and two fully connectedlayers. In Srimadhur and Lalitha (2020), a spectrogram based CNN is compared with anend-to-end neural network which performs better and receives an F1-score of 0.77 for thedepressed class. The authors conclude that as the kernel size increases, the model canlearn more nuanced discriminative patterns thereby yielding better performance.
Chlasta et al. (2019) is one of the very few research papers which use ResNets on theDAIC-WOZ dataset and achieve their best performance from a pre-trained ResNet-50architecture which gave an accuracy of 78% but a poor F1-score of 0.57. This could beattributed to the lack of sampling to address the class imbalance issue when using theDAIC-WOZ dataset.
A Hierarchical Attention Transfer Network (HATN), which comprises mainly of anattention-based encoder-decoder model, is proposed in Zhao et al. (2020) to predict de-pression levels by using the PHQ-8 scores of participants. A speaker de-identification ar-chitecture for depression analysis is proposed in Lopez-Otero and Docio-Fernandez (2020)and compared with a General Adversarial Network (GAN) based approach. A GAN-basedarchitecture called Deep Convolutional General Adversarial Network (DCGAN) is usedfor data augmentation in Yang et al. (2020) which shows an increase in performance whenmore augmented data is introduced. Wang et al. (2020) also uses a CNN-GAN based ap-proach called DR AudioNet which predicts the depression levels in the participants. Onething to note is that the Discriminator in the GAN uses the LeakyReLU as its activationfunction.
2.3.4 Evaluation Metrics
It is found that F1-scores has been used as a measure to accurately evaluate the perform-ance of machine learning models used in this binary classification of depressed individuals.F1-score is the harmonic mean between the precision and recall and these metrics will beused later in this paper. Other metrics such as accuracy perform poorly when it comesto truly describe the performance of the model. It is satisfying to see that most of theimportant evaluation metrics (F1-score, Precision, and Recall) have been provided inHaque et al. (2018), Vazquez-Romero and Gallardo-Antolın (2020), and Ma et al. (2016).Sensitivity and specificity have also been found to be reliable metrics to judge the modelsin depression detection research which are present in Haque et al. (2018).
K-Fold cross-validation has been used in Srimadhur and Lalitha (2020) to increase theaccuracy of the compared models. Root Mean Square Error (RMSE) and Mean AbsoluteError (MAE) were used to evaluate the predicted PHQ-8 scores in Zhao et al. (2020),Yang et al. (2020), and Wang et al. (2020).
Some ICT solutions have also been used to further evaluate the models in real-time.For example, Yalamanchili et al. (2020) uses an android application to assess subjectsusing the PHQ-8 questionnaire just as found in DAIC-WOZ. This provides an F1-score of0.74. However, their training model’s metrics of f1-score, precision, and recall have beenmade to appear high by only highlighting those of the non-depressed class. While thecredible, yet poor depressed, class metrics is camouflaged at best. M.P. et al. (2019) alsoprovides an ICT solution which involves a python script-powered Raspberry Pi receiving
6

input from a microphone and uses the model to predict depression from the user’s voicerecording. One again, we see that only the accuracy of the model is provided with nomention of F1-score.
Table 1: State-of-the-art research using the audio section of DAIC-WOZ.
Author Model Precision Recall F1-ScoreHaque et al. (2018)* C-CNN 0.71 0.83 0.77Srimadhur and Lalitha(2020)
End-to-end CNN 0.79 0.77 0.74
Yalamanchili et al. (2020) SVM 0.7 0.78 0.74Chlasta et al. (2019) ResNet-50 0.57 0.57 0.57Ma et al. (2016) CNN+LSTM 0.35 1 0.52
*Research utilizes audio, video, and linguistic sections of DAIC-WOZ for prediction.
2.4 AlexNet in Audio Classification
AlexNet (Krizhevsky et al.; 2012) is a Deep Convolutional Neural Network (DCNN) whichis believed to be the neural network paved the way for major advancements in the state-of-the-art CNNs we see today. It won the ILSVRC 2012 (ImageNet Large-Scale VisualRecognition Challenge) by beating the runner-up by a significant margin. ILSVRC issomething like the Olympics in Computer Vision research. On the ImageNet dataset,it achieved a top-5 error rate of 15.4% with the runner up achieving the next best of26.2%. AlexNet has recently been applied in audio classification with the increasing useof spectrograms, scalograms, and other image representations of audio features.
In their paper, Jayalakshmy and Sudha (2020), use a pre-trained AlexNet CNN topredict respiratory disorders from scalograms using the Adam optimizer. It uses a stand-ard AlexNet with 5 (convolution + max-pooling) layers followed by 3 fully connectedlayers. Singh et al. (2019) also uses scalograms of Phonocardiogram (PCG) signals on apre-trained AlexNet and achieve high-performance results with specificity and sensitivityat 90%.
However, it is important to be wary of the challenges likely to occur in audio clas-sification using AlexNet. Cohen-McFarlane et al. (2020) predict pre-trained AlexNetswould perform better on spectrograms which differ from conventional images, however,they make no further attempt to justify this statement. Other effects can be reduced byintroducing noise to increase the generalizability of the model.
2.5 ResNets in Audio Classification
Microsoft Research Asia’s 152-layered ResNet architecture (He et al.; 2016a) was thewinner of ILSVRC 2015 with an incredible error rate of 3.6%. This made them one ofthe most acclaimed neural networks in computer vision. The intuition behind this deeparchitecture is that a large number of layers help in learning more complex features. Res-Nets, with their concept of ’residual blocks’, were a solution to the infamous vanishinggradient problem which DCNNs suffered from. This problem was the reason why shal-low architectures such as AlexNet and VGG-19 (Simonyan and Zisserman; 2014) werepreferred until ResNets came along. ResNets usually come with 18, 32, 50, 101, and
7

152 layers. They have become popular in audio classification but its use in depressiondetection has been surprisingly infrequent with the exception of Chlasta et al. (2019).
In Cox et al. (2018), grayscale 2D-spectrograms of radio signals are used to predictsignal classes on Search for Extraterrestrial Intelligence (SETI) research data. The re-search shows that Wide ResNets (WRN) show improved accuracy than DenseNets andtheir deeper counterparts, ResNet-18 through ResNet-152. This is achieved with 95%lesser parameters than standard deep ResNets. In (Chen et al.; 2019), spectrograms ex-tracted from optimized S-transform (OST) on the audio signals are used in ResNet-50to predict certain respiratory sounds like wheeze and crackle. A pre-trained ResNet-50architecture in Le et al. (2019) is used to make use of transfer learning along with anSVM to classify cries of babies and identify those with asphyxia, deafness, hunger, andpain.
3 Methodology
This research will utilize the Knowledge Discovery in Databases (KDD) methodology,initially proposed by Fayyad et al. (1996). This methodology will be the underlyingapproach to acquire, process, experiment with, evaluate, and ultimately gain insightsfrom data in the domain of depression detection. In summary, this approach entailsthe data selection, data preprocessing, data transformation, and the application of theproposed neural network and its evaluation.
3.1 Dataset
The dataset used in this research is of the Wizard-of-Oz interviews from the DistressAnalysis Interview Corpus (DAIC-WOZ)5. It is obtained from the University of SouthernCalifornia’s (USC) Institute for Creative Technologies and was part of the 2016 Au-dio/Visual Emotional Challenge and Workshop (AVEC 2016) (Valstar et al.; 2016). AnEnd User License Agreement (EULA) was submitted and, upon approval, credentials wereprovided to access the dataset from which the interview audio files were downloaded. Allparticipants who have taken part in the study in the DAIC-WOZ dataset have signedwaivers that approve the usage of the data collected for academic research purposes.
The dataset consists of 189 .wav audio files of interview sessions with depressed andnon-depressed participants averaging almost 16 minutes for each interview session. Theparticipant is labelled ’depressed’ or ’not-depressed’ based on the results of a psychiatricquestionnaire, PHQ-8, filled-in by them prior to the interview. A PHQ-score of 10 ormore would indicate the participant suffers from a certain level of depression.
These WOZ-styled interviews are conducted by a virtual interviewer named Ellie whois controlled by a human interviewer in another room. The participants are asked open-ended questions such as ”Who’s someone that’s been a positive influence in your life?...Can you tell me about that?”.
5DAIC-WOZ Dataset: https://dcapswoz.ict.usc.edu/
8

3.2 Audio Segmentation
The files have been segmented to extract only the participant’s speech without the si-lence, background noises, and the voices of other speakers. This was possible since theparticipants used microphones in a low-noise environment which permitted the segment-ation of most audio files with the exception of a few due to technical difficulties. Thiswas done using python’s pyAudioAnalysis6 package.
3.3 Spectrogram Extraction
In this research paper, as mentioned in section 2.2, we have decided to use log-scaledspectrograms of the audio clips. This decision was influenced by the increased efficiencyobtained by using spectrograms in recent state-of-the-art audio classification researchsuch as Guzhov et al. (2020), Esmaeili et al. (2018), and Boddapati et al. (2017).
The segmented audio clips, which only contain the participant voices, are then sampledat a 16 kHz sample rate. The Short-Time Fourier transform (STFT) is then performed onthe signal using a Hanning window, a frame size of 1024, and a hop size of 512 samples.The resulting spectrogram of each segmented audio clip is obtained in the form of a 2Dmatrix. They are then scaled logarithmically to produce log-scaled spectrograms. Thisblog 7 shows that log-scaling of spectrograms perform much better than z-score or min-max scaling. These are then stored locally as grayscale images in preparation for the nextpreprocessing step, random undersampling.
(a) Participant ID: 482 (Normal) (b) Participant ID: 426 (Despressed)
Figure 2: 15-second crops of log-scaled spectrograms.
One interesting observation to note is that depressed participants generally providelow-pitched, relatively short, to-the-point, responses to open-ended questions. Whereas,non-depressed participants tend to be more comfortable with providing detailed re-sponses. This behaviour can be visualised in the spectrogram of the depressed parti-cipant (b) where their voice signals hardly activate the high-frequency bands unlike withthe non-depressed (a) participant.
6pyAudioAnalysis: https://github.com/tyiannak/pyAudioAnalysis7Blog: https://medium.com/using-cnn-to-classify-audio/effects-of-spectrogram-pre-
processing-for-audio-classification-a551f3da5a46
9
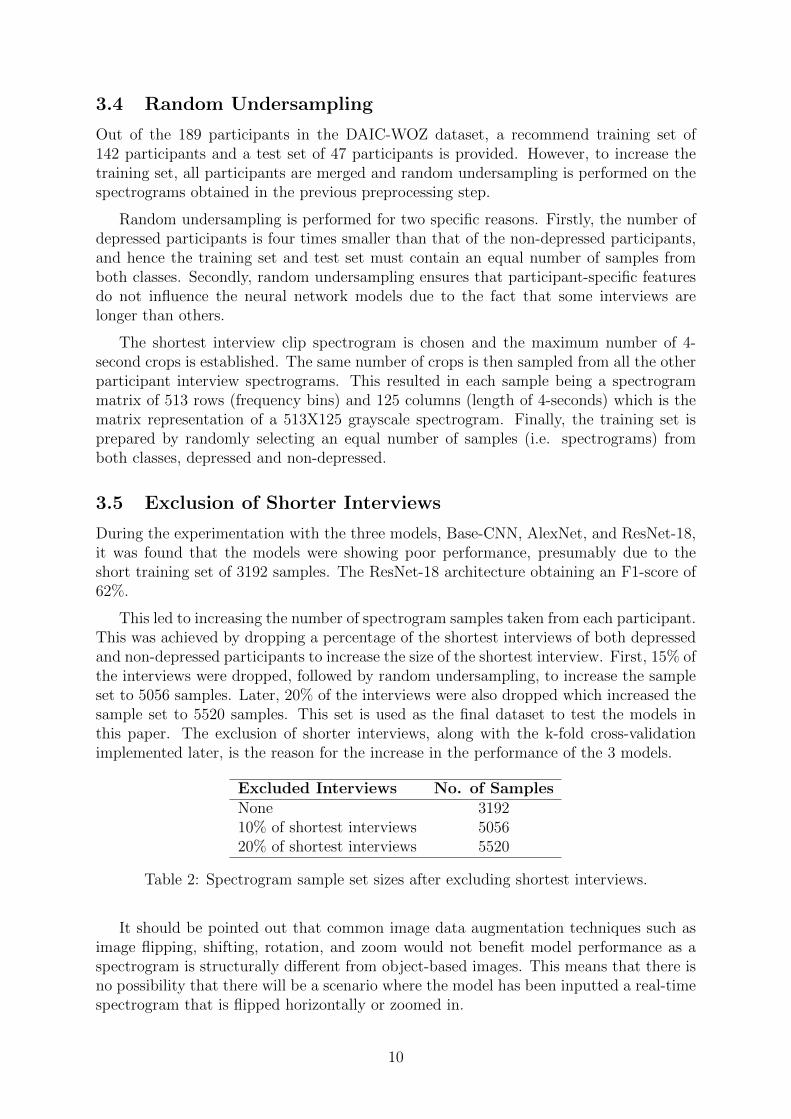
3.4 Random Undersampling
Out of the 189 participants in the DAIC-WOZ dataset, a recommend training set of142 participants and a test set of 47 participants is provided. However, to increase thetraining set, all participants are merged and random undersampling is performed on thespectrograms obtained in the previous preprocessing step.
Random undersampling is performed for two specific reasons. Firstly, the number ofdepressed participants is four times smaller than that of the non-depressed participants,and hence the training set and test set must contain an equal number of samples fromboth classes. Secondly, random undersampling ensures that participant-specific featuresdo not influence the neural network models due to the fact that some interviews arelonger than others.
The shortest interview clip spectrogram is chosen and the maximum number of 4-second crops is established. The same number of crops is then sampled from all the otherparticipant interview spectrograms. This resulted in each sample being a spectrogrammatrix of 513 rows (frequency bins) and 125 columns (length of 4-seconds) which is thematrix representation of a 513X125 grayscale spectrogram. Finally, the training set isprepared by randomly selecting an equal number of samples (i.e. spectrograms) fromboth classes, depressed and non-depressed.
3.5 Exclusion of Shorter Interviews
During the experimentation with the three models, Base-CNN, AlexNet, and ResNet-18,it was found that the models were showing poor performance, presumably due to theshort training set of 3192 samples. The ResNet-18 architecture obtaining an F1-score of62%.
This led to increasing the number of spectrogram samples taken from each participant.This was achieved by dropping a percentage of the shortest interviews of both depressedand non-depressed participants to increase the size of the shortest interview. First, 15% ofthe interviews were dropped, followed by random undersampling, to increase the sampleset to 5056 samples. Later, 20% of the interviews were also dropped which increased thesample set to 5520 samples. This set is used as the final dataset to test the models inthis paper. The exclusion of shorter interviews, along with the k-fold cross-validationimplemented later, is the reason for the increase in the performance of the 3 models.
Excluded Interviews No. of SamplesNone 319210% of shortest interviews 505620% of shortest interviews 5520
Table 2: Spectrogram sample set sizes after excluding shortest interviews.
It should be pointed out that common image data augmentation techniques such asimage flipping, shifting, rotation, and zoom would not benefit model performance as aspectrogram is structurally different from object-based images. This means that there isno possibility that there will be a scenario where the model has been inputted a real-timespectrogram that is flipped horizontally or zoomed in.
10
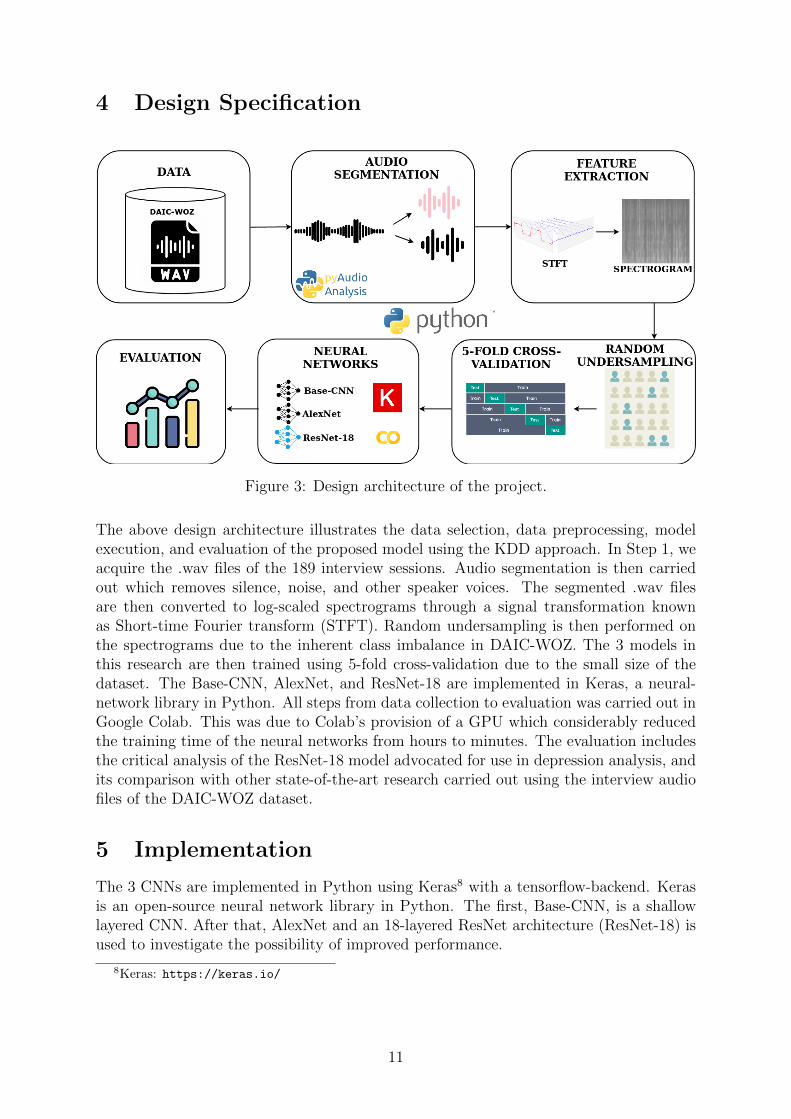
4 Design Specification
Figure 3: Design architecture of the project.
The above design architecture illustrates the data selection, data preprocessing, modelexecution, and evaluation of the proposed model using the KDD approach. In Step 1, weacquire the .wav files of the 189 interview sessions. Audio segmentation is then carriedout which removes silence, noise, and other speaker voices. The segmented .wav filesare then converted to log-scaled spectrograms through a signal transformation knownas Short-time Fourier transform (STFT). Random undersampling is then performed onthe spectrograms due to the inherent class imbalance in DAIC-WOZ. The 3 models inthis research are then trained using 5-fold cross-validation due to the small size of thedataset. The Base-CNN, AlexNet, and ResNet-18 are implemented in Keras, a neural-network library in Python. All steps from data collection to evaluation was carried out inGoogle Colab. This was due to Colab’s provision of a GPU which considerably reducedthe training time of the neural networks from hours to minutes. The evaluation includesthe critical analysis of the ResNet-18 model advocated for use in depression analysis, andits comparison with other state-of-the-art research carried out using the interview audiofiles of the DAIC-WOZ dataset.
5 Implementation
The 3 CNNs are implemented in Python using Keras8 with a tensorflow-backend. Kerasis an open-source neural network library in Python. The first, Base-CNN, is a shallowlayered CNN. After that, AlexNet and an 18-layered ResNet architecture (ResNet-18) isused to investigate the possibility of improved performance.
8Keras: https://keras.io/
11

5.1 Base-CNN
The 2D-CNN applied in this research is used as the base model with which the otherDCNNs, AlexNet and RestNet-18, will be compared with. It is inspired based on the pa-per titled ’Environmental Sound Classification with CNNs’ by Piczak (2015). The Base-CNN comprises of 2 (convolution + max-pooling) layers. The output is then flattenedand fed to 2 consecutive dense layers, each with 512 neurons. A dropout of 0.5 is addedto the output from the 2nd dense layer and is fed to the final output layer which classifiesthe spectrogram as depressed or not depressed. ReLU activation functions are used inthe convolution and dense layers except for the last dense layer which uses the sigmoidactivation function for binary classification. Binary cross-entropy is used to calculate theloss function for the Base-CNN, while the Adam optimizer with a learning rate of 0.001is used.
5.2 AlexNet
Figure 4: Architecture of AlexNet.
The AlexNet implemented in this research consists of 5 convolutional layers and 3 fullyconnected layers. Max-pooling is applied to the 1st, 2nd, and 5th convolution layers. Theoutput is then flattened as passed through 3 fully connected layers with a dropout of 0.4.The final output layer contains a sigmoid activation function for binary classification.
Batch Normalization is the the technique of normalizing the output of the activationlayer. While it is not usually applied in AlexNet, it was employed in all the layers of thismodel which increased performance. No padding has been used in any of the layers in thisimplementation of AlexNet. All convolutional and dense layers use the ReLU activationfunction while the output layer uses the sigmoid activation function.
The hyperparameters were tweaked and the final version of the model used a 64batch size, 20 epochs, and Adam optimizer with 0.001 learning rate. Due to the batchnormalization, AlexNet receives a lesser training accuracy and therefore suffers less fromoverfitting than ResNet-18.
12

5.3 ResNet-18
Figure 5: Architecture of ResNet-18 with ’skip connections’.
The ResNet, proposed by He et al. (2016a), was the first Deep-CNN (DCNN) neuralnetwork to efficiently tackle the problem of the ’vanishing gradient’. Due to the repeatedmultiplication of the gradient due to back-propagation, it starts to become extremelysmall and this leads to the CNN’s training loss increasing rapidly after a period of satur-ation. ResNets use the technique of ’skip connections’ or ’identity shortcut connections’.Later, bottleneck residual block (a slight variation of the basic residual block) was intro-duced by the same authors in He et al. (2016b). A skip connection (see. Figure 5) worksby taking the activation from one layer and feed it to another layer while ’skipping’ a fewlayers. This ensures that feature information normally lost or become abstract can stillinfluence the layers later in the network.
The ResNet-18 implemented in this research utilizes the basic residual block insteadof the bottleneck variant. Each residual block consists of two 3x3 colvolutional layers,where the input to the 1st layer is added to the output of the 2nd layer before the ReLUactivation takes place as implemented in He et al. (2016a). In total ResNet-18 consistsof 17 convolutional layers and one fully connected output layer.
The final version of ResNet-18 which provided the best performance based on theF1-score used a 64 batch size, 20 epochs, and an Adam optimizer with a 0.001 learningrate. Higher learning rate values resulted in a decrease in performance due to the modelbeing unable to find the global minima. The model takes an average of 3.5 minutes totrain for 20 epochs.
6 Evaluation
6.1 K-Fold Cross-Validation
Due to the inherent class imbalance in the DAIC-WOZ dataset, k-fold cross-validationwas employed with a k value of 5. This substantially improved the F1-score of ResNet-18by more than 9% from 0.75 to 0.83. This is due to the fact that the model is able to learnfrom sample sets of spectrograms that are better at discriminating between depressedand non-depressed participants. All 3 models were trained using this approach.
It is worth noting that 3-fold cross-validation was also carried out which providedpolarizing F1-scores across different folds. This indicates that the test set is too small for3-fold cross-validation due to its 2:1 ratio of training to test set. Hence, in certain folds,there is not enough helpful spectrogram samples to help train the model efficiently.
13

6.2 Base-CNN & AlexNet
Model Precision Recall F1-ScoreBase-CNN 0.64 0.66 0.65AlexNet 0.7 0.8 0.75
Table 3: Evaluation metrics of Base-CNN and AlexNet on DAIC-WOZ.
The Base-CNN that was implemented obtained an F1-score of 0.65. The inadequateperformance is to be expected as it was initially designed for detecting environmentalsounds (Piczak; 2015) which is structurally different from speech signals.
The AlexNet neural network obtained an F1-score of 0.75. While its performancemight not be as efficient as RestNet-18 (F1-score: 0.83), there is reason to believe thatshallow networks, subject to appropriate model parameter tweaking, can perform justas reasonably well. Note, that an F1-score of 0.75 means that AlexNet’s performance iscomparable and even marginally better than Yalamanchili et al. (2020) and Srimadhurand Lalitha (2020) in Table 1.
6.3 ResNet-18
The ResNet-18 model performs significantly better than Base-CNN and AlexNet. This isdue to the residual connections that help in amplifying features that would have otherwisebecome too abstract to be picked up on in the deeper layers. Its ’skip connections’ isthe reason for its improved performance, and is also the reason why it performs better tomost DCNNs which have more than 10 layers.
Model Precision Recall F1-ScoreResNet-18 0.76 0.92 0.83ResNet-34 0.7 0.88 0.78ResNet-50 0.73 0.85 0.79ResNet-101 0.71 0.82 0.76
Table 4: Evaluation metrics of ResNets on DAIC-WOZ.
Other ResNet architectures like ResNet-34, 50, and 101 were also implemented withpersonalised parameter tweaking. Despite the increase in the depth of the architectures,the other ResNets show a decrease in performance. This, coupled with the increasein training time for the deeper ResNets, make them impractical for use in real-timeapplications such as listening services and emergency helplines where continuous trainingon new data is required for the model to adapt and for its performance to not deteriorate.
Instead of the standard 4-second 513x125 spectrograms, 16-second crops of 513x513spectrograms were also created to explore the possibility of improved performance. How-ever, the performance of the 3 models did not show any improvement.
14

(a) Accuracy (b) ROC Curve
Figure 6: Accuracy and AUC of ResNet-18.
The accuracy plot (Figure 6a) of ResNet-18 shows that the model reaches 100% train-ing accuracy but only gets an 81% testing accuracy. This indicates a case of overfittingwhich must be addressed in future work. Certain techniques of introducing noise to thespectrograms can be carried out to investigate the possibility of improvement in perform-ance.
From the Receiver Operating Characteristic (ROC) curve (Figure 6b), we can see thatthe AUC (Area Under the ROC Curve) is 0.91. This is significantly higher than the AUCof 0.85 by Yalamanchili et al. (2020). The high ROC value indicates the model’s abilityto precisely distinguish between the depressed and non-depressed classes.
6.4 Discussion
In this section, the performance of the ResNet-18 model will be discussed and its im-plications analyzed. In this research, accuracy will not be used as the principal measureto evaluate the performance of ResNet-18. Precision and recall are far better and moreinterpretable9 metrics which indicate how good the model performs in predicting specificclasses in relation to others. F1-score, the balance between precision and recall, is thekey measure of performance which will be examined. The F1-score of 0.83 for ResNet-18 indicates that the model performs exceptionally better than all the state-of-the-artmodels discussed in the literature review, as seen in Table 5. It must be noted that ap-propriate hyperparameter tweaking, along with the usage of 5-fold cross-validation, andthe increase of the sample set by excluding short interviews has contributed greatly tothe high F1-score by ResNet-18.
The high precision of 0.76, which is only marginally lesser than 0.79 by Srimadhur andLalitha (2020), indicates the percentage of instances that the model correctly predicteda ’depressed’ participant out of all the ’depressed’ predictions it has made. That is, 76%of the depressed predictions were correct. The recall of 0.92 indicates the percentageof instances that the model correctly predicted a ’depressed’ participant out of all the’depressed’ participants in the entire test set. That is, 92% of the total depressed par-ticipants are predicted correctly. The high recall and comparable precision make them
9Medium: https://towardsdatascience.com/beyond-accuracy-precision-and-recall-
3da06bea9f6c
15

Table 5: Comparison of ResNet-18 with top-3 models in terms of F1-scores from Table 1.
Author Model Precision Recall F1-ScoreHaque et al. (2018)* C-CNN 0.71 0.83 0.77Srimadhur and Lalitha(2020)
End-to-end CNN 0.79 0.77 0.74
Yalamanchili et al. (2020) SVM 0.7 0.78 0.74ResNet-18 0.76 0.92 0.83
*Research utilizes audio, video, and linguistic sections of DAIC-WOZ for prediction.
powerful for use, for example in listening and emergency services. In this scenario, it iscrucial to diagnose correctly most of the people with actual depression (i.e. recall), butit would not hurt to have a slight increase in false positives (diagnosing non-depressedpeople as depressed) which only ensure that more care is taken.
The specificity (percentage of non-depressed people being correctly diagnosed as such)of ResNet-18 is 0.71 is much higher compared to 0.66 by Haque et al. (2018) whichalso used facial expressions of the participants from DAIC-WOZ. This method of usingonly spectrograms is non-invasive as no information of gender or age is preserved whichincreases its applicability in various domains that adhere to stringent regulations of dataprivacy (e.g. GDPR in Europe).
While the results may seem encouraging, there are some drawbacks of this research,and the data itself, that must be examined in future research. The ResNet-18’s hightraining accuracy of 100% and relatively low testing accuracy of 81%, as seen in Figure 6a,indicates that the model is experiencing a serious case of overfitting. This could be due toimperfect preprocessing, for instance, where the voice of the interviewer or other speakersmay not get filtered by the audio segmentation performed. This could be remedied byexcluding the first few seconds of the clip to decrease the chances of the assistant’s voicefrom seeping into the segmented audio clip.
Another drawback in this research, and more generally with depression detection usingonly speech, is that people with Major Depressive Disorder (MDD) might sometimes bein a happy mood and their voice might not show signs of depression. This could be thecase with the participants in the DAIC-WOZ dataset. It would be interesting to seehow this model fairs on those people in their daily life. But then again, the very aimof the application of neural networks, in this research field of depression detection fromspeech, is to identify those with depression who healthcare professionals, psychiatrists,and counsellors find hard to diagnose. Or at its worst, this model could serve as anindication for the necessity to seek professional help.
7 Conclusion and Future Work
This paper proposed the use of residual networks in detecting if a person is depressed ornot using spectrograms of the audio files of interviews. Preprocessing techniques, whichincluded audio segmentation through to increasing sample set sizes, that were employedwere a major contribution to the ResNet-18’s superior performance. The Base-CNN, andAlexNet achieved an F1-score of 0.65 and 0.75 respectively which proved to be unsatisfact-ory. The ResNet-18 model, implemented among other ResNet architectures, provided the
16

best F1-score of 0.83 (see Table 5). With the considerable improvement in performanceof ResNet-18 over the existing state-of-the-art models implemented in current research,we can conclude that the research objective has been met and its effectiveness thoroughlyevaluated.
This research is to be aimed to be of use in listening services (e.g. NiteLine) andemergency services (e.g. 999 calls) where only the voice of the individual is available.Here, phone conversations can be used to aid in detecting people with depression. Thiscould help service operators provide the necessary care when dealing with depressedindividuals. Since the DAIC-WOZ participants use microphones, a much better qualityof speech is captured when compared to mobile phones. Hence, this could present somechallenges for the proposed model’s practical use in listening and emergency services.
The implications of ResNet-18’s high F1-score coupled with a high recall providespromise in the rise of the use of ResNets and residual type network architectures foruse in depression detection. While the use of residual networks has been explored inenvironmental sound classification using spectrograms, these environmental sounds areinherently different from speech spectrograms as it is more complex to find patterns inspeech signal spectrograms. All the more difficult it is to predict illnesses such as MDDwhich contain a plethora of nuanced discriminative features. Considering the difficulty inpredicting depression from speech alone, the superior performance of the ResNet-18, inrelation to the current literature, reinforces the claim for residual networks in depressiondetection.
There are still many areas in which this research can be improved. This sectionaims to shed light on those potential areas in which the future work of this researchcould be carried out. There has been promising research using Generative AdversarialNetworks (GAN) for feature augmentation (Yang et al.; 2020)(Esmaeilpour et al.; 2019),and depression severity prediction (Wang et al.; 2020) of audio spectrograms from DAIC-WOZ. ResNets’ encouraging potential with transfer learning (Du et al.; 2018) could alsobe investigated. ResNet-18’s performance on more interpretable prosodic features, suchas MFCC and ZCR, could be investigated as it is difficult to interpret which spectrogramfeatures are most effective for the neural network. Curriculum learning (Hacohen andWeinshall; 2019), a sampling technique, could also be examined due to its increasedpopularity in training neural networks.
7.1 Acknowledgements
The author would like to sincerely thank Dr. Muhammad Iqbal, whose expert advice andguidance proved to be vital in the course of this research.
References
Boddapati, V., Petef, A., Rasmusson, J. and Lundberg, L. (2017). Classifying environ-mental sounds using image recognition networks, Procedia Computer Science 112: 2048– 2056. Knowledge-Based and Intelligent Information & Engineering Systems: Pro-ceedings of the 21st International Conference, KES-20176-8 September 2017, Marseille,France.URL: http://www.sciencedirect.com/science/article/pii/S1877050917316599
17

Chen, H., Yuan, X., Pei, Z., Li, M. and Li, J. (2019). Triple-classification of respiratorysounds using optimized s-transform and deep residual networks, IEEE Access 7: 32845–32852.
Chlasta, K., Wo lk, K. and Krejtz, I. (2019). Automated speech-based screening ofdepression using deep convolutional neural networks, Procedia Computer Science164: 618–628.URL: http://dx.doi.org/10.1016/j.procs.2019.12.228
Choi, W., Kim, M., Chung, J. and Jung, D. L. S. (2019). Investigating deepneural transformations for spectrogram-based musical source separation, arXiv pre-print arXiv:1912.02591 .
Cohen-McFarlane, M., Goubran, R. and Wallace, B. (2020). Challenges with audio clas-sification using image based approaches for health measurement applications, 2020IEEE International Symposium on Medical Measurements and Applications (MeMeA),pp. 1–5.
Cox, G., Egly, S., Harp, G. R., Richards, J., Vinodababu, S. and Voien, J. (2018).Classification of simulated radio signals using wide residual networks for use in thesearch for extra-terrestrial intelligence, arXiv preprint arXiv:1803.08624 .
Dinkel, H., Zhang, P., Wu, M. and Yu, K. (2019). Depa: Self-supervised audio embeddingfor depression detection, arXiv preprint arXiv:1910.13028 .
Du, H., He, Y. and Jin, T. (2018). Transfer learning for human activities classificationusing micro-doppler spectrograms, 2018 IEEE International Conference on Computa-tional Electromagnetics (ICCEM), pp. 1–3.
Esmaeili, N., Rabbani, H., Makaremi, S., Golabbakhsh, M., Saghaei, M., Parviz, M.and Naghibi, K. (2018). Tracheal sound analysis for automatic detection of respiratorydepression in adult patients during cataract surgery under sedation, Journal of MedicalSignals & Sensors 8: 140.
Esmaeilpour, M., Cardinal, P. and Koerich, A. L. (2019). Unsupervised feature learn-ing for environmental sound classification using weighted cycle-consistent generativeadversarial network, arXiv preprint arXiv:1904.04221 .
Fayyad, U., Piatetsky-Shapiro, G. and Smyth, P. (1996). From data mining to knowledgediscovery in databases, AI magazine 17(3): 37–37.
Guzhov, A., Raue, F., Hees, J. and Dengel, A. (2020). Esresnet: Environmental soundclassification based on visual domain models, arXiv preprint arXiv:2004.07301 .
Hacohen, G. and Weinshall, D. (2019). On the power of curriculum learning in trainingdeep networks, arXiv preprint arXiv:1904.03626 .
Haque, A., Guo, M., Miner, A. S. and Fei-Fei, L. (2018). Measuring depressionsymptom severity from spoken language and 3d facial expressions, arXiv preprintarXiv:1811.08592 .
18

He, K., Zhang, X., Ren, S. and Sun, J. (2016a). Deep residual learning for image recog-nition, Proceedings of the IEEE conference on computer vision and pattern recognition,pp. 770–778.
He, K., Zhang, X., Ren, S. and Sun, J. (2016b). Identity mappings in deep residualnetworks, European conference on computer vision, Springer, pp. 630–645.
Huang, Z., Epps, J., Joachim, D. and Sethu, V. (2020). Natural language processingmethods for acoustic and landmark event-based features in speech-based depressiondetection, IEEE Journal of Selected Topics in Signal Processing 14(2): 435–448.
Jayalakshmy, S. and Sudha, G. F. (2020). Scalogram based prediction model for respir-atory disorders using optimized convolutional neural networks, Artificial Intelligencein Medicine 103: 101809.URL: http://www.sciencedirect.com/science/article/pii/S0933365719304981
Krizhevsky, A., Sutskever, I. and Hinton, G. E. (2012). Imagenet classification withdeep convolutional neural networks, Advances in neural information processing systems,pp. 1097–1105.
Le, L., Kabir, A. N. M. H., Ji, C., Basodi, S. and Pan, Y. (2019). Using transfer learning,svm, and ensemble classification to classify baby cries based on their spectrogram im-ages, 2019 IEEE 16th International Conference on Mobile Ad Hoc and Sensor SystemsWorkshops (MASSW), pp. 106–110.
Lopez-Otero, P. and Docio-Fernandez, L. (2020). Analysis of gender and identity issues indepression detection on de-identified speech, Computer Speech & Language 65: 101118.URL: http://www.sciencedirect.com/science/article/pii/S0885230820300516
Ma, X., Yang, H., Chen, Q., Huang, D. and Wang, Y. (2016). Depaudionet: An ef-ficient deep model for audio based depression classification, Proceedings of the 6thInternational Workshop on Audio/Visual Emotion Challenge, AVEC ’16, Associationfor Computing Machinery, New York, NY, USA, p. 35–42.URL: https://doi.org/10.1145/2988257.2988267
Mousavian, M., Chen, J. and Greening, S. (2019). Depression detection using feature ex-traction and deep learning from smri images, 2019 18th IEEE International ConferenceOn Machine Learning And Applications (ICMLA), pp. 1731–1736.
M.P., A., Chander, S., Krishna, B., S.B., A. and Roy, R. (2019). Diagnosing clinicaldepression from voice: Using signal processing and neural network algorithms to builda mental wellness monitor, 2019 International Conference on Advances in Computing,Communication and Control (ICAC3), pp. 1–6.
Piczak, K. J. (2015). Environmental sound classification with convolutional neural net-works, 2015 IEEE 25th International Workshop on Machine Learning for Signal Pro-cessing (MLSP), IEEE, pp. 1–6.
Simonyan, K. and Zisserman, A. (2014). Very deep convolutional networks for large-scaleimage recognition, arXiv preprint arXiv:1409.1556 .
19

Singh, S. A., Majumder, S. and Mishra, M. (2019). Classification of short unsegmentedheart sound based on deep learning, 2019 IEEE International Instrumentation andMeasurement Technology Conference (I2MTC), pp. 1–6.
Srimadhur, N. and Lalitha, S. (2020). An end-to-end model for detection and assessmentof depression levels using speech, Procedia Computer Science 171: 12 – 21. ThirdInternational Conference on Computing and Network Communications (CoCoNet’19).URL: http://www.sciencedirect.com/science/article/pii/S1877050920309662
Valstar, M., Gratch, J., Schuller, B., Ringeval, F., Lalanne, D., Torres Torres, M., Scherer,S., Stratou, G., Cowie, R. and Pantic, M. (2016). Avec 2016: Depression, mood,and emotion recognition workshop and challenge, Proceedings of the 6th internationalworkshop on audio/visual emotion challenge, pp. 3–10.
Vazquez-Romero, A. and Gallardo-Antolın, A. (2020). Automatic detection of depressionin speech using ensemble convolutional neural networks, Entropy 22(6): 688.
Wang, Z., Chen, L., Wang, L. and Diao, G. (2020). Recognition of audio depression basedon convolutional neural network and generative antagonism network model, IEEE Ac-cess 8: 101181–101191.
Yalamanchili, B., Kota, N. S., Abbaraju, M. S., Nadella, V. S. S. and Alluri, S. V. (2020).Real-time acoustic based depression detection using machine learning techniques, 2020International Conference on Emerging Trends in Information Technology and Engin-eering (ic-ETITE), pp. 1–6.
Yang, L., Jiang, D. and Sahli, H. (2020). Feature augmenting networks for improvingdepression severity estimation from speech signals, IEEE Access 8: 24033–24045.
Zhang, B., Zhou, W., Cai, H., Su, Y., Wang, J., Zhang, Z. and Lei, T. (2020). Ubiquitousdepression detection of sleep physiological data by using combination learning andfunctional networks, IEEE Access 8: 94220–94235.
Zhao, Z., Bao, Z., Zhang, Z., Deng, J., Cummins, N., Wang, H., Tao, J. and Schuller, B.(2020). Automatic assessment of depression from speech via a hierarchical attentiontransfer network and attention autoencoders, IEEE Journal of Selected Topics in SignalProcessing 14(2): 423–434.
Zhu, J., Wang, Z., Gong, T., Zeng, S., Li, X., Hu, B., Li, J., Sun, S. and Zhang, L. (2020).An improved classification model for depression detection using eeg and eye trackingdata, IEEE Transactions on NanoBioscience 19(3): 527–537.
20


![Detecting Carbon Monoxide Poisoning Detecting Carbon ...2].pdf · Detecting Carbon Monoxide Poisoning Detecting Carbon Monoxide Poisoning. ... the patient’s SpO2 when he noticed](https://img.pdfslide.us/doc/110x75/5a78e09b7f8b9a21538eab58/detecting-carbon-monoxide-poisoning-detecting-carbon-2pdfdetecting-carbon.jpg)
![Lempel-Ziv complexity of the EEG predicts long-term ... · in detecting abnormal brain function in epilepsy [13], Alzheimer’s disease [14–17], depression, schizophrenia [18,19]](https://img.pdfslide.us/doc/110x75/5d3d9baa88c9939f158c77bb/lempel-ziv-complexity-of-the-eeg-predicts-long-term-in-detecting-abnormal.jpg)


![Detecting Carbon Monoxide Poisoning Detecting Carbon ...2].pdf · Detecting Carbon Monoxide Poisoning Detecting Carbon Monoxide Poisoning. Detecting Carbon Monoxide Poisoning C arbon](https://img.pdfslide.us/doc/110x75/5f551747b859172cd56bb119/detecting-carbon-monoxide-poisoning-detecting-carbon-2pdf-detecting-carbon.jpg)