Embed Size (px)
Citation preview
978-1-4244-4799-2/09/$25.00 ©2009 IE4/29/10EE
Abstract
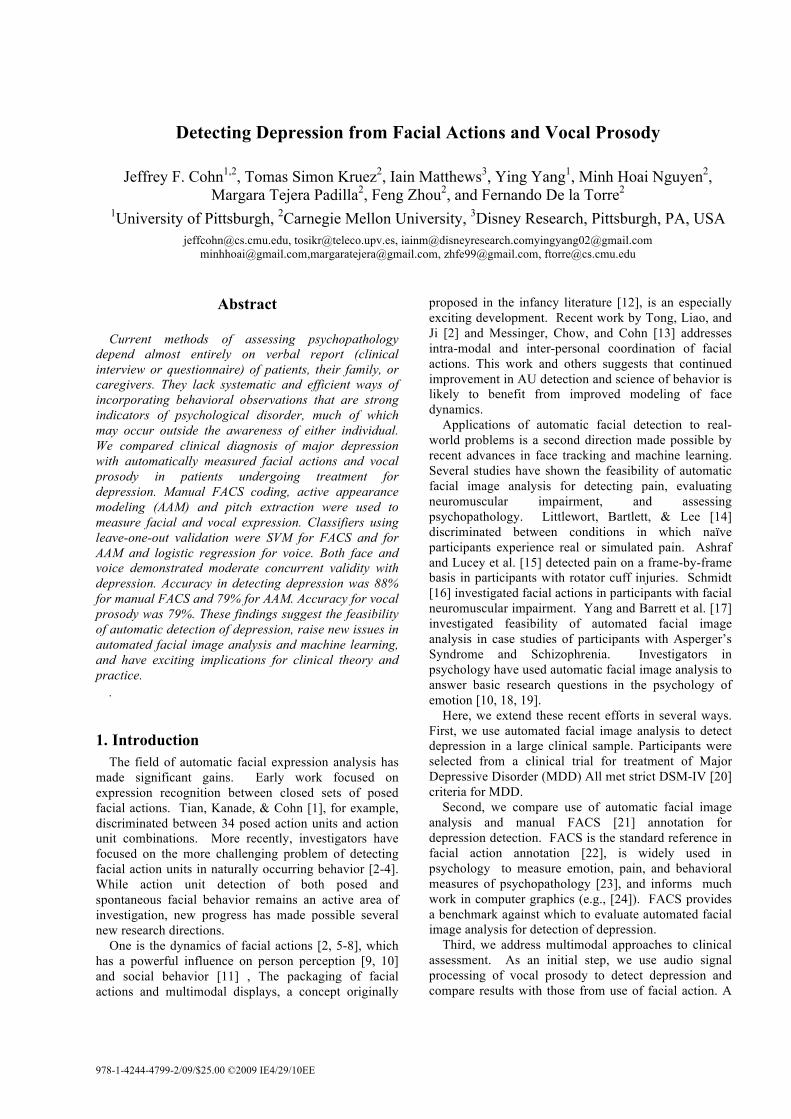
Current methods of assessing psychopathology depend almost entirely on verbal report (clinical interview or questionnaire) of patients, their family, or caregivers. They lack systematic and efficient ways of incorporating behavioral observations that are strong indicators of psychological disorder, much of which may occur outside the awareness of either individual. We compared clinical diagnosis of major depression with automatically measured facial actions and vocal prosody in patients undergoing treatment for depression. Manual FACS coding, active appearance modeling (AAM) and pitch extraction were used to measure facial and vocal expression. Classifiers using leave-one-out validation were SVM for FACS and for AAM and logistic regression for voice. Both face and voice demonstrated moderate concurrent validity with depression. Accuracy in detecting depression was 88% for manual FACS and 79% for AAM. Accuracy for vocal prosody was 79%. These findings suggest the feasibility of automatic detection of depression, raise new issues in automated facial image analysis and machine learning, and have exciting implications for clinical theory and practice.
.
1. Introduction The field of automatic facial expression analysis has
made significant gains. Early work focused on expression recognition between closed sets of posed facial actions. Tian, Kanade, & Cohn [1], for example, discriminated between 34 posed action units and action unit combinations. More recently, investigators have focused on the more challenging problem of detecting facial action units in naturally occurring behavior [2-4]. While action unit detection of both posed and spontaneous facial behavior remains an active area of investigation, new progress has made possible several new research directions.
One is the dynamics of facial actions [2, 5-8], which has a powerful influence on person perception [9, 10] and social behavior [11] , The packaging of facial actions and multimodal displays, a concept originally
proposed in the infancy literature [12], is an especially exciting development. Recent work by Tong, Liao, and Ji [2] and Messinger, Chow, and Cohn [13] addresses intra-modal and inter-personal coordination of facial actions. This work and others suggests that continued improvement in AU detection and science of behavior is likely to benefit from improved modeling of face dynamics.
Applications of automatic facial detection to real-world problems is a second direction made possible by recent advances in face tracking and machine learning. Several studies have shown the feasibility of automatic facial image analysis for detecting pain, evaluating neuromuscular impairment, and assessing psychopathology. Littlewort, Bartlett, & Lee [14] discriminated between conditions in which naïve participants experience real or simulated pain. Ashraf and Lucey et al. [15] detected pain on a frame-by-frame basis in participants with rotator cuff injuries. Schmidt [16] investigated facial actions in participants with facial neuromuscular impairment. Yang and Barrett et al. [17] investigated feasibility of automated facial image analysis in case studies of participants with Asperger’s Syndrome and Schizophrenia. Investigators in psychology have used automatic facial image analysis to answer basic research questions in the psychology of emotion [10, 18, 19].
Here, we extend these recent efforts in several ways. First, we use automated facial image analysis to detect depression in a large clinical sample. Participants were selected from a clinical trial for treatment of Major Depressive Disorder (MDD) All met strict DSM-IV [20] criteria for MDD.
Second, we compare use of automatic facial image analysis and manual FACS [21] annotation for depression detection. FACS is the standard reference in facial action annotation [22], is widely used in psychology to measure emotion, pain, and behavioral measures of psychopathology [23], and informs much work in computer graphics (e.g., [24]). FACS provides a benchmark against which to evaluate automated facial image analysis for detection of depression.
Third, we address multimodal approaches to clinical assessment. As an initial step, we use audio signal processing of vocal prosody to detect depression and compare results with those from use of facial action. A
Detecting Depression from Facial Actions and Vocal Prosody
Jeffrey F. Cohn1,2, Tomas Simon Kruez2, Iain Matthews3, Ying Yang1, Minh Hoai Nguyen2,
Margara Tejera Padilla2, Feng Zhou2, and Fernando De la Torre2
1University of Pittsburgh, 2Carnegie Mellon University, 3Disney Research, Pittsburgh, PA, USA [email protected], [email protected], [email protected]@gmail.com
[email protected],[email protected], [email protected], [email protected]
next step will be multimodal fusion of face and voice for more powerful depression detection.
Fourth, the current study is the first to address change in symptom severity in a clinical sample using automated facial image analysis and machine learning. Participants all met criteria for depression (Major Depressive Disorder) at time of initial interview. Over the course of treatment, many improved, some did not. We detect status at each interview point. In this initial report, we compare interviews in which participants are depressed and not depressed.
Further, to best of our knowledge, this is the largest study to date in which automated facial image analysis has been applied to a real-world problem. Over 50 participants were evaluated over the course of multiple psychiatric interviews over periods of up to five months. Each interview was on average 10 minutes long. We found that automatic facial image analysis and audio signal processing of vocal prosody effectively detected depression and recovery from depression in a clinical sample.
2. Methods Participants were from a clinical trial for treatment of depression. Facial actions were measured using both manual FACS [21] annotation (Exp. 1) and automated facial image analysis using active appearance modeling (AAM) [25] (Exp.2). FACS annotation is arguably the current standard for measuring facial actions [26]. For both FACS and AAM, classification was done using Support Vector Machines (SVMs). Vocal analysis was by audio signal processing with a logistic regression classifier (Exp. 3). Here we describe participants and methods in more detail.
2.1. Participants and image data 2.1.1 Participants
Participants (n = 57, 20 men and 37 women, 19% non-Caucasian) were from a clinical trial for treatment of depression. At the time of study intake, all met DSM-IV [20] criteria by clinical interview [27] for Major Depressive Disorder (MDD). Depression is a recurrent disorder, and most of the participants had multiple prior episodes. In the clinical trial, participants were randomized to either anti-depressant (a selective serotonin reuptake inhibitor; i.e. SSRI) or Interpersonal Psychotherapy (IPT). Both treatments are empirically validated for use with depression [28].
Over the course of treatment, symptom severity was evaluated on up to four occasions at approximately 7-week intervals by a clinical interviewer. Exceptions (n= 33) occurred due to missed appointments, technical error, attrition, or hospitalization. Interviews were conducted using the Hamilton Rating Scale for Depression (HRS-D) [29], which is a criterion measure for assessing severity of depression. Interviewers trained to criterion prior to the study and reliability was
maintained at above 0.90. HRS-D scores of 15 or higher are generally considered to indicate depression; scores of 7 or lower are generally thought to indicate absence thereof. The average duration of the interviews was approximately 10 minutes.
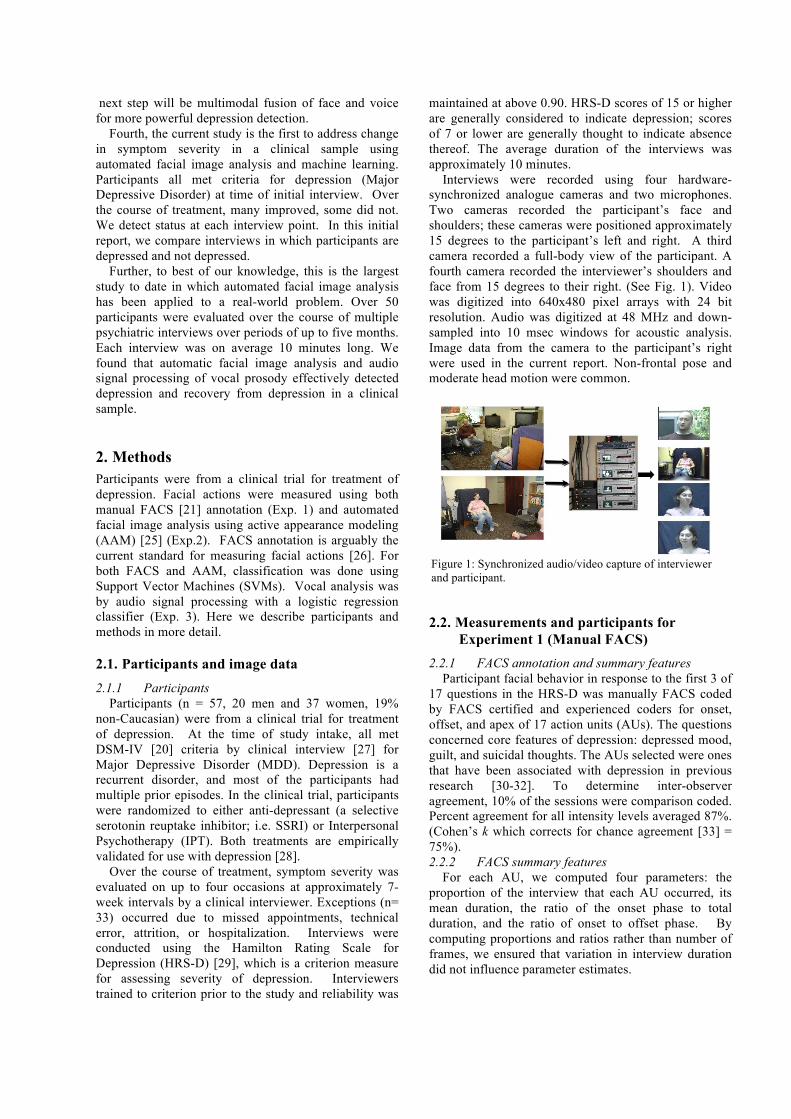
Interviews were recorded using four hardware-synchronized analogue cameras and two microphones. Two cameras recorded the participant’s face and shoulders; these cameras were positioned approximately 15 degrees to the participant’s left and right. A third camera recorded a full-body view of the participant. A fourth camera recorded the interviewer’s shoulders and face from 15 degrees to their right. (See Fig. 1). Video was digitized into 640x480 pixel arrays with 24 bit resolution. Audio was digitized at 48 MHz and down-sampled into 10 msec windows for acoustic analysis. Image data from the camera to the participant’s right were used in the current report. Non-frontal pose and moderate head motion were common.
Figure 1: Synchronized audio/video capture of interviewer and participant.
2.2. Measurements and participants for Experiment 1 (Manual FACS)
2.2.1 FACS annotation and summary features Participant facial behavior in response to the first 3 of
17 questions in the HRS-D was manually FACS coded by FACS certified and experienced coders for onset, offset, and apex of 17 action units (AUs). The questions concerned core features of depression: depressed mood, guilt, and suicidal thoughts. The AUs selected were ones that have been associated with depression in previous research [30-32]. To determine inter-observer agreement, 10% of the sessions were comparison coded. Percent agreement for all intensity levels averaged 87%. (Cohen’s k which corrects for chance agreement [33] = 75%). 2.2.2 FACS summary features
For each AU, we computed four parameters: the proportion of the interview that each AU occurred, its mean duration, the ratio of the onset phase to total duration, and the ratio of onset to offset phase. By computing proportions and ratios rather than number of frames, we ensured that variation in interview duration did not influence parameter estimates.
2.2.3 Session selection To maximize experimental variance and minimize
error variance [34], FACS-labeled interviews with HRS-D scores in the “depressed” (total score ≥15) and “non-depressed” (total score ≤7) range were selected for analysis. Twenty-four interviews (15 depressed and 9 non-depressed) from 15 participants met these criteria
2.3. Measurements and participants for Experiment 2 (AAM)
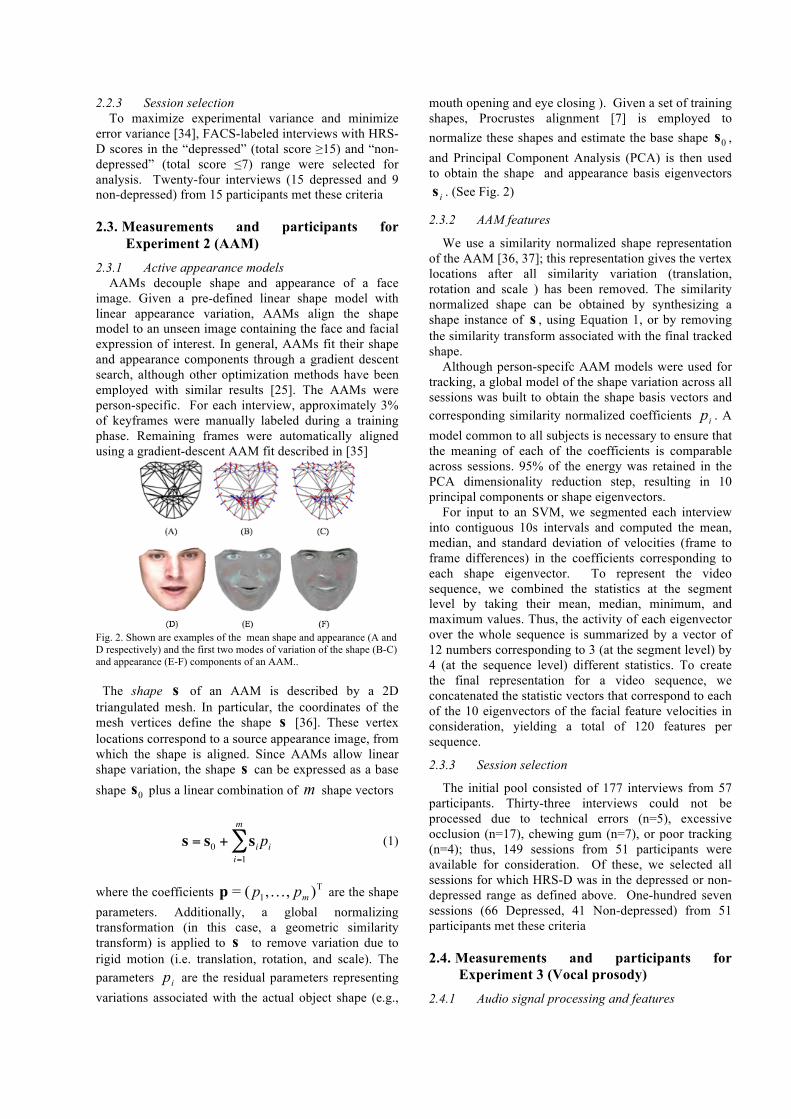
2.3.1 Active appearance models AAMs decouple shape and appearance of a face
image. Given a pre-defined linear shape model with linear appearance variation, AAMs align the shape model to an unseen image containing the face and facial expression of interest. In general, AAMs fit their shape and appearance components through a gradient descent search, although other optimization methods have been employed with similar results [25]. The AAMs were person-specific. For each interview, approximately 3% of keyframes were manually labeled during a training phase. Remaining frames were automatically aligned using a gradient-descent AAM fit described in [35]
Fig. 2. Shown are examples of the mean shape and appearance (A and D respectively) and the first two modes of variation of the shape (B-C) and appearance (E-F) components of an AAM.. The shape of an AAM is described by a 2D triangulated mesh. In particular, the coordinates of the mesh vertices define the shape [36]. These vertex locations correspond to a source appearance image, from which the shape is aligned. Since AAMs allow linear shape variation, the shape can be expressed as a base shape plus a linear combination of shape vectors
€
s = s0 + si pii=1
m
∑
(1)
where the coefficients are the shape parameters. Additionally, a global normalizing transformation (in this case, a geometric similarity transform) is applied to to remove variation due to rigid motion (i.e. translation, rotation, and scale). The parameters are the residual parameters representing variations associated with the actual object shape (e.g.,
mouth opening and eye closing ). Given a set of training shapes, Procrustes alignment [7] is employed to normalize these shapes and estimate the base shape , and Principal Component Analysis (PCA) is then used to obtain the shape and appearance basis eigenvectors
. (See Fig. 2)
2.3.2 AAM features
We use a similarity normalized shape representation of the AAM [36, 37]; this representation gives the vertex locations after all similarity variation (translation, rotation and scale ) has been removed. The similarity normalized shape can be obtained by synthesizing a shape instance of , using Equation 1, or by removing the similarity transform associated with the final tracked shape.
Although person-specifc AAM models were used for tracking, a global model of the shape variation across all sessions was built to obtain the shape basis vectors and corresponding similarity normalized coefficients . A model common to all subjects is necessary to ensure that the meaning of each of the coefficients is comparable across sessions. 95% of the energy was retained in the PCA dimensionality reduction step, resulting in 10 principal components or shape eigenvectors. For input to an SVM, we segmented each interview into contiguous 10s intervals and computed the mean, median, and standard deviation of velocities (frame to frame differences) in the coefficients corresponding to each shape eigenvector. To represent the video sequence, we combined the statistics at the segment level by taking their mean, median, minimum, and maximum values. Thus, the activity of each eigenvector over the whole sequence is summarized by a vector of 12 numbers corresponding to 3 (at the segment level) by 4 (at the sequence level) different statistics. To create the final representation for a video sequence, we concatenated the statistic vectors that correspond to each of the 10 eigenvectors of the facial feature velocities in consideration, yielding a total of 120 features per sequence.
2.3.3 Session selection
The initial pool consisted of 177 interviews from 57 participants. Thirty-three interviews could not be processed due to technical errors (n=5), excessive occlusion (n=17), chewing gum (n=7), or poor tracking (n=4); thus, 149 sessions from 51 participants were available for consideration. Of these, we selected all sessions for which HRS-D was in the depressed or non-depressed range as defined above. One-hundred seven sessions (66 Depressed, 41 Non-depressed) from 51 participants met these criteria
2.4. Measurements and participants for Experiment 3 (Vocal prosody)
2.4.1 Audio signal processing and features
Using publically available software [38], two measures of vocal prosody were computed for participants’ responses to the first 3 questions of the HRS-D. The features were variability of vocal fundamental frequency and latency to respond to interviewer questions and utterances. The first 3 questions of the HRS-D concern core symptoms of depression: depressed mood, guilt feelings, and suicidal thoughts. Choice of vocal prosody measures was informed by previous literature [39, 40]. We hypothesized that depression would be associated with decreased variability of vocal fundamental frequency (Fo) and increased speaker-switch duration. That is, participants would speak in a flattened tone of voice and take longer to respond to interviewer questions and utterances. Vocal fundamental frequency was computed using narrow-band spectrograms from 75 to 1000 Hz at a sampling rate of 10 msec. Pause duration was measured using the same 10 msec sampling interval.
2.4.2 Session selection
Audio data was processed for 28 participants. Particants were classified as either “responders” (n=11) or “non-responders” (n=17) to treatment. There were equal numbers of men in each group (n=2). Fo variability was unrelated to participants’ sex. Treatment response was defined as a 50% or greater reduction in symptoms relative to their initial HRS-D at the second or third HRS-D evaluation (i.e., weeks 7 or 13 of treatment). Thus, the groupings differ somewhat from those used for face data. A participant with very high initial score could experience a 50% reduction and still meet criteria for depression. Efforts are ongoing to apply the same criteria as used for face analyses.
2.5. Classifiers Support Vector Machine (SVM) classifiers were used in Experiements 1 and 2 and a logistic regression classifier in Experiment 3. SVMs have proven useful in many pattern recognition tasks including face and facial action recognition. Because they are binary classifiers, they are well suited to the task of Depressed vs. Non-Depressed classification. SVMs attempt to find the hyper-plane that maximizes the margin between positive and negative observations for a specified class. A linear SVM classification decision is made for an unlabeled test observation by,
(2)
where is the vector normal to the separating hyperplane and is the bias. Both and are estimated so that they minimize the structural risk of a train-set, to alleviate the problem of overfitting the training data. Typically, is not defined explicitly, but through a linear sum of support vectors. As a result
SVMs offer additional appeal as they allow for the employment of non-linear combination functions through the use of kernel functions, such as the radial basis function (RBF) or Gaussian kernel.
3. Experiment 1 (Manual FACS) In Experiment 1, we seek to discriminate Depressed
and Non-depressed interviews using manual FACS coding. As noted above in Section 2.1.2, depressed was defined as HRS-D score ≥ 15, and non-depressed as HRS-D score ≤ 7. We focused on those AU implicated in depression by previous research [32, 41]. For each AU, four features were computed (Section 2.2.2), which yielded 24 = 16 possible combinations. These were input to an SVM using leave-one-out cross-validation. Final classifications were for best features. Accuracy was defined as the number of true positives plus true negatives divided by N.
Using all AU, the classifier achieved 79% accuracy. Accuracies for several AUs exceeded this rate. In particular, AU 14 (caused by contraction of the buccinator muscle, which tightens the lip corners) was the most accurate in detecting depression. True positive and true negative rates were 87% and 89%, respectively (See Table 1).
Table 1
DEPRESSION DETECTDION FROM AU 14 Predicted HRS-D Depressed Not Depressed Depressed 87% 13% Not Depressed 11% 89% Likelihood ratio Χ2 = 14.54, p < .01, accuracy = 88%.
4. Experiment 2 (AAM) In Experiment 2, we use AAM features as described in Section 2.3.2 to discriminate between Depressed and Non-depressed interviews. Once the feature vectors for all video sequences were computed, a Support Vector Machine (SVM) classifier with a Gaussian kernel was evaluated. In our implementation, SVM is optimized using LibSVM [42]
Table 2
DEPRESSION DETECTION FROM AAM SHAPE COEFFICIENTS FEATURES
Predicted HRS-D Depressed Not Depressed Depressed 86% 14% Not Depressed 34% 66% Likelihood ratio Χ2 = 31.45, p < .01, accuracy = 79%.
. We use leave-one-subject-out cross-validation to estimate performance. All sequences belonging to one subject are used as testing data in each cross-validation round, using the remaining sequences as training data. This cross-validation was repeated for all subjects (K = 51). All hyper-parameters were tuned using cross-validation on the training data.
Using a window of 300 frames in which to aggregate summary measures, the SVM realized true positive and
negative rates of 86% and 66%, respectively. Area under the ROC was 0.79 (See Fig. 3).
Fig. 3. ROC curve for shape coefficients. Area under the curve = 0.79
5. Experiment 3 (Vocal prosody) Measures of vocal prosody (Fo and participant
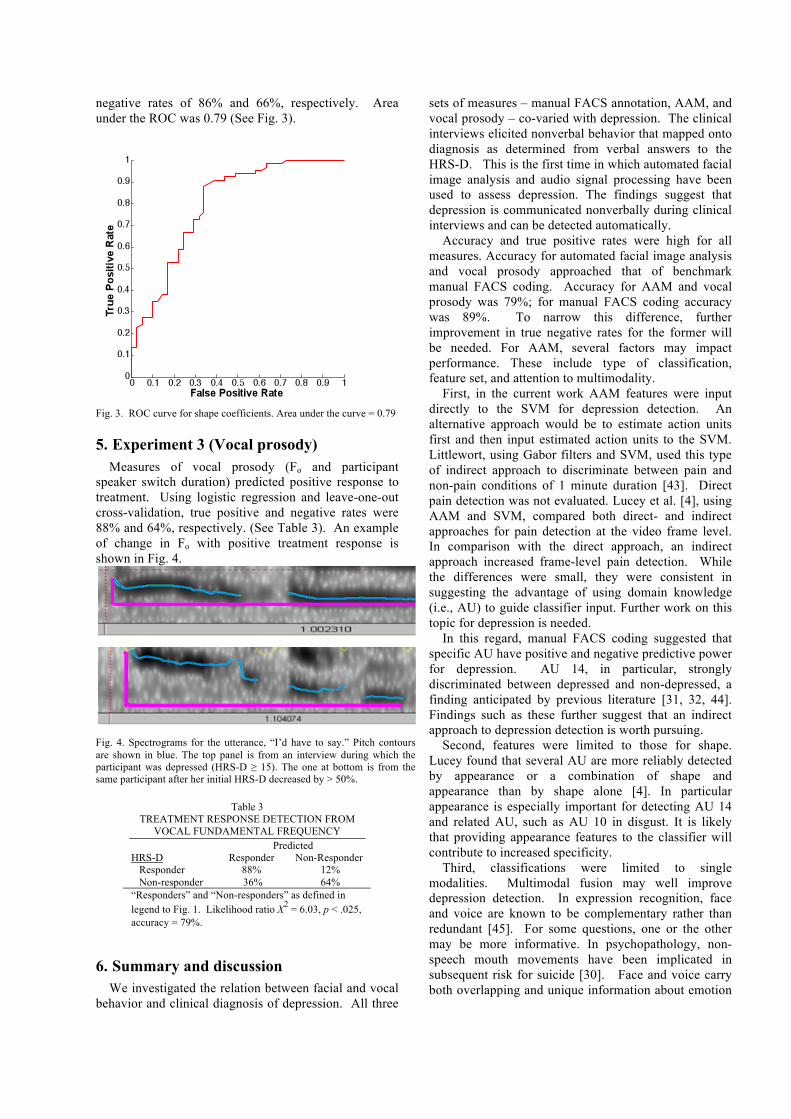
speaker switch duration) predicted positive response to treatment. Using logistic regression and leave-one-out cross-validation, true positive and negative rates were 88% and 64%, respectively. (See Table 3). An example of change in Fo with positive treatment response is shown in Fig. 4.
Fig. 4. Spectrograms for the utterance, “I’d have to say.” Pitch contours are shown in blue. The top panel is from an interview during which the participant was depressed (HRS-D ≥ 15). The one at bottom is from the same participant after her initial HRS-D decreased by > 50%.
Table 3 TREATMENT RESPONSE DETECTION FROM
VOCAL FUNDAMENTAL FREQUENCY Predicted HRS-D Responder Non-Responder Responder 88% 12% Non-responder 36% 64% “Responders” and “Non-responders” as defined in legend to Fig. 1. Likelihood ratio Χ2 = 6.03, p < .025, accuracy = 79%.
6. Summary and discussion We investigated the relation between facial and vocal
behavior and clinical diagnosis of depression. All three
sets of measures – manual FACS annotation, AAM, and vocal prosody – co-varied with depression. The clinical interviews elicited nonverbal behavior that mapped onto diagnosis as determined from verbal answers to the HRS-D. This is the first time in which automated facial image analysis and audio signal processing have been used to assess depression. The findings suggest that depression is communicated nonverbally during clinical interviews and can be detected automatically.
Accuracy and true positive rates were high for all measures. Accuracy for automated facial image analysis and vocal prosody approached that of benchmark manual FACS coding. Accuracy for AAM and vocal prosody was 79%; for manual FACS coding accuracy was 89%. To narrow this difference, further improvement in true negative rates for the former will be needed. For AAM, several factors may impact performance. These include type of classification, feature set, and attention to multimodality.
First, in the current work AAM features were input directly to the SVM for depression detection. An alternative approach would be to estimate action units first and then input estimated action units to the SVM. Littlewort, using Gabor filters and SVM, used this type of indirect approach to discriminate between pain and non-pain conditions of 1 minute duration [43]. Direct pain detection was not evaluated. Lucey et al. [4], using AAM and SVM, compared both direct- and indirect approaches for pain detection at the video frame level. In comparison with the direct approach, an indirect approach increased frame-level pain detection. While the differences were small, they were consistent in suggesting the advantage of using domain knowledge (i.e., AU) to guide classifier input. Further work on this topic for depression is needed.
In this regard, manual FACS coding suggested that specific AU have positive and negative predictive power for depression. AU 14, in particular, strongly discriminated between depressed and non-depressed, a finding anticipated by previous literature [31, 32, 44]. Findings such as these further suggest that an indirect approach to depression detection is worth pursuing.
Second, features were limited to those for shape. Lucey found that several AU are more reliably detected by appearance or a combination of shape and appearance than by shape alone [4]. In particular appearance is especially important for detecting AU 14 and related AU, such as AU 10 in disgust. It is likely that providing appearance features to the classifier will contribute to increased specificity.
Third, classifications were limited to single modalities. Multimodal fusion may well improve depression detection. In expression recognition, face and voice are known to be complementary rather than redundant [45]. For some questions, one or the other may be more informative. In psychopathology, non-speech mouth movements have been implicated in subsequent risk for suicide [30]. Face and voice carry both overlapping and unique information about emotion
and intention. By fusing these information sources, further improvement in depression detection may result.
The current findings strongly suggest that affective behavior can be measured automatically and can contribute to clinical evaluation. Current approaches to clinical interviewing lack the means to include behavioral measures. AAMs and audio signal processing address that limitation. The tools available for clinical practice and research have significantly expanded. While research challenges in automated facial image and analysis and vocal prosody remain, the time is near to apply these emerging tools to real-world problems in clinical science and practice. In a clinical trial with repeated interviews of over 50 participants, we found that clinically significant information could be found in automated measures of expressive behavior. A next step is to investigate their relation to symptom severity, type of treatment (e.g., medication versus psychotherapy) and other outcomes. In summary, current methods of assessing depression and psychopathology depend almost entirely on verbal report (clinical interview or questionnaire) of patients, their family, or caregivers. They lack systematic and efficient ways of incorporating behavioral observations that are strong indicators of psychological disorder, much of which may occur outside the awareness of either individual. In a large clinical sample, we found that facial and vocal expression revealed depression and non-depression consistent with DSM-IV criteria. A next step is to evaluate the relation between symptom severity as measured by interview self-report and facial and vocal behavior.
We raise three issues for current research. One is use of a two-step or indirect classifier, in which estimated AU rather than AAM features are used for classification. Second is use of appearance features from the AAM; appearance features were omitted in the work to date. Three is multimodal fusion of vocal prosody and video. This preliminary study suggests that nonverbal affective information maps onto diagnosis and reveals significant potential to contribute to clinical research and practice.
7. Acknowledgements This work was supported in part by U.S. National Institute of
Mental Health grants R01 MH 051435 to Jeffrey Cohn and R01 MH65376 to Ellen Frank. Zara Ambadar, Joan Buttenfield, Kate Jordan, Javier Montano, Manuel Quero, and Nicki Ridgeway provided technical assistance.
8. References 1 Tian, Y., Kanade, T., and Cohn, J.F.: ‘Recognizing action units for facial expression analysis’, IEEE Transactions on Pattern Analysis and Machine Intelligence, 2001, 23, (2), pp. 97-115 2 Tong, Y., Liao, W., and Ji, Q.: ‘Facial action unit recognition by exploiting their dynamic and semantic relationships’, IEEE Transactions on Pattern Analysis and Machine Intelligence, 2007, 29, (10), pp. 1683 - 1699. 3 Pantic, M., and Bartlett, M.S.: ‘Machine analysis of facial expressions’, in Delac, K., and Grgic, M. (Eds.): ‘Face
recognition’ (I-Tech Education and Publishing, 2007), pp. 377-416. 4 Lucey, P., Cohn, J.F., Lucey, S., Sridharan, S., and Prkachin, K.: ‘Automatically detecting action units from faces of pain: Comparing shape and appearance features’. Proc. 2nd IEEE Workshop on CVPR for Human Communicative Behavior Analysis (CVPR4HB), June 2009. 5 Schmidt, K.L., Ambadar, Z., Cohn, J.F., and Reed, L.I.: ‘Movement differences between deliberate and spontaneous facial expressions: Zygomaticus major action in smiling’, Journal of Nonverbal Behavior, 2006, 30, pp. 37-52 6 Valstar, M.F., Pantic, M., Ambadar, Z., and Cohn, J.F.: ‘Spontaneous vs. posed facial behavior: Automatic analysis of brow actions’. Proc. ACM International Conference on Multimodal Interfaces, Banff, Canada, November 2006. 7 De la Torre, F., Campoy, J., Ambadar, Z., and Cohn, J.F.: ‘Temporal segmentation of facial behavior’, IEEE International Conference on Computer Vision, 2007, pp. xxx-xxx 8 Reilly, J., Ghent, J., and McDonald, J.: ‘Investigating the dynamics of facial expression’, in Bebis, G., Boyle, R., Koracin, D., and Parvin, B. (Eds.): ‘Advances in visual computing. Lecture Notes in Computer Science’ (Springer 2006), pp. 334-343 9 Krumhuber, E., and Kappas, A.: ‘Moving smiles: The role of dynamic components for the perception of the genuineness of smiles’, Journal of Nonverbal Behavior, 2005, 29, pp. 3-24 10 Ambadar, Z., Cohn, J.F., and Reed, L.I.: ‘All smiles are not created equal: Morphology and timing of smiles perceived as amused, polite, and embarrassed/nervous’, Journal of Nonverbal Behavior, 2009, 33, pp. 17-34. 11 Cohn, J.F., Boker, S.M., Matthews, I., Theobald, B.-J., Spies, J., and Brick, T.: ‘Effects of damping facial expression in dyadic conversation using real-time facial expression tracking and synthesized avatars’, Philosophical Transactions B of the Royal Society, In press 12 Beebe, B., and Gerstman, L.J.: ‘The "packaging" of maternal stimulation in relation to infant facial-visual engagement: A case study at four months ’, Merrill-Palmer Quarterly of Behavior and Development, 1980, 26, (4), pp. 321-339. 13 Messinger, D.S., Chow, S.M., and Cohn, J.F.: ‘Automated measurement of smile dynamics in mother-infant interaction: A pilot study’, Infancy, Accepted with revisions. 14 Littlewort, G.C., Bartlett, M.S., and Lee, K.: ‘Automatic coding of facial expressions displayed during posed and genuine pain’, Image and Vision Computing, in press, 2009 15 Ashraf, A.B., Lucey, S., Cohn, J.F., Chen, T., Prkachin, K.M., Solomon, P., and Theobald, B.J.: ‘The painful face: Pain expression recognition using active appearance models’. Proc. Proceedings of the ACM International Conference on Multimodal Interfaces, 2007. 16 Schmidt, K.L., VanSwearingen, J.M., and Levenstein, R.M.: ‘Speed, amplitude, and asymmetry of lip movement in voluntary puckering and blowing expressions: Implications for facial assessment.’, Motor Control, 2007, 9, pp. 270-280. 17 Wang, P., Barrett, F., Martin, E., Milonova, M., Gurd, R.E., Gur, R.C., Kohler, C., and Verma, R.: ‘Automated video-based facial expression analysis of neuropsychiatric disorders’, Journal of Neuroscience Methods, 2008, 168, pp. 224–238. 18 Schmidt, K.L., Bhattacharya, S., and Denlinger, R.: ‘Comparison of deliberate and spontaneous facial movement in smiles and eyebrow raises’, Journal of Nonverbal Behavior, 2009, 33, pp. 35–45.
19 Schmidt, K.L., Lui, Y., and Cohn, J.F.: ‘The role of structural facial asymmetry in asymmetry of peak facial expressions’, Laterality, 2006, 11, (6), pp. 540-561. 20 American Psychiatric Association: ‘Diagnostic and statistical manual of mental disorders’ (American Psychiatric Association, 1994, Fourth edn. 1994). 21 Ekman, P., Friesen, W.V., and Hager, J.C.: ‘Facial action coding system’ (Research Nexus, Network Research Information, Salt Lake City, UT, 2002). 22 Cohn, J.F., and Ekman, P.: ‘Measuring facial action by manual coding, facial EMG, and automatic facial image analysis’, in Harrigan, J.A., Rosenthal, R., and Scherer, K. (Eds.): ‘Handbook of nonverbal behavior research methods in the affective sciences’ (Oxford, 2005), pp. 9-64. 23 Ekman, P., and Rosenberg, E.: ‘What the face reveals’ (Oxford, 2nd edn. 2005). 24 Moving Picture Experts Group: ‘Overview of the MPEG-4 standard’ (2002) 25 Cootes, T.F., Edwards, G., and Taylor, C.J.: ‘Active Appearance Models’, IEEE Transactions on Pattern Analysis and Machine Intelligence, 2001, 23, (6), pp. 681-685. 26 Cohn, J.F., Ambadar, Z., and Ekman, P.: ‘Observer-based measurement of facial expression with the Facial Action Coding System’, in Coan, J.A., and Allen, J.J.B. (Eds.): ‘The handbook of emotion elicitation and assessment. Oxford University Press Series in Affective Science’ (Oxford University, 2007), pp. 203-221. 27 First, M.B., Spitzer, R.L., Gibbon, M., and Williams, J.B.W.: ‘Structured clinical interview for DSM-IV axis I disorders’ (Biometrics Research Department, New York State Psychiatric Institute-Patient Edition, 1995, SCID-I/P, Version 2.0 edn. 1995). 28 Hollon, S.D., Thase, M.E., and Markowitz, J.C.: ‘Treatment and prevention of depression’, Psychological Science in the Public Interest, 2002, 3, (2), pp. 38-77. 29 Hamilton, M.: ‘A rating scale for depression’, Journal of Neurology and Neurosurgery, 1960, 23, pp. 56-61. 30 Heller, M., and Haynal-Reymond, V.: ‘Depression and suicide faces’, in Ekman, P., and Rosenberg, E. (Eds.): ‘What the face reveals’ (Oxford, 1997), pp. 398-407. 31 Ekman, P., Matsumoto, D., and Friesen, W.V.: ‘Facial expression in affective disorders’, in Ekman, P., and Rosenberg, E. (Eds.): ‘What the face reveals’ (Oxford, 2005, 2nd edn.), pp. 331-341. 32 Ellgring, H.: ‘Nonverbal communication in depression’ (Cambridge University,1999). 33 Fleiss, J.L.: ‘Statistical methods for rates and proportions’ (Wiley, 1981) 34 Kerlinger, F.N.: ‘Foundations of behavioral research: Educational, psychological and sociological inquiry ’ (Holt, Rinehart and Winston,1973).. 35 Matthews, I., and Baker, S.: ‘Active appearance models revisited’, International Journal of Computer Vision, 2004, 60, (2), pp. 135-164. 36 Ashraf, A.B., Lucey, S., Cohn, J.F., Chen, T., Prkachin, K.M., and Solomon, P.: ‘The painful face: Pain expression recognition using active appearance models’, Image and Vision Computing, In press. 37 Lucey, S., Matthews, I., Hu, C., Ambadar, Z., De la Torre, F., and Cohn, J.F.: ‘AAM derived face representations for robust facial action recognition’, Seventh IEEE International Conference on Automatic Face and Gesture Recognition, 2006, FG '06, pp. 155-160. 38 Boersma, P., and Weenink, D.: ‘Praat: Doing phonetics by computer’ (Undated)
39 Bettes, B.A.: ‘Maternal depression and motherese: Temporal and intonational features’, Child Development, 1988, 59, pp. 1089-1096. 40 Zlochower, A.J., and Cohn, J.F.: ‘Vocal timing in face-to-face interaction of clinically depressed and nondepressed mothers and their 4-month-old infants’, Infant Behavior and Development, 1996, 19, pp. 373-376. 41 Ekman, P., Matsumoto, D., and Friesen, W.V.: ‘Assessment of facial behavior in affective disorders’, in Maser, J.D. (Ed.): ‘Depression and expressive behavior’ (Lawrence Erlbaum Associates, 1987). 42 Chang, C.-C., and Lin, C.-J.: ‘LIBSVM: A library for support vector machines’ (2001). 43 Littlewort, G.C., Bartlett, M.S., and Lee, K.: ‘Faces of pain: Automated measurement of spontaneous facial expressions of genuine and posed pain’. Proc. International Conference on Multimodal Interfaces, Nagoya 2007. 44 Reed, L.I., Sayette, M.A., and Cohn, J.F.: ‘Impact of depression on response to comedy: A dynamic facial coding analysis’, Abnormal Psychology, 2007, 116, (4), pp. 804-809. 45 Scherer, K.R.: ‘Emotion’, in Hewstone, M., and Stroebe, W. (Eds.): ‘Introduction to Social Psychology: A European perspective’ (Blackwell, 2000, 3rd edn.), pp. 151-191.