Embed Size (px)
Citation preview
IT Licentiate theses2009-001
Detailed Simulation of HeterogeneousWireless Sensor Networks
JOAKIM ERIKSSON
UPPSALA UNIVERSITYDepartment of Information Technology

Detailed Simulation of HeterogeneousWireless Sensor Networks
BY
JOAKIM ERIKSSON
April 2009
DIVISION OF COMPUTERSYSTEMS
DEPARTMENT OFINFORMATION TECHNOLOGY
UPPSALA UNIVERSITY
UPPSALA
SWEDEN
Dissertation for the degree of Licentiate of Philosophy in Computer Scienceat Uppsala University 2009
Detailed Simulation of HeterogeneousWireless Sensor Networks
Joakim [email protected]
Division of Computer SystemsDepartment of Information Technology
Uppsala UniversityBox 337
SE-751 05 UppsalaSweden
http://www.it.uu.se/
c© Joakim Eriksson 2009ISSN 1404-5117
Printed by the Department of Information Technology, Uppsala University, Sweden
Abstract
Wireless sensor networks consist of many small nodes. Each node has amicroprocessor, a radio chip, some sensors, and is usually battery poweredwhich limits network lifetime. Applications of wireless sensor networks rangefrom environmental monitoring and health-care to industrial automationand military surveillance.
Since the nodes are battery powered and communication consumes morepower than computation much of the research focuses on power efficientcommunication. One of the problems is however to measure the powerconsumption and communication quality.
Simulation of sensor networks can greatly increase development speedand also be used for evaluating power consumption as well as communica-tion quality. For application and system development, simulators can beused to test code functionality and find software bugs. For research exper-iments, simulators can be used to get easier access to fine grained resultsthan corresponding real world experiments. One problem with simulators isthat it is hard to show that a simulation experiment corresponds well witha similar real world experiment.
This thesis studies how detailed simulation of wireless sensor networkscan be validated for power profiling accuracy and shows that detailed, emu-lation based simulation is a useful tool for white-box interoperability testing.Both power profiling and interoperability testing represent important topicsin today’s wireless sensor network research and development.
The results and main contributions of the thesis are the simulationplatform COOJA/MSPSim and that we show that three low-power MAC-protocol experiments performed in our simulator COOJA/MSPSim corre-spond well with experiments performed in our testbed. We also show thatusing COOJA/MSPSim any software running in the simulation can be powerprofiled, and that COOJA/MSPSim can be used for white-box interoper-ability testing.
i

ii

To Oliver, Viktor and Agneta
iii

iv
Acknowledgements
I would like to thank my advisor and colleague Thiemo Voigt for all inspira-tion and encouragement during the work with the thesis. I would also liketo thank my co-advisor Mats Bjorkman for good advices, and discussions.I am also very grateful to Per Gunningberg, co-advisor, inspiring teacher inmany university courses that I took, and the one who helped me get theopportunity to work at SICS.
Many thanks also go to my colleagues at SICS, including Adam Dunkels,Niclas Finne, Fredrik Osterlind - main developer of COOJA, Nicolas Tsiftes,Olle Olsson, Sverker Janson, Zhitao He, Daniel Gillblad, and many manymore.
I am grateful to the SAVE-IT industrial Ph.D. program at MdH in whichI have been an industrial Ph.D. student during the work with this thesis.Many thanks to ABB Corporate Research in Vasteras that have given me theopportunity to participate in industrial research and development projects.Many thanks to Tomas Lennvall, Lennart Balgard and Jonas Neander atABB Corporate Research in Vasteras for interesting discussions. I am alsograteful to the former ABB CRC employees Stefan Svensson, now at Acreo,and Martin Strand, now at ABB Power Systems. Thanks also go to Jan-Erik Frej and Mikael Gidlund, both ABB CRC, for interesting discussionsabout research directions, projects, and relations between Swedish industryand research organisations.
Finally, many thanks to my wife Agneta and my two sons Oliver andViktor for making life more fun and lively.
The work in this thesis is in part supported by VINNOVA, FMV, The CONET FP7
Network of Excellence, SAVE-IT/KKS, and the Uppsala VINN Excellence Center
for Wireless Sensor Networks (WISENET). The Swedish Institute of Computer
Science, SICS AB, is sponsored by TeliaSonera, Ericsson, Saab Systems, FMV,
Green Cargo, ABB and Bombardier Transportation.
v
Included Papers
This thesis is composed of the following papers. In the thesis the paperswill be referred to as papers A to C.
A Niclas Finne, Joakim Eriksson, Adam Dunkels and Thiemo Voigt. Ex-periences from two sensor network deployments: self-monitoring andself-configuration keys to success. Proceedings of Wired/Wireless In-ternet Communications: 6th International Conference, WWIC 2008.28-30 May 2008, Tampere, Finland.
B Joakim Eriksson, Fredrik Osterlind, Niclas Finne, Adam Dunkels,Thiemo Voigt and Nicolas Tsiftes. Accurate, network-scale power pro-filing for sensor network simulators. Proceedings of EWSN 2009, the6th European Conference on Wireless Sensor Networks. 11-13 Febru-ary 2009, Cork, Ireland.
C Joakim Eriksson, Fredrik Osterlind, Thiemo Voigt, Adam Dunkels,Niclas Finne, Nicolas Tsiftes, Robert Sauter and Pedro Jose Marron.COOJA/MSPSim: Interoperability Testing for Wireless Sensor Net-works. Proceedings of SIMUTools 2009, the 2nd International Con-ference on Simulation Tools and Techniques. 2-6 March 2009, Rome,Italy.
Papers reprinted with permission of the publishers:
Paper A: c©Springer-Verlag 2008Paper B: c©Springer-Verlag 2009Paper C: c©ICST 2009
vi
Selected Papers not Included in the Thesis
1 Fredrik Osterlind, Adam Dunkels, Thiemo Voigt, Nicolas Tsiftes, JoakimEriksson and Niclas Finne. Sensornet checkpointing: enabling re-peatability in testbeds and realism in simulations. Proceedings ofEWSN 2009, the 6th European Conference on Wireless Sensor Net-works. 11-13 February 2009, Cork, Ireland.
2 Joakim Eriksson, Fredrik Osterlind, Niclas Finne, Adam Dunkels,Thiemo Voigt. Accurate power profiling for sensor network simulators.8th Scandinavian Workshop on Wireless Ad-hoc and Sensor Networks.7-8 May 2008, Stockholm, Sweden.
3 Joakim Eriksson, Adam Dunkels, Niclas Finne, Fredrik Osterlind,Thiemo Voigt and Nicolas Tsiftes. Demo abstract: MSPsim - an ex-tensible simulator for MSP430-equipped sensor boards. EWSN 2008,5th European Conference on Wireless Sensor Networks. 30 Jan - 1 Feb2008, Bologna, Italy.
4 Fredrik Osterlind, Adam Dunkels, Joakim Eriksson, Niclas Finne andThiemo Voigt. Cross-level simulation in COOJA. European Confer-ence on Wireless Sensor Networks, EWSN 07. January 2007, Delft,The Netherlands.
5 Fredrik Osterlind, Erik Pramsten, Dainel Roberthson, Joakim Eriks-son, Niclas Finne and Thiemo Voigt. Integrating Building Automa-tion Systems and Wireless Sensor Networks. 12th IEEE Conferenceon Emerging Technologies and Factory Automation. 25-28 September2007, Patras, Greece.
6 Thiemo Voigt, Fredik Osterlind, Niclas Finne, Nicolas Tsiftes, ZhitaoHe, Joakim Eriksson, Adam Dunkels, Ulf Bamstedt, Jochen Schillerand Klas Hjort. Sensor Networking in Aquatic Environments - Expe-riences and New Challenges. Second IEEE International Workshop onPractical Issues in Building Sensor Network Applications. 15-18 Oct2007, Dublin, Ireland.
7 Adam Dunkels, Niclas Finne, Joakim Eriksson and Thiemo Voigt.Run-time dynamic linking for reprogramming wireless sensor networks.Proceedings of the Fourth ACM Conference on Embedded NetworkedSensor Systems, SenSys 2006. November 2006, Boulder, Colorado,USA.
vii

viii
Contents
I Thesis 1
1 Introduction 3
1.1 Wireless Sensor Networks . . . . . . . . . . . . . . . . . . . . 3
1.2 Wireless Sensor Network Simulators . . . . . . . . . . . . . . 4
1.2.1 Types of Sensor Network Simulators . . . . . . . . . . 5
1.3 The COOJA/MSPSim Simulator . . . . . . . . . . . . . . . . 7
1.3.1 The MSPSim Emulator . . . . . . . . . . . . . . . . . 7
1.3.2 The COOJA Network Simulator . . . . . . . . . . . . 7
2 Challenges and Research Questions 9
2.1 Power Profiling in Simulators . . . . . . . . . . . . . . . . . . 9
2.2 Level of Detail in Simulators . . . . . . . . . . . . . . . . . . 9
2.3 Interoperability Testing and Simulation of Heterogeneous Net-works . . . . . . . . . . . . . . . . . . . . . . . . . . . . . . . 10
2.4 Self-Configuration . . . . . . . . . . . . . . . . . . . . . . . . 10
2.5 Contributions and Results . . . . . . . . . . . . . . . . . . . . 11
3 Related Work 13
3.1 Generic Sensor Network Simulators . . . . . . . . . . . . . . . 13
3.2 Code Level Sensor Network Simulators . . . . . . . . . . . . . 14
3.3 Sensor Node Emulators . . . . . . . . . . . . . . . . . . . . . 15
4 Summary of the Papers 17
4.1 Paper A: Experiences from Two Sensor Network Deployments— Self-Monitoring and Self-Configuration Keys to Success . . 17
4.2 Paper B: Accurate Network-Scale Power Profiling for SensorNetwork Simulators . . . . . . . . . . . . . . . . . . . . . . . 18
4.3 Paper C: COOJA/MSPSim: Interoperability Testing for Wire-less Sensor Networks . . . . . . . . . . . . . . . . . . . . . . . 19
5 Conclusions and Future Work 21
ix
II Included papers 27
6 Experiences from Two Sensor Network Deployments — Self-Monitoring and Self-Configuration Keys to Success 29
6.1 Abstract . . . . . . . . . . . . . . . . . . . . . . . . . . . . . . 29
6.2 Introduction . . . . . . . . . . . . . . . . . . . . . . . . . . . . 30
6.3 Deployments . . . . . . . . . . . . . . . . . . . . . . . . . . . 31
6.3.1 First Deployment: Factory Complex . . . . . . . . . . 31
6.3.2 Second Deployment: Combined in-door and out-doorurban terrain . . . . . . . . . . . . . . . . . . . . . . . 33
6.4 Deployment Experiences . . . . . . . . . . . . . . . . . . . . . 34
6.5 A Self-Monitoring Architecture for Detecting Hardware andSoftware Problems . . . . . . . . . . . . . . . . . . . . . . . . 36
6.5.1 Hardware Self-Test . . . . . . . . . . . . . . . . . . . . 36
6.5.2 Software Self-Monitoring . . . . . . . . . . . . . . . . . 38
6.5.3 Self-Configuration . . . . . . . . . . . . . . . . . . . . 38
6.6 Evaluation . . . . . . . . . . . . . . . . . . . . . . . . . . . . . 38
6.6.1 Detection of Hardware Problems . . . . . . . . . . . . 38
6.6.2 Detection of Software and Configuration Problems . . 40
6.7 Related Work . . . . . . . . . . . . . . . . . . . . . . . . . . . 41
6.8 Conclusions . . . . . . . . . . . . . . . . . . . . . . . . . . . . 41
7 Accurate Network-Scale Power Profiling for Sensor NetworkSimulators 45
7.1 Introduction . . . . . . . . . . . . . . . . . . . . . . . . . . . . 46
7.2 Related Work . . . . . . . . . . . . . . . . . . . . . . . . . . . 47
7.3 Simulation-based Network-scale Power Profiling . . . . . . . . 48
7.3.1 Contiki Power Profiler . . . . . . . . . . . . . . . . . . 48
7.3.2 COOJA . . . . . . . . . . . . . . . . . . . . . . . . . . 48
7.3.3 MSPSim . . . . . . . . . . . . . . . . . . . . . . . . . . 48
7.3.4 A Network-Scale Power Profiler . . . . . . . . . . . . . 49
7.4 Evaluation . . . . . . . . . . . . . . . . . . . . . . . . . . . . . 50
7.4.1 Case Study: Data Collection with CoReDac . . . . . . 50
7.4.2 Case Study: Low Power Probing . . . . . . . . . . . . 53
7.4.3 Case Study: X-MAC . . . . . . . . . . . . . . . . . . . 56
7.4.4 Power Profiling Accuracy . . . . . . . . . . . . . . . . 57
7.5 Conclusions . . . . . . . . . . . . . . . . . . . . . . . . . . . . 59
8 COOJA/MSPSim: Interoperability Testing for Wireless Sen-sor Networks 65
8.1 Introduction . . . . . . . . . . . . . . . . . . . . . . . . . . . . 66
8.2 Background . . . . . . . . . . . . . . . . . . . . . . . . . . . . 67
8.2.1 The MSPSim Simulator . . . . . . . . . . . . . . . . . 68
8.2.2 The COOJA Simulator . . . . . . . . . . . . . . . . . 69
x
8.2.3 Contiki . . . . . . . . . . . . . . . . . . . . . . . . . . 708.2.4 TinyOS . . . . . . . . . . . . . . . . . . . . . . . . . . 70
8.3 Implementation . . . . . . . . . . . . . . . . . . . . . . . . . . 718.3.1 Simulating TinyOS nodes . . . . . . . . . . . . . . . . 718.3.2 Power Profiling of all nodes . . . . . . . . . . . . . . . 72
8.4 Evaluation . . . . . . . . . . . . . . . . . . . . . . . . . . . . . 728.4.1 Measuring Power Consumption . . . . . . . . . . . . . 728.4.2 Measuring Power Consumption with MSPSim . . . . . 738.4.3 A Heterogeneous, Hierarchical Sensor Network . . . . 748.4.4 Interoperability Tests . . . . . . . . . . . . . . . . . . 75
8.5 Related Work . . . . . . . . . . . . . . . . . . . . . . . . . . . 768.6 Conclusions . . . . . . . . . . . . . . . . . . . . . . . . . . . . 778.7 Acknowledgments . . . . . . . . . . . . . . . . . . . . . . . . . 78
xi


Part I
Thesis
1

Chapter 1
Introduction
1.1 Wireless Sensor Networks
Wireless sensor networks consist of small autonomous nodes. Each node hasa small microprocessor, a radio chip, some sensors, and is usually batterypowered which limits network lifetime. Applications of wireless sensor net-works range from environmental monitoring and health-care to industrialautomation and military surveillance.
To make sensor networks a technology that can be used in a large num-ber of application areas it is important that the network nodes are low-cost.Therefore, the network nodes are resource constrained and a typical micro-processor is limited to a few MHz in processing speed, has a few kbyte ofRAM and some tens of kbyte storage for programs. The radio chip typicallyhas a communication range of up to a few hundred meters outdoors and lessindoors, and a few hundred kbit/s of communication speed.
Since the nodes are resource constrained, common operating systems,communication stacks and development tools cannot be used. This has leadto the development of small operating systems specifically designed for re-source constrained networked embedded systems. The most well known op-erating systems are Contiki OS [6], TinyOS [14], Mantis OS [1] and SOS [11].They all have tools such as simulators, communication stacks, and are portedto several hardware platforms.
The combination of resource constraints and lack of mature develop-ment tools make programming wireless sensor network a challenge. Sensornetworks are typically expected to last several years, and since the sensornodes are battery powered, another challenge is to develop power efficientcommunication protocols and applications.
The focus of this thesis is to develop and study detailed wireless sensornetwork simulators and to investigate how they can be used in some appli-cation areas such as power profiling and interoperability testing. The thesisconsists of three published papers; one motivates the work and the other
3
two describe and evaluate the simulator.
1.2 Wireless Sensor Network Simulators
A simulator is a software tool that imitates selected parts of the behaviorof the real world and is normally used as a tool for research and develop-ment. Simulators exist for a wide variety of fields including physics, biology,economics, and computer systems. Depending on the intended usage of thesimulator, different parts of the real-world system are modeled and imitated.The parts that are modeled can also be of varying abstraction level. A wire-less sensor network simulator imitates the wireless network media - the air- and the nodes in the network. Some sensor network simulators have adetailed model of the wireless media including effects of obstacles betweennodes, while other simulators have a more abstract model. In this thesis thefocus is mainly on simulators that have detailed node models.
During development of applications, systems and protocols for sensornetworks, a large part of the time is spent compiling, testing, debugging andevaluating. Either a network of real sensor nodes or a wireless sensor net-work simulator is used during the testing, debugging and evaluation. In theresearch group I am working in, the Networked Embedded Systems group,we develop the sensor network operating system Contiki OS [6] includingIPv6 communication stacks [8] and tools such as COOJA/MSPSim. Byusing COOJA/MSPSim we have found both alignment problems and com-piler bugs during development and porting of communication stacks andother software. COOJA/MSPSim is also used for our automatic nightlytests of the Contiki OS software library.
When using simulators for research experiments, the evaluation of theexperiment can be much less time consuming and information about nodesand their communication can be measured at a high level of detail. It is alsopossible to repeat the exact same experiment several times, something moreor less impossible when evaluating an experiment on real sensor networks.In simulation it is also possible to control most aspects of the environmentsuch as number of nodes, mobility, packet loss ratio, etc.
Sensor network simulators can be used for a wide range of tasks. Someof these are briefly introduced below.
Application and System Development
When developing applications or systems, simulators can be used as a toolfor testing the complete behavior of the system. By executing the applicationor system in a simulator with support for debugging it is possible to findsoftware bugs before deploying the application on real nodes. Installing,executing and debugging using a simulator can save a substantial amount oftime compared to using real nodes since it takes much less time to install and
4
execute in a simulator. It is also easier to get detailed information aboutinternal states and other debugging related information of the simulatednodes than it is on real nodes.
Evaluation of new Communication Protocols
When developing new types of communication protocols for wireless sensornetworks it is necessary to evaluate some aspects of the protocol such asenergy consumption, throughput, reliability, etc. under varying conditions.Simulators provide detailed evaluations as well as control and variation ofthe conditions in the simulated environment. Evaluating in a simulator istypically both easier and faster than on a real world deployment or testbed.
Power Profiling of Applications
Many sensor network applications have high lifetime requirements. Usingsimulators it is possible to get an expectation of how long the batteries inthe nodes will last. It is, however, important that the simulator has a fine-grained model of the nodes and that it is accurate in its power consumptionpredictions.
1.2.1 Types of Sensor Network Simulators
Simulations can be performed at several different abstraction levels, fromgeneric simulation where only the most important aspects are simulated tohigh detail simulations where many details are simulated. In this thesis Iclassify the available simulators into the three different categories: genericnetwork simulators, code level simulators, and firmware level simulators asshortly described below.
Generic Network Simulators
Generic network simulators simulate systems with a focus on networkingaspects. The user of the simulator typically writes the simulation applica-tion in a high level language different from the one used for the real sensornetwork. Since the focus of the simulation is on networking the simulatortypically provides detailed simulation of the radio medium, but less detailedsimulation of the nodes.
The application or protocol code is usually written in the same program-ming language as the simulator itself. Most network simulators provide im-plementations of network stacks, MAC protocols, radio medium simulation,etc. Generic network simulators are useful for evaluating new types of com-munication protocols, but less useful for interoperability testing or findingsoftware bugs in deployable code, since the code executed is not the sameas on real nodes.
5
Code Level Simulators
Code level simulators use the same code in simulation as in real sensornetwork nodes. The code is compiled for the machine that is running thesimulator, typically a PC workstation that is magnitudes faster than the sen-sor node. Typically code level simulators are operating system specific sincethey need to replace driver code for the sensors and radio chips available onthe node with driver code that instead have hooks into the simulator.
Code level simulators provide implementation of the network stacks thatare available for the specific operating system since the code is the same ason real nodes. The simulators also provide simulation of the radio mediumand in some cases simulation of sensors, etc. Code level simulators can beused for finding some types of bugs in deployable code, logical error, bufferoverrun errors, etc. Bugs that relate to timing, CPU architecture or low-level drivers are usually hard to find using code level simulators since theydo not simulate the hardware in detail. Code level simulators can be usedfor interoperability testing, but since they are operating system specific thetests will be limited to communication stacks within the same operatingsystem.
Firmware Level Simulators
These simulators are based on emulation of the sensor nodes and the softwarethat runs in the simulator is the actual firmware that can be deployed in thereal sensor network. This approach gives the highest level of detail in thesimulation and enables accurate execution statistics. This type of simulationprovides emulation of microprocessor, radio chip and other peripherals andsimulation of radio medium. Due to the high level of detail provided byfirmware level simulators, they are usually slower than code level or genericnetwork simulators.
Firmware level of simulation is useful when timing-sensitive softwaresuch as MAC protocols or low level device drivers are tested, debugged andevaluated. Most types of bugs can be found since the target CPU is emulatedwith its specific properties such as word alignment and memory limitations.
While simulators are useful in many cases it is important to understandthe limitations of the simulator and the quality of evaluation results thatare the output of the simulations. Some aspects of the real world such asweather effects or execution speed of nodes might not be simulated, and ifthese aspects affect the simulated sensor network the results might not berealistic and cannot be trusted.
6
1.3 The COOJA/MSPSim Simulator
Most of the work in this thesis is focused on COOJA/MSPSim, our sensornetwork simulator and sensor node emulator. COOJA/MSPSim is a com-bination of two separate tools into one cross-level wireless sensor networksimulator. These tools are introduced in the following sections.
1.3.1 The MSPSim Emulator
MSPSim [9] is a Java-based instruction level emulator of the MSP430 micro-processor series. It emulates complete sensor networking platforms such asthe Tmote Sky [24] and ESB/2 [26]. MSPSim provides detailed simulationwith accurate timing and strong debugging support.
MSPSim combines cycle accurate interpretation of CPU instructionswith a discrete-event based simulation of all other components, both in-ternal and external. MSPSim uses an event-based execution kernel thatenables accurate timing while keeping the host processor utilization as lowas possible.
The emulator provides a programming interface for integration with net-work simulators such as COOJA. In addition, the emulator can be extendedwith new mote types through a mote interface and I/O interfaces that cor-respond to the MSP430 I/O ports and serial communication ports.
MSPSim provides both debugging capabilities such as break points,watches, logging, and single stepping as well as statistics about the operat-ing modes of the emulated components, statistics such as how much timethe CPU has consumed in the different low-power modes. All features andinformation can be accessed either via a command line interface, or via theintegration programming interfaces.
1.3.2 The COOJA Network Simulator
COOJA [22] is a flexible Java-based simulator initially designed for simulat-ing networks of sensor nodes running the Contiki operating system. COOJAsimulates networks of sensor nodes where each node can be of a differenttype; differing not only in on-board software, but also in the simulated hard-ware. COOJA is flexible in that many parts of the simulator can be easilyreplaced or extended with additional functionality.
COOJA can execute Contiki programs either by running the programcode compiled for the PC workstation CPU, or by running code compiledfor the sensor node in MSPSim. COOJA can also run nodes programmedin Java. All different approaches have advantages as well as disadvantages.Java-based nodes enable much faster simulations but do not run deployablecode. Emulating nodes allows control and retrieval of more fine-grainedexecution details compared to Java-based nodes or nodes running PC host
7

code. Combining the different levels in the same simulation gives both afast simulation as well as fine-grained execution details on selected nodes.
We have extended COOJA with support for other operating systemssuch as TinyOS and for emulating nodes based on the Atmel AVR micro-controller.
8
Chapter 2
Challenges and ResearchQuestions
There are many challenges and open research questions in the area of wirelesssensor network simulation. Some of the important challenges are introducedin this section together with a discussion on how this thesis addresses thechallenges.
2.1 Power Profiling in Simulators
Simulators are useful tools for studying many aspects of sensor networkingbut without validating the simulator the results are of uncertain quality.Two important aspects to validate are timing and the properties of theradio medium. Timing validation and improvements of timing accuracyhave been made for some simulators such as TOSSIM but only for singlenodes and not for networked nodes. In this thesis the focus is on validatingthe timing and power profiling on a network scale and study the accuracywhen nodes interact. This is done by comparing testbed results with resultsfrom simulation in COOJA/MSPSim. This work is presented in paper B.
Validation of the radio medium and the radio chip is also importantand there is some work in this field [3]. Validation of the radio medium isorthogonal to this thesis work on validation of timing accuracy.
2.2 Level of Detail in Simulators
An important topic is how much level of detail should be used in differentsimulations. Less detail usually give a faster simulation, while more de-tails potentially give more accurate results. Heidemann et al. suggest thatsimulation of wireless sensor networks needs more detail than for examplesimulation of wired networks [13]. This is partly due to the characteris-tics of the wireless medium, but also due to the focus of energy efficiency
9
which leads to very timing-sensitive energy optimizations. In Paper B wesuggest using emulation of sensor nodes to achieve a high level of detail inthe simulation, making detailed power profiling and fine-grained white-boxinteroperability testing possible.
2.3 Interoperability Testing and Simulation of Het-erogeneous Networks
Many standards for sensor networking are currently emerging, and inter-operability testing is needed to ensure interoperability between differentimplementations. Typically interoperability tests are performed by eitherrunning the communication stack together with stacks that are correctlyimplemented or with test-scripts that generate packets and study the re-sponses. This will result in a low level of detail when answering if the stackis compliant or not. In the worst case it will only give the answer “not com-pliant” and no more information. When porting Contiki’s 6LoWPAN/IPv6stack with HC01 compression to the MSP430 microprocessor we used COO-JA/MSPSim for interoperability testing. During the tests we found severalalignment bugs that caused interoperability problems. These bugs werefound by MSPSim’s alignment checker.
Since interoperability testing tests different implementations of commu-nication stacks it is important that the simulator supports simulation ofheterogeneous sensor networks. COOJA/MSPSim can simulate heteroge-neous networks and supports both several operating systems and severalCPU architectures.
Paper C studies the usage of emulator based simulators such as COO-JA/MSPSim for interoperability testing. By using emulators it is easy to getdetailed execution traces and statistics which makes testing and debuggingof the communication stack a much easier task.
2.4 Self-Configuration
Many sensor network applications require some form of self-configurationto perform optimally and adapt in a changing environment. There are sev-eral proposals for self-configuration architectures for sensor networks such asGeneric Role Assignment [10] and Hood [32]. There are also some adaptiveand self-configuring communication protocols [2], but the self-configurationmechanism is often specific for the given protocol. A challenge is to de-velop generic methods that can find self-configuration rules or behavior fora wide range of applications. Some of the candidates for these methods arebased on machine learning, and usually require lots of statistical data forthe learning process. Instead of or in addition to running these methodson a live sensor network it is possible to use simulators. Using simulators
10
will both speed-up the learning and make it easy to vary the environmentin a systematic way. These methods require a fast and accurate simulationfor getting good results. Paper A motivates the need for self-configurationand paper B validates the accuracy of COOJA/MSPSim which is importantwhen learning and evaluating self-configuration policies.
2.5 Contributions and Results
The main contributions and results of this thesis are:1) The design and implementation of COOJA/MSPSim and evaluation of
it as a detailed simulator for sensor network and its accuracy with respect topower profiling of interacting nodes. Earlier work only evaluated simulationaccuracy on a per node basis.
2) Evaluation of COOJA/MSPSim as a tool for white-box interoper-ability testing. Using an emulator-based simulator it is possible to performinteroperability testing and get detailed information from the tests insteadof only getting yes/no answers. COOJA/MSPSim allows testing of hetero-geneous sensor networks running different node types and different operatingsystems.
Both MSPSim stand-alone and COOJA/MSPSim have been used by alarge number of people during development and evaluation. Some of theuses include: debugging of the mspgcc compiler, automatic nightly testsand algorithm profiling. The simulator is used both in academy and incommercial companies.
11

12
Chapter 3
Related Work
The discussion of related work is divided into the sections generic sensornetwork simulators, code level sensor network simulators and sensor nodeemulators.
3.1 Generic Sensor Network Simulators
There are many generic sensor network simulators available. Some of themare network simulators with extensions for simulation of sensor networking;others are designed for sensor network simulation. NS-2 is one of the mostwide spread network simulators [21]. NS-2 is an object-oriented discreteevent based simulator with support for TCP/IP simulation over both wiredand wireless links. NS-2 is extensible and new protocols can be implementedin C++ and the simulator can be controlled via OTcl code. There are someextensions related to ad-hoc networks and wireless sensor networks [5]. Sen-sorSim [23] provides additional features for NS-2 such as sensor networkingprotocols, power consumption models for sensor nodes and battery models.
OMNeT++ [31] is a discrete event simulator with focus on simulationof communication networks. OMNeT++ is more efficient than NS-2 whensimulating wireless networks and has several extensions for sensor networksimulations including models of energy consumption of communication onIEEE 802.15.4 networks [4]. MiXiM [16] extends OMNeT++ by combiningseveral sensor network related OMNeT++ extensions into one more com-plete package for simulation of wireless sensor networks.
GloMoSim [33] is another object-oriented discrete event simulator basedon the parsec library for parallel execution of the simulation. The focus ison wireless networks and it has support for mobility.
J-Sim [30] is a component-based, real-time process-driven simulator.Real-time process-driven simulation differs from discrete-event simulatorsin that events consume time corresponding to the time they would consumein the real word. J-Sim is Java-based and thus platform independent.
13
The generic network simulators can be used for some of the simulationtasks that COOJA/MSPSim can be used for, but none of them are usefulfor interoperability testing since that requires the same code in simulationas on real nodes. Power profiling can typically not be done either, at leastnot with the same accuracy as in emulation based simulators [17].
3.2 Code Level Sensor Network Simulators
There are a few simulators that use the same code as is used on real nodes.These simulators are specific for one single operating system since this typeof simulator requires low-level drivers for hardware components, etc. to bereplaced by the corresponding code in the simulator.
TOSSIM [19] is a code level simulator for detailed simulation of TinyOSbased nodes, including simulation of interrupts and bit-based radio commu-nication. TOSSIM provides simulation of radio stack and radio mediums,etc.
POWERTOSSIM [27] is an extension of TOSSIM that adds an energymodel. This enables energy profiling of the simulated applications, but sincethe node model is not executing the same compiled code as real sensor nodeswould do, the accuracy is not as good as if the nodes are emulated.
TimeTOSSIM [18] is another extension of TOSSIM that focus on ac-curate timing without emulation. They improve accuracy by adding in-strumentation to the source code. Their evaluation shows that they get99% timing accuracy compared to the Avrora emulator without emulation.TimeTOSSIM is claimed to be faster than emulation but several times slowerthan TOSSIM without the instrumentation.
XMOS is Mantis OS’s [1] simulator which basically is a port of the MantisOS to the X86-platform so that multiple nodes can be run on x86 machines.
The code level simulators are more useful than generic network sim-ulators for tasks such as interoperability tests since the code executed insimulation is the same as on real nodes. Code level simulators, however,typically support only one operating system which limits the availability ofcommunication stacks to test. Another problem is that compiling for an-other CPU architecture might cause a different behavior than on the targetsensor node (typically a MSP430 or AVR microcontroller). Using COO-JA/MSPSim it is possible to either perform tests on a code level or onemulated nodes executing the same object code that is executed on a realnode. COOJA/MSPSim also has support for multiple operating systemsso that several different communication stacks can be tested. Code levelsimulators do not have the same accuracy level as emulated node when itcomes to timing and power profiling.
14
3.3 Sensor Node Emulators
Sensor node emulators provide a very detailed model of the sensor nodesby emulating node hardware such as microprocessor and radio transeiver.The COOJA/MSPSim simulator is a sensor node emulator and has manyfeatures in common with other simulators in this category.
Avrora [29] is a cycle-accurate emulator of Atmel AVR-based nodes whileMSPSim emulates the Texas Instruments MSP430 architecture. Avrora hasa built-in radio medium model and can simulate many nodes. When ex-ecuting more than one node, Avrora creates a Java thread for each emu-lated node. Avrora uses selectable synchronization policies for keeping thethreads running at the same speed. COOJA/MSPSim handles schedulingof each node explicitly instead of creating threads. While Avrora offers acycle-accurate simulation of AVR-based nodes, it did not initially have apower profiler. For this purpose, Landsiedel et al. created the power an-alyzer AEON [17] on top of Avrora. AvroraZ [3] is another extension ofAvrora that adds CC2420 and MicaZ emulation to Avrora which makes itpossible to execute applications running 802.15.4 based communication pro-tocols (Zigbee [34], 6LoWPAN [20], WirelessHART [12], ISA100 [15]). Thesame radio chip CC2420 is emulated in COOJA/MSPSim and is used forthe Tmote Sky sensor node emulation.
ATEMU [25] is another emulator for Atmel AVR-based sensor nodes.ATEMU is a tick based emulator unlike MSPSim and Avrora that are bothevent based. Tick based emulators are typically slower since they call emu-lated components each cycle or tick while event based emulators only call thecomponents when they request to be called. ATEMU supports the Mica2sensor node which means that it does not have any 802.15.4 support thatboth AvroraZ and COOJA/MSPSim have.
There are also more limited emulators that can be used for code andalgorithm testing. For example the debugger, GDB, usually comes withemulators. The main differences between these emulators and COOJA/M-SPSim are that they do not emulate external peripherals and only emulatea single microprocessor.
15

16
Chapter 4
Summary of the Papers
The thesis consists of the following papers.
4.1 Paper A: Experiences from Two Sensor Net-
work Deployments — Self-Monitoring and Self-Configuration Keys to Success
Niclas Finne, Joakim Eriksson, Adam Dunkels, Thiemo Voigt. In Proceed-ings of WWIC 2008, the 6th International Conference on Wired/WirelessInternet Communications. Tampere, Finland, May 2008.
Summary. This paper describes two deployments of surveillance appli-cations made together with the Swedish defense unit Markstridsskolan, andtwo mechanisms for self-monitoring and self-management in sensor networkapplications. During the deployments we discovered some problems causedby failing hardware of the sensor nodes. Based on this experience we de-signed two mechanisms for self-monitoring of hardware and software. Thesemechanisms are presented and evaluated in the paper. The first mechanismprobes the hardware for errors by activating different hardware componentsand measuring all sensors. If any sensor consistently reports unexpected in-put while activating a component, a hardware error is assumed to be present.The other mechanism monitors the software by using the built-in energy es-timator in Contiki OS and compares the results with an application specificpower profile. When the estimated energy consumption deviates from theprofile a software error is likely. The first mechanism captures the problemsdetected during the deployments, and the second mechanism captures soft-ware errors such as forgetting to turn of the radio after sending/receivingpackets.
Contribution. The main contribution of this paper is to highlightthe importance of and provide mechanisms for self-monitoring and self-management in wireless sensor networks. The paper serves as background
17
and motivates the work on detailed and accurate simulation for evaluatingpower profiling mechanisms as tools for bug detection.
My contribution. I performed both experiments together with NiclasFinne, SICS and Mikael Axelsson, Swedish Defence. I am also co-authorof the paper and worked on design and development of the self-monitoringsystem and experiments.
4.2 Paper B: Accurate Network-Scale Power Pro-
filing for Sensor Network Simulators
Joakim Eriksson, Fredrik Osterlind, Niclas Finne, Adam Dunkels, NicolasTsiftes, Thiemo Voigt. In Proceedings of EWSN 2009, the 6th EuropeanConference on Wireless Sensor Networking. Cork, Ireland, February 2009.
Summary. In this paper we evaluate the accuracy of the combined sen-sor network simulation tool COOJA/MSPSim that consists of COOJA, asensor network simulator, and MSPSim, a sensor node emulator. The eval-uation is made using Contiki’s power profiler as base-line [7]. The powerprofiler measures time spent in different modes for each chip on a nodeand calculates power consumption by multiplying time with pre-measuredcurrent draw and battery voltage. We compare experimental results mea-sured on real sensor nodes with simulation results for three different MACprotocols. The MAC protocols are of varying types, one is TDMA based(CoReDac) and one is low power probing (LPP), and the final one is basedon low power listening (X-MAC). The results of the evaluation indicate thatCOOJA/MSPSim enables accurate network-scale simulation of the powerconsumption of sensor networks.
Contribution. The main contribution of this paper is that we evaluatethe accuracy of power profiling in simulation by comparing the results fromsimulation with results from execution on real sensor nodes. We did thisevaluation on a network scale which differs from previous efforts that onlyevaluate single nodes without any communication aspects. Another impor-tant contribution is the simulation tool, COOJA/MSPSim that supportsaccurate power profiling.
My Contribution. I am the main developer of MSPSim and I im-proved it for better support of power profiling, improved CC2420 radio chipemulation and extended the integration with COOJA. I also made some ofthe experiments and wrote parts of the paper.
18
4.3 Paper C: COOJA/MSPSim: InteroperabilityTesting for Wireless Sensor Networks
Joakim Eriksson, Fredrik Osterlind, Niclas Finne, Nicolas Tsiftes, AdamDunkels, Thiemo Voigt, Swedish Institute of Computer Science, SICS.Robert Sauter, Pedro Jose Marron, University of Bonn and Fraunhofer IAIS.In Proceedings of SIMUTools 2009, the Second International Conference onSimulation Tools and Techniques. Rome, Italy, March 2009.
Summary. In this paper we show that COOJA/MSPSim can be usedfor interoperability tests between different protocol stack implementationsin different sensor network operating systems. We also show that the built-in power profiling in MSPSim is as accurate as the Contiki’s power profilerand that it can be used for power profiling any application without anypower profiling support from the operating system in the node. We evaluateCOOJA/MSPSim for use in interoperability tests by adding support forTinyOS and performing basic experiments where nodes based on TinyOScommunicate with nodes based on Contiki OS.
Contribution. The main contributions of this paper are that we showthat COOJA/MSPSim can be used as an interoperability testing tool andthat it accurately evaluates power consumption of the simulated nodes. In-teroperability testing in COOJA/MSPSim gives the tester much more de-tailed information than performing the same test on real nodes.
My Contribution. I improved MSPSim for better support of the radiochip CC2420, specifically to meet the needs of TinyOS such as support forSFD capture interrupt. I also performed experiments and wrote parts of thepaper.
19

20
Chapter 5
Conclusions and FutureWork
This licentiate thesis presents important steps towards simulating sensor net-works with high level of detail and with support for accurate power profilingand timing of interacting nodes. To achieve even more realistic simulationsa combination of detailed node models with accurate timing and improvedradio medium simulation such as AvroraZ [3] is needed. The thesis alsoshows that this type of tools can be used for white-box interoperability testswith high level of control and detailed information during the test runs.White-box interoperability testing using COOJA/MSPSim can save muchtime and effort when developing or porting implementations of standardprotocols such as 6LoWPAN/IPv6 and WirelessHART.
Another area where I will use COOJA/MSPSim is to study methodsthat optimize performance and enable a higher degree of self-configurationin sensor networks. I will study methods for learning self-configuration poli-cies for sensor network applications and protocols. One promising method isreinforcement learning [28]. By formulating a utility function for the sensornetwork application it is possible to use reinforcement learning to learn con-figuration policies that optimize the utility. A typical utility function for asensor network application includes parameters such as power consumption,reliability, response time, etc. The challenges for using reinforcement learn-ing for configuration in sensor networks are first to develop methods thatwork in multi-agent settings and then to make the learned policies smallenough to fit in the very resource constrained sensor nodes.
I will also improve COOJA/MSPSim to better support fast and accuratesimulations that combine Java level simulation with firmware level simula-tion to get high level of detail while simulating at a high speed.
21

22
Bibliography
[1] S. Bhatti, J. Carlson, H. Dai, J. Deng, J. Rose, A. Sheth, B. Shucker,C. Gruenwald, A. Torgerson, and R. Han. Mantis os: An embeddedmultithreaded operating system for wireless micro sensor platforms.CM/Kluwer Mobile Networks & Applications (MONET), Special Issueon Wireless Sensor Networks, 10(4), August 2005.
[2] M. Buettner, G. V. Yee, E. Anderson, and R. Han. X-MAC: a shortpreamble MAC protocol for duty-cycled wireless sensor networks. InSenSys ’06: Proceedings of the 4th international conference on Embed-ded networked sensor systems, pages 307–320, Boulder, Colorado, USA,2006.
[3] Rodolfo de Paz Alberola and Dirk Pesch. Avroraz: Extending avrorawith an ieee 802.15.4 compliant radio chip mode. In 3rd ACM In-ternational Workshop on Performance Monitoring, Measurement, andEvaluation of Heterogeneous Wireless and Wired Networks, Vancouver,Canada, October 2008.
[4] Isabel Dietrich, Feng Chen, Reinhard German, and Falko Dressler.Modeling energy consumption of wireless communications in OM-NeT++. GI/ITG KuVS Fachgesprach Systemsoftware und Energiebe-wusste Systeme, October 2007.
[5] Ian Downard. Simulating sensor networks in ns-2. NRL Formal Report5522, April 2004.
[6] A. Dunkels, B. Gronvall, and T. Voigt. Contiki - a lightweight andflexible operating system for tiny networked sensors. In Workshop onEmbedded Networked Sensors, Tampa, Florida, USA, November 2004.
[7] Adam Dunkels, Fredrik Osterlind, Nicolas Tsiftes, and Zhitao He.Software-based on-line energy estimation for sensor nodes. In EmNets’07: Proceedings of the 4th workshop on Embedded networked sensors,pages 28–32, 2007.
[8] M. Durvy, J. Abeille, P. Wetterwald, C. O’Flynn, B. Leverett,E. Gnoske, M. Vidales, G. Mulligan, N. Tsiftes, N. Finne, and
23
A. Dunkels. Making Sensor Networks IPv6 Ready. In Proceedingsof the Sixth ACM Conference on Networked Embedded Sensor Systems(ACM SenSys 2008), Raleigh, North Carolina, USA, November 2008.
[9] J. Eriksson, A. Dunkels, N. Finne, F. Osterlind, and T. Voigt. Msp-sim – an extensible simulator for msp430-equipped sensor boards. InProceedings of the European Conference on Wireless Sensor Networks(EWSN), Poster/Demo session, Delft, The Netherlands, January 2007.
[10] Christian Frank and Kay Romer. Algorithms for generic role assignmentin wireless sensor networks. In SenSys ’05: Proceedings of the 3rdinternational conference on Embedded networked sensor systems, pages230–242, New York, NY, USA, 2005. ACM Press.
[11] C. Han, R. K. Rengaswamy, R. Shea, E. Kohler, and M. Srivastava.SOS: A dynamic operating system for sensor networks. In MobiSys ’05,2005.
[12] Wirelesshart. Web page. http://www.hartcomm2.org/.
[13] John Heidemann, Nirupama Bulusu, Jeremy Elson, Chalermek In-tanagonwiwat, Kun chan Lan, Ya Xu, Wei Ye, Deborah Estrin, andRamesh Govindan. Effects of detail in wireless network simulation. InIn Proceedings of the SCS Multiconference on Distributed Simulation,pages 3–11, 2001.
[14] J. Hill, R. Szewczyk, A. Woo, S. Hollar, D. Culler, and K. Pister. Systemarchitecture directions for networked sensors. In Proceedings of the9th International Conference on Architectural Support for ProgrammingLanguages and Operating Systems, November 2000.
[15] Isa100. Web page. http://www.isa.org/isa100/.
[16] A. Kopke, M. Swigulski, K. Wessel, D. Willkomm, P. T. Klein Han-eveld, T. E. V. Parker, O. W. Visser, H. S. Lichte, and S. Valentin.Simulating wireless and mobile networks in omnet++ the mixim vi-sion. In Simutools ’08: Proceedings of the 1st international conferenceon Simulation tools and techniques for communications, networks andsystems & workshops, pages 1–8, ICST, Brussels, Belgium, 2008. ICST(Institute for Computer Sciences, Social-Informatics and Telecommu-nications Engineering).
[17] O. Landsiedel, K. Wehrle, and S. Gotz. Accurate prediction of powerconsumption in sensor networks. In Proceedings of The Second IEEEWorkshop on Embedded Networked Sensors (EmNetS-II), Sydney, Aus-tralia, May 2005.
24
[18] Olaf Landsiedel, Hamad Alizai, and Klaus Wehrle. When timing mat-ters: Enabling time accurate and scalable simulation of sensor networkapplications. In IPSN ’08: Proceedings of the 7th international con-ference on Information processing in sensor networks, pages 344–355,Washington, DC, USA, 2008. IEEE Computer Society.
[19] P. Levis, N. Lee, M. Welsh, and D. Culler. Tossim: accurate andscalable simulation of entire tinyos applications. In Proceedings of thefirst international conference on Embedded networked sensor systems,pages 126–137, 2003.
[20] G. Mulligan, N. Kushalnagar, and G. Montenegro. IPv6 overIEEE 802.15.4 BOF (6lowplan). Web page. Visited 2005-02-21.http://www.ietf.org/ietf/04nov/6lowpan.txt
[21] The Network Simulator NS-2. http://www.isi.edu/nsnam/ns/.
[22] F. Osterlind, A. Dunkels, J. Eriksson, N. Finne, and T. Voigt. Cross-level sensor network simulation with cooja. In Proceedings of the FirstIEEE International Workshop on Practical Issues in Building SensorNetwork Applications (SenseApp 2006), Tampa, Florida, USA, Novem-ber 2006.
[23] Sung Park, Andreas Savvides, and Mani B. Srivastava. Sensorsim: asimulation framework for sensor networks. In MSWIM ’00: Proceed-ings of the 3rd ACM international workshop on Modeling, analysis andsimulation of wireless and mobile systems, pages 104–111, New York,NY, USA, 2000. ACM.
[24] J. Polastre, R. Szewczyk, and D. Culler. Telos: Enabling ultra-low power wireless research. In Proceedings of The Fourth Interna-tional Conference on Information Processing in Sensor Networks. IP-SN/SPOTS’05, Los Angeles, CA, USA, April 2005.
[25] Jonathan Polley, Dionysys Blazakis, Jonathan Mcgee, Dan Rusk, andJohn S. Baras. Atemu: A fine-grained sensor network simulator. InIEEE Communications Society Conference on Sensor and Ad Hoc Com-munications and Networks, 2004.
[26] J. Schiller, H. Ritter, A. Liers, and T. Voigt. Scatterweb - low powernodes and energy aware routing. In Proceedings of Hawaii InternationalConference on System Sciences, Hawaii, USA, 2005.
[27] V. Shnayder, M. Hempstead, Chen B., G.W. Allen, and M. Welsh.Simulating the power consumption of large-scale sensor network ap-plications. In 2nd International Conference on Embedded NetworkedSensor Systems (ACM SenSys), November 2004.
25
[28] Richard S. Sutton and Andrew G. Barto. Reinforcement Learning: AnIntroduction (Adaptive Computation and Machine Learning). The MITPress, March 1998. ISBN: 0262193981
[29] B.L. Titzer, D.K. Lee, and J. Palsberg. Avrora: scalable sensor networksimulation with precise timing. In Proceedings of the 4th internationalsymposium on Information processing in sensor networks (IPSN), April2005.
[30] Hung-Ying Tyan. Design, Realization and Evaluation of a Component-Based Compositional Software Architecture for Network Simulation.PhD thesis, 2002.
[31] Andras Varga. The omnet++ discrete event simulation system. InProceedings of the European Simulation Multiconference, pages 319–324, Prague, Czech Republic, June 2001. SCS – European PublishingHouse.
[32] K. Whitehouse, C. Sharp, E. Brewer, and D. Culler. Hood: a neigh-borhood abstraction for sensor networks. In Proc. ACM MobiSys’04,Boston, MA, USA, June 2004.
[33] Xiang Zeng, Rajive Bagrodia, and Mario Gerla. Glomosim: a libraryfor parallel simulation of large-scale wireless networks. SIGSIM Simul.Dig., 28(1):154–161, 1998. ISSN: 0163-6103
[34] Zigbee. Web page. 2007-11-21. http://www.zigbee.org.
26

Part II
Included papers
27

Chapter 6
Experiences from TwoSensor Network Deployments— Self-Monitoring andSelf-Configuration Keys toSuccess
Niclas Finne, Joakim Eriksson, Adam Dunkels, Thiemo Voigt.Swedish Institute of Computer Science, SICS.{nfi,joakime,adam,thiemo}@sics.se
6.1 Abstract
Despite sensor network protocols being self-configuring, sensor network de-ployments continue to fail. We report our experience from two recentlydeployed IP-based multi-hop sensor networks: one in-door surveillance net-work in a factory complex and a combined out-door and in-door surveillancenetwork. Our experiences highlight that adaptive protocols alone are notsufficient, but that an approach to self-monitoring and self-configurationthat covers more aspects than protocol adaptation is needed. Based on ourexperiences, we design and implement an architecture for self-monitoring ofsensor nodes. We show that the self-monitoring architecture detects andprevents the problems with false alarms encountered in our deployments.The architecture also detects software bugs by monitoring actual and ex-pected duty-cycle of key components of the sensor node. We show that theenergy-monitoring architecture detects bugs that cause the radio chip to beactive longer than expected.
29
6.2 Introduction
Surveillance is one of the most prominent application domains for wirelesssensor networks. Wireless sensor networks enable rapidly deployed surveil-lance applications in urban terrain. While most wireless sensor networkmechanisms are self-configuring and designed to operate in changing condi-tions [12, 16], the characteristics of the deployment environment often causeadditional and unexpected problems [8, 9, 11]. In particular, Langendoenet al. [8] point out the difficulties posed by, e.g., hardware not working asexpected.
To contribute to the understanding of the problems encountered in real-world sensor network deployments, we report on our experience from re-cent deployments of two surveillance applications: one in-door surveillanceapplication in a factory complex, and one combined out-door and in-doorsurveillance network. Both applications covered a large area and thereforerequired multi-hop networking.
Our experiences highlight that adaptive protocols alone are not sufficient,but that an approach to self-monitoring and self-configuration that coversmore aspects than protocol adaptation is needed. An example where wehave experienced the need for self-monitoring of sensor nodes is when thecomponents used in low-cost sensor nodes behave differently on differentnodes. In many of our experiments, radio transmissions triggered the motiondetector on a subset of our nodes while other nodes did not experience thisproblem.
Motivated by the observation that self-configuration and adaptation isnot sufficient to circumvent unexpected hardware and software problems, wedesign and implement a self-monitoring architecture for detecting hardwareand software problems. Our architecture consists of pairs of probes andactivators where the activators start up an activity that is suspected totrigger problems and the probes measure if sensor components react to theactivator’s activity. Callback functions enable a node to self-configure itshandling of a detected problem. We experimentally demonstrate that ourapproach solves the observed problem of packet transmissions triggering themotion detector.
To find software problems, we integrate Contiki’s software-based on-lineenergy estimator [5] into the self-monitoring architecture. This allows usto detect problems such as the CPU not going into the correct low powermode, a problem previously encountered by Langendoen et al. [8]. With twoexamples we demonstrate the effectiveness of the self-monitoring architec-ture. Based on our deployment experiences, we believe this tool to be veryvaluable for both application developers and system developers.
The rest of the paper is structured as follows. The setup and measure-ments for the two deployments are described in Section 6.3. In Section 6.4we present our experiences from the deployments, including unexpected be-
30
havior. Section 6.5 describes our architecture for self-monitoring while thefollowing section evaluates it. Finally, we describe related work in Section 6.7and our conclusions in Section 6.8.
6.3 Deployments
We have deployed two sensor network surveillance applications in two differ-ent environments. The first network was deployed indoors in a large factorycomplex setting with concrete floors and walls, and the second in a combinedoutdoor and indoor setting in an urban environment.
In both experiments, we used ESB sensor nodes [14] consisting of aMSP430 microprocessor with 2kB RAM, 60kB flash, a TR1001 868 MHzradio and several sensors. During the deployments, we used the ESB’s mo-tion detector (PIR) and vibration sensor.
We implemented the applications on top of the Contiki operating sys-tem [4] that features the uIP stack, the smallest RFC-compliant TCP/IPstack [3]. All communication uses UDP broadcast and header compressionthat reduces the UDP/IP header down to only six bytes: the full source IPaddress and UDP port, as well as a flag field that indicates whether or notthe header is compressed.
We used three different types of messages: Measurement messages tosend sensor data to the sink, Path messages to report forwarding paths tothe sink, and Alarm messages that send alarms about detected activity.
We used two different protocols during the deployment. In the first ex-periment, we used a single-hop protocol where all nodes broadcast messagesto the sink. In the second experiment, we used a multi-hop protocol whereeach node calculates the number of hops to the sink and transmits messageswith a limit on hops to the sink. A node only forwards messages for nodesit has accepted to be relay node for. A message can take several paths tothe sink and arrive multiple times. During the first deployment only a fewnodes were configured to forward messages, but in the second deploymentany node could configure itself to act as relay node.
After a sensor has triggered an alarm, an alarm message is sent towardsthe sink. Alarm messages are retransmitted up to three times unless thenode hears an explicit acknowledgment message or overhears that anothernode forwards the message further. Only the latest alarm from each nodeis forwarded.
6.3.1 First Deployment: Factory Complex
The first deployment of the surveillance sensor network was performed in afactory complex. The main building was about 250 meters times 25 metersin size and three floors high. Both floors and most walls were made ofconcrete but there were sections with office-like rooms that were separated
31
by wooden walls. Between the bottom floor and first floor there was asmaller half-height floor. The largest distance between the sink and themost distant nodes was slightly less than 100 meters.
The sensor network we deployed consisted of 25 ESB nodes running asurveillance application. All nodes were either forwarding messages to thesink or monitored their environment using the PIR sensor and the vibrationdetector. We made several experiments ranging from a single hop networkfor measuring communication quality to a multi-hop surveillance network.
Single-Hop Network Experiment
We made the first experiment to understand the limitations of communi-cation range and quality in the building. All nodes communicated directlywith the sink and sent measurement packets at regular intervals.
NodeDistance
Walls ReceivedSent Sent Reception ratio Signal strength
(meter) (expected) (actual) (percent) (avg,max)2 65 1 C 92 621 639 15% 1829 21043 21 1 W 329 587 588 56% 1940 23144 55 1 C 72 501 517 14% 1774 19795 33 2 W 114 611 613 19% 1758 19696 18 1 W 212 580 590 37% 1866 22307 26 2 W 347 587 588 59% 2102 25688 15 1 W 419 584 585 71% 2131 26439 25 1 W 194 575 599 34% 1868 2218
10 23 2 W 219 597 599 37% 1815 210611 17 1 W 331 591 593 56% 2102 258250 27 2 W 230 587 594 39% 1945 2334
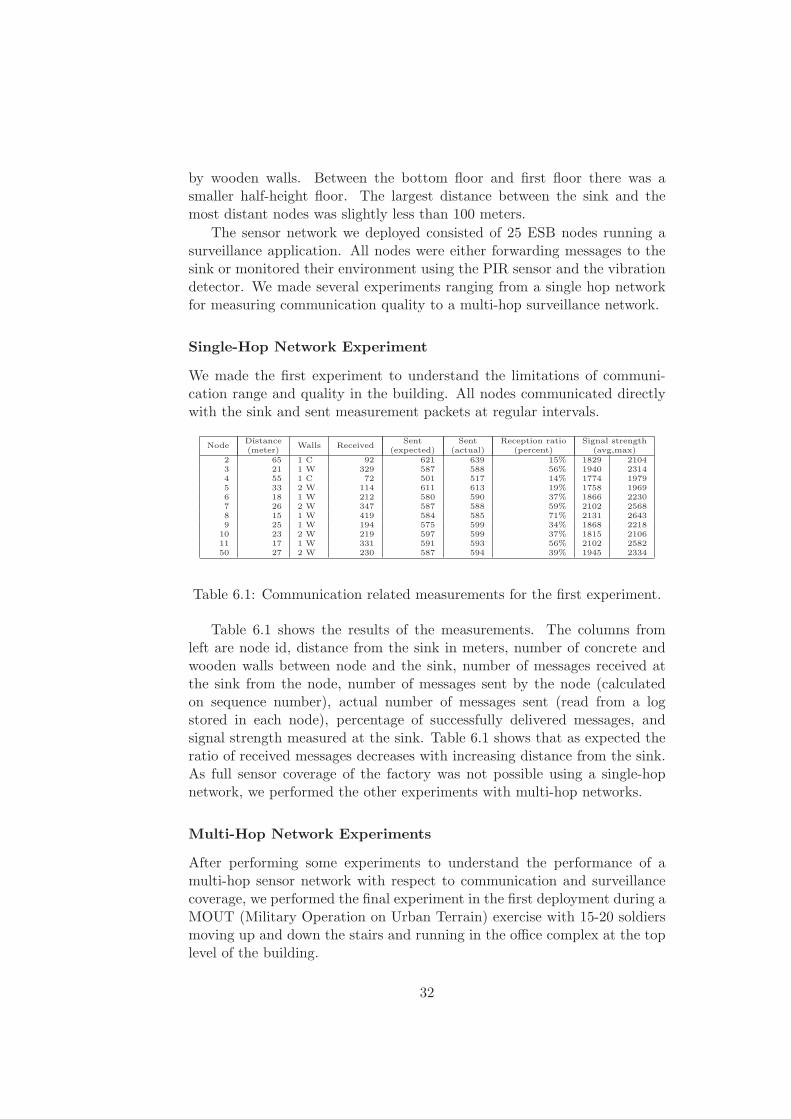
Table 6.1: Communication related measurements for the first experiment.
Table 6.1 shows the results of the measurements. The columns fromleft are node id, distance from the sink in meters, number of concrete andwooden walls between node and the sink, number of messages received atthe sink from the node, number of messages sent by the node (calculatedon sequence number), actual number of messages sent (read from a logstored in each node), percentage of successfully delivered messages, andsignal strength measured at the sink. Table 6.1 shows that as expected theratio of received messages decreases with increasing distance from the sink.As full sensor coverage of the factory was not possible using a single-hopnetwork, we performed the other experiments with multi-hop networks.
Multi-Hop Network Experiments
After performing some experiments to understand the performance of amulti-hop sensor network with respect to communication and surveillancecoverage, we performed the final experiment in the first deployment during aMOUT (Military Operation on Urban Terrain) exercise with 15-20 soldiersmoving up and down the stairs and running in the office complex at the toplevel of the building.
32
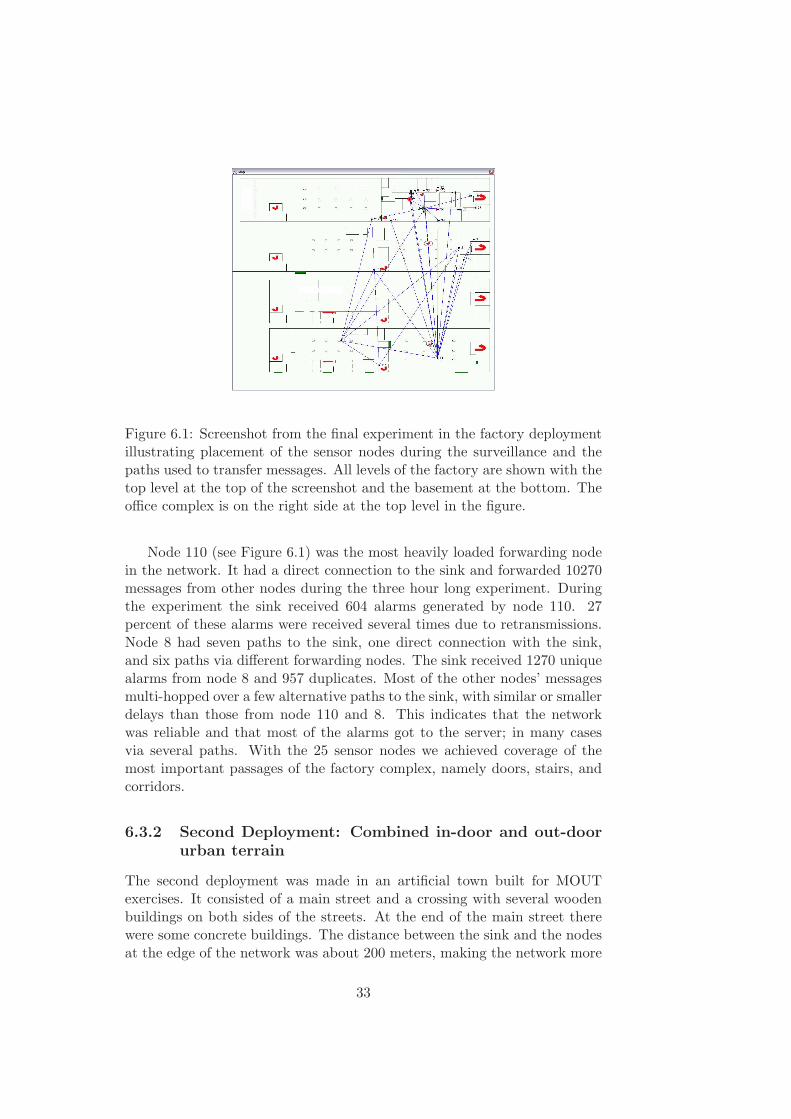
Figure 6.1: Screenshot from the final experiment in the factory deploymentillustrating placement of the sensor nodes during the surveillance and thepaths used to transfer messages. All levels of the factory are shown with thetop level at the top of the screenshot and the basement at the bottom. Theoffice complex is on the right side at the top level in the figure.
Node 110 (see Figure 6.1) was the most heavily loaded forwarding nodein the network. It had a direct connection to the sink and forwarded 10270messages from other nodes during the three hour long experiment. Duringthe experiment the sink received 604 alarms generated by node 110. 27percent of these alarms were received several times due to retransmissions.Node 8 had seven paths to the sink, one direct connection with the sink,and six paths via different forwarding nodes. The sink received 1270 uniquealarms from node 8 and 957 duplicates. Most of the other nodes’ messagesmulti-hopped over a few alternative paths to the sink, with similar or smallerdelays than those from node 110 and 8. This indicates that the networkwas reliable and that most of the alarms got to the server; in many casesvia several paths. With the 25 sensor nodes we achieved coverage of themost important passages of the factory complex, namely doors, stairs, andcorridors.
6.3.2 Second Deployment: Combined in-door and out-doorurban terrain
The second deployment was made in an artificial town built for MOUTexercises. It consisted of a main street and a crossing with several woodenbuildings on both sides of the streets. At the end of the main street therewere some concrete buildings. The distance between the sink and the nodesat the edge of the network was about 200 meters, making the network more
33
than twice as long as in the first deployment.
The surveillance system was improved in two important ways. First,the network was more self-configuring in that there was no need for man-ually configuring which role each node should have (relay node or sensornode). Each node configured itself for relaying if the connectivity to sinkwas above a threshold. Second, alarm messages also included path infor-mation so that information of the current configuration of the network wasconstantly updated as messages arrived to the sink. Even with the addedpath information in the alarm messages, the response times for alarms in thenetwork were similar to the response times in the first deployment despitethat the distant nodes were three or four hops away from the sink ratherthan two or three. Using 25 nodes we achieved fairly good sensor coverageof the most important areas.
6.4 Deployment Experiences
When we deployed the sensor network application we did not know what toexpect in terms of deployment speed, communication quality, applicabilityof sensors, etc. Both deployments were made in locations that were newto us. This section reports on the various experiences we made during thedeployments.
Network Configuration
During the first deployment the configuration needed to make a node actas a relay node was done manually. This made it very important to planthe network carefully and make measurements on connectivity at differentlocations in order to get an adequate number of forwarding nodes. This wasone of the largest problems with the first deployment. During the seconddeployment the network’s self-configuration capabilities made deployment afaster and easier task.
The importance of self-configuration of the network routing turned outto be higher than we expected since we suddenly needed to move togetherwith the sink to a safer location during the second deployment, where wedid not risk being fired at. This happened while the network was deployedand active.
Unforeseen Hardware Problems
During radio transmissions a few of the sensor nodes triggered sensor read-ings which cause unwanted false alarms. Since we detected and understoodthis during the first deployment, we rewrote the application to turn off sens-ing on the nodes that had this behavior. Our long term solution is describedin the next section.
34
Parameter Configuration
In the implementation of the communication protocols and surveillance ap-plication there are a number of parameters with static values set during earlytesting with small networks. Many of these parameters need to be optimizedfor better application performance. Due to differences in the environment,this optimization can only partly be done before deployment. Examples ofsuch parameters are retransmission timers, alarm triggering delays, radiotransmission power level, and time before refreshing a communication link.
Ground Truth
It is important for understanding the performance of a sensor network de-ployment to compare the sensed data to ground truth. In our deployments,we did not have an explicit installation of a parallel monitoring system toobtain ground truth, but in both deployments we received a limited amountof parallel feedback.
During the first deployment, the sensor networks alerted us of movementsin various parts of the factory but since we did not have any informationabout the soldiers’ current locations it was difficult to estimate the time be-tween detection by the sensor nodes and the alarm at the sink. Sometimesthe soldiers threw grenades powerful enough to trigger the vibration sensorson the nodes. This way, we could estimate the time between the grenadeexplosions and the arrival of the vibration alarm at the sink. During the sec-ond deployment we received a real time feed from a wireless camera and usedit to compare the soldiers’ path with the alarms from the sensor network.
Radio Transmission
During the first deployment we placed forwarding nodes in places where weexpected good radio signal strength (less walls, and floors). We expected themost used path to the sink via forwarding nodes in the stairwells. However,most messages took a path straight through two concrete floors via a nodeplaced at the ground floor below the office rooms where the sensors weredeployed.
Instant Feedback
One important feature of the application during deployment was that whenstarted, a node visualized its connection. When it connected, the nodebeeped and flashed all its leds before being silent. Without this feature wewould have been calling the person at the sink all the time just to see ifthe node had connected to the network. This way, we could also estimate anode’s link quality. The longer time for the node to connect to the network,
35
the worse it was connected. We usually moved nodes that required morethan 5 - 10 seconds to connect to a position with better connectivity.
6.5 A Self-Monitoring Architecture for DetectingHardware and Software Problems
To ensure automatic detection of the nodes that have hardware problems, wedesign a self-monitoring architecture that probes potential hardware prob-lems. Our experiences show that the nodes can be categorized into twotypes: those with a hardware problem and those without. The self-probingmechanism could therefore possibly be run at start-up, during deployment,or even prior to deployment.
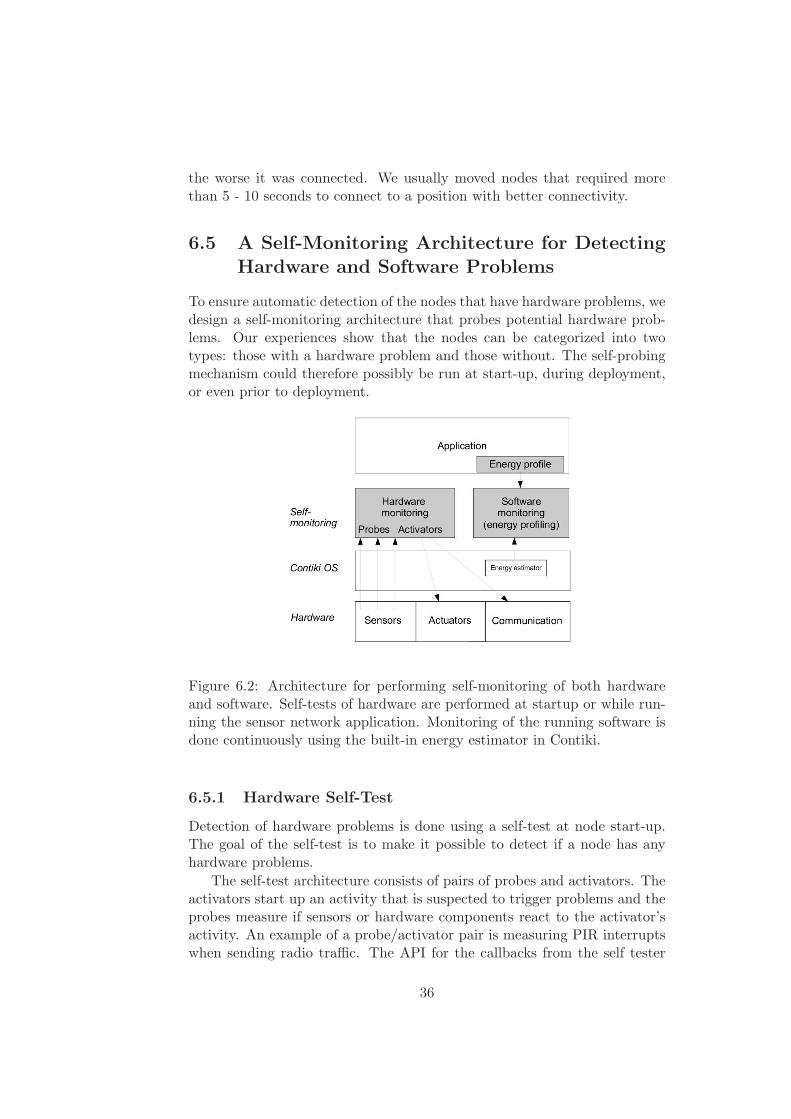
Figure 6.2: Architecture for performing self-monitoring of both hardwareand software. Self-tests of hardware are performed at startup or while run-ning the sensor network application. Monitoring of the running software isdone continuously using the built-in energy estimator in Contiki.
6.5.1 Hardware Self-Test
Detection of hardware problems is done using a self-test at node start-up.The goal of the self-test is to make it possible to detect if a node has anyhardware problems.
The self-test architecture consists of pairs of probes and activators. Theactivators start up an activity that is suspected to trigger problems and theprobes measure if sensors or hardware components react to the activator’sactivity. An example of a probe/activator pair is measuring PIR interruptswhen sending radio traffic. The API for the callbacks from the self tester
36
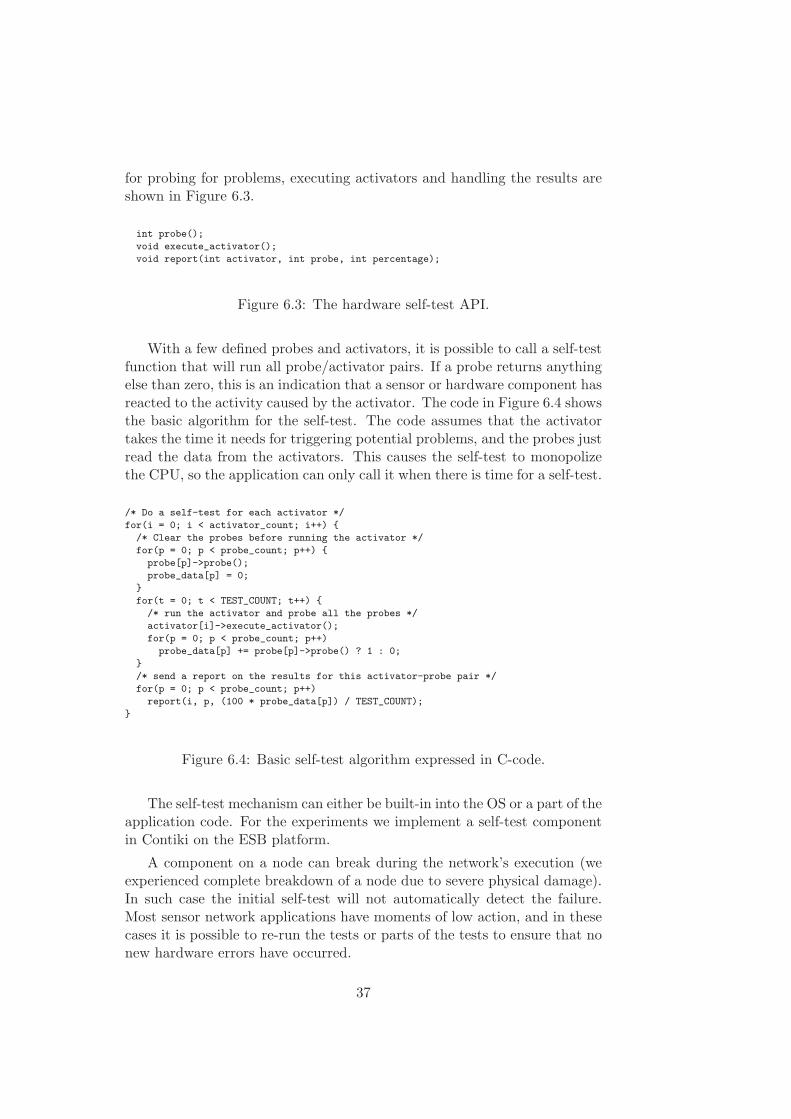
for probing for problems, executing activators and handling the results areshown in Figure 6.3.
int probe();
void execute_activator();
void report(int activator, int probe, int percentage);
Figure 6.3: The hardware self-test API.
With a few defined probes and activators, it is possible to call a self-testfunction that will run all probe/activator pairs. If a probe returns anythingelse than zero, this is an indication that a sensor or hardware component hasreacted to the activity caused by the activator. The code in Figure 6.4 showsthe basic algorithm for the self-test. The code assumes that the activatortakes the time it needs for triggering potential problems, and the probes justread the data from the activators. This causes the self-test to monopolizethe CPU, so the application can only call it when there is time for a self-test.
/* Do a self-test for each activator */
for(i = 0; i < activator_count; i++) {
/* Clear the probes before running the activator */
for(p = 0; p < probe_count; p++) {
probe[p]->probe();
probe_data[p] = 0;
}
for(t = 0; t < TEST_COUNT; t++) {
/* run the activator and probe all the probes */
activator[i]->execute_activator();
for(p = 0; p < probe_count; p++)
probe_data[p] += probe[p]->probe() ? 1 : 0;
}
/* send a report on the results for this activator-probe pair */
for(p = 0; p < probe_count; p++)
report(i, p, (100 * probe_data[p]) / TEST_COUNT);
}
Figure 6.4: Basic self-test algorithm expressed in C-code.
The self-test mechanism can either be built-in into the OS or a part of theapplication code. For the experiments we implement a self-test componentin Contiki on the ESB platform.
A component on a node can break during the network’s execution (weexperienced complete breakdown of a node due to severe physical damage).In such case the initial self-test will not automatically detect the failure.Most sensor network applications have moments of low action, and in thesecases it is possible to re-run the tests or parts of the tests to ensure that nonew hardware errors have occurred.
37
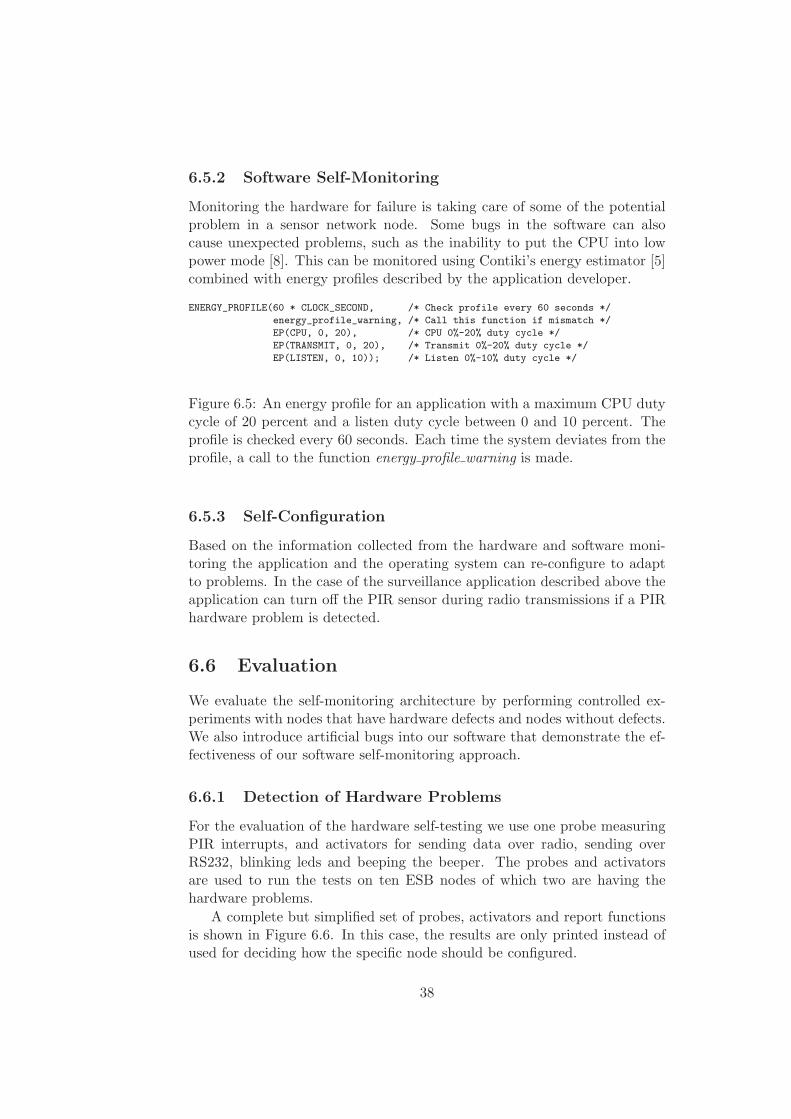
6.5.2 Software Self-Monitoring
Monitoring the hardware for failure is taking care of some of the potentialproblem in a sensor network node. Some bugs in the software can alsocause unexpected problems, such as the inability to put the CPU into lowpower mode [8]. This can be monitored using Contiki’s energy estimator [5]combined with energy profiles described by the application developer.
ENERGY_PROFILE(60 * CLOCK_SECOND, /* Check profile every 60 seconds */
energy_profile_warning, /* Call this function if mismatch */
EP(CPU, 0, 20), /* CPU 0%-20% duty cycle */
EP(TRANSMIT, 0, 20), /* Transmit 0%-20% duty cycle */
EP(LISTEN, 0, 10)); /* Listen 0%-10% duty cycle */
Figure 6.5: An energy profile for an application with a maximum CPU dutycycle of 20 percent and a listen duty cycle between 0 and 10 percent. Theprofile is checked every 60 seconds. Each time the system deviates from theprofile, a call to the function energy profile warning is made.
6.5.3 Self-Configuration
Based on the information collected from the hardware and software moni-toring the application and the operating system can re-configure to adaptto problems. In the case of the surveillance application described above theapplication can turn off the PIR sensor during radio transmissions if a PIRhardware problem is detected.
6.6 Evaluation
We evaluate the self-monitoring architecture by performing controlled ex-periments with nodes that have hardware defects and nodes without defects.We also introduce artificial bugs into our software that demonstrate the ef-fectiveness of our software self-monitoring approach.
6.6.1 Detection of Hardware Problems
For the evaluation of the hardware self-testing we use one probe measuringPIR interrupts, and activators for sending data over radio, sending overRS232, blinking leds and beeping the beeper. The probes and activatorsare used to run the tests on ten ESB nodes of which two are having thehardware problems.
A complete but simplified set of probes, activators and report functionsis shown in Figure 6.6. In this case, the results are only printed instead ofused for deciding how the specific node should be configured.
38
/* A basic PIR sensor probe */
static int probe_pir(void) {
static unsigned int lastpir;
unsigned int value = lastpir;
lastpir = (unsigned int) pir_sensor.value(0);
return lastpir - value;
}
/* A basic activator for sending data over radio */
static void activator_send(void) {
/* send packet */
rimebuf_copyfrom(PACKET_DATA, sizeof(PACKET_DATA));
abc_send(&abc);
}
/* Print out the report */
static void report(int activator, int probe, int trigged_percent) {
printf("Activator %u Probe %u: %u%%\n", activator, probe, trigged_percent);
}
Figure 6.6: A complete set of callback functions for a self test of radiotriggered PIR sensor.
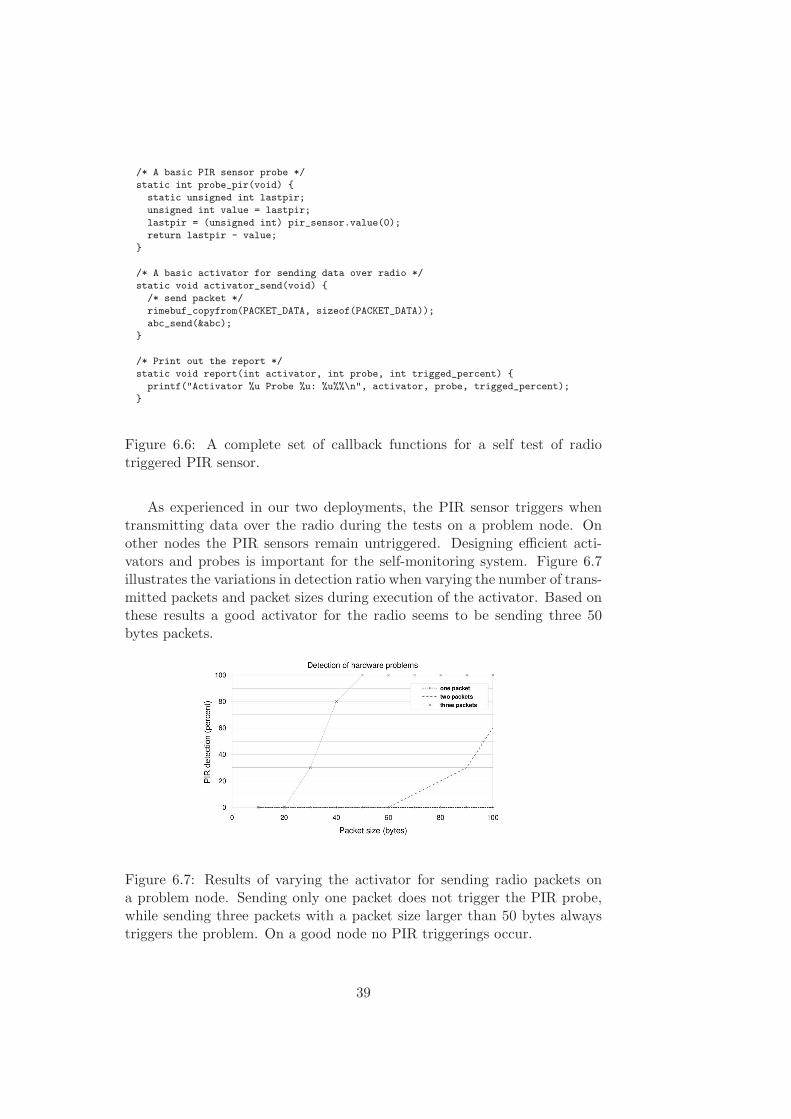
As experienced in our two deployments, the PIR sensor triggers whentransmitting data over the radio during the tests on a problem node. Onother nodes the PIR sensors remain untriggered. Designing efficient acti-vators and probes is important for the self-monitoring system. Figure 6.7illustrates the variations in detection ratio when varying the number of trans-mitted packets and packet sizes during execution of the activator. Based onthese results a good activator for the radio seems to be sending three 50bytes packets.
Figure 6.7: Results of varying the activator for sending radio packets ona problem node. Sending only one packet does not trigger the PIR probe,while sending three packets with a packet size larger than 50 bytes alwaystriggers the problem. On a good node no PIR triggerings occur.
39
6.6.2 Detection of Software and Configuration Problems
Some of the problems encountered during development and deployment ofsensor network software are related to minor software bugs and misconfigu-rations that decrease the lifetime of the network [8]. Bugs such as missingto power down a sensor or the radio chip when going into sleep mode, ora missed frequency divisor and therefore higher sample rate in an interruptdriven A/D based sensor can decrease the network’s expected lifetime. Weexplicitly create two software problems causing this type of behavior.
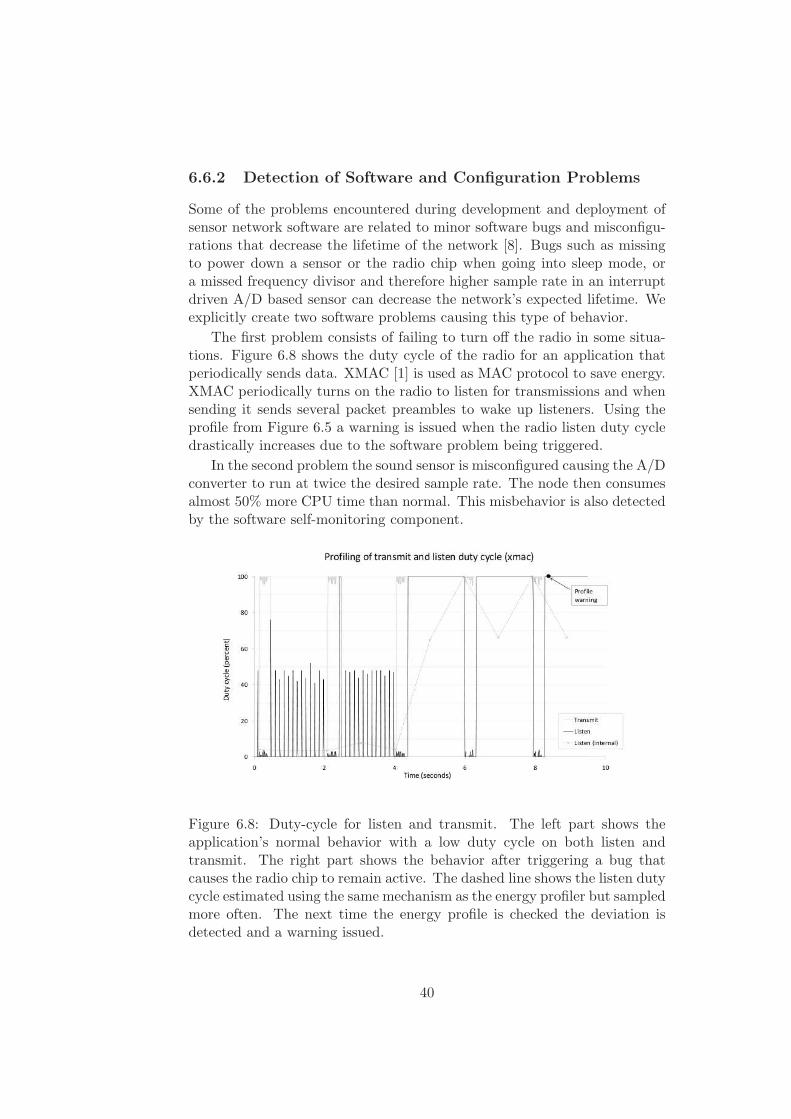
The first problem consists of failing to turn off the radio in some situa-tions. Figure 6.8 shows the duty cycle of the radio for an application thatperiodically sends data. XMAC [1] is used as MAC protocol to save energy.XMAC periodically turns on the radio to listen for transmissions and whensending it sends several packet preambles to wake up listeners. Using theprofile from Figure 6.5 a warning is issued when the radio listen duty cycledrastically increases due to the software problem being triggered.
In the second problem the sound sensor is misconfigured causing the A/Dconverter to run at twice the desired sample rate. The node then consumesalmost 50% more CPU time than normal. This misbehavior is also detectedby the software self-monitoring component.
Figure 6.8: Duty-cycle for listen and transmit. The left part shows theapplication’s normal behavior with a low duty cycle on both listen andtransmit. The right part shows the behavior after triggering a bug thatcauses the radio chip to remain active. The dashed line shows the listen dutycycle estimated using the same mechanism as the energy profiler but sampledmore often. The next time the energy profile is checked the deviation isdetected and a warning issued.
40
6.7 Related Work
During recent years several wireless sensor networks have been deployed themost prominent being probably the one on Great Duck Island [9]. Otherefforts include glacier [11] and water quality monitoring [2]. For an overviewon wireless sensor network deployments, see Romer and Mattern [13].
Despite efforts to increase adaptiveness and self-configurationin wirelesssensor networks [10, 12, 16], sensor network deployments still encountersevere problems: Werner-Allen et al. have deployed a sensor network tomonitor a volcano in South America [15]. They encountered several bugs inTinyOS after the deployment. For example, one bug caused a three day out-age of the entire network, other bugs made nodes lose time synchronization.We have already mentioned the project by Langendoen that encountered se-vere problems [8]. Further examples include a surveillance application called“A line in the sand” [6] where some nodes would detect false events exhaust-ing their batteries early and Lakshman et al.’s network that included nodeswith a hardware problem that caused highly spatially correlated failures [7].Our work has revealed additional insights such as a subset of nodes having aspecific hardware problem where packet transmissions triggered the motiondetector.
6.8 Conclusions
In this paper we have reported results and experiences from two sensor net-work surveillance deployments. Based on our experiences we have designed,implemented and evaluated an architecture for detecting both hardware andsoftware problems. The evaluation demonstrates that our architecture de-tects and handles hardware problems we experienced and software problemsexperienced during deployments of other researchers.
Acknowledgments
This work was funded by the Swedish Defence Materiel Administration andthe Swedish Agency for Innovation Systems, VINNOVA.
41

42
Bibliography
[1] Michael Buettner, Gary V. Yee, Eric Anderson, and Richard Han. X-mac: a short preamble mac protocol for duty-cycled wireless sensornetworks. In ACM SenSys, November 2006.
[2] T.L. Dinh, W. Hu, P. Sikka, P. Corke, L. Overs, and S. Brosnan. Designand Deployment of a Remote Robust Sensor Network: Experiences froman Outdoor Water Quality Monitoring Network. IEEE Congf. on LocalComputer Networks, pages 799–806, 2007.
[3] A. Dunkels. Full TCP/IP for 8-bit architectures. In Proceedings of TheFirst International Conference on Mobile Systems, Applications, andServices (MOBISYS ‘03), May 2003.
[4] A. Dunkels, B. Gronvall, and T. Voigt. Contiki - a lightweight andflexible operating system for tiny networked sensors. In Workshop onEmbedded Networked Sensors, Tampa, Florida, USA, November 2004.
[5] Adam Dunkels, Fredrik Osterlind, Nicolas Tsiftes, and Zhitao He.Software-based on-line energy estimation for sensor nodes. In EmNets’07: Proceedings of the 4th workshop on Embedded networked sensors,pages 28–32, 2007.
[6] Anish Arora et al. A line in the sand: a wireless sensor networkfor target detection, classification, and tracking. Computer Networks,46(5):605–634, 2004.
[7] L. Krishnamurthy, R. Adler, P. Buonadonna, J. Chhabra, M. Flanigan,N. Kushalnagar, L. Nachman, and M. Yarvis. Design and deploymentof industrial sensor networks: experiences from a semiconductor plantand the north sea. In ACM SenSys, pages 64–75, 2005.
[8] K. Langendoen, A. Baggio, and O. Visser. Murphy loves potatoes: ex-periences from a pilot sensor network deployment in precision agricul-ture. In Proceedings of the 20th International Parallel and DistributedProcessing Symposium (IPDPS 2006), Rhodes Island, Greece, April2006. IEEE.
43
[9] A. Mainwaring, J. Polastre, R. Szewczyk, D. Culler, and J. Anderson.Wireless sensor networks for habitat monitoring. In First ACM Work-shop on Wireless Sensor Networks and Applications (WSNA 2002),Atlanta, GA, USA, September 2002.
[10] PJ Marron, A. Lachenmann, D. Minder, J. Hahner, R. Sauter, andK. Rothermel. TinyCubus: a flexible and adaptive framework sensornetworks. EWSN 2005.
[11] P. Padhy, K. K. Martinez, A. Riddoch, H. Ong, and J. Hart. Glacial en-vironment monitoring using sensor networks. In Proc. of the Workshopon Real-World Wireless Sensor Networks (REALWSN’05), Stockholm,Sweden, June 2005.
[12] I. Rhee, A. Warrier, M. Aia, and J. Min. Z-MAC: a hybrid MAC forwireless sensor networks. ACM SenSys, pages 90–101, 2005.
[13] K. Romer and F. Mattern. The design space of wireless sensor networks.IEEE Wireless Communications, 11(6):54–61, December 2004.
[14] J. Schiller, H. Ritter, A. Liers, and T. Voigt. Scatterweb - low powernodes and energy aware routing. In Proceedings of Hawaii InternationalConference on System Sciences, Hawaii, USA, 2005.
[15] Geoff Werner-Allen, Konrad Lorincz, Jeff Johnson, Jonathan Lees, andMatt Welsh. Fidelity and yield in a volcano monitoring sensor net-work. In Symposium on Operating Systems Design and Implementation(OSDI), Seattle, USA, 2006.
[16] A. Woo, T. Tong, and D. Culler. Taming the underlying challengesof reliable multihop routing in sensor networks. ACM SenSys, pages14–27, 2003.
44
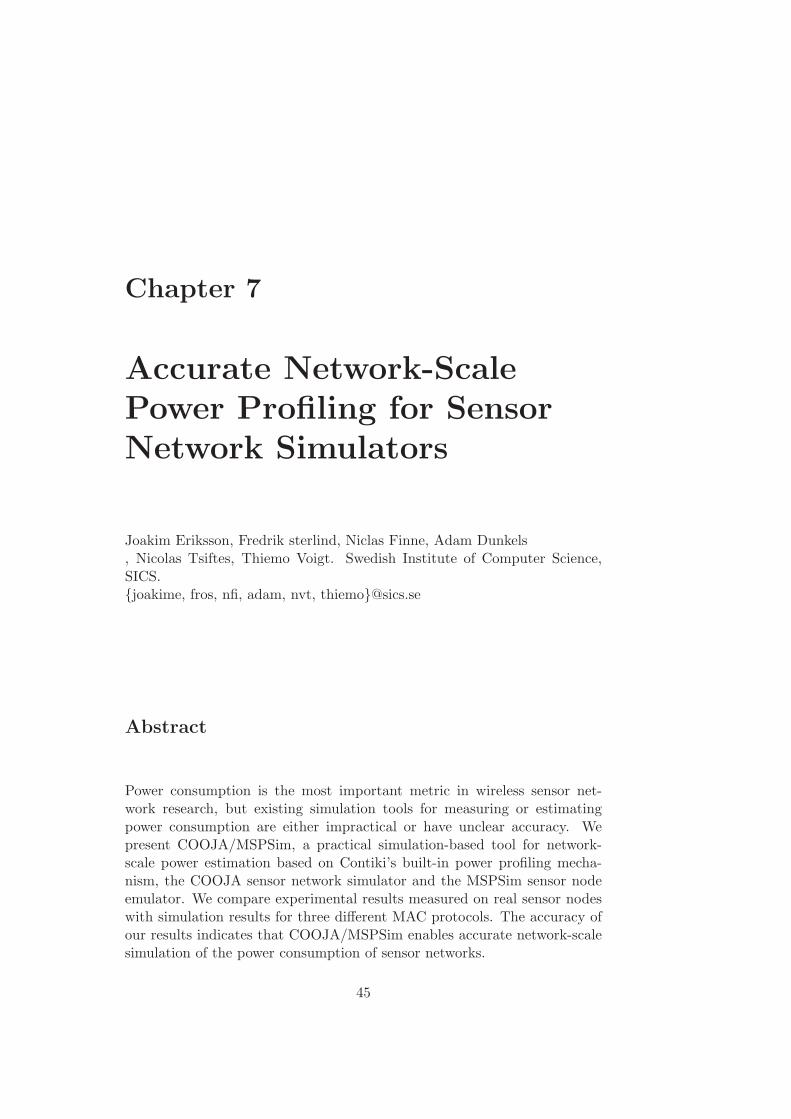
Chapter 7
Accurate Network-ScalePower Profiling for SensorNetwork Simulators
Joakim Eriksson, Fredrik sterlind, Niclas Finne, Adam Dunkels, Nicolas Tsiftes, Thiemo Voigt. Swedish Institute of Computer Science,SICS.{joakime, fros, nfi, adam, nvt, thiemo}@sics.se
Abstract
Power consumption is the most important metric in wireless sensor net-work research, but existing simulation tools for measuring or estimatingpower consumption are either impractical or have unclear accuracy. Wepresent COOJA/MSPSim, a practical simulation-based tool for network-scale power estimation based on Contiki’s built-in power profiling mecha-nism, the COOJA sensor network simulator and the MSPSim sensor nodeemulator. We compare experimental results measured on real sensor nodeswith simulation results for three different MAC protocols. The accuracy ofour results indicates that COOJA/MSPSim enables accurate network-scalesimulation of the power consumption of sensor networks.
45
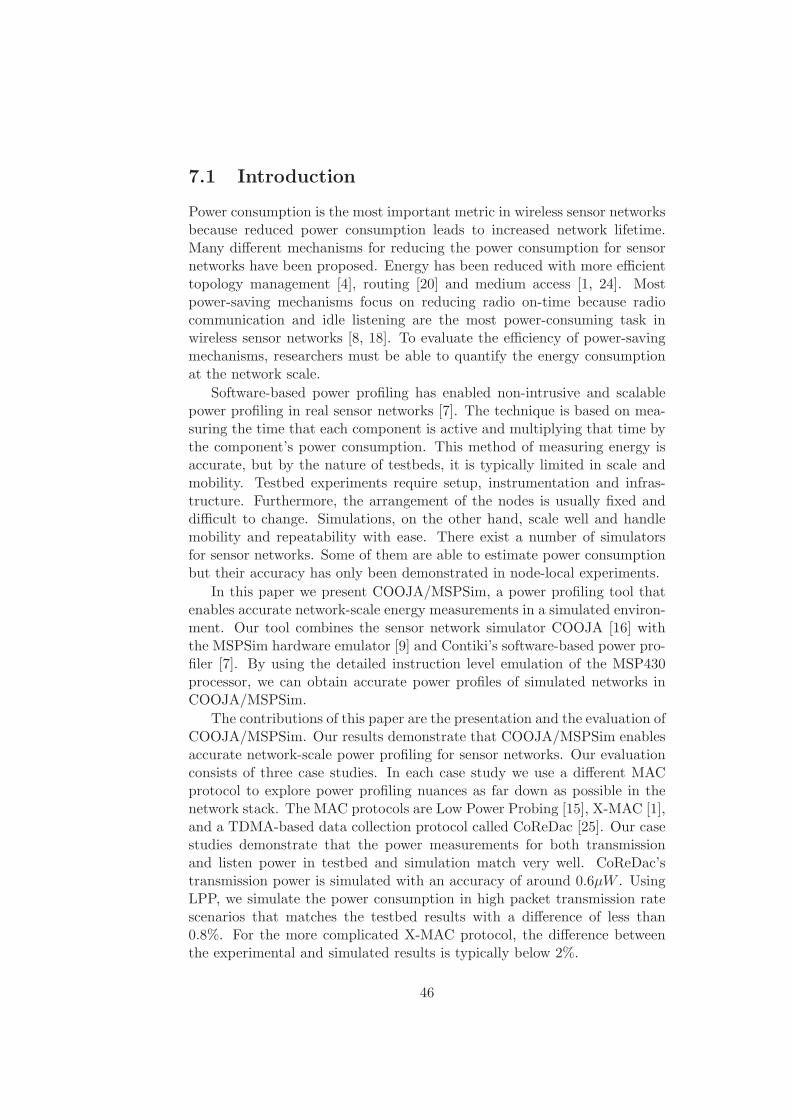
7.1 Introduction
Power consumption is the most important metric in wireless sensor networksbecause reduced power consumption leads to increased network lifetime.Many different mechanisms for reducing the power consumption for sensornetworks have been proposed. Energy has been reduced with more efficienttopology management [4], routing [20] and medium access [1, 24]. Mostpower-saving mechanisms focus on reducing radio on-time because radiocommunication and idle listening are the most power-consuming task inwireless sensor networks [8, 18]. To evaluate the efficiency of power-savingmechanisms, researchers must be able to quantify the energy consumptionat the network scale.
Software-based power profiling has enabled non-intrusive and scalablepower profiling in real sensor networks [7]. The technique is based on mea-suring the time that each component is active and multiplying that time bythe component’s power consumption. This method of measuring energy isaccurate, but by the nature of testbeds, it is typically limited in scale andmobility. Testbed experiments require setup, instrumentation and infras-tructure. Furthermore, the arrangement of the nodes is usually fixed anddifficult to change. Simulations, on the other hand, scale well and handlemobility and repeatability with ease. There exist a number of simulatorsfor sensor networks. Some of them are able to estimate power consumptionbut their accuracy has only been demonstrated in node-local experiments.
In this paper we present COOJA/MSPSim, a power profiling tool thatenables accurate network-scale energy measurements in a simulated environ-ment. Our tool combines the sensor network simulator COOJA [16] withthe MSPSim hardware emulator [9] and Contiki’s software-based power pro-filer [7]. By using the detailed instruction level emulation of the MSP430processor, we can obtain accurate power profiles of simulated networks inCOOJA/MSPSim.
The contributions of this paper are the presentation and the evaluation ofCOOJA/MSPSim. Our results demonstrate that COOJA/MSPSim enablesaccurate network-scale power profiling for sensor networks. Our evaluationconsists of three case studies. In each case study we use a different MACprotocol to explore power profiling nuances as far down as possible in thenetwork stack. The MAC protocols are Low Power Probing [15], X-MAC [1],and a TDMA-based data collection protocol called CoReDac [25]. Our casestudies demonstrate that the power measurements for both transmissionand listen power in testbed and simulation match very well. CoReDac’stransmission power is simulated with an accuracy of around 0.6µW . UsingLPP, we simulate the power consumption in high packet transmission ratescenarios that matches the testbed results with a difference of less than0.8%. For the more complicated X-MAC protocol, the difference betweenthe experimental and simulated results is typically below 2%.
46
The remainder of this paper is outlined as follows. We explore relatedwork in Section 7.2. Then we describe our tool for network-scale powerprofiling in Section 7.3. In Section 7.4 we experimentally evaluate the accu-racy of COOJA/MSPSim through a set of case studies with different MACprotocols. Section 7.5 concludes our work.
7.2 Related Work
There are many sensor network simulators with energy estimation abili-ties [12, 13, 21], but their accuracy has only been demonstrated in node-local experiments. Avrora [22] is a machine code level simulator similar toMSPSim. While it offers a cycle-accurate simulation of AVR-based nodes,it does not have a power profiler. For this purpose, Landsiedel et al. havecreated the power analyzer AEON [12] on top of Avrora. AEON is limitedto TinyOS, however. Furthermore, the authors do not compare simulationwith testbed results for multi-hop applications. In contrast, our work isaimed at power profiling at a network scale.
PowerTOSSIM [21] is an extension of TOSSIM [13] designed to estimatethe power consumption of Mica2 sensor nodes. Since TOSSIM operatesat the operating system level, its granularity with respect to timing andinterrupt properties is not sufficient when nodes interact [22]. Our measure-ments of the radio power consumption show that a very detailed model of thenode is required to obtain accurate results. Trathnigg et al. [23] improvethe accuracy of PowerTOSSIM, but for a single node only. Colesanti etal. [5] evaluated the accuracy of a multi-node simulation using metrics suchas packets sent and received. They got inaccurate results and concludedthat a more sophisticated node model is required. By using emulated nodesin the simulation, COOJA/MSPSim uses a very detailed node model thatconsiderably improves the power measurement accuracy.
Haq and Kunz compare emulated testbed results with simulation resultsfor mobile ad-hoc network routing protocols [10]. While their results matchin low traffic scenarios, the results differ in scenarios with higher traffic rates.In contrast, COOJA/MSPSim maintains the accuracy in high traffic. Cavinet al. compare simulation results obtained with several simulators for mobilead-hoc networks [3]. They discovered large divergences for packet deliveryrates, latency and message overhead when simulating an intentionally simpleflooding algorithm in different scenarios.
Ivanov et al. show that after careful simulation parameter adjustment,NS-2 accurately models packet delivery ratios in a wireless mesh testbed [11].The parameter adjustment did not improve the accuracy regarding con-nectivity and packet latencies, however. COOJA/MSPSim allows accuratepower profiling of arbitrary nodes in the network, and is orthogonal to thatof an accurate radio model.
47
7.3 Simulation-based Network-scale Power Profil-ing
We develop COOJA/MSPSim for network-scale power estimation by com-bining three existing tools: Contiki’s power profiling [7], the COOJA sensornetwork simulator [16], and the MSPSim sensor node emulator [9].
7.3.1 Contiki Power Profiler
The built-in power profiler in Contiki estimates the power consumption ofsensor nodes in a real network. Thereby it enables scalable measurements ofthe power consumption. The power profiling mechanism measures the timethat hardware components spend in different operating modes. This datais then combined with detailed pre-measured data of power consumptionfor these components into power consumption estimations. This mechanismcan be implemented on most microprocessors with very small overhead.
7.3.2 COOJA
The other important component of our power profiling software is the COOJAsimulator, a Java-based sensor network simulator. COOJA has the abilityto mix simulations of sensor devices at multiple abstraction levels. Theselevels are application level, OS level, and hardware level. In the applicationlevel the simulated nodes run the application logic reimplemented in Java -the native language of COOJA. In the OS level the nodes use the same codeas real nodes, but compiled for the host machine running COOJA. Finally inthe hardware level the nodes run the same compiled code that can be usedin real nodes, e.g. the same system image. The hardware level is providedby MSPSim that emulates systems based on the MSP430 processor family.By using MSPSim underneath, COOJA allows simulated nodes to executethe same system image as the one used on the real nodes. The nodes atdifferent abstraction levels communicate with each other using one of thethree radio propagation models available in COOJA.
7.3.3 MSPSim
MSPSim is an instruction level emulator of MSP430-based sensor networknodes. MSPSim targets cycle accurate emulation of both the MSP430 CPUcore and built-in peripherals such as timers, serial communication and analogto digital converters. Furthermore, MSPSim emulates external componentssuch as the radio chip CC2420, sensors, and flash memories. MSPSim alsoprovides emulation of complete sensor devices such as the Tmote Sky [17]and Scatterweb ESB [19].
48
Plugin system
Simulation scheduler and control
COOJA Simulator Core
Radio Medium
...
User interface
COOJA/MSPSim sensor network simulator
CC
2420
CC
2420 MSPSim
Contiki OS
MSPSim
Contiki OSPower ProfilingPower Profiling
Figure 7.1: The architecture of the COOJA/MSPSim simulator. MSPSimis integrated into the COOJA simulator and Contiki’s built-in power profilerprovides estimation of power consumption.
7.3.4 A Network-Scale Power Profiler
We combine the three tools presented above into an accurate network-scalepower profiler. Figure 7.1 shows the integrated COOJA/MSPSim architec-ture with COOJA controlling MSPSim and the power profiler in Contikithat provides COOJA with the estimation of energy consumption. It alsoshows the sensor nodes’ radio communication via the emulated CC2420 andCOOJA’s radio medium simulation. Several improvements of the involvedtools are necessary to achieve an accurate power profiling. We ensure thatthe components emulated in MSPSim have the same timing as in real nodes.In addition, we integrate MSPSim more tightly with COOJA including amore fine-grained connection between the emulated nodes’ radio chips. Inorder to increase the power profiling accuracy we extend the timer emula-tion, and improve the timing precision of the SPI bus and the CC2420 radiotransmissions.
We estimate the power consumption on a network scale in COOJA us-ing Contiki’s built-in power profiling mechanism, and we run the Contikiapplication on emulated hardware using MSPSim. In this paper our simu-lations make use of hardware-emulation for all nodes since we need accuratepower profiling for the complete network. Hence, we benefit both fromCOOJA’s ability to simulate network behaviour and the on-line energy esti-mation in Contiki. Furthermore, MSPSim’s sophisticated and detailed nodemodel provides fine-grained timing and interrupt modeling which is impor-tant for the accuracy when estimating power consumption. Figure 7.2 shows
49
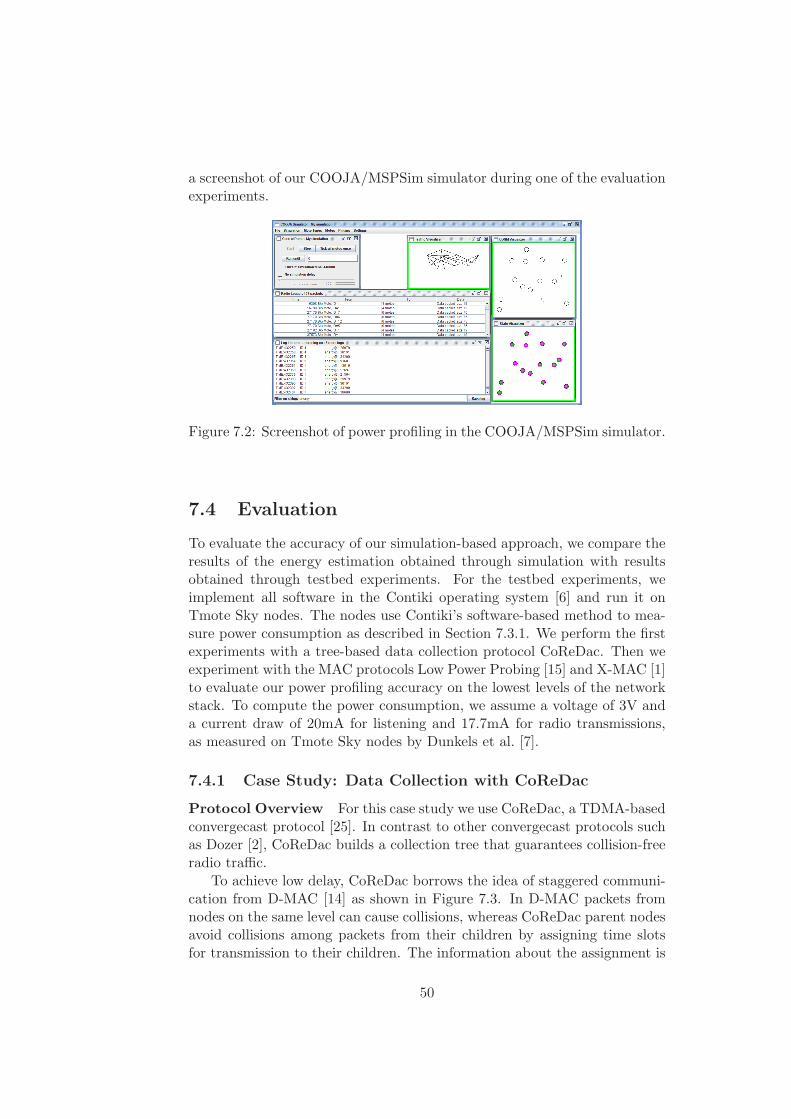
a screenshot of our COOJA/MSPSim simulator during one of the evaluationexperiments.
Figure 7.2: Screenshot of power profiling in the COOJA/MSPSim simulator.
7.4 Evaluation
To evaluate the accuracy of our simulation-based approach, we compare theresults of the energy estimation obtained through simulation with resultsobtained through testbed experiments. For the testbed experiments, weimplement all software in the Contiki operating system [6] and run it onTmote Sky nodes. The nodes use Contiki’s software-based method to mea-sure power consumption as described in Section 7.3.1. We perform the firstexperiments with a tree-based data collection protocol CoReDac. Then weexperiment with the MAC protocols Low Power Probing [15] and X-MAC [1]to evaluate our power profiling accuracy on the lowest levels of the networkstack. To compute the power consumption, we assume a voltage of 3V anda current draw of 20mA for listening and 17.7mA for radio transmissions,as measured on Tmote Sky nodes by Dunkels et al. [7].
7.4.1 Case Study: Data Collection with CoReDac
Protocol Overview For this case study we use CoReDac, a TDMA-basedconvergecast protocol [25]. In contrast to other convergecast protocols suchas Dozer [2], CoReDac builds a collection tree that guarantees collision-freeradio traffic.
To achieve low delay, CoReDac borrows the idea of staggered communi-cation from D-MAC [14] as shown in Figure 7.3. In D-MAC packets fromnodes on the same level can cause collisions, whereas CoReDac parent nodesavoid collisions among packets from their children by assigning time slotsfor transmission to their children. The information about the assignment is
50
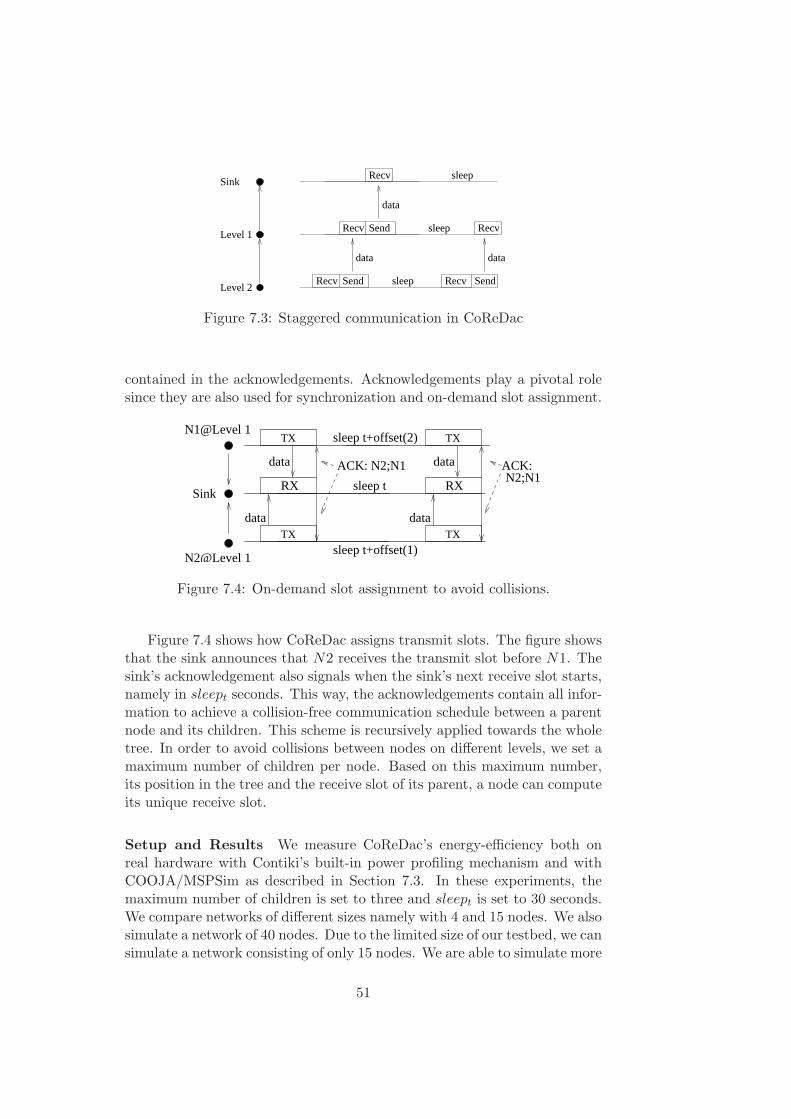
Recv Send
SendRecv
RecvSink
Level 1
Level 2
data
data
Recv Sendsleep
data
Recvsleep
sleep
Figure 7.3: Staggered communication in CoReDac
contained in the acknowledgements. Acknowledgements play a pivotal rolesince they are also used for synchronization and on-demand slot assignment.
data
data data
data
sleep t
ACK: N2;N1
sleep t+offset(2)
sleep t+offset(1)TX
TX
RX
TX
RX
TX
N2@Level 1
N1@Level 1
Sink
ACK:N2;N1
Figure 7.4: On-demand slot assignment to avoid collisions.
Figure 7.4 shows how CoReDac assigns transmit slots. The figure showsthat the sink announces that N2 receives the transmit slot before N1. Thesink’s acknowledgement also signals when the sink’s next receive slot starts,namely in sleept seconds. This way, the acknowledgements contain all infor-mation to achieve a collision-free communication schedule between a parentnode and its children. This scheme is recursively applied towards the wholetree. In order to avoid collisions between nodes on different levels, we set amaximum number of children per node. Based on this maximum number,its position in the tree and the receive slot of its parent, a node can computeits unique receive slot.
Setup and Results We measure CoReDac’s energy-efficiency both onreal hardware with Contiki’s built-in power profiling mechanism and withCOOJA/MSPSim as described in Section 7.3. In these experiments, themaximum number of children is set to three and sleept is set to 30 seconds.We compare networks of different sizes namely with 4 and 15 nodes. We alsosimulate a network of 40 nodes. Due to the limited size of our testbed, we cansimulate a network consisting of only 15 nodes. We are able to simulate more
51
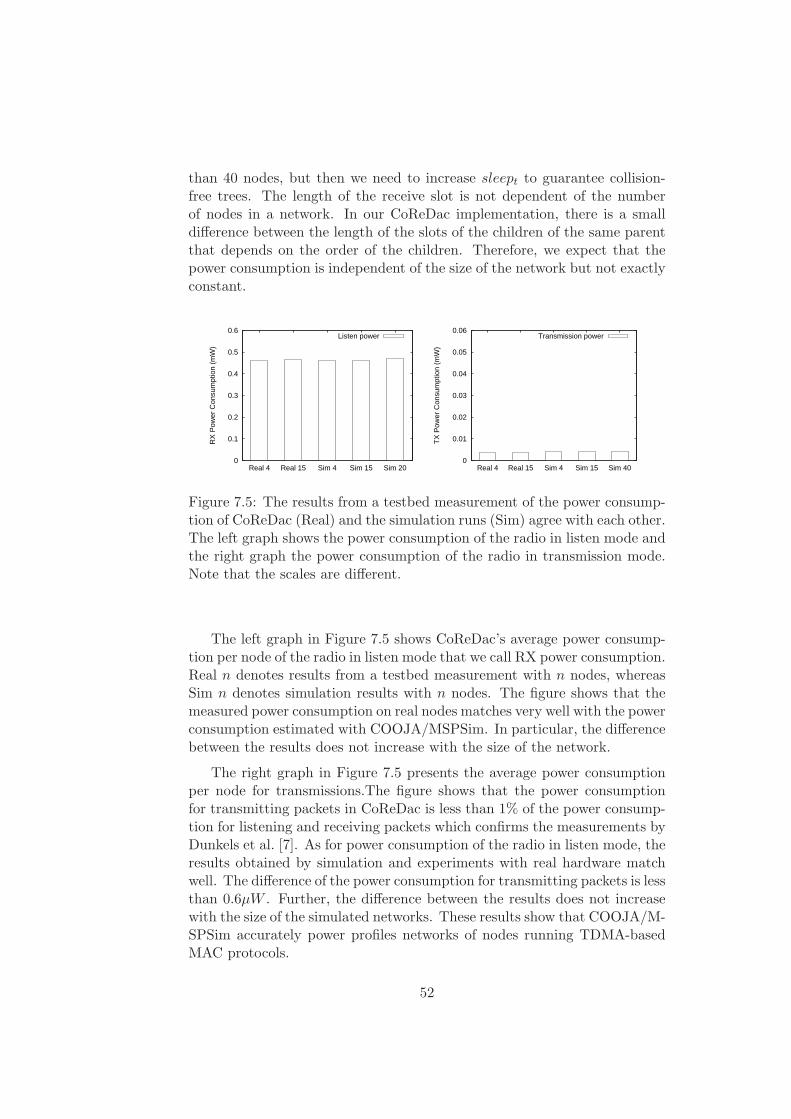
than 40 nodes, but then we need to increase sleept to guarantee collision-free trees. The length of the receive slot is not dependent of the numberof nodes in a network. In our CoReDac implementation, there is a smalldifference between the length of the slots of the children of the same parentthat depends on the order of the children. Therefore, we expect that thepower consumption is independent of the size of the network but not exactlyconstant.
0
0.1
0.2
0.3
0.4
0.5
0.6
Real 4 Real 15 Sim 4 Sim 15 Sim 20
RX
Pow
er C
onsu
mpt
ion
(mW
)
Listen power
0
0.01
0.02
0.03
0.04
0.05
0.06
Real 4 Real 15 Sim 4 Sim 15 Sim 40
TX
Pow
er C
onsu
mpt
ion
(mW
)
Transmission power
Figure 7.5: The results from a testbed measurement of the power consump-tion of CoReDac (Real) and the simulation runs (Sim) agree with each other.The left graph shows the power consumption of the radio in listen mode andthe right graph the power consumption of the radio in transmission mode.Note that the scales are different.
The left graph in Figure 7.5 shows CoReDac’s average power consump-tion per node of the radio in listen mode that we call RX power consumption.Real n denotes results from a testbed measurement with n nodes, whereasSim n denotes simulation results with n nodes. The figure shows that themeasured power consumption on real nodes matches very well with the powerconsumption estimated with COOJA/MSPSim. In particular, the differencebetween the results does not increase with the size of the network.
The right graph in Figure 7.5 presents the average power consumptionper node for transmissions.The figure shows that the power consumptionfor transmitting packets in CoReDac is less than 1% of the power consump-tion for listening and receiving packets which confirms the measurements byDunkels et al. [7]. As for power consumption of the radio in listen mode, theresults obtained by simulation and experiments with real hardware matchwell. The difference of the power consumption for transmitting packets is lessthan 0.6µW . Further, the difference between the results does not increasewith the size of the simulated networks. These results show that COOJA/M-SPSim accurately power profiles networks of nodes running TDMA-basedMAC protocols.
52
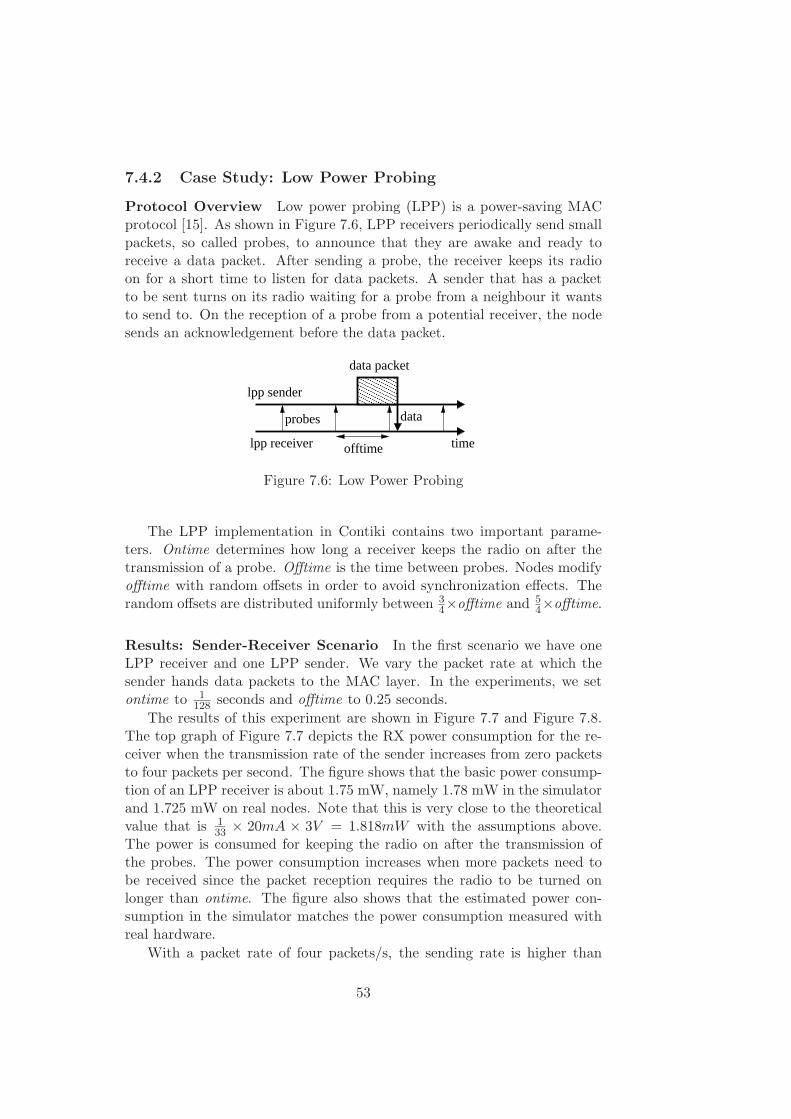
7.4.2 Case Study: Low Power Probing
Protocol Overview Low power probing (LPP) is a power-saving MACprotocol [15]. As shown in Figure 7.6, LPP receivers periodically send smallpackets, so called probes, to announce that they are awake and ready toreceive a data packet. After sending a probe, the receiver keeps its radioon for a short time to listen for data packets. A sender that has a packetto be sent turns on its radio waiting for a probe from a neighbour it wantsto send to. On the reception of a probe from a potential receiver, the nodesends an acknowledgement before the data packet.
������������
������������
offtime
lpp sender
lpp receiver
data packet
time
dataprobes
Figure 7.6: Low Power Probing
The LPP implementation in Contiki contains two important parame-ters. Ontime determines how long a receiver keeps the radio on after thetransmission of a probe. Offtime is the time between probes. Nodes modifyofftime with random offsets in order to avoid synchronization effects. Therandom offsets are distributed uniformly between 3
4×offtime and 5
4×offtime.
Results: Sender-Receiver Scenario In the first scenario we have oneLPP receiver and one LPP sender. We vary the packet rate at which thesender hands data packets to the MAC layer. In the experiments, we setontime to 1
128seconds and offtime to 0.25 seconds.
The results of this experiment are shown in Figure 7.7 and Figure 7.8.The top graph of Figure 7.7 depicts the RX power consumption for the re-ceiver when the transmission rate of the sender increases from zero packetsto four packets per second. The figure shows that the basic power consump-tion of an LPP receiver is about 1.75 mW, namely 1.78 mW in the simulatorand 1.725 mW on real nodes. Note that this is very close to the theoreticalvalue that is 1
33× 20mA × 3V = 1.818mW with the assumptions above.
The power is consumed for keeping the radio on after the transmission ofthe probes. The power consumption increases when more packets need tobe received since the packet reception requires the radio to be turned onlonger than ontime. The figure also shows that the estimated power con-sumption in the simulator matches the power consumption measured withreal hardware.
With a packet rate of four packets/s, the sending rate is higher than
53
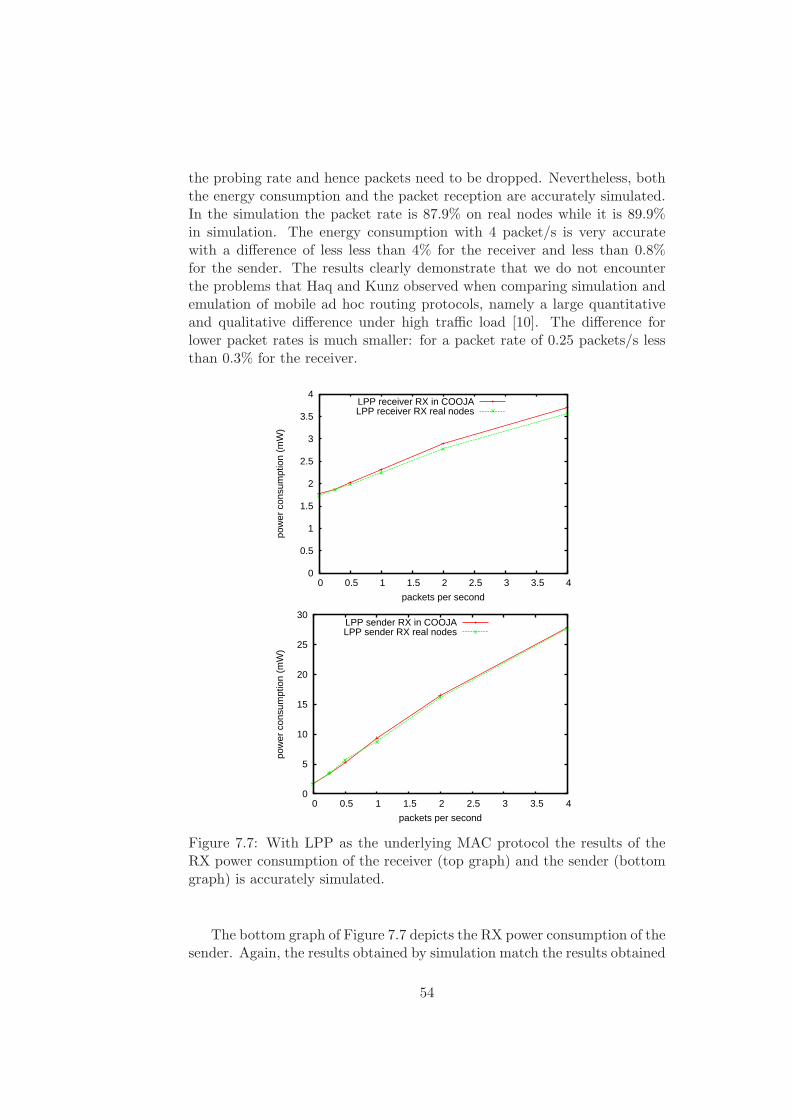
the probing rate and hence packets need to be dropped. Nevertheless, boththe energy consumption and the packet reception are accurately simulated.In the simulation the packet rate is 87.9% on real nodes while it is 89.9%in simulation. The energy consumption with 4 packet/s is very accuratewith a difference of less less than 4% for the receiver and less than 0.8%for the sender. The results clearly demonstrate that we do not encounterthe problems that Haq and Kunz observed when comparing simulation andemulation of mobile ad hoc routing protocols, namely a large quantitativeand qualitative difference under high traffic load [10]. The difference forlower packet rates is much smaller: for a packet rate of 0.25 packets/s lessthan 0.3% for the receiver.
0
0.5
1
1.5
2
2.5
3
3.5
4
0 0.5 1 1.5 2 2.5 3 3.5 4
pow
er c
onsu
mpt
ion
(mW
)
packets per second
LPP receiver RX in COOJALPP receiver RX real nodes
0
5
10
15
20
25
30
0 0.5 1 1.5 2 2.5 3 3.5 4
pow
er c
onsu
mpt
ion
(mW
)
packets per second
LPP sender RX in COOJALPP sender RX real nodes
Figure 7.7: With LPP as the underlying MAC protocol the results of theRX power consumption of the receiver (top graph) and the sender (bottomgraph) is accurately simulated.
The bottom graph of Figure 7.7 depicts the RX power consumption of thesender. Again, the results obtained by simulation match the results obtained
54
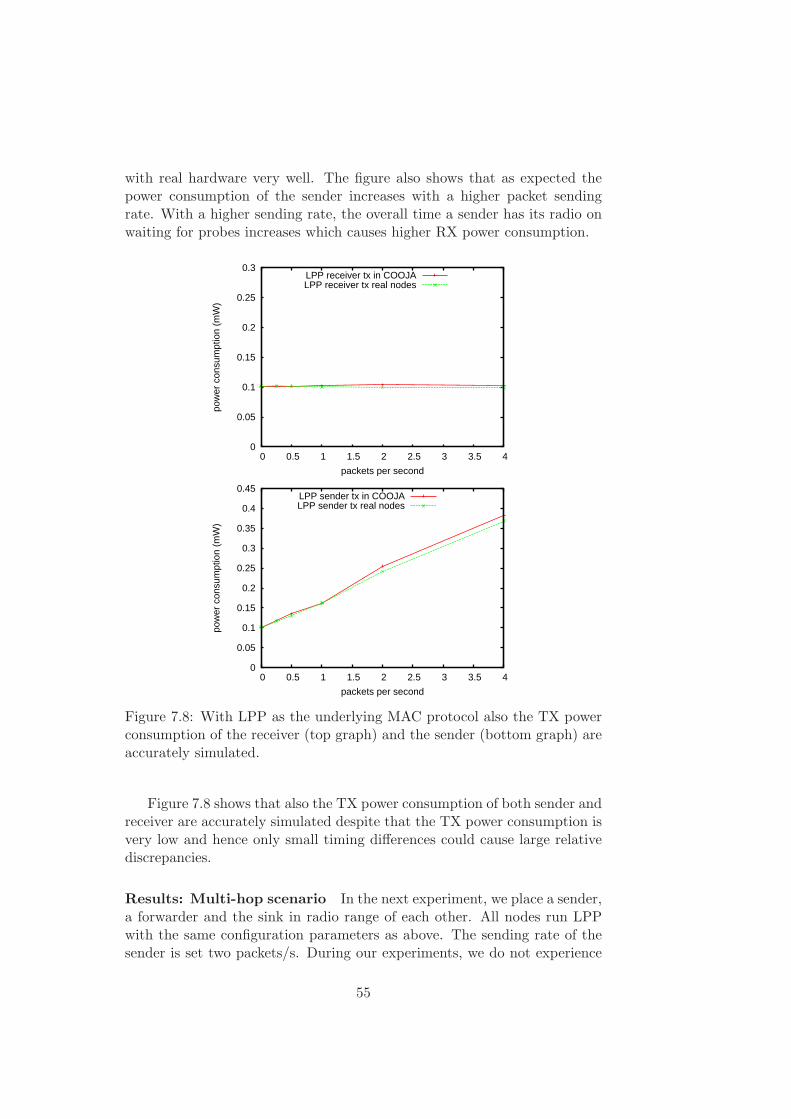
with real hardware very well. The figure also shows that as expected thepower consumption of the sender increases with a higher packet sendingrate. With a higher sending rate, the overall time a sender has its radio onwaiting for probes increases which causes higher RX power consumption.
0
0.05
0.1
0.15
0.2
0.25
0.3
0 0.5 1 1.5 2 2.5 3 3.5 4
pow
er c
onsu
mpt
ion
(mW
)
packets per second
LPP receiver tx in COOJALPP receiver tx real nodes
0
0.05
0.1
0.15
0.2
0.25
0.3
0.35
0.4
0.45
0 0.5 1 1.5 2 2.5 3 3.5 4
pow
er c
onsu
mpt
ion
(mW
)
packets per second
LPP sender tx in COOJALPP sender tx real nodes
Figure 7.8: With LPP as the underlying MAC protocol also the TX powerconsumption of the receiver (top graph) and the sender (bottom graph) areaccurately simulated.
Figure 7.8 shows that also the TX power consumption of both sender andreceiver are accurately simulated despite that the TX power consumption isvery low and hence only small timing differences could cause large relativediscrepancies.
Results: Multi-hop scenario In the next experiment, we place a sender,a forwarder and the sink in radio range of each other. All nodes run LPPwith the same configuration parameters as above. The sending rate of thesender is set two packets/s. During our experiments, we do not experience
55
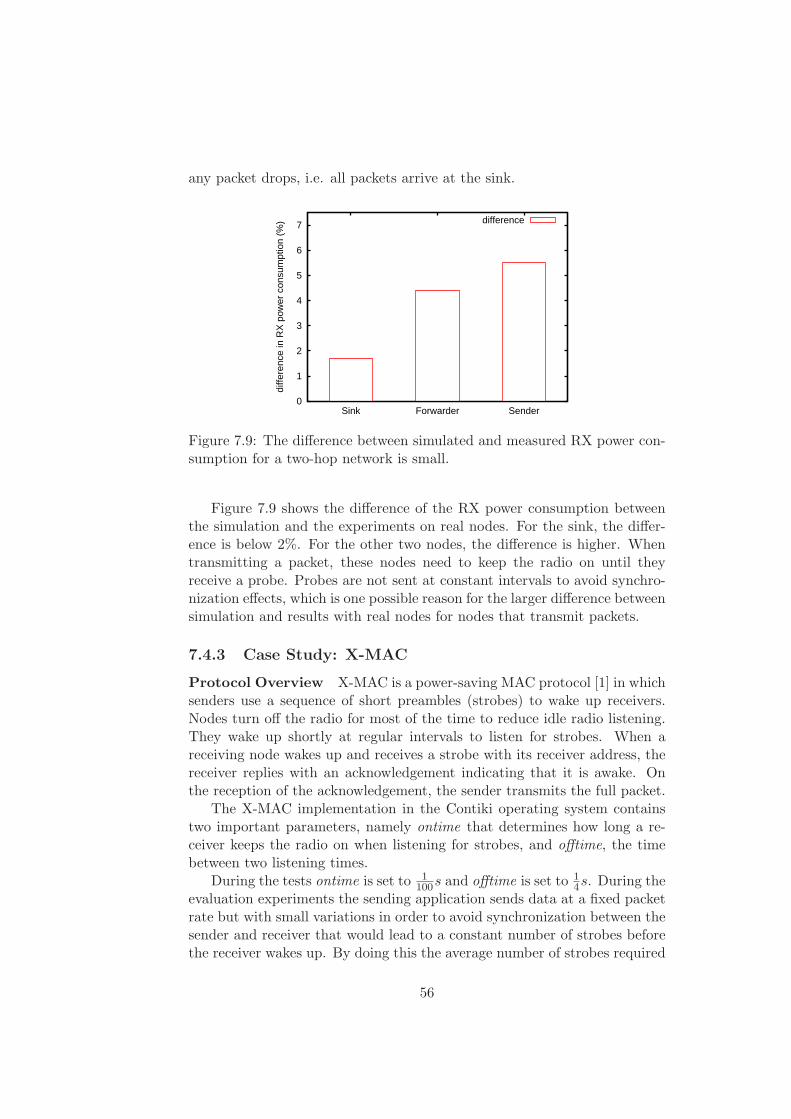
any packet drops, i.e. all packets arrive at the sink.
0
1
2
3
4
5
6
7
Sink Forwarder Sender
diffe
renc
e in
RX
pow
er c
onsu
mpt
ion
(%) difference
Figure 7.9: The difference between simulated and measured RX power con-sumption for a two-hop network is small.
Figure 7.9 shows the difference of the RX power consumption betweenthe simulation and the experiments on real nodes. For the sink, the differ-ence is below 2%. For the other two nodes, the difference is higher. Whentransmitting a packet, these nodes need to keep the radio on until theyreceive a probe. Probes are not sent at constant intervals to avoid synchro-nization effects, which is one possible reason for the larger difference betweensimulation and results with real nodes for nodes that transmit packets.
7.4.3 Case Study: X-MAC
Protocol Overview X-MAC is a power-saving MAC protocol [1] in whichsenders use a sequence of short preambles (strobes) to wake up receivers.Nodes turn off the radio for most of the time to reduce idle radio listening.They wake up shortly at regular intervals to listen for strobes. When areceiving node wakes up and receives a strobe with its receiver address, thereceiver replies with an acknowledgement indicating that it is awake. Onthe reception of the acknowledgement, the sender transmits the full packet.
The X-MAC implementation in the Contiki operating system containstwo important parameters, namely ontime that determines how long a re-ceiver keeps the radio on when listening for strobes, and offtime, the timebetween two listening times.
During the tests ontime is set to 1
100s and offtime is set to 1
4s. During the
evaluation experiments the sending application sends data at a fixed packetrate but with small variations in order to avoid synchronization between thesender and receiver that would lead to a constant number of strobes beforethe receiver wakes up. By doing this the average number of strobes required
56
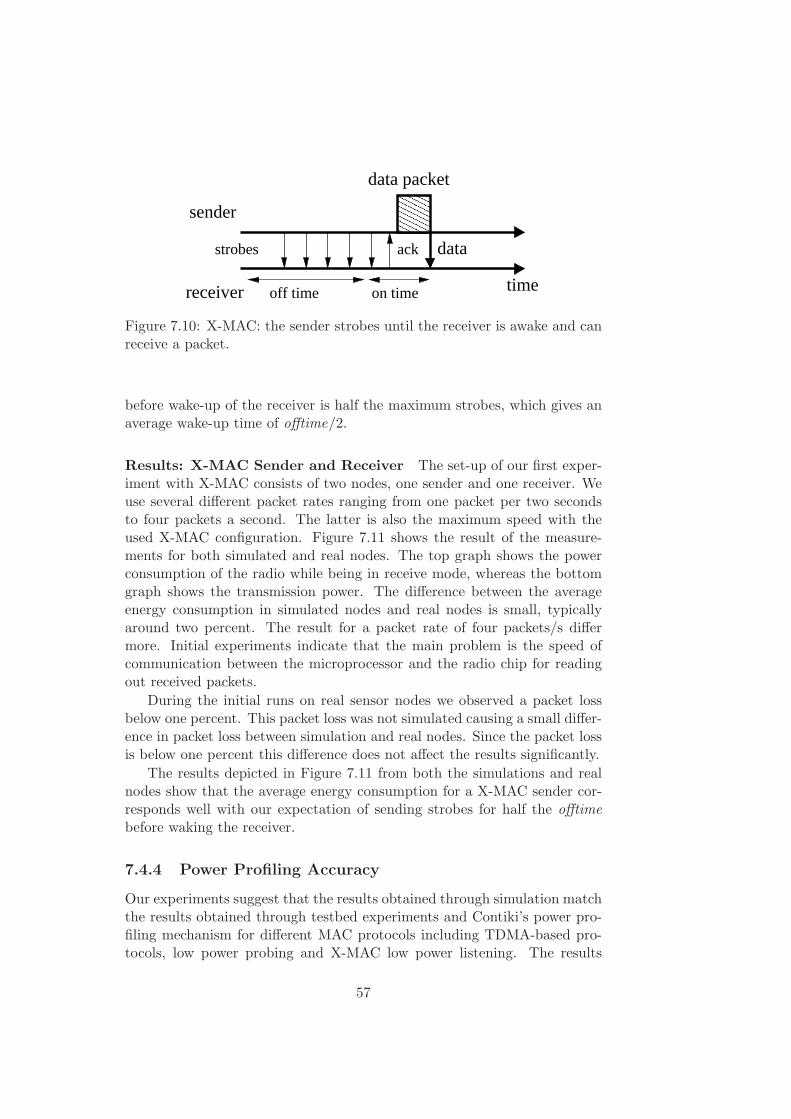
������������
������������
time
data packet
off time
strobes
receiver
sender
dataack
on time
Figure 7.10: X-MAC: the sender strobes until the receiver is awake and canreceive a packet.
before wake-up of the receiver is half the maximum strobes, which gives anaverage wake-up time of offtime/2.
Results: X-MAC Sender and Receiver The set-up of our first exper-iment with X-MAC consists of two nodes, one sender and one receiver. Weuse several different packet rates ranging from one packet per two secondsto four packets a second. The latter is also the maximum speed with theused X-MAC configuration. Figure 7.11 shows the result of the measure-ments for both simulated and real nodes. The top graph shows the powerconsumption of the radio while being in receive mode, whereas the bottomgraph shows the transmission power. The difference between the averageenergy consumption in simulated nodes and real nodes is small, typicallyaround two percent. The result for a packet rate of four packets/s differmore. Initial experiments indicate that the main problem is the speed ofcommunication between the microprocessor and the radio chip for readingout received packets.
During the initial runs on real sensor nodes we observed a packet lossbelow one percent. This packet loss was not simulated causing a small differ-ence in packet loss between simulation and real nodes. Since the packet lossis below one percent this difference does not affect the results significantly.
The results depicted in Figure 7.11 from both the simulations and realnodes show that the average energy consumption for a X-MAC sender cor-responds well with our expectation of sending strobes for half the offtimebefore waking the receiver.
7.4.4 Power Profiling Accuracy
Our experiments suggest that the results obtained through simulation matchthe results obtained through testbed experiments and Contiki’s power pro-filing mechanism for different MAC protocols including TDMA-based pro-tocols, low power probing and X-MAC low power listening. The results
57
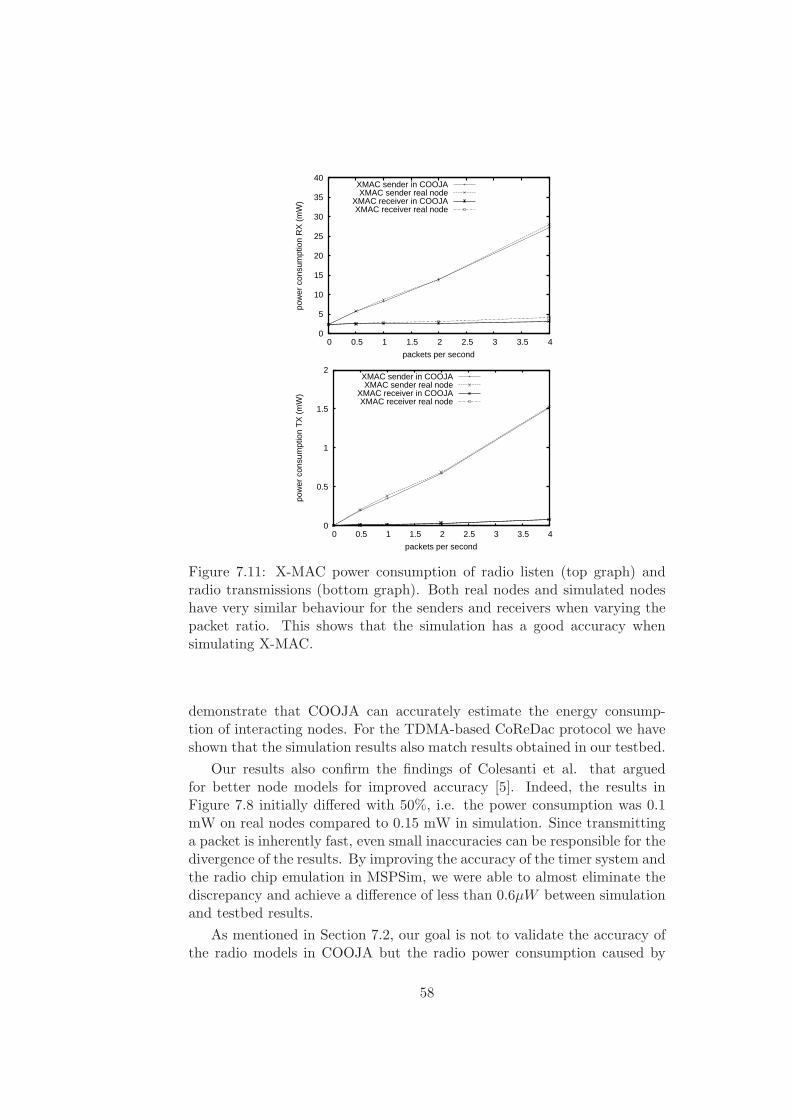
0
5
10
15
20
25
30
35
40
0 0.5 1 1.5 2 2.5 3 3.5 4
pow
er c
onsu
mpt
ion
RX
(m
W)
packets per second
XMAC sender in COOJAXMAC sender real node
XMAC receiver in COOJAXMAC receiver real node
0
0.5
1
1.5
2
0 0.5 1 1.5 2 2.5 3 3.5 4
pow
er c
onsu
mpt
ion
TX
(m
W)
packets per second
XMAC sender in COOJAXMAC sender real node
XMAC receiver in COOJAXMAC receiver real node
Figure 7.11: X-MAC power consumption of radio listen (top graph) andradio transmissions (bottom graph). Both real nodes and simulated nodeshave very similar behaviour for the senders and receivers when varying thepacket ratio. This shows that the simulation has a good accuracy whensimulating X-MAC.
demonstrate that COOJA can accurately estimate the energy consump-tion of interacting nodes. For the TDMA-based CoReDac protocol we haveshown that the simulation results also match results obtained in our testbed.
Our results also confirm the findings of Colesanti et al. that arguedfor better node models for improved accuracy [5]. Indeed, the results inFigure 7.8 initially differed with 50%, i.e. the power consumption was 0.1mW on real nodes compared to 0.15 mW in simulation. Since transmittinga packet is inherently fast, even small inaccuracies can be responsible for thedivergence of the results. By improving the accuracy of the timer system andthe radio chip emulation in MSPSim, we were able to almost eliminate thediscrepancy and achieve a difference of less than 0.6µW between simulationand testbed results.
As mentioned in Section 7.2, our goal is not to validate the accuracy ofthe radio models in COOJA but the radio power consumption caused by
58
the interaction of nodes. The TDMA-based CoReDac protocol is collision-free by design and hence there are no collisions between nodes after theinitialization phase. Therefore, we were able to validate CoReDac’s sim-ulated power consumption also in the testbed. For LPP and X-MAC theactual power consumption depends very much on the delivery rate, the riskof packet collisions and other factors that are influenced by the environ-ment. Therefore, we have constrained ourselves to demonstrate COOJA’sability to accurately simulate behaviour that relies on fine-grained timingand interrupts when nodes interact. Nevertheless, our results indicate thatwhen appropriately modeling the surroundings, COOJA enables accuratesimulation of the power consumption of large-scale sensor networks.
7.5 Conclusions
In this paper we have presented COOJA/MSPSim, a tool for simulation-based network-scale power profiling that combines Contiki’s on-line powerprofiling mechanism, the COOJA sensor network simulator and the MSPSimsensor node emulator. We have shown that the results obtained with COO-JA/MSPSim correspond well with the results obtained through measure-ments on real hardware. Our results demonstrate that COOJA/MSPSimenables accurate simulation of the power consumption of sensor networks.
Acknowledgements
This work was financed by VINNOVA, the Swedish Agency for InnovationSystems, and the Uppsala VINN Excellence Center for Wireless Sensor Net-works WISENET, also partly funded by VINNOVA. This work has beenpartially supported by CONET, the Cooperating Objects Network of Ex-cellence, funded by the European Commission under FP7 with contractnumber FP7-2007-2-224053.
59

60
Bibliography
[1] M. Buettner, G. V. Yee, E. Anderson, and R. Han. X-MAC: a shortpreamble MAC protocol for duty-cycled wireless sensor networks. InSenSys ’06: Proceedings of the 4th international conference on Embed-ded networked sensor systems, pages 307–320, Boulder, Colorado, USA,2006.
[2] N. Burri, P. von Rickenbach, and R. Wattenhofer. Dozer: ultra-lowpower data gathering in sensor networks. In IPSN ’07, 2007.
[3] D. Cavin, Y. Sasson, and A. Schiper. On the accuracy of MANETsimulators. In Proceedings of the second ACM international workshopon Principles of mobile computing, Toulouse, France, 2002.
[4] A. Cerpa and D. Estrin. ASCENT: Adaptive Self-Configuring sEnsorNetworks Topologies. IEEE TRANSACTIONS ON MOBILE COM-PUTING, pages 272–285, 2004.
[5] U.M. Colesanti, C. Crociani, and A. Vitaletti. On the accuracy of om-net++ in the wireless sensornetworks domain: simulation vs. testbed.In Proceedings of the 4th ACM workshop on Performance evaluation ofwireless ad hoc, sensor, and ubiquitous networks, pages 25–31, Chania,Greece, October 2007.
[6] A. Dunkels, B. Gronvall, and T. Voigt. Contiki - a lightweight andflexible operating system for tiny networked sensors. In Workshop onEmbedded Networked Sensors, Tampa, Florida, USA, November 2004.
[7] A. Dunkels, F. Osterlind, N. Tsiftes, and Z. He. Software-based on-line energy estimation for sensor nodes. In Proceedings of the FourthWorkshop on Embedded Networked Sensors (Emnets IV), Cork, Ireland,June 2007.
[8] P. Dutta, D. Culler, and S. Shenker. Procrastination might lead to alonger and more useful life. In Proceedings of HotNets-VI, Atlanta, GA,USA, November 2007.
61
[9] J. Eriksson, A. Dunkels, N. Finne, F. Osterlind, and T. Voigt. Msp-sim – an extensible simulator for msp430-equipped sensor boards. InProceedings of the European Conference on Wireless Sensor Networks(EWSN), Poster/Demo session, Delft, The Netherlands, January 2007.
[10] F. Haq and T. Kunz. Simulation vs. emulation: Evaluating mobilead hoc network routing protocols. In Proceedings of the InternationalWorkshop on Wireless Ad-hoc Networks (IWWAN 2005), London, Eng-land, May 2005.
[11] S. Ivanov, A. Herms, and G. Lukas. Experimental validation of thens-2 wireless model using simulation, emulation, and real network. InProceedings of the 4th Workshop on Mobile Ad-Hoc Networks (WMAN2007), 2007.
[12] O. Landsiedel, K. Wehrle, and S. Gotz. Accurate prediction of powerconsumption in sensor networks. In Proceedings of The Second IEEEWorkshop on Embedded Networked Sensors (EmNetS-II), Sydney, Aus-tralia, May 2005.
[13] P. Levis, N. Lee, M. Welsh, and D. Culler. Tossim: accurate andscalable simulation of entire tinyos applications. In Proceedings of thefirst international conference on Embedded networked sensor systems,pages 126–137, 2003.
[14] G. Lu, B. Krishnamachari, and C. Raghavendra. An adaptive energy-efficient and low-latency mac for data gathering in wireless sensor net-works. In International Parallel and Distributed Processing Symposium(IPDPS), 2004.
[15] R. Musaloiu-E., C-J. M. Liang, and A. Terzis. Koala: Ultra-Low PowerData Retrieval in Wireless Sensor Networks. In IPSN ’08, 2008.
[16] F. Osterlind, A. Dunkels, J. Eriksson, N. Finne, and T. Voigt. Cross-level sensor network simulation with cooja. In Proceedings of the FirstIEEE International Workshop on Practical Issues in Building SensorNetwork Applications (SenseApp 2006), Tampa, Florida, USA, Novem-ber 2006.
[17] J. Polastre, R. Szewczyk, and D. Culler. Telos: Enabling ultra-low power wireless research. In Proceedings of The Fourth Interna-tional Conference on Information Processing in Sensor Networks. IP-SN/SPOTS’05, Los Angeles, CA, USA, April 2005.
[18] V. Raghunathan, C. Schurgers, S. Park, and M. Srivastava. Energyaware wireless microsensor networks. IEEE Signal Processing Magazine,19(2):40–50, March 2002.
62
[19] J. Schiller, H. Ritter, A. Liers, and T. Voigt. Scatterweb - low powernodes and energy aware routing. In Proceedings of Hawaii InternationalConference on System Sciences, Hawaii, USA, 2005.
[20] R.C. Shah and J.M. Rabaey. Energy aware routing for low energy adhoc sensor networks. In Proc. IEEE Wireless Communications andNetworking Conference (WCNC), March 2002.
[21] V. Shnayder, M. Hempstead, Chen B., G.W. Allen, and M. Welsh.Simulating the power consumption of large-scale sensor network ap-plications. In 2nd International Conference on Embedded NetworkedSensor Systems (ACM SenSys), November 2004.
[22] B.L. Titzer, D.K. Lee, and J. Palsberg. Avrora: scalable sensor networksimulation with precise timing. In Proceedings of the 4th internationalsymposium on Information processing in sensor networks (IPSN), April2005.
[23] T. Trathnigg, J. Moser, and R. Weisse. A low-cost energy measurementsetup and improving the accuracy of energy simulators for wireless sen-sor networks. In Proceedings of REALWSN 2008, April 2008.
[24] T. van Dam and K. Langendoen. An adaptive energy-efficient MACprotocol for wireless sensor networks. In Proceedings of the first interna-tional conference on Embedded networked sensor systems, Los Angeles,California, USA, November 2003.
[25] T. Voigt and F. Osterlind. CoReDac: Collision-free command-responsedata collection. In 13th IEEE Conference on Emerging Technologiesand Factory Automation, Hamburg, Germany, September 2008.
63

64
Chapter 8
COOJA/MSPSim:Interoperability Testing forWireless Sensor Networks
Joakim Eriksson, Fredrik Osterlind, Niclas Finne, Nicolas Tsiftes, AdamDunkels, Thiemo VoigtSwedish Institute of Computer Science{joakime,fros,nfi,nvt,adam,thiemo}@sics.se
Robert Sauter, Pedro Jose MarronUniversity of Bonn and Fraunhofer IAIS{sauter,pjmarron}@cs.uni-bonn.de
abstract
Wireless sensor networks are moving towards emerging standards such as IP,ZigBee and WirelessHART which makes interoperability testing important.Interoperability testing is today performed through black-box testing withvendors physically meeting to test their equipment. Black-box testing cantest interoperability but gives no detailed information of the internals in thenodes during the testing. Black-box testing is required because existing sim-ulators cannot simultaneously simulate sensor nodes with different firmware.For standards such as IP and WirelessHART, a white-box interoperabilitytesting approach is desired, since it gives details on both performance andclues about why tests succeeded or failed. To allow white-box testing, wepropose a simulation-based approach to interoperability testing, where thefirmware from different vendors is run in the same simulator.
We extend our MSPSim emulator and COOJA wireless sensor networksimulator to support interoperable simulation of sensor nodes with firmwarefrom different vendors. To demonstrate both cross-vendor interoperability
65
and the benefits of white-box interoperability testing, we run the state-of-the-art Contiki and TinyOS operating systems in a single simulation.Because of the white-box testing, we can do performance measurement andpower profiling over both operating systems.
8.1 Introduction
Wireless sensor networks are distributed systems consisting of small, oftenbattery-powered sensing devices that communicate using low-power wire-less radios. Wireless sensor networks enable numerous applications rangingfrom water [27] and bridge monitoring [20] to predictive maintenance inindustry [17].
The resource constraints of sensor devices have driven researchers tofocus on performance rather than on modularity [23]. Consequentially, anumber of highly efficient vertically integrated solutions such as Koala [21]and Dozer [2] have been developed. These low power data gathering appli-cations operate on radio duty cycles less than 1%. The vertical integration,however, is by design non-interoperable and it is therefore difficult to ex-change layers to achieve interoperability.
A vast body of research on sensor networks has yielded numerous dif-ferent communication architectures and protocols. The rapid acceptance ofsensor networks for industrial applications has, however, driven focus to-wards standardization and interoperability. Due to the proven industrialpotential of wireless sensor networks, a number of standards have emergedduring recent years. These include WirelessHART [15], ZigBee [28], andIPv6-based sensor networks [10].
The standardization of sensor networks makes interoperability a new re-quirement when implementing communication stacks and applications. In-teroperability is difficult to verify, however, since sensor network simulatorsand prototyping tools lack the possibility to simulate heterogeneous sensornetworks. For example, the widely used TOSSIM simulator [19] only simu-lates nodes running the TinyOS operating system [14]. These tools are thusunable to test the requirements that have arisen with the vision of an Inter-net of Things [9]. Instead, vendors are today required to physically meet toperform black-box testing of their equipment.
To meet the need for white-box testing of interoperability, we extend theContiki simulator COOJA [22] and MSPSim, an instruction level emulatorthat is integrated in COOJA. Our simulator extensions enable simulationsof heterogeneous sensor networks that consist of different operating systemsand sensor devices. We also extend MSPSim with a power profiling mech-anism similar to the software-based power profiler of the Contiki operatingsystem [7]. Our experiments demonstrate that our combined simulator isnot only a feasible tool for interoperability testing; it is also able to power
66
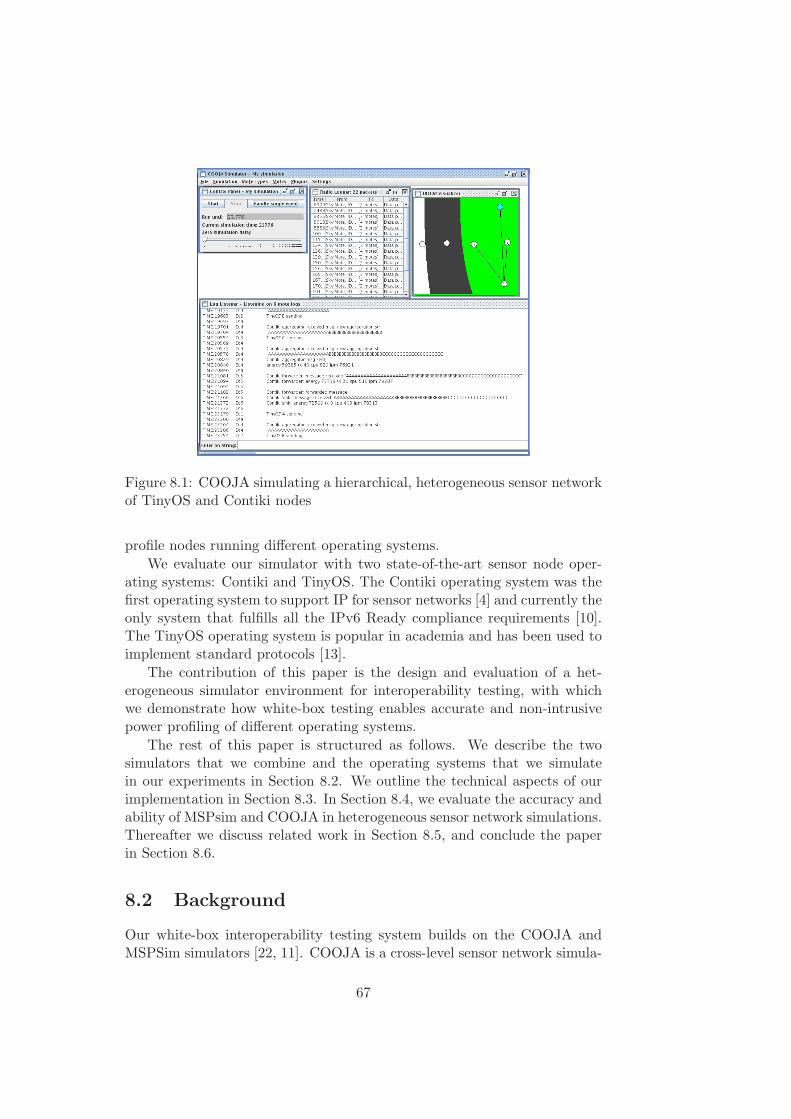
Figure 8.1: COOJA simulating a hierarchical, heterogeneous sensor networkof TinyOS and Contiki nodes
profile nodes running different operating systems.
We evaluate our simulator with two state-of-the-art sensor node oper-ating systems: Contiki and TinyOS. The Contiki operating system was thefirst operating system to support IP for sensor networks [4] and currently theonly system that fulfills all the IPv6 Ready compliance requirements [10].The TinyOS operating system is popular in academia and has been used toimplement standard protocols [13].
The contribution of this paper is the design and evaluation of a het-erogeneous simulator environment for interoperability testing, with whichwe demonstrate how white-box testing enables accurate and non-intrusivepower profiling of different operating systems.
The rest of this paper is structured as follows. We describe the twosimulators that we combine and the operating systems that we simulatein our experiments in Section 8.2. We outline the technical aspects of ourimplementation in Section 8.3. In Section 8.4, we evaluate the accuracy andability of MSPsim and COOJA in heterogeneous sensor network simulations.Thereafter we discuss related work in Section 8.5, and conclude the paperin Section 8.6.
8.2 Background
Our white-box interoperability testing system builds on the COOJA andMSPSim simulators [22, 11]. COOJA is a cross-level sensor network simula-
67
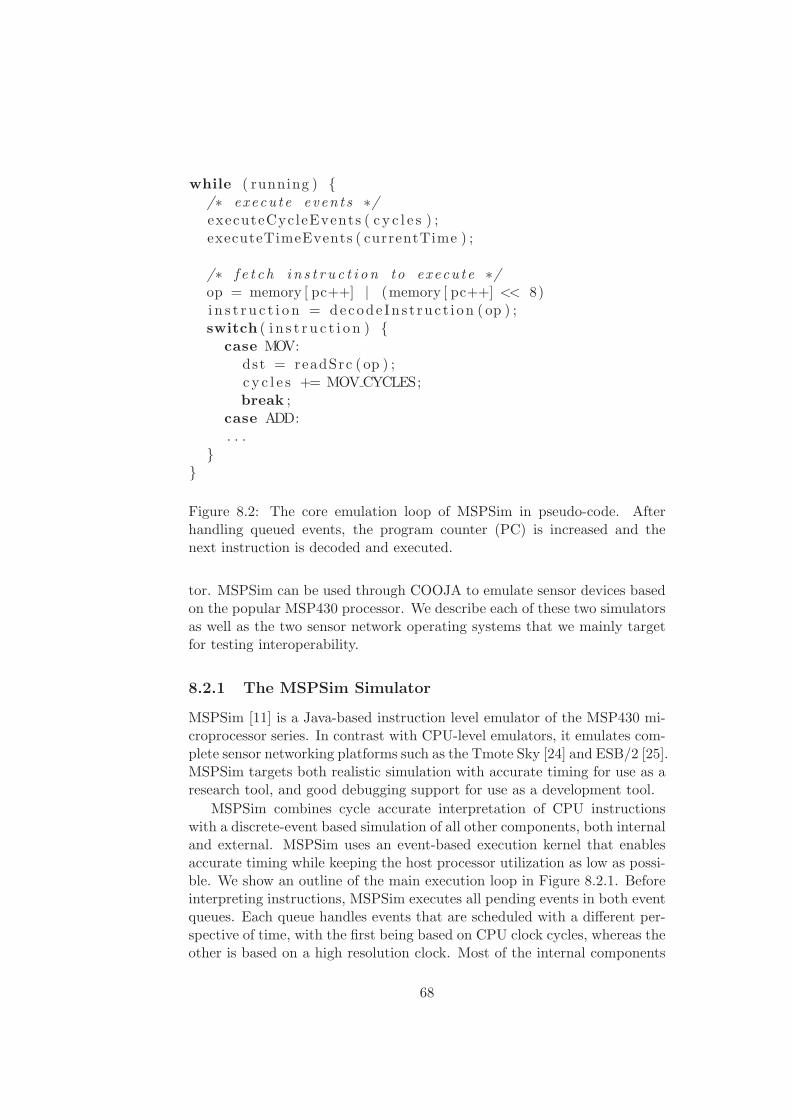
while ( running ) {/∗ execu te even t s ∗/executeCycleEvents ( c y c l e s ) ;executeTimeEvents ( currentTime ) ;
/∗ f e t c h i n s t r u c t i o n to execu te ∗/op = memory [ pc++] | (memory [ pc++] << 8)i n s t r u c t i o n = decode In s t ruc t i on ( op ) ;switch ( i n s t r u c t i o n ) {
case MOV:dst = readSrc ( op ) ;c y c l e s += MOV CYCLES;break ;
case ADD:. . .
}}
Figure 8.2: The core emulation loop of MSPSim in pseudo-code. Afterhandling queued events, the program counter (PC) is increased and thenext instruction is decoded and executed.
tor. MSPSim can be used through COOJA to emulate sensor devices basedon the popular MSP430 processor. We describe each of these two simulatorsas well as the two sensor network operating systems that we mainly targetfor testing interoperability.
8.2.1 The MSPSim Simulator
MSPSim [11] is a Java-based instruction level emulator of the MSP430 mi-croprocessor series. In contrast with CPU-level emulators, it emulates com-plete sensor networking platforms such as the Tmote Sky [24] and ESB/2 [25].MSPSim targets both realistic simulation with accurate timing for use as aresearch tool, and good debugging support for use as a development tool.
MSPSim combines cycle accurate interpretation of CPU instructionswith a discrete-event based simulation of all other components, both internaland external. MSPSim uses an event-based execution kernel that enablesaccurate timing while keeping the host processor utilization as low as possi-ble. We show an outline of the main execution loop in Figure 8.2.1. Beforeinterpreting instructions, MSPSim executes all pending events in both eventqueues. Each queue handles events that are scheduled with a different per-spective of time, with the first being based on CPU clock cycles, whereas theother is based on a high resolution clock. Most of the internal components
68
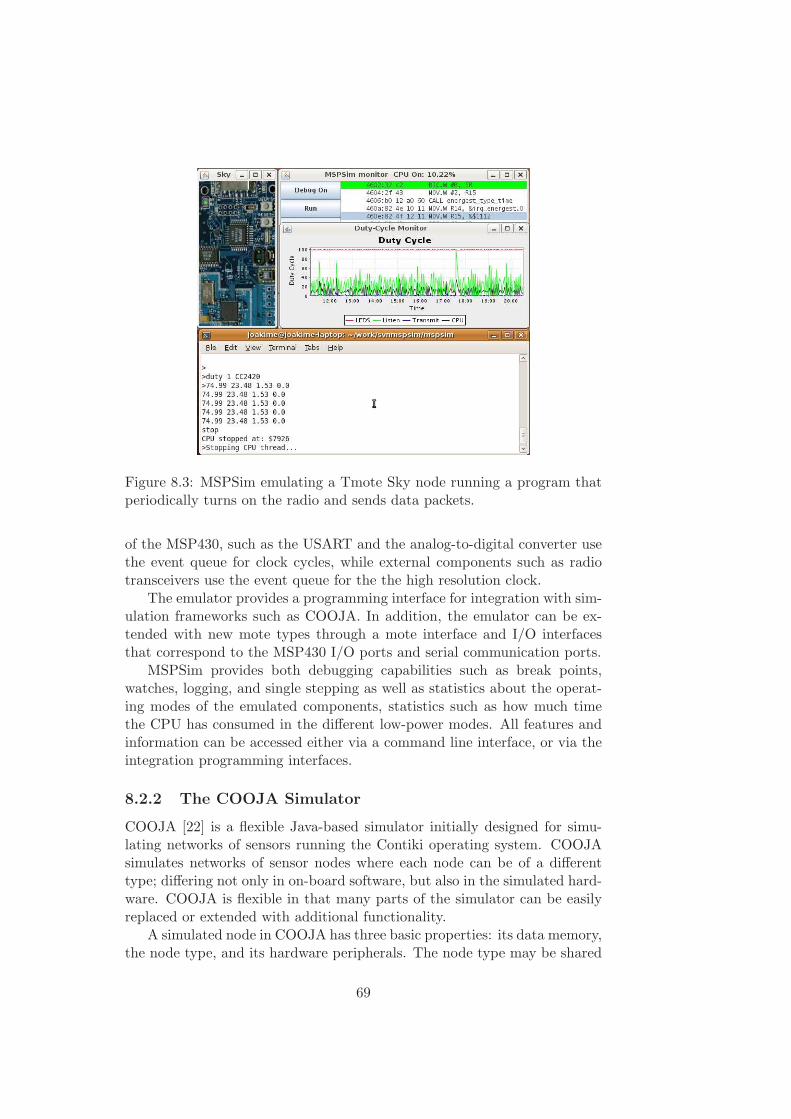
Figure 8.3: MSPSim emulating a Tmote Sky node running a program thatperiodically turns on the radio and sends data packets.
of the MSP430, such as the USART and the analog-to-digital converter usethe event queue for clock cycles, while external components such as radiotransceivers use the event queue for the the high resolution clock.
The emulator provides a programming interface for integration with sim-ulation frameworks such as COOJA. In addition, the emulator can be ex-tended with new mote types through a mote interface and I/O interfacesthat correspond to the MSP430 I/O ports and serial communication ports.
MSPSim provides both debugging capabilities such as break points,watches, logging, and single stepping as well as statistics about the operat-ing modes of the emulated components, statistics such as how much timethe CPU has consumed in the different low-power modes. All features andinformation can be accessed either via a command line interface, or via theintegration programming interfaces.
8.2.2 The COOJA Simulator
COOJA [22] is a flexible Java-based simulator initially designed for simu-lating networks of sensors running the Contiki operating system. COOJAsimulates networks of sensor nodes where each node can be of a differenttype; differing not only in on-board software, but also in the simulated hard-ware. COOJA is flexible in that many parts of the simulator can be easilyreplaced or extended with additional functionality.
A simulated node in COOJA has three basic properties: its data memory,the node type, and its hardware peripherals. The node type may be shared
69
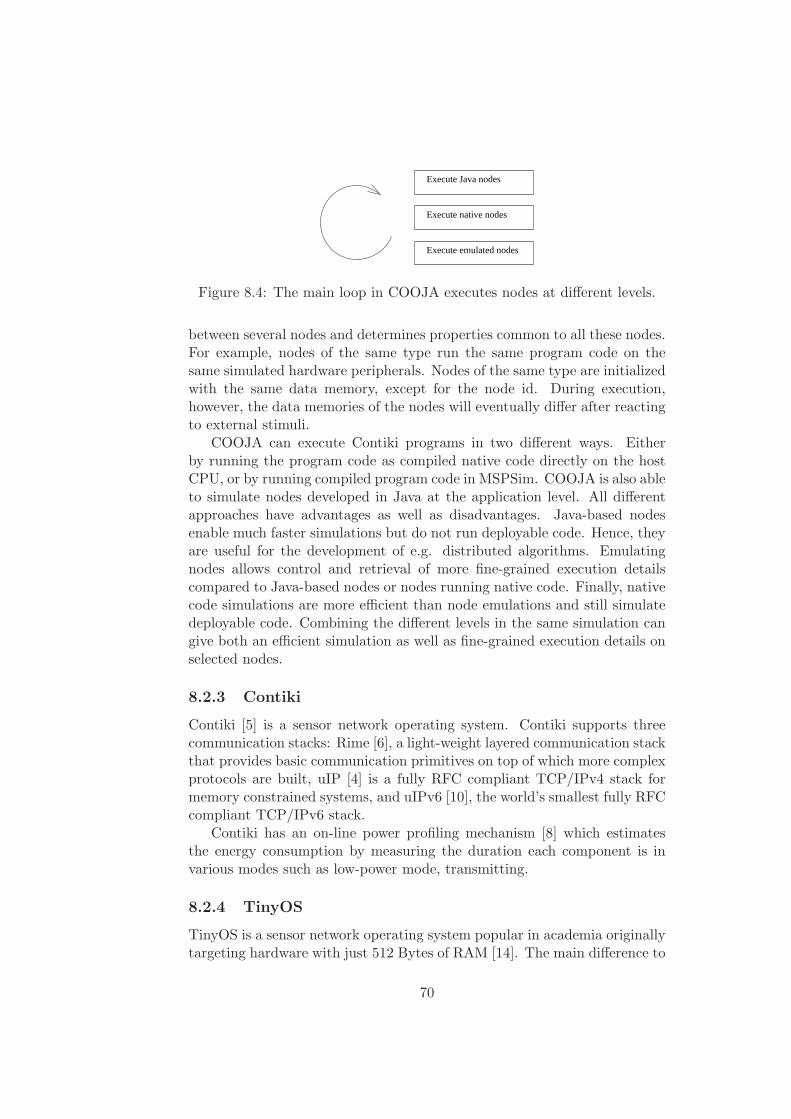
Execute native nodes
Execute emulated nodes
Execute Java nodes
Figure 8.4: The main loop in COOJA executes nodes at different levels.
between several nodes and determines properties common to all these nodes.For example, nodes of the same type run the same program code on thesame simulated hardware peripherals. Nodes of the same type are initializedwith the same data memory, except for the node id. During execution,however, the data memories of the nodes will eventually differ after reactingto external stimuli.
COOJA can execute Contiki programs in two different ways. Eitherby running the program code as compiled native code directly on the hostCPU, or by running compiled program code in MSPSim. COOJA is also ableto simulate nodes developed in Java at the application level. All differentapproaches have advantages as well as disadvantages. Java-based nodesenable much faster simulations but do not run deployable code. Hence, theyare useful for the development of e.g. distributed algorithms. Emulatingnodes allows control and retrieval of more fine-grained execution detailscompared to Java-based nodes or nodes running native code. Finally, nativecode simulations are more efficient than node emulations and still simulatedeployable code. Combining the different levels in the same simulation cangive both an efficient simulation as well as fine-grained execution details onselected nodes.
8.2.3 Contiki
Contiki [5] is a sensor network operating system. Contiki supports threecommunication stacks: Rime [6], a light-weight layered communication stackthat provides basic communication primitives on top of which more complexprotocols are built, uIP [4] is a fully RFC compliant TCP/IPv4 stack formemory constrained systems, and uIPv6 [10], the world’s smallest fully RFCcompliant TCP/IPv6 stack.
Contiki has an on-line power profiling mechanism [8] which estimatesthe energy consumption by measuring the duration each component is invarious modes such as low-power mode, transmitting.
8.2.4 TinyOS
TinyOS is a sensor network operating system popular in academia originallytargeting hardware with just 512 Bytes of RAM [14]. The main difference to
70
other sensor network operating systems is the use of the specifically devel-oped programming language nesC [12] that builds component abstractionson top of standard C. This programming language has to be used by appli-cation developers, since the application together with system componentsare used to generate a single binary image to be programmed to the sensornodes. TinyOS is event-based, which is supported by special constructs innesC, and requires also the application developer to follow this programmingmodel.
The basic communication abstraction of TinyOS is a simple best-effortone-hop message transmission service. In addition to the frame format ofthe data link layer used by the radio chip, e.g., 802.15.4, TinyOS just addsone byte – the Active Message Type – to differentiate among up to 256different software components as the intended destination on the receiver.Building on this abstraction, other protocols can be built. As an alternativeto this, a partial IPv6 stack [13] has been added in recent TinyOS releases.
No mechanism for on-line estimation of power consumption is available.Instead, algorithms that require this information, e.g., for lifetime estima-tion and adaption of functionality, require an extensive prior evaluation bysimulation to obtain estimates for inclusion in the deployment [18].
8.3 Implementation
By integrating MSPsim more closely into COOJA and adding some OS-specific support, we get a simulation tool that can simulate sensor networksconsisting of both Contiki and TinyOS nodes.
8.3.1 Simulating TinyOS nodes
The main difference between simulating Contiki nodes and TinyOS nodesis that they use different node ID variables. Contiki uses node id for itsnode ID while TinyOS uses the constant TOS NODE ID and the mutableActive Message address TOS AM ADDRESS. Initially, we added supportin COOJA for setting just the node id, but initial experiments indicatedthat it is also practical to be able to set the Active Message address throughCOOJA.
In MSPSim, we made the emulation of the MSP430 and the CC2420radio chip to be more accurate and complete. The initial emulation waslimited to the subset of features used in only one of the operating systems.One important addition is the SFD capture interrupt that might be usedfor time stamping, etc.
71
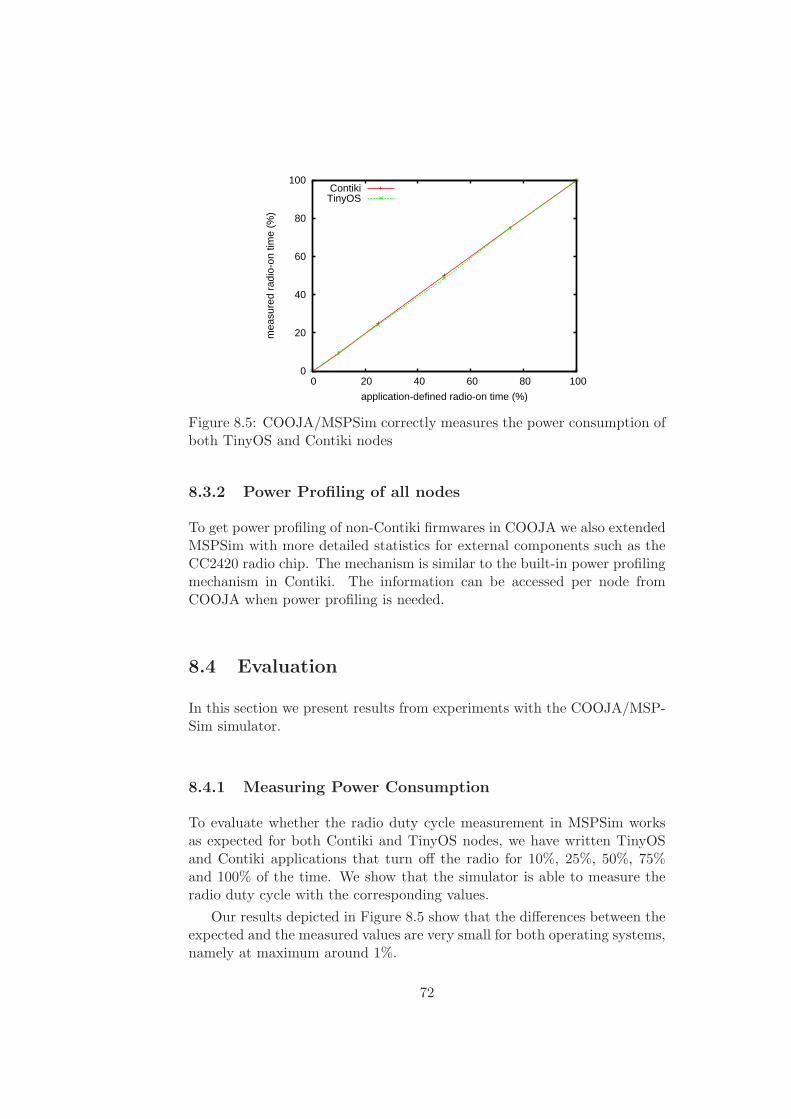
0
20
40
60
80
100
0 20 40 60 80 100
mea
sure
d ra
dio-
on ti
me
(%)
application-defined radio-on time (%)
ContikiTinyOS
Figure 8.5: COOJA/MSPSim correctly measures the power consumption ofboth TinyOS and Contiki nodes
8.3.2 Power Profiling of all nodes
To get power profiling of non-Contiki firmwares in COOJA we also extendedMSPSim with more detailed statistics for external components such as theCC2420 radio chip. The mechanism is similar to the built-in power profilingmechanism in Contiki. The information can be accessed per node fromCOOJA when power profiling is needed.
8.4 Evaluation
In this section we present results from experiments with the COOJA/MSP-Sim simulator.
8.4.1 Measuring Power Consumption
To evaluate whether the radio duty cycle measurement in MSPSim worksas expected for both Contiki and TinyOS nodes, we have written TinyOSand Contiki applications that turn off the radio for 10%, 25%, 50%, 75%and 100% of the time. We show that the simulator is able to measure theradio duty cycle with the corresponding values.
Our results depicted in Figure 8.5 show that the differences between theexpected and the measured values are very small for both operating systems,namely at maximum around 1%.
72
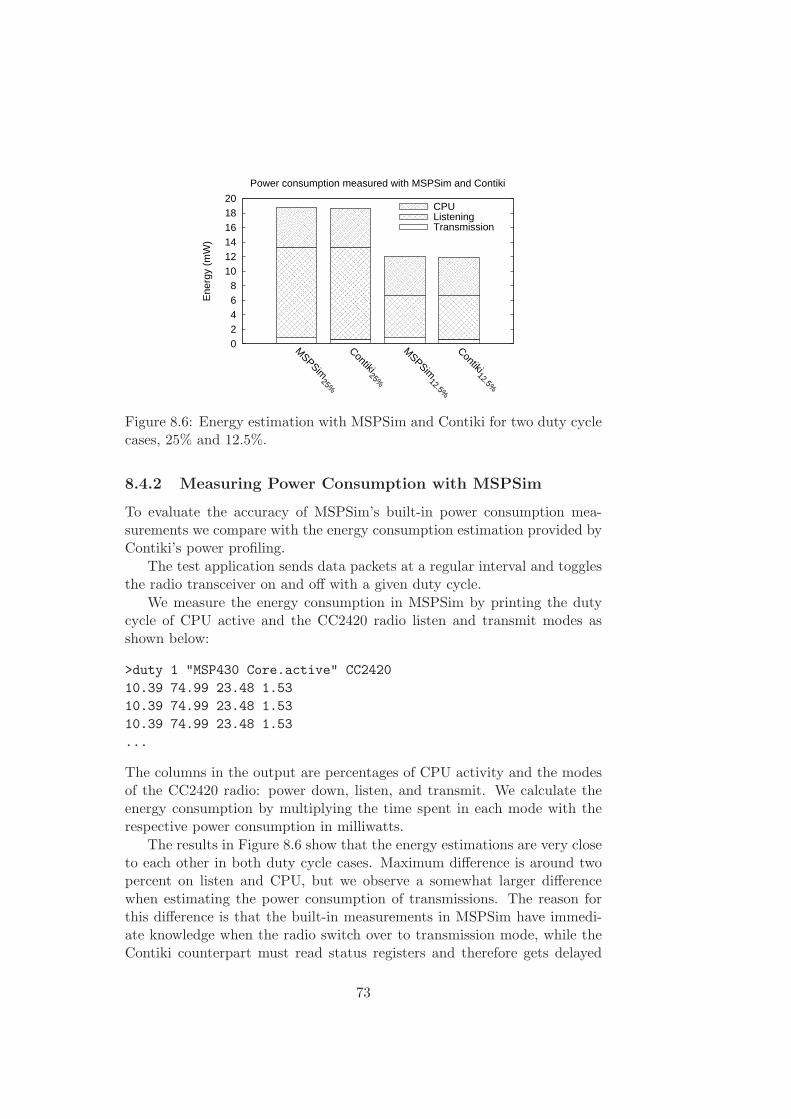
0 2 4 6 8
10 12 14 16 18 20
MSPSim
25%
Contiki25%
MSPSim
12.5%
Contiki12.5%
Ene
rgy
(mW
)
Power consumption measured with MSPSim and Contiki
TransmissionListeningCPU
Figure 8.6: Energy estimation with MSPSim and Contiki for two duty cyclecases, 25% and 12.5%.
8.4.2 Measuring Power Consumption with MSPSim
To evaluate the accuracy of MSPSim’s built-in power consumption mea-surements we compare with the energy consumption estimation provided byContiki’s power profiling.
The test application sends data packets at a regular interval and togglesthe radio transceiver on and off with a given duty cycle.
We measure the energy consumption in MSPSim by printing the dutycycle of CPU active and the CC2420 radio listen and transmit modes asshown below:
>duty 1 "MSP430 Core.active" CC2420
10.39 74.99 23.48 1.53
10.39 74.99 23.48 1.53
10.39 74.99 23.48 1.53
...
The columns in the output are percentages of CPU activity and the modesof the CC2420 radio: power down, listen, and transmit. We calculate theenergy consumption by multiplying the time spent in each mode with therespective power consumption in milliwatts.
The results in Figure 8.6 show that the energy estimations are very closeto each other in both duty cycle cases. Maximum difference is around twopercent on listen and CPU, but we observe a somewhat larger differencewhen estimating the power consumption of transmissions. The reason forthis difference is that the built-in measurements in MSPSim have immedi-ate knowledge when the radio switch over to transmission mode, while theContiki counterpart must read status registers and therefore gets delayed
73
information about when transmission starts.
8.4.3 A Heterogeneous, Hierarchical Sensor Network
To demonstrate interoperability between Contiki and TinyOS in COOJA/M-SPSim, we simulate a heterogeneous, hierarchical sensor network shown inFigure 8.3. The hierarchical sensornet consists of both TinyOS and Contikinodes. The three TinyOS nodes placed in the right part of the top rightplug-in in Figure 8.3 act as data sources that periodically send a data mes-sage with 20 bytes payload (“As”, “Bs” or “Cs”) to an aggregator noderunning Contiki. The aggregator node aggregates the data and sends it viaa forwarder node in a multi-hop fashion to the sink (left-hand node in theplug-in). Both the forwarder and the sink node run Contiki.
Since the TinyOS frame format differs from the Contiki frame format,we have modified the Rime stack and the Chameleon module [6] to allowContiki to understand packets from the TinyOS nodes.
In our experiments we send 200 packets from each TinyOS node. Theaggregator node reduces the number of packets from 600 to 200. If thisreduction of the number of packets leads to energy savings depends to alarge extent on the MAC layer. In order to quantify the power savings, wehave measured the power consumption with and without aggregation overtwo hops, i.e. from the aggregator node via the forwarder to the sink node.In these results, the aggregator either sends one large packets with 60 Bytespayload every three seconds or three shorter packets with 20 Bytes payloadevery second.
We use low power probing (LPP) as the underlying MAC layer [21]. LPPreceivers periodically transmit probes. Essentially, probes are short packetsthat announce that the node in question is awake and ready to receive adata packet. After sending a probe, receivers keep their radio on for a shorttime to listen for data packets. A sender that has a packet to be sent turnson its radio waiting for a probe from a neighbor it wants to send to. Onthe reception of a probe from a potential receiver, the node sends a smallhardware ACK that is followed by the actual data packet. We have used thedefault LPP configuration available in Contiki that sends on average fourprobes per second and that keeps the radio on for 1
128seconds after each
probe.
Our results are shown in Figure 8.7 and Figure 8.8. Figure 8.7 showsthat the reduction of the number of packets also leads to reduced powerconsumption for transmitting packets (TX power consumption) for the for-warder and the aggregator nodes. The TX power consumption for the sinknodes is not influenced which indicates that the reduced power consumptionis not caused by a change of the number probing packets but by the reducednumber of header bytes that needs to be transmitted.
As expected, the power consumption for the radio in listen mode (RX
74
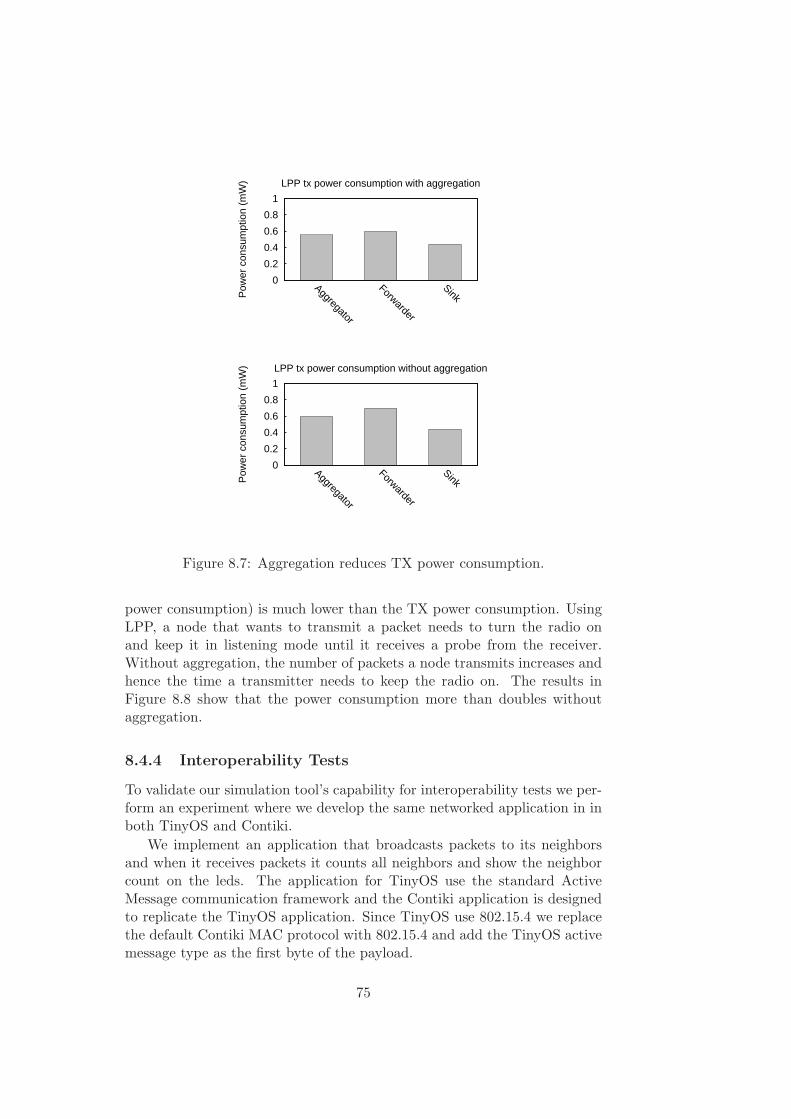
0
0.2
0.4
0.6
0.8
1
Aggregator
Forwarder
SinkPow
er c
onsu
mpt
ion
(mW
)
LPP tx power consumption with aggregation
0
0.2
0.4
0.6
0.8
1
Aggregator
Forwarder
SinkPow
er c
onsu
mpt
ion
(mW
)
LPP tx power consumption without aggregation
Figure 8.7: Aggregation reduces TX power consumption.
power consumption) is much lower than the TX power consumption. UsingLPP, a node that wants to transmit a packet needs to turn the radio onand keep it in listening mode until it receives a probe from the receiver.Without aggregation, the number of packets a node transmits increases andhence the time a transmitter needs to keep the radio on. The results inFigure 8.8 show that the power consumption more than doubles withoutaggregation.
8.4.4 Interoperability Tests
To validate our simulation tool’s capability for interoperability tests we per-form an experiment where we develop the same networked application in inboth TinyOS and Contiki.
We implement an application that broadcasts packets to its neighborsand when it receives packets it counts all neighbors and show the neighborcount on the leds. The application for TinyOS use the standard ActiveMessage communication framework and the Contiki application is designedto replicate the TinyOS application. Since TinyOS use 802.15.4 we replacethe default Contiki MAC protocol with 802.15.4 and add the TinyOS activemessage type as the first byte of the payload.
75
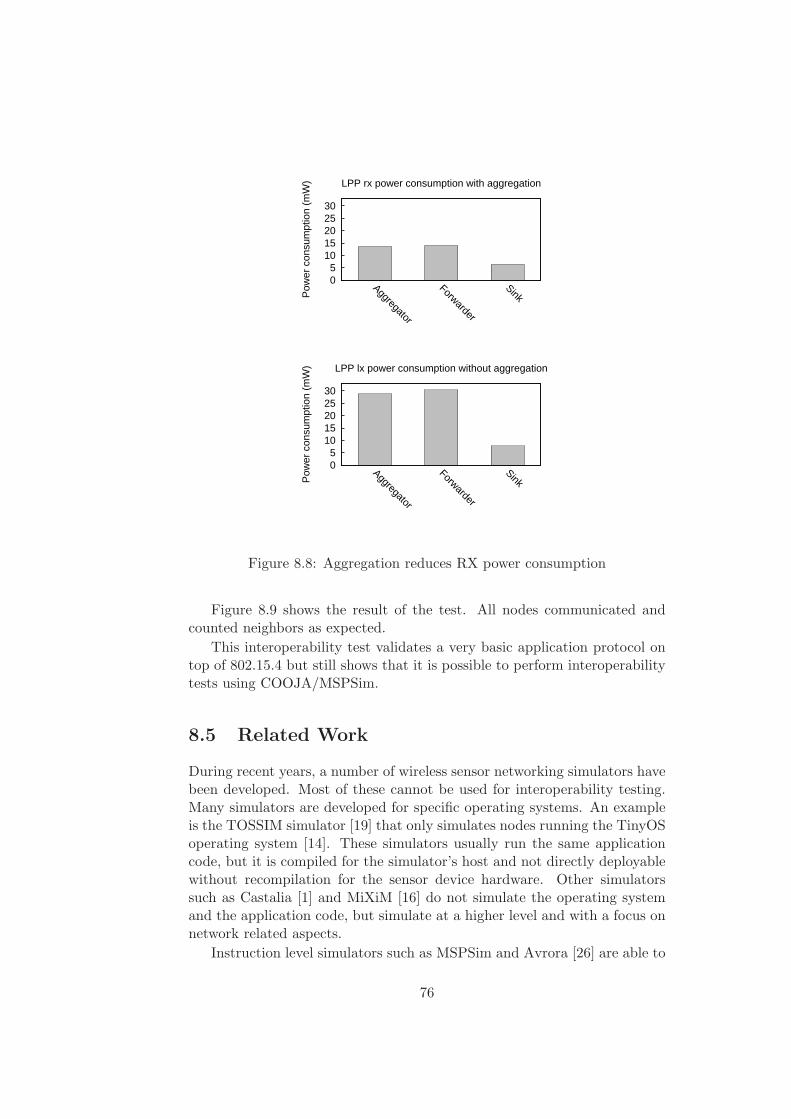
0 5
10 15 20 25 30
Aggregator
Forwarder
SinkPow
er c
onsu
mpt
ion
(mW
)
LPP rx power consumption with aggregation
0 5
10 15 20 25 30
Aggregator
Forwarder
SinkPow
er c
onsu
mpt
ion
(mW
)
LPP lx power consumption without aggregation
Figure 8.8: Aggregation reduces RX power consumption
Figure 8.9 shows the result of the test. All nodes communicated andcounted neighbors as expected.
This interoperability test validates a very basic application protocol ontop of 802.15.4 but still shows that it is possible to perform interoperabilitytests using COOJA/MSPSim.
8.5 Related Work
During recent years, a number of wireless sensor networking simulators havebeen developed. Most of these cannot be used for interoperability testing.Many simulators are developed for specific operating systems. An exampleis the TOSSIM simulator [19] that only simulates nodes running the TinyOSoperating system [14]. These simulators usually run the same applicationcode, but it is compiled for the simulator’s host and not directly deployablewithout recompilation for the sensor device hardware. Other simulatorssuch as Castalia [1] and MiXiM [16] do not simulate the operating systemand the application code, but simulate at a higher level and with a focus onnetwork related aspects.
Instruction level simulators such as MSPSim and Avrora [26] are able to
76
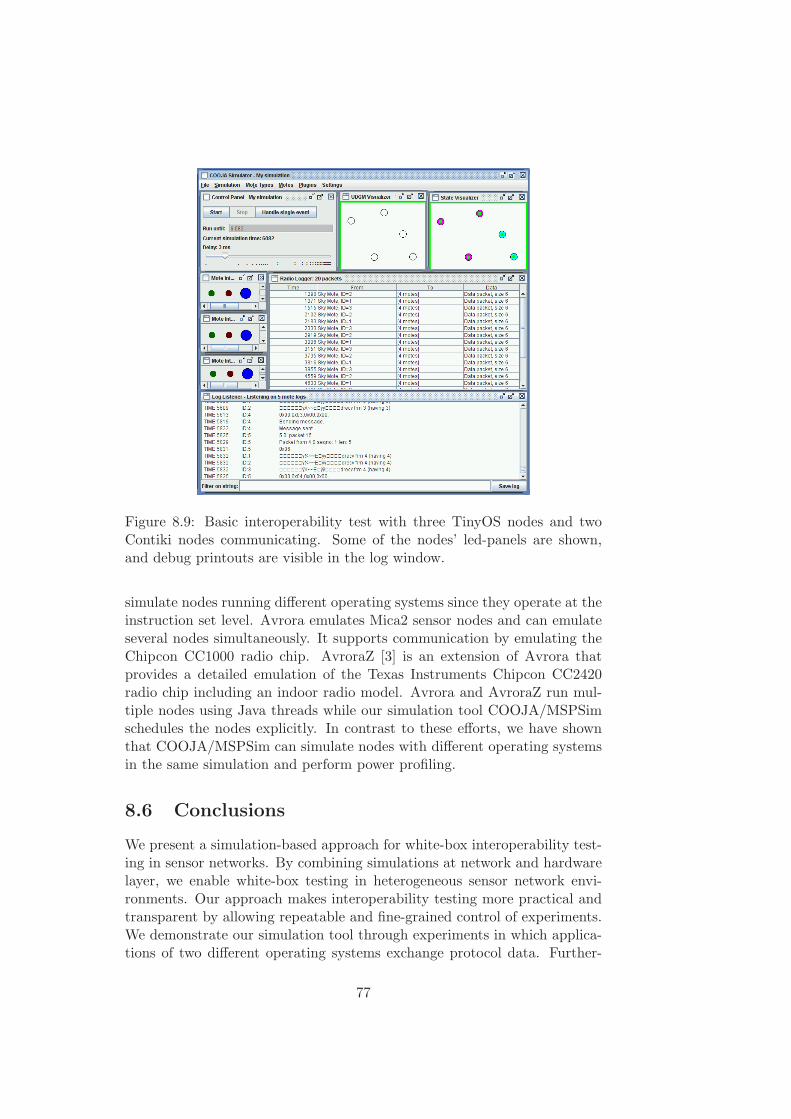
Figure 8.9: Basic interoperability test with three TinyOS nodes and twoContiki nodes communicating. Some of the nodes’ led-panels are shown,and debug printouts are visible in the log window.
simulate nodes running different operating systems since they operate at theinstruction set level. Avrora emulates Mica2 sensor nodes and can emulateseveral nodes simultaneously. It supports communication by emulating theChipcon CC1000 radio chip. AvroraZ [3] is an extension of Avrora thatprovides a detailed emulation of the Texas Instruments Chipcon CC2420radio chip including an indoor radio model. Avrora and AvroraZ run mul-tiple nodes using Java threads while our simulation tool COOJA/MSPSimschedules the nodes explicitly. In contrast to these efforts, we have shownthat COOJA/MSPSim can simulate nodes with different operating systemsin the same simulation and perform power profiling.
8.6 Conclusions
We present a simulation-based approach for white-box interoperability test-ing in sensor networks. By combining simulations at network and hardwarelayer, we enable white-box testing in heterogeneous sensor network envi-ronments. Our approach makes interoperability testing more practical andtransparent by allowing repeatable and fine-grained control of experiments.We demonstrate our simulation tool through experiments in which applica-tions of two different operating systems exchange protocol data. Further-
77
more, we show that the new white-box testing environment allows accurateand non-intrusive power consumption measurements at the network scale.
More information about COOJA and MSPSim, including download links,can be found at:
http://www.sics.se/contiki/andhttp://www.sics.se/project/mspsim/
8.7 Acknowledgments
This work has been partially supported by CONET, the Cooperating Ob-jects Network of Excellence, funded by the European Commission underFP7 with contract number FP7-2007-2-224053. This work was also partlyfinanced by VINNOVA, the Swedish Agency for Innovation Systems.
78
Bibliography
[1] A. Boulis. Castalia: revealing pitfalls in designing distributed algo-rithms in WSN. In Poster proceedings of the 5th international confer-ence on Embedded networked sensor systems, pages 407–408, 2007.
[2] N. Burri, P. von Rickenbach, and R. Wattenhofer. Dozer: ultra-lowpower data gathering in sensor networks. In IPSN ’07, 2007.
[3] Rodolfo de Paz Alberola and Dirk Pesch. Avroraz: Extending avrorawith an ieee 802.15.4 compliant radio chip mode. In 3rd ACM In-ternational Workshop on Performance Monitoring, Measurement, andEvaluation of Heterogeneous Wireless and Wired Networks, Vancouver,Canada, October 2008.
[4] A. Dunkels. Full TCP/IP for 8-bit architectures. In Proceedings of TheFirst International Conference on Mobile Systems, Applications, andServices (MOBISYS ‘03), May 2003.
[5] A. Dunkels, B. Gronvall, and T. Voigt. Contiki - a lightweight andflexible operating system for tiny networked sensors. In Workshop onEmbedded Networked Sensors, Tampa, Florida, USA, November 2004.
[6] A. Dunkels, F. Osterlind, and Z. He. An adaptive communication archi-tecture for wireless sensor networks. In Proceedings of the Fifth ACMConference on Networked Embedded Sensor Systems (SenSys 2007),Sydney, Australia, November 2007.
[7] A. Dunkels, F. Osterlind, N. Tsiftes, and Z. He. Software-based on-line energy estimation for sensor nodes. In Proceedings of the FourthWorkshop on Embedded Networked Sensors (Emnets IV), Cork, Ireland,June 2007.
[8] A. Dunkels, F. Osterlind, N. Tsiftes, and Z. He. Software-based on-line energy estimation for sensor nodes. In Proceedings of the FourthWorkshop on Embedded Networked Sensors (Emnets IV), Cork, Ireland,June 2007.
79
[9] A. Dunkels and J-P. Vasseur. IP for Smart Objects, September 2008.IPSO Alliance White Paper #1.
[10] M. Durvy, J. Abeille, P. Wetterwald, C. O’Flynn, B. Leverett,E. Gnoske, M. Vidales, G. Mulligan, N. Tsiftes, N. Finne, andA. Dunkels. Making Sensor Networks IPv6 Ready. In Proceedingsof the Sixth ACM Conference on Networked Embedded Sensor Systems(ACM SenSys 2008), Raleigh, North Carolina, USA, November 2008.
[11] J. Eriksson, A. Dunkels, N. Finne, F. Osterlind, and T. Voigt. Msp-sim – an extensible simulator for msp430-equipped sensor boards. InProceedings of the European Conference on Wireless Sensor Networks(EWSN), Poster/Demo session, Delft, The Netherlands, January 2007.
[12] D. Gay, P. Levis, R. von Behren, M. Welsh, E. Brewer, and D. Culler.The nesC language: A holistic approach to networked embedded sys-tems. In Proceedings of the ACM SIGPLAN 2003 conference on Pro-gramming language design and implementation, pages 1–11, 2003.
[13] Matus Harvan and Jurgen Schonwalder. A 6lowpan implementation forTinyOS 2.0. In Proc. of the 6th GI/ITG KuVS Fachgesprach ”WirelessSensor Networks”, Aachen, 2007.
[14] J. Hill, R. Szewczyk, A. Woo, S. Hollar, D. Culler, and K. Pister. Systemarchitecture directions for networked sensors. In Proceedings of the9th International Conference on Architectural Support for ProgrammingLanguages and Operating Systems, November 2000.
[15] F. Kim, A.and Hekland, S. Petersen, and P. Doyle. When hart goeswireless: Understanding and implementing the wirelesshart standard.In 13th IEEE Conference on Emerging Technologies and Factory Au-tomation, Hamburg, Germany, September 2008.
[16] A. Kopke, M. Swigulski, K. Wessel, D. Willkomm, P. T. Klein Han-eveld, T. E. V. Parker, O. W. Visser, H. S. Lichte, and S. Valentin.Simulating wireless and mobile networks in omnet++ the mixim vi-sion. In Simutools ’08: Proceedings of the 1st international conferenceon Simulation tools and techniques for communications, networks andsystems & workshops, pages 1–8, ICST, Brussels, Belgium, 2008. ICST(Institute for Computer Sciences, Social-Informatics and Telecommu-nications Engineering).
[17] L. Krishnamurthy, R. Adler, P. Buonadonna, J. Chhabra, M. Flanigan,N. Kushalnagar, L. Nachman, and M. Yarvis. Design and deploymentof industrial sensor networks: experiences from a semiconductor plantand the north sea. In Proceedings of the 3rd international conference on
80
Embedded networked sensor systems (SenSyS), San Diego, CA, USA,November 2005.
[18] Andreas Lachenmann, Pedro Jose Marron, Daniel Minder, and KurtRothermel. Meeting lifetime goals with energy levels. In Proc. of the5th ACM Conference on Embedded Networked Sensor Systems, 2007.
[19] P. Levis, N. Lee, M. Welsh, and D. Culler. Tossim: accurate andscalable simulation of entire tinyos applications. In Proceedings of thefirst international conference on Embedded networked sensor systems,pages 126–137, 2003.
[20] P. Marron, R. Sauter, O. Saukh, M. Gauger, and K. Rothermel. Chal-lenges of complex data processing in real world sensor network deploy-ments. In Proceedings of ACM Workshop on Real-World Wireless Sen-sor Networks (REALWSN’06), Uppsala, Sweden, June 2006.
[21] R. Musaloiu-E., C-J. M. Liang, and A. Terzis. Koala: Ultra-Low PowerData Retrieval in Wireless Sensor Networks. In IPSN ’08, 2008.
[22] F. Osterlind, A. Dunkels, J. Eriksson, N. Finne, and T. Voigt. Cross-level sensor network simulation with cooja. In Proceedings of the FirstIEEE International Workshop on Practical Issues in Building SensorNetwork Applications (SenseApp 2006), Tampa, Florida, USA, Novem-ber 2006.
[23] J. Polastre, J. Hui, P. Levis, J. Zhao, D. Culler, S. Shenker, and I. Sto-ica. A unifying link abstraction for wireless sensor networks. In SenSys,2005.
[24] J. Polastre, R. Szewczyk, and D. Culler. Telos: Enabling ultra-low power wireless research. In Proceedings of The Fourth Interna-tional Conference on Information Processing in Sensor Networks. IP-SN/SPOTS’05, Los Angeles, CA, USA, April 2005.
[25] J. Schiller, H. Ritter, A. Liers, and T. Voigt. Scatterweb - low powernodes and energy aware routing. In Proceedings of Hawaii InternationalConference on System Sciences, Hawaii, USA, 2005.
[26] B.L. Titzer, D.K. Lee, and J. Palsberg. Avrora: scalable sensor networksimulation with precise timing. In Proceedings of the 4th internationalsymposium on Information processing in sensor networks (IPSN), April2005.
[27] T. Voigt, F. Osterlind, N. Finne, N. Tsiftes, Z. He, J. Eriksson,A. Dunkels, U. Bamsted, J. Schiller, and K. Hjort. Sensor networking inaquatic environments – experiences and new challenges. In Workshop
81

on Practical Issues in Building Sensor Network Applications (SenseApp2007), Dublin, Ireland, October 2007.
[28] Zigbee. Web page. 2007-11-21. http://www.zigbee.org.
82

Recent licentiate theses from the Department of Information Technology
2008-003 Andreas Hellander:Numerical Simulation of Well Stirred Biochemical Reac-tion Networks Governed by the Master Equation
2008-002 Ioana Rodhe:Query Authentication and Data Confidentiality in Wireless Sen-sor Networks
2008-001 Mattias Wiggberg: Unwinding Processes in Computer Science StudentProjects
2007-006 Bjorn Halvarsson:Interaction Analysis and Control of Bioreactors for Nitro-gen Removal
2007-005 Mahen Jayawardena:Parallel Algorithms and Implementations for GeneticAnalysis of Quantitative Traits
2007-004 Olof Rensfelt:Tools and Methods for Evaluation of Overlay Networks
2007-003 Thabotharan Kathiravelu:Towards Content Distribution in Opportunistic Net-works
2007-002 Jonas Boustedt:Students Working with a Large Software System: Experiencesand Understandings
2007-001 Manivasakan Sabesan:Querying Mediated Web Services
2006-012 Stefan Blomkvist:User-Centred Design and Agile Development of IT Systems
2006-011 Asa Cajander:Values and Perspectives Affecting IT Systems Development andUsability Work
2006-010 Henrik Johansson:Performance Characterization and Evaluation of ParallelPDE Solvers
2006-009 Eddie Wadbro:Topology Optimization for Acoustic Wave Propagation Prob-lems
Department of Information Technology, Uppsala University, Sweden