Embed Size (px)
Citation preview
1
LLNL-PRES-653562
Detailed Kinetic Modeling
of Gasoline Fuels
Slide show prepared by Dr. Marco Mehl, LLNL
Charles Westbrook
Tsinghua-Princeton 2014 Summer School on
CombustionJuly 20-25, 2014
2
LLNL-PRES-653562
What is the relationship between fuel quality and
engine technology?
3
LLNL-PRES-653562
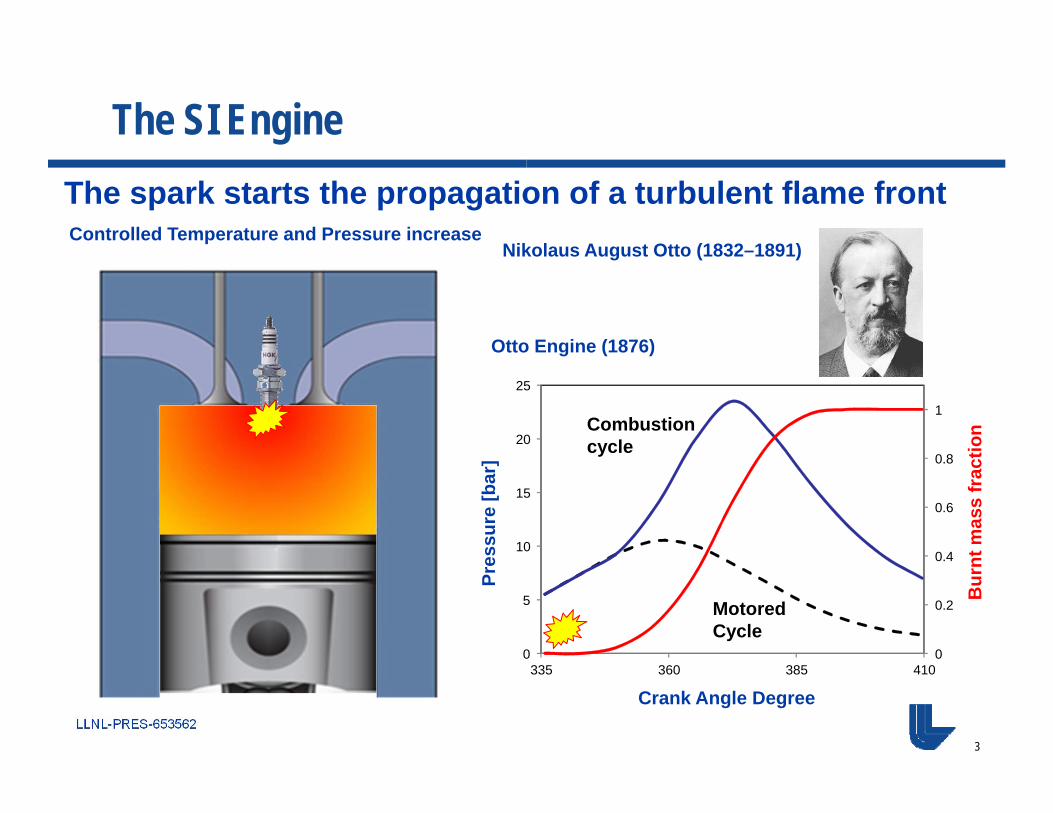
The SI Engine
0
0.2
0.4
0.6
0.8
1
0
5
10
15
20
25
335 360 385 410
Pres
sure
[bar
]
Crank Angle Degree
Bur
nt m
ass
frac
tion
The spark starts the propagation of a turbulent flame frontControlled Temperature and Pressure increase
Nikolaus August Otto (1832–1891)
Motored Cycle
Combustion cycle
Otto Engine (1876)
4
LLNL-PRES-653562
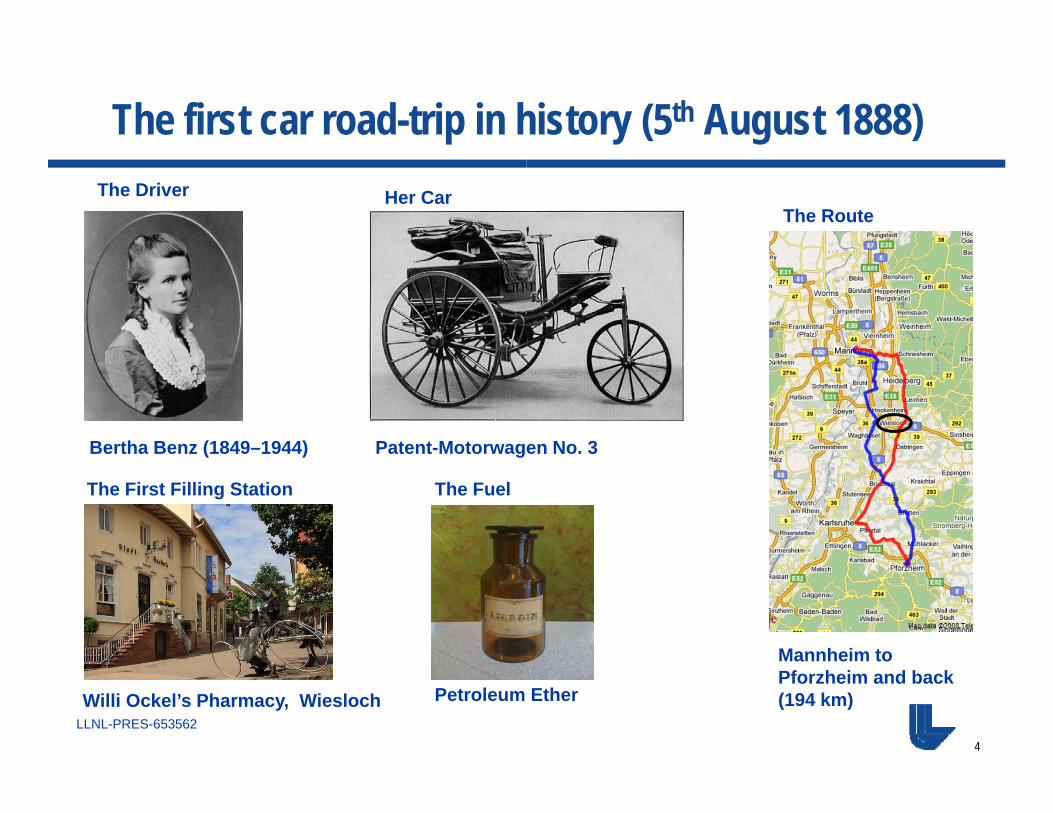
The first car road-trip in history (5th August 1888)
Bertha Benz (1849–1944)
The Driver Her Car
Patent-Motorwagen No. 3
The Route
Mannheim to Pforzheim and back (194 km)
The Fuel
Petroleum Ether
The First Filling Station
Willi Ockel’s Pharmacy, Wiesloch
5
LLNL-PRES-653562
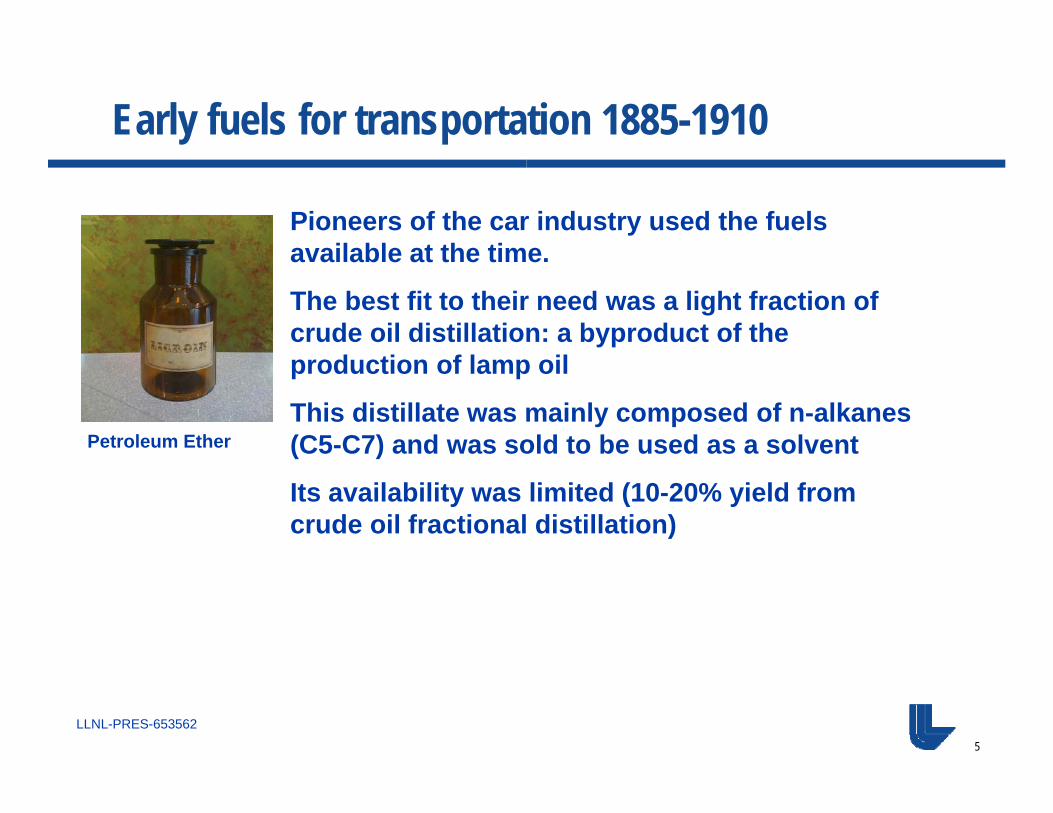
Early fuels for transportation 1885-1910
Petroleum Ether
Pioneers of the car industry used the fuels available at the time.
The best fit to their need was a light fraction of crude oil distillation: a byproduct of the production of lamp oil
This distillate was mainly composed of n-alkanes (C5-C7) and was sold to be used as a solvent
Its availability was limited (10-20% yield from crude oil fractional distillation)
6
LLNL-PRES-653562
0
50
100
150
200
250
300
350
0
2
4
6
8
10
12
14
16
1880 1900 1920 1940 1960 1980 2000 2020
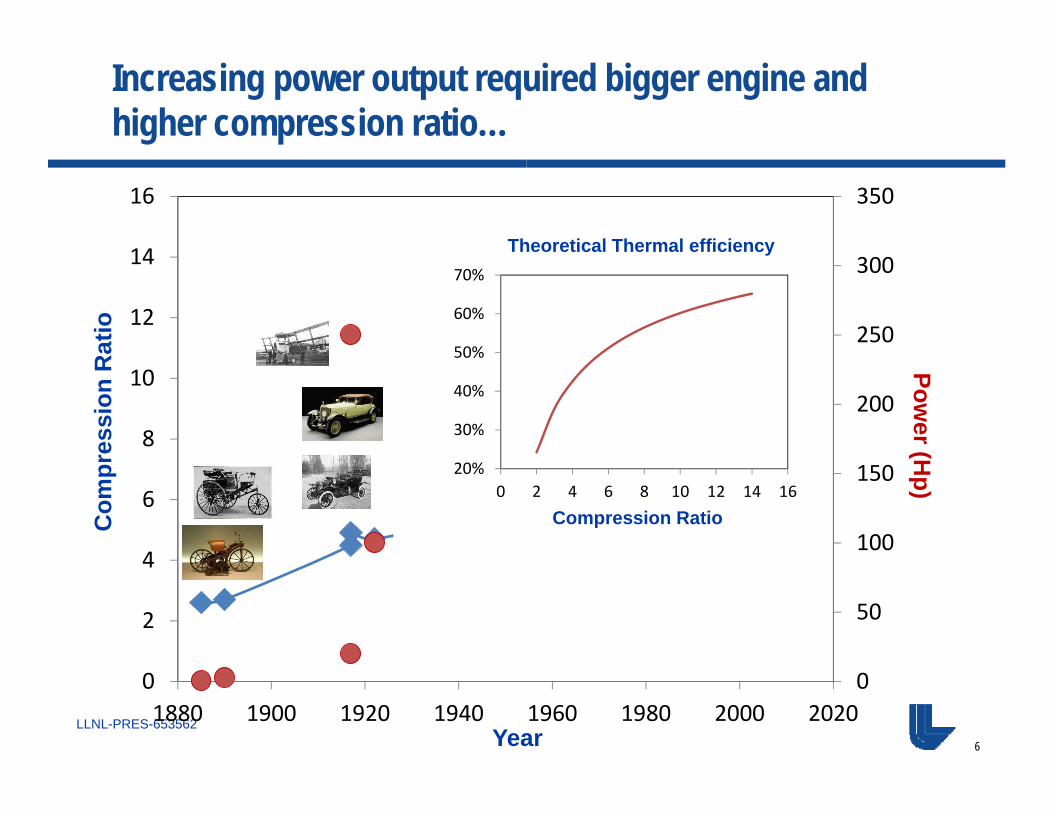
Increasing power output required bigger engine and higher compression ratio…
20%
30%
40%
50%
60%
70%
0 2 4 6 8 10 12 14 16
Theoretical Thermal efficiency
Compression Ratio
Year
Power (H
p)C
ompr
essi
on R
atio
7
LLNL-PRES-653562
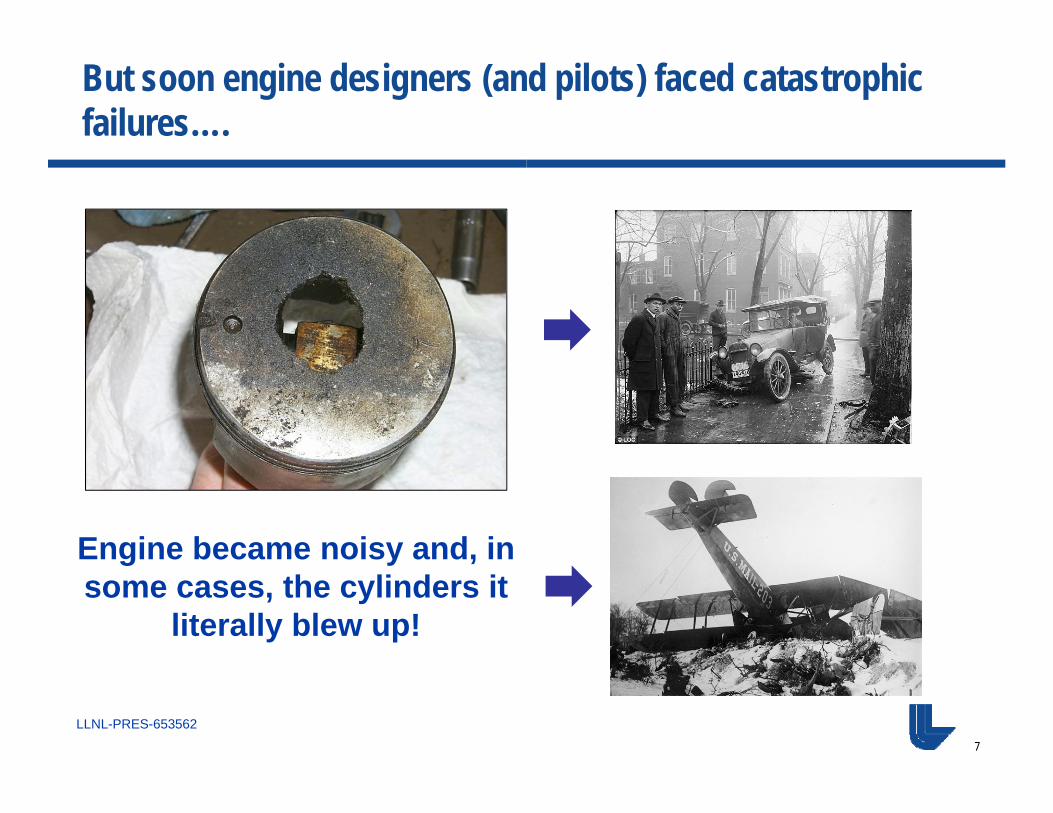
But soon engine designers (and pilots) faced catastrophic failures….
Engine became noisy and, in some cases, the cylinders it
literally blew up!
8
LLNL-PRES-653562
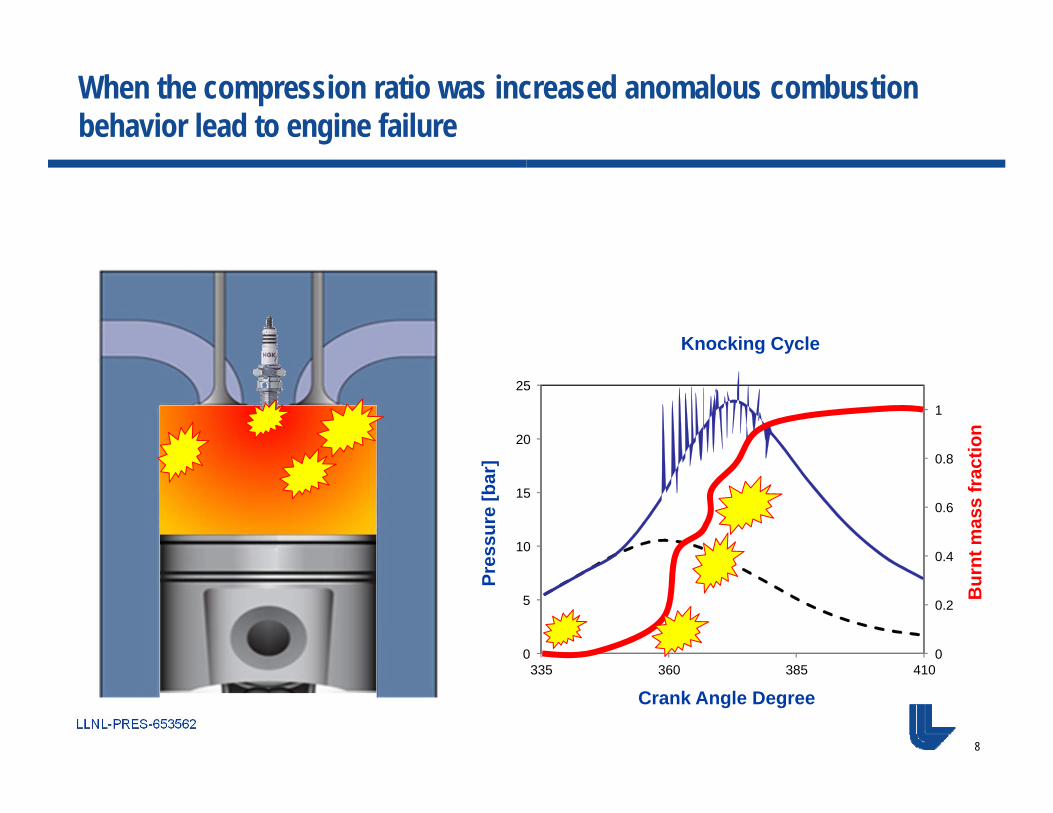
When the compression ratio was increased anomalous combustion behavior lead to engine failure
0
0.2
0.4
0.6
0.8
1
0
5
10
15
20
25
335 360 385 410
Pres
sure
[bar
]
Crank Angle Degree
Bur
nt m
ass
frac
tion
Knocking Cycle
9
LLNL-PRES-653562
H
•
R•
- RH
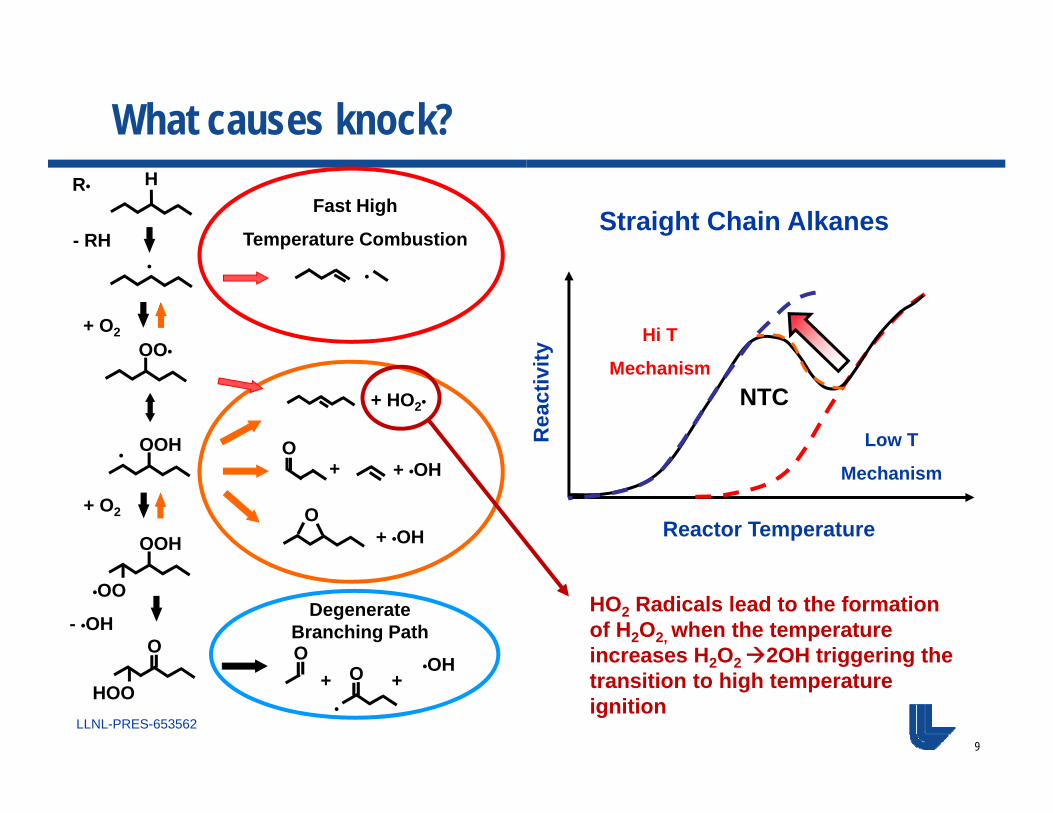
What causes knock?
Rea
ctiv
ityReactor Temperature
•
Fast High
Temperature Combustion
Hi T
Mechanism
Straight Chain Alkanes
NTC
+ O2
Degenerate Branching Path
OO•
OOH•
•OO
OOH
HOO
O
+ O2
- •OHO
O
•
•OH+ +
Low T
Mechanism
+ HO2•
+ •OH
+ •OHO
+
O
HO2 Radicals lead to the formation of H2O2, when the temperature increases H2O2 2OH triggering the transition to high temperature ignition
10
LLNL-PRES-653562
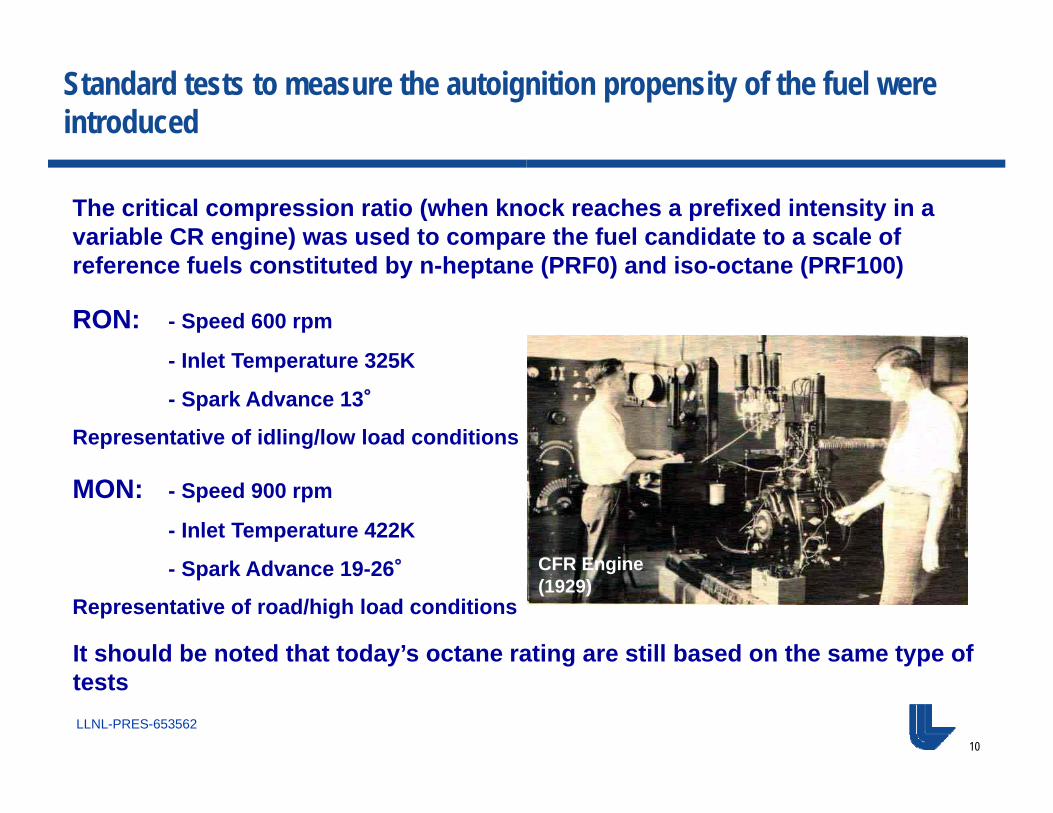
Standard tests to measure the autoignition propensity of the fuel were introduced
RON: - Speed 600 rpm
- Inlet Temperature 325K
- Spark Advance 13°
Representative of idling/low load conditions
MON: - Speed 900 rpm
- Inlet Temperature 422K
- Spark Advance 19-26°
Representative of road/high load conditions
The critical compression ratio (when knock reaches a prefixed intensity in a variable CR engine) was used to compare the fuel candidate to a scale of reference fuels constituted by n-heptane (PRF0) and iso-octane (PRF100)
CFR Engine (1929)
It should be noted that today’s octane rating are still based on the same type of tests
11
LLNL-PRES-653562
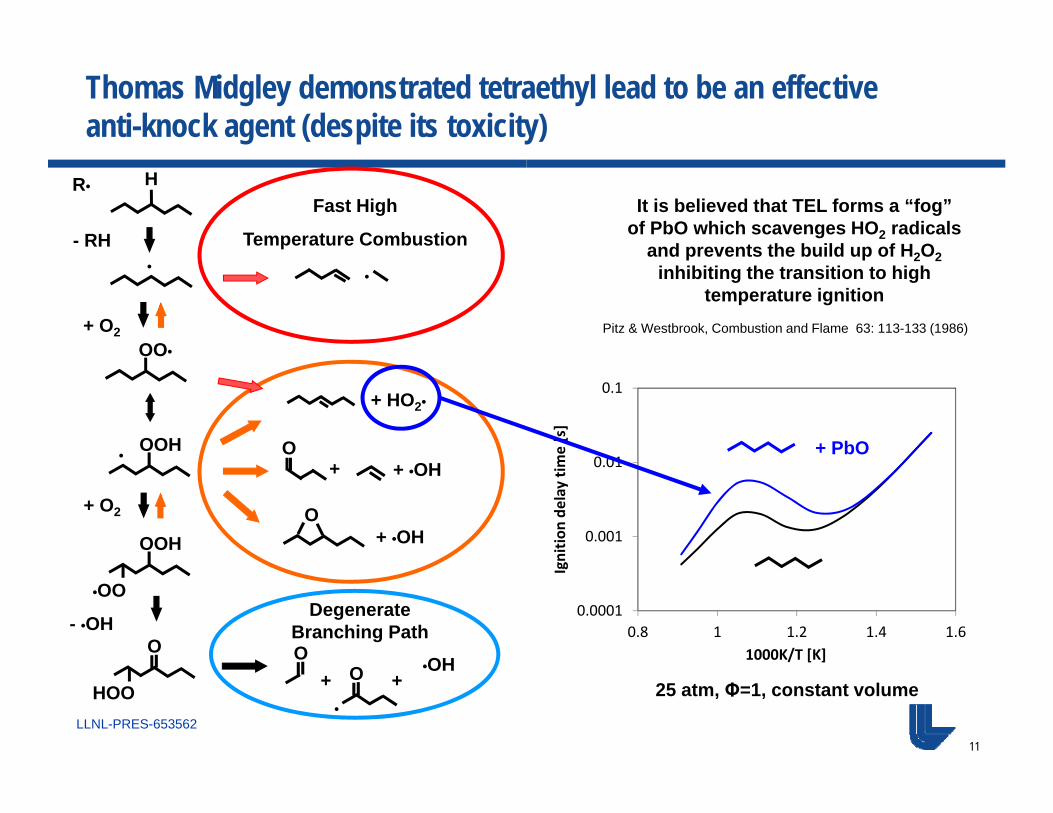
Thomas Midgley demonstrated tetraethyl lead to be an effective anti-knock agent (despite its toxicity)
H
•
R•
- RH
•
Fast High
Temperature Combustion
+ O2
Degenerate Branching Path
OO•
OOH•
•OO
OOH
HOO
O
+ O2
- •OHO
O
•
•OH+ +
+ HO2•
+ •OH
+ •OHO
+
O
It is believed that TEL forms a “fog” of PbO which scavenges HO2 radicals
and prevents the build up of H2O2inhibiting the transition to high
temperature ignition
0.0001
0.001
0.01
0.1
0.8 1 1.2 1.4 1.6
Ignitio
n de
lay tim
e [s]
1000K/T [K]
+ PbO
25 atm, Φ=1, constant volume
Pitz & Westbrook, Combustion and Flame 63: 113-133 (1986)
12
LLNL-PRES-653562
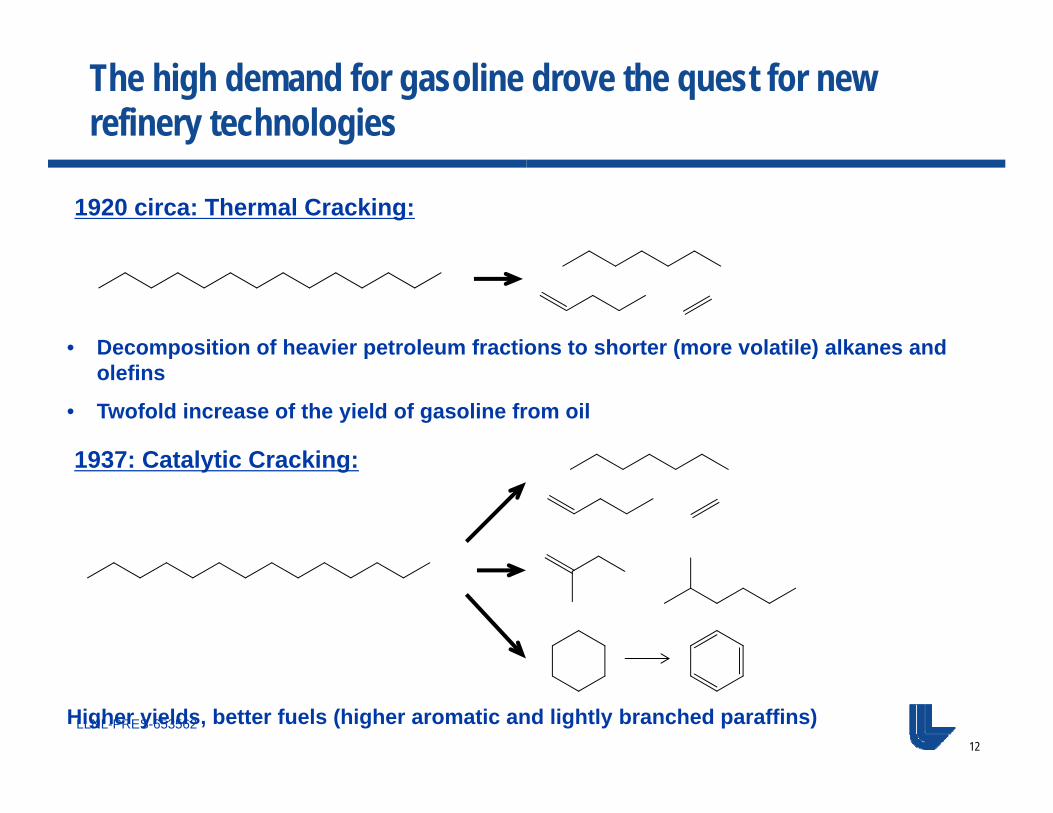
The high demand for gasoline drove the quest for new refinery technologies
1920 circa: Thermal Cracking:
• Decomposition of heavier petroleum fractions to shorter (more volatile) alkanes and olefins
• Twofold increase of the yield of gasoline from oil
1937: Catalytic Cracking:
Higher yields, better fuels (higher aromatic and lightly branched paraffins)
13
LLNL-PRES-653562
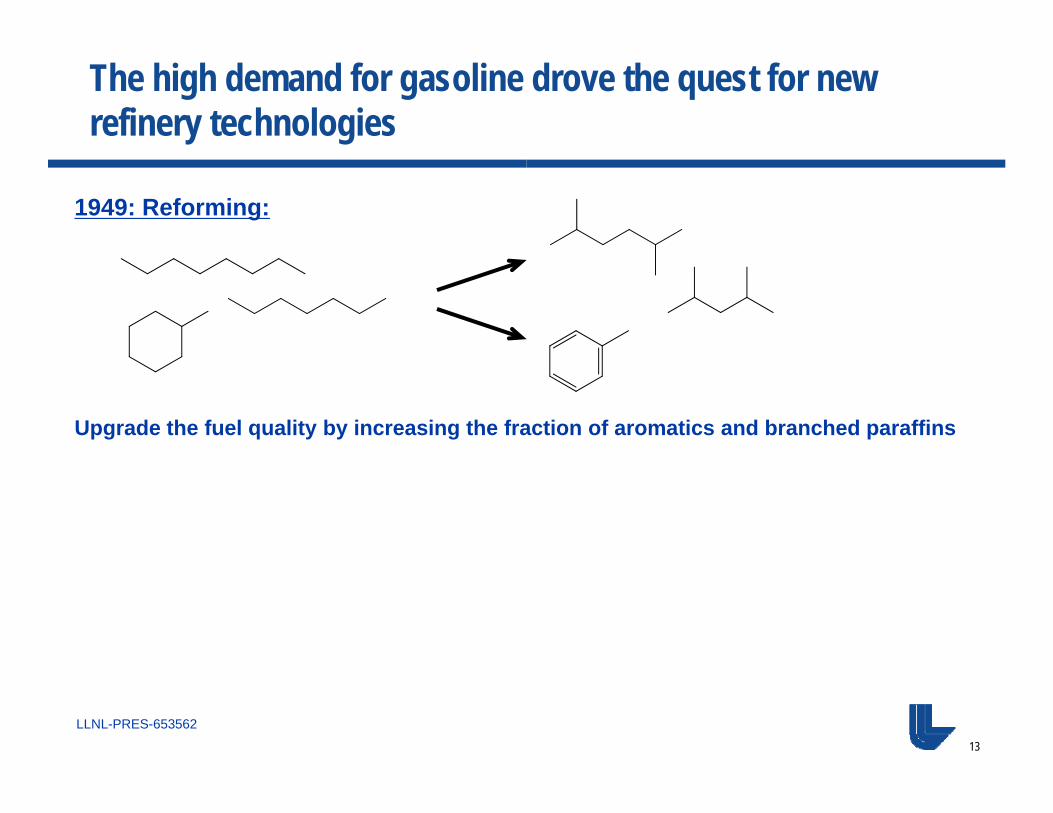
The high demand for gasoline drove the quest for new refinery technologies
1949: Reforming:
Upgrade the fuel quality by increasing the fraction of aromatics and branched paraffins
14
LLNL-PRES-653562
0.0001
0.001
0.01
0.1
0.8 1 1.2 1.4 1.6
Ignitio
n de
lay tim
e [s]
1000K/T [K]
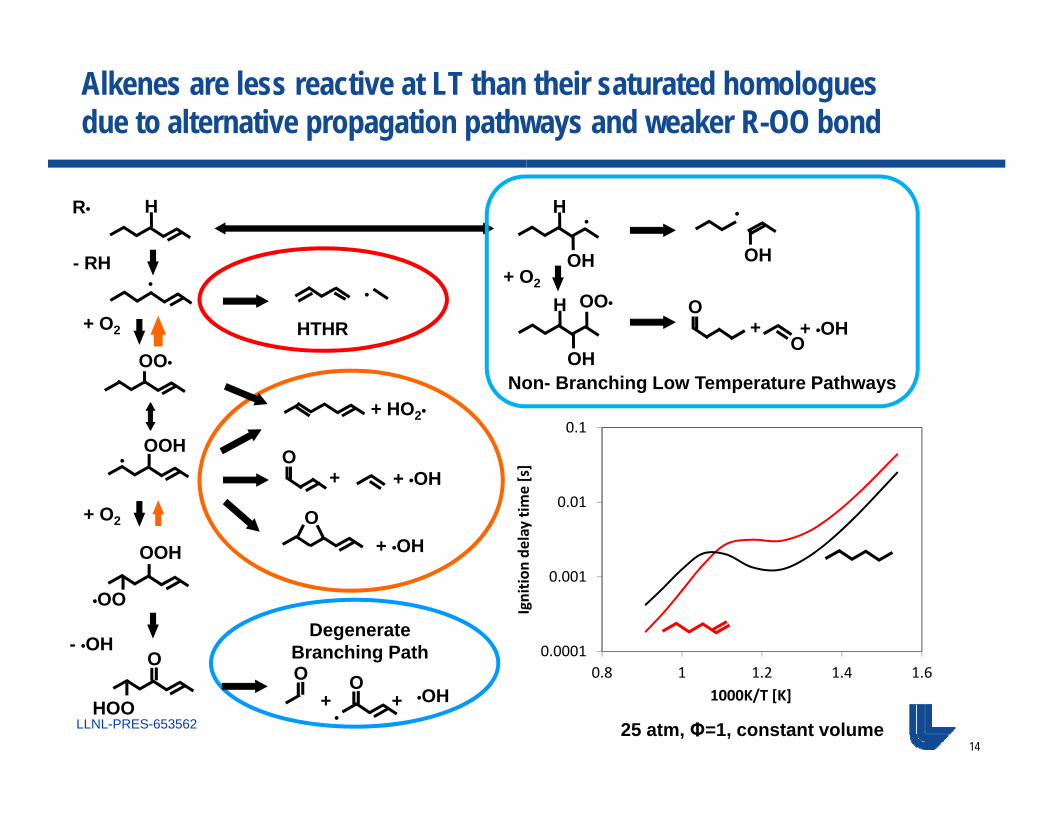
Alkenes are less reactive at LT than their saturated homologues due to alternative propagation pathways and weaker R-OO bond
•
R• H
- RH
+ O2
Degenerate Branching Path
OO•
OOH•
•OO
OOH
HOO
O
+ O2
- •OHO O
••OH+ +
+ HO2•
+ •OH
+ •OHO
+
O
•
HTHR
H
OH
•
+ O2
H
OH
OO•
OH
•
+ •OH+O
O
Non- Branching Low Temperature Pathways
25 atm, Φ=1, constant volume
15
LLNL-PRES-653562
0.0001
0.001
0.01
0.1
0.8 1 1.2 1.4 1.6
Ignitio
n de
lay tim
e [s]
1000K/T [K]
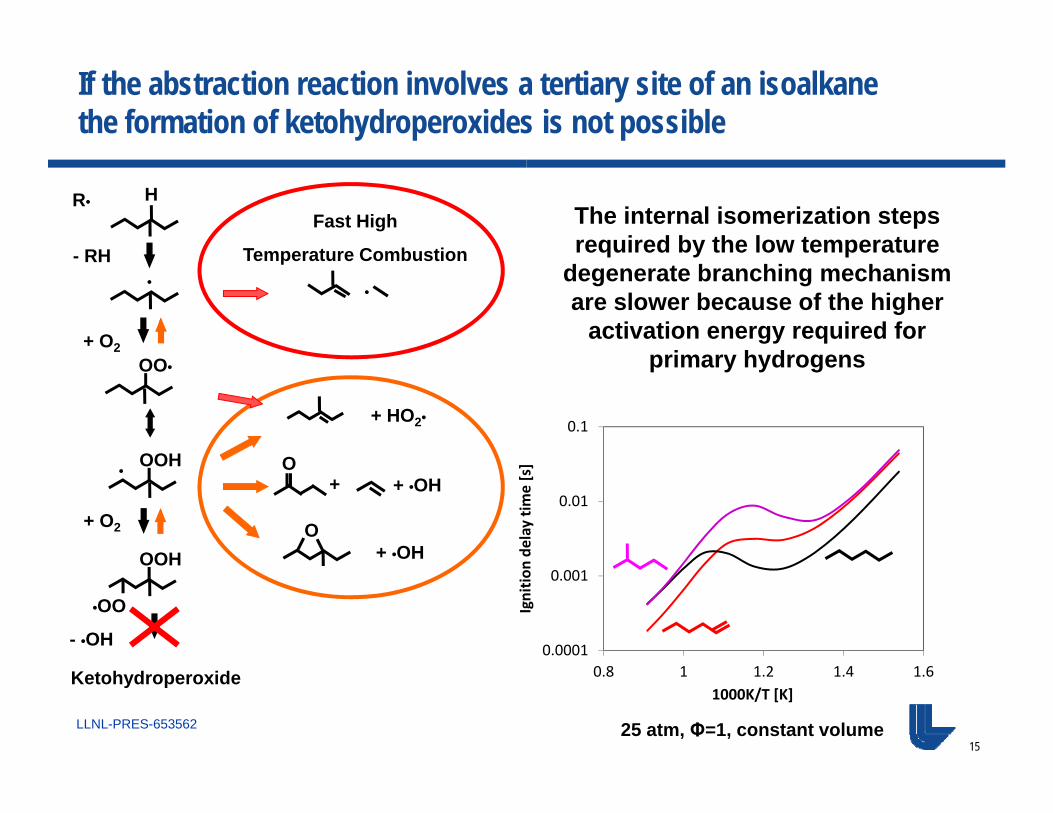
If the abstraction reaction involves a tertiary site of an isoalkanethe formation of ketohydroperoxides is not possible
H
•
R•
- RH
•
Fast High
Temperature Combustion
+ O2OO•
OOH•
•OO
OOH
+ O2
- •OH
+ HO2•
+ •OH
+ •OHO
+
O
Ketohydroperoxide
The internal isomerization steps required by the low temperature
degenerate branching mechanism are slower because of the higher
activation energy required for primary hydrogens
25 atm, Φ=1, constant volume
16
LLNL-PRES-653562
0.0001
0.001
0.01
0.1
0.8 1 1.2 1.4 1.6
Ignitio
n de
lay tim
e [s]
1000K/T [K]
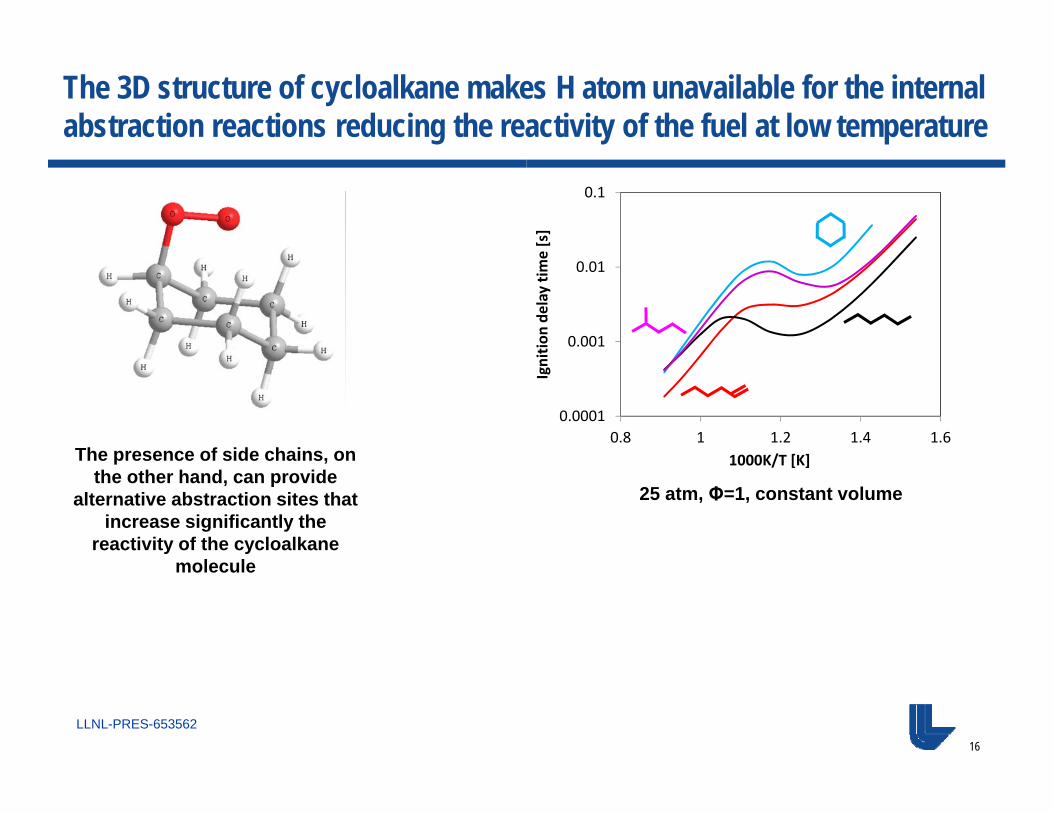
The 3D structure of cycloalkane makes H atom unavailable for the internal abstraction reactions reducing the reactivity of the fuel at low temperature
25 atm, Φ=1, constant volume
The presence of side chains, on the other hand, can provide
alternative abstraction sites that increase significantly the
reactivity of the cycloalkane molecule
17
LLNL-PRES-653562
0.0001
0.001
0.01
0.1
0.8 1 1.2 1.4 1.6
Ignitio
n de
lay tim
e [s]
1000K/T [K]
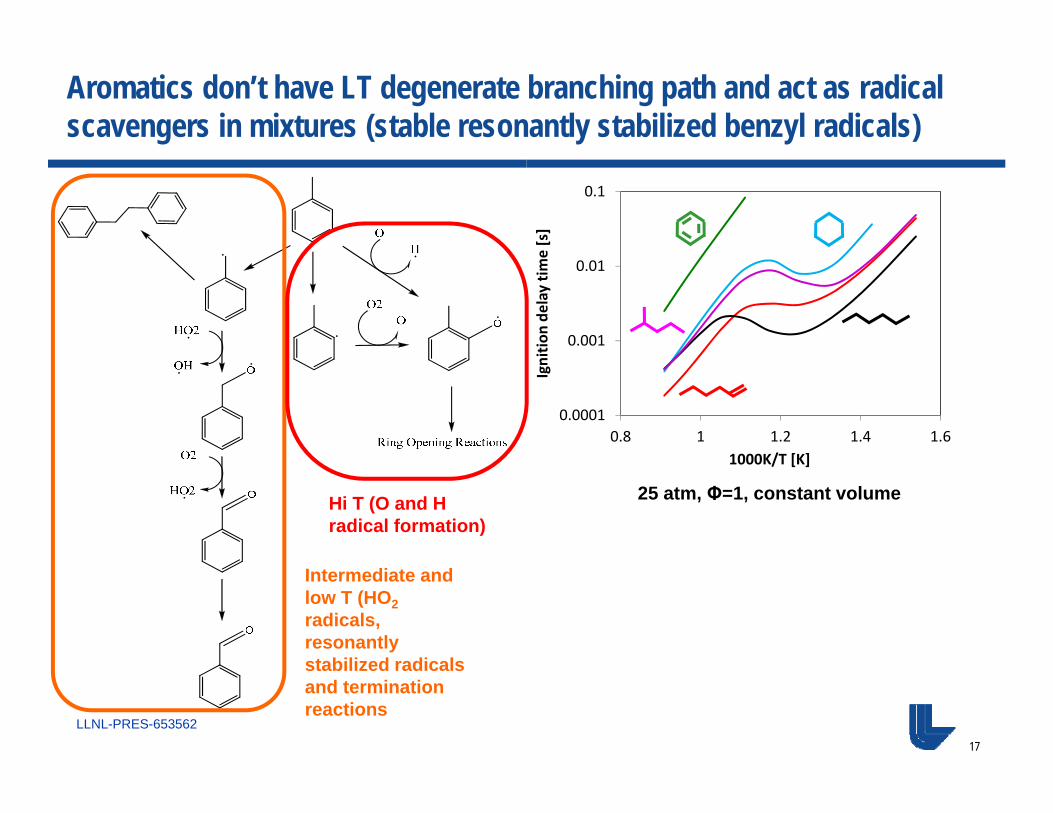
Aromatics don’t have LT degenerate branching path and act as radical scavengers in mixtures (stable resonantly stabilized benzyl radicals)
Hi T (O and H radical formation)
Intermediate and low T (HO2radicals, resonantly stabilized radicals and termination reactions
25 atm, Φ=1, constant volume
18
LLNL-PRES-653562
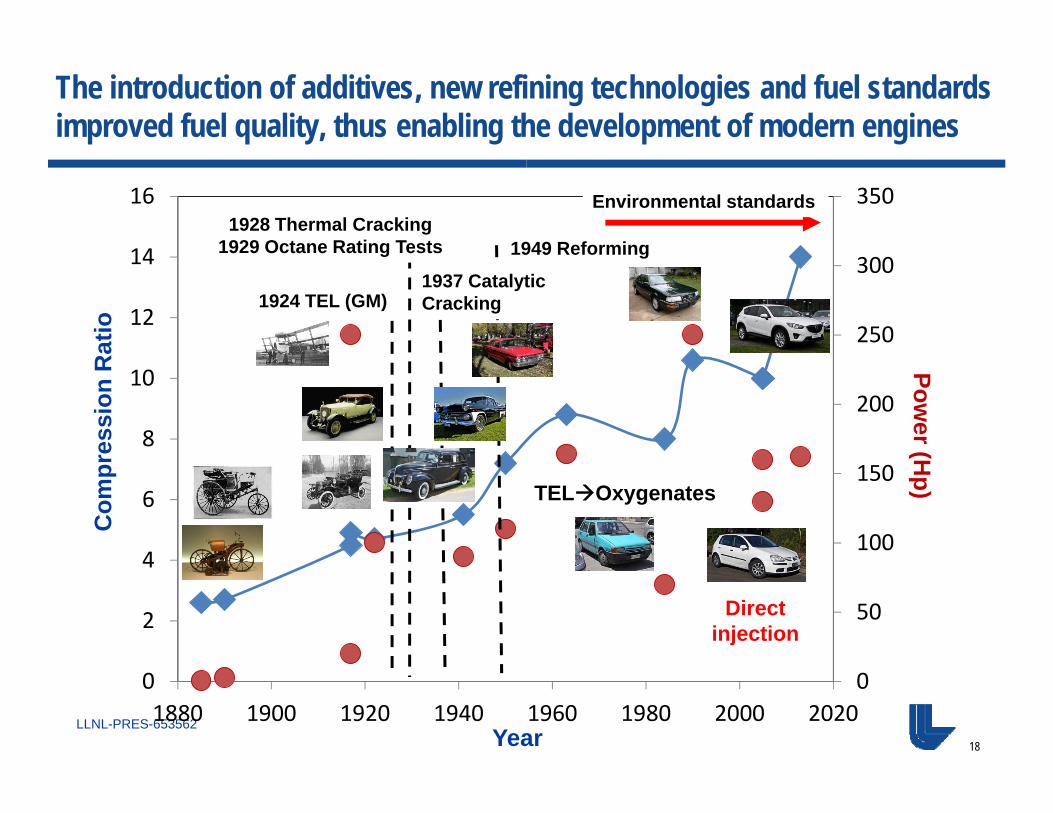
The introduction of additives, new refining technologies and fuel standards improved fuel quality, thus enabling the development of modern engines
0
50
100
150
200
250
300
350
0
2
4
6
8
10
12
14
16
1880 1900 1920 1940 1960 1980 2000 2020
Direct injection
1924 TEL (GM)
1928 Thermal Cracking 1929 Octane Rating Tests
TELOxygenates
1937 Catalytic Cracking
1949 Reforming
Environmental standards
Year
Power (H
p)C
ompr
essi
on R
atio
19
LLNL-PRES-653562
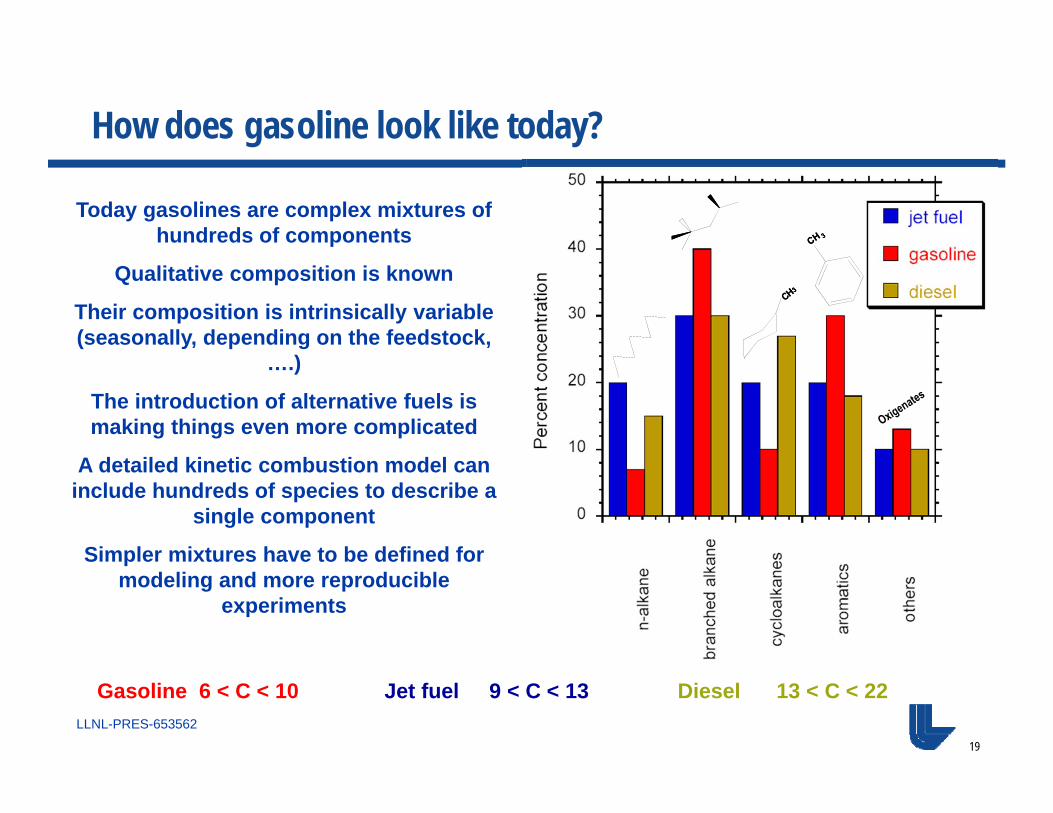
How does gasoline look like today?
Today gasolines are complex mixtures of hundreds of components
Qualitative composition is known
Their composition is intrinsically variable (seasonally, depending on the feedstock,
….)
The introduction of alternative fuels is making things even more complicated
A detailed kinetic combustion model can include hundreds of species to describe a
single component
Simpler mixtures have to be defined for modeling and more reproducible
experiments
Gasoline 6 < C < 10 Jet fuel 9 < C < 13 Diesel 13 < C < 22
20
LLNL-PRES-653562
Surrogate fuels allow to cope with the compositional complexity of real fuels
• Mixtures with a limited number of components (Surrogates) are generallyused to model the physical and chemical properties of real fuels both inmodeling and experimental studies (simplicity & consistency)
• The simplest surrogate for gasoline is considered to be iso-octane
• Primary reference fuels allow to characterize better the auto-ignition propensity allowing a finer tuning of the reactivity. The notion of AKI = (RON+MON)/2 (currently used in the US as a “road octane number”) was introduced and PRFs with that rating were used to simulate gasoline
• The shortcomings of these surrogates become evident when we are moving away from the operating conditions of old carbureted engines (DISI, Downsized, HCCI, …)
21
LLNL-PRES-653562
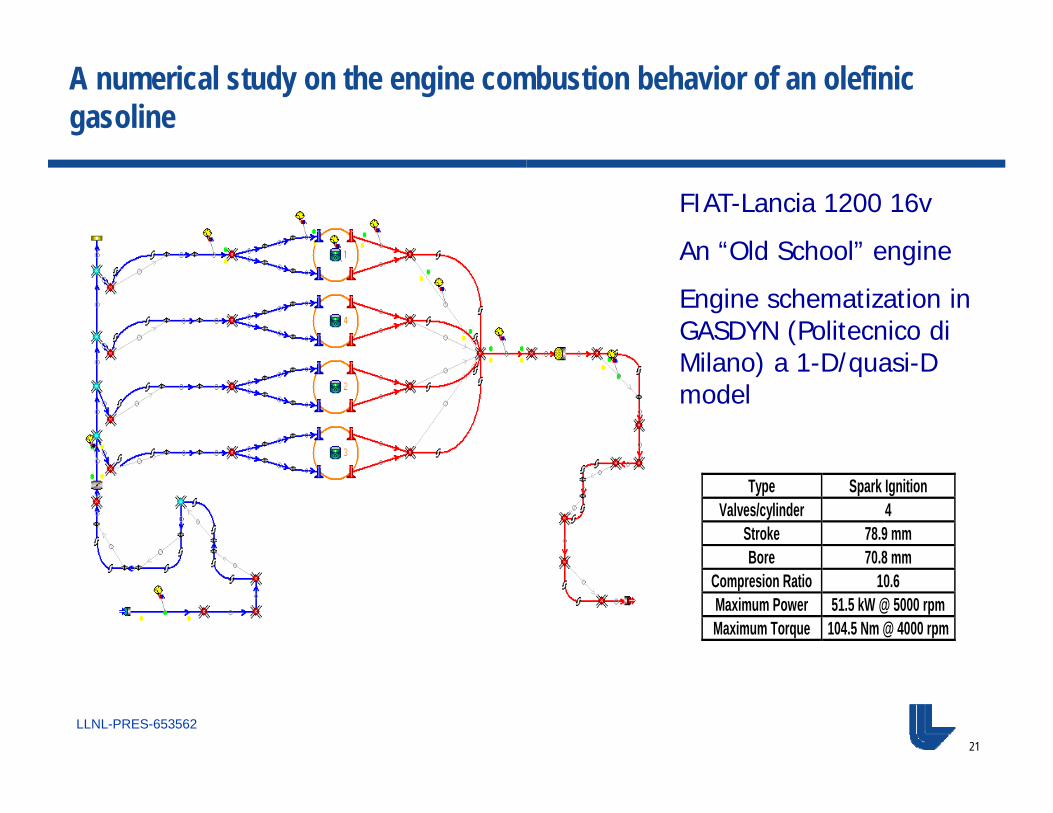
A numerical study on the engine combustion behavior of an olefinicgasoline
Type Spark Ignition Valves/cylinder 4
Stroke 78.9 mm Bore 70.8 mm
Compresion Ratio 10.6 Maximum Power 51.5 kW @ 5000 rpm Maximum Torque 104.5 Nm @ 4000 rpm
FIAT-Lancia 1200 16v
An “Old School” engine
Engine schematization in GASDYN (Politecnico di Milano) a 1-D/quasi-D model
22
LLNL-PRES-653562
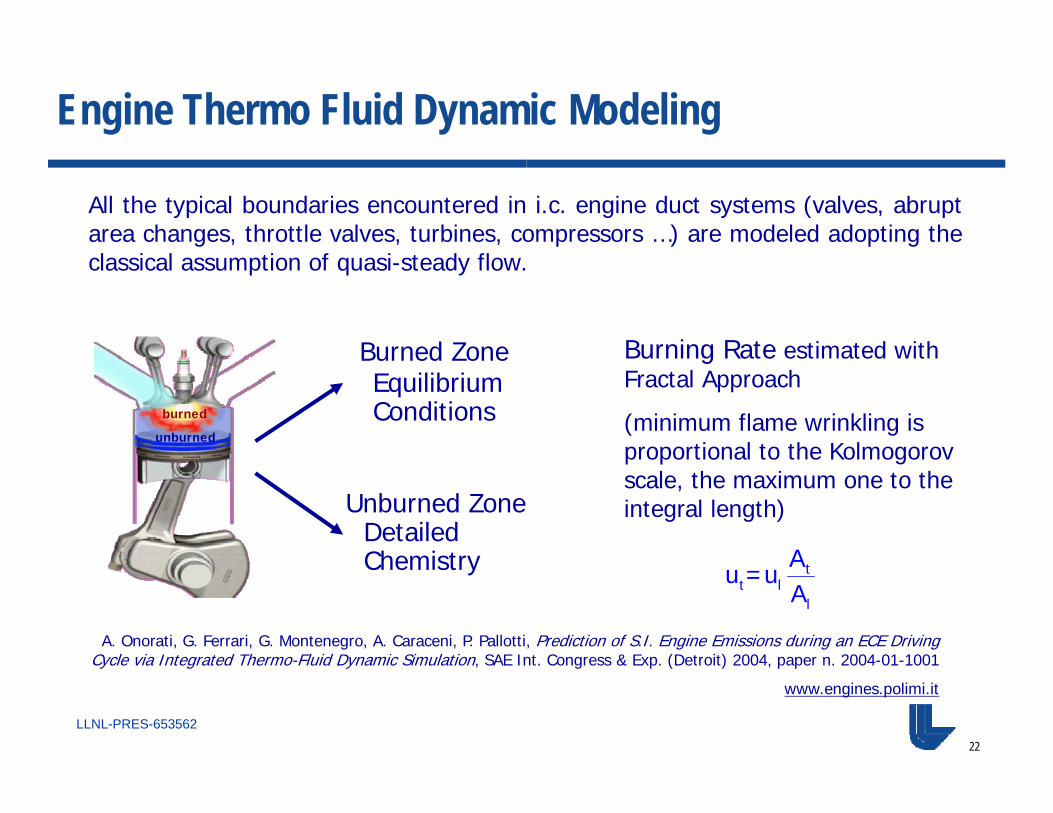
Engine Thermo Fluid Dynamic Modeling
All the typical boundaries encountered in i.c. engine duct systems (valves, abruptarea changes, throttle valves, turbines, compressors …) are modeled adopting theclassical assumption of quasi-steady flow.
A. Onorati, G. Ferrari, G. Montenegro, A. Caraceni, P. Pallotti, Prediction of S.I. Engine Emissions during an ECE Driving Cycle via Integrated Thermo-Fluid Dynamic Simulation, SAE Int. Congress & Exp. (Detroit) 2004, paper n. 2004-01-1001
www.engines.polimi.it
Burned ZoneEquilibrium Conditions
Unburned ZoneDetailed Chemistry
burned
unburned
burned
unburned
Burning Rate estimated with Fractal Approach
(minimum flame wrinkling is proportional to the Kolmogorov scale, the maximum one to the integral length)
tt l
l
Au =u
A
23
LLNL-PRES-653562
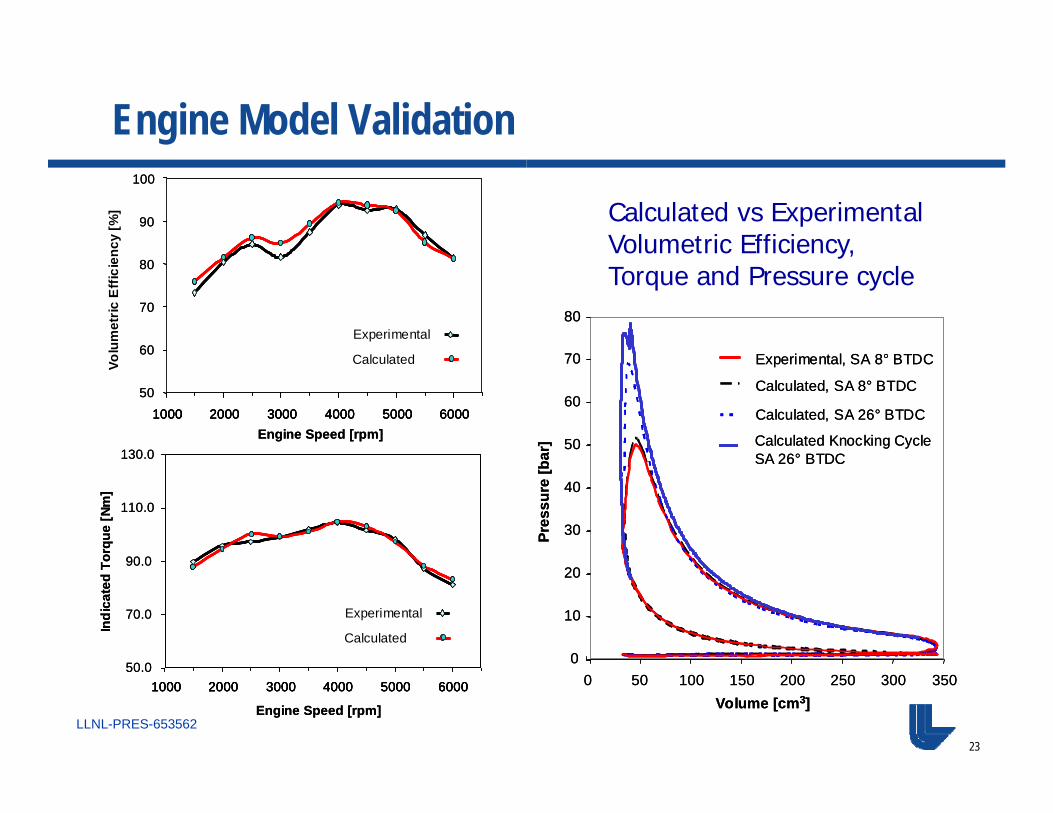
Engine Model Validation100
50
60
70
80
90
1000 2000 3000 4000 5000 60001000 2000 3000 4000 5000 6000
Experimental
CalculatedVolu
met
ric E
ffic
ienc
y [%
]
Engine Speed [rpm]
100
50
60
70
80
90
1000 2000 3000 4000 5000 60001000 2000 3000 4000 5000 6000
Experimental
CalculatedVolu
met
ric E
ffic
ienc
y [%
]
Engine Speed [rpm]
50.0
70.0
90.0
110.0
130.0
1000 2000 3000 4000 5000 60001000 2000 3000 4000 5000 6000
Engine Speed [rpm]
Indi
cate
d To
rque
[Nm
]
Experimental
Calculated
50.0
70.0
90.0
110.0
130.0
1000 2000 3000 4000 5000 60001000 2000 3000 4000 5000 6000
Engine Speed [rpm]
Indi
cate
d To
rque
[Nm
]
Experimental
Calculated
Calculated vs Experimental Volumetric Efficiency, Torque and Pressure cycle
0
10
20
30
40
50
60
70
0 50 100 150 200 250 300 350Volume [cm3]
Pres
sure
[bar
]
Calculated, SA 8° BTDC
Calculated, SA 26° BTDC
Experimental, SA 8° BTDC
80
Calculated Knocking CycleSA 26° BTDC
0
10
20
30
40
50
60
70
0 50 100 150 200 250 300 350Volume [cm3]
Pres
sure
[bar
]
Calculated, SA 8° BTDC
Calculated, SA 26° BTDC
Experimental, SA 8° BTDC
80
Calculated Knocking CycleSA 26° BTDC
24
LLNL-PRES-653562
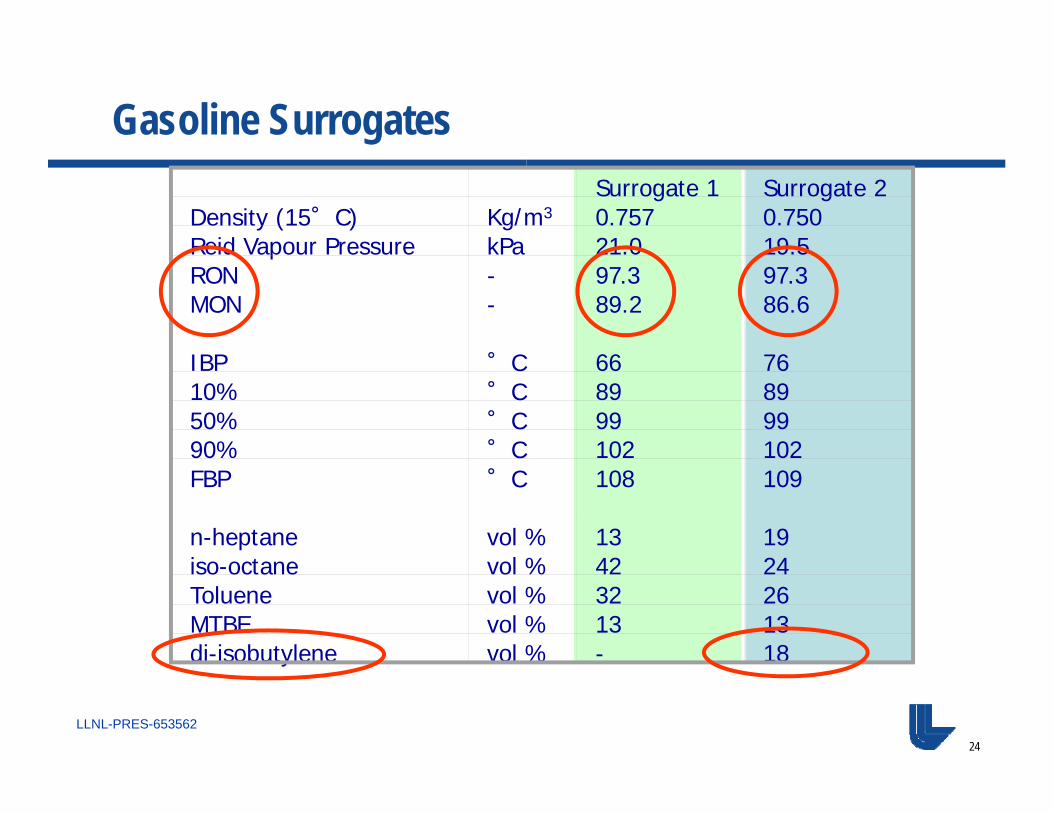
Gasoline SurrogatesSurrogate 1 Surrogate 2
Density (15°C) Kg/m3 0.757 0.750Reid Vapour Pressure kPa 21.0 19.5RON - 97.3 97.3MON - 89.2 86.6
IBP °C 66 7610% °C 89 8950% °C 99 9990% °C 102 102FBP °C 108 109
n-heptane vol % 13 19iso-octane vol % 42 24Toluene vol % 32 26MTBE vol % 13 13di-isobutylene vol % - 18
25
LLNL-PRES-653562
-18 -16 -14 -12 -10
1.43
0.99
1.10
1.24
14-1612-1410-128-106-84-62-40-2
-18 -16 -14 -12 -10
1.43
0.99
1.10
1.24
14-1612-1410-128-106-84-62-40-2
Spark Advance
Φ
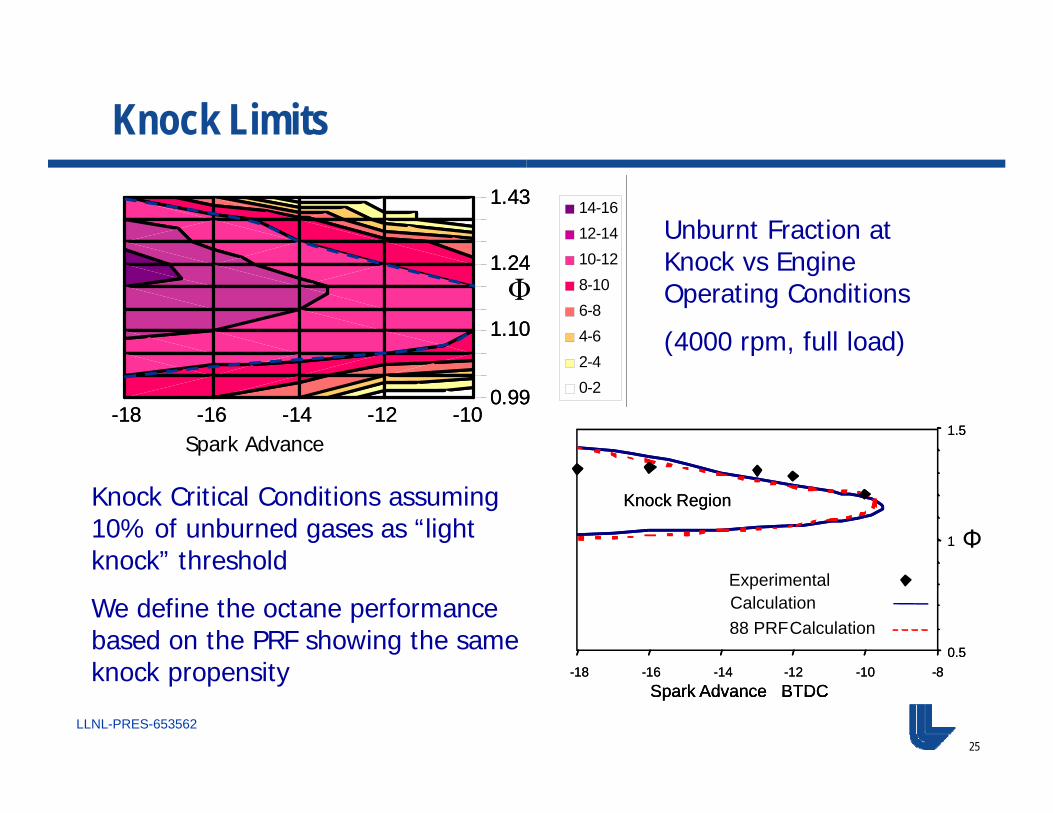
Unburnt Fraction at Knock vs Engine Operating Conditions
(4000 rpm, full load)
Knock Critical Conditions assuming 10% of unburned gases as “light knock” threshold
We define the octane performance based on the PRF showing the same knock propensity
0.5
1
1.5
-18 -16 -14 -12 -10 -8
Knock Region
Spark Advance BTDC
0.5
1
1.5
-18 -16 -14 -12 -10 -8
Knock Region
Spark Advance BTDC
ExperimentalSurrogate Calculation88 PRF Calculation
?
0.5
1
1.5
-18 -16 -14 -12 -10 -8
Knock Region
Spark Advance BTDC
0.5
1
1.5
-18 -16 -14 -12 -10 -8
Knock Region
Spark Advance BTDC
ExperimentalCalculation88 PRF Calculation
Φ
Knock Limits
26
LLNL-PRES-653562
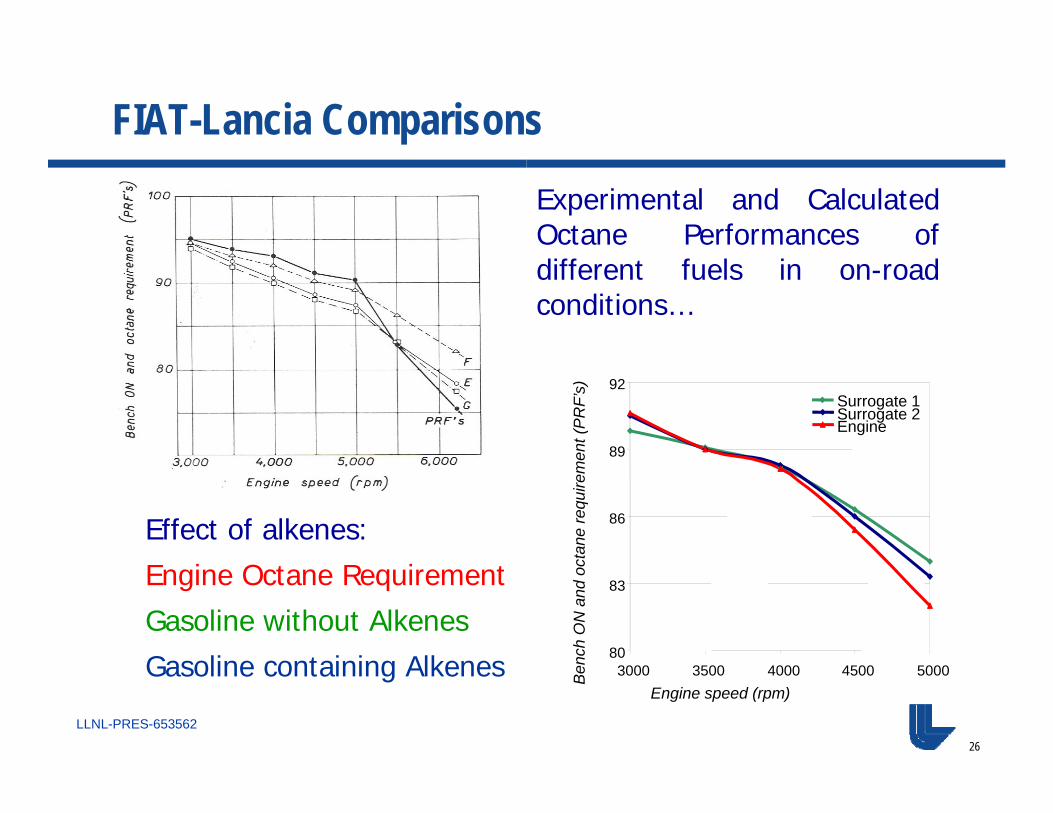
FIAT-Lancia ComparisonsExperimental and CalculatedOctane Performances ofdifferent fuels in on-roadconditions…
Effect of alkenes:Engine Octane RequirementGasoline without AlkenesGasoline containing Alkenes
80
83
86
89
92
3000 3500 4000 4500 5000
Surrogate 1Surrogate 2Engine
Engine speed (rpm)
Ben
ch O
N a
nd o
ctan
e re
quire
men
t (P
RF’
s)

27
LLNL-PRES-653562
Effect of Turbocharging
Turbocharged conditions highlightthe better octane performances ofsurrogate 2 (containing alkenes)
TurboCharged Engine
The lower reactivity of alkenes at lowT and high P allows higher pressureboost.
2000 2500 3000 3500 4000 4500 5000
Benc
hO
N (P
RF’s
)
86
88
90
92
94
96
Engine speed [rpm]
b)
Surrogate 1
Surrogate 2
2000 2500 3000 3500 4000 4500 5000
Benc
hO
N (P
RF’s
)
86
88
90
92
94
96
Engine speed [rpm]
b)
2000 2500 3000 3500 4000 4500 5000
Benc
hO
N (P
RF’s
)
86
88
90
92
94
96
Engine speed [rpm]2000 2500 3000 3500 4000 4500 5000
Benc
hO
N (P
RF’s
)
86
88
90
92
94
96
Engine speed [rpm]
b)
Surrogate 1
Surrogate 2Surrogate 1Surrogate 2
1.0
1.2
1.4
1.6
1.8
criti
cal a
bsol
ute
pres
sure
(bar
)
2000 2500 3000 3500 4000 4500 5000
Engine speed [rpm]
a)
Surrogate 1
Surrogate 2
1.0
1.2
1.4
1.6
1.8
criti
cal a
bsol
ute
pres
sure
(bar
)
2000 2500 3000 3500 4000 4500 5000
Engine speed [rpm]
a)1.0
1.2
1.4
1.6
1.8
criti
cal a
bsol
ute
pres
sure
(bar
)
2000 2500 3000 3500 4000 4500 5000
Engine speed [rpm]
1.0
1.2
1.4
1.6
1.8
criti
cal a
bsol
ute
pres
sure
(bar
)
2000 2500 3000 3500 4000 4500 5000
Engine speed [rpm]
a)
Surrogate 1
Surrogate 2
Surrogate 1Surrogate 2
28
LLNL-PRES-653562
600 650 700 750 800 850 900 950 1000
10
20
30
40
50
60
70
T [K]
Pre
ssur
e[b
ar]
600 650 700 750 800 850 900 950 1000
10
20
30
40
50
60
70
T [K]
Pre
ssur
e[b
ar]
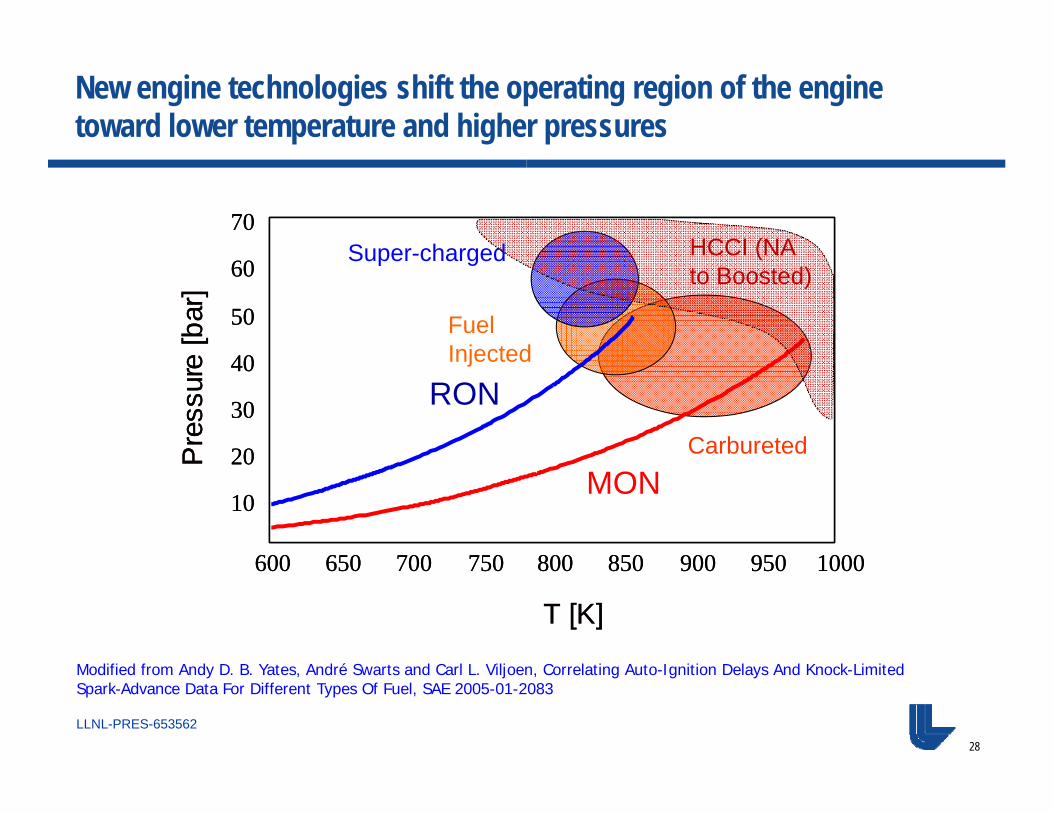
MON
RON
Super-charged
Carbureted
Fuel Injected
Modified from Andy D. B. Yates, André Swarts and Carl L. Viljoen, Correlating Auto-Ignition Delays And Knock-Limited Spark-Advance Data For Different Types Of Fuel, SAE 2005-01-2083
New engine technologies shift the operating region of the engine toward lower temperature and higher pressures
HCCI (NA to Boosted)
29
LLNL-PRES-653562
T [K]
600 650 700 750 800 850 900 950 10001
10
20
30
40
50
P [B
ar]
T [K]
600 650 700 750 800 850 900 950 10001
10
20
30
40
50
P [B
ar]
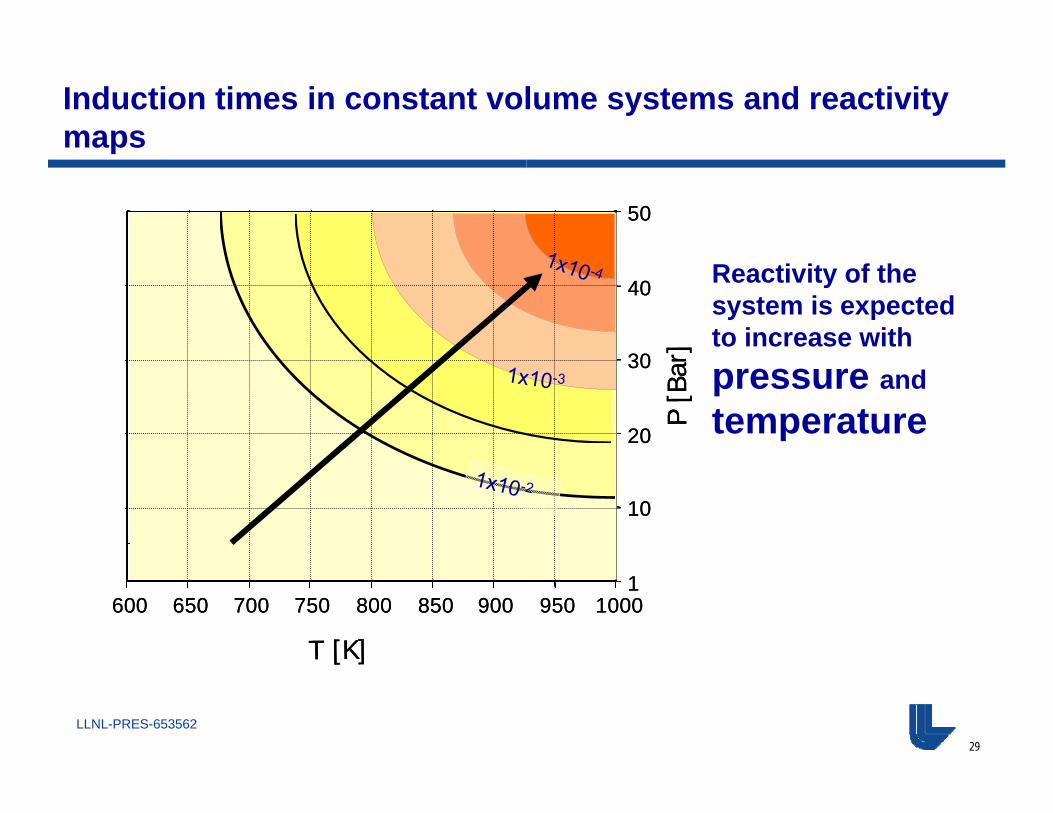
Induction times in constant volume systems and reactivity maps
Reactivity of the system is expected to increase with pressure andtemperature
30
LLNL-PRES-653562
600 650 700 750 800 850 900 950 1000
10
20
30
40
50
60
70
Pre
ssur
e [b
ar]
T[K]
600 650 700 750 800 850 900 950 1000
10
20
30
40
50
60
70
Pre
ssur
e [b
ar]
T[K]
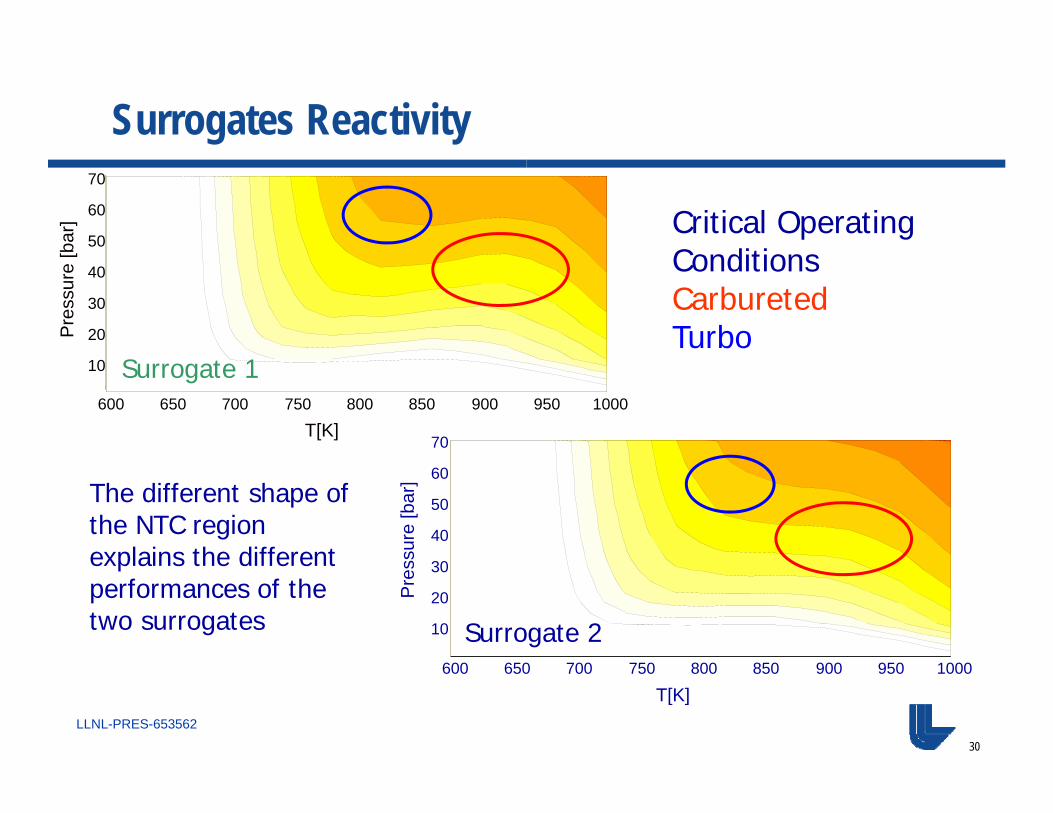
Surrogates Reactivity
Critical Operating Conditions in Carbureted and Turbo Engines
The different shape of the NTC region explains the different performances of the two surrogates
Surrogate 1
Surrogate 2
31
LLNL-PRES-653562
More complex surrogates are needed for today’s engines – Can we use a kinetic model to assist the development of better surrogates???
• As we have seen, engine technology and fuel quality has changed substantially from the ‘20s
Are the standards defined back then, based on the ignition behavior of PRFs, still relevant to the combustion behavior of gasoline in modern engines?
• Mixtures of saturated, unsaturated, oxygenated, aromatic compounds are needed to reproduce correctly the reactivity of the fuel
• A predictive model should take into account fuel effects on combustion and emissions
32
LLNL-PRES-653562
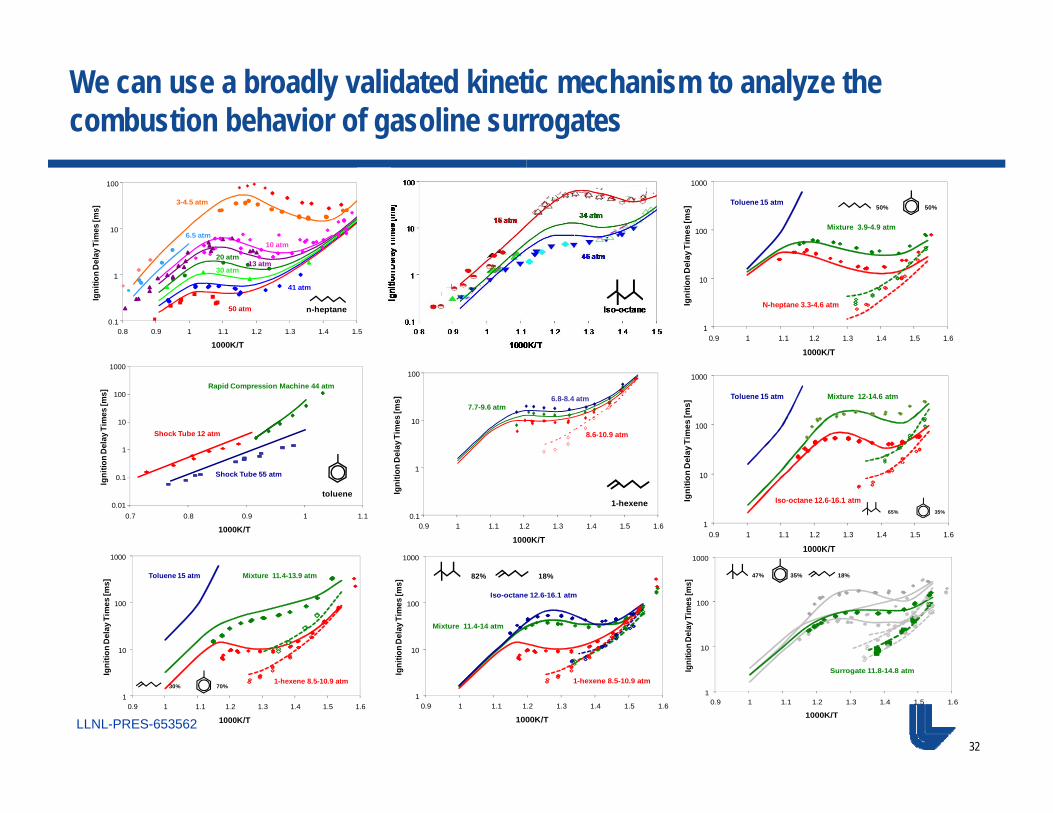
We can use a broadly validated kinetic mechanism to analyze the combustion behavior of gasoline surrogates
0.1
1
10
100
50 atm
41 atm
20 atm
6.5 atm10 atm
13 atm
3-4.5 atm
30 atm
n-heptane
0.8 0.9 1 1.1 1.2 1.3 1.4 1.5
1000K/T
Igni
tion
Del
ay T
imes
[ms]
1
Igni
tion
Del
ay T
imes
[ms]
toluene
0.7 0.8 0.9 1 1.1
1000K/T
Shock Tube 12 atm
Shock Tube 55 atm
Rapid Compression Machine 44 atm
10
1000
100
0.1
0.010.1
1
10
100
1-hexene
0.9 1 1.1 1.2 1.3 1.4 1.5 1.6
1000K/T
8.6-10.9 atm
6.8-8.4 atm7.7-9.6 atm
Igni
tion
Del
ay T
imes
[ms]
1
10
100
1000
0.9 1 1.1 1.2 1.3 1.4 1.5 1.6
1000K/T
Igni
tion
Del
ay T
imes
[ms]
Toluene 15 atm
Mixture 3.9-4.9 atm
N-heptane 3.3-4.6 atm
1
10
100
1000
0.9 1 1.1 1.2 1.3 1.4 1.5 1.6
1000K/T
Igni
tion
Del
ay T
imes
[ms]
Toluene 15 atm
Iso-octane 12.6-16.1 atm
Mixture 12-14.6 atm
1
10
100
1000
0.9 1 1.1 1.2 1.3 1.4 1.5 1.6
1000K/T
Igni
tion
Del
ay T
imes
[ms]
Toluene 15 atm
1-hexene 8.5-10.9 atm
Mixture 11.4-13.9 atm
1
10
100
1000
0.9 1 1.1 1.2 1.3 1.4 1.5 1.6
1000K/T
Igni
tion
Del
ay T
imes
[ms]
1-hexene 8.5-10.9 atm
Iso-octane 12.6-16.1 atm
Mixture 11.4-14 atm
1
10
100
1000
0.9 1 1.1 1.2 1.3 1.4 1.5 1.6
1000K/T
Igni
tion
Dela
y Tim
es [m
s]
Surrogate 11.8-14.8 atm
47% 35% 18%
50% 50%
65% 35%
30% 70%
82% 18%

33
LLNL-PRES-653562
How does the presence of aromatics, olefins and oxygenates influence the reactivity of a fuel?
1.00E-04
1.00E-03
1.00E-02
1.00E-01
0.8 1 1.2 1.4 1.6
1000K/T
Igni
tion
Del
ay T
imes
[s]
1.00E-04
1.00E-03
1.00E-02
1.00E-01
0.8 1 1.2 1.4 1.6
AKI=85, SEN=15
The two octane numbers (RON and MON) are used to determine theAKI=(RON+MON)/2 and the sensitivity (RON-MON) of the fuel to theoperating conditions
AKI=0, SEN=0
AKI=85, SEN=3
AKI=100, SEN=0
34
LLNL-PRES-653562
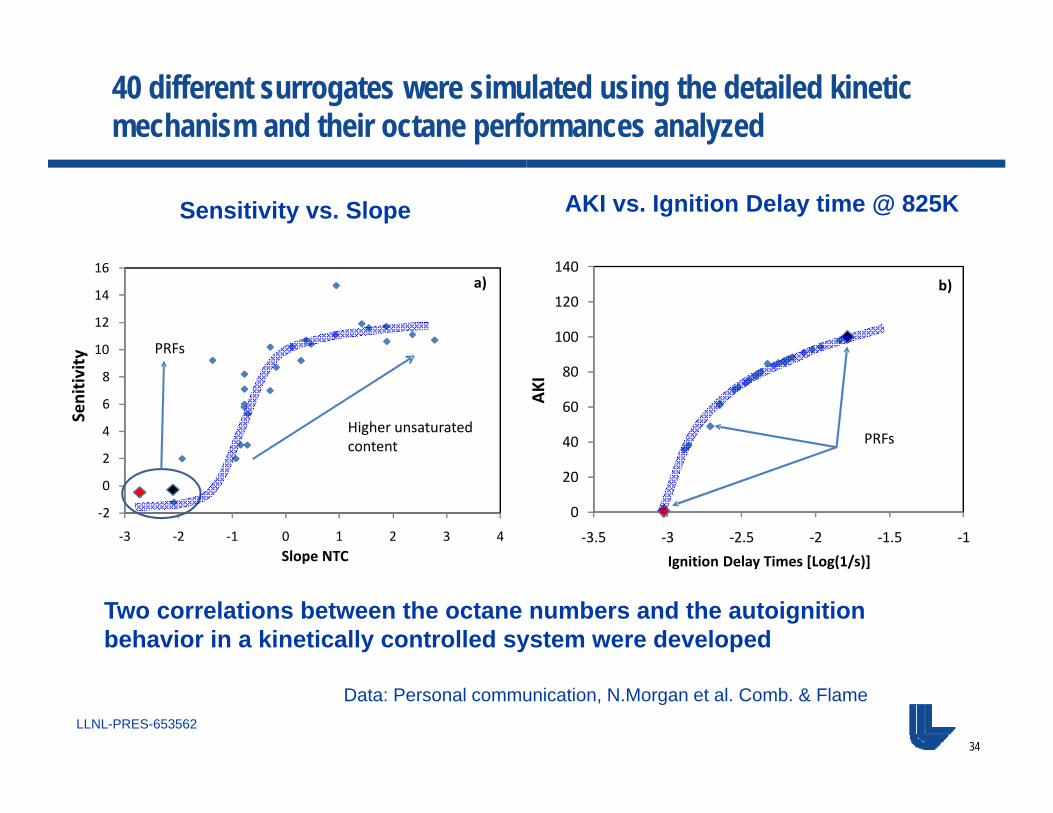
40 different surrogates were simulated using the detailed kinetic mechanism and their octane performances analyzed
Sensitivity vs. Slope AKI vs. Ignition Delay time @ 825K
Two correlations between the octane numbers and the autoignition behavior in a kinetically controlled system were developed
Data: Personal communication, N.Morgan et al. Comb. & Flame
‐2
0
2
4
6
8
10
12
14
16
‐3 ‐2 ‐1 0 1 2 3 4
PRFs
Higher unsaturated content
Slope NTC
Senitiv
ity
a)
0
20
40
60
80
100
120
140
‐3.5 ‐3 ‐2.5 ‐2 ‐1.5 ‐1
PRFs
Ignition Delay Times [Log(1/s)] AK
I
b)
35
LLNL-PRES-653562
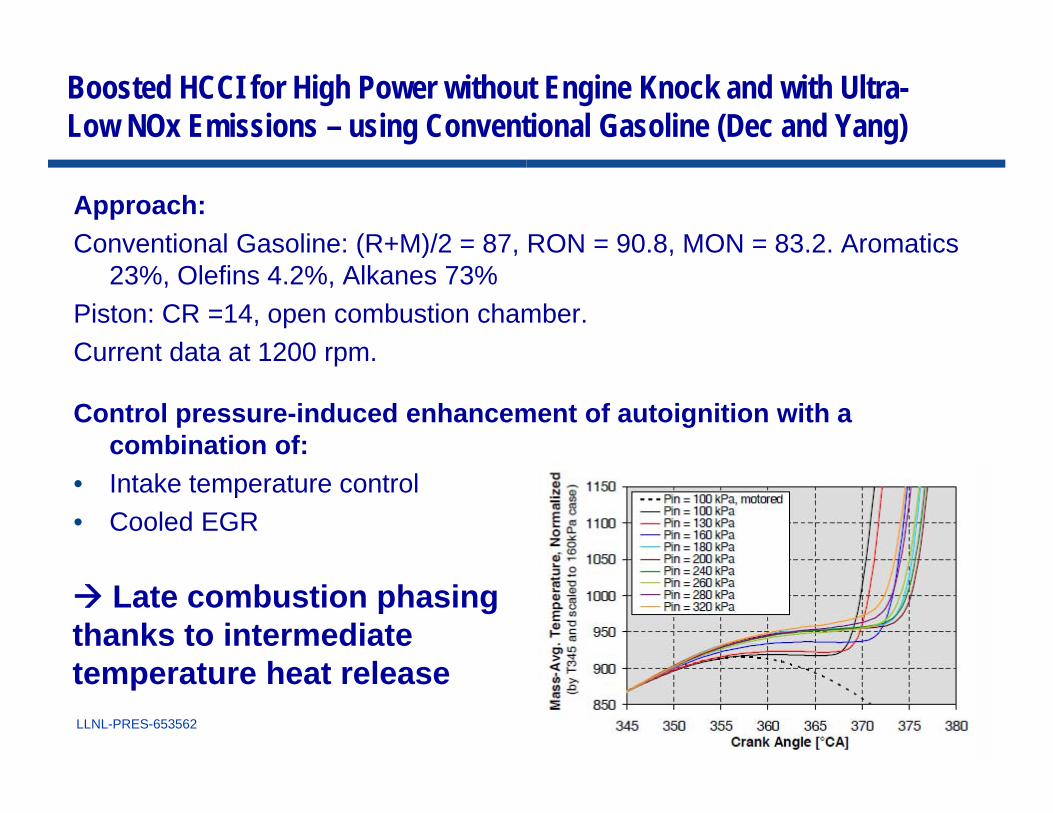
Boosted HCCI for High Power without Engine Knock and with Ultra-Low NOx Emissions – using Conventional Gasoline (Dec and Yang)
Approach:Conventional Gasoline: (R+M)/2 = 87, RON = 90.8, MON = 83.2. Aromatics
23%, Olefins 4.2%, Alkanes 73%Piston: CR =14, open combustion chamber.Current data at 1200 rpm.
Control pressure-induced enhancement of autoignition with a combination of:
• Intake temperature control• Cooled EGR
Late combustion phasing thanks to intermediate temperature heat release
36
LLNL-PRES-653562
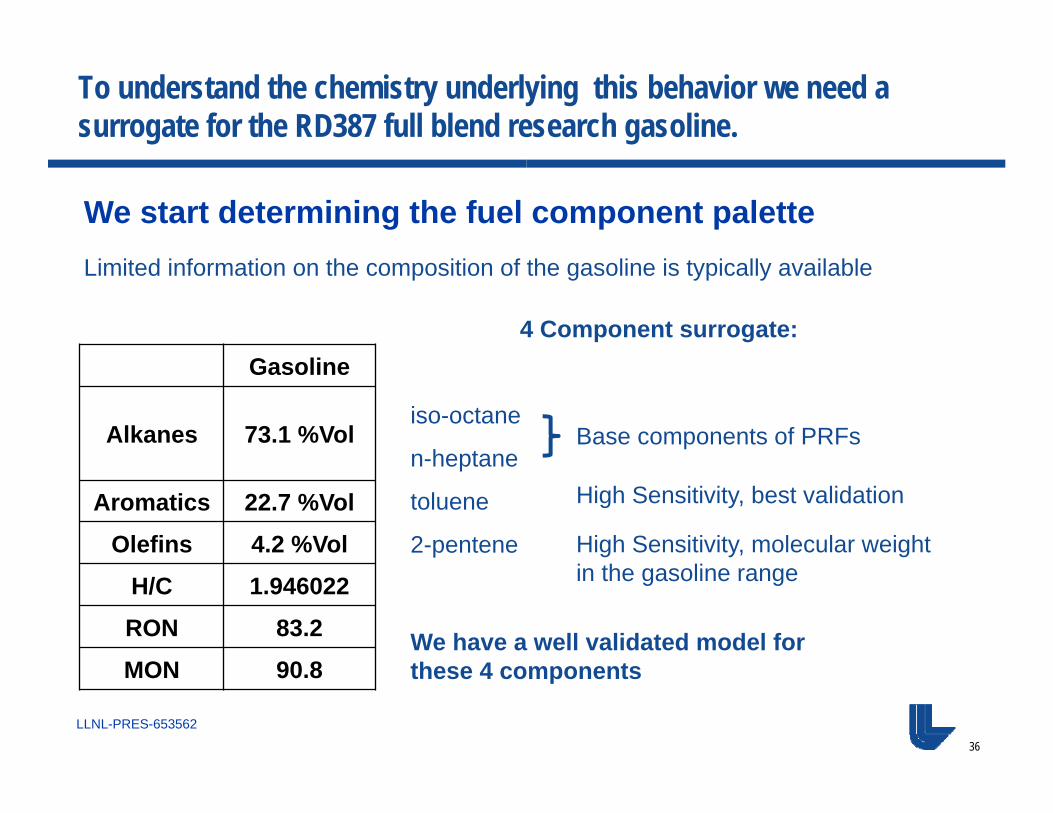
To understand the chemistry underlying this behavior we need a surrogate for the RD387 full blend research gasoline.
Gasoline
Alkanes 73.1 %Vol
Aromatics 22.7 %Vol
Olefins 4.2 %Vol
H/C 1.946022
RON 83.2
MON 90.8
4 Component surrogate:
iso-octane
n-heptane
toluene
2-pentene
Base components of PRFs
High Sensitivity, best validation
High Sensitivity, molecular weight in the gasoline range
Limited information on the composition of the gasoline is typically available
We have a well validated model for these 4 components
We start determining the fuel component palette
37
LLNL-PRES-653562
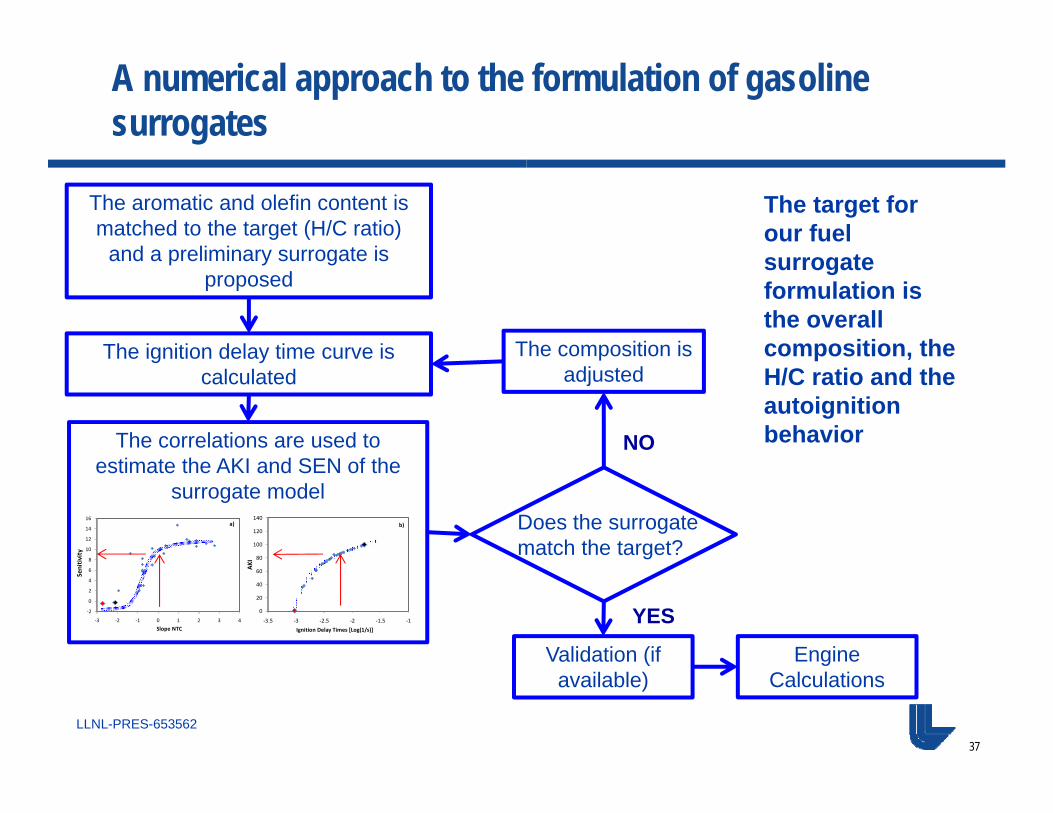
A numerical approach to the formulation of gasoline surrogates
The aromatic and olefin content is matched to the target (H/C ratio)
and a preliminary surrogate is proposed
The ignition delay time curve is calculated
The composition is adjusted
The correlations are used to estimate the AKI and SEN of the
surrogate model
‐2
0
2
4
6
8
10
12
14
16
‐3 ‐2 ‐1 0 1 2 3 4Slope NTC
Senitiv
ity
a)
0
20
40
60
80
100
120
140
‐3.5 ‐3 ‐2.5 ‐2 ‐1.5 ‐1Ignition Delay Times [Log(1/s)]
AKI
b)
Validation (if available)
Engine Calculations
NO
YES
Does the surrogate match the target?
The target for our fuel surrogate formulation is the overall composition, the H/C ratio and the autoignitionbehavior
38
LLNL-PRES-653562
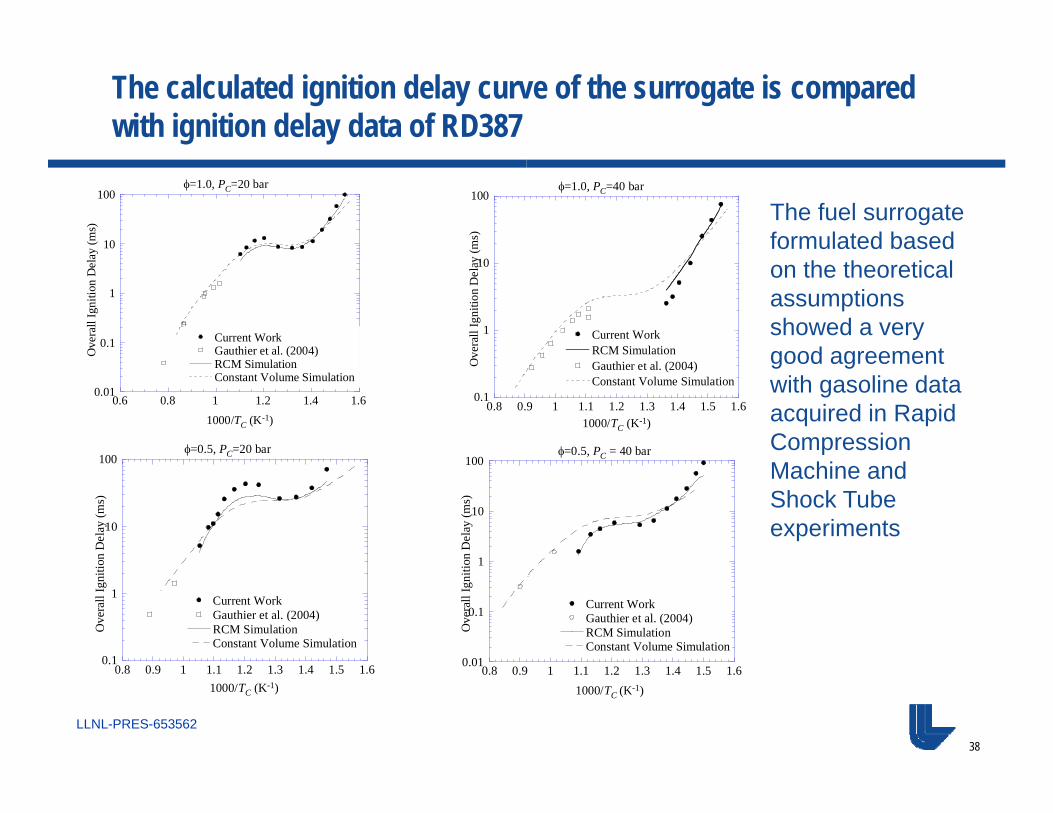
The calculated ignition delay curve of the surrogate is compared with ignition delay data of RD387
0.01
0.1
1
10
100
0.6 0.8 1 1.2 1.4 1.6
Current WorkGauthier et al. (2004)RCM SimulationConstant Volume Simulation
Ove
rall
Igni
tion
Del
ay (m
s)
1000/TC (K-1)
=1.0, PC=20 bar
0.1
1
10
100
0.8 0.9 1 1.1 1.2 1.3 1.4 1.5 1.6
Current WorkGauthier et al. (2004)RCM SimulationConstant Volume Simulation
Ove
rall
Igni
tion
Del
ay (m
s)
1000/TC (K-1)
=0.5, PC=20 bar
0.01
0.1
1
10
100
0.8 0.9 1 1.1 1.2 1.3 1.4 1.5 1.6
Current WorkGauthier et al. (2004)RCM SimulationConstant Volume Simulation
Ove
rall
Igni
tion
Del
ay (m
s)
1000/TC (K-1)
=0.5, PC = 40 bar
0.1
1
10
100
0.8 0.9 1 1.1 1.2 1.3 1.4 1.5 1.6
Current WorkRCM SimulationGauthier et al. (2004)Constant Volume Simulation
Ove
rall
Igni
tion
Del
ay (m
s)
1000/TC (K-1)
=1.0, PC=40 bar
The fuel surrogate formulated based on the theoretical assumptions showed a very good agreement with gasoline data acquired in Rapid Compression Machine and Shock Tube experiments
39
LLNL-PRES-653562
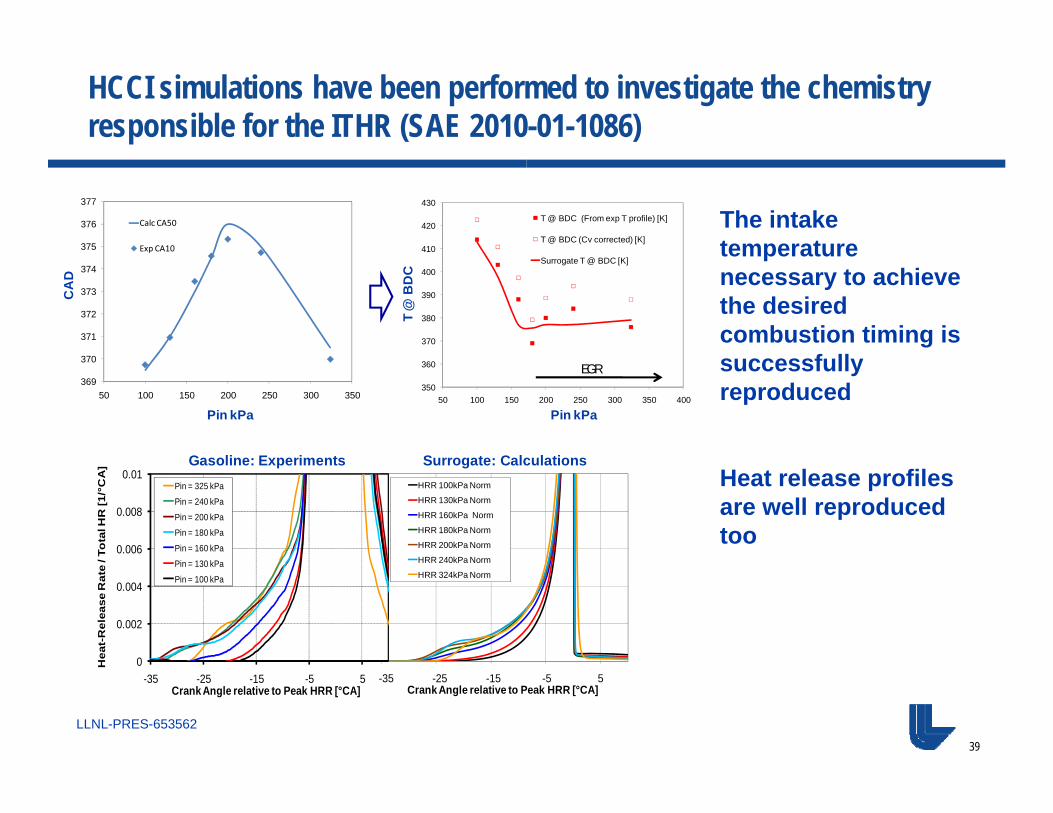
HCCI simulations have been performed to investigate the chemistry responsible for the ITHR (SAE 2010-01-1086)
369
370
371
372
373
374
375
376
377
50 100 150 200 250 300 350
Calc CA50
Exp CA10
Pin kPa
CA
D
Pin kPa
350
360
370
380
390
400
410
420
430
50 100 150 200 250 300 350 400
T @ BDC (From exp T profile) [K]
T @ BDC (Cv corrected) [K]
Surrogate T @ BDC [K]
T @
BD
C
EGR
The intake temperature necessary to achieve the desired combustion timing is successfully reproduced
Heat release profiles are well reproduced too
-35 -25 -15 -5 5
HRR 100kPa Norm
HRR 130kPa Norm
HRR 160kPa Norm
HRR 180kPa Norm
HRR 200kPa Norm
HRR 240kPa Norm
HRR 324kPa Norm
Gasoline: Experiments Surrogate: Calculations
0
0.002
0.004
0.006
0.008
0.01
-35 -25 -15 -5 5
Hea
t-R
elea
se R
ate
/ To
tal H
R [1
/°C
A]
Crank Angle relative to Peak HRR [°CA]
Pin = 325 kPa
Pin = 240 kPa
Pin = 200 kPa
Pin = 180 kPa
Pin = 160 kPa
Pin = 130 kPa
Pin = 100 kPa
b.
-35 -25 -15 -5 5Crank Angle relative to Peak HRR [°CA]
40
LLNL-PRES-653562
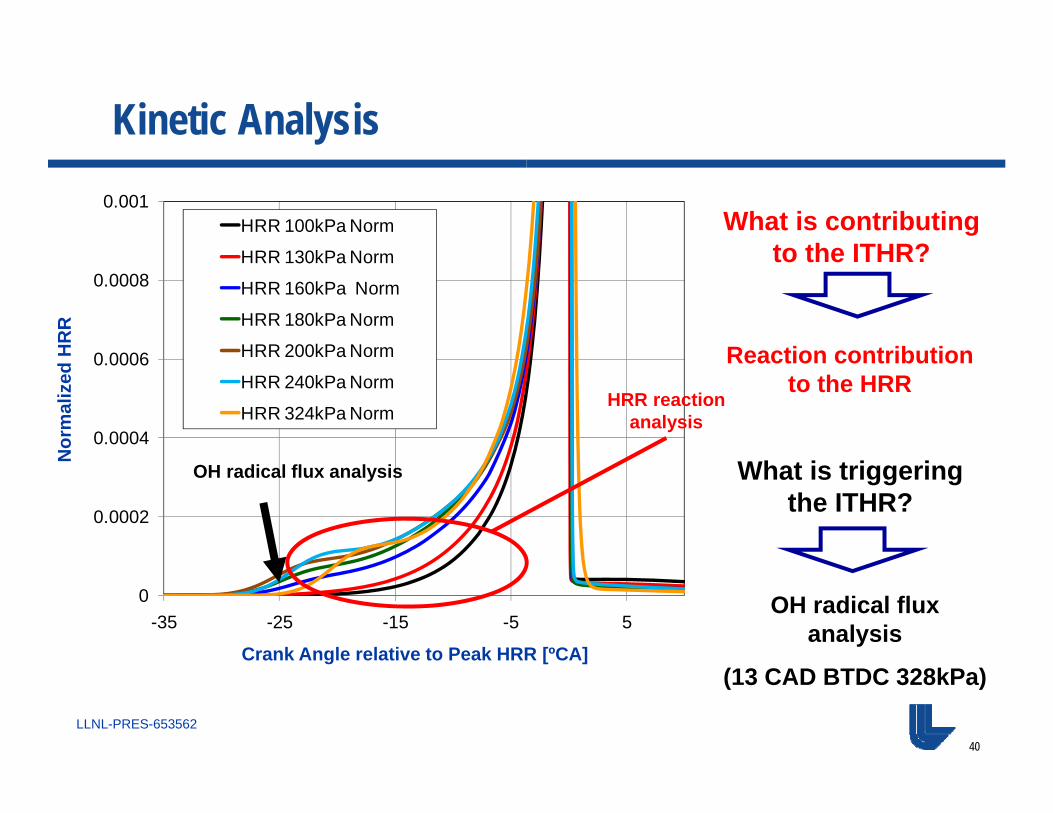
Kinetic Analysis
Crank Angle relative to Peak HRR [ºCA]
Nor
mal
ized
HR
R
0
0.0002
0.0004
0.0006
0.0008
0.001
-35 -25 -15 -5 5
HRR 100kPa Norm
HRR 130kPa Norm
HRR 160kPa Norm
HRR 180kPa Norm
HRR 200kPa Norm
HRR 240kPa Norm
HRR 324kPa Norm
OH radical flux analysis
(13 CAD BTDC 328kPa)
What is triggering the ITHR?
OH radical flux analysis
HRR reaction analysis
What is contributing to the ITHR?
Reaction contribution to the HRR
41
LLNL-PRES-653562
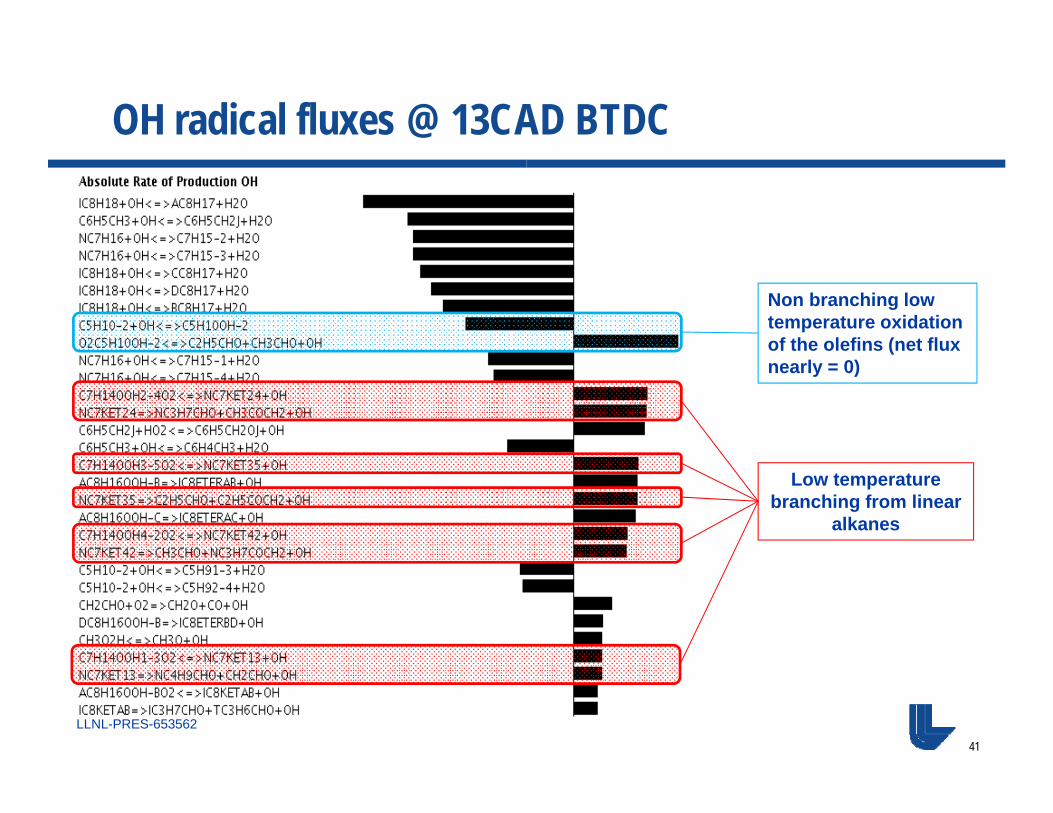
OH radical fluxes @ 13CAD BTDC
Low temperature branching from linear
alkanes
Non branching low temperature oxidation of the olefins (net flux nearly = 0)
42
LLNL-PRES-653562
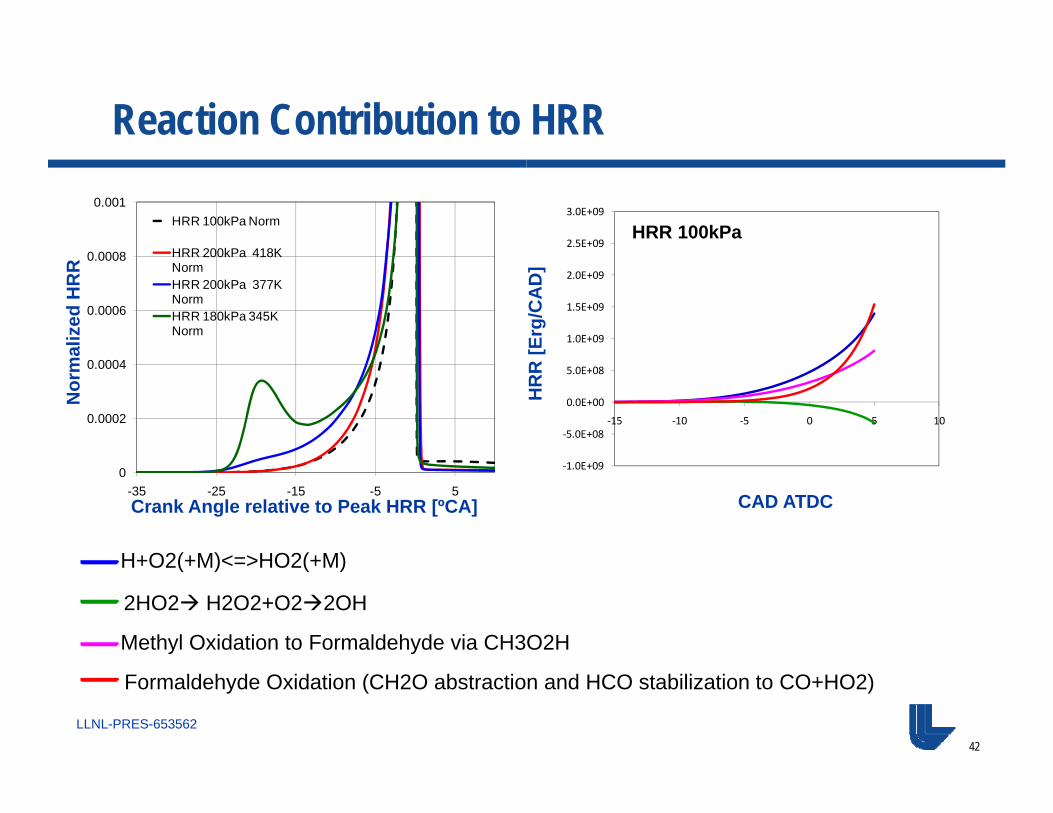
Reaction Contribution to HRR
H+O2(+M)<=>HO2(+M)
2HO2 H2O2+O22OH
Methyl Oxidation to Formaldehyde via CH3O2H
Formaldehyde Oxidation (CH2O abstraction and HCO stabilization to CO+HO2)
Nor
mal
ized
HR
R
0
0.0002
0.0004
0.0006
0.0008
0.001
-35 -25 -15 -5 5
HRR 100kPa Norm
HRR 200kPa 418K Norm HRR 200kPa 377K Norm HRR 180kPa 345K Norm
Crank Angle relative to Peak HRR [ºCA] CAD ATDC
HR
R [E
rg/C
AD
]
‐1.0E+09
‐5.0E+08
0.0E+00
5.0E+08
1.0E+09
1.5E+09
2.0E+09
2.5E+09
3.0E+09
‐15 ‐10 ‐5 0 5 10
HRR 100kPa
43
LLNL-PRES-653562
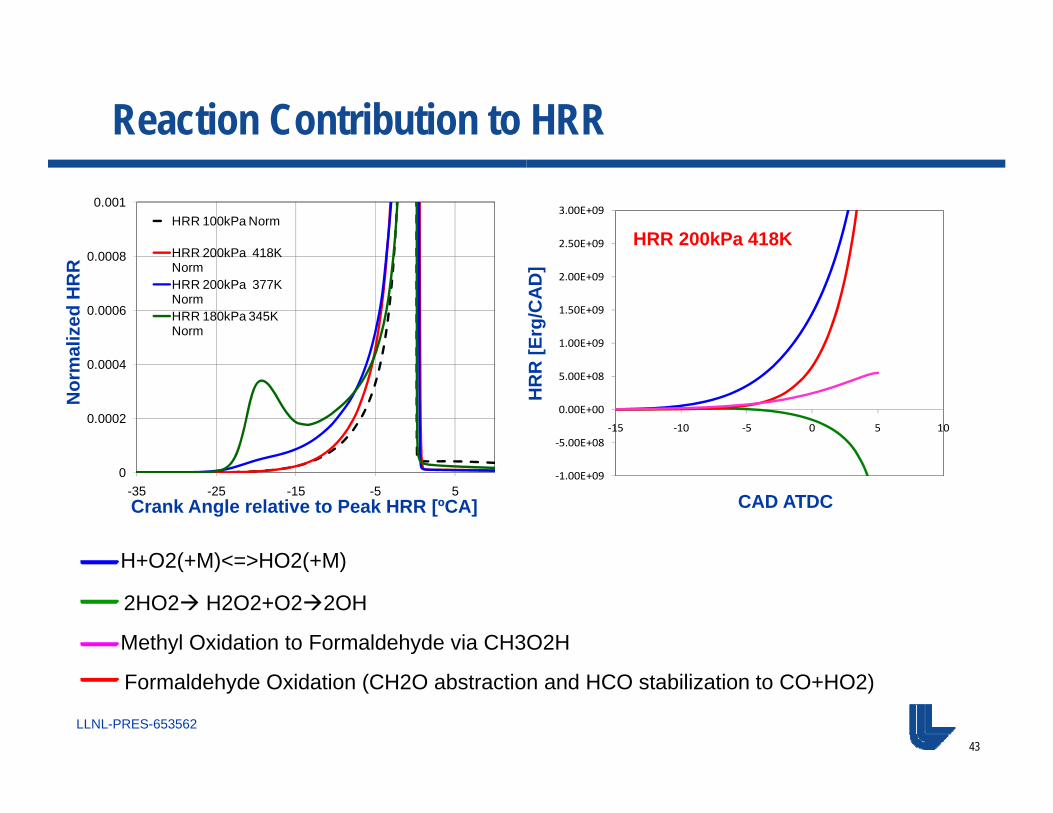
Reaction Contribution to HRR
H+O2(+M)<=>HO2(+M)
2HO2 H2O2+O22OH
Methyl Oxidation to Formaldehyde via CH3O2H
Formaldehyde Oxidation (CH2O abstraction and HCO stabilization to CO+HO2)
Nor
mal
ized
HR
R
0
0.0002
0.0004
0.0006
0.0008
0.001
-35 -25 -15 -5 5
HRR 100kPa Norm
HRR 200kPa 418K Norm HRR 200kPa 377K Norm HRR 180kPa 345K Norm
Crank Angle relative to Peak HRR [ºCA] CAD ATDC
HR
R [E
rg/C
AD
]
‐1.0E+09
‐5.0E+08
0.0E+00
5.0E+08
1.0E+09
1.5E+09
2.0E+09
2.5E+09
3.0E+09
‐15 ‐10 ‐5 0 5 10
HRR 100kPa
‐1.00E+09
‐5.00E+08
0.00E+00
5.00E+08
1.00E+09
1.50E+09
2.00E+09
2.50E+09
3.00E+09
‐15 ‐10 ‐5 0 5 10
HRR 200kPa 418K

44
LLNL-PRES-653562
Reaction Contribution to HRR
H+O2(+M)<=>HO2(+M)
2HO2 H2O2+O22OH
Methyl Oxidation to Formaldehyde via CH3O2H
Formaldehyde Oxidation (CH2O abstraction and HCO stabilization to CO+HO2)
Nor
mal
ized
HR
R
0
0.0002
0.0004
0.0006
0.0008
0.001
-35 -25 -15 -5 5
HRR 100kPa Norm
HRR 200kPa 418K Norm HRR 200kPa 377K Norm HRR 180kPa 345K Norm
Crank Angle relative to Peak HRR [ºCA] CAD ATDC
HR
R [E
rg/C
AD
]
‐1.0E+09
‐5.0E+08
0.0E+00
5.0E+08
1.0E+09
1.5E+09
2.0E+09
2.5E+09
3.0E+09
‐15 ‐10 ‐5 0 5 10
HRR 100kPa
‐1.00E+09
‐5.00E+08
0.00E+00
5.00E+08
1.00E+09
1.50E+09
2.00E+09
2.50E+09
3.00E+09
‐15 ‐10 ‐5 0 5 10
HRR 200kPa 418K
‐1.00E+09
‐5.00E+08
0.00E+00
5.00E+08
1.00E+09
1.50E+09
2.00E+09
2.50E+09
3.00E+09
‐15 ‐10 ‐5 0 5 10
HRR 200kPa 377K
45
LLNL-PRES-653562
Reaction Contribution to HRR
H+O2(+M)<=>HO2(+M)
2HO2 H2O2+O22OH
Methyl Oxidation to Formaldehyde via CH3O2H
Formaldehyde Oxidation (CH2O abstraction and HCO stabilization to CO+HO2)
Nor
mal
ized
HR
R
0
0.0002
0.0004
0.0006
0.0008
0.001
-35 -25 -15 -5 5
HRR 100kPa Norm
HRR 200kPa 418K Norm HRR 200kPa 377K Norm HRR 180kPa 345K Norm
Crank Angle relative to Peak HRR [ºCA] CAD ATDC
HR
R [E
rg/C
AD
]
‐1.0E+09
‐5.0E+08
0.0E+00
5.0E+08
1.0E+09
1.5E+09
2.0E+09
2.5E+09
3.0E+09
‐15 ‐10 ‐5 0 5 10
HRR 100kPa
‐1.00E+09
‐5.00E+08
0.00E+00
5.00E+08
1.00E+09
1.50E+09
2.00E+09
2.50E+09
3.00E+09
‐15 ‐10 ‐5 0 5 10
HRR 200kPa 418K
‐1.00E+09
‐5.00E+08
0.00E+00
5.00E+08
1.00E+09
1.50E+09
2.00E+09
2.50E+09
3.00E+09
‐15 ‐10 ‐5 0 5 10
HRR 200kPa 377K
‐1.0E+09
‐5.0E+08
0.0E+00
5.0E+08
1.0E+09
1.5E+09
2.0E+09
2.5E+09
3.0E+09
‐15 ‐10 ‐5 0 5 10
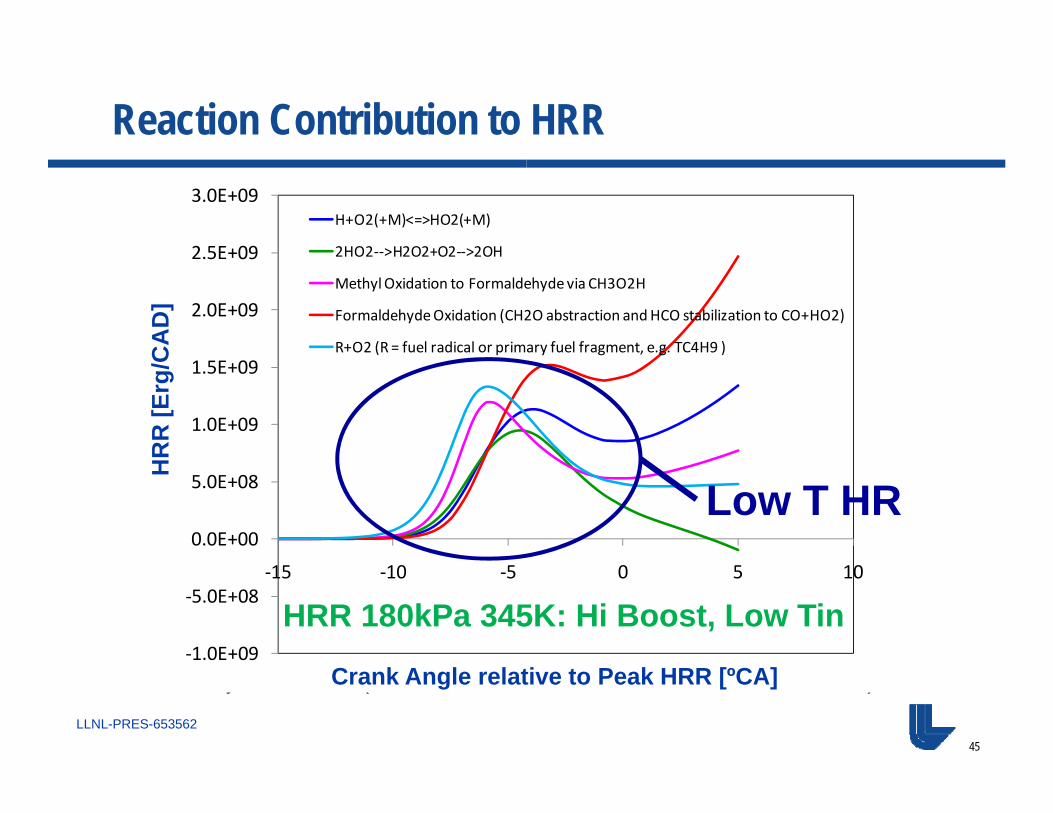
H+O2(+M)<=>HO2(+M)
2HO2‐‐>H2O2+O2‐‐>2OH
Methyl Oxidation to Formaldehyde via CH3O2H
Formaldehyde Oxidation (CH2O abstraction and HCO stabilization to CO+HO2)
R+O2 (R = fuel radical or primary fuel fragment, e.g. TC4H9 )
Low T HR
HRR 180kPa 345K: Hi Boost, Low Tin
HR
R [E
rg/C
AD
]
Crank Angle relative to Peak HRR [ºCA]
46
LLNL-PRES-653562
350
360
370
380
390
400
410
420
430
50 100 150 200 250 300 350 400
T @ BDC (From exp T profile) [K]T @ BDC (Cv corrected) [K]Surrogate T @ BDC [K]PRF 87 T @ BDC [K]
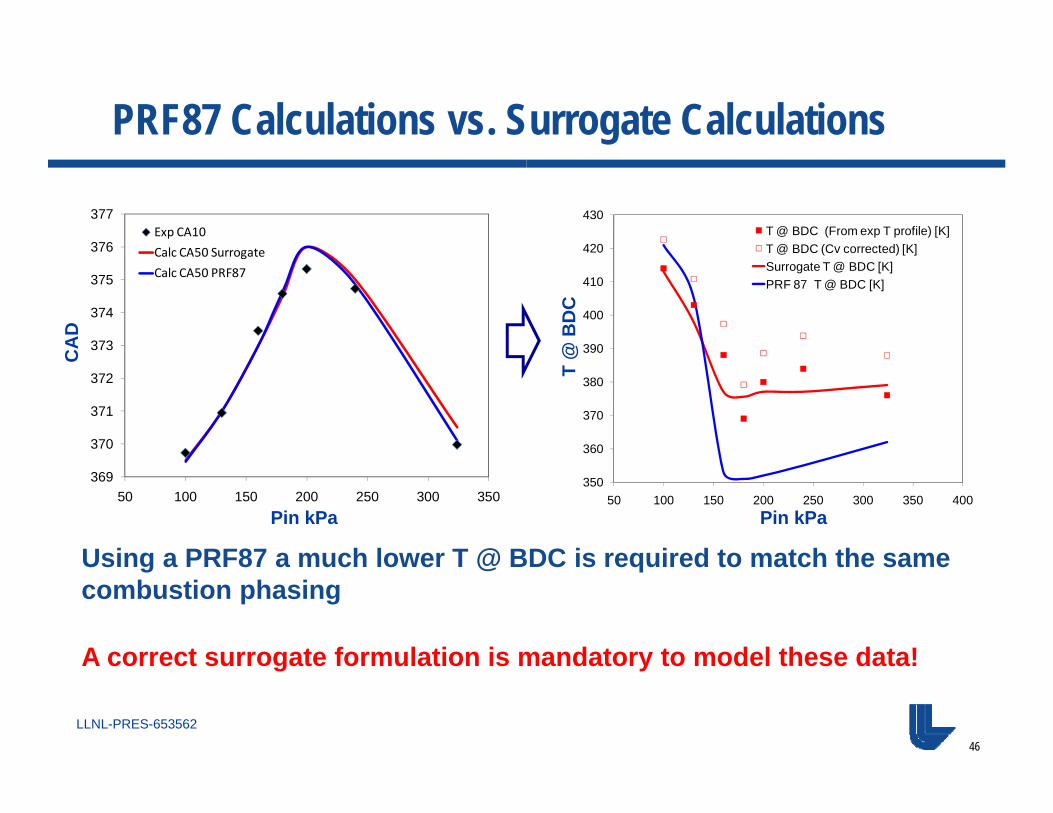
PRF87 Calculations vs. Surrogate Calculations
Using a PRF87 a much lower T @ BDC is required to match the same combustion phasing
A correct surrogate formulation is mandatory to model these data!
369
370
371
372
373
374
375
376
377
50 100 150 200 250 300 350
Exp CA10Calc CA50 SurrogateCalc CA50 PRF87
Pin kPa
CA
D
Pin kPa
T @
BD
C
47
LLNL-PRES-653562
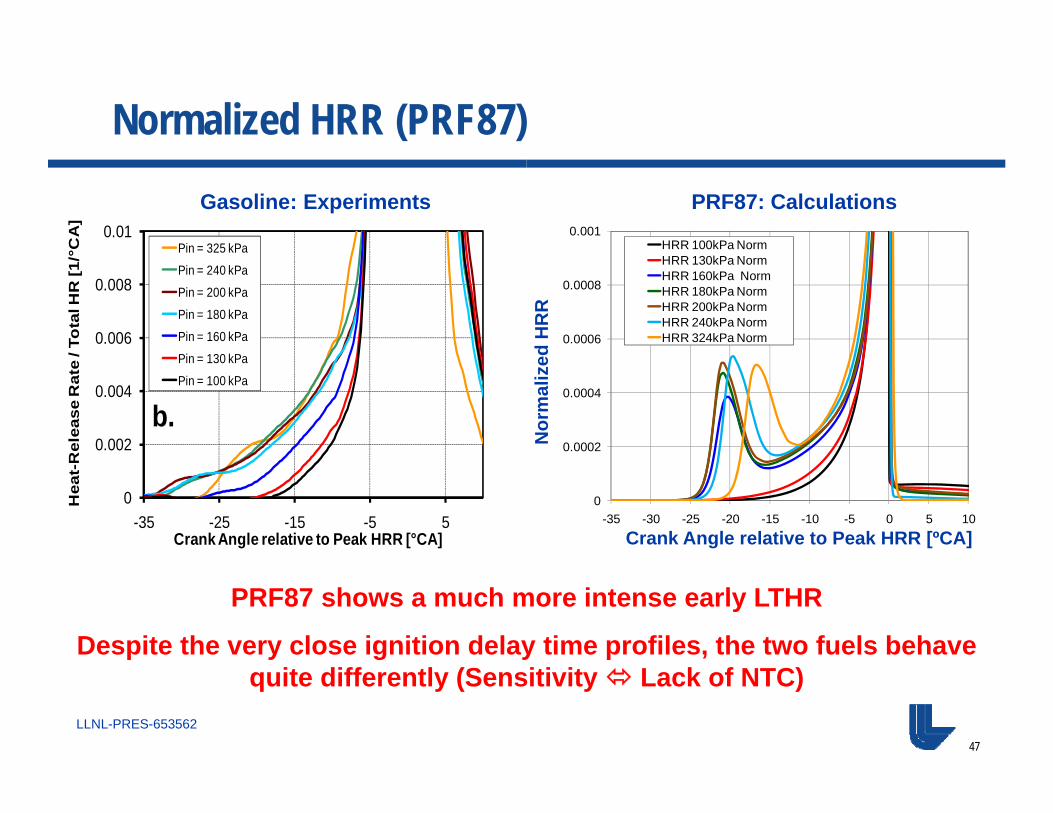
Normalized HRR (PRF87)
Crank Angle relative to Peak HRR [ºCA]N
orm
aliz
ed H
RR
0
0.002
0.004
0.006
0.008
0.01
-35 -25 -15 -5 5
Hea
t-R
elea
se R
ate
/ To
tal H
R [1
/°C
A]
Crank Angle relative to Peak HRR [°CA]
Pin = 325 kPa
Pin = 240 kPa
Pin = 200 kPa
Pin = 180 kPa
Pin = 160 kPa
Pin = 130 kPa
Pin = 100 kPa
b.
PRF87 shows a much more intense early LTHR
Despite the very close ignition delay time profiles, the two fuels behave quite differently (Sensitivity Lack of NTC)
0
0.0002
0.0004
0.0006
0.0008
0.001
-35 -30 -25 -20 -15 -10 -5 0 5 10
HRR 100kPa NormHRR 130kPa NormHRR 160kPa NormHRR 180kPa NormHRR 200kPa NormHRR 240kPa NormHRR 324kPa Norm
Gasoline: Experiments PRF87: Calculations
48
LLNL-PRES-653562
Final Remarks
The evolution of engines and fuels proceeded in tandem since the dawn of the automotive industry with fuel quality being the limiting factor in engine development
In the last 90 years both engines and fuels have dramatically changed, but, for fuel properties specifications, we are still using fuel quality standards defined back then
Fuel surrogates allow us to run more reproducible experiments and sophisticated engine numerical analysis, though there are still many open questions on how a good surrogate should be formulated
Detailed kinetic models can be used to guide the formulation of surrogates and are effective tools to interpret fuel behavior in the combustion chamber
49
LLNL-PRES-653562
Premixed Air/Fuel
Mixture
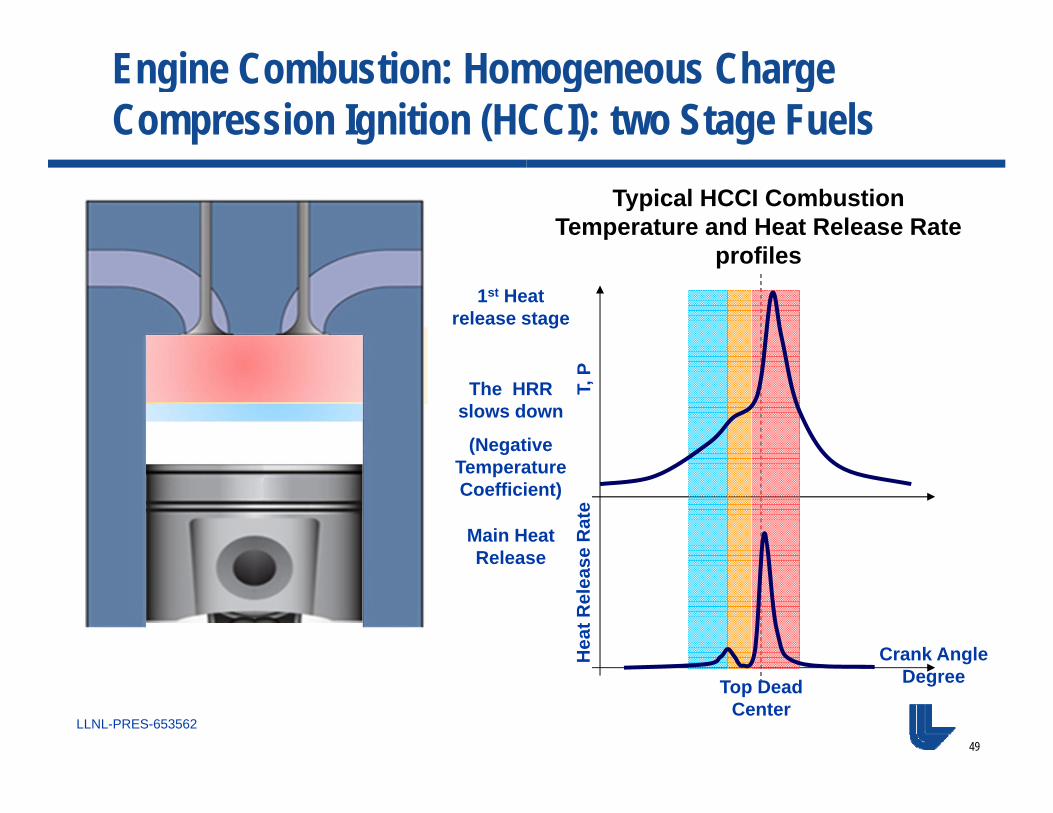
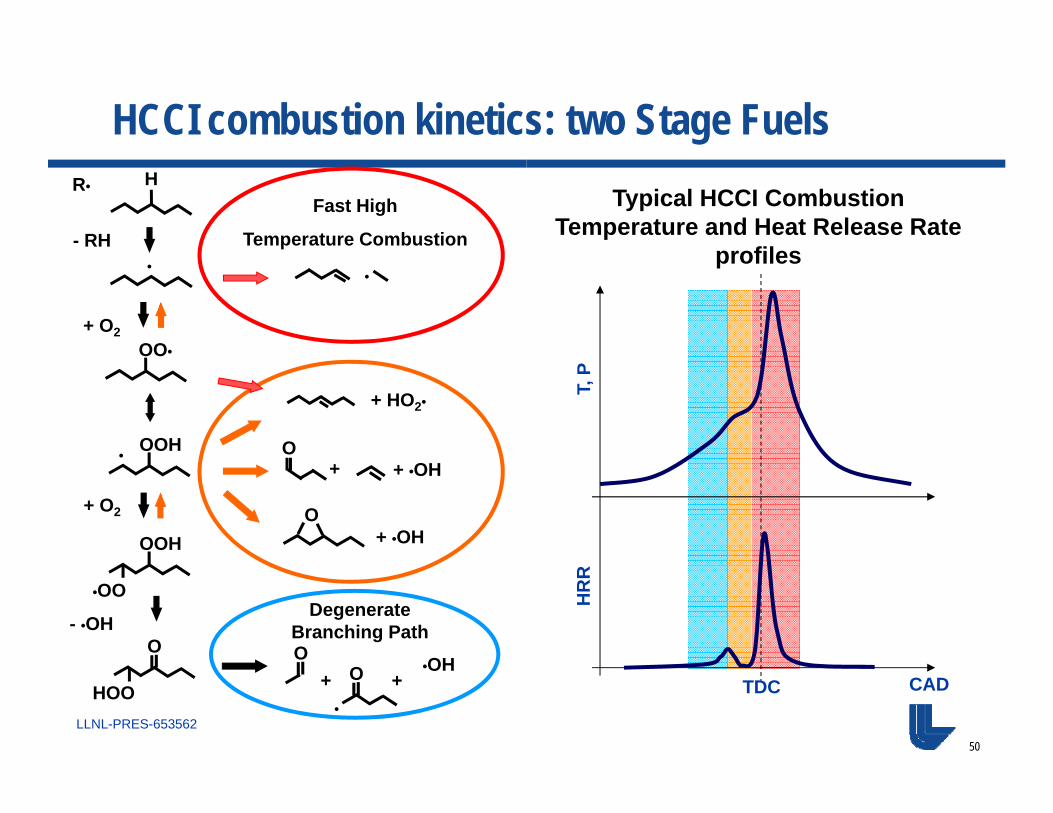
Engine Combustion: Homogeneous Charge Compression Ignition (HCCI): two Stage Fuels
Typical HCCI Combustion Temperature and Heat Release Rate
profiles
Crank Angle Degree
Hea
t Rel
ease
Rat
e
Top Dead Center
1st Heat release stage
The HRR slows down
(Negative TemperatureCoefficient)
Main Heat Release
T, P
50
LLNL-PRES-653562
Typical HCCI Combustion Temperature and Heat Release Rate
profiles
H
•
R•
- RH
+ O2
Degenerate Branching Path
OO•
OOH•
•OO
OOH
HOO
O
+ O2
- •OHO
O
•
•OH+ +
+ HO2•
+ •OH
+ •OHO
+
O
•
Fast High
Temperature Combustion
T, P
CAD
HR
R
TDC
HCCI combustion kinetics: two Stage Fuels
Chemical Kinetics Modeling of Engine Processes
Charles Westbrook
Tsinghua-Princeton 2014 Summer School on Combustion
July 20-25, 2014
Kinetic analyses of engine processes• Stratified charge engine details• Flame quench in lean-burn engines• Flame quench on engine chamber walls• Heat transfer to engine walls during flame quenching• Flame quench in expanding engine chamber• Fuel additive studies• Detonation parameters• Engine knock and octane numbers, proknocks and antiknocks• Diesel ignition and cetane numbers• Biodiesel fuel combustion• Soot production• Reduction of soot in diesel engines with oxygen added• Pulse combustor optimization• HCCI combustion mechanisms• Surrogate fuel formulations• Reduced mechanisms for ignition and combustion• Ignition models
WSS meeting 10/2007 210/16/2007
Laminar flames in quenching problems
Mid-volume quenching in direct injection stratified charge (DISC) engine
Bulk quenching due to volume expansion in lean-burn engine mixtures
Flame quenching at lean and rich flammability limits
Flame quenching on cold walls and unburned hydrocarbon emissions from internal combustion engines
Emissions from DISC engine
• Interest in mid 1970’s by engine designers in stratified charge engine. Honda CVCC, Ford PROCO, GM DISC
• Principle was spatial charge stratification, achieved by spray injection.
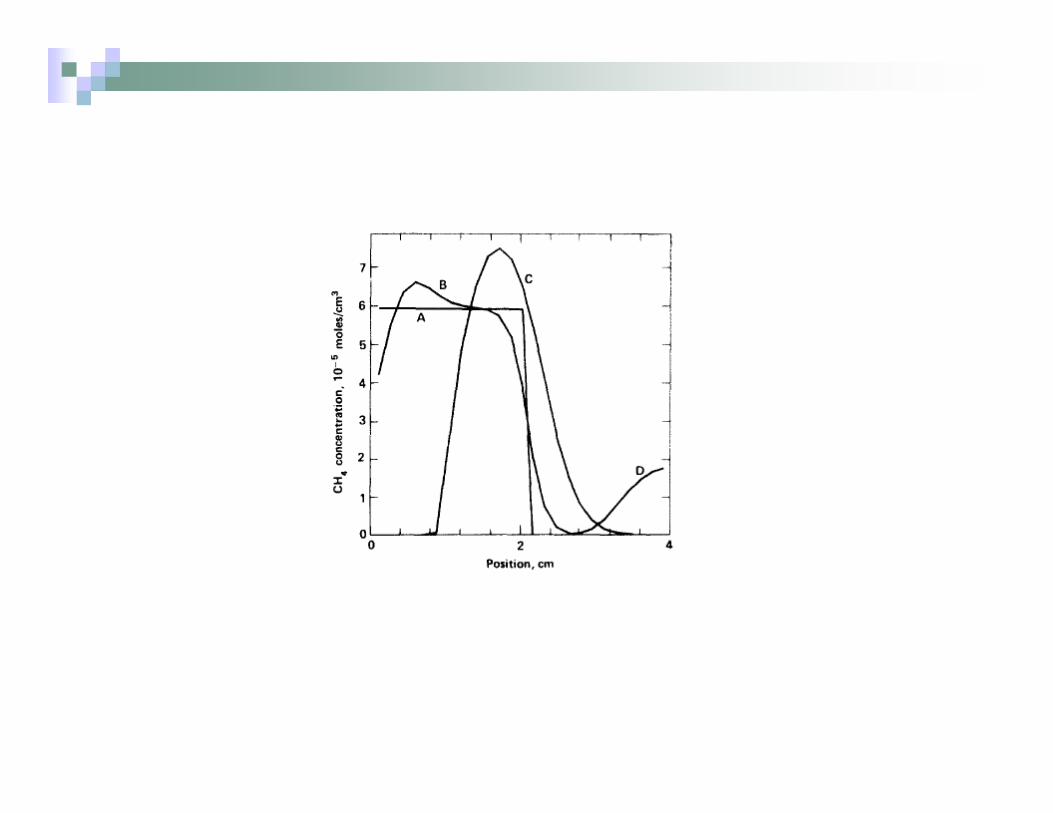
• Flame should burn fuel, halt abruptly when it reached the discontinuity in fuel concentration.
• Experimental observations of Lancaster (GMR) of excessive UHC emissions.
WSS meeting 10/2007 610/16/2007
Flame quenching by volume expansion
• Concept of “lean burn” engine in mid-1970’s• Experimental studies in real engines by Quader
demonstrated large UHC emissions and flame failure for late-ignition, extremely lean fuel/air mixtures.
• “What limits lean operation in spark ignition engines - Flame initiation or propagation?”A.A. Quader, 1976.
• Laboratory experiments by Smith and Sawyer, with supporting laminar flame modeling, answered Quader’s questions.
WSS meeting 10/2007 710/16/2007
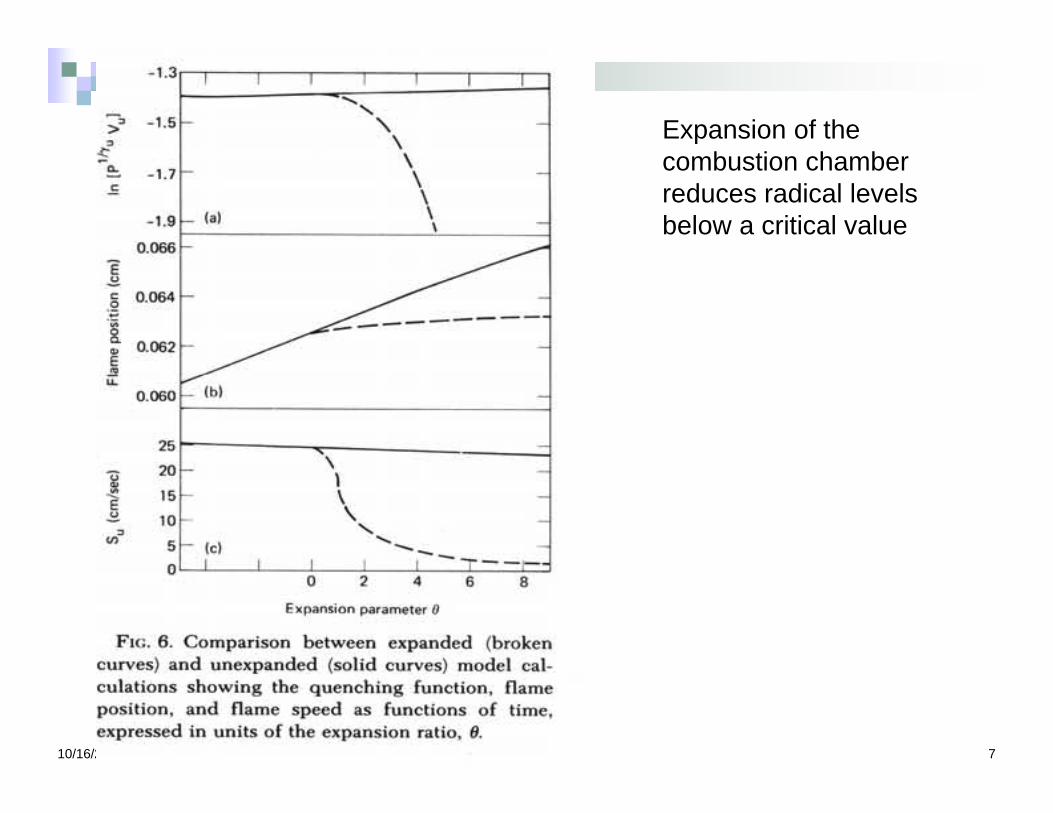
Expansion of thecombustion chamberreduces radical levelsbelow a critical value
WSS meeting 10/2007 810/16/2007
Flame quenching on engine walls
Previous concept of UHC emissions
Idea of making wall layers thinner
Simple flame model results at Ford weren’t believed
Detailed modeling results
Evidence had been there, Wentworth

WSS meeting 10/2007 910/16/2007
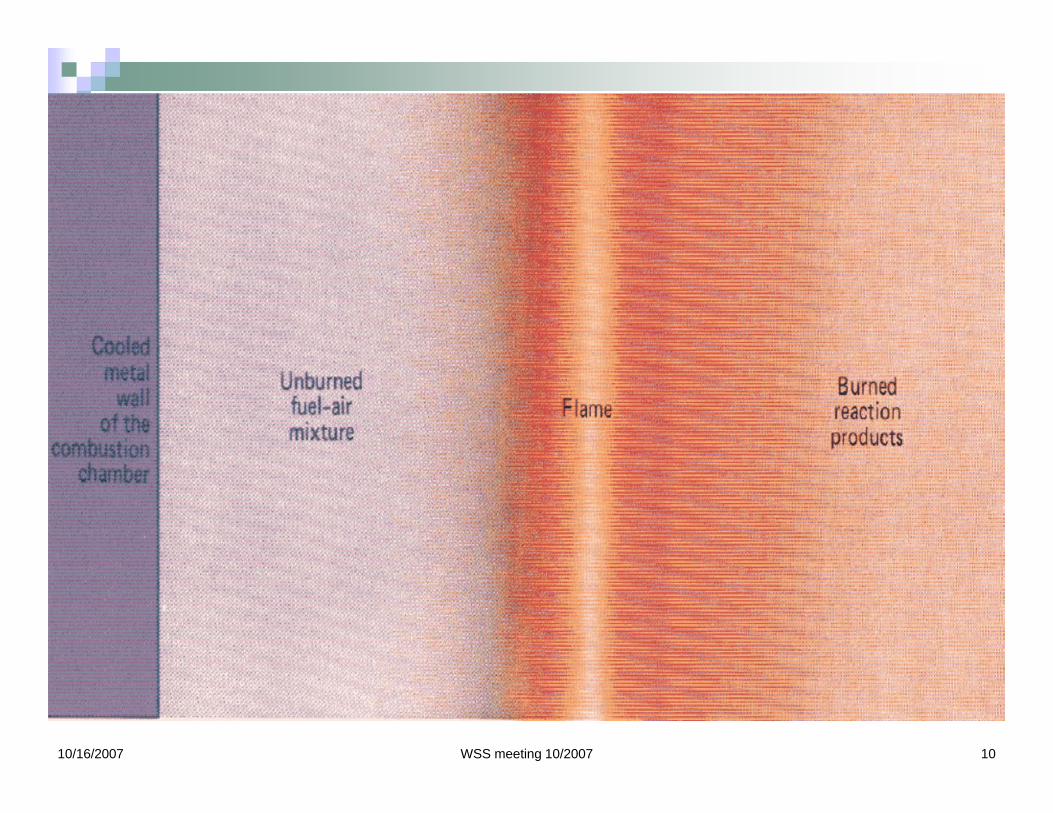
Pictures of wall quenching
Flame approaching wall Fuel diffuses away from walland is rapidly consumed
WSS meeting 10/2007 1010/16/2007
WSS meeting 10/2007 1110/16/2007
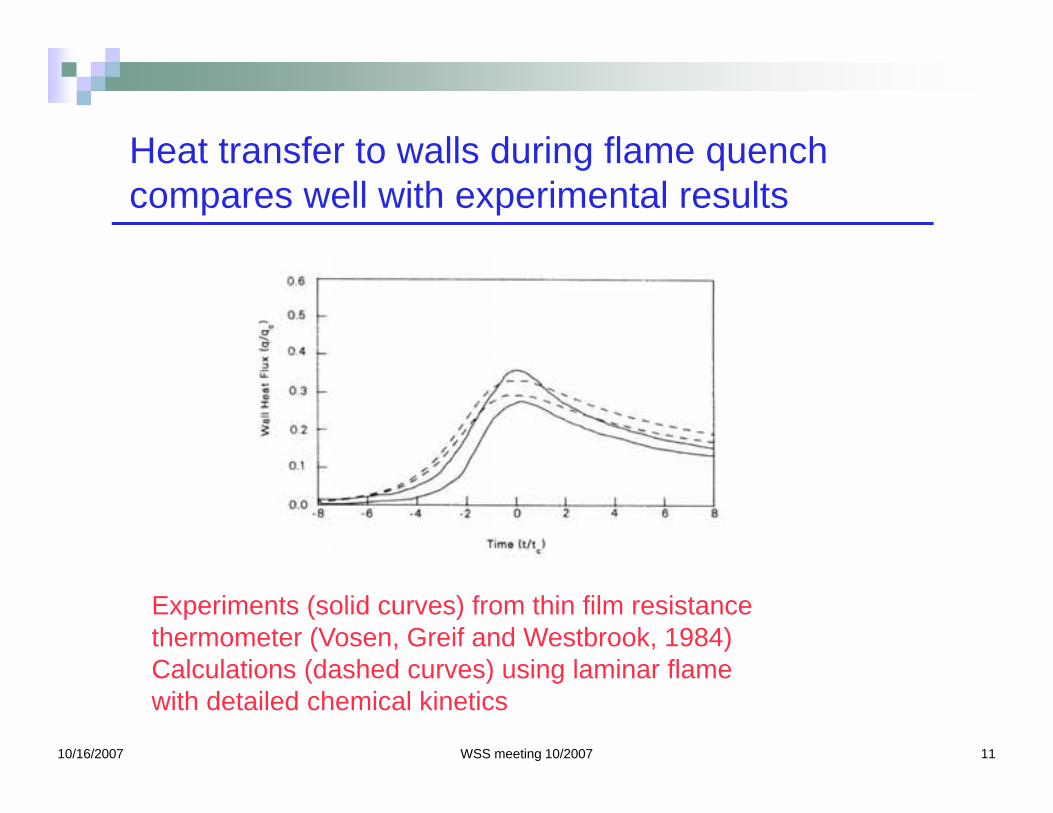
Heat transfer to walls during flame quench compares well with experimental results
Experiments (solid curves) from thin film resistance thermometer (Vosen, Greif and Westbrook, 1984)Calculations (dashed curves) using laminar flame with detailed chemical kinetics
WSS meeting 10/2007 1210/16/2007

WSS meeting 10/2007 1310/16/2007
Chemical Kinetics and Soot Production
Charles Westbrook
Tsinghua-Princeton 2014 Summer School on Combustion
July 20-25, 2014
2
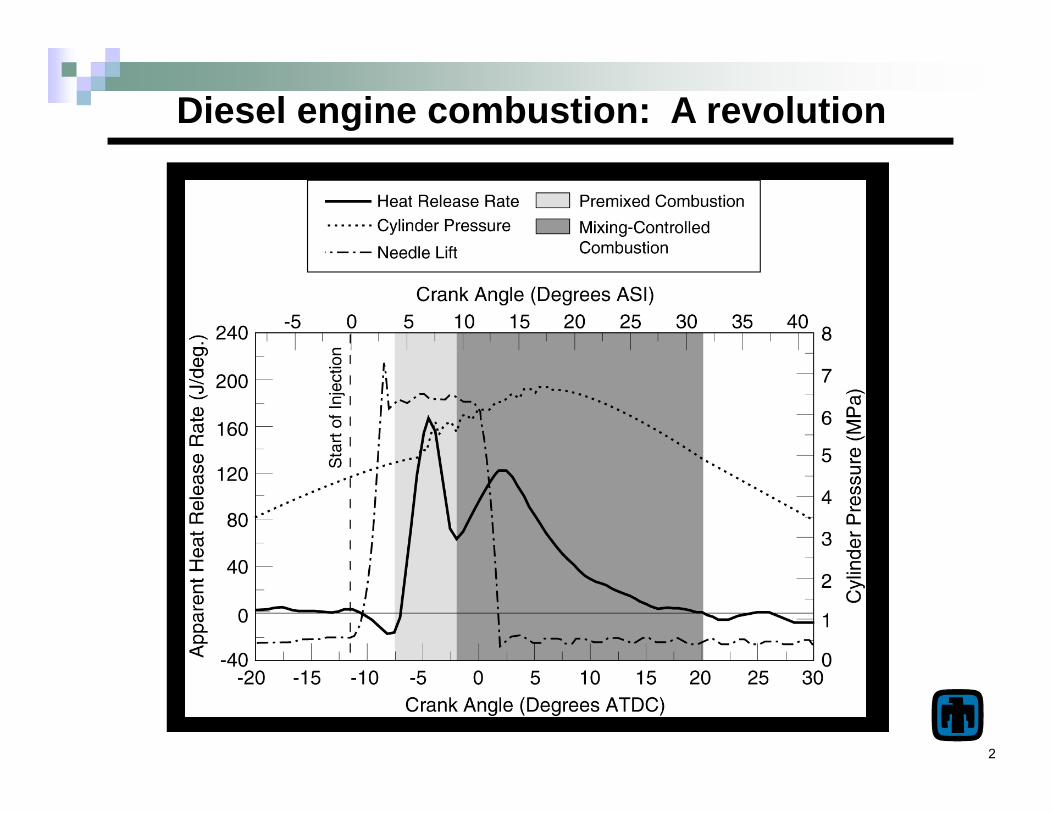
Diesel engine combustion: A revolution
3
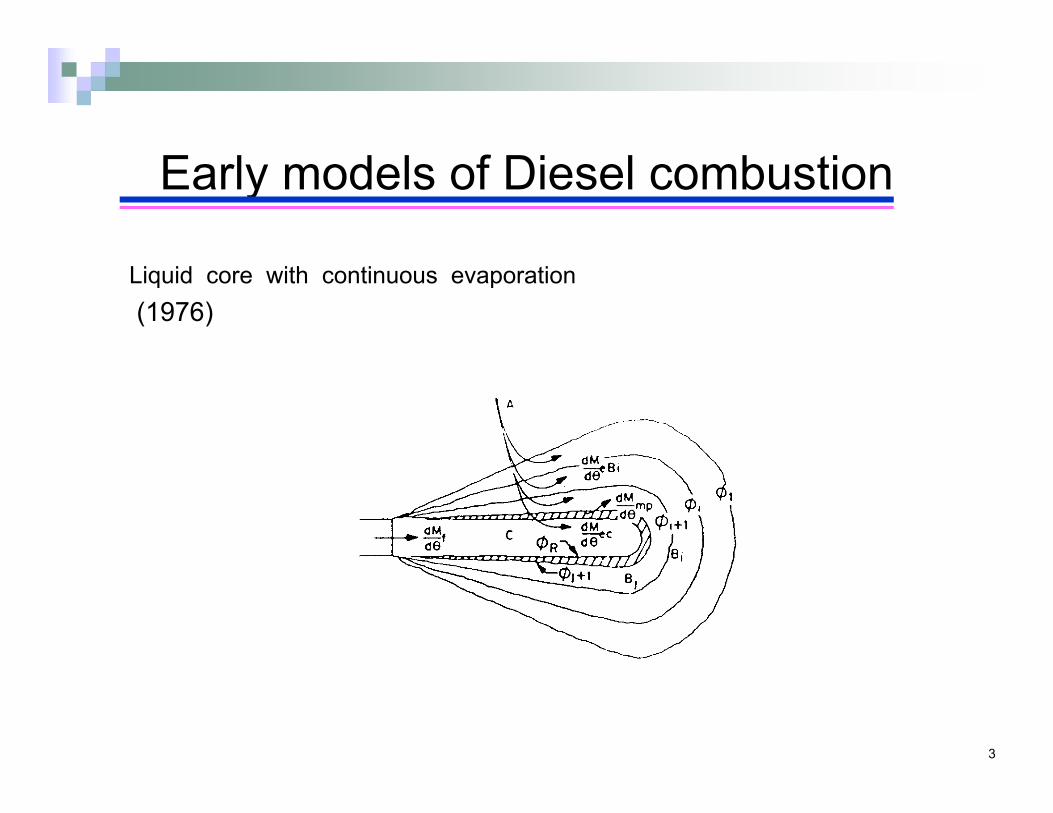
Early models of Diesel combustion
Liquid core with continuous evaporation (1976)
4
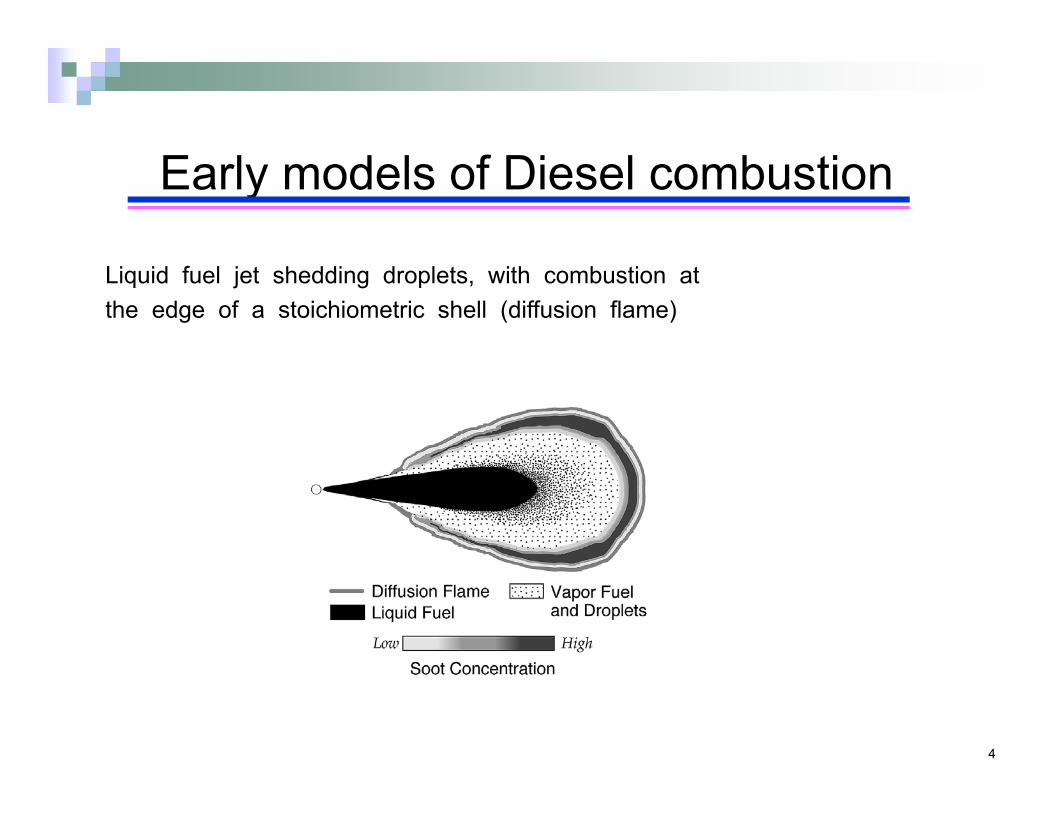
Early models of Diesel combustion
Liquid fuel jet shedding droplets, with combustion at the edge of a stoichiometric shell (diffusion flame)
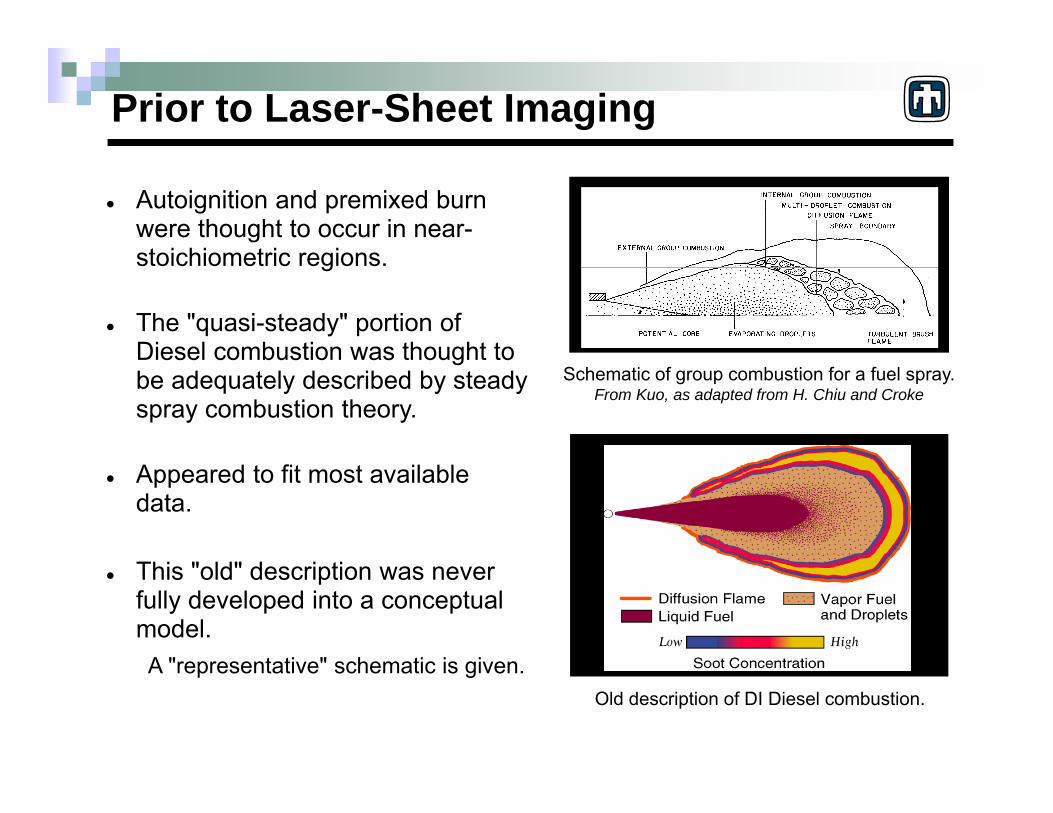
Prior to Laser-Sheet Imaging
Autoignition and premixed burn were thought to occur in near-stoichiometric regions.
The "quasi-steady" portion of Diesel combustion was thought to be adequately described by steady spray combustion theory.
Appeared to fit most available data.
This "old" description was never fully developed into a conceptual model.A "representative" schematic is given.
Schematic of group combustion for a fuel spray.From Kuo, as adapted from H. Chiu and Croke
Old description of DI Diesel combustion.

The DOE Engine Combustion Research Program at Sandia’s CRF played a major role in solving the diesel “mystery”.
Mission - Develop the science-base for in-cylinder combustion and emissions processes.– Help U.S. manufacturers reduce
emissions & improve performance.
Approach –– Strong interaction and
collaboration with industry.– Optical diagnostics.– Realistic engine geometries with
optical access through:> pistons> cylinder liner> spacer plates> exhaust ports
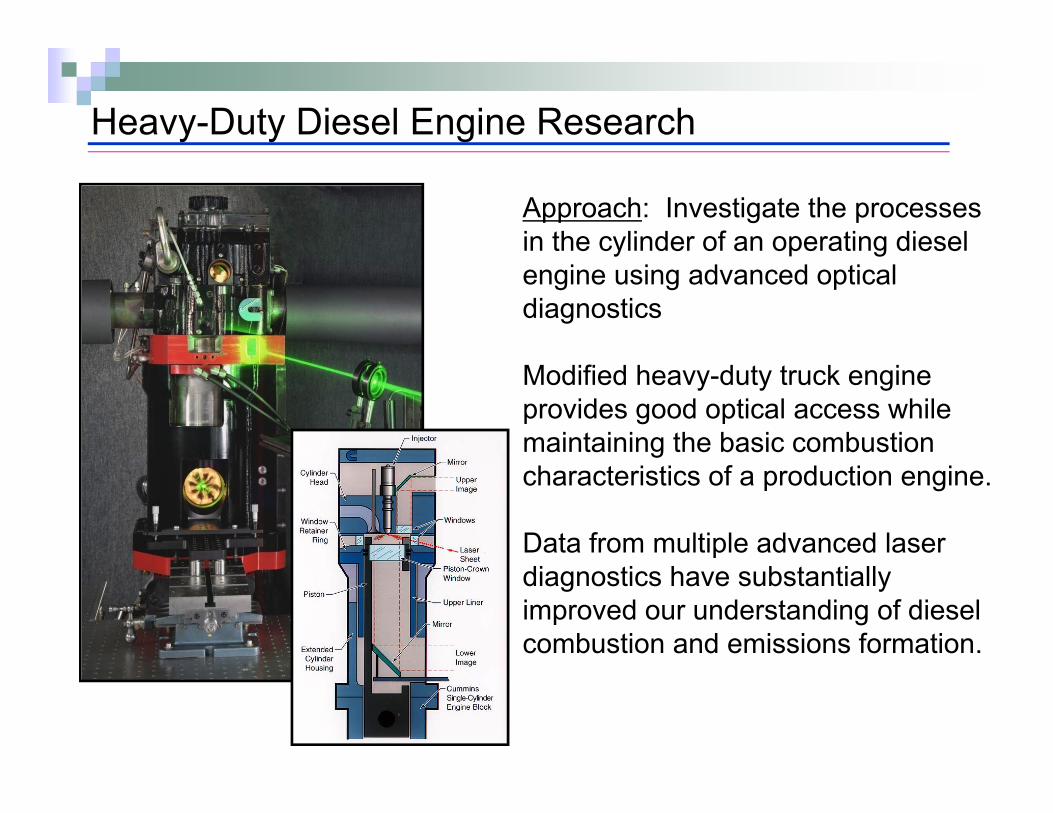
Approach: Investigate the processes in the cylinder of an operating diesel engine using advanced optical diagnostics
Modified heavy-duty truck engine provides good optical access while maintaining the basic combustion characteristics of a production engine.
Data from multiple advanced laser diagnostics have substantially improved our understanding of diesel combustion and emissions formation.
Heavy-Duty Diesel Engine Research
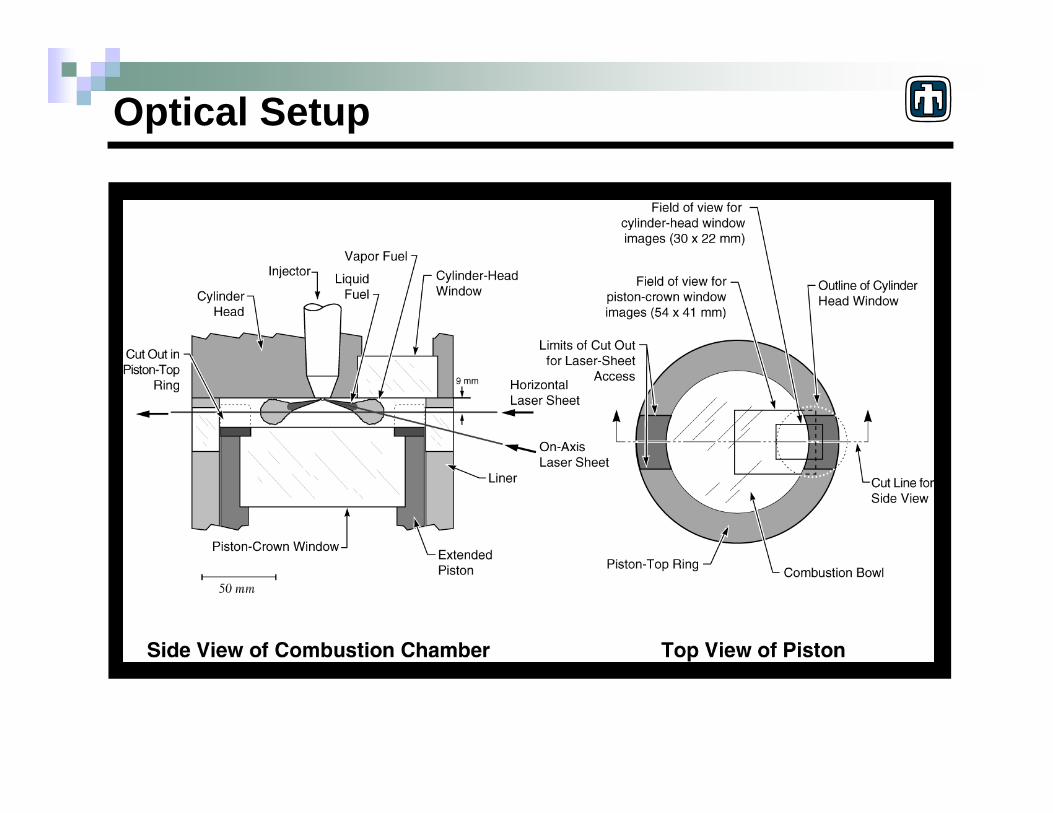
Optical Setup
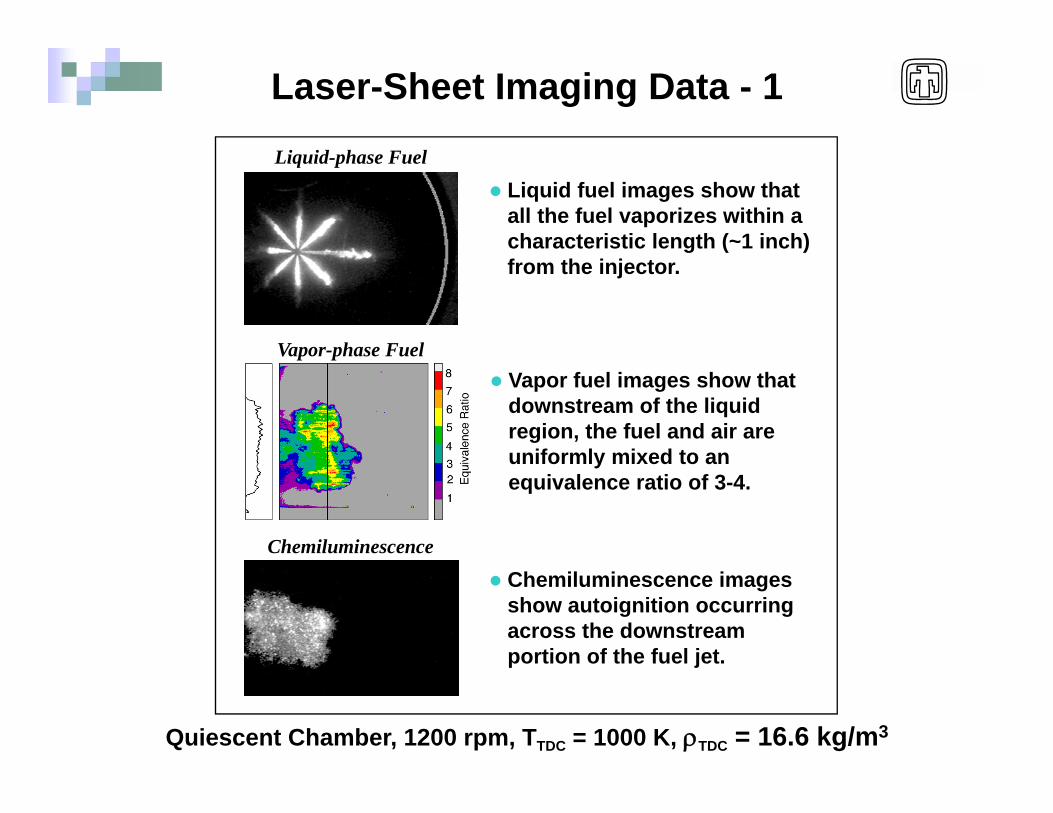
Laser-Sheet Imaging Data - 1Liquid-phase Fuel
Vapor-phase Fuel
Chemiluminescence
Liquid fuel images show that all the fuel vaporizes within a characteristic length (~1 inch) from the injector.
Vapor fuel images show that downstream of the liquid region, the fuel and air are uniformly mixed to an equivalence ratio of 3-4.
Chemiluminescence images show autoignition occurring across the downstream portion of the fuel jet.
Quiescent Chamber, 1200 rpm, TTDC = 1000 K, TDC = 16.6 kg/m3
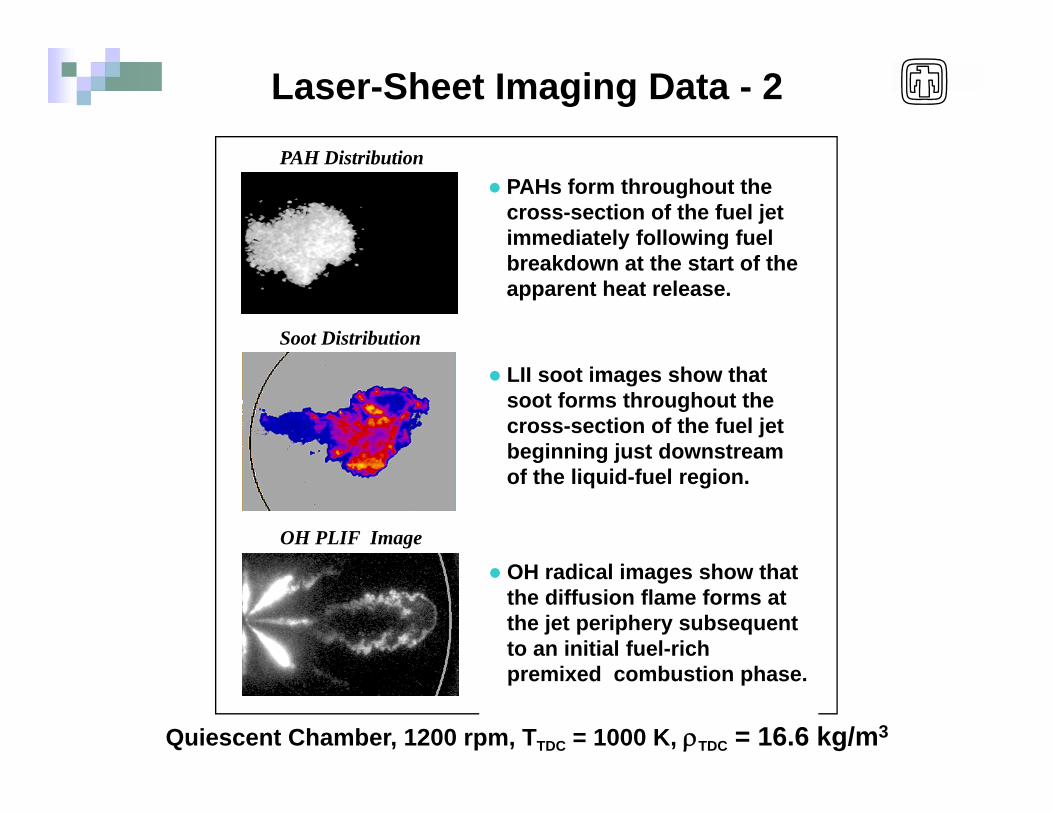
Laser-Sheet Imaging Data - 2
PAH Distribution
Soot Distribution
OH PLIF Image
PAHs form throughout the cross-section of the fuel jet immediately following fuel breakdown at the start of the apparent heat release.
LII soot images show that soot forms throughout the cross-section of the fuel jet beginning just downstream of the liquid-fuel region.
OH radical images show that the diffusion flame forms at the jet periphery subsequent to an initial fuel-rich premixed combustion phase.
Quiescent Chamber, 1200 rpm, TTDC = 1000 K, TDC = 16.6 kg/m3
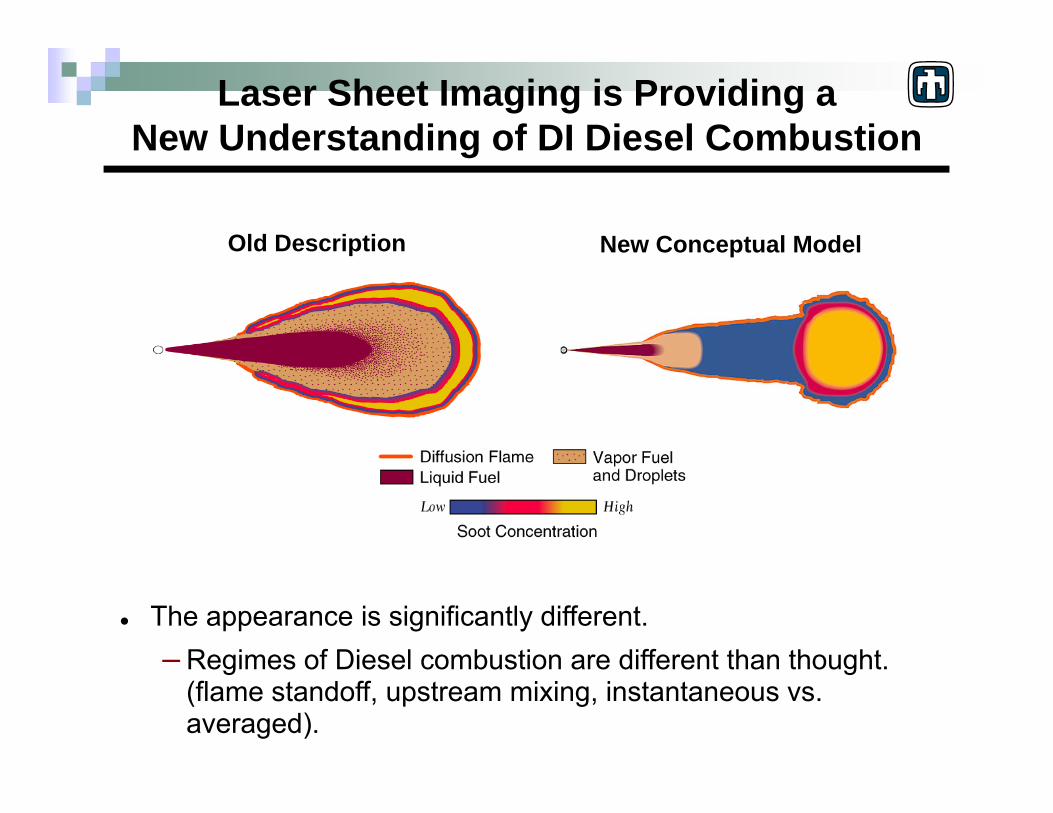
Laser Sheet Imaging is Providing aNew Understanding of DI Diesel Combustion
The appearance is significantly different.– Regimes of Diesel combustion are different than thought.
(flame standoff, upstream mixing, instantaneous vs. averaged).
Old Description New Conceptual Model
12
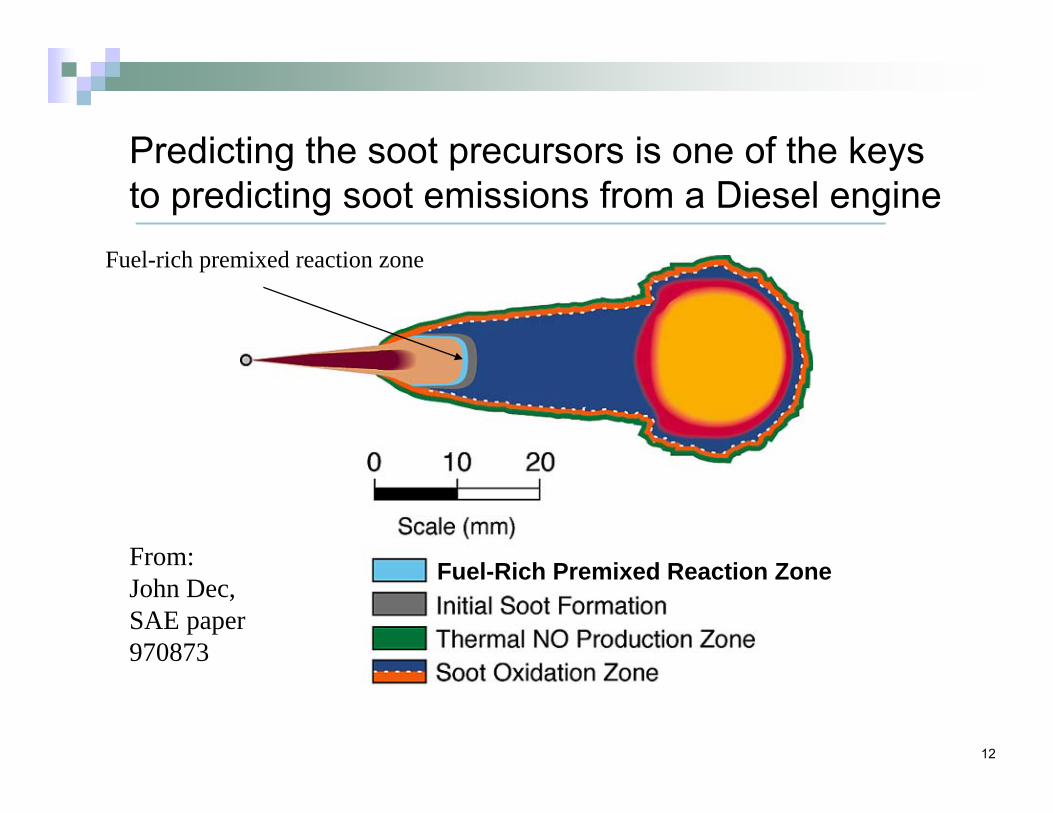
Predicting the soot precursors is one of the keys to predicting soot emissions from a Diesel engine
Fuel-Rich Premixed Reaction Zone
Fuel-rich premixed reaction zone
From: John Dec,SAE paper970873
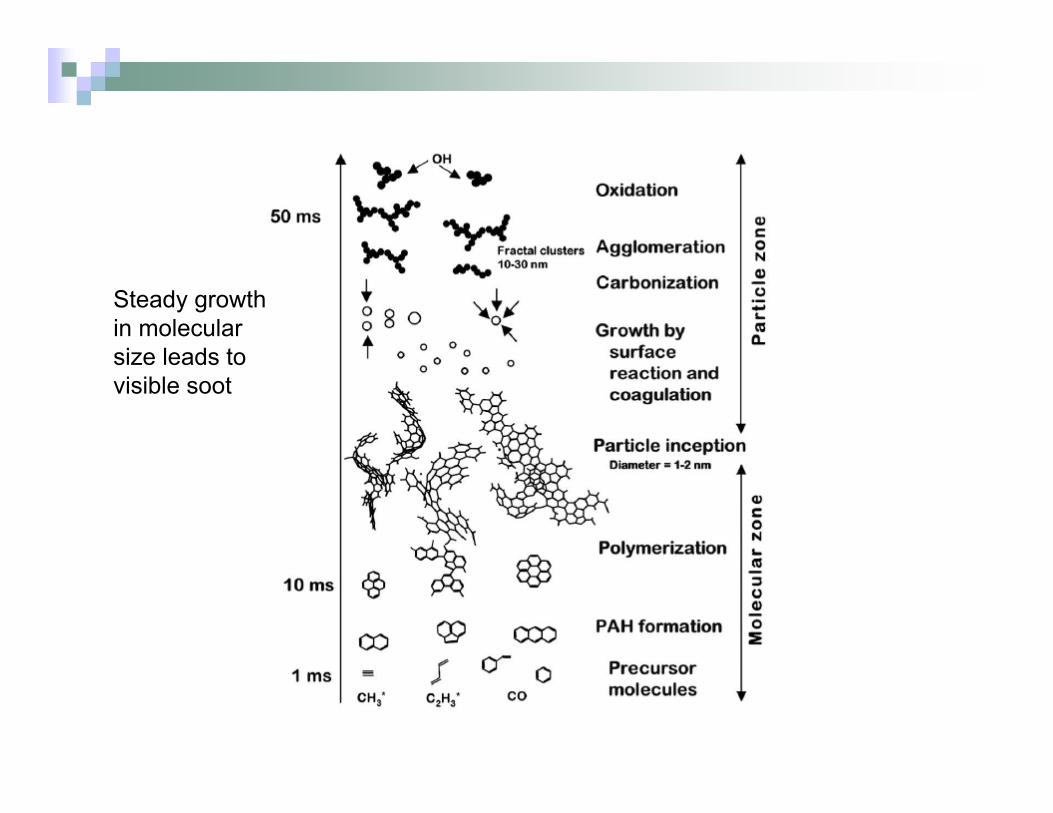
Steady growthin molecular size leads to visible soot
Correlations between Fuel Structural Features and Benzene Formation
Hongzhi R. Zhang, Eric G. Eddings, Adel F. SarofimThe University of Utah
and Charles K. WestbrookLawrence Livermore National Lab
presented at2008 International Combustion Institute Meeting
Montreal, Canada, August 8th, 2008
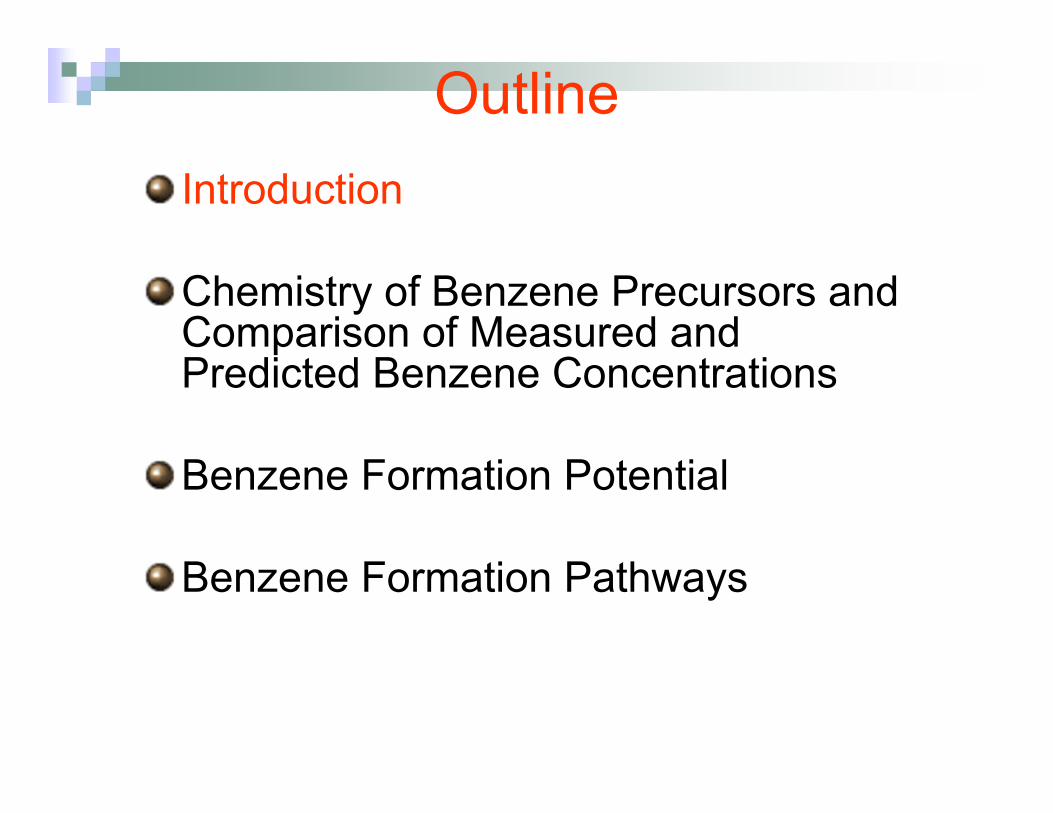
Introduction
Chemistry of Benzene Precursors and Comparison of Measured and Predicted Benzene Concentrations
Benzene Formation Potential
Benzene Formation Pathways
Outline
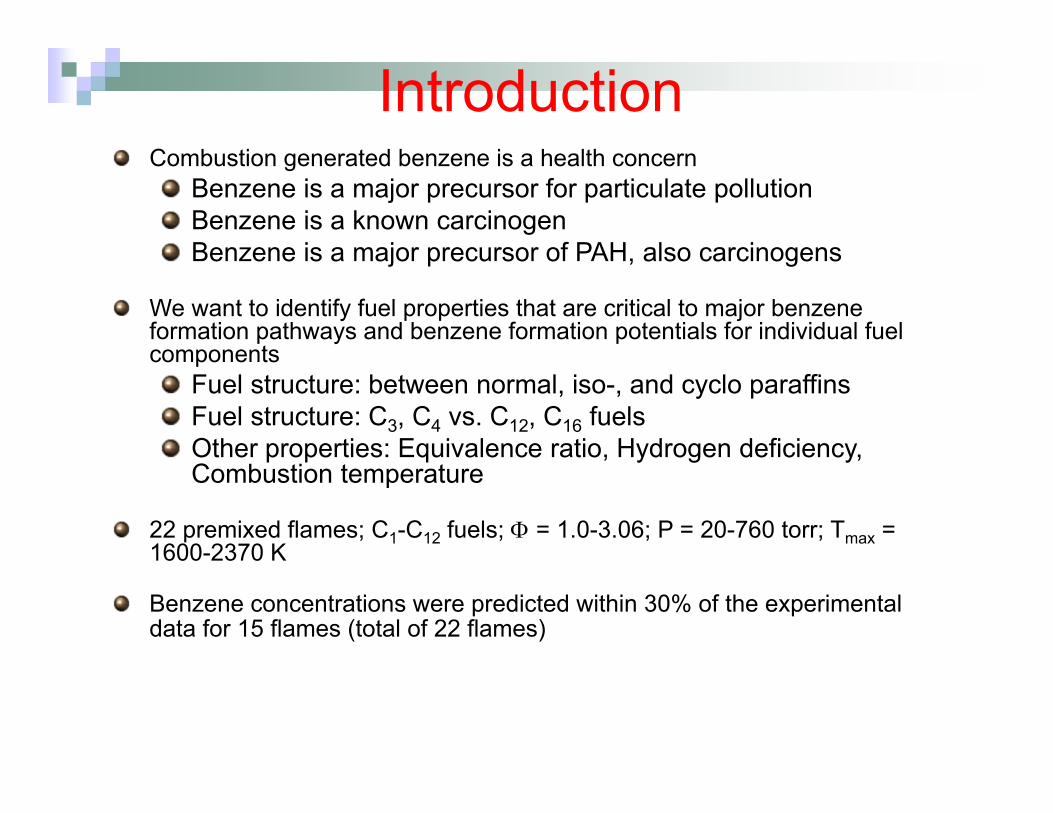
IntroductionCombustion generated benzene is a health concern
Benzene is a major precursor for particulate pollutionBenzene is a known carcinogenBenzene is a major precursor of PAH, also carcinogens
We want to identify fuel properties that are critical to major benzene formation pathways and benzene formation potentials for individual fuel components
Fuel structure: between normal, iso-, and cyclo paraffinsFuel structure: C3, C4 vs. C12, C16 fuelsOther properties: Equivalence ratio, Hydrogen deficiency, Combustion temperature
22 premixed flames; C1-C12 fuels; = 1.0-3.06; P = 20-760 torr; Tmax = 1600-2370 K
Benzene concentrations were predicted within 30% of the experimental data for 15 flames (total of 22 flames)

Class 1: Acetylene addition (Westmoreland et al., 1989; Frenklach et al., 1985)
R1: C2H2 + CH2CHCHCH = C6H6 + HR2: C2H2 + HCCHCCH = C6H5
Class 2: C3 combination (Hopf, 1971; Miller-Melius, 1992)R3: H2CCCH + H2CCCH = C6H6R4: H2CCCH + CH2CCH2 = C6H6 + HR5: H2CCCH + H2CCCH = C6H5 + HR6: H2CCCH + CH2CHCH2 = FULVENE + 2H
Class 3: Combination of CH3 and C5H5R7: C5H5 + CH3 = C-C6H8 = C6H6 + 2H
Class 4: Cascading dehydrogenation (Zhang et al., 2007)R8: cycloC6-R C-C6H10(–R) C-C6H8(–R)C6H6(–R)
Class 5: De-alkylationR9: C6H5-R + H = C6H6 + R
Major Benzene Formation Pathways Revisited
Natural Gas,
Synfuel, Indicator
Fuels, Biofuels
Liquid Fuels
from Oil and Coal

Experimental: Benzene from Cyclo-Paraffins
Author Fuel P torr T(Max) in K [C6H6]V C7H16 1.0 760 1843 12 PPM HSP gasoline 1.0 760 1990 344 LWC C-C6H12 1.0 30 1960 473
Max
Questions:
1. Why gasoline produces more benzene than n-heptane, the indicator fuel for octane rating?2. What are the benzene sources in gasoline?3. How is benzene formed from various chemical classes?
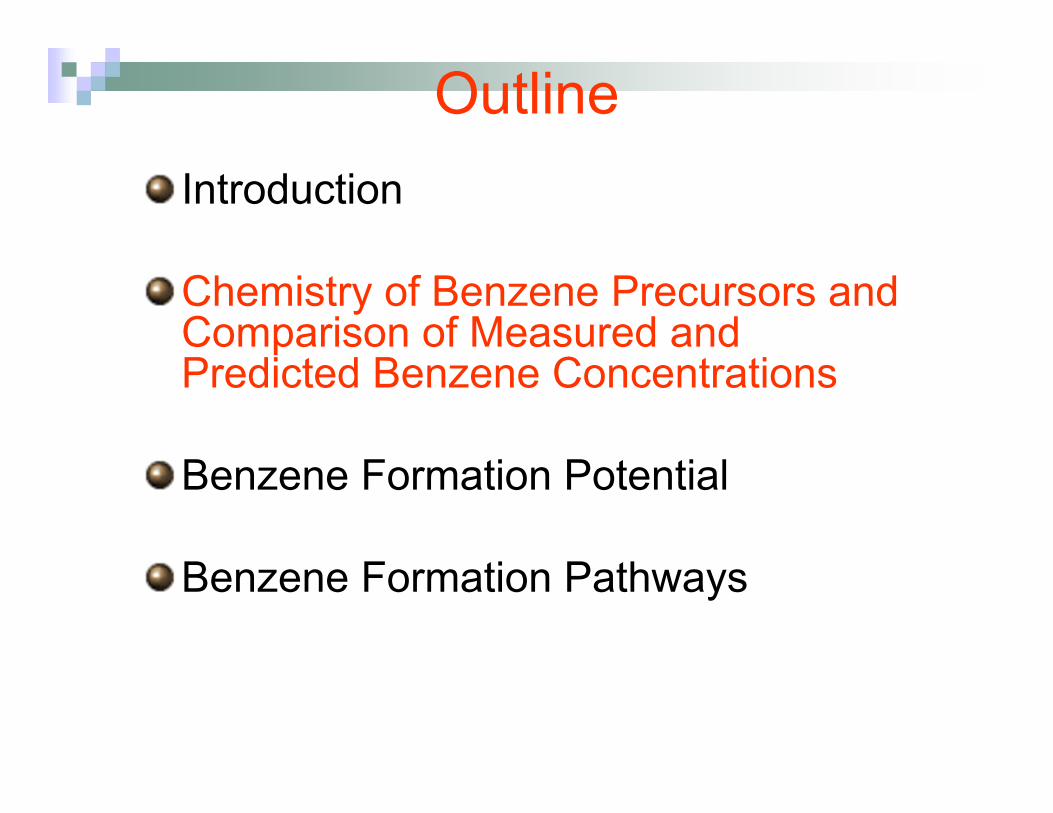
Introduction
Chemistry of Benzene Precursors and Comparison of Measured and Predicted Benzene Concentrations
Benzene Formation Potential
Benzene Formation Pathways
Outline
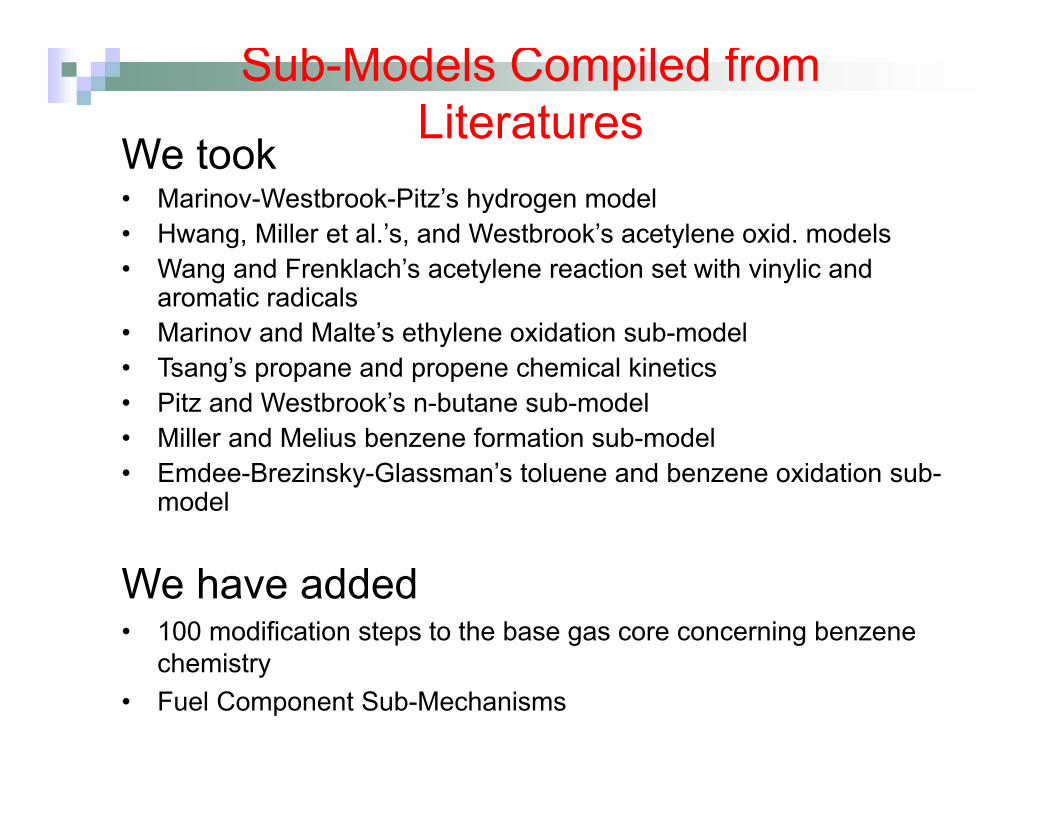
Sub-Models Compiled from Literatures
We took• Marinov-Westbrook-Pitz’s hydrogen model• Hwang, Miller et al.’s, and Westbrook’s acetylene oxid. models• Wang and Frenklach’s acetylene reaction set with vinylic and
aromatic radicals• Marinov and Malte’s ethylene oxidation sub-model• Tsang’s propane and propene chemical kinetics• Pitz and Westbrook’s n-butane sub-model• Miller and Melius benzene formation sub-model• Emdee-Brezinsky-Glassman’s toluene and benzene oxidation sub-
model
We have added• 100 modification steps to the base gas core concerning benzene
chemistry• Fuel Component Sub-Mechanisms
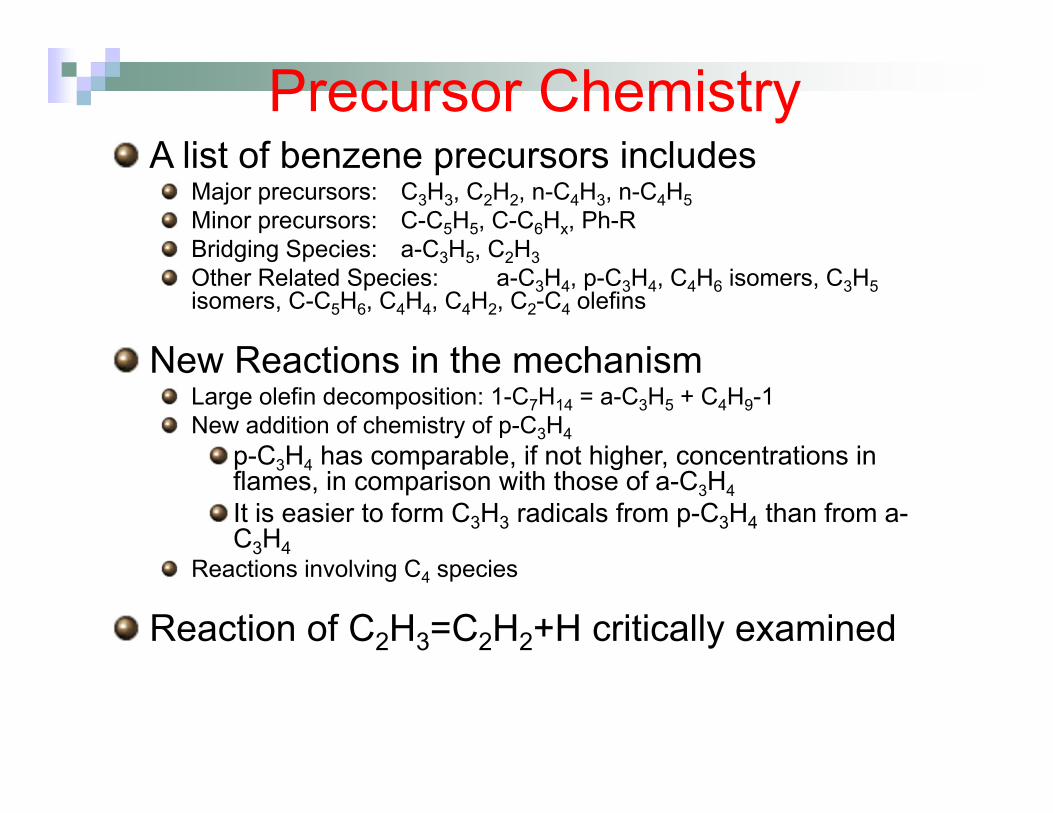
Precursor ChemistryA list of benzene precursors includes
Major precursors: C3H3, C2H2, n-C4H3, n-C4H5Minor precursors: C-C5H5, C-C6Hx, Ph-RBridging Species: a-C3H5, C2H3Other Related Species: a-C3H4, p-C3H4, C4H6 isomers, C3H5isomers, C-C5H6, C4H4, C4H2, C2-C4 olefins
New Reactions in the mechanismLarge olefin decomposition: 1-C7H14 = a-C3H5 + C4H9-1New addition of chemistry of p-C3H4
p-C3H4 has comparable, if not higher, concentrations in flames, in comparison with those of a-C3H4It is easier to form C3H3 radicals from p-C3H4 than from a-C3H4
Reactions involving C4 species
Reaction of C2H3=C2H2+H critically examined
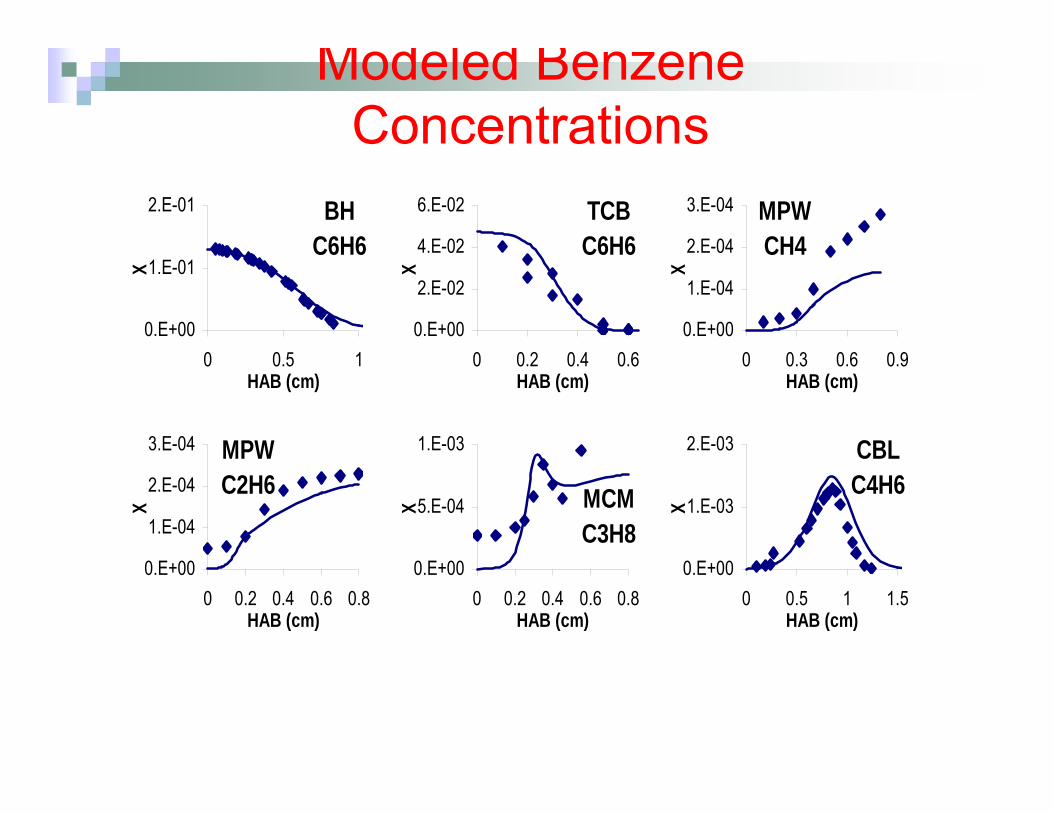
BHC6H6
0.E+00
1.E-01
2.E-01
0 0.5 1HAB (cm)
X
TCBC6H6
0.E+00
2.E-02
4.E-02
6.E-02
0 0.2 0.4 0.6HAB (cm)
X
MPWCH4
0.E+00
1.E-04
2.E-04
3.E-04
0 0.3 0.6 0.9HAB (cm)
X
MPWC2H6
0.E+00
1.E-04
2.E-04
3.E-04
0 0.2 0.4 0.6 0.8HAB (cm)
X MCMC3H8
0.E+00
5.E-04
1.E-03
0 0.2 0.4 0.6 0.8HAB (cm)
X
CBLC4H6
0.E+00
1.E-03
2.E-03
0 0.5 1 1.5HAB (cm)
X
Modeled Benzene Concentrations
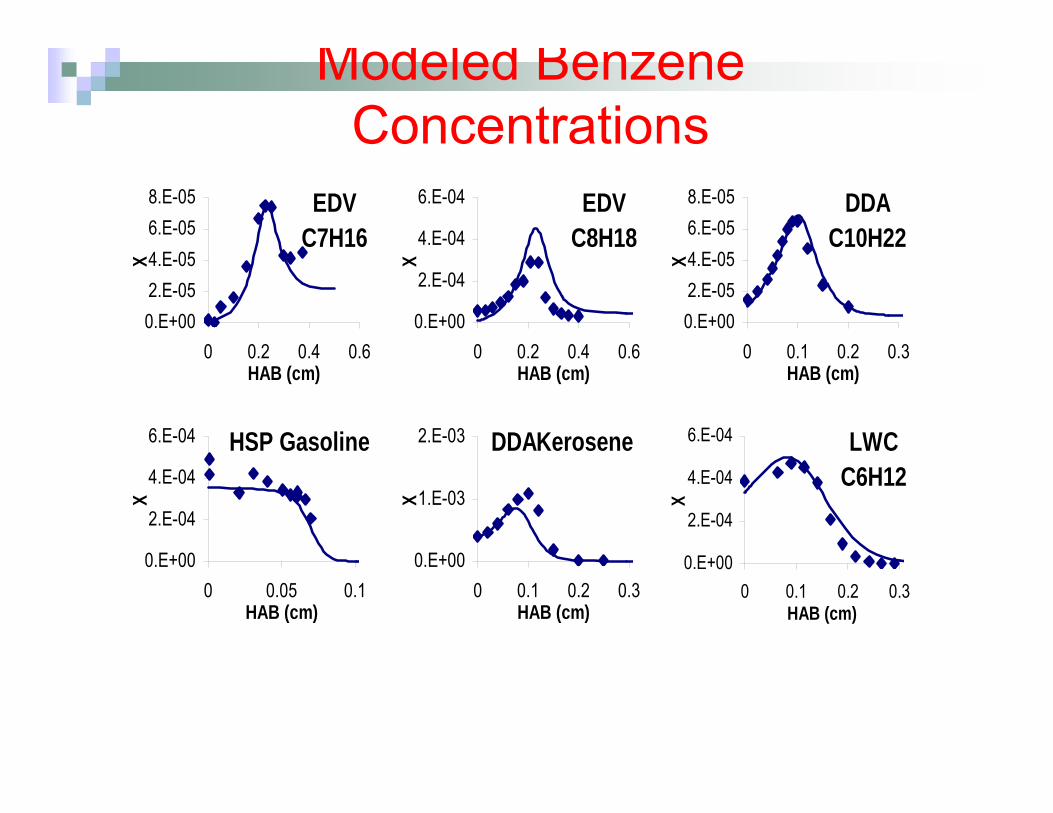
Modeled Benzene Concentrations
EDVC7H16
0.E+002.E-054.E-056.E-058.E-05
0 0.2 0.4 0.6HAB (cm)
X
EDVC8H18
0.E+00
2.E-04
4.E-04
6.E-04
0 0.2 0.4 0.6HAB (cm)
X
DDAC10H22
0.E+002.E-054.E-056.E-058.E-05
0 0.1 0.2 0.3HAB (cm)
X
HSP Gasoline
0.E+00
2.E-04
4.E-04
6.E-04
0 0.05 0.1HAB (cm)
X
DDAKerosene
0.E+00
1.E-03
2.E-03
0 0.1 0.2 0.3HAB (cm)
XLWC
C6H12
0.E+00
2.E-04
4.E-04
6.E-04
0 0.1 0.2 0.3HAB (cm)
X
Introduction
Chemistry of Benzene Precursors and Comparison of Measured and Predicted Benzene Concentrations
Benzene Formation Potential
Benzene Formation Pathways
Outline
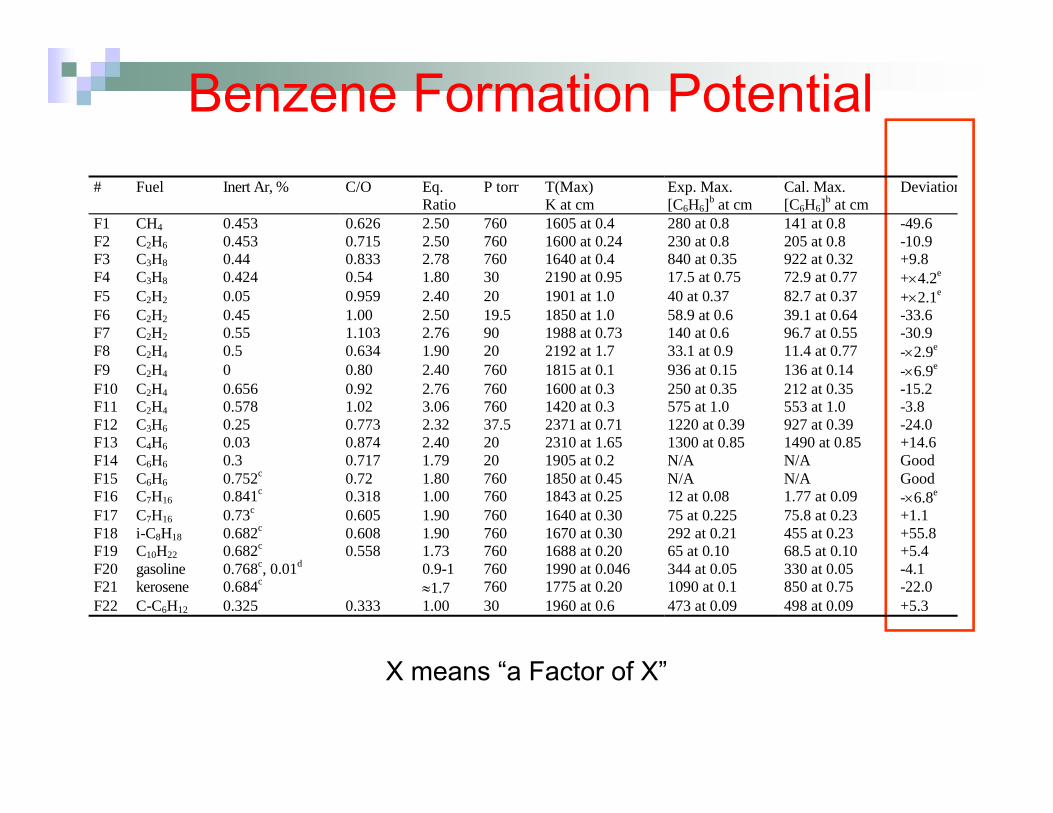
Benzene Formation Potential
X means “a Factor of X”
# Fuel Inert Ar, % C/O Eq. Ratio
P torr T(Max) K at cm
Exp. Max. [C6H6]b at cm
Cal. Max. [C6H6]b at cm
Deviation
F1 CH4 0.453 0.626 2.50 760 1605 at 0.4 280 at 0.8 141 at 0.8 -49.6 F2 C2H6 0.453 0.715 2.50 760 1600 at 0.24 230 at 0.8 205 at 0.8 -10.9 F3 C3H8 0.44 0.833 2.78 760 1640 at 0.4 840 at 0.35 922 at 0.32 +9.8 F4 C3H8 0.424 0.54 1.80 30 2190 at 0.95 17.5 at 0.75 72.9 at 0.77 +4.2e
F5 C2H2 0.05 0.959 2.40 20 1901 at 1.0 40 at 0.37 82.7 at 0.37 +2.1e F6 C2H2 0.45 1.00 2.50 19.5 1850 at 1.0 58.9 at 0.6 39.1 at 0.64 -33.6 F7 C2H2 0.55 1.103 2.76 90 1988 at 0.73 140 at 0.6 96.7 at 0.55 -30.9 F8 C2H4 0.5 0.634 1.90 20 2192 at 1.7 33.1 at 0.9 11.4 at 0.77 -2.9e F9 C2H4 0 0.80 2.40 760 1815 at 0.1 936 at 0.15 136 at 0.14 -6.9e F10 C2H4 0.656 0.92 2.76 760 1600 at 0.3 250 at 0.35 212 at 0.35 -15.2 F11 C2H4 0.578 1.02 3.06 760 1420 at 0.3 575 at 1.0 553 at 1.0 -3.8 F12 C3H6 0.25 0.773 2.32 37.5 2371 at 0.71 1220 at 0.39 927 at 0.39 -24.0 F13 C4H6 0.03 0.874 2.40 20 2310 at 1.65 1300 at 0.85 1490 at 0.85 +14.6 F14 C6H6 0.3 0.717 1.79 20 1905 at 0.2 N/A N/A Good F15 C6H6 0.752c 0.72 1.80 760 1850 at 0.45 N/A N/A Good F16 C7H16 0.841c 0.318 1.00 760 1843 at 0.25 12 at 0.08 1.77 at 0.09 -6.8e F17 C7H16 0.73c 0.605 1.90 760 1640 at 0.30 75 at 0.225 75.8 at 0.23 +1.1 F18 i-C8H18 0.682c 0.608 1.90 760 1670 at 0.30 292 at 0.21 455 at 0.23 +55.8 F19 C10H22 0.682c 0.558 1.73 760 1688 at 0.20 65 at 0.10 68.5 at 0.10 +5.4 F20 gasoline 0.768c, 0.01d 0.9-1 760 1990 at 0.046 344 at 0.05 330 at 0.05 -4.1 F21 kerosene 0.684c 1.7 760 1775 at 0.20 1090 at 0.1 850 at 0.75 -22.0 F22 C-C6H12 0.325 0.333 1.00 30 1960 at 0.6 473 at 0.09 498 at 0.09 +5.3
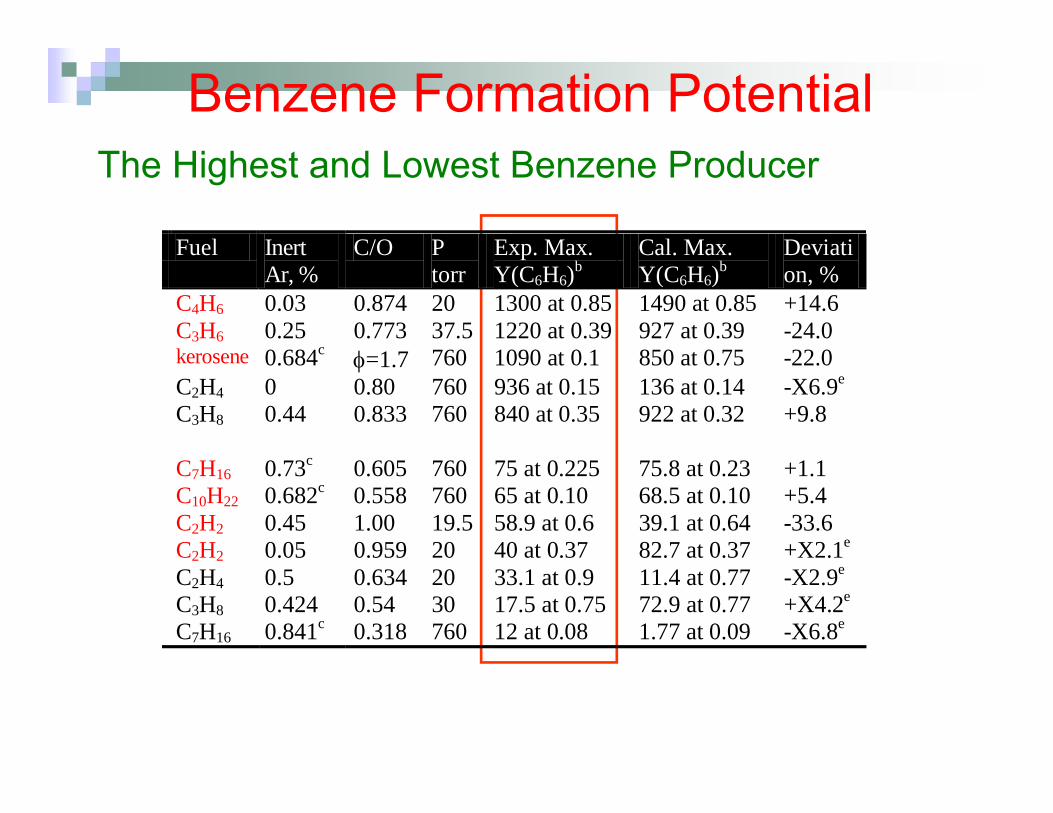
Benzene Formation PotentialThe Highest and Lowest Benzene Producer
Author Fuel Inert Ar, %
C/O P torr
Exp. Max. Y(C6H6)b
Cal. Max. Y(C6H6)b
Deviation, %
CBL C4H6 0.03 0.874 20 1300 at 0.85 1490 at 0.85 +14.6 AHB C3H6 0.25 0.773 37.5 1220 at 0.39 927 at 0.39 -24.0 DDA kerosene 0.684c =1.7 760 1090 at 0.1 850 at 0.75 -22.0 CDB C2H4 0 0.80 760 936 at 0.15 136 at 0.14 -X6.9e MCM C3H8 0.44 0.833 760 840 at 0.35 922 at 0.32 +9.8 EDA C7H16 0.73c 0.605 760 75 at 0.225 75.8 at 0.23 +1.1 DDA C10H22 0.682c 0.558 760 65 at 0.10 68.5 at 0.10 +5.4 BDR C2H2 0.45 1.00 19.5 58.9 at 0.6 39.1 at 0.64 -33.6 WHL C2H2 0.05 0.959 20 40 at 0.37 82.7 at 0.37 +X2.1e BW C2H4 0.5 0.634 20 33.1 at 0.9 11.4 at 0.77 -X2.9e CNT C3H8 0.424 0.54 30 17.5 at 0.75 72.9 at 0.77 +X4.2e
V C7H16 0.841c 0.318 760 12 at 0.08 1.77 at 0.09 -X6.8e
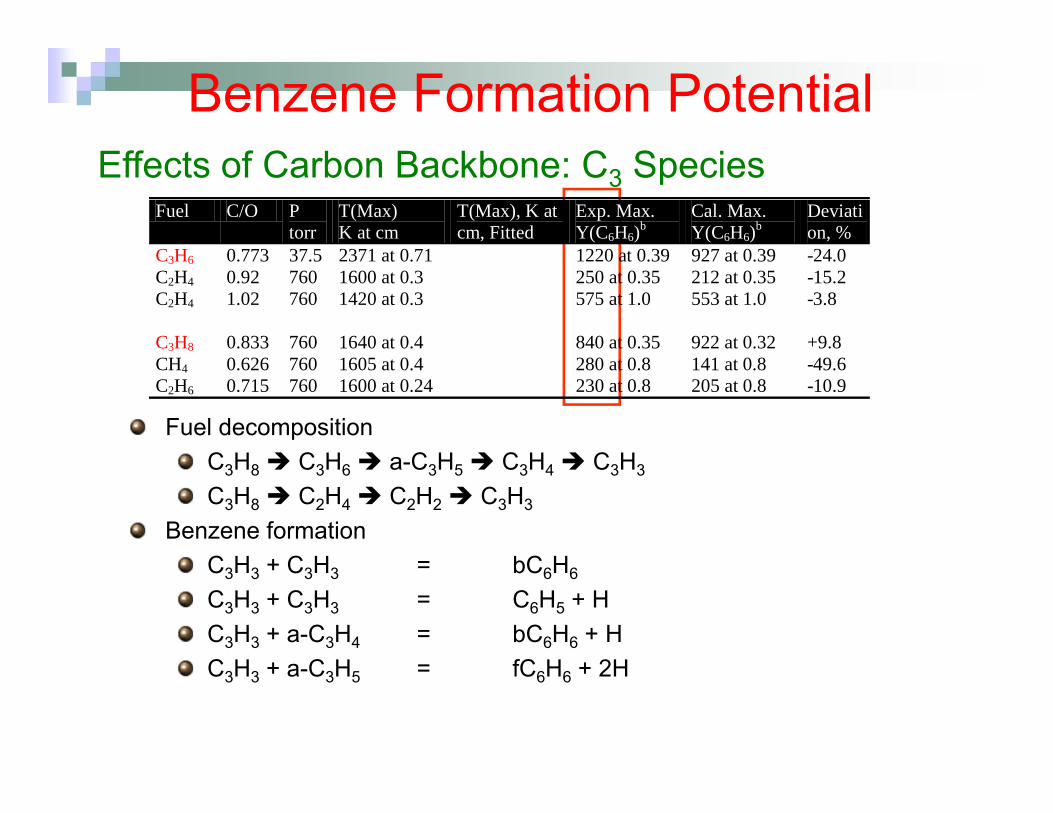
Benzene Formation PotentialEffects of Carbon Backbone: C3 Species
Fuel decompositionC3H8 C3H6 a-C3H5 C3H4 C3H3
C3H8 C2H4 C2H2 C3H3
Benzene formationC3H3 + C3H3 = bC6H6
C3H3 + C3H3 = C6H5 + HC3H3 + a-C3H4 = bC6H6 + HC3H3 + a-C3H5 = fC6H6 + 2H
Author Fuel C/O P torr
T(Max) K at cm
T(Max), K at cm, Fitted
Exp. Max. Y(C6H6)b
Cal. Max. Y(C6H6)b
Deviation, %
AHB C3H6 0.773 37.5 2371 at 0.71 1220 at 0.39 927 at 0.39 -24.0 HW C2H4 0.92 760 1600 at 0.3 250 at 0.35 212 at 0.35 -15.2 CMM C2H4 1.02 760 1420 at 0.3 575 at 1.0 553 at 1.0 -3.8 MCM C3H8 0.833 760 1640 at 0.4 840 at 0.35 922 at 0.32 +9.8 MPW CH4 0.626 760 1605 at 0.4 280 at 0.8 141 at 0.8 -49.6 MPW C2H6 0.715 760 1600 at 0.24 230 at 0.8 205 at 0.8 -10.9
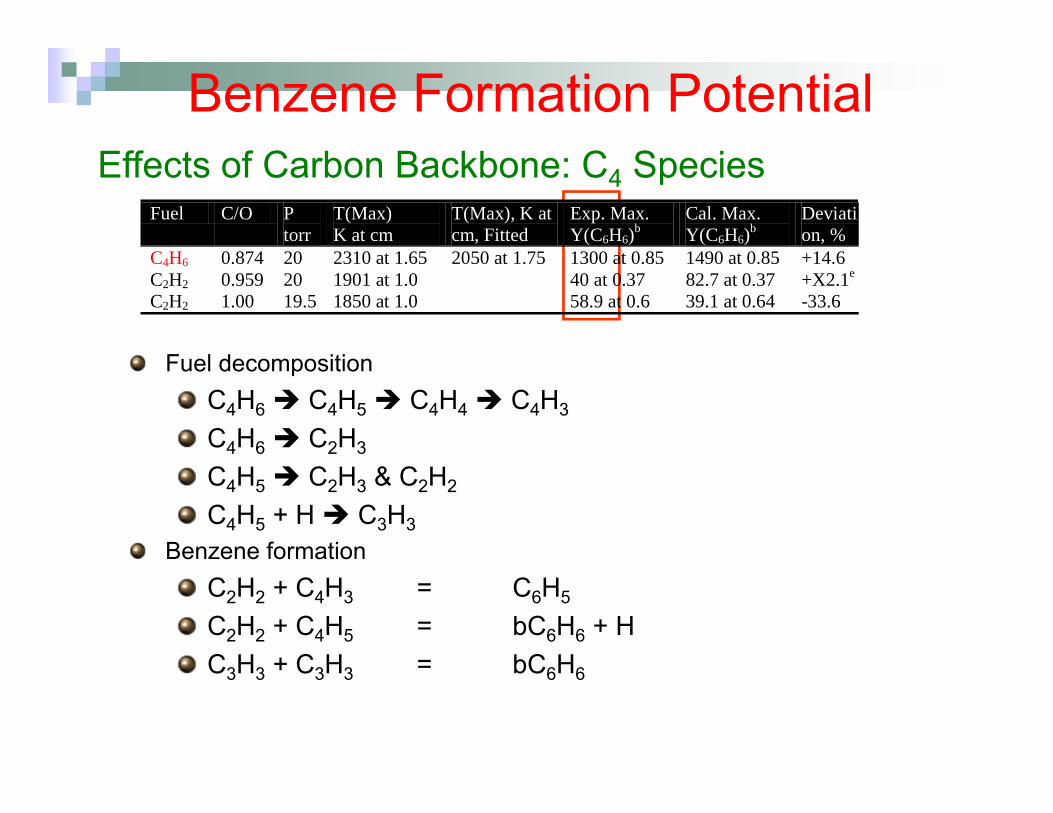
Benzene Formation PotentialEffects of Carbon Backbone: C4 Species
Fuel decompositionC4H6 C4H5 C4H4 C4H3
C4H6 C2H3
C4H5 C2H3 & C2H2
C4H5 + H C3H3Benzene formation
C2H2 + C4H3 = C6H5
C2H2 + C4H5 = bC6H6 + HC3H3 + C3H3 = bC6H6
Author Fuel C/O P torr
T(Max) K at cm
T(Max), K at cm, Fitted
Exp. Max. Y(C6H6)b
Cal. Max. Y(C6H6)b
Deviation, %
CBL C4H6 0.874 20 2310 at 1.65 2050 at 1.75 1300 at 0.85 1490 at 0.85 +14.6 WHL C2H2 0.959 20 1901 at 1.0 40 at 0.37 82.7 at 0.37 +X2.1e
BDR C2H2 1.00 19.5 1850 at 1.0 58.9 at 0.6 39.1 at 0.64 -33.6
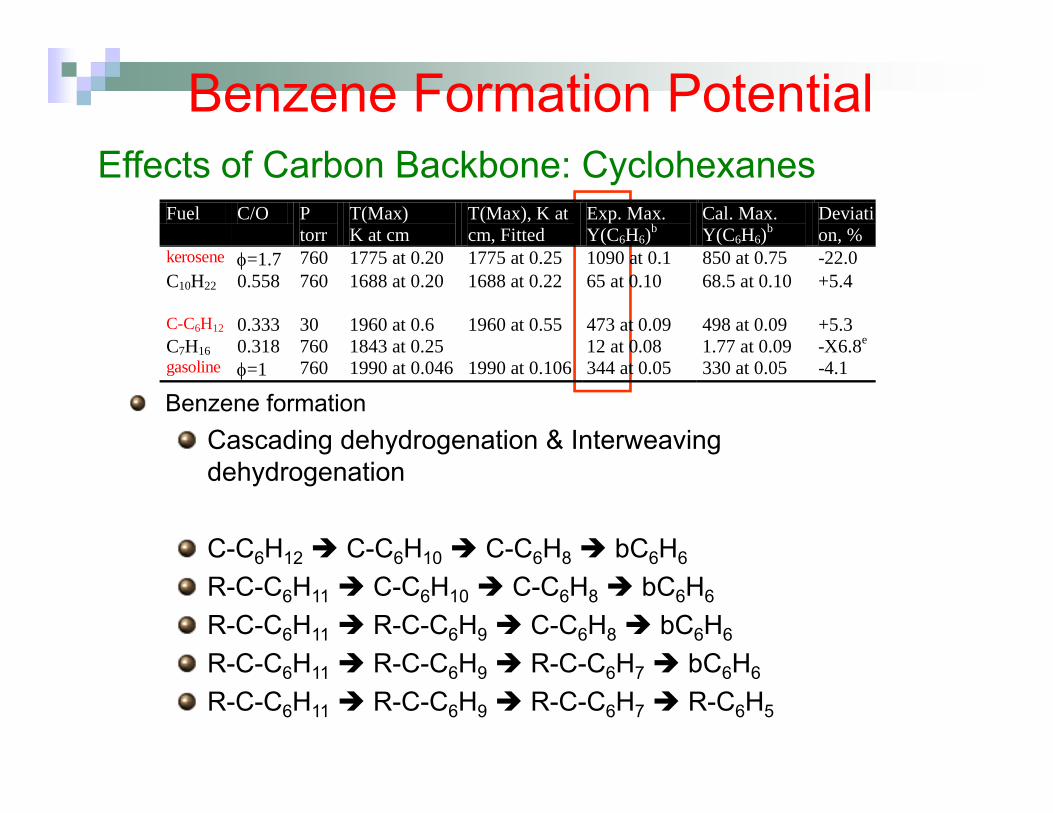
Benzene Formation PotentialEffects of Carbon Backbone: Cyclohexanes
Benzene formationCascading dehydrogenation & Interweaving dehydrogenation
C-C6H12 C-C6H10 C-C6H8 bC6H6
R-C-C6H11 C-C6H10 C-C6H8 bC6H6
R-C-C6H11 R-C-C6H9 C-C6H8 bC6H6
R-C-C6H11 R-C-C6H9 R-C-C6H7 bC6H6
R-C-C6H11 R-C-C6H9 R-C-C6H7 R-C6H5
Author Fuel C/O P torr
T(Max) K at cm
T(Max), K at cm, Fitted
Exp. Max. Y(C6H6)b
Cal. Max. Y(C6H6)b
Deviation, %
DDA kerosene =1.7 760 1775 at 0.20 1775 at 0.25 1090 at 0.1 850 at 0.75 -22.0 DDA C10H22 0.558 760 1688 at 0.20 1688 at 0.22 65 at 0.10 68.5 at 0.10 +5.4 LWC C-C6H12 0.333 30 1960 at 0.6 1960 at 0.55 473 at 0.09 498 at 0.09 +5.3 V C7H16 0.318 760 1843 at 0.25 12 at 0.08 1.77 at 0.09 -X6.8e
HSP gasoline =1 760 1990 at 0.046 1990 at 0.106 344 at 0.05 330 at 0.05 -4.1
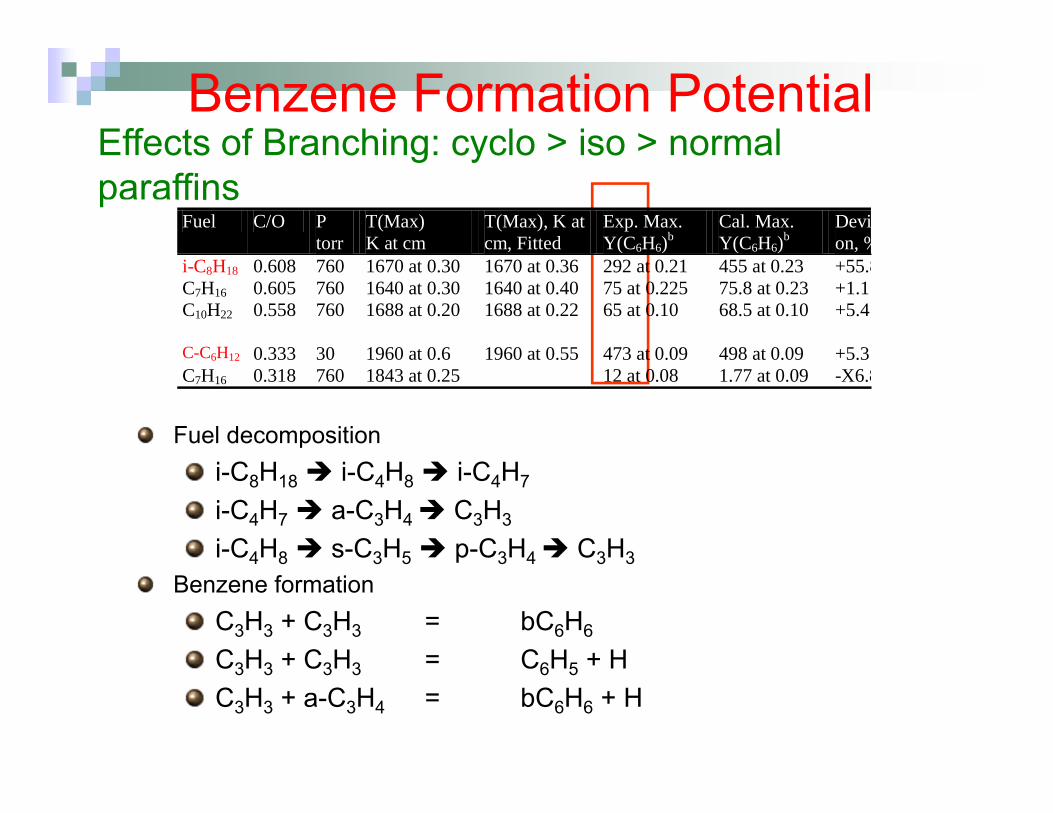
Benzene Formation PotentialEffects of Branching: cyclo > iso > normal paraffins
Fuel decompositioni-C8H18 i-C4H8 i-C4H7
i-C4H7 a-C3H4 C3H3
i-C4H8 s-C3H5 p-C3H4 C3H3Benzene formation
C3H3 + C3H3 = bC6H6
C3H3 + C3H3 = C6H5 + HC3H3 + a-C3H4 = bC6H6 + H
Author Fuel C/O P torr
T(Max) K at cm
T(Max), K at cm, Fitted
Exp. Max. Y(C6H6)b
Cal. Max. Y(C6H6)b
Devion, %
EDA i-C8H18 0.608 760 1670 at 0.30 1670 at 0.36 292 at 0.21 455 at 0.23 +55.8EDA C7H16 0.605 760 1640 at 0.30 1640 at 0.40 75 at 0.225 75.8 at 0.23 +1.1DDA C10H22 0.558 760 1688 at 0.20 1688 at 0.22 65 at 0.10 68.5 at 0.10 +5.4 LWC C-C6H12 0.333 30 1960 at 0.6 1960 at 0.55 473 at 0.09 498 at 0.09 +5.3V C7H16 0.318 760 1843 at 0.25 12 at 0.08 1.77 at 0.09 -X6.8

Introduction
Chemistry of Benzene Precursors and Comparison of Measured and Predicted Benzene Concentrations
Benzene Formation Potential
Benzene Formation Pathways
Outline
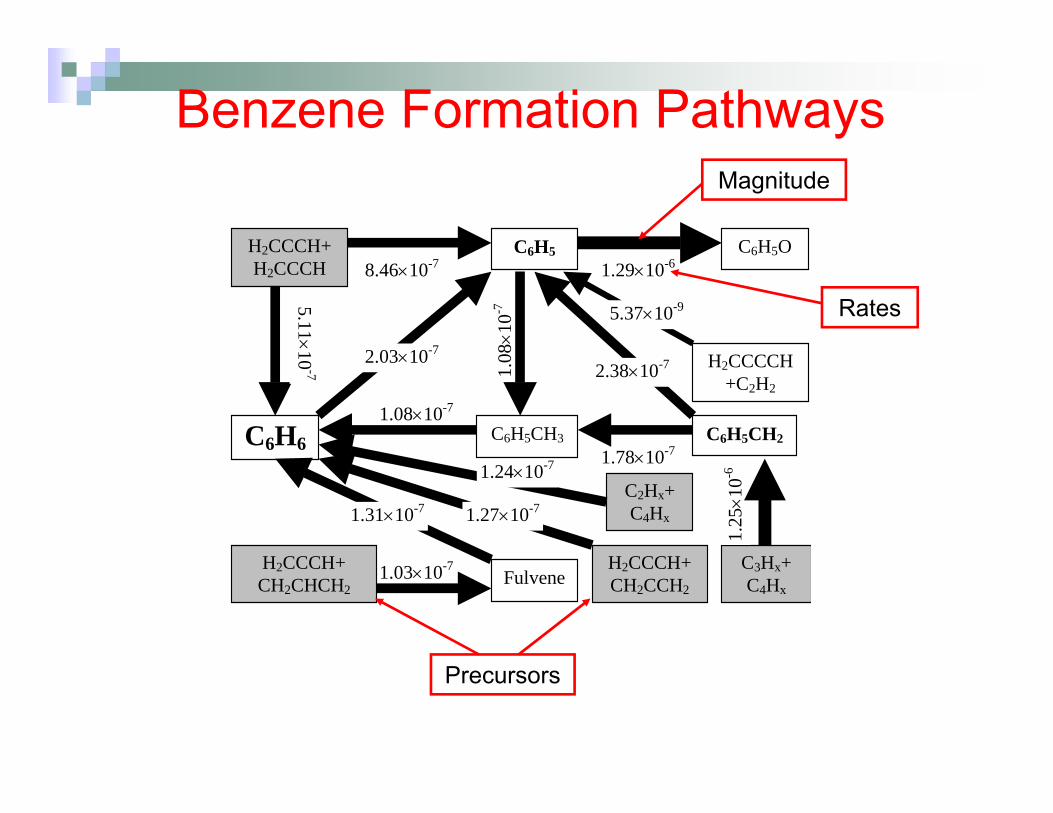
Benzene Formation Pathways
1.0810-7
C6H5CH3
C6H5OH2CCCH+H2CCCH
5.11 10-7
8.4610-7
C6H6
2.0310-7
Fulvene
1.3110-7
H2CCCH+CH2CCH2
1.2710-7
C3Hx+C4Hx
1.25 1
0-6
C6H5CH21.7810-7
2.3810-7
1.0310-7H2CCCH+ CH2CHCH2
H2CCCCH+C2H2
C6H51.2910-6
1.08 1
0-7
5.3710-9
C2Hx+C4Hx
1.2410-7
Rates
Magnitude
Precursors
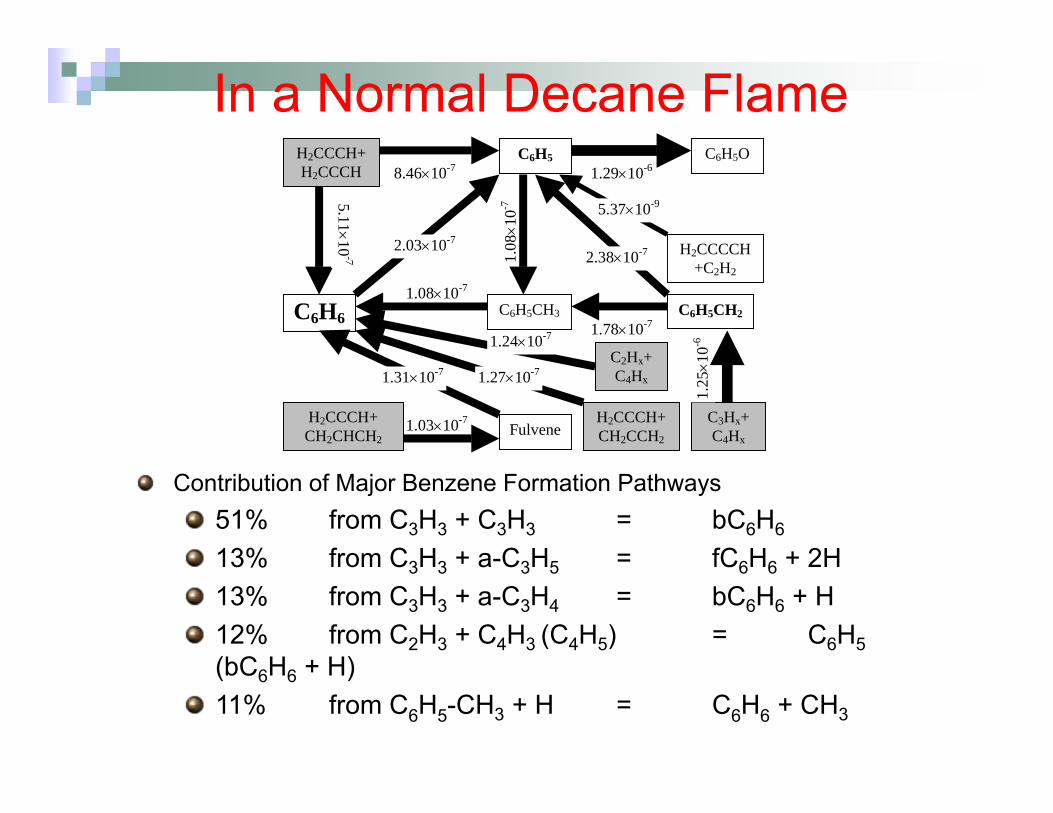
In a Normal Decane Flame
1.0810-7
C6H5CH3
C6H5OH2CCCH+H2CCCH
5.11 10-7
8.4610-7
C6H6
2.0310-7
Fulvene
1.3110-7
H2CCCH+CH2CCH2
1.2710-7
C3Hx+C4Hx
1.25 1
0-6
C6H5CH21.7810-7
2.3810-7
1.0310-7H2CCCH+ CH2CHCH2
H2CCCCH+C2H2
C6H51.2910-6
1.08 1
0-7
5.3710-9
C2Hx+ C4Hx
1.2410-7
Contribution of Major Benzene Formation Pathways51% from C3H3 + C3H3 = bC6H6
13% from C3H3 + a-C3H5 = fC6H6 + 2H13% from C3H3 + a-C3H4 = bC6H6 + H12% from C2H3 + C4H3 (C4H5) = C6H5 (bC6H6 + H)11% from C6H5-CH3 + H = C6H6 + CH3
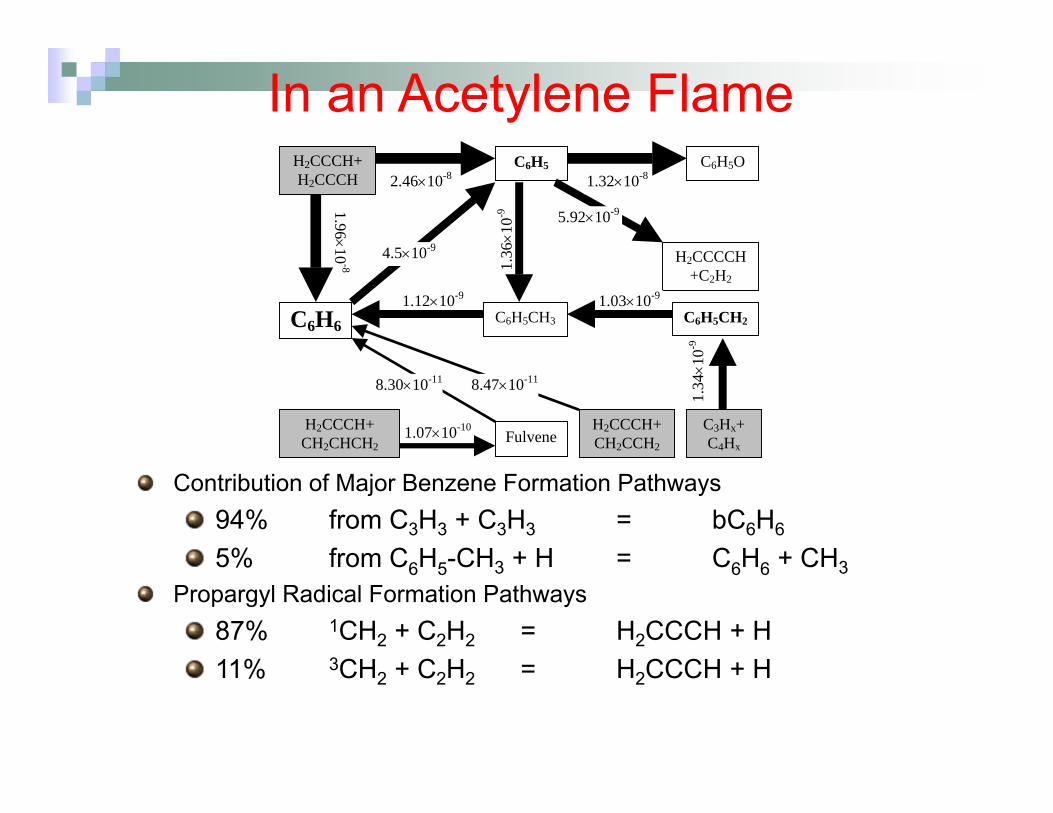
In an Acetylene Flame
Contribution of Major Benzene Formation Pathways94% from C3H3 + C3H3 = bC6H6
5% from C6H5-CH3 + H = C6H6 + CH3Propargyl Radical Formation Pathways
87% 1CH2 + C2H2 = H2CCCH + H11% 3CH2 + C2H2 = H2CCCH + H
1.1210-9
C6H5CH3
C6H5O
H2CCCCH+C2H2
C6H6
4.510-9
Fulvene
8.3010-11
H2CCCH+CH2CCH2
8.4710-11
C3Hx+C4Hx
1.34 1
0-9
1.0310-9
C6H5CH2
1.0710-10H2CCCH+ CH2CHCH2
C6H5
5.9210-9
1.3210-8
1.36 1
0-9
H2CCCH+H2CCCH 2.4610-8
1.96 10-8
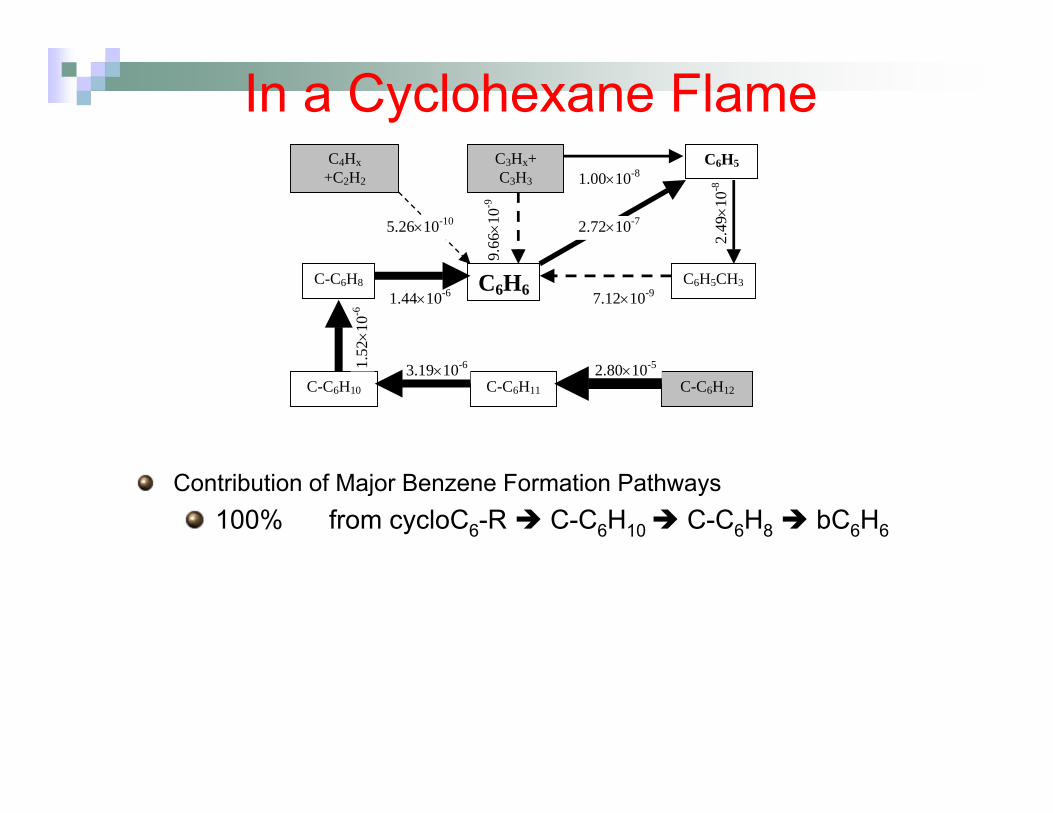
In a Cyclohexane Flame
Contribution of Major Benzene Formation Pathways100% from cycloC6-R C-C6H10 C-C6H8 bC6H6
7.1210-9C6H5CH3
C3Hx+ C3H3
9.66 1
0-9
1.0010-8
C6H6
2.7210-7
C4Hx +C2H2
5.2610-10
C-C6H10
1.52 1
0-6
C6H5
2.49 1
0-8
C-C6H11
3.1910-6
C-C6H12 2.8010-5
C-C6H8
1.4410-6
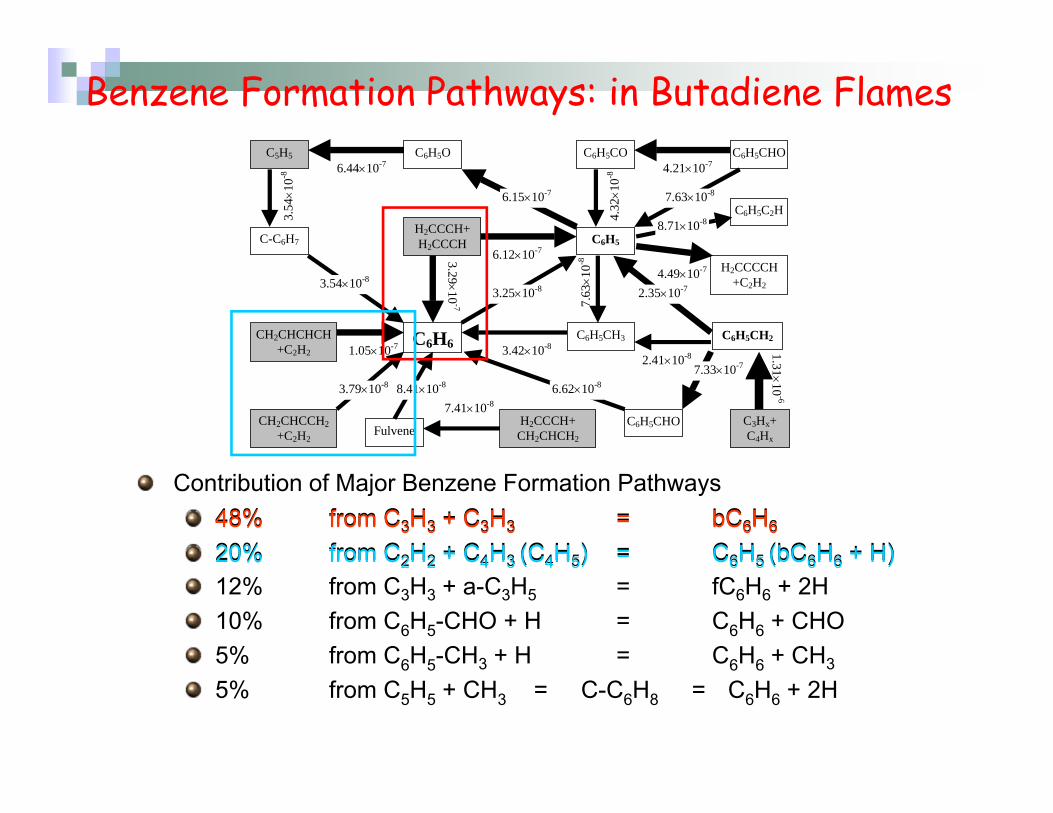
Benzene Formation Pathways: in Butadiene Flames
Contribution of Major Benzene Formation Pathways48% from C3H3 + C3H3 = bC6H6
20% from C2H2 + C4H3 (C4H5) = C6H5 (bC6H6 + H)12% from C3H3 + a-C3H5 = fC6H6 + 2H10% from C6H5-CHO + H = C6H6 + CHO5% from C6H5-CH3 + H = C6H6 + CH3
5% from C5H5 + CH3 = C-C6H8 = C6H6 + 2H
CH2CHCHCH+C2H2 1.0510-7 3.4210-8
C6H5CH3
H2CCCH+H2CCCH
3.29 10-7
6.1210-7
H2CCCCH+C2H2
C6H6
3.2510-8
Fulvene
8.4110-8
C3Hx+C4Hx
1.31 10-6
H2CCCH+ CH2CHCH2
7.4110-8
C6H5CHO
6.6210-8
C6H5CH2
2.4110-8
2.3510-7
7.3310-7
C6H5CO
4.32 1
0-8
C6H5C2H
C6H5O6.4410-7
C5H5
3.54 1
0-8
C-C6H7
3.5410-8
C6H5
7.63 1
0-8
4.4910-7
8.7110-8
6.1510-7
CH2CHCCH2+C2H2
3.7910-8
C6H5CHO4.2110-7
7.6310-8
48% from C3H3 + C3H3 = bC6H6
20% from C2H2 + C4H3 (C4H5) = C6H5 (bC6H6 + H)
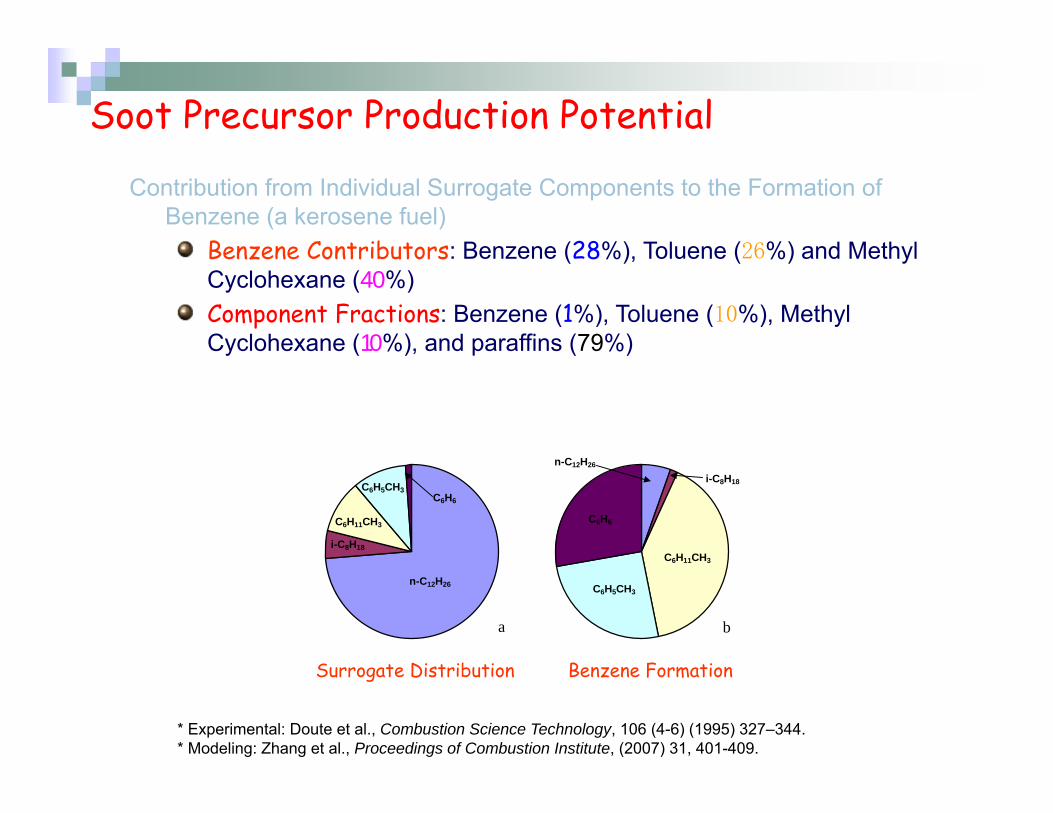
Soot Precursor Production Potential
Contribution from Individual Surrogate Components to the Formation of Benzene (a kerosene fuel)
Benzene Contributors: Benzene (28%), Toluene (26%) and Methyl Cyclohexane (40%)Component Fractions: Benzene (1%), Toluene (10%), Methyl Cyclohexane (10%), and paraffins (79%)
n-C12H26
a
i-C8H18
C6H11CH3
C6H5CH3C6H6
n-C12H26
b
i-C8H18
C6H11CH3
C6H5CH3
C6H6
Surrogate Distribution Benzene Formation
* Experimental: Doute et al., Combustion Science Technology, 106 (4-6) (1995) 327–344.* Modeling: Zhang et al., Proceedings of Combustion Institute, (2007) 31, 401-409.
Concluding CommentsThe Utah Surrogate Model Was Validated for 22 Premixed Flames of Various Fuels (C1-C12 fuels; = 1.0-3.06; P = 20-760 torr; T = 1600-2370 K).Benzene Concentrations Were Predicted within 30% of the Experimental Data for 15 (out of 22) Flames.Both Formation Pathways and Formation Potential of Benzene Were Found to Be Dependent on the Fuel Structure, and C3, C4 and C-C6 Were among the Most Productive Fuels.C3 Combination Was Identified to be the Major Benzene Formation Pathway for Most Fuels; That Is Replaced with Dehydrogenation Only for Cyclohexanes.Acetylene Addition Was Found to Be Important in C4Flames and Those with Large Paraffinic Fuels.
Flame experiments on formation of the first aromatics, usually benzene or toluene McNesby et al., Combust. Flame 142, 413-427 (2005)
Opposed flow diffusion flames
McEnally et al., Prog. En. Comb. Sci. 32, 247-294 (2006) Co-flow non-premixed flames
Violi and Izvekov, PROCI 31, 529-537 (2007). Molecular dynamics
Desgroux et al., PROCI 34, 1713-1738 (2013) Review of use of optical diagnostics

Thomas and Wornat, PROCI 32, 2009. Pyrolysis of catechol and butadiene at 1000 C, residence time of 0.3 seconds
Premixed ignition in Diesel combustion
• Fuel-rich conditions ( ≈ 4 )• Relatively low temperature (T ≈ 850 K )
- Source of cetane ratings in Diesel engines- Very similar to conditions of engine knock
- Very complex chemical kinetic pathways
• Products are good producers of soot precursor species
• Ignition kinetics are the same as in engine knock in SI engines, driven by H2O2 decomposition
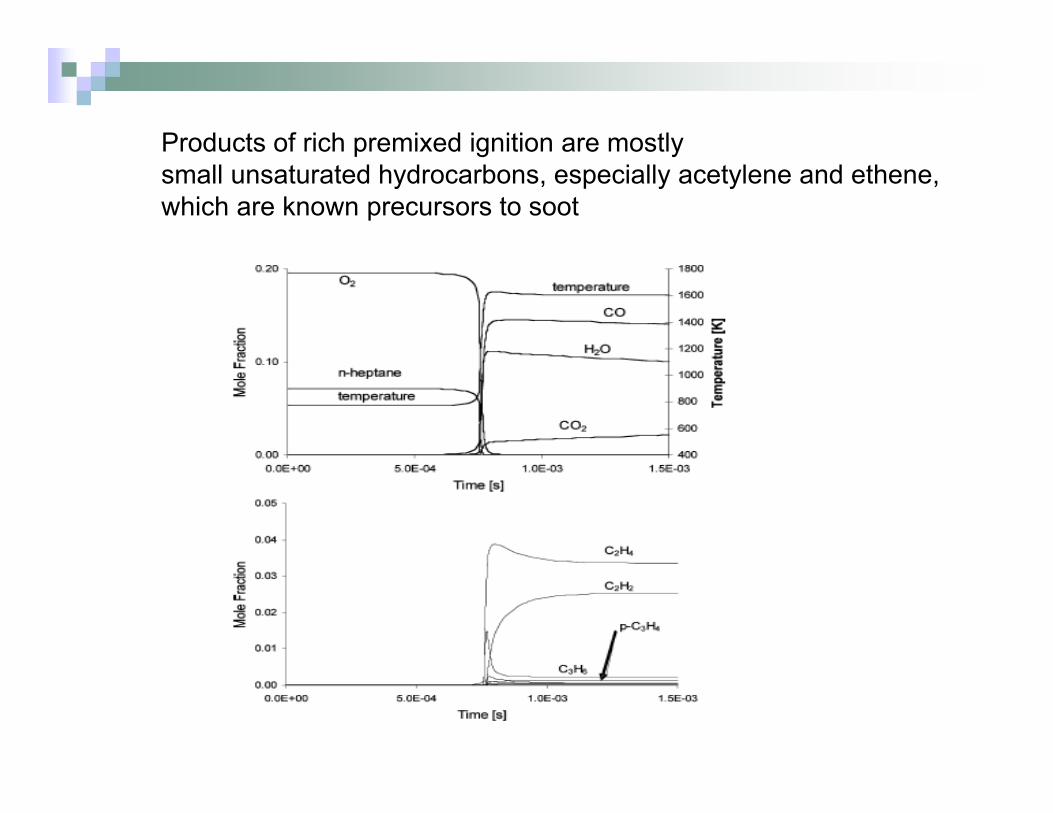
Products of rich premixed ignition are mostlysmall unsaturated hydrocarbons, especially acetylene and ethene,which are known precursors to soot
Experimental background
• Addition of oxygenated species reduces soot
- Important possible oxygenates include biodiesel fuels
• Soot production correlates with post-ignition levels of selected
chemical species
• Suggestions that this is due to presence of C - C bonds or total O
concentrations
• Use kinetic model to examine these possibilities
44
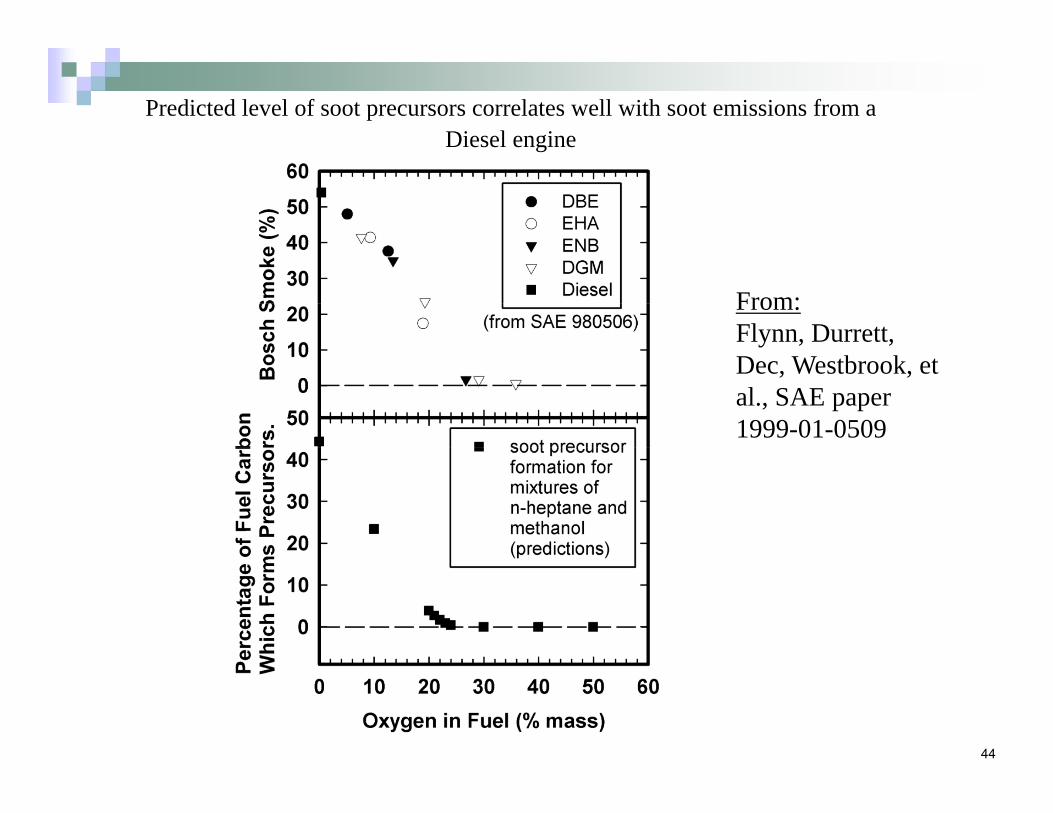
Predicted level of soot precursors correlates well with soot emissions from a Diesel engine
From:Flynn, Durrett, Dec, Westbrook, et al., SAE paper1999-01-0509

45
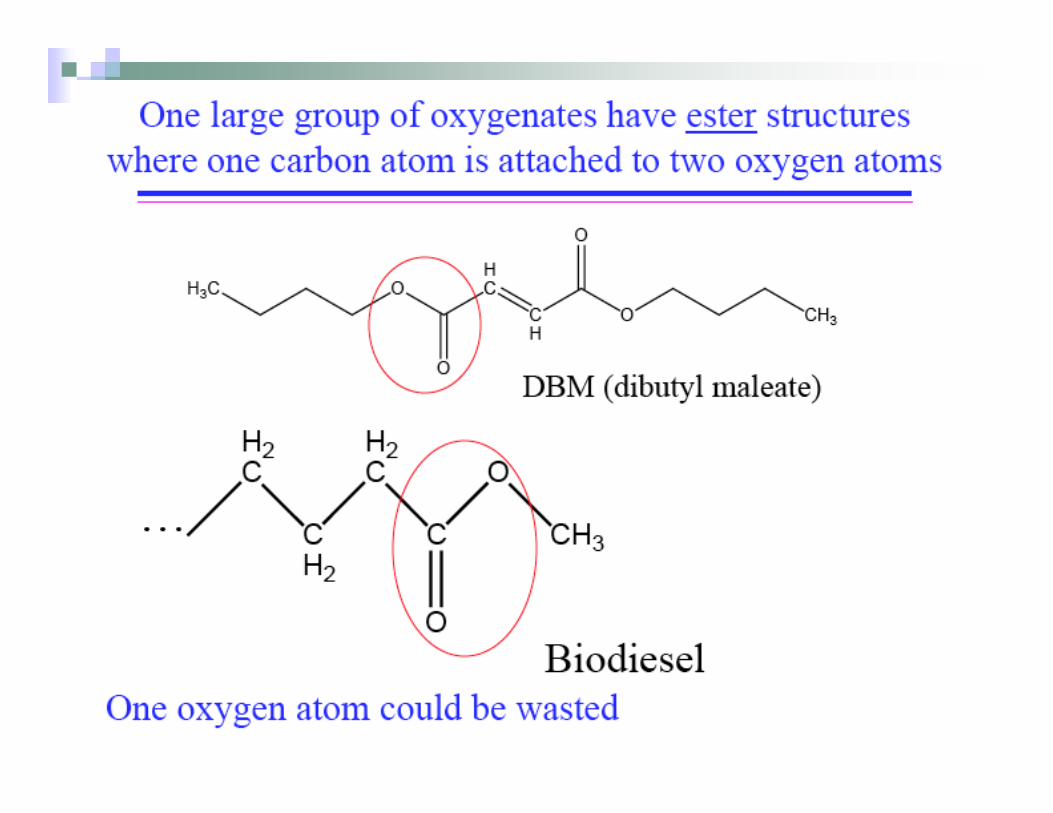

Structure of Tripropylene Glycol Monomethyl Ether (TPGME)
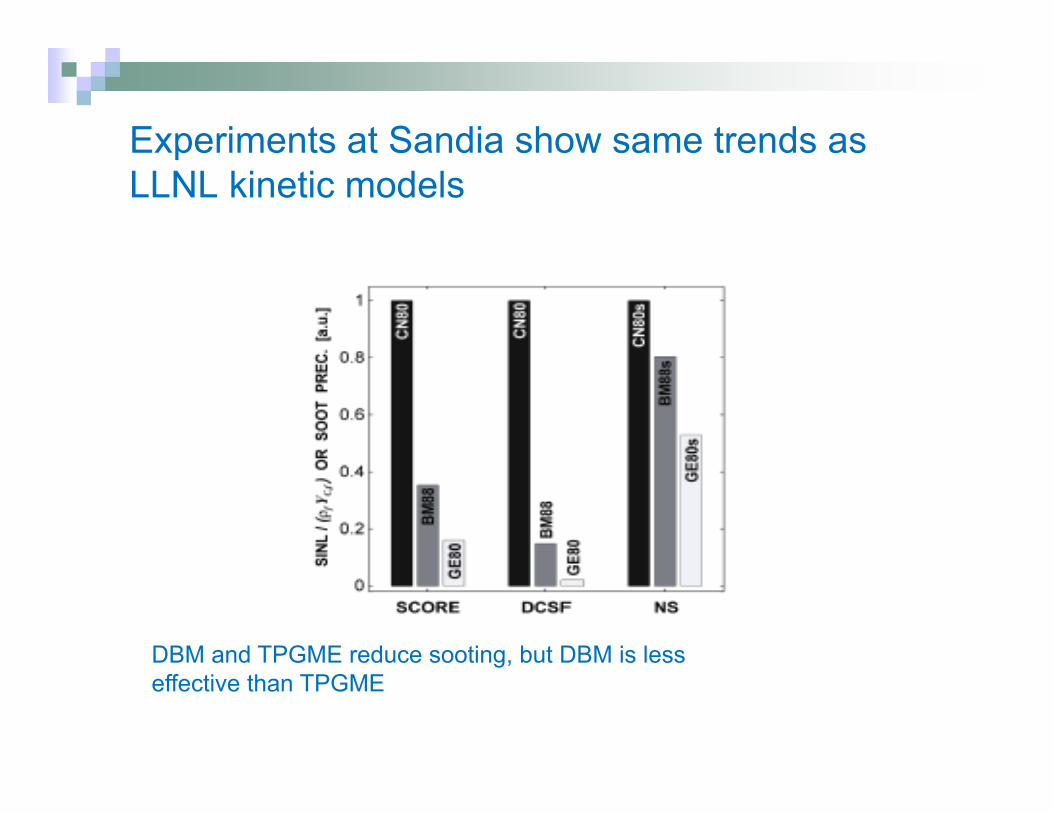
Experiments at Sandia show same trends as LLNL kinetic models
DBM and TPGME reduce sooting, but DBM is less effective than TPGME

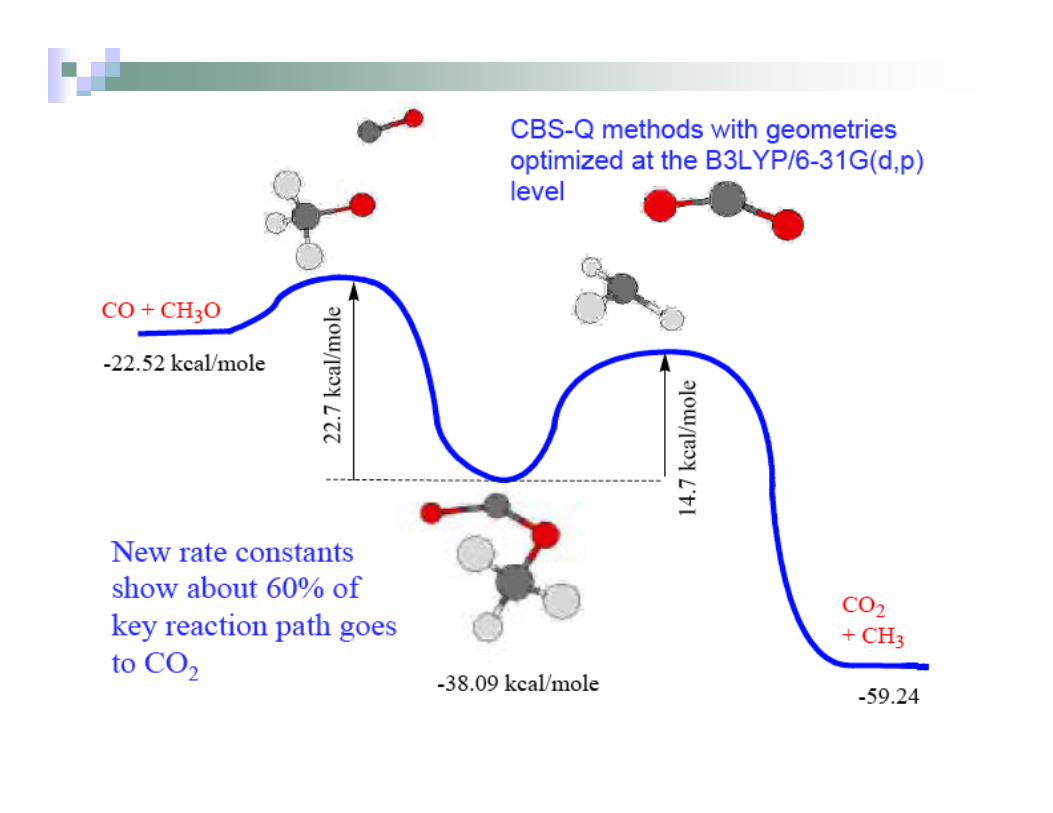
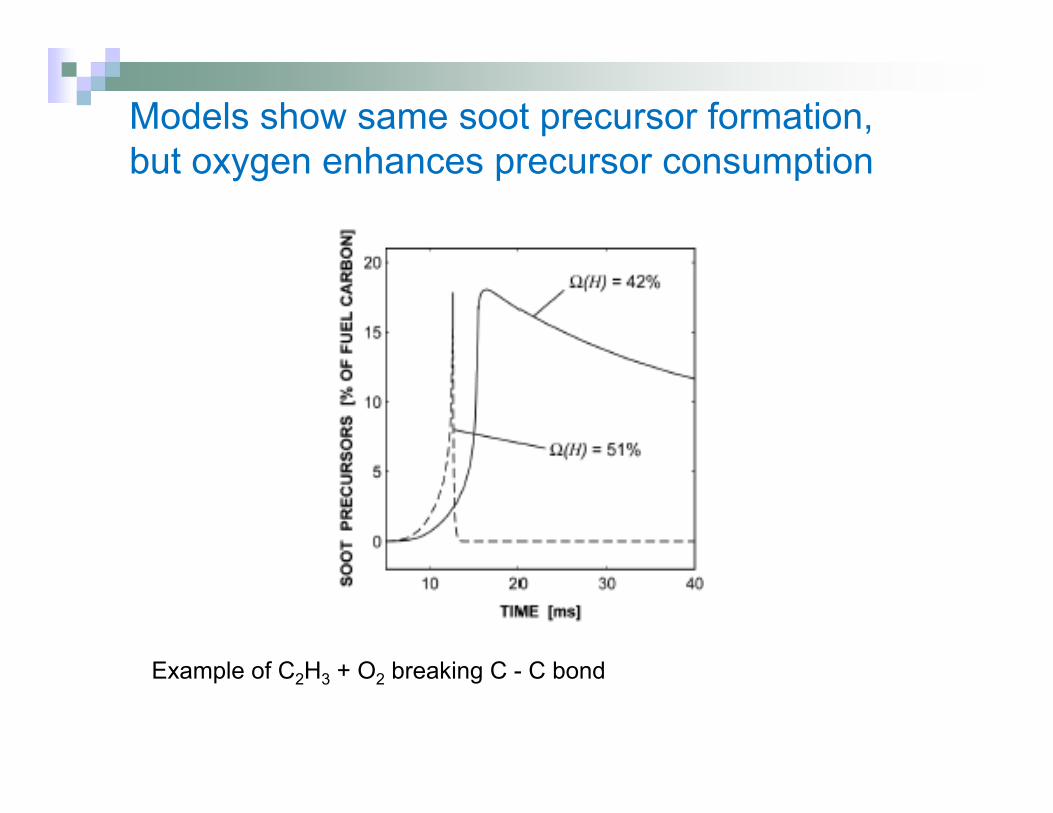
Models show same soot precursor formation, but oxygen enhances precursor consumption
Example of C2H3 + O2 breaking C - C bond
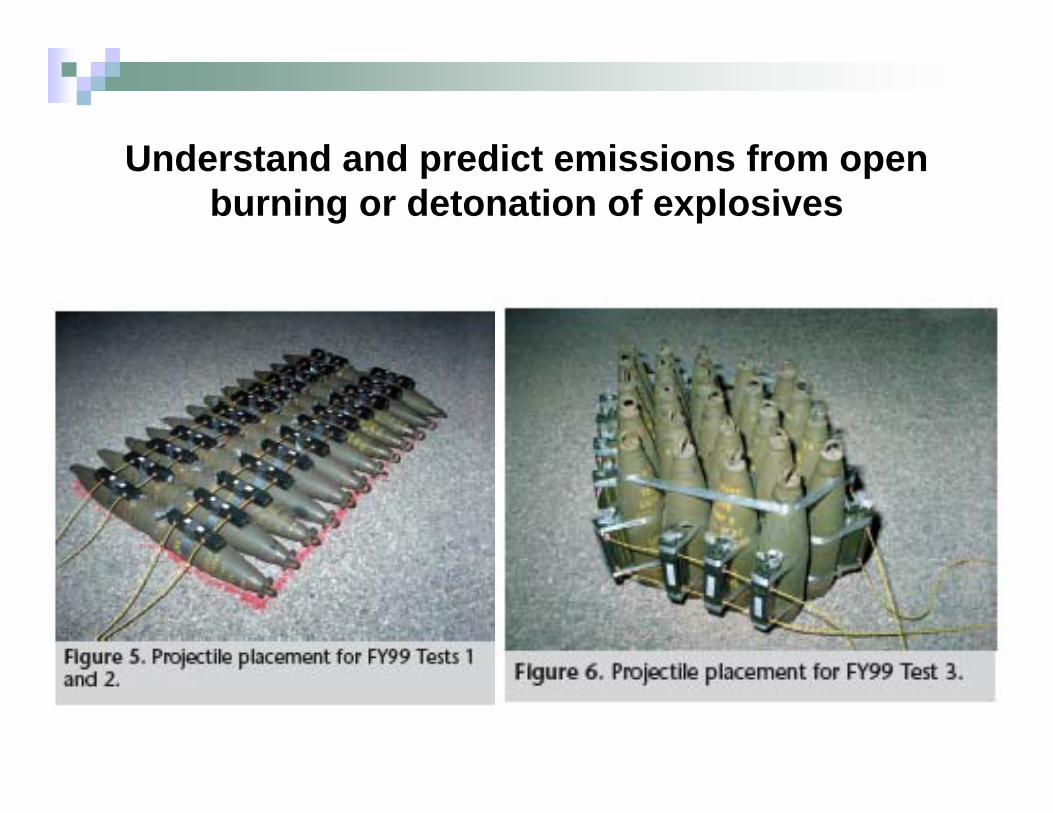
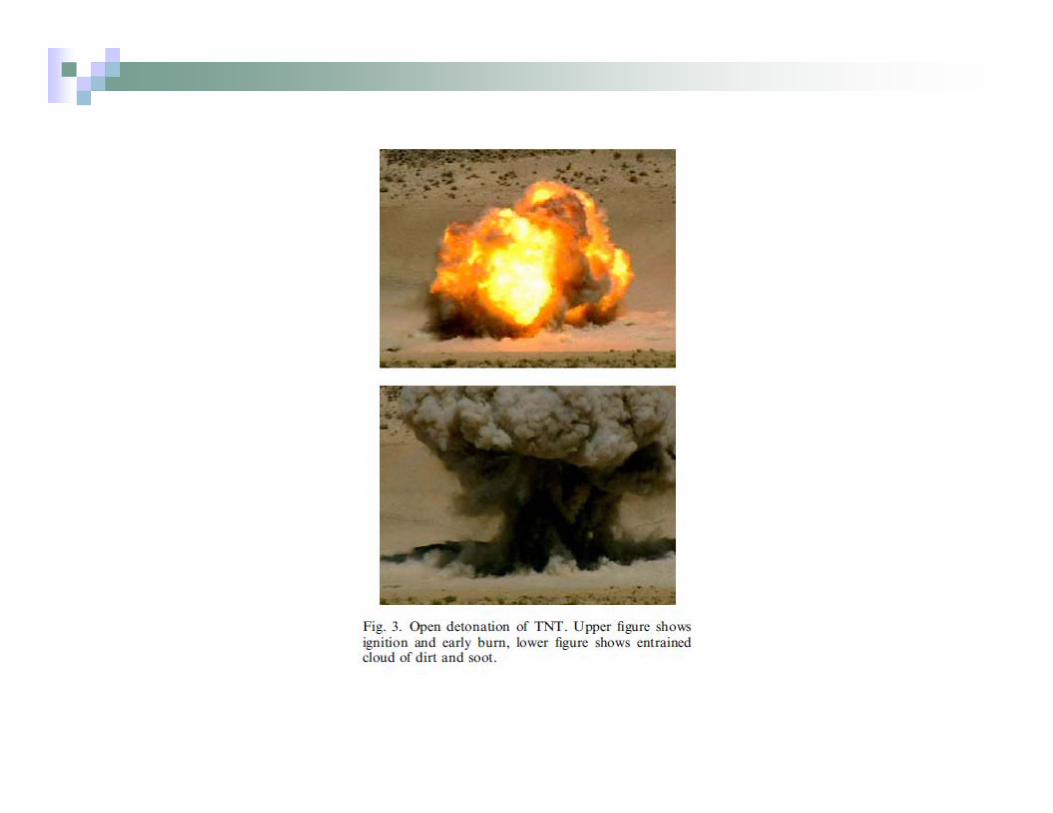
Understand and predict emissions from open burning or detonation of explosives
RDX and HMX are based on non-aromatic rings
C C NN N N C
C C C NN N C
Note the absence of C - C bonds or aromatic rings
NO2
NH2NO2
NH2
O2N
H2N
CH3NO2
NO2
O2N
TATBTNT
Presence of aromatic rings indicates explosivewill lead to soot.
Aromatic rings and lots of C - C bonds
RDX does not produce soot precursors
N
NNNN
N
O
OO
O
OO
N
N.N
N
N
O
O
OO
+ NO2
CH2N
N
O
O
CH2N
N
O
O
CH2
N.
+
+
+ NO2CH2
.N
No carbon – carbon bonds!
From Ree et al, J. Phys. Chem. A, 1996
Soot tendencies depend on molecular structure
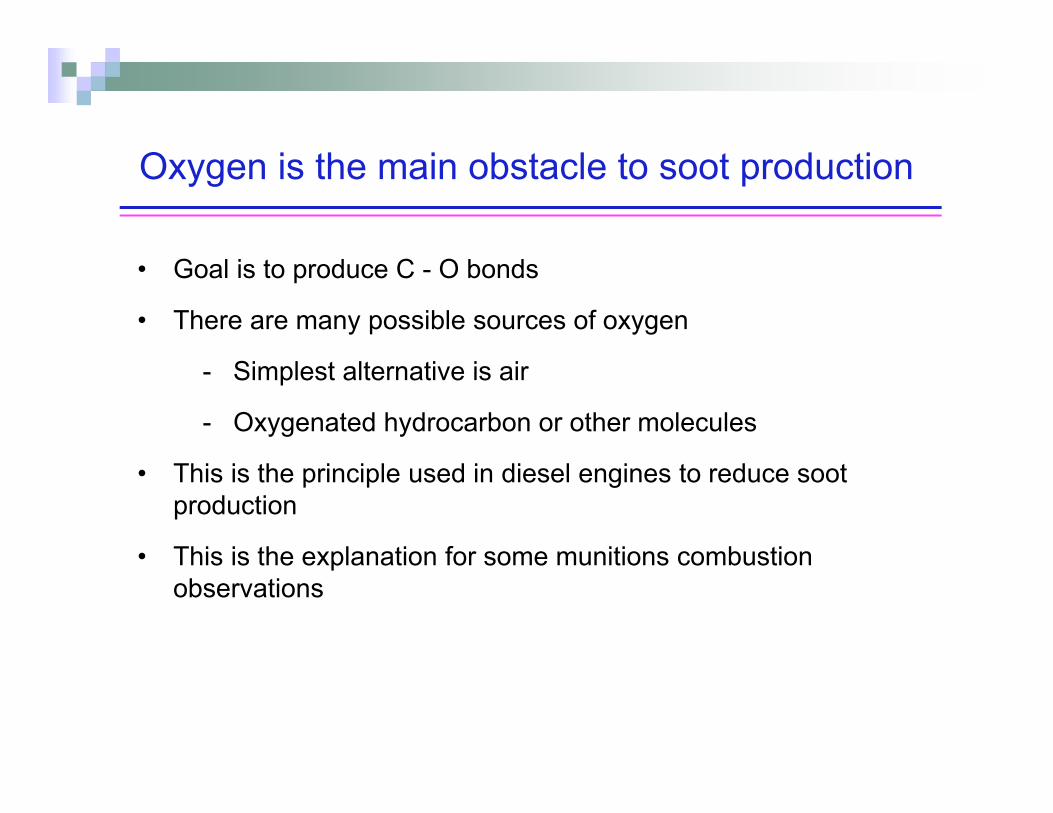
Oxygen is the main obstacle to soot production
• Goal is to produce C - O bonds
• There are many possible sources of oxygen
- Simplest alternative is air
- Oxygenated hydrocarbon or other molecules
• This is the principle used in diesel engines to reduce soot production
• This is the explanation for some munitions combustion observations
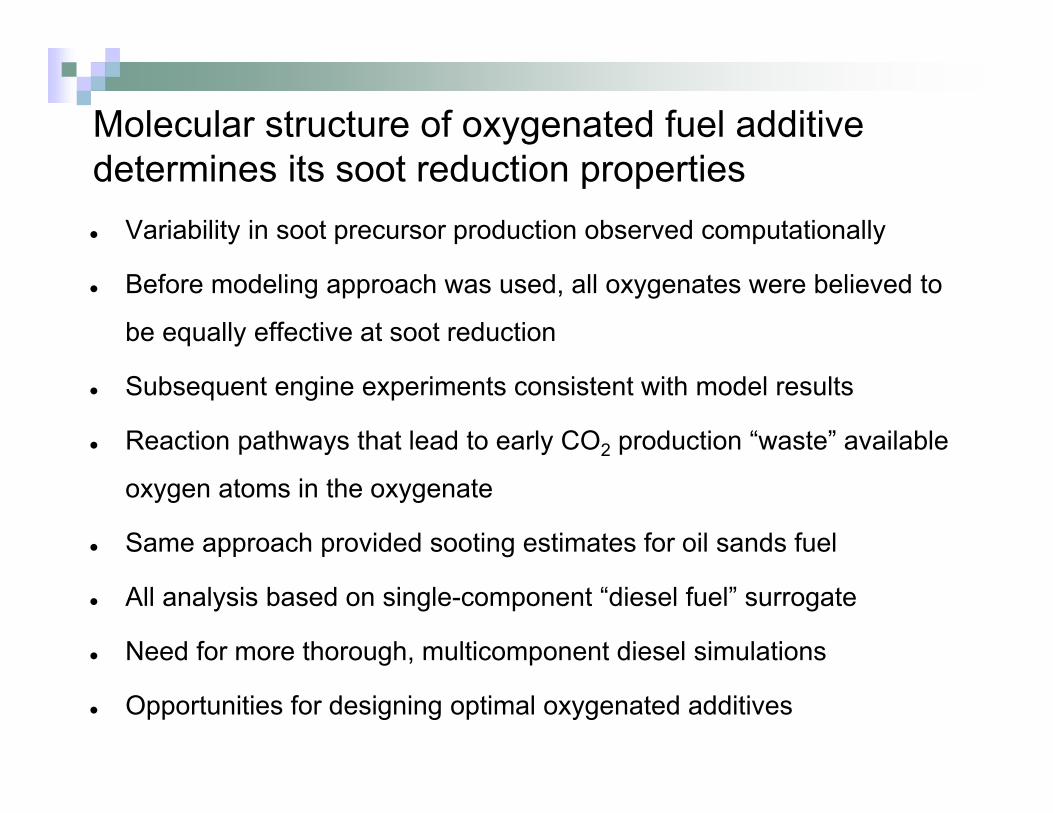
Molecular structure of oxygenated fuel additive determines its soot reduction properties Variability in soot precursor production observed computationally
Before modeling approach was used, all oxygenates were believed to
be equally effective at soot reduction
Subsequent engine experiments consistent with model results
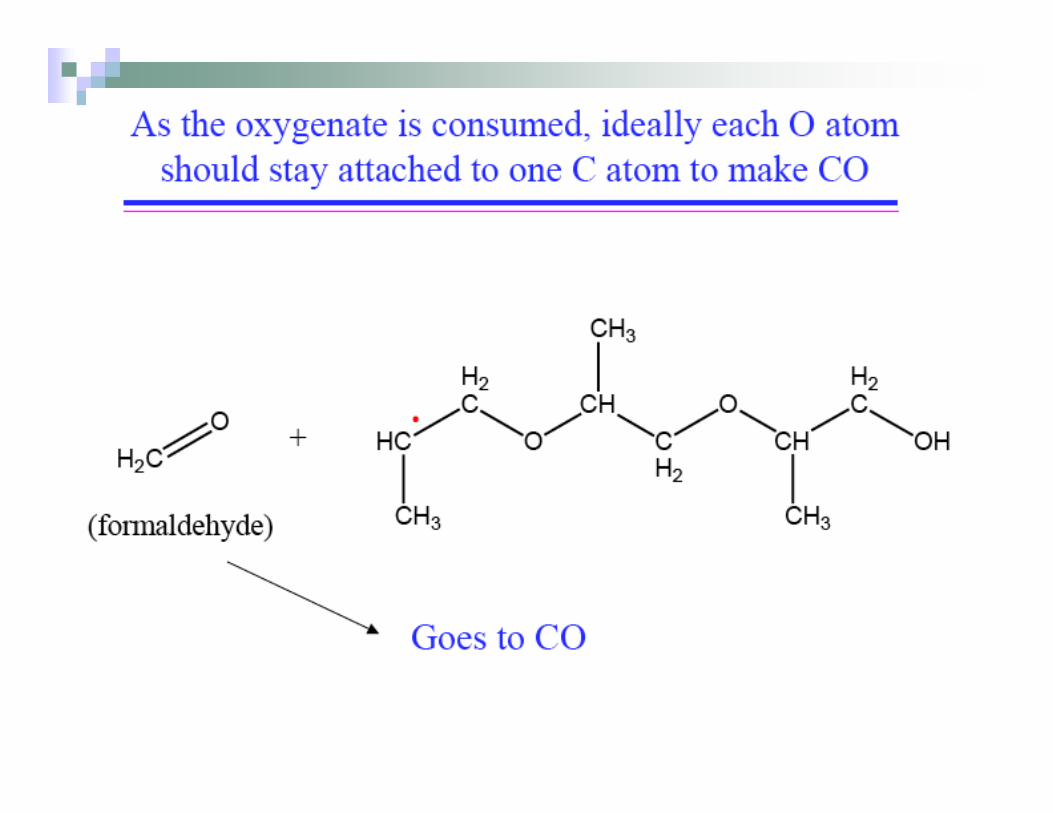
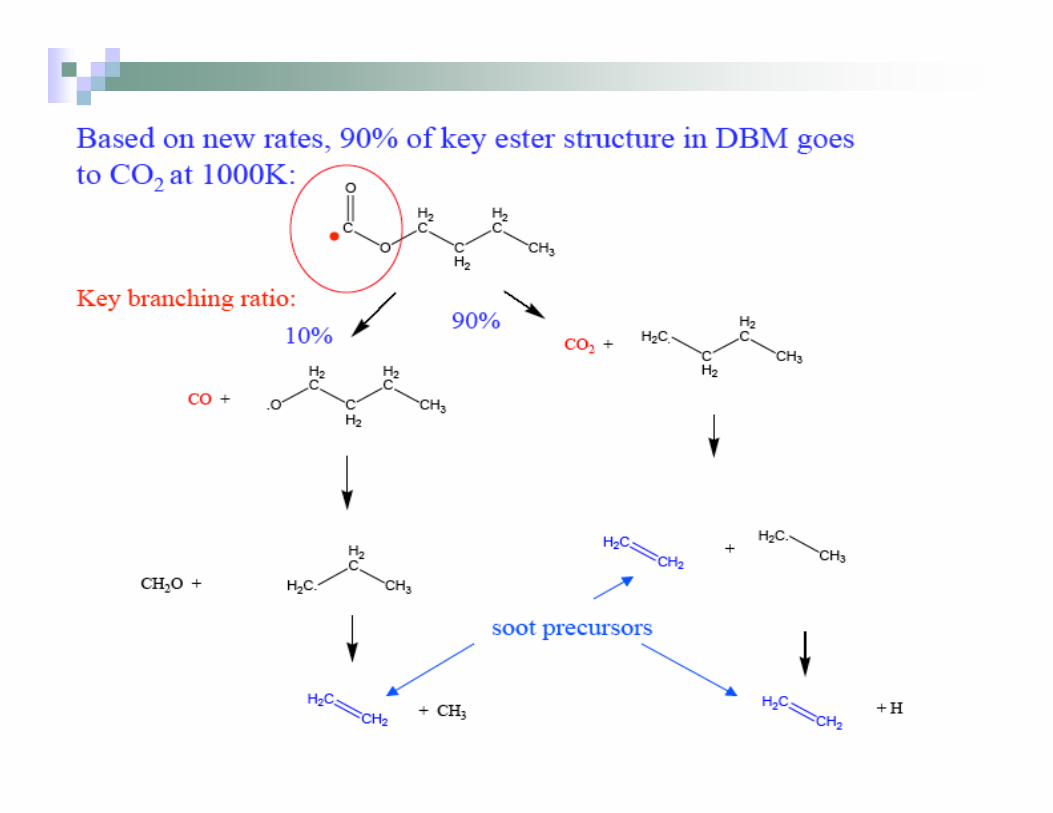
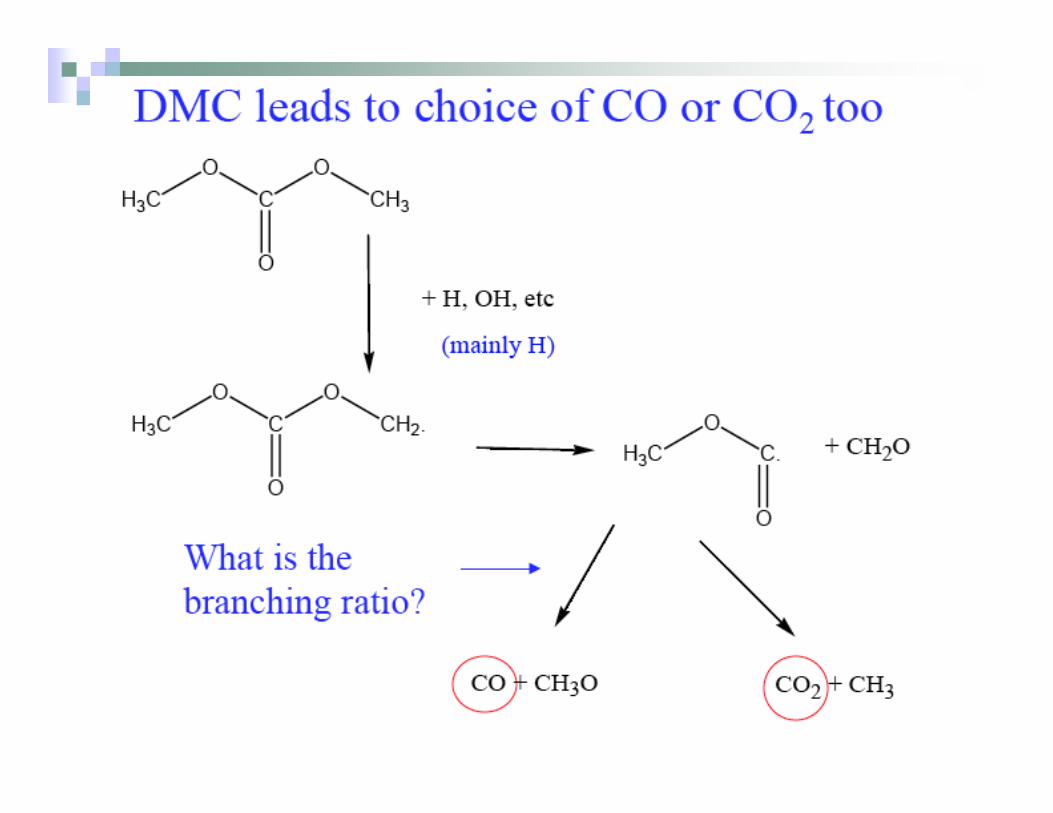
Reaction pathways that lead to early CO2 production “waste” available
oxygen atoms in the oxygenate
Same approach provided sooting estimates for oil sands fuel
All analysis based on single-component “diesel fuel” surrogate
Need for more thorough, multicomponent diesel simulations
Opportunities for designing optimal oxygenated additives
63
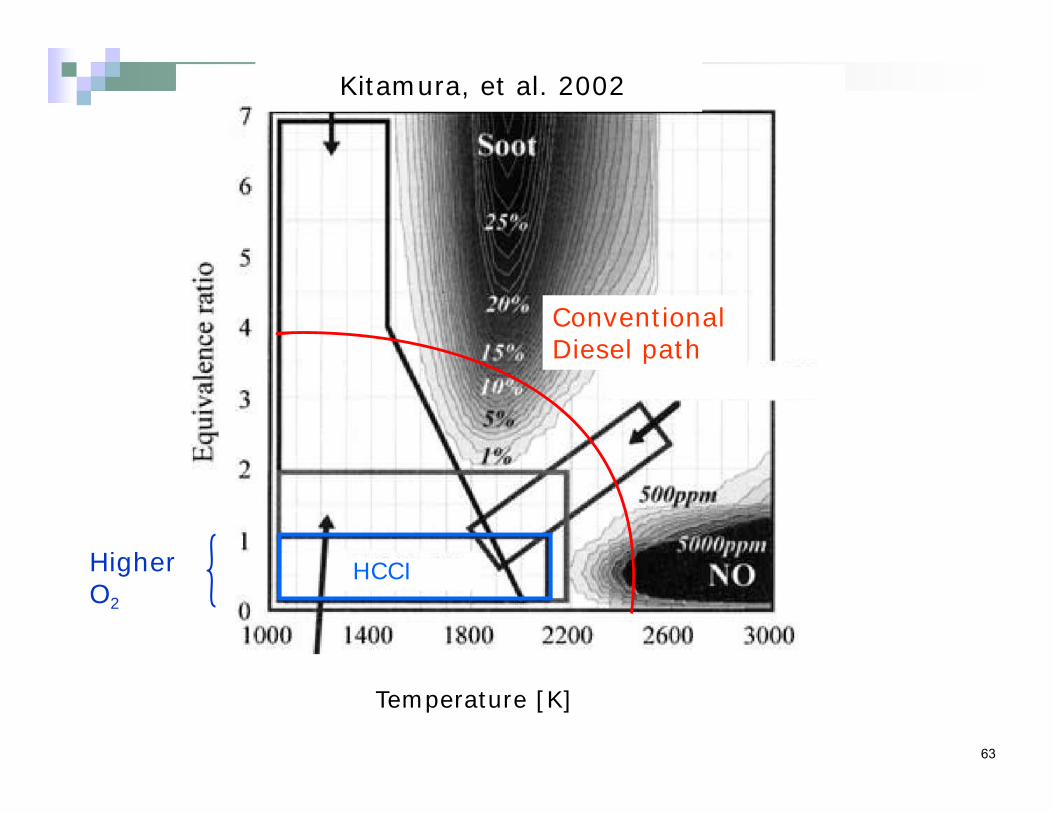
HCCIHigherO2
Low temperatureTemperature [K]
Kitamura, et al. 2002
ConventionalDiesel path