Embed Size (px)
Citation preview
Online Text S1
Detailed description of the study system and field methodologies
Study system
We focused on the plant-frugivore assemblage composed of fleshy-fruited trees and frugivorous
thrushes (Turdus spp.) in the temperate secondary-growth forest of the Cantabrian range (N
Spain), a highly heterogeneous habitat resulting from strong anthropogenic impact. Temperate
secondary forest is a common, but highly fragmented habitat type in mid-elevation areas of the
Cantabrian range [1]. Typically, secondary forest stands cover less than 30% of surface in these
areas, and may occur as fringe patches, adjacent to beech (Fagus sylvatica) stands. More
frequently, they occur as variable-sized fragments (from isolated remnant trees to patches of
several hectares) embedded in a historically deforested matrix of stony pastures and heathland
(Erica spp., Ulex europaeus; [2]. These woodland-pasture areas are traditionally used for
extensive cattle raising. Secondary forests are dominated by fleshy-fruited trees, mostly Holly
(Ilex aquifolium), Hawthorn (Crataegus monogyna), Yew (Taxus baccata), which account for a
large proportion of tree cover (ca. 70%, e.g. [3]. Fruits of these species are 10-14 mm diameter,
sugar-rich red berries (arillated seed in yew), and contain 1-4 seeds (5-9 mm). All species ripen
in autumn (September to November).
The fruits of the above tree species are consumed from trees by birds and, once fallen to
the ground, by carnivorous mammals [4]. Among birds, the main frugivore species are thrushes
(Turdus sp.) of increasing size (see Table S1.1 in Supporting information Appendix S1):
Redwing T.iliacus, Song Thrush T. philomelos, Blackbird Turdus merula, Fieldfare T. pilaris,
Ring-Ouzel T. torquatus and Mistle Thrush T. viscivorus. Among these species T. iliacus, T.
pilaris and T. torquatus are over-wintering species in north-western Spain, whereas T.
philomelos, T. merula, and T. viscivorus are resident species that receive overwintering migrants
[5]. All thrushes are insectivorous birds whose diet turns to almost exclusively frugivore during
autumn and winter. They swallow the entire fruits, defecating (and occasionally regurgitating)
the intact seeds in their faeces and, thus, acting as legitimate seed dispersers.
Seed dispersal by thrushes has been shown to affect regeneration of fleshy-fruited trees in
the Cantabrian secondary forest, by triggering the processes of re-colonization of deforested
areas [6], and by driving the patterns of long-term recruitment at different spatial scales [3,7].
Study site and spatio-temporal framework
The study area was located in the Sierra de Peña Mayor (43º 17'N, 5º 30'W, 900 m a.s.l., Asturias
Province, Spain), a mountain range covered by woodland pastures where secondary forest are
intermingled with meadows, heathland and limestone rocky outcrops. There, in September 2006,
we set up a 400 x 440 m rectangular plot in which the amount of forest cover varied from
densely covered sectors to areas of scant cover and isolated remnant trees (see Fig. S1). Thus, the
plot was chosen to represent a gradient of forest loss and increasing forest subdivision and forest
edge [7]. For sampling purposes, the plot was subdivided into 440, 20 x 20 m cells. Based on
previous findings [8], we assumed this spatial framework to have appropriate grain and extent
sizes to represent the spatial scale at which frugivory and seed dispersal by thrushes operate.
Sampling (see below) was carried out from September to February along three consecutive
sampling periods: 2007-2008, 2008-2009 and 2009-2010 (hereafter 2007, 2008 and 2009).
Forest cover and fruit abundance measures
In September 2007, we developed a Geographical Information System (GIS, ArcGIS 9.0) based
on a recent (2007) 1:5000-scale ortophotomap image of the study plot. The GIS platform
incorporated a grid of 440, 20 x 20 m landscape cells, as well as a layer of digitized forest cover
(Fig. S1.1). From this GIS we estimated the amount of forest cover (in m2, and irrespective of
tree species identity) in each cell. We assumed that the per-cell values of forest cover measured
in 2007 were also applicable to 2008 and 2009, as actual changes in tree canopy cover in the plot
were negligible over years (canopy growth was undetectable at this resolution and tree-fall gaps
were very scarce and small).
In autumn of each sampling year, we walked carefully all the study plot, identifying and
mapping all individual trees (>1.5 m tall or 4 cm trunk basal diameter) of all species. We
assigned visually a standing crop to each tree of any fleshy-fruited species, by means of a semi-
quantitative Fruiting Abundance Index (FAI; considering six intervals: 0 = without fruits; 1 = 1-
10 fruits; 2 = 11-100; 3 = 101-1,000; 4 = 1,001-10,000; 5 > 10,001). Fruiting is quite
synchronous among individuals and species within the Cantabrian secondary forest, with almost
all fruit ripening delimited to 1-2 months (although fruits may remain attached to trees for 1-3
additional months). We thus considered that a sampling of fruit abundance at the beginning of
the season provided an appropriate estimate of the spatial template of fruit resources for
frugivores through the season. As T. baccata show earlier fruiting peaks than the remaining
fruiting species, we first walked the plot in late September to survey the crops of these species,
and walked again the plot in late October, recording the fruit crops of all remaining fleshy-fruited
species. All data on position, species and FAI of each individual tree, every sampling year, were
incorporated into the GIS platform. We calculated the total abundance of fruits per cell, and the
abundance of fruits of different tree species, per year as the sum of the crops of all fruiting trees
present each year. Crops were extrapolated from FAI ranks, taking into account the fit between
the actual crop size of a sub-sample of trees and the assigned FAI index, using an allometric
equation (crop size = 1.77 × exp(1.92 FAI), R2
= 0.80; N = 136 trees [9].
Bird feeding activity and movement
Foraging patterns of thrushes were sampled over observation sequences made from five different
vantage positions in elevated outcrops (hill tops), located along the central axis of the plot (Fig.
S1). Sampling season extended from October to February. Observation time was 78, 90 and 79 h
for 2007, 2008 and 2009, respectively. In each sequence, a movement bout of a given individual
bird was tracked with the help of 8 x 30 binoculars, a chronometer, and printed maps of plot
cells. Once a given focal bird was located, it was followed until lost either because it left the plot
or disappeared into the canopy). For all sequential steps in the movement bout (i.e. consecutive
rests separated by intervening flights), we recorded the duration and location of the resting site
(i.e. the cell within the plot), and the species and number of fleshy fruits eaten while perching in
a fruiting tree. Flight distance was calculated for each flight between rests located in different
cells as the Euclidean distance between the centroids of the starting point and endpoint cells.
Sampling of seed dispersal by thrushes in the field
Bird-dispersed tree seeds are unequivocally identifiable: they are clean of pulp remains, unlike
seeds on fruits fallen beneath trees, and occur in small clusters easily distinguishable from those
occurring in mammal faeces, and they can be almost exclusively attributable to thrushes [4]. We
assessed the occurrence of seeds dispersed by thrushes in sampling stations across the whole plot
in 2009. Ten sampling stations, separated from each other by 2 m, were placed along the central
longitudinal axis of 220 sampling cells following a checkered pattern (see Fig. S1). In each
station, we set up a permanently labelled, open-ground 50 x 50 cm quadrat where all tree seeds
dispersed by birds were collected and counted. Each sampling station was assigned to covered
(tree canopy) or open (pasture, rock) microhabitats, corresponding to the structural features of
the area covered by (or above) the quadrat. We estimated the number of dispersed seeds per tree
species sampling station as the sum of seeds found in two consecutive surveys (late November
2009 and early January 2010). Previous studies in the same site demonstrated that this
methodology provides estimates of seed abundance and richness reliable enough for the
evaluation of the large-scale patterns of seed dispersal [3,8]. In fact, seed removal by diurnal
animals was never observed, and removal by nocturnal rodents is low during most of the
dispersal season (predation frequency peaks late in winter, [10]. In any case, those seeds showing
signs of predation (open husks or teeth marks) found in the quadrats were considered as
dispersed seeds.
References
1. García D, Quevedo M, Obeso JR, Abajo A (2005) Fragmentation patterns and protection of
montane forest in the Cantabrian range (NW Spain). Forest Ecology and Management 208.
2. Herrera JM, García D, Morales JM (2011) Matrix effects on plant-frugivore and plant-predator
interactions in forest fragments. Landscape Ecology 26: 125-135.
3. García D, Obeso JR, Martinez I (2005) Spatial concordance between seed rain and seedling
establishment in bird-dispersed trees: does scale matter? Journal of Ecology 93: 693-704.
4. Martínez I, García D, Ramon Obeso J (2008) Differential seed dispersal patterns generated by
a common assemblage of vertebrate frugivores in three fleshy-fruited trees. Ecoscience 15.
5. Guitián J, Guitián P, Munilla I, Guitián J, Bermejo T, et al. (2000) Zorzales, espinos y
serbales. Un estudio sobre el consumo de frutos silvestres de las aves migratorias en la costa
occidental europea. Santiago de Compostela: Universidad de Santiago de Compostela.
6. García D, Martínez D, Herrera JM, Morales JM (2012) Functional heterogeneity in a plant–
frugivore assemblage enhances seed dispersal resilience to habitat loss. Ecography in press.
7. Herrera JM, García D (2010) Effects of Forest Fragmentation on Seed Dispersal and Seedling
Establishment in Ornithochorous Trees. Conservation Biology 24.
8. García D, Zamora R, Amico G (2011) The spatial scale of plant-animal interactions: effects of
resource availability and habitat structure. Ecological Monographs 81: 123-139.
9. Herrera JM, Morales JM, García D (2011) Differential effects of fruit availability and habitat
cover for frugivore-mediated seed dispersal in a heterogeneous landscape. Journal of Ecology
99: 1100-1107.
10. García D, Obeso JR, Martínez I (2005) Rodent seed predation promotes bird-dispersed trees
in temperate differential recruitment among secondary forests. Oecologia 144.
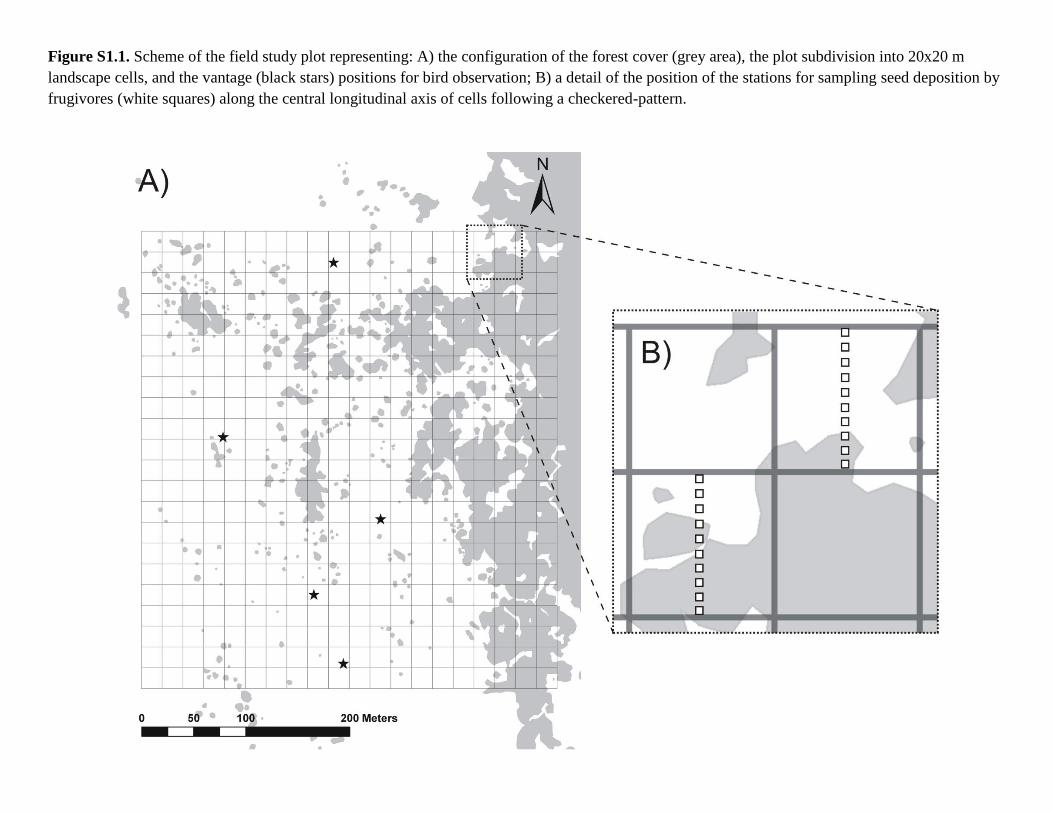
Figure S1.1. Scheme of the field study plot representing: A) the configuration of the forest cover (grey area), the plot subdivision into 20x20 m
landscape cells, and the vantage (black stars) positions for bird observation; B) a detail of the position of the stations for sampling seed deposition by
frugivores (white squares) along the central longitudinal axis of cells following a checkered-pattern.
Online Text S2
Gut Passage Time estimation for Turdus sp. and seeds of fleshy-fruits in the
Cantabrian Range
Regurgitation vs. defecation
We have calculated Gut Passage Time (GPT) distribution based exclusively on seed
defecation times. Although seed regurgitation from fleshy-fruited species, like Crataegus
monogyna and Prunus avium, has been observed (e.g. Turdus merula in captivity, Sorensen
1984; Breitbach et al. in press), we assumed that seed regurgitation of fleshy-fruited species
by Turdus sp. is very rare in the Cantabrian Range, by the following reasons:
1) Sorensen’s finding was probably related to the much larger seed mass of C.
monogyna fruits used in her study (130 mg in Soresen 1984 vs. 87 mg in García et
al. 2005). Similarly, regurgitation of P. avium seeds was associated to its big size
(fruit diameter > 15 mm), much bigger than those of the fleshy-fruited species
studied here.
2) We had never observed regurgitation in the field (from aprox. 450 hours of direct
observation on foraging sequences of individual birds of different species across 3
years). Similar results have been found in other studies in the same fruit-frugivore
system in northern Spain (Guitián et al. 2002).
3) Regurgitation has been found to be rare (<5% of ingested seeds) in other captivity
studies involving thrushes and fleshy fruits in the range of size of the studied here
(Turdus helleri eating Xymalos monospora, Lehouck et al. 2009; Turdus merula
eating Crataegus monogyna, Sobral et al. 2010; Turdus merula eating Myrtus
communis, M. Sobral, A.R. Larrinaga & L. Santamaría unpublished)
GPT values and distribution
As no empirical data on the distribution of values of GPTs was available from any of the
studied bird-fruit species pairs, we used data from a similar bird-fruit species pair: Turdus
merula eating fruits of Myrtus communis (Mar Sobral, Asier R. Larrinaga & Luis
Santamaría, unpublished data). GPT measures were done in January 2006 at the Institut für
Vogelforshung, Vogelwarte Helgoland (Germany). Feeding trials in captivity conditions
involved 18 hand-raised and wild Turdus merula individuals (see Sobral et al. 2010 for a
comprehensive description of aviary conditions and bird care methodology in a similar
study). GPT was measured as the time from swallowing to defecation per individual seeds.
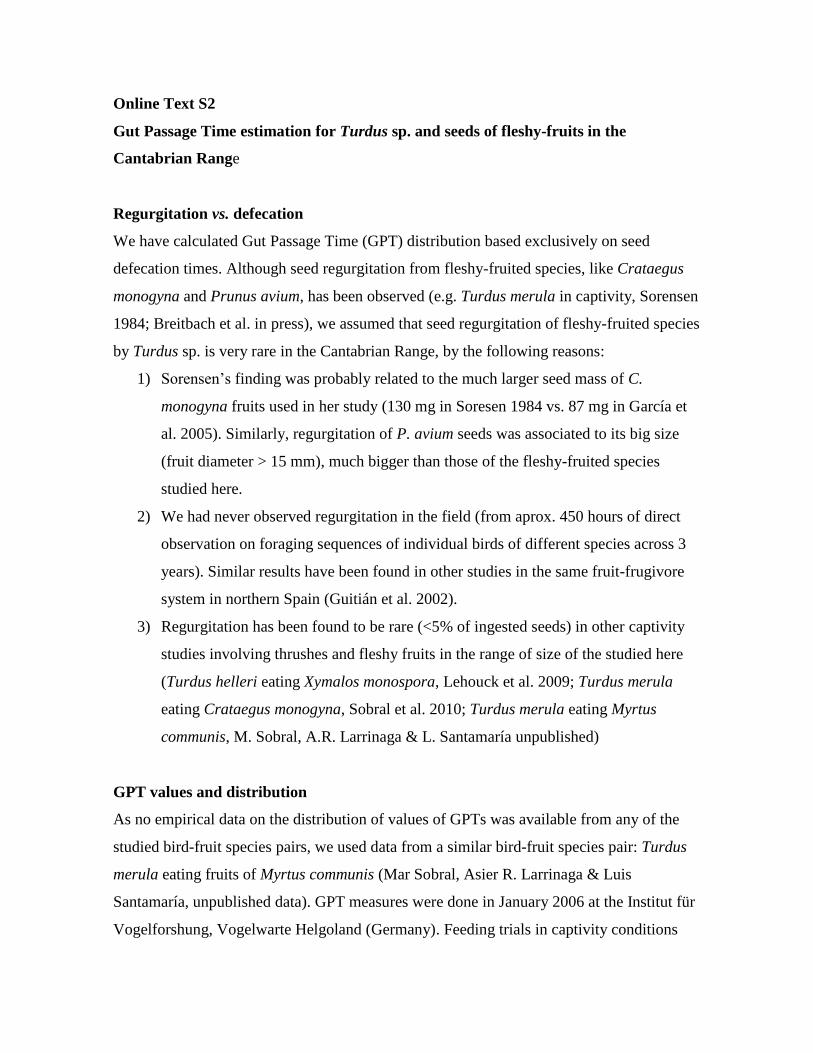
Average GPT resulted in 39.35 min. (±2.29SE; CV=173.98; N=890 seeds; Fig. S.1.1). This
value was only slightly longer than that found by Breitbach et al. (in press) for seed
regurgitation of P. avium seeds by T. merula (median 29.6 min).
Given the similarity of fruits of Crataegus monogyna, Ilex aquifolium and Taxus
baccata in the Cantabrian range (in terms of fruit mass; seed load; pulp to seed ratio) we
assumed that average values and distribution of frequencies of GPTs were equivalent
between tree species for T. merula, and similar to that found in Myrtus communis. In fact,
no relationship between fruit or seed size and GPT across species has been found for
Turdus merula (Sorensen 1984). We assumed that in Ilex aquifolium, all seeds per fruit
(average 3.5 seeds/fruit) were defecated at the same time (the average number of seeds per
dropping defecated in the field is 3.4; Martínez et al. 2008; see also Guitián et al. 2002).
Figure S2.1. Frequency distribution of gut passage time for Myrtus communis seeds
defecated by Turdus merula.
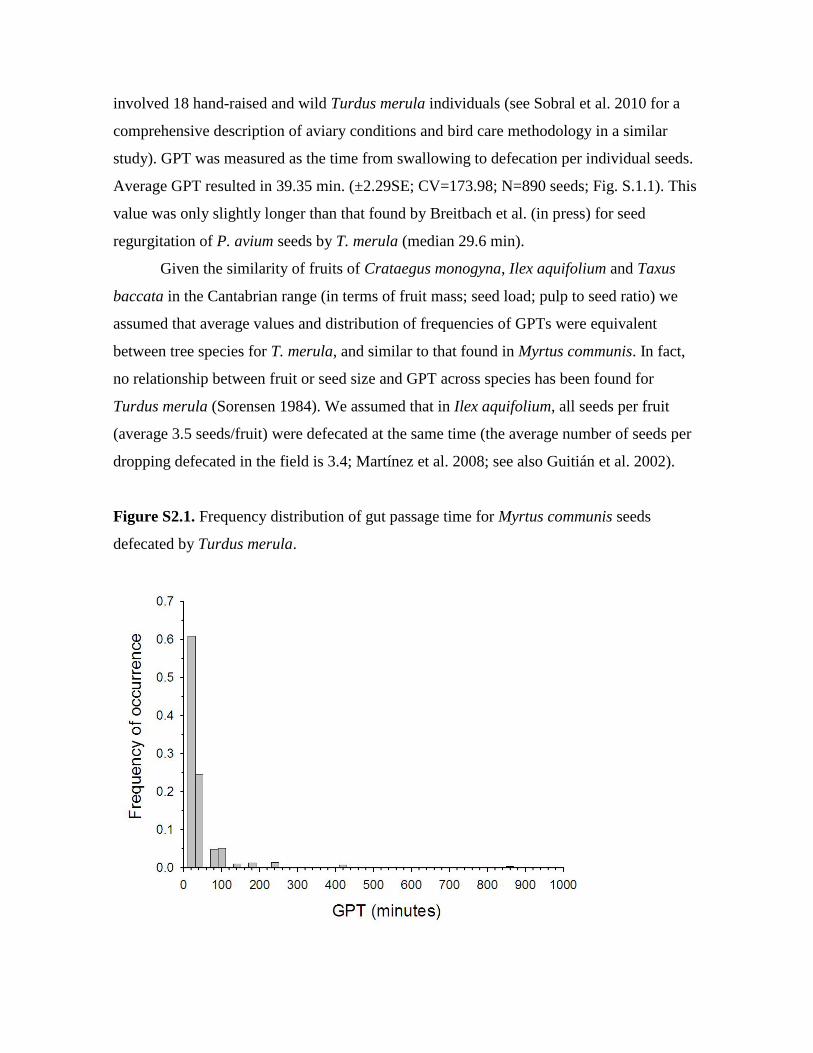
Extrapolation from Turdus merula to other Turdus spp. Relationship between bird
body size and GPT:
We calculated a body size-GPT relationship from Herrera (1984) using 8 species from
Turdidae and Silvidae, and the GPT of a Barium Sulfate solution:
GPT = 23.73 + 0.51*weight
Slope: 0.511±0.14
Linear regression R2
= 0.68; F1,6 = 12.74; P = 0.012
Using the slope of this relationship, we calculated an intercept of -11.76 corresponding to a
GPT of 39.35 min (which is the average GPT value for Myrtus communis seeds for Turdus
merula in captivity, Fig. 1). Thus, the relationship between the Turdus body size and GPT
for any fleshy-fruit species should be based on the relationship
GPT = -11.76 + 0.511*weight (0.1)
Thus, to extrapolate GPT for species other than Turdus merula, we used GPT distribution
of Myrtus communis in Turdus merula and transform GPT data by using the proportions
between species obtained from GPT in eq. (0.1) given the coefficients from Table 1. For
example, a GPT=15 min in Turdus merula would correspond to 8.17 (=15*0.545) min in
Turdus iliacus, 16.93 min in Turdus pilaris, 10.15 min in Turdus philomelos, etc.
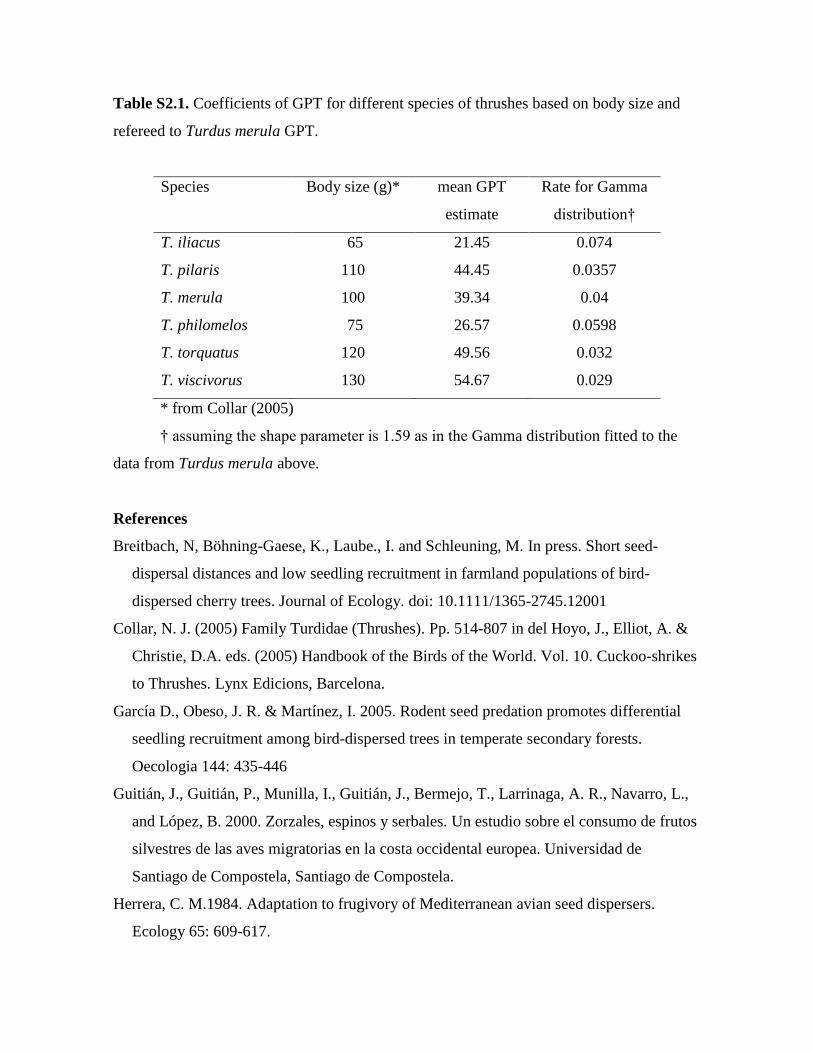
Table S2.1. Coefficients of GPT for different species of thrushes based on body size and
refereed to Turdus merula GPT.
Species Body size (g)* mean GPT
estimate
Rate for Gamma
distribution†
T. iliacus 65 21.45 0.074
T. pilaris 110 44.45 0.0357
T. merula 100 39.34 0.04
T. philomelos 75 26.57 0.0598
T. torquatus 120 49.56 0.032
T. viscivorus 130 54.67 0.029
* from Collar (2005)
† assuming the shape parameter is 1.59 as in the Gamma distribution fitted to the
data from Turdus merula above.
References
Breitbach, N, Böhning-Gaese, K., Laube., I. and Schleuning, M. In press. Short seed-
dispersal distances and low seedling recruitment in farmland populations of bird-
dispersed cherry trees. Journal of Ecology. doi: 10.1111/1365-2745.12001
Collar, N. J. (2005) Family Turdidae (Thrushes). Pp. 514-807 in del Hoyo, J., Elliot, A. &
Christie, D.A. eds. (2005) Handbook of the Birds of the World. Vol. 10. Cuckoo-shrikes
to Thrushes. Lynx Edicions, Barcelona.
García D., Obeso, J. R. & Martínez, I. 2005. Rodent seed predation promotes differential
seedling recruitment among bird-dispersed trees in temperate secondary forests.
Oecologia 144: 435-446
Guitián, J., Guitián, P., Munilla, I., Guitián, J., Bermejo, T., Larrinaga, A. R., Navarro, L.,
and López, B. 2000. Zorzales, espinos y serbales. Un estudio sobre el consumo de frutos
silvestres de las aves migratorias en la costa occidental europea. Universidad de
Santiago de Compostela, Santiago de Compostela.
Herrera, C. M.1984. Adaptation to frugivory of Mediterranean avian seed dispersers.
Ecology 65: 609-617.
Lehouck, V., Spanhove, T., Demeter, S., Groot, N. E., and Lens. L. 2009. Complementary
seed dispersal by three avian frugivores in a fragmented Afromontane forest. Journal of
Vegetation Science 20: 1110–1120.
Martínez, I., García, D. & Obeso, J. R. 2008. Differential seed dispersal patterns generated
by a common assemblage of vertebrate frugivores in three fleshyfruited trees.
Ecoscience 15: 189–199.
Sobral, M., Larrinaga, A. R., and Guitián, J. 2010. Fruit preferences in wild and naïve
blackbirds (Turdus merula) feeding on hawthorn fruits (Crataegus monogyna). The Auk
127: 532-539.
Sorensen, A. 1984. Nutrition, Energy and Passage Time: Experiments with Fruit Preference
in European Blackbirds (Turdus merula). Journal of Animal Ecology 53: 545-557.
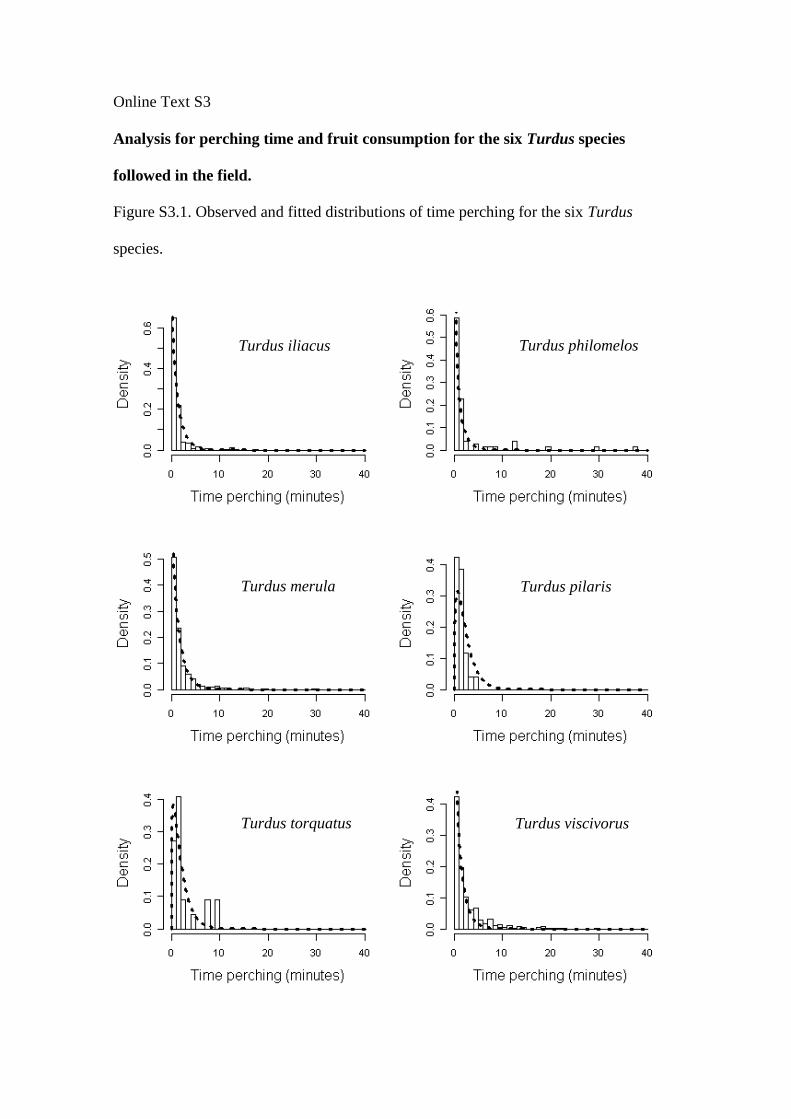
Online Text S3
Analysis for perching time and fruit consumption for the six Turdus species
followed in the field.
Figure S3.1. Observed and fitted distributions of time perching for the six Turdus
species.
Turdus iliacus Turdus philomelos
Turdus merula Turdus pilaris
Turdus torquatus Turdus viscivorus
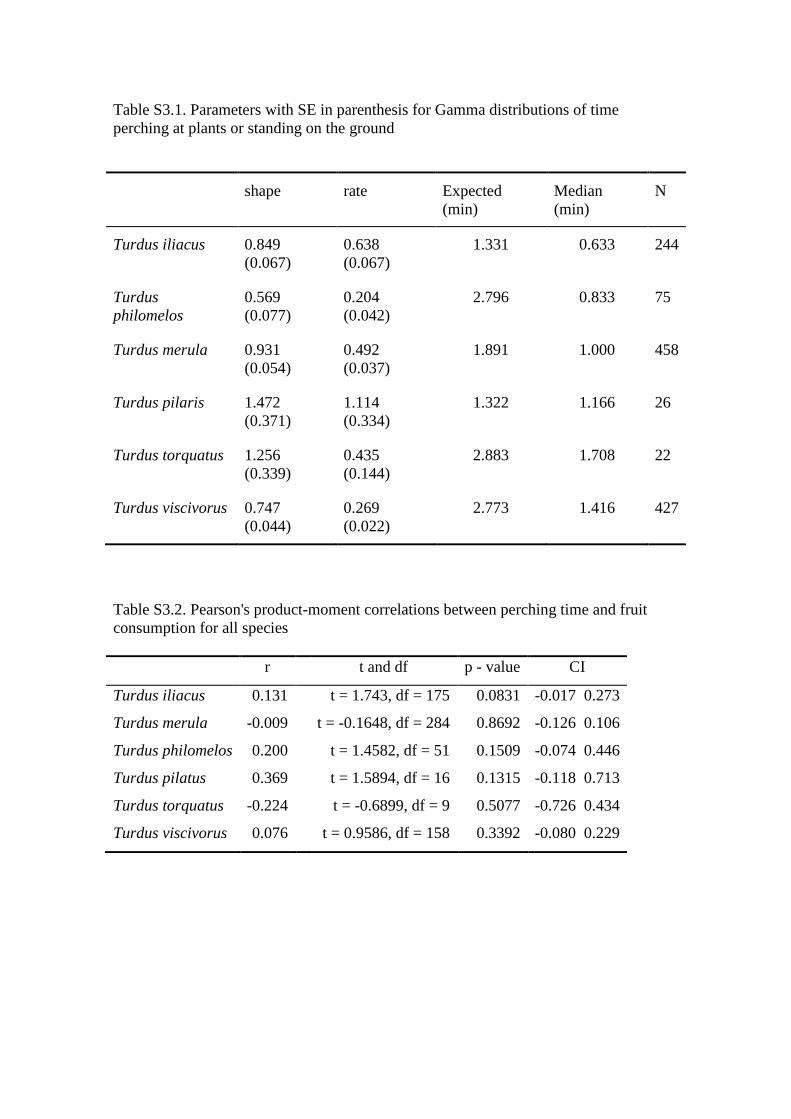
Table S3.1. Parameters with SE in parenthesis for Gamma distributions of time
perching at plants or standing on the ground
shape rate Expected
(min)
Median
(min)
N
Turdus iliacus 0.849
(0.067)
0.638
(0.067)
1.331 0.633 244
Turdus
philomelos
0.569
(0.077)
0.204
(0.042)
2.796 0.833 75
Turdus merula 0.931
(0.054)
0.492
(0.037)
1.891 1.000 458
Turdus pilaris 1.472
(0.371)
1.114
(0.334)
1.322 1.166 26
Turdus torquatus 1.256
(0.339)
0.435
(0.144)
2.883 1.708 22
Turdus viscivorus 0.747
(0.044)
0.269
(0.022)
2.773 1.416 427
Table S3.2. Pearson's product-moment correlations between perching time and fruit
consumption for all species
r t and df p - value CI
Turdus iliacus 0.131 t = 1.743, df = 175 0.0831 -0.017 0.273
Turdus merula -0.009 t = -0.1648, df = 284 0.8692 -0.126 0.106
Turdus philomelos 0.200 t = 1.4582, df = 51 0.1509 -0.074 0.446
Turdus pilatus 0.369 t = 1.5894, df = 16 0.1315 -0.118 0.713
Turdus torquatus -0.224 t = -0.6899, df = 9 0.5077 -0.726 0.434
Turdus viscivorus 0.076 t = 0.9586, df = 158 0.3392 -0.080 0.229
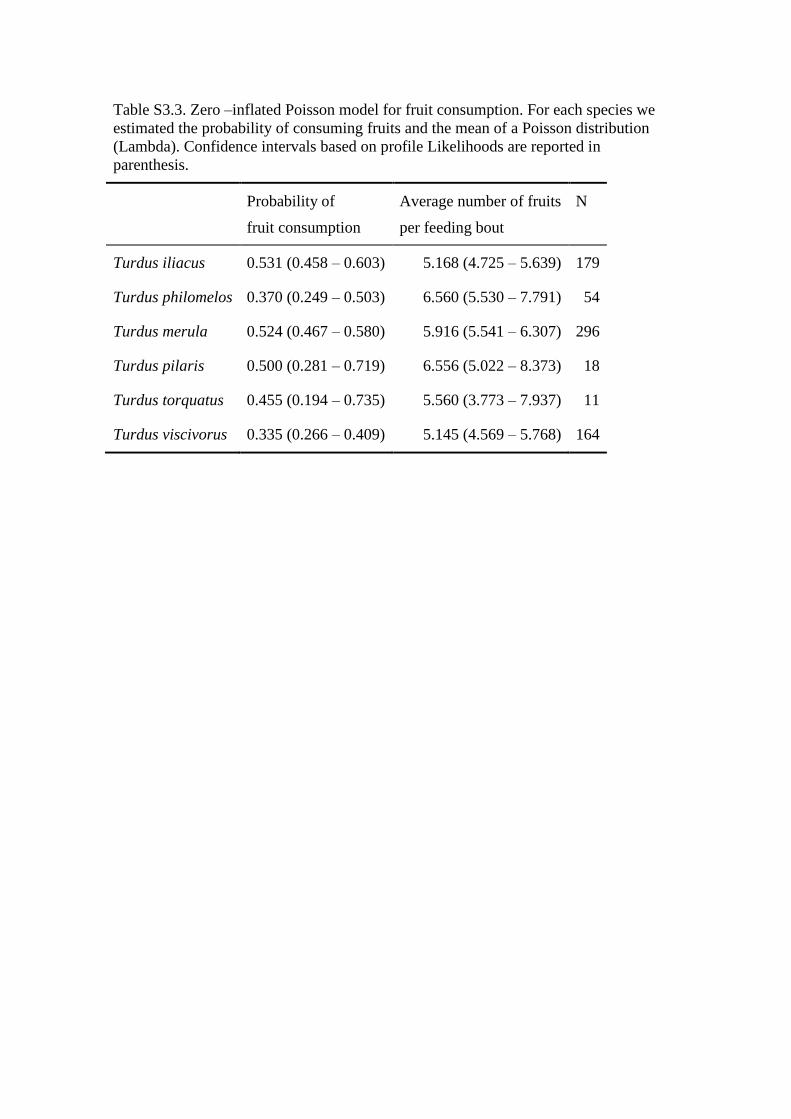
Table S3.3. Zero –inflated Poisson model for fruit consumption. For each species we
estimated the probability of consuming fruits and the mean of a Poisson distribution
(Lambda). Confidence intervals based on profile Likelihoods are reported in
parenthesis.
Probability of
fruit consumption
Average number of fruits
per feeding bout
N
Turdus iliacus 0.531 (0.458 – 0.603) 5.168 (4.725 – 5.639) 179
Turdus philomelos 0.370 (0.249 – 0.503) 6.560 (5.530 – 7.791) 54
Turdus merula 0.524 (0.467 – 0.580) 5.916 (5.541 – 6.307) 296
Turdus pilaris 0.500 (0.281 – 0.719) 6.556 (5.022 – 8.373) 18
Turdus torquatus 0.455 (0.194 – 0.735) 5.560 (3.773 – 7.937) 11
Turdus viscivorus 0.335 (0.266 – 0.409) 5.145 (4.569 – 5.768) 164
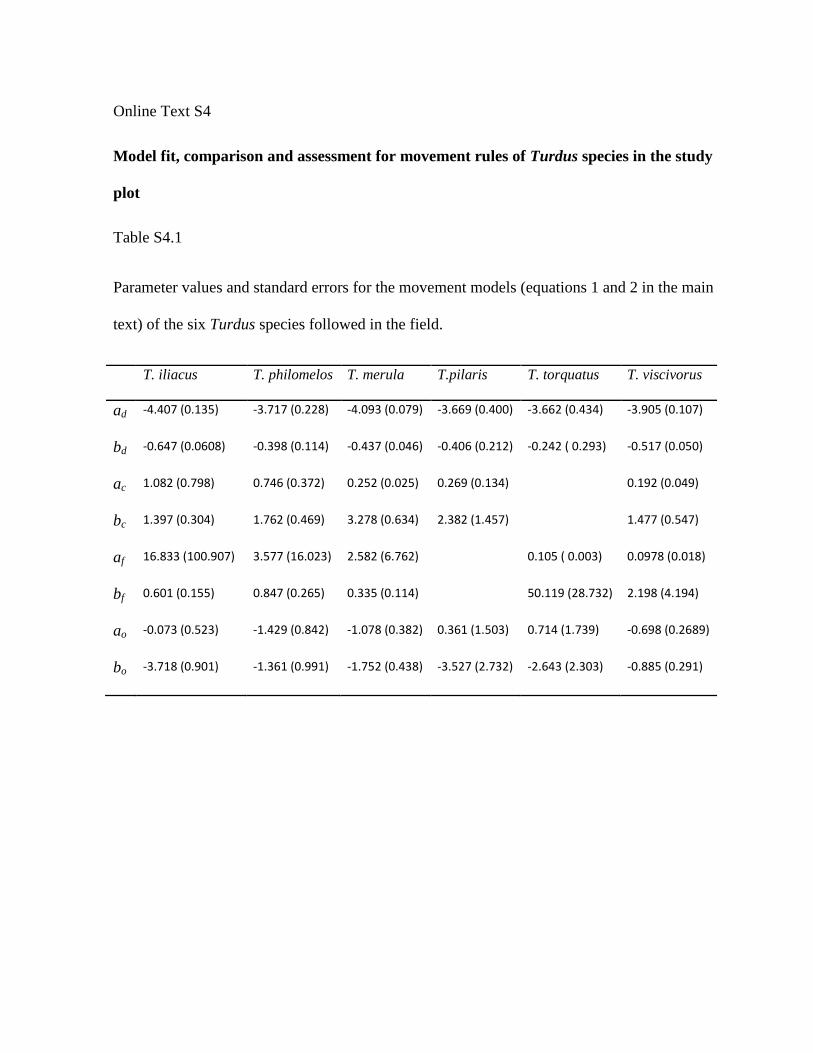
Online Text S4
Model fit, comparison and assessment for movement rules of Turdus species in the study
plot
Table S4.1
Parameter values and standard errors for the movement models (equations 1 and 2 in the main
text) of the six Turdus species followed in the field.
T. iliacus T. philomelos T. merula T.pilaris T. torquatus T. viscivorus
ad -4.407 (0.135) -3.717 (0.228) -4.093 (0.079) -3.669 (0.400) -3.662 (0.434) -3.905 (0.107)
bd -0.647 (0.0608) -0.398 (0.114) -0.437 (0.046) -0.406 (0.212) -0.242 ( 0.293) -0.517 (0.050)
ac 1.082 (0.798) 0.746 (0.372) 0.252 (0.025) 0.269 (0.134) 0.192 (0.049)
bc 1.397 (0.304) 1.762 (0.469) 3.278 (0.634) 2.382 (1.457) 1.477 (0.547)
af 16.833 (100.907) 3.577 (16.023) 2.582 (6.762) 0.105 ( 0.003) 0.0978 (0.018)
bf 0.601 (0.155) 0.847 (0.265) 0.335 (0.114) 50.119 (28.732) 2.198 (4.194)
ao -0.073 (0.523) -1.429 (0.842) -1.078 (0.382) 0.361 (1.503) 0.714 (1.739) -0.698 (0.2689)
bo -3.718 (0.901) -1.361 (0.991) -1.752 (0.438) -3.527 (2.732) -2.643 (2.303) -0.885 (0.291)
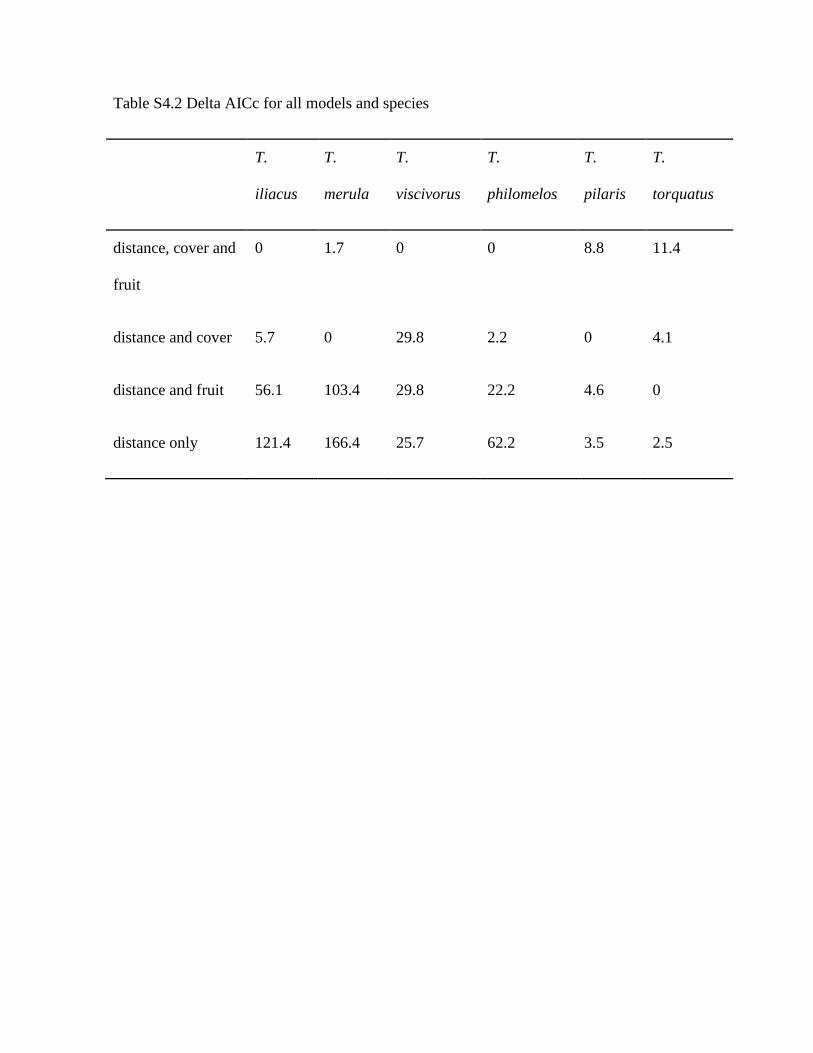
Table S4.2 Delta AICc for all models and species
T.
iliacus
T.
merula
T.
viscivorus
T.
philomelos
T.
pilaris
T.
torquatus
distance, cover and
fruit
0 1.7 0 0 8.8 11.4
distance and cover 5.7 0 29.8 2.2 0 4.1
distance and fruit 56.1 103.4 29.8 22.2 4.6 0
distance only 121.4 166.4 25.7 62.2 3.5 2.5
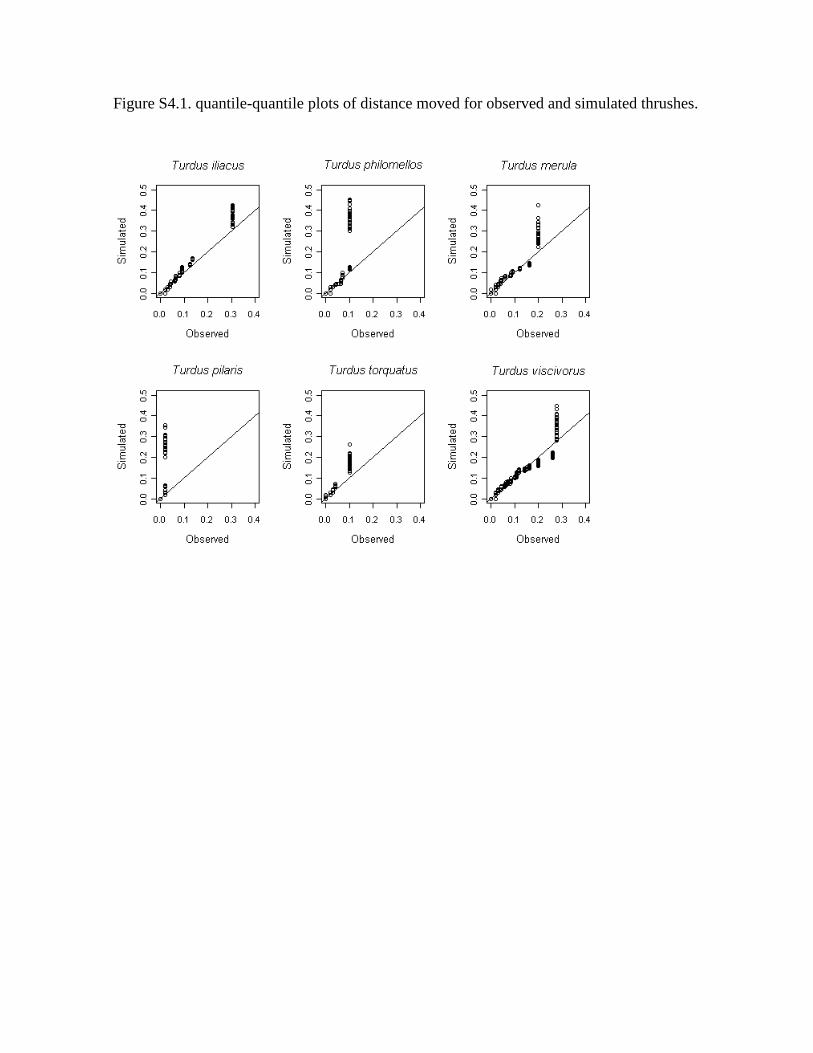
Figure S4.1. quantile-quantile plots of distance moved for observed and simulated thrushes.
Online Text S5
Assessment of landscape-scale spatial structure of observed and predicted seed
rain.
Spatial aggregation of the seed rain
We characterized the landscape-scale spatial structure of predicted and observed seed
rain of the different tree species (Crataegus monogyna, Ilex aquifolium and Taxus
baccata) by quantifying the degree of spatial aggregation (patchiness) in the abundance
of dispersed seeds. For that, we used the Spatial Analysis by Distance Indices (SADIE;
Perry 1995; Perry et al. 1999), a method that describes the spatial structure of ecological
data sampled in the form of spatially geo-referenced counts, identifying and locating the
areas where patches of high- or low density occur.
We estimated, for the cell subset of field sampling (N=220), the abundance of
dispersed seeds per cell observed in the field (from the average number of seeds per
sampling station), and the corresponding abundance predicted by the model, for each
tree species. Seed counts were referenced in space by the x,y coordinates of cell
centroids. Based on estimates of distance to regularity (i.e. the difference between the
true count value in a given point and a count value assuming a regular distribution of all
counts across sampling points), SADIE provides an aggregation index (Ia) to measure
the degree of overall spatial clumpiness across the whole plot extent, representing
random (Ia = 1), regular (Ia < 1) or aggregated (Ia > 1) distribution patterns. The degree
of significance of Ia is checked by means of a randomization procedure based on
rearrangements of the observed counts amongst the sample units. SADIE also provides
a point-level parameter, the clustering index ( ), which quantifies the degree to which
the count at a given point contributes to the overall clumpiness. Points with high
positive values contain big counts which contribute greatly to the generation of high-
density clusters (“patches”), whereas points with negative values contain small counts
which contribute to low-density clusters (“gaps”; e.g. Figure S5.1).
The aggregation indexes of both observed and predicted abundances of
dispersed seeds at the landscape scale indicated strong and significant patchiness, with
higher values on predicted seed rain than of observed seed rain, for all species (Table
S5.1). Aggregation was stronger on I. aquifolium seed rain than on those of C.
monogyna and T. baccata, in both the observed and predicted estimates.
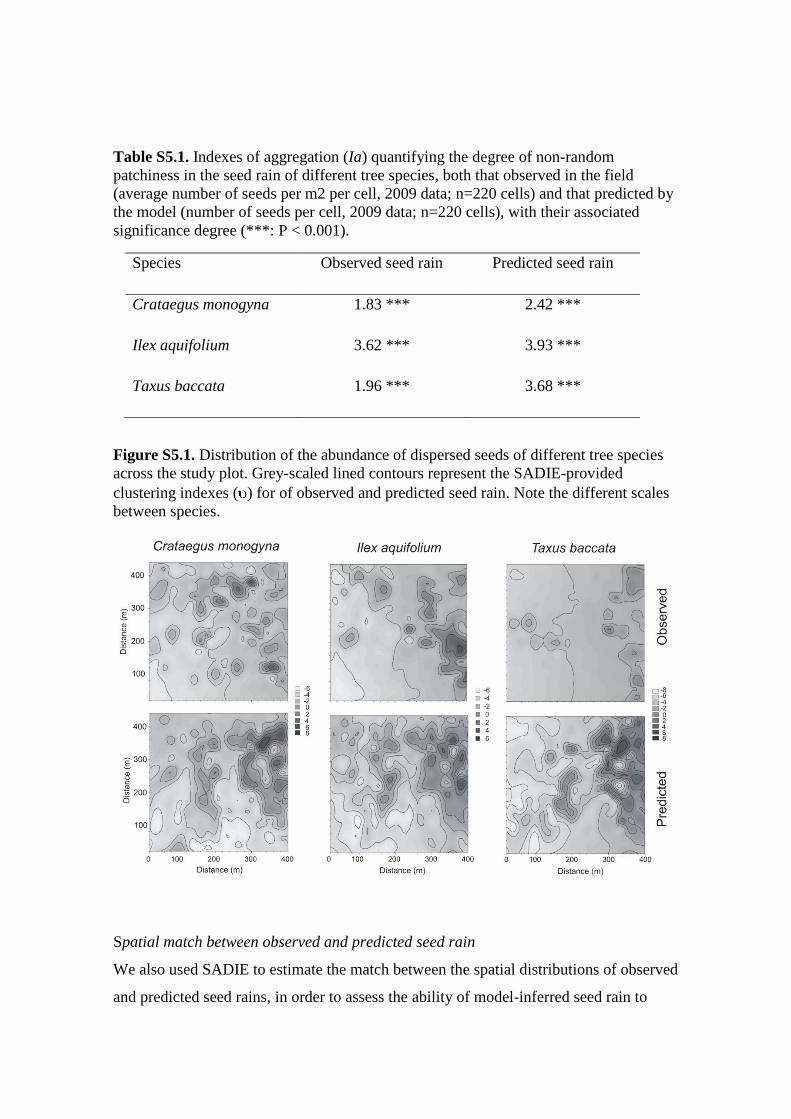
Table S5.1. Indexes of aggregation (Ia) quantifying the degree of non-random
patchiness in the seed rain of different tree species, both that observed in the field
(average number of seeds per m2 per cell, 2009 data; n=220 cells) and that predicted by
the model (number of seeds per cell, 2009 data; n=220 cells), with their associated
significance degree (***: P < 0.001).
Species Observed seed rain Predicted seed rain
Crataegus monogyna 1.83 *** 2.42 ***
Ilex aquifolium 3.62 *** 3.93 ***
Taxus baccata 1.96 *** 3.68 ***
Figure S5.1. Distribution of the abundance of dispersed seeds of different tree species
across the study plot. Grey-scaled lined contours represent the SADIE-provided
clustering indexes ( ) for of observed and predicted seed rain. Note the different scales
between species.
Spatial match between observed and predicted seed rain
We also used SADIE to estimate the match between the spatial distributions of observed
and predicted seed rains, in order to assess the ability of model-inferred seed rain to
predict the large-scale spatial structure of seed dispersal in the field. For that, we related
the clustering vectors of the observed seed rain with those of the seed rain predicted by
the model in the same cells. Analyses relating clustering vectors must account for the
potential effects of spatial autocorrelation in the determination of correlation strength. In
this sense, the association index Xp, (Perry & Dixon 2002) quantifies the degree of
spatial association/dissociation between two variables sampled at the same points. This
index ranges between + 1 (complete spatial association) and -1 (complete dissociation),
with 0 indicating spatial independence. The statistical significance of Xp is quantified by
the Dutilleul method, which corrects the amount of degrees of freedom in the presence
of spatial autocorrelation. Complementarily, in order to estimate the proportion of the
variance in the patchiness of the observed seed rain explained by that predicted by the
model, we regressed the clustering indexes of observed (response) and predicted
(predictor) seed rain by means of Spatial Simultaneous Autoregressive Models (SAR,
Keitt et al. 2002).
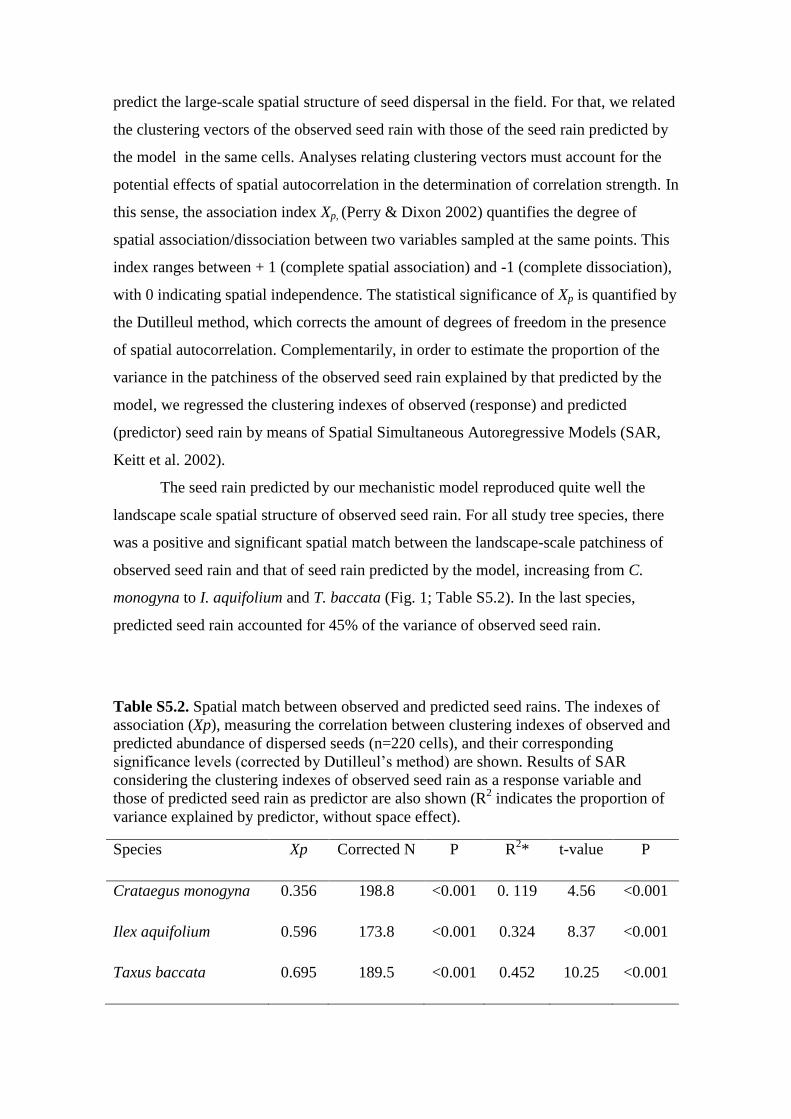
The seed rain predicted by our mechanistic model reproduced quite well the
landscape scale spatial structure of observed seed rain. For all study tree species, there
was a positive and significant spatial match between the landscape-scale patchiness of
observed seed rain and that of seed rain predicted by the model, increasing from C.
monogyna to I. aquifolium and T. baccata (Fig. 1; Table S5.2). In the last species,
predicted seed rain accounted for 45% of the variance of observed seed rain.
Table S5.2. Spatial match between observed and predicted seed rains. The indexes of
association (Xp), measuring the correlation between clustering indexes of observed and
predicted abundance of dispersed seeds (n=220 cells), and their corresponding
significance levels (corrected by Dutilleul’s method) are shown. Results of SAR
considering the clustering indexes of observed seed rain as a response variable and
those of predicted seed rain as predictor are also shown (R2 indicates the proportion of
variance explained by predictor, without space effect).
Species Xp Corrected N P R2* t-value P
Crataegus monogyna 0.356 198.8 <0.001 0. 119 4.56 <0.001
Ilex aquifolium 0.596 173.8 <0.001 0.324 8.37 <0.001
Taxus baccata 0.695 189.5 <0.001 0.452 10.25 <0.001
References
Keitt, T. H., Bøjornstad, O. N., Dixon, P. M. & Citron-Pousty, S. 2002 Accounting for
spatial pattern when modelling organism-environment interactions. Ecography 25:616-
625.
Perry, J. N. 1995. Spatial analysis by distance index. Journal of Animal Ecology
64:303-314.
Perry, J. N., Winder, L., Holland, J. M. and Alston R. D. 1999. Red-blue plots for
detecting clusters in count data. Ecology Letters. 2:106-113.
Perry, J. N. & Dixon, P.M. 2002. A new method to measure spatial association for
ecological count data. Ecoscience 9:133–141.