Embed Size (px)
Citation preview

DeTail: Reducing the Flow Completion Time Tail inDatacenter Networks
David Zats∓, Tathagata Das∓, Prashanth Mohan∓, Dhruba Borthakur�, Randy Katz∓∓ University of California, Berkeley � Facebook
{dzats, tdas, prmohan, randy}@cs.berkeley.edu, [email protected]
ABSTRACTWeb applications have now become so sophisticated that renderinga typical page may require hundreds of intra-datacenter flows. Atthe same time, web sites must meet strict page creation deadlines of200-300ms to satisfy user demands for interactivity. Long-tailedflow completion times make it challenging for web sites to meetthese constraints. They are forced to choose between rendering asubset of the complex page, or delay its rendering, thus missingdeadlines and sacrificing either quality or responsiveness. Eitheroption leads to potential financial loss.
In this paper, we present a new cross-layer network stack aimedat reducing the long tail of flow completion times. The approachexploits cross-layer information to reduce packet drops, prioritizelatency-sensitive flows, and evenly distribute network load, effec-tively reducing the long tail of flow completion times. We evaluateour approach through NS-3 based simulation and Click-based im-plementation demonstrating our ability to consistently reduce thetail across a wide range of workloads. We often achieve reductionsof over 50% in 99.9th percentile flow completion times.
Categories and Subject DescriptorsC.2.2 [Computer-Communication Networks]: Network Protocols
KeywordsDatacenter network, Flow statistics, Multi-path
1. INTRODUCTIONWeb sites have grown complex in their quest to provide increas-
ingly rich and dynamic content. A typical Facebook page consistsof a timeline-organized “wall” that is writeable by the user and herfriends, a real-time cascade of friend event notifications, a chat ap-plication listing friends currently on-line, and of course, advertise-ments selected by displayed content. Modern web pages such asthese are made up of many components, generated by independentsubsystems and “mixed” together to provide a rich presentation ofinformation.
Permission to make digital or hard copies of all or part of this work forpersonal or classroom use is granted without fee provided that copies arenot made or distributed for profit or commercial advantage and that copiesbear this notice and the full citation on the first page. To copy otherwise, torepublish, to post on servers or to redistribute to lists, requires prior specificpermission and/or a fee.SIGCOMM’12, August 13–17, 2012, Helsinki, Finland.Copyright 2012 ACM 978-1-4503-1419-0/12/08 ...$15.00.
Building such systems is not easy. They exploit high-level paral-lelism to assemble the independent page parts in a timely fashion,and present these incrementally, subject to deadlines to provide aninteractive response. The final mixing system must wait for all sub-systems to deliver some of their content, potentially sacrificing re-sponsiveness if a small number of subsystems are delayed. Alter-natively, it must present what it has at the deadline, sacrificing pagequality and wasting resources consumed in creating parts of a pagethat a user never sees.
In this paper, we investigate how the network complicates suchapplication construction, because of the high variation in perfor-mance of the network flows underlying their distributed workflows.By improving the statistics of network flow completion, in par-ticular by reducing the long flow completion tail, the applicationgains better worst-case performance from the network. Applyingthe end-to-end principle, while the mixer software must still dealwith subsystems that fail to respond by the deadline, an underlyingnetwork that yields better flow statistics reduces the conservative-ness of time-outs while reducing the frequency with which they aretriggered. The ultimate application-layer result is better quality andresponsiveness of the presented pages.
Deadlines are an essential constraint on how these systems areconstructed. Experiments at Amazon [26] demonstrated that fail-ing to provide a highly interactive web site leads to significantfinancial loss. Increasing page presentation times by as little as100ms significantly reduces user satisfaction. To meet these de-mands, web sites seek to meet deadlines of 200-300ms 99.9% ofthe time [12, 33].
Highly variable flow completion times complicate the meetingof interactivity deadlines. Application workflows that span the net-work depend on the performance of the underlying network flows.Packet arrival pacing is dictated by round-trip-times (RTTs) andcongestion can significantly affect performance. While datacenternetwork RTTs can be as low as 250μs, in the presence of conges-tion, these times can grow by two orders of magnitude, forming along tail distribution [12]. Average RTTs of hundreds of microsec-onds can occasionally take tens of milliseconds, with implicationsfor how long a mixer application must wait before timing-out onreceiving results from its subsystems.
Flash congestion is the culprit and it cannot be managed throughconventional transport-layer means. Traffic bursts commonly causepacket losses and retransmissions [12]. Uneven load balancing of-ten causes a subset of flows to experience unnecessarily high con-gestion [10]. The absence of traffic prioritization causes latency-sensitive foreground flows to wait behind latency-insensitive back-ground flows [33]. Each contributes to increasing the long tail offlow completion, especially for the latency-sensitive short flowscritical for page creation. While partial solutions exist [10, 12, 29,
139

33], no existing approach solves the whole problem. Fortunately,datacenter networks already contain the key enabling technologyto reduce the long flow completion tail. They employ high-speedlinks and a scaled-out network topology, providing multiple pathsbetween every source and destination [9, 23, 24].
Flash congestion can be reduced if it can be detected and ifnetwork-layer alternatives can be exploited quickly enough. Weaddress this challenge by constructing a cross-layer network stackthat quickly detects congestion at lower network layers, to driveupper layer routing decisions, to find alternative lower-congestionpaths to destinations.
In this paper, we present the implementation and experimentalevaluation of DeTail. DeTail is a cross-layer network stack designto reduce long-tailed flow completions in datacenter networks. Itprovides an effective network foundation for enabling mixer ap-plications to assemble their complex content more completely andwithin responsiveness time constraints. The key contributions ofthis work are:
• Quantification of the impact of long-tailed flow completiontimes on different datacenter workflows;
• Assessment of the causes of long-tailed flow completion times;
• A cross-layer network stack that addresses them;
• Implementation-validated simulations demonstrating DeTail’sreduction of 99.9th percentile flow completion times by over50% for many workloads without significantly increasing themedian
In the following section, we analyze how long-tailed flow com-pletion times affect workflows’ interactive deadlines. In Section 3,we describe the causes of long-tailed flow completion times andthe inadequacy of partial solutions. In Section 4, we introduce thecross-layer network-based approach DeTail uses to overcome theseissues. In Section 5, we describe the NS-3-based simulation [6] andClick-based implementation [27] with which we evaluate DeTail.The evaluation of DeTail in Section 6 demonstrates reduced flowcompletion times for a wide range of workloads. We discuss vari-ous aspects of DeTail in Section 7. We describe how DeTail com-pares with prior work in Section 8 and conclude in Section 9.
2. IMPACT OF THE LONG TAILIn this section, we begin by analyzing datacenter network traffic
measurements, describing the phenomenon of the long tail. Next,we present two workflows commonly used by page creation sub-systems and quantify the impact of the long flow completion timetail on their ability to provide rich, interactive content. We comparethis with the performance that could be achieved with shorter-taileddistributions. We conclude this section with a discussion of how toquantify the long tail.
2.1 Traffic MeasurementsRecently, Microsoft researchers [12] published datacenter traf-
fic measurements for production networks performing services likeweb search. These traces captured three traffic types: (i) soft real-time queries, (ii) urgent short messages, and (iii) large deadline-insensitive background updates. Figure 1 reproduces graphs from [12],showing the distribution of measured round-trip-times (RTTs) fromworker nodes to aggregators. The former typically communicatewith mid-level aggregators (MLAs) located on the same rack. Thisgraph represents the distribution of intra-rack RTTs.
Figure 1 shows that while the measured intra-rack RTTs are typ-ically low, congestion causes them to vary by two orders of mag-nitude, forming a long-tail distribution. In this particular environ-
0 5 10 150
0.5
1
msecs
CD
F o
f RT
T
normalmeasured
(a) Complete Distribution
0 5 10 150.9
0.95
1
msecs
CD
F o
f RT
T
normalmeasured
(b) 90th-100th Percentile
Figure 1: CDF of RTTs from the worker to the aggregator. We compareMicrosoft’s measured distribution [12] with a synthetic normal one havinga 50% larger median.
0 2 4 60
0.5
1
Number of Missed Deadlines
CD
F
measured
(a) 40 workers
0 5 10 15 200
0.5
1
Number of Missed Deadlines
CD
F
measured
(b) 400 workers
Figure 2: Probability that a workflow will have a certain number of workersmiss their 10ms deadline. All workers would meet their deadlines if RTTsfollowed the normal distribution.
ment, intra-rack RTTs take as little as 61μs and have a median du-ration of 334μs. But, in 10% of the cases, RTTs take over 1ms. Infact, RTTs can be as high as 14ms. These RTTs are the measuredtime between the transmission of a TCP packet and the receipt ofits acknowledgement. Since switch queue size distributions matchthis behavior [11], the variation in RTTs is caused primarily bycongestion.
For comparison, Figure 1 includes a synthetic distribution ofRTTs following a normal distribution. While we set this distribu-tion to have a median value that is 50% higher than that of themeasured one, it has a much shorter tail.
As a measured distribution of datacenter flow completion timesis unavailable, we conservatively assume each flow takes one RTT.
2.2 Impact on WorkflowsHere we introduce the partition-aggregate and sequential work-
flows commonly used by page creation subsystems. For both work-flows, we compare the impact of the long-tailed measured distribu-tion with a shorter-tailed one. For this comparison, we focus on99.9th percentile performance as this is the common metric usedfor page creation [12, 33]. We see that a long-tailed distributionperforms significantly worse than a shorter-tailed distribution, evenwhen the latter has a higher median. We conclude this analysis withthe key takeaways.
2.2.1 Partition-AggregatePartition-aggregate workflows are used by subsystems such as
web search. Top-level aggregators (TLAs) receive requests. Theydivide (partition) the computation required to perform the requestacross multiple mid-level aggregators (MLAs), who further parti-tion computation across worker nodes. Worker nodes perform thecomputation in parallel and send their results back to their MLA.Each MLA combines the results it receives and forwards them onto the TLA.
To ensure that the response is provided in a timely manner, itis common practice to give worker nodes as little as 10ms to per-form their computation and deliver their result [12]. If a worker
140

0 200 400 6000
200
400
600
800
Number of Sequential Data Transfers
Com
plet
ion
Tim
e (m
s)
normalmeasured
Figure 3: 99.9th percentile completion times of sequential workflows. Websites could use twice as many sequential requests per page under a shorter-tailed distribution.
node does not meet its deadline, its results are typically discarded,ultimately degrading the quality of the response.
To assess the impact of the measured RTT distribution (in Fig-ure 1) on partition-aggregate workers meeting such deadlines, weanalyze two hypothetical workflows. One has 40 workers while theother has 400. In Figure 2, we show the probability that a workflowwill have a certain number of workers miss their deadlines. Weassigned completion times to each worker by sampling from themeasured RTT distribution. Those with completion times greaterthan 10ms were considered to have missed their deadlines. We per-formed this calculation 10000 times. Under the measured distribu-tion, at the 99.9th percentile, a 40-worker workflow has 4 workers(10%) miss their deadlines, while a 400-worker workflow has 14(3.50%) miss theirs. Had RTTs followed the normal distribution,no workers would have missed their deadlines. This is despite thedistribution having a 50% higher median than the measured one.This shows the hazard of designing for the median rather than long-tail performance.
These results assume that worker nodes do not spend any timecomputing the result they transmit. As the pressure for workers toperform more computation increases, the fraction of workers miss-ing their deadlines will increase as well.
2.2.2 SequentialIn sequential workflows, a single front-end server fetches data
from back-end servers (datastores) for every page creation. Futurerequests depend on the results of previous ones.
To quantify the impact of the long tail, we generated sequentialworkflows with varying numbers of data retrievals. We assumedthat each data retrieval would use one flow and obtained values forretrievals by sampling from the appropriate distribution in Figure 1.We took the completion time of sequential workflows to be the sumof the randomly generated data retrieval times. We performed thiscalculation 10000 times.
In Figure 3, we report 99.9th percentile completion times fordifferent RTT distributions. Under the measured RTT distribution,to meet 200ms page creation deadlines, web sites must have lessthan 150 sequential data retrievals per page creation. Had RTTs fol-lowed the normal distribution, web sites could employ more than350 sequential data retrievals per page. This is despite the distri-bution having a 50% higher median than the measured one. Again,designing for the median rather than long-tail performance is a mis-take.
2.2.3 TakeawaysLong-tailed RTT distributions make it challenging for workflows
used by page creation subsystems to meet interactivity deadlines.While events at the long tail occur rarely, workflows use so manyflows, that it is likely that several will experience long delays for ev-ery page creation. Hitting the long tail is so significant that work-
flows actually perform better under distributions that have highermedians but shorter tails.
The impact is likely to be even greater than that presented here.Our analysis does not capture packet losses and retransmissionsthat are likely to cause more flows to hit the long tail.
Facebook engineers tell us that the long tail of flow completionsforces their applications to choose between two poor options. Theycan set tight data retrieval timeouts for retrying requests. Whilethis increases the likelihood that they will render complete pages,long tail flows generate non-productive requests that increase serverload. Alternatively, they can use conservative timeouts that avoidunnecessary requests, but limit complete web page rendering bywaiting too long for retrievals that never arrive. A network that re-duces the flow completion time tail allows such applications to usetighter timeouts to render more complete pages without increasingserver load.
2.3 Quantifying the TailMedian flow completion time is an insufficient indicator of work-
flow performance. However, determining the right metric is chal-lenging. Workflows only requiring 10 flows are much less likely tobe affected by 99.9th percentile flow completion times versus thosewith 1000 flows. To capture the effect of the long tail on a range ofdifferent workflow sizes, we report both 99th and 99.9th percentileflow completion times.
3. CAUSES OF LONG TAILSSection 2 showed how the long tail of flow completion times im-
pacts page creation workflows. As mentioned earlier, flash conges-tion aggravates three problems that lead to long-tailed flow comple-tion times: packet losses and retransmissions, absence of prioritiza-tion, and uneven load balancing. Here we describe these problemsand how they affect the latency-sensitive short flows critical to pagecreation. We then discuss why current solutions fall short.
3.1 Packet Losses and Retransmissions[12,16,31] study the effect of packet losses and retransmissions
on network performance in datacenters. Packet losses often leadto flow timeouts, particularly in short flows where window sizesare not large enough to perform fast recovery. In datacenters, thesetimeouts are typically set to 10ms [12, 31]. Since datacenter RTTsare commonly of the order of 250μs, just one timeout guaranteesthat the short flow will hit the long tail. It will complete too late,making it unusable for page creation. Using shorter timeouts maymitigate this problem, but it increases the likelihood of spuriousretransmissions that increase network and server load.
Additionally, partition-aggregate workflows increase the likeli-hood of incast breakdown [12, 33]. Workers performing computa-tion typically respond simultaneously to the same aggregator, send-ing it short flows. This sometimes leads to correlated losses thatcause many flows to timeout and hit the long tail.
3.2 Absence of PrioritizationDatacenter networks represent a shared environment where many
flows have different sizes and timeliness requirements. The tracesfrom Section 2 show us that datacenters must support both latency-sensitive and latency-insensitive flows, with sizes that typically rangefrom 2KB to 100MB [12].
During periods of flash congestion, short latency-sensitive flowscan become enqueued behind long latency-insensitive flows. Thisincreases the likelihood that latency-sensitive flows will hit the longtail and miss their deadlines. Approaches that do not consider dif-ferent flow requirements can harm latency-sensitive flows.
141

(a) Regular Topology (b) Degraded Link
Figure 4: Simulated 99.9th percentile flow completion times of flow hash-ing (FH) and packet scatter (PS)
3.3 Uneven Load BalancingModern datacenter networks have scaled out, creating many paths
between every source and destination [9, 23, 24]. Flow hashing istypically used to spread load across these paths while maintainingthe single-path assumption commonly employed by transport pro-tocols. Imperfect hashing, as well as varying flow sizes often leadto uneven flow assignments. Some flows are unnecessarily assignedto a more congested path, despite the availability of less congestedones. This increases the likelihood that they will hit the long tail.
This phenomena has been observed before for large flow sizes[10, 29]. Here we show that it is also a problem for the short flowscommon in page creation. We present a simulation on a 128-serverFatTree topology with a moderate oversubscription factor of four(two from top-of-rack to aggregate switches and two from aggre-gate to core switches). For this experiment, we ran an all-to-allworkload consisting solely of high-priority, uniformly chosen 2KB,8KB, and 32KB flows. These sizes span the range of latency-sensitiveflows common in datacenter networks [12].
In Figure 4(a), we compare the performance of flow hashing anda simple multipath approach: packet scatter. Packet scatter ran-domly picks the output port on which to send packets when mul-tiple shortest paths are available. To factor out transport-layer ef-fects, we used infinitely large switch buffers and also disabled rate-limiting and packet retransmission mechanisms. We see that packetscatter significantly outperforms traditional flow hashing, cutting99.9th percentile flow completion times by half. As we have re-moved transport-layer effects, these results show that single pathapproaches reliant of flow hashing significantly under-perform mul-tipath ones.
Multipath approaches that do not dynamically respond to con-gestion, like packet scatter, may perform significantly worse thanflow hashing for topological asymmetries. Consider a common typeof failure, where a 1Gbps link between a core and aggregate switchhas been degraded and now operates at 100Mbps [29]. Figure 4(b)shows that for the same workload, packet scatter can perform 12%worse than flow hashing. As we will see in Section 6, flow hashingitself performs poorly.
Topological asymmetries occur for a variety of reasons. Dat-acenter network failures are common [18]. Asymmetries can becaused by incremental deployments or network reconfigurations.Both static approaches (packet scatter and flow hashing) are un-aware of the different capabilities of different paths and cannot ad-just to these environments. An adaptive multipath approach wouldbe able to manage such asymmetries.
3.4 Current Solutions InsufficientDCTCP, D3, and HULL [12,13,33] are single path solutions re-
cently proposed to reduce the completion times of latency-sensitiveflows. Single-path fairness and congestion control protocols havealso been developed through the datacenter bridging effort [2]. These
Physical
Link
Network
Transport
Application
Reorder-Resistant Transport
ComponentsLayer Info Exchanged
Flow Priority
Port Occupancy
Congestion Notification
Adaptive Load Balancing
LosslessFabric
Figure 5: The DeTail network stack uses cross-layer information to addresssources of long tails in flow completion times.
reduce packet losses and prioritize latency-sensitive flows. But theydo not address the uneven load balancing caused by flow hashing,and hence still suffer the performance loss illustrated in Figure 4(a).
Recently two solutions have been proposed to more evenly bal-ance flows across multiple paths. Hedera [10] monitors link stateand periodically remaps flows to alleviate hotspots. Since Hederaremaps flows every five seconds and focuses on flows taking morethan 10% of link capacity, it cannot improve performance for theshort flows common in page creation.
The other solution is MPTCP [29]. MPTCP launches multipleTCP subflows and balances traffic across them based on conges-tion. MPTCP uses standard TCP congestion detection mechanismsthat have been shown by DCTCP to be insufficient for preventingpacket drops and retransmissions [12]. Also, while MPTCP is ef-fective for flow sizes larger than 70KB, it is worse than TCP forflows with less than 10 packets [29]. As small flows typically com-plete in just a few RTTs, host-based solutions do not have sufficienttime to react to congested links and rebalance their load. Currentmultipath-aware solutions cannot support the short flows commonin page creation workflows.
Most of the solutions discussed here seek to minimize in-networkfunctionality. Instead they opt for host-based or controller-basedapproaches. Quick response times are needed to support the short,latency-sensitive flows common in page creation. In the followingsection, we present our network-oriented, cross-layer approach tomeeting this goal.
4. DETAILIn this section, we first provide an overview of DeTail’s func-
tionality and discuss how it addresses the causes of long-tailed flowcompletion times. We then describe the mechanisms DeTail uses toachieve this functionality and their parameterization.
4.1 OverviewDeTail is a cross-layer network-based approach for reducing the
long flow completion time tail. Figure 5 depicts the components ofthe DeTail stack and the cross-layer information exchanged.
At the link layer, DeTail uses port buffer occupancies to con-struct a lossless fabric [2]. By responding quickly, lossless fabricsensure that packets are never dropped due to flash congestion. Theyare only dropped due to hardware errors and/or failures. Preventing
142

RX Port0
RX Port1
RX Port2
RX Port3
IPLookup
IPLookup
IPLookup
IPLookup
InQueue0
InQueue1
InQueue2
InQueue3
Crossbar
EgQueue0
EgQueue1
EgQueue2
EgQueue3
TX Port0
TX Port1
TX Port2
TX Port3
PFC Message
Queue Occupancy
Figure 6: Assumed CIOQ Switch Architecture
congestion-related losses reduces the number of flows that experi-ence long completion times.
At the network layer, DeTail performs per-packet adaptive loadbalancing of packet routes. At every hop, switches use the con-gestion information obtained from port buffer occupancies to dy-namically pick a packet’s next hop. This approach evenly smoothsnetwork load across available paths, reducing the likelihood of en-countering a congested portion of the network. Since it is adaptive,it performs well even given topologic asymmetries.
DeTail’s choices at the link and network layers have implicationsfor transport. Since packets are no longer lost due to congestion, ourtransport protocol relies upon congestion notifications derived fromport buffer occupancies. Since routes are load balanced one packetat a time, out-of-order packet delivery cannot be used as an earlyindication of congestion to the transport layer.
Finally, DeTail allows applications to specify flow priorities. Ap-plications typically know which flows are latency-sensitive fore-ground flows and which are latency-insensitive background flows.By allowing applications to set these priorities, and respondingto them at the link and network layers, DeTail ensures that high-priority packets do not get stuck behind low-priority ones. This as-sumes that applications are trusted, capable of specifying whichflows are high priority. We believe that this assumption is appropri-ate for the kind of environment targeted by DeTail.
4.2 DeTail’s DetailsNow we discuss the detailed mechanisms DeTail uses to real-
ize the functionality presented earlier. We begin by describing ourassumed switch architecture. Then we go up the stack, discussingwhat DeTail does at every layer. We conclude by discussing thebenefits of our cross-layer stack.
4.2.1 Assumed Switch ArchitectureIn Figure 6, we depict a four-port representation of a Combined
Input/Output Queue (CIOQ) Switch. The CIOQ architecture is com-monly used in today’s switches [1,28]. We discuss DeTail’s mecha-nisms in the context of this architecture and postpone discussion ofothers until Section 7. This architecture employs both ingress andegress queues, which we denote as InQueue and EgQueue, respec-tively. A crossbar moves packets between these queues.
When a packet arrives at an input port (e.g., RX Port 0), it ispassed to the forwarding engine (IP Lookup). The forwarding en-gine determines on which output port (e.g., TX Port 2) the packetshould be sent. Once the output port has been determined, the packetis stored in the ingress queue (i.e., InQueue 0) until the crossbar be-comes available. When this happens, the packet is passed from theingress queue to the egress queue corresponding to the desired out-put port (i.e., InQueue 0 to EgQueue 2). Finally, when the packet
reaches the head of the egress queue, it is transmitted on the corre-sponding output port (i.e., TX Port 2).
To ensure that high-priority packets do not wait behind thosewith low-priority, the switch’s ingress and egress queues performstrict priority queueing. Switches are typically capable of perform-ing strict priority queueing between eight different priorities [4].We use strict prioritization at both ingress and egress queues.
DeTail requires that the switch provide per-priority ingress andegress queue occupancies to higher layers in the stack. Each queuemaintains a drain bytes counter per priority. This is the number ofbytes of equal or higher priority in front of a newly arriving packet.The switch maintains this value by incrementing/decrementing thecounters for each arriving/departing packet.
Having higher layers continuously poll the counter values ofeach queue may be prohibitively expensive. To address this issue,the switch associates a signal with each counter. Whenever thevalue of the counter is below a pre-defined threshold, the switchasserts the associated signal. These signals enable higher layers toquickly select queues without having to obtain the counter valuesfrom each. When multiple thresholds are used, a signal per thresh-old is associated with each counter. We describe how these thresh-olds are set in Section 4.3.2.
4.2.2 Link LayerAt the link layer, DeTail employs flow control to create a loss-
less fabric. While many variants of flow control exist [8], we choseto use the one that recently became part of the Ethernet standard:Priority Flow Control (PFC) [7]. PFC has already been adopted byvendors and is available on newer Ethernet switches [4].
The switch monitors ingress queue occupancy to detect conges-tion. When the drain byte counters of an ingress queue pass a thresh-old, the switch reacts by sending a Pause message informing theprevious hop that it should stop transmitting packets with the spec-ified priorities. When the drain byte counters reduce, it sends anUnpause message to the previous hop asking it to resume transmis-sion of packets with the selected priorities1.
During periods of persistent congestion, buffers at the previoushop fill, forcing it to generate its own Pause message. In this way,flow control messages can propagate back, quenching the source.
We chose to generate Pause/Unpause messages based on ingressqueue occupancies because packets stored in these queues are at-tributed to the port on which they arrived. By sending Pause mes-sages to the corresponding port when an ingress queue fills, DeTailensures that the correct source postpones transmission.
Our choice of using PFC is based on the fact that packets in loss-less fabrics can experience head-of-line blocking. With traditionalflow control mechanisms, when the previous hop receives a Pausemessage, it must stop transmitting all packets on the link, not justthose contributing to congestion. As a result, packets at the previ-ous hop that are not contributing to congestion may be unneces-sarily delayed. By allowing eight different priorities to be pausedindividually, PFC reduces the likelihood that low-priority packetswill delay high priority ones. We describe how packet priorities areset in Section 4.2.5.
4.2.3 Network LayerAt the network layer, DeTail makes congestion-based load bal-
ancing decisions. Since datacenter networks have many paths be-tween the source and destination, multiple shortest path options ex-ist. When a packet arrives at a switch, it is forwarded on to theshortest path that is least congested.
1PFC messages specify the duration for which packet transmis-sions should be delayed. We use them here in an on/off fashion.
143
Forwarding Entry
10.1.2.X
10.1.X.X
Output Ports
0101
1100
0101
AcceptablePorts (A)
1011
FavoredPorts (F)
0001
SelectedPorts
&Port Occup
1110
1011
PacketPriority
PacketDest Addr
Occupancy Signals
Figure 7: Performing Adaptive Load Balancing - A packet’s destinationIP address is used to determine the bitmap of acceptable ports (A). Thepacket’s priority and port buffer occupancy signals are used to find thebitmap of the lightly loaded favored ports (F). A bitwise AND (&) of thesetwo bitmaps gives the set of selected ports from which one is chosen.
DeTail monitors the egress queue occupancies described in Sec-tion 4.2.1 to make congestion-based decisions. Unlike traditionalEthernet, egress queue occupancies provide an indication of thecongestion being experienced downstream. As congestion increases,flow control messages are propagated towards the source, causingthe queues at each of the switches in the path to fill. By reacting tolocal egress queue occupancies we make globally-aware hop-by-hop decisions without additional control messages.
We would like to react by picking an acceptable port with thesmallest drain byte counter at its egress queue for every packet.However, with the large number of ports in today’s switches, thecomputational cost of doing so is prohibitively high. We leveragethe threshold-based signals described in Section 4.2.1. By concate-nating all the signals for a given priority, we obtain a bitmap of thefavored ports, which are lightly loaded.
DeTail relies on forwarding engines to obtain the set of availableshortest paths to a destination. We assume that associated with eachforwarding entry is a bitmap of acceptable ports that lead to shortestpaths for matching packets2.
As shown in Figure 7, when a packet arrives, DeTail sends itsdestination IP address to the forwarding engine to determine whichentry it belongs to and obtains the associated bitmap of acceptableports (A). It then performs a bitwise AND (&) of this bitmap andthe bitmap of favored ports (F) matching the packet’s priority, toobtain the set of lightly loaded ports that the packet can use. DeTailrandomly chooses from one of these ports and forwards the packet3.
During periods of high congestion, the set of favored ports maybe empty. In this case, DeTail performs the same operation with asecond, larger threshold. If that does not yield results either, DeTailrandomly picks a port from the bitmap. We describe how to setthese thresholds in Section 4.3.2.
4.2.4 Transport LayerA transport-layer protocol must address two issues to run on our
load-balanced, lossless fabric. It must be resistant to packet reorder-ing and it cannot depend on packet loss for congestion notification.
Our lossless fabric simplifies developing a transport protocol thatis robust to out-of-order packet delivery. The lossless fabric ensuresthat packets will only be lost due to relatively infrequent hardwareerrors/failures. As packet drops are now much less frequent, it is notnecessary that the transport protocol respond agilely to them. Wesimply need to disable the monitoring and reaction to out-of-orderpacket delivery. For TCP NewReno, we do this by disabling fast
2Bitmaps can be obtained with the TCAM and RAM approach asdescribed in [9].3Round-robin selection can be used if random selection is costly
recovery and fast retransmit. While this leads to increased bufferingat the end host, this is an acceptable tradeoff given the large amountof memory available on modern servers.
Obtaining congestion information from a lossless fabric is moredifficult. Traditionally, transport protocols monitor packet drops todetermine congestion information. As packet drops no longer hap-pen due to congestion, we need another approach. To enable TCPNewReno to operate effectively with DeTail, we monitor the drainbyte counters at all output queues. Low priority packets enqueuedwhen the appropriate counter is above a threshold have their ECNflag set. This forces the low priority, deadline-insensitive TCP flowcontributing to congestion to reduce its rate.
These types of modifications often raise concerns about perfor-mance and fairness across different transports. As the vast major-ity of datacenter flows are TCP [12] and operators can specify thetransports used, we do not perform a cross-transport study here.
4.2.5 Application LayerDeTail depends upon applications to properly specify flow prior-
ities based on how latency-sensitive they are. Applications expressthese priorities to DeTail through the sockets interface. They seteach flow (and hence the packets belonging to it) to have one ofeight different priorities. As the priorities are relative, applicationsneed not use all of them. In our evaluation, we only use two.
Applications must also react to extreme congestion events wherethe source has been quenched for a long time (Section 4.2.2). Theyneed to determine how to reduce network load while minimallyimpacting the user.
4.2.6 Benefits of the StackDeTail’s layers are designed to complement each other, over-
coming limitations while preserving their advantages.As mentioned earlier, link-layer flow control can cause head-
of-line blocking. In addition to using priority, we mitigate this byemploying adaptive load balancing and ECN. Adaptive load bal-ancing allows alternate paths to be used when one is blocked andECN handles the persistent congestion that aggravates head-of-lineblocking.
DeTail’s per-packet adaptive load balancing greatly benefits fromthe decisions made at the link and transport layers. Recall that us-ing flow control at the link layer provides the adaptive load bal-ancer with global congestion information, allowing it to make bet-ter decisions. And the transport layer’s ability to handle out-of-order packet delivery allows the adaptive load balancer more flexi-bility in making decisions.
4.3 Choice of SettingsNow that we have described the mechanisms employed by De-
Tail, we discuss how to choose their parameters. We also assesshow end-host parameters should be chosen when running DeTail.
4.3.1 Link Layer Flow ControlA key parameter is the threshold for triggering PFC messages.
Pausing a link early allows congestion information to be propagatedmore quickly, making DeTail’s adaptive load balancing more agile.At the same time, it increases the number of control messages. AsPFC messages take time to be sent and responded to, setting theUnpause threshold too low can lead to buffer underflow, reducinglink utilization.
To strike a balance between these competing concerns, we mustfirst calculate the time to generate PFC messages. We use the sameapproach described in [7] to obtain this value.
144

For 1GigE, it may take up to 36.456μs for a PFC message totake effect4. 4557B (bytes) may arrive after a switch generates aPFC message. As we pause every priority individually, this can hap-pen for all eight priorities. We must leave 4557B × 8 = 36456Bof buffer space for receiving packets after PFC generation. Assum-ing 128KB buffers, this implies a maximum Pause threshold of(131072B − 36456B)/8 = 11827 Drain Bytes per priority. Set-ting the threshold any higher can lead to packet loss.
Calculating the Unpause threshold is challenging because thespecifics of congestion cause queues to drain at different rates. Ourcalculations simply assume a drain rate of 1Gbps, requiring an Un-pause threshold of at least 4557B to ensure the ingress queues donot overflow. However, ingress queues may drain faster or slowerthan 1Gbps. If they drain slower, additional control messages mayhave to be sent, re-pausing the priority. If they drain faster, ouregress queues reduce the likelihood of link underutilization.
These calculations establish the minimum and maximum thresh-old values to prevent packet loss and buffer underflow. Betweenthe desire for agility and reduced control message overhead, we setthe Unpause threshold to the minimum value of 4557 Drain Bytesand the Pause threshold to 8192 Drain Bytes (halfway between theminimum and the maximum). When fewer priorities are used, thePause threshold can be raised without suffering packet loss. Giventhe desire for agile response to congestion, we leave it unmodified.
The tradeoffs discussed here depend on link speeds and buffersizes. Analysis of how these tradeoffs change is left for future work.
4.3.2 Adaptive Load BalancingWhen performing threshold-based adaptive-load balancing, we
must determine how many thresholds to have for a given prior-ity (i.e., most favored, favored, and least favored ports) as well aswhat these thresholds should be. Clearly, increasing the number ofthresholds increases complexity, so the benefits of each additionalthreshold must outweigh the complexity cost.
Through a simulation-based exploration of the design space withthe other parameters as described above, we determined that havingtwo thresholds of 16KB and 64KB yields favorable results.
4.3.3 Explicit Congestion NotificationThe threshold for setting ECN flags represents a tradeoff. Set-
ting it too low reduces the likelihood of head-of-line blocking butincreases the chance that low-priority flows will back off too much,underutilizing the link. Setting it too high has the opposite effect.Through experiments, we determined that a threshold of 64KB drainbytes appropriately makes this tradeoff.
4.3.4 End-Host TimersSetting the timeout duration (i.e., RTOmin in TCP) of end host
timers too low may lead to spurious retransmissions that waste net-work resources. Setting them too high leads to long response timeswhen packets are dropped.
Traditionally, transport-layer protocols recover from packet dropscaused by congestion and hardware failures. Congestion occurs fre-quently, so responding quickly to packet drops is important forachieving high throughput. However, DeTail ensures that packetdrops only occur due to relatively infrequent hardware errors/failures.Therefore, it is more important for the timeout duration to be largerto avoid spurious retransmissions.
4We do not consider jumbo frames. Also, PFC is only defined for10GigE. We use 1GigE for manageable simulation times. We basePFC response times on the time specified for Pause Frames. This isappropriate since 10GigE links are given the same amount of timeto respond to PFC messages are they are to Pause Frames.
To determine a robust timeout duration for DeTail, we simulatedall-to-all incast 25 times with varying numbers of servers (con-nected to a single switch) and different values of RTOmin. Duringevery incast event, one server receives a total of 1MB from the re-maining servers. We saw that values of 10ms and higher effectivelyavoid spurious retransmissions.
Unlike this simulation, datacenter topologies typically have mul-tiple hops. Hence, we use 200ms as RTOmin for DeTail in ourevaluations to accommodate the higher RTTs.
5. EXPERIMENTAL SETUPHere we describe the NS-3 based simulator [6] and Click-based
implementation [27] we use to evaluate DeTail.
5.1 NS-3 SimulationOur NS-3 based simulation closely follows the switch design de-
picted in Figure 6. Datacenter switches typically have 128-256KBbuffers per port [12]. To meet this constraint, we chose per-portingress and egress queues of 128KB.
Network simulators typically assume that nodes are infinitelyfast at processing packets, this is inadequate for evaluating DeTail.We extended NS-3 to include real-world processing delays. Switchdelays of 25μs are common in datacenter networks [12]. We relyupon published specifications to break-down this delay as follows,providing explanations where possible:
• 12.24μs transmission delay of a full-size 1530B Ethernetframe on a 1GigE link.
• 3.06μs crossbar delay when using a speedup of 4. Cross-bar speedups of 4 are commonly used to reduce head of lineblocking [28].
• 0.476μs propagation delay on a copper link [7].
• 5μs transceiver delay (both ends of the link) [7].
• 4.224μs forwarding engine delay (the remainder of the 25μsbudget).
We incorporate the transceiver delay into the propagation delay.The other delays are implemented individually, including the re-sponse time to PFC messages.
Packet-level simulators are known to have scalability issues, interms of topology size and simulation duration [29]. We evaluatedthe feasibility of also developing a flow-level simulator, but con-cluded that it would be unable to shed light on the packet-leveldynamics that are the focus of this paper.
NS-3’s TCP model lacks support for ECN. Hence, our simula-tions do not evaluate explicit congestion notification (as discussedin Section 4.2.4). As we will show, even without ECN-based throt-tling of low priority flows our simulations demonstrate impressiveresults.
5.2 Click-based ImplementationTo validate our approach, we implemented DeTail in Click [27].
Overall, our implementation mirrors the design decisions specifiedin Section 4 and portrayed in Figure 6. Here we describe the salientdifferences and analyze the impact they have on our parameters.
5.2.1 Design DifferencesUnlike hardware switches, software routers typically do not em-
ulate a CIOQ switch architecture. Instead, the forwarding engineplaces packets directly into the output queue. This output-queuedapproach is poorly suited to DeTail because we rely on ingressqueues to determine when to send PFC messages.
145

To address this difference, we modified Click to have both ingressand egress queues. When packets arrive, the forwarding enginesimply annotates them with the desired output port and places themin the ingress queue corresponding to the port on which they ar-rived. Crossbar elements then pull packets from the ingress queueto the appropriate egress queue. Finally, when the output port be-comes free, it pulls packets from its egress queue.
Software routers also typically do not have direct control overthe underlying hardware. For example, when Click sends a packet,it is actually enqueued in the driver’s ring buffer. The packet is thenDMAed to the NIC where it waits in another buffer until it is trans-mitted. In Linux, the driver’s ring buffer alone can contain hundredsof packets. It is difficult for the software router to asses how con-gested the output link is when performing load balancing. Also,hundreds of packets may be transmitted between the time when thesoftware router receives a PFC message and it takes effect.
To address this issue, we add rate limiters in Click before everyoutput port. They clock out packets based on the link’s bandwidth.This reduces packet buildup in the driver’s and NIC’s buffers, in-stead keeping those packets in Click’s queues for a longer duration.
5.2.2 Parameter ModificationsThe limitations of our software router impact our parameter choices.
As it lacks hardware support for PFC messages, it takes more timeboth generate and respond to them.
Also, our rate limiter allows batching up to 6KB of data to ensureefficient DMA use. This may cause PFC messages to be enqueuedfor longer before they are placed on the wire and additional datamay be transmitted before a PFC message takes effect. This alsohurts high-priority packets. High priority packets will suffer addi-tional delays if they arrive just after a batch of low priority packetshas been passed to the driver.
To address these limitations, we increased our Pause / Unpausethresholds. However, instead of increasing ingress queue sizes, weopted to ensure that only two priorities were used at a time. Thisapproach allows us to provide a better assessment of the advantagesof DeTail in datacenter networks.
6. EXPERIMENTAL RESULTSIn this section, we evaluate DeTail through extensive simula-
tion and implementation, demonstrating its ability to reduce theflow completion time tail for a wide range of workloads. We be-gin with an overview describing our traffic workloads and touch onkey results. Next, we compare simulation and implementation re-sults, validating our simulator. Later, we subject DeTail to a widerange of workloads under a larger topology than permitted by theimplementation and investigate its scaled-up performance.
6.1 OverviewTo evaluate DeTail’s ability to reduce the flow completion time
tail, we compare the following approaches:
Flow Hashing (FH): Switches employ flow-level hashing. This isthe status quo and is our baseline for comparing the perfor-mance of DeTail.
Lossless Packet Scatter (LPS): Switches employ packet scatter (asalready explained in Section 3) along with Priority Flow Con-trol (PFC). While not industry standard, LPS is a naive mul-tipath approach that can be deployed in current datacenters.The performance difference between LPS and DeTail high-lights the advantages of Adaptive Load Balancing (ALB).
DeTail: As already explained in previous sections, switches em-ploy PFC and ALB.
All three cases use strict priority queueing and use TCP NewRenoas the transport layer protocol. For FH, we use a TCP RTOmin of10ms, as suggested by prior work [12, 31]. Since LPS and DeTailuse PFC to avoid packet losses, we use the standard value of 200ms(as discussed in Section 4.3.4). Also, we use reorder buffers at theend-hosts to deal with out-of-order packet delivery.
We evaluate DeTail against LPS only in Section 6.4. For all otherworkloads, LPS shows similar improvements as DeTail and hasbeen omitted for space constraints.
Traffic Model: Our traffic model consists primarily of high-prioritydata retrievals. For each retrieval, a server sends a 10-byte requestto another server and obtains a variable sized response (i.e., data)from it. The size of the data (henceforth referred to as retrieval datasize) is randomly chosen to be 2KB, 8KB, or 32KB, with equalprobability. We chose discrete data sizes for more effective analysisof 99th and 99.9th percentile performance. The rate of generationof these data retrievals (henceforth called retrieval rate) and the se-lection of servers for the retrievals are defined by the traffic work-load. In most cases, we assumed the inter-arrival times of retrievalsto be exponentially distributed (that is, a Poisson process). We alsoevaluated against more bursty traffic models having lognormal dis-tributions with varying sigma (σ) values. Where specified, we alsorun low-priority, long background data transfers.
Key results: Throughout our evaluation, we focus on 99th and99.9th percentile completion times of data retrievals to assess De-Tail’s effectiveness. We use the percentage reduction in the com-pletion times provided by DeTail over Flow Hashing as the metricof improvement. Our key results are:
• DeTail completely avoids congestion-related losses, reduc-ing 99.9th percentile completion times of data retrievals inall-to-all workloads by up to 84% over Flow Hashing.
• DeTail effectively moves packets away from congestion hotspotsthat may arise due to disconnected links, reducing 99.9th
percentile completion times by up to 89% over Flow Hash-ing. LPS does not do as well and actually performs worsethan FH for degraded links.
• Reductions in individual data retrievals translate into improve-ments for sequential and partition-aggregate workflows, re-ducing their 99.9th percentile completion times by 54% and78%, respectively.
6.2 Simulator VerificationTo validate our simulator, we ran our Click-based implementa-
tion on Deter [14]. We constructed a 36-node, 16-server FatTreetopology. Over-subscription is common in datacenter networks [3].To model the effect of a moderate over-subscription factor of four,we rate-limited the ToR-to-aggregate links to 500Mbps and theaggregate-to-core links to 250Mbps.
We designated half of the servers to be front-end (web-facing)servers and half to be back-end servers. Each front-end server con-tinuously selects a back-end server and issues a high-priority dataretrieval to it. The data retrievals are according to a Poisson processand their rate is varied from 100 to 1500 retrievals/second.
We simulated the same workload and topology, with parame-ters matched with that of the implementation. Figure 8 comparesthe simulation results with the implementation measurements. Forrates ranging from 500 to 1500 retrievals/sec, the percentage re-duction in completion time predicted by the simulator is closelymatched by implementation measurements, with the difference in
146

(a) 2KB (b) 8KB
Figure 8: Comparison of simulation and implementation results - Re-duction by DeTail over FH in 99th and 99.9th percentile completion timesof 2KB and 8KB data retrievals
(a) Complete distribution (b) 90th-100th percentile
Figure 9: CDF of completion times of 8KB data retrievals under all-to-allworkload of 2000 retrievals/second
the percentage being within 8% (results for 32KB data retrievalsand LPS are similar and have been omitted for space constraints).Note that this difference increases for lower rates. We hypothesizethat this is due to end-host processing delays that are present onlyin the implementation (i.e., not captured by simulation) dominatingcompletion times during light traffic loads.
We similarly verified our simulator for lognormal distributionsof data retrievals having a σ = 1. The simulation and implementa-tion results continue to match, with the difference in the percentagegrowing slightly to 12%.This demonstrates that our simulator is agood predictor of performance that one may expect in a real imple-mentation. Next, we use this simulator to evaluate larger topologiesand a wider range of workloads.
6.3 MicrobenchmarksWe evaluate the performance of DeTail on a larger FatTree topol-
ogy with 128 servers. The servers are distributed into four podshaving four ToR switches and four aggregate switches each. Thefour pods are connected to eight core switches. This gives an over-subscription factor of four in the network (two from top-of-rack toaggregate switches and two from aggregate to core switches). Weevaluate two traffic patterns:
• All-to-all: Each server randomly selects another server andretrieves data from it. All 128 servers engage in issuing andserving data retrievals.
• Front-end / Back-end: Each server in first three pods (i.e,front-end server) retrieves data from a randomly selected serverin the fourth pod (i.e., back-end server).
The data retrievals follow a Poisson process unless mentioned oth-erwise. In addition, each server is engaged in, on average, one 1MB
(a) 2KB (b) 8KB (c) 32KB
Figure 10: All-to-all Workload - Reduction by DeTail over FH in 99th and99.9th percentile completion times of 2KB, 8KB and 32KB retrievals
σ 0.5 1 2size (KB) 2 8 32 2 8 32 2 8 32500 (r/s) 40% 20% 26% 38% 26% 26% 31% 30% 31%1000 (r/s) 43% 30% 35% 46% 35% 37% 36% 23% 33%2000 (r/s) 67% 62% 65% 68% 66% 67% 84% 76% 73%
Table 1: All-to-all Workload with Lognormal Distributions - Reductionin 99.9th percentile completion time of retrievals under lognormal arrivals
low-priority background flow. Using a wide range of workloads, weillustrate how ALB and PFC employed in DeTail reduce the tail ofcompletion times as compared to FH.
All-to-all Workload: Each server generates retrievals at rates rang-ing from 500 to 2000 retrievals/second, which corresponds to loadfactors5 of approximately 0.17 to 0.67. Figure 9 illustrates the ef-fectiveness of DeTail in reducing the tail, by presenting the cumu-lative distribution of completion times of 8KB data retrievals un-der a rate of 2000 retrievals/second. While the 99th and 99.9th
percentile completion times under FH were 6.3ms and 7.3ms,respectively, DeTail reduced them to 2.1ms and 2.3ms; a reduc-tion of about 67% in both cases. Even the median completion timeimproved by about 40%, from 2.2ms to 1.3ms. Furthermore, theworst case completion time was 28ms under FH compared to 2.6ms,which demonstrates the phenomenon discussed in Section 2. Flowcompletion times can increase by an order of magnitude due to con-gestion and mechanisms employed by DeTail are essential for en-suring tighter bounds on network performance.
Figure 10 presents the reductions in completion times for threedata sizes at three retrieval rates. DeTail provided up to 70% reduc-tion at the 99th percentile (71% at 99.9th percentile) completiontimes. Specifically, the 99.9th percentile completion times for allsizes were within 3.6ms compared to 11.9ms under FH. Withineach data size, higher rates have greater improvement. The highertraffic load at these rates exacerbates the uneven load balancingcaused by FH, which ALB addresses.
We also evaluate DeTail under more bursty traffic using lognor-mally distributed inter-arrival times. While keeping the same meanquery rate (i.e., same load factors) as before, we vary the distribu-tion’s parameter σ from 0.5 to 2. Higher values of σ lead to morebursty traffic. Table 1 shows that DeTail achieves between 20% and84% reductions at the 99.9th percentile. Note that even at low load(500 r/s), for highly bursty (σ = 2) traffic DeTail achieves reduc-tions greater than 30%.
Front-end / Back-end Workload: Each front-end server (i.e., serversin the first three pods) retrieves data from randomly selected back-end servers (i.e., servers in the fourth pod) at rates ranging from125 to 500 retrievals/second, which correspond to load factors ofapproximately 0.17 to 0.67 on the aggregate-to-core links of the
5load factor is the approximate utilization of the aggregate-to-corelinks by high-priority traffic only
147

(a) 2KB (b) 8KB (c) 32KB
Figure 11: Front-end / Back-end Workload - Reduction by DeTail overFH in 99th and 99.9th percentile completion times of 2KB, 8KB and32KB data retrievals
(a) 2KB (b) 8KB (c) 32KB
Figure 12: Disconnected Link - Reduction by LPS and DeTail over FH in99.9th percentile completion times of 2KB, 8KB and 32KB retrievals
fourth pod. Figure 11 shows that DeTail achieves 30% to 65% re-duction in the completion times of data retrievals at the 99.9th per-centile. This illustrates that DeTail can perform well even under thepersistent hotspot caused by this workload.
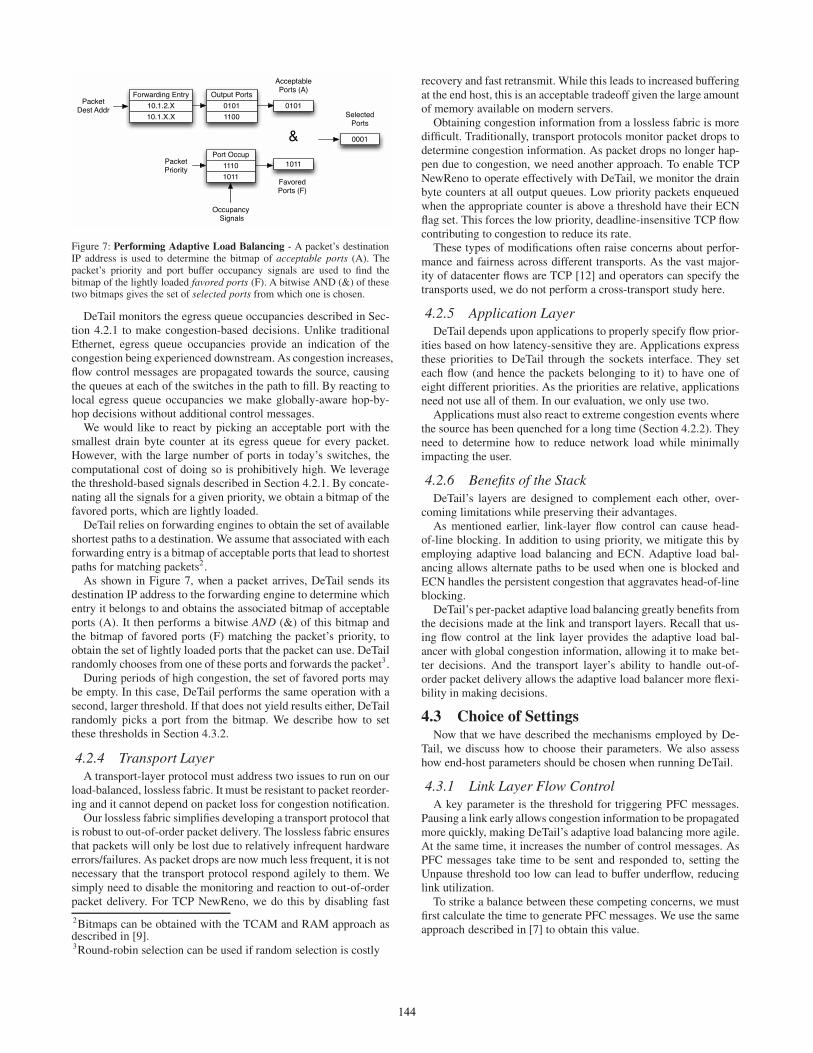
Long Background Flows: DeTail’s approach to improving dataretrievals (i.e., high-priority, short flows) does not sacrifice back-ground flow performance. Due to NS-3’s lack of ECN support, weevaluate the performance of background flows using the 16-serverimplementation presented earlier. We use the same half front-endservers and half-backend servers setup, and apply a retrieval rate300 retrievals/second. Additionally, front-end servers are also con-tinuously engaged in low-priority background flows with randomlyselected back-end servers. The background flows are long; eachflow is randomly chosen to be one of 1MB, 16MB or 64MB withequal probability. Figure 14 shows that DeTail provides a 38% to60% reduction over FH in the average completion time and a 58%to 71% reduction in the 99th percentile. Thus, DeTail significantlyimproves the performance of long flows. A detailed evaluation ofDeTail’s impact on long flows is left for future work.
6.4 Topological AsymmetriesAs discussed in Section 3.3, a multipath approach must be robust
enough to handle topological asymmetries due to network compo-nent failures or reconfigurations. We consider two types of asym-metries: disconnected links and degraded links. These asymmetrieslead to load imbalance, even with packet scatter. In this section,we show how ALB can adapt to the varying traffic demands andovercome the limitations of packet-level scattering. Besides FH, weevaluate DeTail against LPS to highlight the strength of ALB overpacket scatter (used in LPS). We assume that the routing protocolused in the network has detected the asymmetry and converged toprovide stable multiple routes.
Disconnected Link: We evaluated the all-to-all workload with Pois-son data retrievals on the same topology described in the previoussubsection, but with the assumption of one disconnected aggregate-
(a) 2KB (b) 8KB (c) 32KB
Figure 13: Degraded Link - Reduction by LPS and DeTail over FH in99.9th percentile completion times of 2KB, 8KB and 32KB data retrievals
to-core link. Figure 12 presents the reduction in 99.9th percentilecompletion times for both LPS and DeTail (we do not present 99th
percentile for space constraints). DeTail provided 10% to 89% re-duction, almost an order of magnitude improvement (18ms un-der DeTail compared to 159ms under FH for 8KB retrievals at2000 retrievals/second). LPS’s inability to match DeTail’s improve-ment at higher retrieval rates highlights the effectiveness of ALB atevenly distributing load despite asymmetries in available paths.
Degraded Link: Instead of disconnecting, links can occasionallybe downgraded from 1Gbps to 100Mbps. Figure 13 presents theresults for the same workload with a degraded core-to-agg link.DeTail provided more than 91% reduction compared to FH. Thisdramatic improvement is due to ALB’s inherent capability to routearound congestion hotspots (i.e., switches connected to the degradedlink) by redirecting traffic to alternate paths. While the 99.9th per-centile completion time for 8KB at 2000 retrievals/second (referto Figure 13(b)) under FH and LPS was more than 755ms, it was37ms under DeTail. In certain cases, LPS actually performs worsethan FH (i.e., for 2KB, 500 retrievals/second).
In both fault types, the improvement in the tail comes at the costof increased median completion times. As we have argued earlier,this trade off between median and 99.9th percentile performance isappropriate for consistently meeting deadlines.
6.5 Web WorkloadsNext, we evaluate how the improvements in individual data re-
trievals translate to improvements in the sequential and partition-aggregate workflows used in page creation. Here we randomly as-sign half the servers to be front-end servers and half to be back-endservers. The front-end servers initiate the workflows to retrieve datafrom randomly chosen back-end servers. We present the reductionin the 99.9th percentile completion times of these workflows.
Sequential Workflows: Each sequential workflow initiated by afront-end server consists of 10 data retrievals of size 2KB, 4KB,8KB, 16KB, and 32KB (randomly chosen with equal probability).As described in the Section 2, these retrievals need to be performedone after another. Workflows arrive according to a Poisson processat an average rate of 350 workflows/second. Figure 15 shows thatDeTail provides 71% to 76% reduction in the 99.9th percentilecompletion times of individual data retrievals. In total, there is a54% improvement in the 99.9th percentile completion time of thesequential workflows – from 38ms to 18ms.
Partition-Aggregate Workflows: In each partition-aggregate work-flow, a front-end server retrieves data in parallel from 10, 20, or40 (randomly chosen with equal probability) back-end servers. Ascharacterized in [12], the size of individual data retrievals is setto 2KB. These workflows arrive according to a Poisson process
148
Figure 14: Long Flows- Reduction by DeTail incompletion times of long,low-priority flows
Figure 15: Sequential Workflows - Reduction by DeTailover FH in 99.9th percentile completion times of sequen-tial workflows and their individual data retrievals
Figure 16: Partition-Aggregate Workflows - Reduction byDeTail over FH in 99.9th percentile completion times ofpartition-aggregate workflows and their individual retrievals
at an average rate of 600 workflows/second. Figure 16 shows thatDetail provides 78% to 88% reduction in 99.9th percentile com-pletion times of the workflows. Specifically, the 99.9th percentilecompletion time of workflows with 40 servers was 17ms under De-Tail, compared to 143ms under FH. This dramatic improvement isachieved by preventing the timeouts that were experienced by over3% of the individual data retrievals under FH.
These results demonstrate that DeTail effectively manages net-work congestion, providing significant improvements in the perfor-mance of distributed page creation workflows.
7. DISCUSSIONWe first describe how DeTail can be applied to other switch
architectures. Next we present initial ideas about a DeTail-awaretransport protocol.
7.1 Alternate Switch ArchitecturesModern datacenters increasingly employ shared-memory top-of-
rack switches [12]. In these switches, arriving packets are added tothe output queue when the forwarding decision is made. They donot wait in input queues until the crossbar becomes available. Thismakes it difficult to determine which links contribute to congestion.
We address this by associating a bitmap with every input port.When an arriving packet is enqueued on a congested output queue,the bit corresponding to that port is set. When the output queueempties, the corresponding bits in the input ports are cleared. As in-put ports with any bits set in their bitmaps are contributing to con-gestion, this determines when we send Pause/Unpause messages.To handle multiple priorities, we use a per-port bitmap for each.
We have output queues only report congestion for a priority ifits drain bytes have exceeded the thresholds specified earlier andif total queue occupancy is greater than 128KB. This reduces thelikelihood of underflow in the same way that the 128KB outputqueues do in the CIOQ architecture (see Section 4).
To evaluate this approach, we re-ran the Poisson all-to-all mi-crobenchmark presented in Section 6. As before, we assume ourswitches have 256KB per-port. Shared-memory architectures dy-namically set queue occupancy thresholds. We simulated a simplemodel that optimizes per-port fairness. When a switch’s memory isexhausted, it drops packets from the queue with the highest occu-pancy. Arriving packets may only be dropped if they are destinedfor the most occupied queue. Priority is used to decide which ofan output queue’s packets to drop. We believe this is an idealizedmodel of the performance a shared-memory switch with the sameoptimization strategy can achieve.
In Table 2, we present the reduction in 99.9th percentile dataretrieval times. Due to space constraints, we do not present 99th
percentile results. With up to 66% reduction in completion time,
500 1000 2000size (KB) 2 8 32 2 8 32 2 8 32reduction 17% 10% 14% 38% 34% 35% 66% 64% 66%
Table 2: Shared Memory - Reduction by DeTail in 99.9th percentile com-pletion times for all-to-all workloads of exponentially distributed retrievals
these results show that DeTail’s approach is beneficial for sharedmemory switches as well. We leave a thorough evaluation of De-Tail’s performance with shared-memory switches for future work.
7.2 DeTail-aware transportThe transport layer protocol presented in this paper is a retrofit
of TCP NewReno. Delay-based protocols, such as TCP Vegas [15],may be better suited in these environments. Instead of waiting forpacket drops that do not occur, they monitor increases in delay.Increased delay is precisely the behavior our lossless interconnectexhibits as congestion rises. We plan to investigate this approachfurther in the future.
8. RELATED WORKIn this section, we discuss prior work and how it relates to De-
Tail in three areas: Internet protocols, datacenters, and HPC inter-connects, discussing each in turn.
8.1 Internet ProtocolsThe Internet was initially designed as a series of independent lay-
ers [17] with a focus on placing functionality at the end-hosts [30].This approach explicitly sacrificed performance for generality. Im-provements to this design, in terms of TCP modifications such asNewReno, Vegas, and SACK [15, 20, 25] and in terms of buffermanagement such as RED and Fair Queuing [19, 21] were pro-posed. All of these approaches focused on improving the notifi-cation and response of end-hosts. Consequently, they operate atcoarse-grained timescales inappropriate for our workload.
DeTail differs from this work by taking a more agile in-networkapproach that breaks the single path assumption to reduce the flowcompletion time tail.
8.2 Datacenter NetworksRelevant datacenter work has focused on two areas: topologies
and traffic management protocols. Topologies such as FatTrees,VL2, BCube, and DCell [9, 22–24] sought to increase bisectionbandwidth. Doing so necessitated increasing the number of pathsbetween the source and destination because increasing link speedswas seen as impossible or prohibitively expensive.
Prior work has also focused on traffic management protocols fordatacenters. DCTCP and HULL proposed mechanisms to improveflow completion time by reducing buffer occupancies [12, 13]. D3
sought to allocate flow resources based on application-specified
149

deadlines [33]. And, the recent industrial effort known as Data-center Bridging extends Ethernet to support traffic from other pro-tocols that have different link layer assumptions [2]. All of theseapproaches focus on single-path mechanisms that are bound by theperformance of flow hashing.
Datacenter protocols focused on spreading load across multi-ple paths have been proposed. Hedera performs periodic flow re-mapping of elephant flows [10]. MPTCP takes a step further, mak-ing TCP aware of multiple paths [29]. While these approaches pro-vide multipath support, they operate at timescales that are too coarse-grained to improve the short flow completion time tail.
8.3 HPC InterconnectsDeTail borrows some ideas from HPC interconnects. Credit-based
flow control has been extensively studied and is often deployed tocreate lossless fabrics [8]. Adaptive load balancing algorithms suchas UGAL and PAR have also been proposed [8]. To the best of ourknowledge, these mechanisms have not been evaluated for web-facing datacenter networks focused on reducing the flow comple-tion tail.
A commodity HPC interconnect, Infiniband, has made its wayinto datacenter networks [5]. While Infiniband provides a priority-aware lossless interconnect, it does not perform Adaptive Load Bal-ancing (ALB). Without ALB, hotspots can occur, leading a subsetof flows to hit the long tail. Host-based approaches to performingload-balancing, such as [32] have been proposed. But these ap-proaches are limited because they are not sufficiently agile.
9. CONCLUSIONIn this paper, we presented DeTail, an approach for reducing
the tail of completion times of the short, latency-sensitive flowscritical for page creation. DeTail employs cross-layer, in-networkmechanisms to reduce packet losses and retransmissions, prioritizelatency-sensitive flows, and evenly balance traffic across multiplepaths. By making its flow completion statistics robust to conges-tion, DeTail can reduce 99.9th percentile flow completion times byover 50% for many workloads.
DeTail’s approach will likely achieve significant improvementsin the tail of flow completion times for the foreseeable future. In-creases in network bandwidth are unlikely to be sufficient. Bufferswill drain faster, but they will also fill up more quickly, ultimatelycausing the packet losses and retransmissions that lead to long tails.Prioritization will continue to be important as background flowswill likely remain the dominant fraction of traffic. And load imbal-ances due to topological asymmetries will continue to create hot-spots. By addressing these issues, DeTail enables web sites to de-liver richer content while still meeting interactivity deadlines.
10. ACKNOWLEDGEMENTSThis work is supported by MuSyC: "Multi-Scale Systems Cen-
ter", MARCO, Award #2009-BT-2052 and AmpLab: "AMPLab:Scalable Hybrid Data Systems Integrating Algorithms, Machinesand People", DARPA, Award #031362. We thank Ganesh Anan-thanarayanan, David Culler, Jon Kuroda, Sylvia Ratnasamy, ScottShenker, and our shepherd Jon Crowcroft for their insightful com-ments and suggestions. We also thank Mohammad Alizadeh andDavid Maltz for helping us understand the DCTCP workloads.
11. REFERENCES[1] Cisco nexus 5000 series architecture.
http://www.cisco.com/en/US/prod/collateral/switches/ps9441/ps9670/white_paper_c11-462176.html.
[2] Data center bridging. http://www.cisco.com/en/US/solutions/collateral/ns340/ns517/ns224/ns783/at_a_glance_c45-460907.pdf.
[3] Datacenter networks are in my way. http://mvdirona.com/jrh/TalksAndPapers/JamesHamilton_CleanSlateCTO2009.pdf.
[4] Fulcrum focalpoint 6000 series.http://www.fulcrummicro.com/product_library/ FM6000_Product_Brief.pdf.
[5] Infiniband architecture specification release 1.2.1. http://infinibandta.org/.[6] Ns3. http://www.nsnam.org/.[7] Priority flow control: Build reliable layer 2 infrastructure.
http://www.cisco.com/en/US/prod/collateral/switches/ps9441/ps9670/white_paper_c11-542809.pdf.
[8] ABTS, D., AND KIM, J. High performance datacenter networks:Architectures, algorithms, and opportunities. Synthesis Lectures on ComputerArchitecture 6, 1 (2011).
[9] AL-FARES, M., LOUKISSAS, A., AND VAHDAT, A. A scalable, commoditydata center network architecture. In SIGCOMM (2008).
[10] AL-FARES, M., RADHAKRISHNAN, S., RAGHAVAN, B., HUANG, N., AND
VAHDAT, A. Hedera: Dynamic flow scheduling for data center networks. InNSDI (2010).
[11] ALIZADEH, M. Personal communication, 2012.[12] ALIZADEH, M., GREENBERG, A., MALTZ, D. A., PADHYE, J., PATEL, P.,
PRABHAKAR, B., SENGUPTA, S., AND SRIDHARAN, M. Data center tcp(dctcp). In SIGCOMM (2010).
[13] ALIZADEH, M., KABBANI, A., EDSALL, T., PRABHAKAR, B., VAHDAT,A., AND YASUDA, M. Less is more: Trading a little bandwidth for ultra-lowlatency in the data center. In NSDI (2012).
[14] BENZEL, T., BRADEN, R., KIM, D., NEUMAN, C., JOSEPH, A., SKLOWER,K., OSTRENGA, R., AND SCHWAB, S. Experience with deter: a testbed forsecurity research. In TRIDENTCOM (2006).
[15] BRAKMO, L. S., O’MALLEY, S. W., AND PETERSON, L. L. Tcp vegas: newtechniques for congestion detection and avoidance. In SIGCOMM (1994).
[16] CHEN, Y., GRIFFITH, R., LIU, J., KATZ, R. H., AND JOSEPH, A. D.Understanding tcp incast throughput collapse in datacenter networks. InWREN (2009).
[17] CLARK, D. The design philosophy of the darpa internet protocols. InSIGCOMM (1988).
[18] DEAN, J. Software engineering advice from building large-scale distributedsystems. http://research.google.com/people/jeff/stanford-295-talk.pdf.
[19] DEMERS, A., KESHAV, S., AND SHENKER, S. Analysis and simulation of afair queueing algorithm. In SIGCOMM (1989).
[20] FLOYD, S., AND HENDERSON, T. The newreno modification to tcp’s fastrecovery algorithm, 1999.
[21] FLOYD, S., AND JACOBSON, V. Random early detection gateways forcongestion avoidance. IEEE/ACM Trans. Netw. 1 (August 1993).
[22] GREENBERG, A., HAMILTON, J. R., JAIN, N., KANDULA, S., KIM, C.,LAHIRI, P., MALTZ, D. A., PATEL, P., AND SENGUPTA, S. Vl2: a scalableand flexible data center network. In SIGCOMM (2009).
[23] GUO, C., LU, G., LI, D., WU, H., ZHANG, X., SHI, Y., TIAN, C., ZHANG,Y., AND LU, S. Bcube: A high performance, server-centric networkarchitecture for modular data centers. In SIGCOMM (2009).
[24] GUO, C., WU, H., TAN, K., SHI, L., ZHANG, Y., AND LU, S. Dcell: ascalable and fault-tolerant network structure for data centers. In SIGCOMM(2008).
[25] JACOBSON, V., AND BRADEN, R. T. Tcp extensions for long-delay paths,1988.
[26] KOHAVI, R., AND LONGBOTHAM, R. Online experiments: Lessons learned,September 2007. http://exp-platform.com/Documents/IEEEComputer2007OnlineExperiments.pdf.
[27] KOHLER, E., MORRIS, R., CHEN, B., JANNOTTI, J., AND KAASHOEK,M. F. The click modular router. ACM Trans. Comput. Syst. 18 (August 2000).
[28] MCKEOWN, N. White paper: A fast switched backplane for a gigabitswitched router. http://www-2.cs.cmu.edu/ srini/15-744/readings/McK97.pdf.
[29] RAICIU, C., BARRE, S., PLUNTKE, C., GREENHALGH, A., WISCHIK, D.,AND HANDLEY, M. Improving datacenter performance and robustness withmultipath tcp. In SIGCOMM (2011).
[30] SALTZER, J. H., REED, D. P., AND CLARK, D. D. End-to-end arguments insystem design. ACM Trans. Comput. Syst. 2 (November 1984).
[31] VASUDEVAN, V., PHANISHAYEE, A., SHAH, H., KREVAT, E., ANDERSEN,D. G., GANGER, G. R., GIBSON, G. A., AND MUELLER, B. Safe andeffective fine-grained TCP retransmissions for datacenter communication. InSIGCOMM (2009).
[32] VISHNU, A., KOOP, M., MOODY, A., MAMIDALA, A. R., NARRAVULA, S.,AND PANDA, D. K. Hot-spot avoidance with multi-pathing over infiniband:An mpi perspective. In CCGRID (2007).
[33] WILSON, C., BALLANI, H., KARAGIANNIS, T., AND ROWTRON, A. Betternever than late: meeting deadlines in datacenter networks. In SIGCOMM(2011).
150


![DeTail: Reducing the Flow Completion Time Tail in ......[33]. Each contributes to increasing the long tail of flow completion. While partial solutions exist [12,13,29,33], no existing](https://img.pdfslide.us/doc/110x75/5ff07150cf6b2c218a21e0dd/detail-reducing-the-flow-completion-time-tail-in-33-each-contributes.jpg)