Embed Size (px)
Citation preview

LSE Research Online Article (refereed)
Designing the voting system for the Council of the European Union
Dennis Leech
LSE has developed LSE Research Online so that users may access research output of the School. Copyright © and Moral Rights for the papers on this site are retained by the individual authors and/or other copyright owners. Users may download and/or print one copy of any article(s) in LSE Research Online to facilitate their private study or for non-commercial research. You may not engage in further distribution of the material or use it for any profit-making activities or any commercial gain. You may freely distribute the URL (http://eprints.lse.ac.uk) of the LSE Research Online website. You may cite this version as: Leech, D. (2002). Designing the voting system for the Council of the European Union [online]. London: LSE Research Online. Available at: http://eprints.lse.ac.uk/archive/00000649 This is an electronic version of an Article published in Public choice, 113 (3-4). 437 -464 © 2002 Springer. http://springerlink.metapress.com/openurl.asp?genre=journal&issn=0048-5829
http://eprints.lse.ac.uk Contact LSE Research Online at: [email protected]

DESIGNING THE VOTING SYSTEM FOR THE COUNCIL OF THE EUROPEAN UNION
Dennis Leech,
Department of Economics and CSGR, University of Warwick and
Voting Power and Procedures programme, CPNSS, London School of Economics
To be published in Public Choice. Dr D Leech Department of Economics University of Warwick Coventry CV4 7AL UK Phone: (+44)(0)(24)76523047 (direct) (+44)(0)(24)76523027 (messages) 07712353201 (mobile) Fax: (+44)(0)(24)76523032 Email: [email protected] http://www.warwick.ac.uk/fac/soc/Economics/leech/ Acknowledgements: I would like to thank Moshé Machover, Dan Felsenthal and an anonymous referee for advice and comments on this work, which have led to considerable improvements. Any remaining errors remain my responsibility. An earlier version was circulated as a working paper under the title: “Fair Reweighting of the Votes in the EU Council of Ministers and the Choice of Majority Requirement for Qualified Majority Voting During Successive Enlargements”. A preliminary version was presented to a seminar in the Centre for the Study of Globalisation and Regionalisation at Warwick University;I would like to thank all participants for their comments.
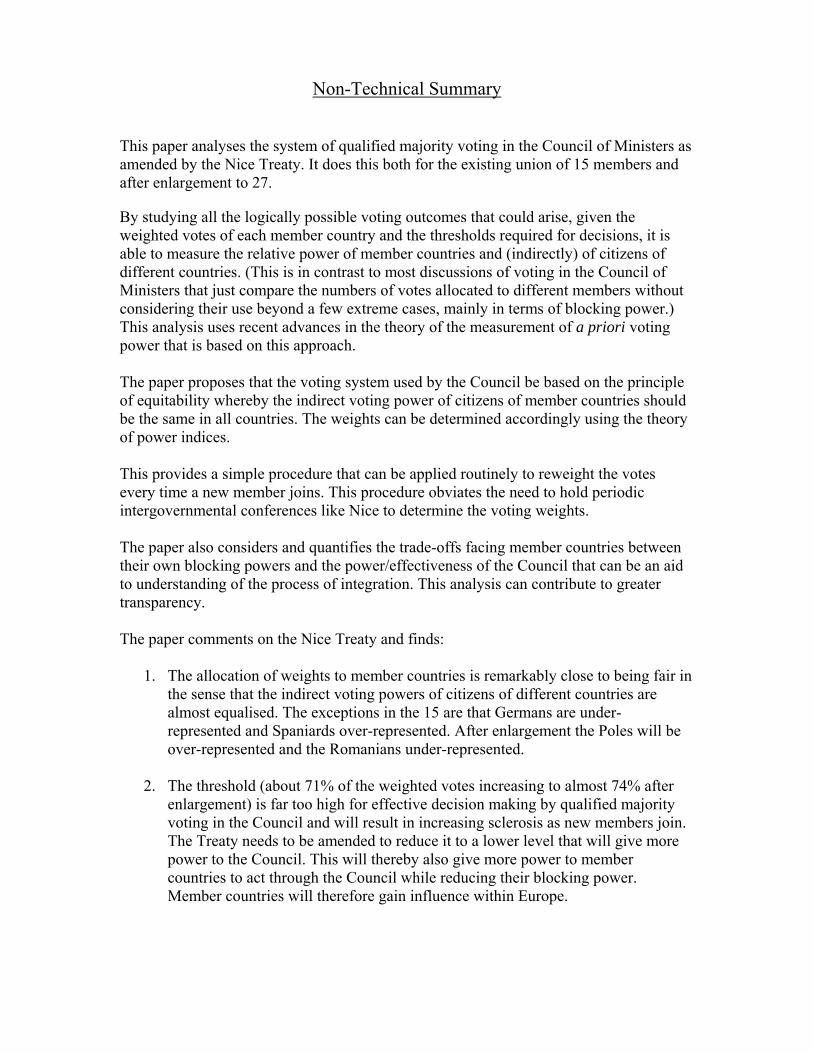
Non-Technical Summary
This paper analyses the system of qualified majority voting in the Council of Ministers as amended by the Nice Treaty. It does this both for the existing union of 15 members and after enlargement to 27.
By studying all the logically possible voting outcomes that could arise, given the weighted votes of each member country and the thresholds required for decisions, it is able to measure the relative power of member countries and (indirectly) of citizens of different countries. (This is in contrast to most discussions of voting in the Council of Ministers that just compare the numbers of votes allocated to different members without considering their use beyond a few extreme cases, mainly in terms of blocking power.) This analysis uses recent advances in the theory of the measurement of a priori voting power that is based on this approach. The paper proposes that the voting system used by the Council be based on the principle of equitability whereby the indirect voting power of citizens of member countries should be the same in all countries. The weights can be determined accordingly using the theory of power indices. This provides a simple procedure that can be applied routinely to reweight the votes every time a new member joins. This procedure obviates the need to hold periodic intergovernmental conferences like Nice to determine the voting weights. The paper also considers and quantifies the trade-offs facing member countries between their own blocking powers and the power/effectiveness of the Council that can be an aid to understanding of the process of integration. This analysis can contribute to greater transparency. The paper comments on the Nice Treaty and finds:
1. The allocation of weights to member countries is remarkably close to being fair in the sense that the indirect voting powers of citizens of different countries are almost equalised. The exceptions in the 15 are that Germans are under-represented and Spaniards over-represented. After enlargement the Poles will be over-represented and the Romanians under-represented.
2. The threshold (about 71% of the weighted votes increasing to almost 74% after enlargement) is far too high for effective decision making by qualified majority voting in the Council and will result in increasing sclerosis as new members join. The Treaty needs to be amended to reduce it to a lower level that will give more power to the Council. This will thereby also give more power to member countries to act through the Council while reducing their blocking power. Member countries will therefore gain influence within Europe.

Abstract Title: Designing the Voting System for the Council of the European Union Author: Dennis Leech Affiliation: Department of Economics and CSGR University of Warwick and Voting Power and Procedures Programme, CPNSS, London School of Economics. Abstract: This paper examines the system of Qualified Majority Voting, used by the Council of the European Union, from the perspective of enlargement of the Union. It uses an approach based on power indices due to Penrose, Banzhaf and Coleman to make two analyses: (1) the question of the voting power of member countries from the point of view of fairness, and (2) the question of how the threshold number of votes required for QMV should be determined. It studies two scenarios for change from 2005 onwards envisaged by the Nice Treaty: (1) no enlargement, the EU comprising 15 member countries, and (2) full enlargement to 27 members by the accession of all the present twelve candidates. The proposal is made that fair weights be determined algorithmically as a technical or routine matter as the membership changes. The analysis of how the threshold affects power shows the trade-offs that countries face between their blocking power and the power of the Council to act. The main findings are: (1) that the weights laid down in the Nice Treaty are close to being fair, the only significant discrepancies being the under-representation of Germany and Romania, and the over-representation of Spain and Poland; (2) the threshold required for a decision is set too high for the Council to be an effective decision making body. Keywords: European Union; Nice Treaty; Qualified Majority Voting; Weighted Voting; Power Indices.
2

1. INTRODUCTION
The prospect of enlargement of the European Union by the accession of new
member countries from Eastern Europe has posed fundamental questions about how its
institutions of governance should change in response. The Intergovernmental Conference
held in Nice in December 2000 was held to address these issues and produce an
agreement on the basic structures of decision making as a framework for enlargement.
However the Nice Treaty has been criticised and should be regarded as only a limited
success.
The main focus of the conference was on the extension of the range of decisions
taken by Qualified Majority Voting in the Council and on the technicalities of how this
system would work from 2005 onwards. There was considerable discussion of how the
weighted votes should be allocated to each member country and what the decision rule
should be in terms of the threshold. The treaty made provision for new weights for the
existing fifteen members and for twelve candidates. It also provided for changes to the
decision rule in terms of the size of the majority required for a proposal to pass. These
changes have been analysed rigorously in terms of a priori voting power by Felsenthal
and Machover (2001b) who concluded that, while the allocation of voting weights is
relatively fair in the sense that the system gives electors in different countries roughly
similar voting power, the threshold agreed on is set too high for the Council to be an
1

effective democratic decision-making body. The present paper builds on that study, partly
duplicating it, but also extending it.1
I investigate the properties of the voting systems laid down in the treaty to apply
both before and after enlargement, duplicating the analysis of Felsenthal and Machover
(2001b). I also consider the normative question of what the voting weights should be in
order that the system is fair. I apply an algorithm for choosing the weights so as to
achieve a given distribution of voting power among the members. This is proposed as a
general procedure that could be applied in a more or less routine manner each time the
membership changes: every time a new member country joins its voting weight can be
calculated, and those of all existing members recalculated, by this algorithm in
accordance with the agreed general criterion of fairness. The Nice Summit was held to
determine the voting weights once and for all so that there would be no need to hold an
Intergovernmental Conference every time new members joined. The general procedure
proposed is an alternative that would have the advantage of giving fair weights in all
cases. I also investigate how the choice of decision rule affects voting power given the
Nice weights.
I address the following specific questions in terms of a priori voting power.
Separate analyses are reported for the Union comprising the existing 15 and after
enlargement to 27.
1 Other studies of voting power in the EU Council of Ministers include Hosli (1993, 1995, 1996, 1998), Widgren (1994), Felsenthal and Machover (1998, 2000), Laruelle and Widgren (1998), Nurmi and Meskanen (1999), Sutter (2000). A recent contribution on the Nice Treaty is Baldwin et al. (2001).
2

(1) What is the distribution of voting power among the member countries given
by the voting system and weights in the Nice Treaty?
(2) How should the weights be chosen if the aim is to ensure that all citizens of
the EU have equal voting power?
(3) What is the effect of the threshold required for a decision by weighted
majority voting on the power of the Council to act and also the powers of
the individual members?
The paper is organised as follows. Section 2 describes the system of Qualified
Majority Voting, and the Nice Treaty is described in Section 3. Section 4 outlines the
measurement of power under weighted voting, using the power indices due to Penrose,
Banzhaf and Coleman. The idea of fair weighting and reweighting is defined and the
algorithmic approach described in Section 5. Section 6 presents the analysis of the
distribution of voting power and the fair weights under the Nice Treaty. Section 7
presents the analysis of the threshold for Qualified Majority Voting and Section 8
concludes.
2. QUALIFIED MAJORITY VOTING
The Council is the most senior decision-making body within the EU under the
Treaty of Rome. It uses different decision rules for different matters, unanimity for
certain matters affecting members’ fundamental sovereignty, but qualified majority
voting for others. Its key features are: (1) that all members have a seat but their respective
3
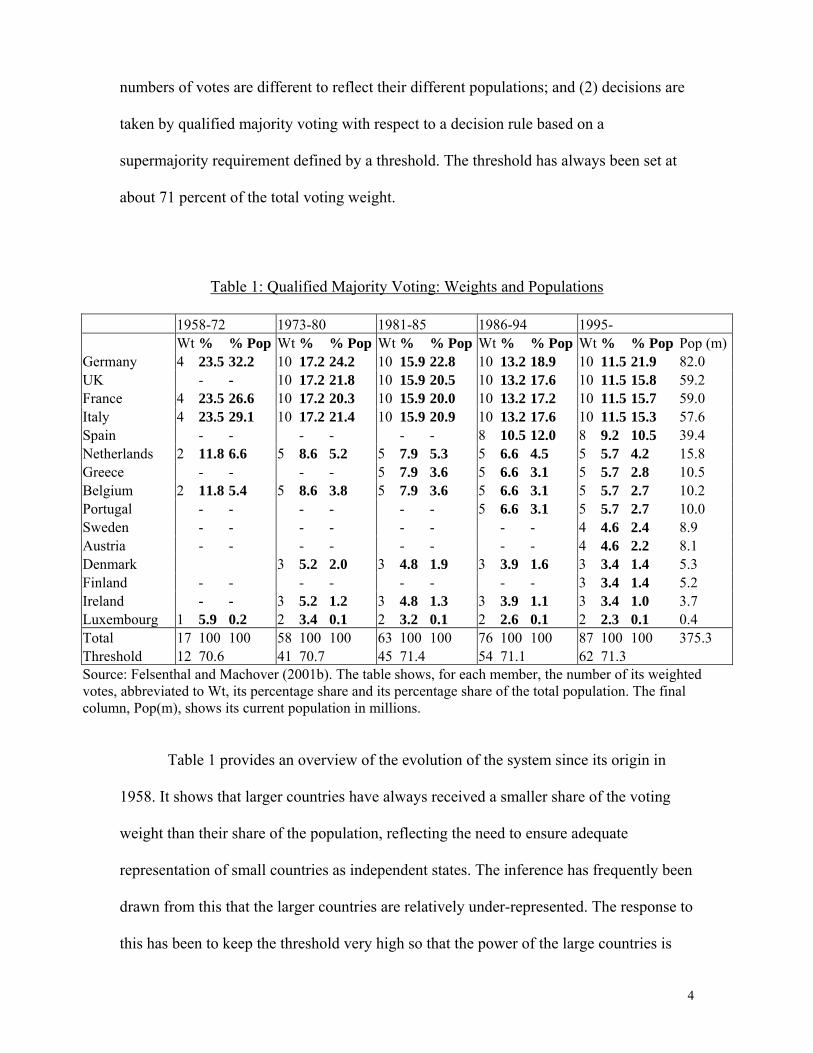
numbers of votes are different to reflect their different populations; and (2) decisions are
taken by qualified majority voting with respect to a decision rule based on a
supermajority requirement defined by a threshold. The threshold has always been set at
about 71 percent of the total voting weight.
Table 1: Qualified Majority Voting: Weights and Populations
1958-72 1973-80 1981-85 1986-94 1995- Wt % % Pop Wt % % Pop Wt % % Pop Wt % % Pop Wt % % Pop Pop (m)Germany 4 23.5 32.2 10 17.2 24.2 10 15.9 22.8 10 13.2 18.9 10 11.5 21.9 82.0 UK - - 10 17.2 21.8 10 15.9 20.5 10 13.2 17.6 10 11.5 15.8 59.2 France 4 23.5 26.6 10 17.2 20.3 10 15.9 20.0 10 13.2 17.2 10 11.5 15.7 59.0 Italy 4 23.5 29.1 10 17.2 21.4 10 15.9 20.9 10 13.2 17.6 10 11.5 15.3 57.6 Spain - - - - - - 8 10.5 12.0 8 9.2 10.5 39.4 Netherlands 2 11.8 6.6 5 8.6 5.2 5 7.9 5.3 5 6.6 4.5 5 5.7 4.2 15.8 Greece - - - - 5 7.9 3.6 5 6.6 3.1 5 5.7 2.8 10.5 Belgium 2 11.8 5.4 5 8.6 3.8 5 7.9 3.6 5 6.6 3.1 5 5.7 2.7 10.2 Portugal - - - - - - 5 6.6 3.1 5 5.7 2.7 10.0 Sweden - - - - - - - - 4 4.6 2.4 8.9 Austria - - - - - - - - 4 4.6 2.2 8.1 Denmark 3 5.2 2.0 3 4.8 1.9 3 3.9 1.6 3 3.4 1.4 5.3 Finland - - - - - - - - 3 3.4 1.4 5.2 Ireland - - 3 5.2 1.2 3 4.8 1.3 3 3.9 1.1 3 3.4 1.0 3.7 Luxembourg 1 5.9 0.2 2 3.4 0.1 2 3.2 0.1 2 2.6 0.1 2 2.3 0.1 0.4 Total 17 100 100 58 100 100 63 100 100 76 100 100 87 100 100 375.3 Threshold 12 70.6 41 70.7 45 71.4 54 71.1 62 71.3 Source: Felsenthal and Machover (2001b). The table shows, for each member, the number of its weighted votes, abbreviated to Wt, its percentage share and its percentage share of the total population. The final column, Pop(m), shows its current population in millions.
Table 1 provides an overview of the evolution of the system since its origin in
1958. It shows that larger countries have always received a smaller share of the voting
weight than their share of the population, reflecting the need to ensure adequate
representation of small countries as independent states. The inference has frequently been
drawn from this that the larger countries are relatively under-represented. The response to
this has been to keep the threshold very high so that the power of the large countries is
4

protected. This has meant that any decision has always required the support of at least
two out of the big four countries (Germany, UK, France and Italy); therefore these
members have had a considerable ability to prevent action.
Such arguments however are based on a simple comparison of population shares
with vote shares and ignore relative voting power. The fact that decisions are taken by
block-voting, each member country casting all its votes together – in contrast to the
European Parliament where MEPs are not constrained to vote as national groups – means
that the relationship between voting power and weight is complex. It is well known that,
in general, in a legislature that uses weighted voting, relative voting powers of members
are different from relative numbers of votes, sometimes substantially so.2 In making this
comparison it is necessary to examine the rules of the legislature in relation to all the
possible voting outcomes that could conceivably occur.
While choosing a high level for the threshold has the advantage of protecting the
large countries against being outvoted too easily, it has the disadvantage that it limits the
effectiveness of the Council by making it difficult, a priori, to make a decision and
therefore imparts a considerable bias in favour of the status quo3. It also restricts the
ability of all members to get their own proposals accepted, including those of the large
members themselves, whose sovereignty it is meant to protect. The choice of the
threshold was on the agenda at the Nice Summit but it was not changed despite the
2 This is described in Felsenthal and Machover (1998). 3 Different terms have been used in the literature for this characteristic of a decision rule which reflects the ease with which it responds to variations in the members’ wishes. Felsenthal and Machover (1998) use the term sensitivity. I use the measure of it due to Coleman (1971) who called it the power of the collectivity to act.
5

substantial extension of the scope of qualified majority voting to cover a greater range of
policy areas.
3. THE TREATY OF NICE
The Nice Treaty amended the system of Qualified Majority Voting to apply from
2005. It laid down the rules of decision making on different scenarios for enlargement.
For each assumed scenario weighted voting is at the heart of the system but two
additional conditions which must also be met have been added, in terms of the number of
countries and population.4 The system should therefore be thought of as one requiring a
triple majority. For a proposal to pass three conditions must be satisfied: (1) the number
of weighted votes equalling or exceeding the threshold; (2) a simple majority of the
member countries; (3) a supermajority (62%) of the population must be represented. In
fact, as Felsenthal and Machover (2001b) have shown, conditions (2) and (3) add little in
that there are very few voting outcomes in which either is not met when (1) is.
Nevertheless I allow for all three conditions in the following analysis.
Two scenarios are assumed for 2005:
(1) No enlargement. No new members have acceded and the EU comprises the
same fifteen countries as at present. The triple-majority system in this case is
4 See EU (2001). The provisions laying down the first scenario are in Article 3 of the Protocol on the Enlargement of the European Union (pp97-8). The second scenario is based on the Declaration on the Qualified Majority Threshold and the Number of Votes for a Blocking Minority in an Enlarged Union (p.167).
6

referred to as N15.5 When I analyse the effect of the threshold I assume
condition (1) only; this decision-making system based on weighted voting is
referred to as W15.
(2) Maximum enlargement. All candidates have joined and the EU has expanded
to 27 members. I refer to this case under the provisions of the treaty as N27,
and the weighted majority system as W27, respectively.
Table 2 shows the member countries together with their voting weights, the
threshold and the decision rule for N15. The big four countries all have 29 votes, 12.2%
of the total, Spain slightly fewer with 27, the Netherlands,13, traditionally the same as,
but now getting slightly more than, Belgium, 12, and so on, finally Luxembourg having
4. This allocation of weights represents a slight shift towards the larger countries
compared with the present weights reported in Table 1. The threshold is set at 169 out of
a total of 237 votes, representing 71.3 percent, the same as before. A decision under N15
therefore requires the support of: (1) at least 169 weighted votes, (2) eight member
countries, and (3) member countries whose combined population is at least 62 percent of
the total.
5 This nomenclature was used by Felsenthal and Machover (2001b). They looked at two variants for the union of 27 members because of ambiguity in the text of the treaty, which they labelled N27 and N´27. The difference is that in the former the threshold is stated as 258 while in the latter the blocking minority is stated as 91, which means that the threshold is lowered to 255. I have ignored this distinction and analysed the second case on the assumption that this is the authoritative version; I have called this case N27.
7

Table 2:N15, No Enlargement
Member Votes Votes %Germany 29 12.2 UK 29 12.2 France 29 12.2 Italy 29 12.2 Spain 27 11.4 Netherlands 13 5.5 Greece 12 5.1 Belgium 12 5.1 Portugal 12 5.1 Sweden 10 4.2 Austria 10 4.2 Denmark 7 3.0 Finland 7 3.0 Ireland 7 3.0 Luxembourg 4 1.7
Total 237 100
Threshold =169 (71.3%) Decision Rule: 1. Combined weight ≥ 169 2. No. of members ≥ 8 3. Population ≥ 62%
Table 3 shows the equivalent data after all the current candidates have been
admitted. The total number of weighted votes is now 345 with the threshold set at 255.
This represents a relative increase in the threshold to 73.9% of the total weighted votes.
Despite this increase in the threshold, however, it is now no longer possible for three of
the big four to block a decision. As I show below, this increase in the threshold cannot be
said to benefit either the Council or the individual member countries concerned.
8
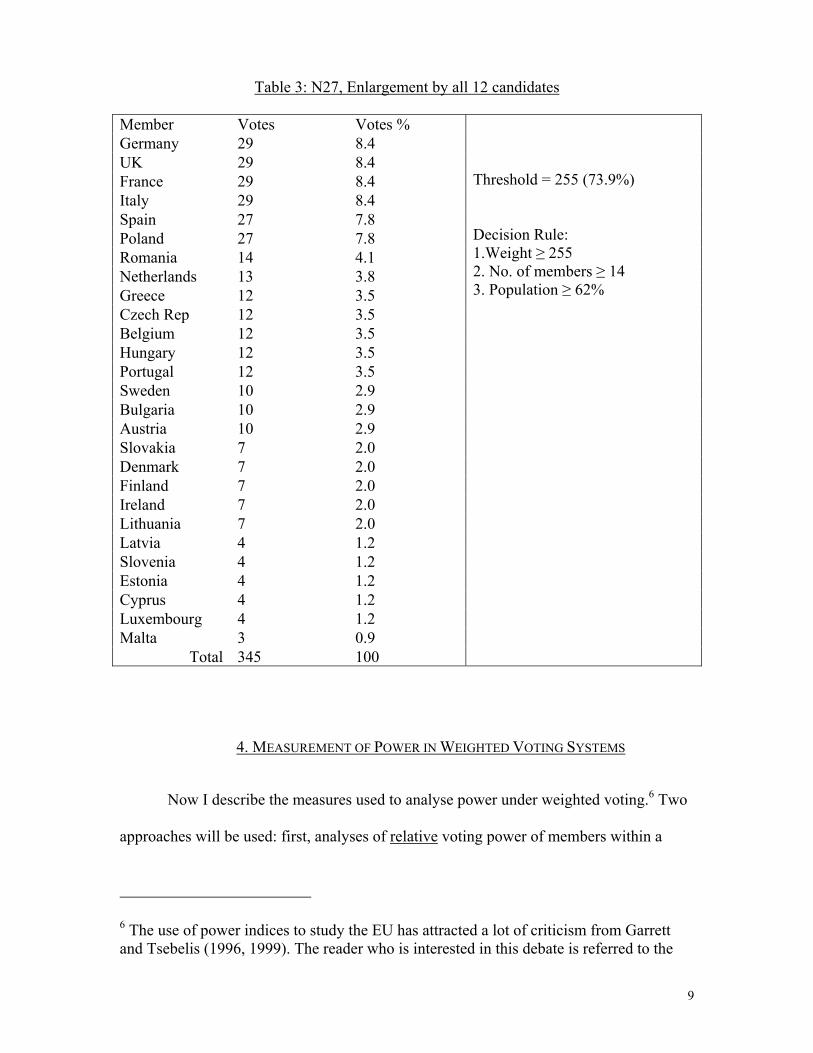
Table 3: N27, Enlargement by all 12 candidates Member Votes Votes % Germany 29 8.4 UK 29 8.4 France 29 8.4 Italy 29 8.4 Spain 27 7.8 Poland 27 7.8 Romania 14 4.1 Netherlands 13 3.8 Greece 12 3.5 Czech Rep 12 3.5 Belgium 12 3.5 Hungary 12 3.5 Portugal 12 3.5 Sweden 10 2.9 Bulgaria 10 2.9 Austria 10 2.9 Slovakia 7 2.0 Denmark 7 2.0 Finland 7 2.0 Ireland 7 2.0 Lithuania 7 2.0 Latvia 4 1.2 Slovenia 4 1.2 Estonia 4 1.2 Cyprus 4 1.2 Luxembourg 4 1.2 Malta 3 0.9
Total 345 100
Threshold = 255 (73.9%) Decision Rule: 1.Weight ≥ 255 2. No. of members ≥ 14 3. Population ≥ 62%
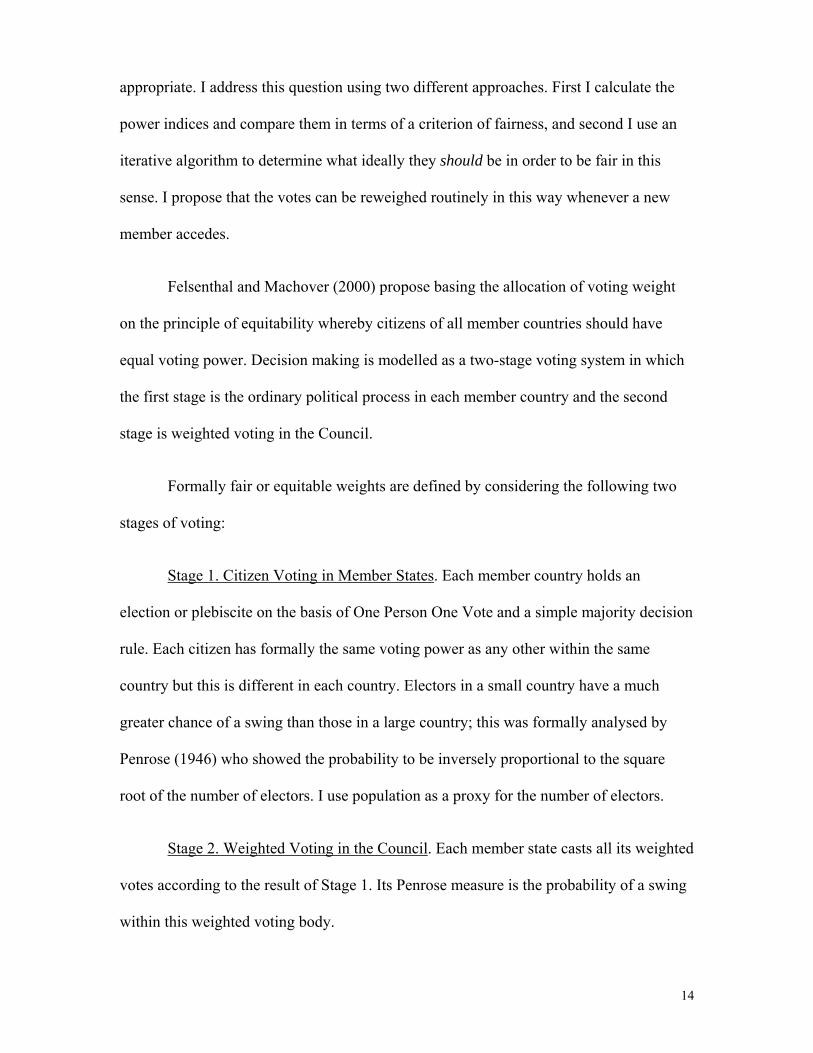
4. MEASUREMENT OF POWER IN WEIGHTED VOTING SYSTEMS
Now I describe the measures used to analyse power under weighted voting.6 Two
approaches will be used: first, analyses of relative voting power of members within a
6 The use of power indices to study the EU has attracted a lot of criticism from Garrett and Tsebelis (1996, 1999). The reader who is interested in this debate is referred to the
9

given legislature using the Banzhaf power index, and second, analyses of absolute voting
power using the Penrose index and three indices proposed by Coleman (the power to act,
the power to prevent action and the power to initiate action).7 The former, relative power
analysis, is useful for making comparisons of a priori voting power between members
within a given voting body defined by weights and decision rule, and also as the basis of a
suitable choice of the weights using the algorithm I will describe below, but useless for
making comparisons between different voting bodies with different weights and decision
rules. On the other hand the absolute measures can be used for such comparisons and in
particular to study the effect of the threshold. First it is necessary to give definitions.
A voting body has n members with voting weights, w1, w2, . . . ,wn and a decision
rule in terms of a threshold, q.8 The set of all members is N. All the indices are based on
counting the number of swings, voting outcomes that can be changed from losing to
winning by members changing how they cast their weighted vote. A particular voting
outcome will be referred to as a division.
A swing for member i is a coalition (corresponding to a division) represented by a
subset of members Si, N ⊃ Si, i ∉Si, such that
wj ∈Si
∑ j < q and j ∈Si
∑ wj + wi ≥ q.
A swing is a coalition where the total votes cast in favour of a particular decision fall
short of the threshold without those of member i, but equal or exceed it when member i symposium in the Journal of Theoretical Politics in 1999, especially Lane and Berg (1999) and to Felsenthal and Machover (2001a). 7 Banzhaf (1965), Penrose (1946), Coleman (1971). 8 It is usual in the theoretical literature to refer to q as the quota. However no confusion will result from retaining the official term, threshold.
10

joins. Let the number of swings for i be ηi and the total number of swings be η = η i∑ .
The total number of divisions, the number of subsets of N, is 2n.
Five measures of power are used, defined as follows.9.
(1) The Penrose Measure for i is the proportion of all possible divisions which are
swings, denoted by πi:
πi = ηi/ 2n-1 i=1,2,..,n
The denominator is the number of possible coalitions among n members which do not
include i, and therefore the maximum number of swings. Finding this for all i provides an
absolute measure of each member’s voting power which is used directly in the analysis of
the threshold and as the basis of the definition of the Banzhaf index below.10
(2) The Banzhaf Index for member i is the member’s relative number of swings, the
normalised version of the Penrose measure, denoted by βi:
βi = ηi/η = πi/Σπj i=1,2,..,n
9 Other power indices than these have been used, in particular the well known index proposed in Shapley and Shubik (1954), which provides a measure of relative voting power often regarded as comparable with the Banzhaf index, but based on a completely different coalition model. The decision not to use the Shapley-Shubik index here is based on two considerations: first it was found not to perform well in a comparison of its empirical properties with those of the Banzhaf index, and second, criticism of its theoretical basis. See Leech (2000a), also Felsenthal and Machover (1998), Coleman (1971). 10 This measure has a number of names. It is often called the Absolute (or Non-Normalised) Banzhaf index, or Banzhaf-Coleman index, most writers emphasising its relation with the Banzhaf index. However, since it was invented by Penrose (Penrose (1946)) and I am arguing that the distinction between a normalised and a non-normalised index is more than a technical detail, it seems sensible to attribute it historically correctly. Felsenthal and Machover (1998) restrict the use of the term "index" to one which is normalised, and refer to this measure as the Banzhaf Measure.
11

This has the property that the indices of all members sum to 1 and can be interpreted as
giving the share of member i in the combined capacity of all members to influence
decisions. This index is used to analyse relative powers of members under the Treaty of
Nice and also as the basis of the approach to the fair choice of weights.
(3) The Power of the Body to Act measures the ease with which members' interests in a
division can be translated into actual decisions. It is denoted by A. The measure is a
property of the voting body itself, rather than any particular member. It is defined as the
proportion of all the theoretically possible divisions that lead to a decision.
A = w/ 2n,
where w is the number of winning divisions (i.e. divisions where the total number of
votes cast for the decision at least equals the threshold). This measure is important when
the decision rule requires a supermajority with a threshold in excess of 0.5.
(4) The Power of a Member to Prevent Action measures the ability of member i to
prevent a decision being taken. It is denoted Pi. It is defined as the proportion of winning
divisions that are swings for i:
Pi = ηi / w i=1,2,..,n.
(5) The Power of a Member to Initiate Action is complementary to this, measuring
member i’s power to get its proposals accepted and is denoted Ii. It is formally defined as
the number of swings for i as a proportion of the total number of divisions that do not
produce a decision without the support of i.
I i = ηi / ( 2n - w) i=1,2,..,n.
12

Both (4) and (5) can be regarded as rescalings of the Banzhaf index or Penrose
measure. They are both identical to the latter when q=0.511, since then there is no
difference between the power to prevent action and the power to initiate action. However
there is a difference where there is a supermajority decision rule, and they are useful in
enabling the analysis to focus on these two different aspects of members’ voting power.
The distinction is especially useful in the present context where discussions surrounding
the choice of the threshold have centred on individual members’ and groups of members’
ability to block decisions.
The relationships among the indices are brought out by noting that we can write
the Penrose measure as:
πi = ηi/ 2n-1 = 2(ηi / w).(w/2n) = 2Pi.A,
and, πi = ηi/ 2n-1 = 2[ηi / ( 2n - w)]. [( 2n - w). /2n] = 2Ii.[1 - A].
Therefore the Penrose measure combines the individual member's power either to prevent
action or to initiate action with the power of the voting body itself to act.12. These
measures are used to compare the properties of different thresholds.
5. FAIR WEIGHTING AND REWEIGHTING
The first main question to be addressed using the measures of voting power
defined in the last section is whether the weights agreed in the Nice Treaty are 11 Strictly q must be slightly greater than 0.5. 12 It is also of interest to note that the Penrose measure πi is the harmonic mean of Ii and Pi: 1/π� = (1/Pi + 1/Ii)/2 (Dubey and Shapley (1979)).
13
appropriate. I address this question using two different approaches. First I calculate the
power indices and compare them in terms of a criterion of fairness, and second I use an
iterative algorithm to determine what ideally they should be in order to be fair in this
sense. I propose that the votes can be reweighed routinely in this way whenever a new
member accedes.
Felsenthal and Machover (2000) propose basing the allocation of voting weight
on the principle of equitability whereby citizens of all member countries should have
equal voting power. Decision making is modelled as a two-stage voting system in which
the first stage is the ordinary political process in each member country and the second
stage is weighted voting in the Council.
Formally fair or equitable weights are defined by considering the following two
stages of voting:
Stage 1. Citizen Voting in Member States. Each member country holds an
election or plebiscite on the basis of One Person One Vote and a simple majority decision
rule. Each citizen has formally the same voting power as any other within the same
country but this is different in each country. Electors in a small country have a much
greater chance of a swing than those in a large country; this was formally analysed by
Penrose (1946) who showed the probability to be inversely proportional to the square
root of the number of electors. I use population as a proxy for the number of electors.
Stage 2. Weighted Voting in the Council. Each member state casts all its weighted
votes according to the result of Stage 1. Its Penrose measure is the probability of a swing
within this weighted voting body.
14
The product of these two probabilities, at Stage 1 and Stage 2, for any member
country, measures the power of one of its citizens, as the probability of his or her
theoretically being able to determine the overall outcome. The principle of fairness
suggests that this measure should be equal for all citizens in all member countries and
therefore voting weights should be allocated such that the power indices of each member
are proportional to the square roots of populations.
Let the population of member state i be denoted by mi. Then the fair weights,
w1*, w2*, . . . , wn*, are determined by the property that the resulting Penrose measures
satisfy
πi = k mi0.5 , for some k>0, i=1,2,…,n.
Let the share of member i in the sum of the square roots of populations be ti. That
is, let ti = mi0.5/ Σmj
0.5, i =1,2,…, n. Then the ti are the target values to which the Banzhaf
indices should be set equal in the distribution of voting weights. This must be done by an
iterative procedure, which entails successively computing the power indices and
reweighting to bring them closer to the target values; iterations continue until
convergence has occurred according to an appropriate stopping rule,13. The algorithm can
be thought of as the determination of a fixed point of a mapping from the unit simplex to
itself.
13 A similar approach has been proposed by Laruelle and Widgren (1998) and used by Sutter (2000). It has also been used in Leech (2000b). The question was discussed by Nurmi (1982).
15

Let it be required that member i should possess a voting power of ti, where
Σ ti =1. The problem is to find weights wi*, w2*, . .., wn* that have associated Banzhaf
indices, βi , such that βi = ti, for all i. For notational simplicity I denote the target, the
weights and corresponding power indices, as functions of the weights, by the n-vectors t,
w and β(w).
Let the weights after d iterations be denoted by the vector w(d), and corresponding
power indices by the vector of functions β(w(d)). The iterative procedure consists of an
initial guess w(0) and an updating rule:
w(d+1) = w(d) + λ(t - β(w(d))) (1)
for some appropriate choice of scalar λ>0.
If power indices are continuous functions of the weights, and (1) is a continuous
point-to-point mapping of a compact convex set into itself; it therefore satisfies the
conditions of the Brouwer fixed point theorem and has a unique fixed point.14 If the
14 The continuity property does not strictly hold for small voting bodies. The Penrose measure is not continuous since it is a rational number and therefore the Banzhaf index is also a rational number. However for large n it seems reasonable to assume that the conditions hold approximately, and that the approximation improves as n increases.
It does not follow from this that a member’s Banzhaf index necessarily increases when it is given more weight; in fact the opposite can occur. Felsenthal and Machover (1998, p 253) call this the “fattening paradox”. It is a property of the normalised power index only and is not shared by the Penrose measure. How serious this is for the algorithm employed in this paper is unclear since the fixed-point theorem on which it is based requires the mapping to be point-to-point, that is to associate a unique vector of power indices with each vector of weights. Then, convergence guarantees finding a fixed point.
16

procedure converges to a vector, w*, then that will be the desired weight vector, since
then:
w*=w* + λ(t - β(w*)) and so t = β(w*).
Convergence can be defined in terms of a measure of the distance between β(w(d))
and t. The simple sum of squares (βi(d)∑ − t i )
2 with a suitable stopping rule has been
found to work well in practice.15 The algorithm is set out graphically in Figure 1.
Figure 1 about here
6. VOTING POWER UNDER THE NICE TREATY
Tables 4 and 5 present the results of applying this approach to the Nice Treaty.16
Table 4 shows the analysis for N15; the same information is displayed graphically in
Figure 2. In the first column after the names of the countries are the weights expressed as
percentages of the total, then the Banzhaf power indices (columns (3) and (4)). The effect
of the 62% population condition is evident from the greater power of Germany than the
other three of the big four despite its having the same weight. It appears from comparing
15 For N15 the algorithm was found to converge to an accuracy, in terms of this criterion, of the order of 10-8, but it was not possible to get full convergence with a smaller value. For N27 it easily converged with respect to a stopping rule of the order of10-10. The power indices were computed exactly using the program ipnice (Leech (2001b)). In Leech (2000b) the same iterative algorithm was used to compute fair weights for the International Monetary Fund Board of Governors with n=178. In this case the power indices were calculated using a different program suitable for large n (described in Leech (2001c)); the accuracy achieved in terms of the sum of squares stopping rule was of the order of 10-17.
16 The computer program used was Leech (2001b).
17

these two columns that the allocation of weights is very close to being proportional: that
is, that weight shares and power indices are almost the same. This can be seen from
Figure 2(a), which shows these numbers for each country against a population scale, and
Figure 2(b), which shows them for each country separately: the graphs for weight and
power almost coincide for every member country.
That a member’s power index is approximately proportional to its share of the
weight does not mean that the weights are fair. Comparing the power indices with their
target values (column (5)) shows that there are some discrepancies from fair weights, in
particular Germans are under-represented and Spaniards over-represented: Germany’s
power index is 12.11% compared with a target of 13.97%, Spain’s power index is
11.11% compared with its target of 9.68%. For all other countries the discrepancy is less
than one percentage point.
18

Table 4: Voting Power in N15 N15 q1=169 q2=62%
(1) (2) (3) (4) (5) (6) (7)Weight Country Weight% Bz Index % √Pop% Fair Weight % Pop%
29 Germany 12.24 12.11 13.97 15.12 21.85829 UK 12.24 11.99 11.87 12.06 15.78629 France 12.24 11.99 11.84 12.05 15.71129 Italy 12.24 11.99 11.70 11.99 15.35027 Spain 11.39 11.11 9.68 9.34 10.49613 Netherlands 5.49 5.50 6.12 5.98 4.19912 Greece 5.06 5.16 5.00 4.64 2.80612 Belgium 5.06 5.16 4.93 4.61 2.72112 Portugal 5.06 5.16 4.87 4.58 2.65910 Sweden 4.22 4.30 4.59 4.47 2.35910 Austria 4.22 4.30 4.38 4.41 2.1537 Denmark 2.95 3.09 3.55 3.22 1.4167 Finland 2.95 3.09 3.50 3.20 1.3757 Ireland 2.95 3.09 2.98 3.03 0.9984 Luxembourg 1.69 1.96 1.01 1.29 0.114
237 100.00 100.00 100.00 100.00 100.00Bz: Banzhaf; q1= the threshold in terms of weighted votes, q2 = the population condition.
Applying the iterative algorithm gives the fair weights, listed in column (6). The
only member countries whose weights change substantially are Germany and Spain:
Germany’s weight has now increased to 15.12 and Spain’s reduced to 9.34 percent of the
votes. These results are shown in Figure 2(a) and 2(b) also.
Figure 2 about here
The equivalent analysis for N27 is presented in Table 5 and Figure 3. A broadly
similar story emerges with power and weight being roughly proportional, although the
discrepancy for the big four countries is now larger, more than half a percentage point.
19

The population condition no longer favours Germany, its power index being the same as
that of the UK, France and Italy.
However these are not fair weights in that Germany is under-represented and both
Spain and Poland are over-represented: Germany has a power index of 7.78% compared
with a target of 9.54%, Spain and Poland have a power index of 7.42% compared with
targets of 6.61% and 6.55%; also Romania is under-represented. Applying the algorithm
to compute the fair weights adjusts these discrepancies (column (6)). The most
substantial changes are that Germany should have 12.21 (instead of 8.41) percent of the
weight, Spain’s and Poland’s weights should be reduced to 6.53 and 6.45 (instead of
7.83) percent and Romania’s increased to 4.74 (instead of 4.06) percent. Some of the
changes for other countries are large in relative terms, compared with their absolute
weight, but they make little difference in absolute terms.
20
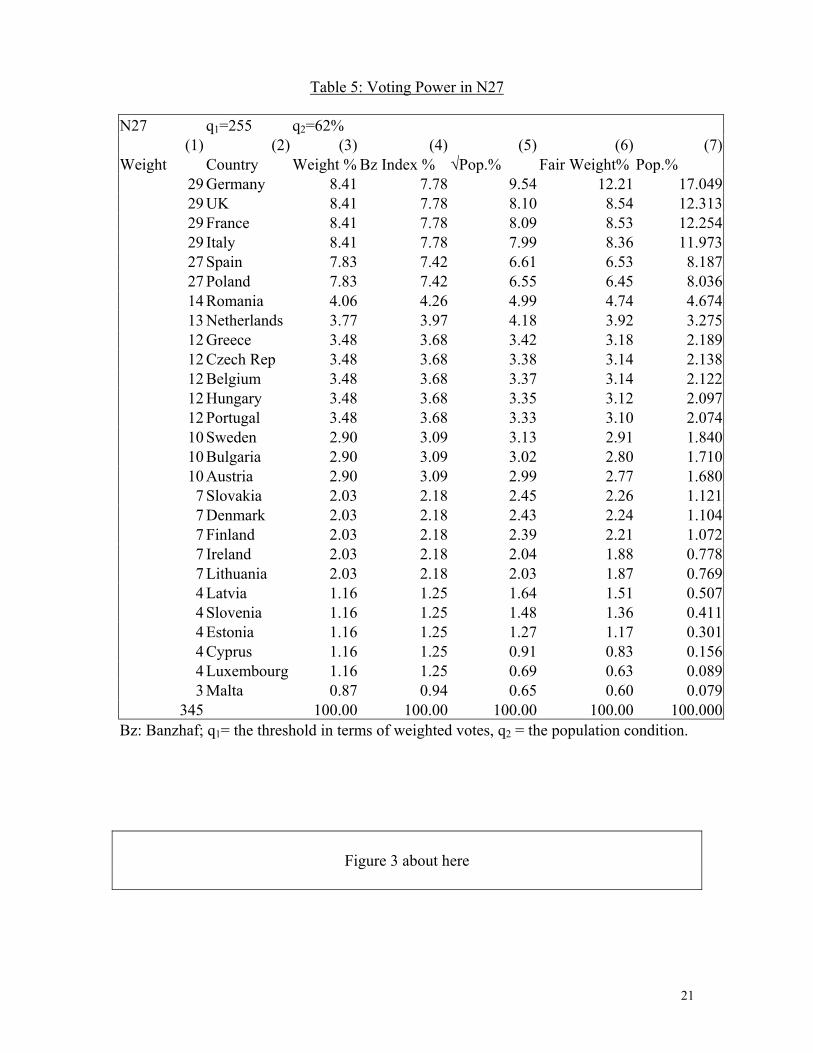
Table 5: Voting Power in N27 N27 q1=255 q2=62%
(1) (2) (3) (4) (5) (6) (7)Weight Country Weight % Bz Index % √Pop.% Fair Weight% Pop.%
29 Germany 8.41 7.78 9.54 12.21 17.04929 UK 8.41 7.78 8.10 8.54 12.31329 France 8.41 7.78 8.09 8.53 12.25429 Italy 8.41 7.78 7.99 8.36 11.97327 Spain 7.83 7.42 6.61 6.53 8.18727 Poland 7.83 7.42 6.55 6.45 8.03614 Romania 4.06 4.26 4.99 4.74 4.67413 Netherlands 3.77 3.97 4.18 3.92 3.27512 Greece 3.48 3.68 3.42 3.18 2.18912 Czech Rep 3.48 3.68 3.38 3.14 2.13812 Belgium 3.48 3.68 3.37 3.14 2.12212 Hungary 3.48 3.68 3.35 3.12 2.09712 Portugal 3.48 3.68 3.33 3.10 2.07410 Sweden 2.90 3.09 3.13 2.91 1.84010 Bulgaria 2.90 3.09 3.02 2.80 1.71010 Austria 2.90 3.09 2.99 2.77 1.6807 Slovakia 2.03 2.18 2.45 2.26 1.1217 Denmark 2.03 2.18 2.43 2.24 1.1047 Finland 2.03 2.18 2.39 2.21 1.0727 Ireland 2.03 2.18 2.04 1.88 0.7787 Lithuania 2.03 2.18 2.03 1.87 0.7694 Latvia 1.16 1.25 1.64 1.51 0.5074 Slovenia 1.16 1.25 1.48 1.36 0.4114 Estonia 1.16 1.25 1.27 1.17 0.3014 Cyprus 1.16 1.25 0.91 0.83 0.1564 Luxembourg 1.16 1.25 0.69 0.63 0.0893 Malta 0.87 0.94 0.65 0.60 0.079
345 100.00 100.00 100.00 100.00 100.000Bz: Banzhaf; q1= the threshold in terms of weighted votes, q2 = the population condition.
Figure 3 about here
21

7. THE EFFECT OF THE CHOICE OF THRESHOLD
The analysis so far has been in terms of the relative voting power of each member
country within a given decision-making system, defined by a particular threshold, and no
consideration has been given to what that ought to be. For N15 q was equal to 71.3%, and
for N27, 73.9%. Now in this section the decision rule becomes the main focus of the
analysis and I invesitgate its effect using the power indices due to Coleman as well as the
Penrose measure. I allow the decision rule as determined by the value of q to vary over its
entire feasible range from a simple majority, q=50 %, to unanimity, q=100%. In order to
define the problem to be analysed clearly, I assume qualified majority voting in terms of
a single decision rule, for the two scenarios that have been previously defined as W15
and W27, with the weights fixed in the Nice Treaty.17
The analysis of this section uses member countries’ powers to prevent action, Pi,
and to initiate action,Ii, as properties of the voting system, reflecting countries’
sovereignty, to interpret the effects of varying q. It also shows how the power to act of
the Council itself, A, is affected. An important feature of this approach is that it allows
us to study the tradeoff between members’ powers to prevent action and the power of the
Council to act, which is at the heart of the political development of the European Union.
17. This means that for this purpose the other two conditions in N15 and N27 (a majority of countries and 62% of the population) are ignored. The reason for doing this is that, if the threshold for weighted voting is varied, there seems no particular reason not to vary the population threshold also and investigate whether its optimal value is 62%The analysis could just as easily be done for N15 and N27. In any case the power indices for W15 and W27 are almost identical to those for N15 and N27.
22

The results for W15 are presented first, in Figure 4.18 Figure 4(a) shows the effect
of the threshold on the power of the Council to act. Its maximum value is 0.5 when
q=50% and its minimum value 2-15 = 3.05E-5 when q=100%. It is clear that the value of q
set by the Nice Treaty makes it very difficult to make a decision in the Council, its power
to act when q=71.3% being only 0.0826. This means that only 8.26% of divisions, a
priori, would result in a decision. Therefore there is a very strong conservative bias.
Figure 4 about here
Figure 4(b) shows how the threshold affects the powers of members to prevent
action, their capacities to block initiatives they do not like. Not surprisingly it increases
monotonically for all countries as q increases until it reaches a maximum of 1 when
q=100 and all members have a veto. For q=71.3% all members have a substantial power
to prevent action: for each of Germany, the UK, France and Italy it is 0.735 (one of the
big four countries can block 73.5% of divisions), for Netherlands 0.342, and even for the
smallest member Luxembourg it is 0.125. Figure 4(c) shows the equivalent diagram for
the power to initiate action. This measure of power falls very rapidly indeed for every
member as q increases, showing that blocking power is bought at a high price in terms of
loss of influence. Figure 4(d) shows the Penrose power measure, πi, against q. It confirms
that all members, most significantly the largest countries, suffer a loss of influence, in
choosing too high a threshold.
Figure 5 shows the equivalent analysis for W27. The findings are substantially the
same: Figure 5(a) shows the power to act falls very rapidly as q increases, reaching 10%
18 The results of this section were obtained using the computer program Leech (2001a).
23

when q=65%. The effect of the Nice Treaty, which set q=73.9%, is even worse for this
case, with the power to act falling to as low as 0.02: only 2% of divisions a priori lead to
a decision. The diagrams showing the powers of member countries to prevent action,
Figure 5(b), to initiate action, Figure 5(c), and Penrose voting power, Figure 5(d), give
similar results to those for N15. Thus, again, the conclusion is that choosing too high a
value of q is counterproductive to a member country’s own sovereignty within the EU.
Figure 5 about here
Figures 6 and 7 show the same information for W15 and W27 as relationships
between member countries’ own absolute power measures and the power of the Council
to act as q varies. These diagrams make explicit the tradeoffs involved in qualified
majority voting. Figure 6(a) plots the power to prevent action for each member against
the power of the Council to act. There would seem to be a fairly strong tradeoff for the
largest five countries showing how much of their own blocking power they must give up
in order to create an effective Council. Figure 6(b) shows a very direct relationship
between the power to initiate action of each member and the power to act. Figure 6(c)
shows the relationships between the Penrose powers of members and the Council’s power
to act. Again there is a direct relationship in every case suggesting that member countries
have greater influence through higher power of the Council to act. Figure 7 shows the
same analyses for W27, leading to the similar conclusions.
Figures 6 and 7 about here
24

8. CONCLUSIONS
This paper has reported on a study of the system of Qualified Majority Voting in
the Council of the European Union using the methods of a priori voting power analysis.
The perspective of the study has been that of an enlarging union to which new members
accede from time to time, as envisaged in the Treaty of Nice to apply from 2005.
Two investigations have been carried out. First, a study of weighted voting using
the Banzhaf power index aimed at discovering if the allocation of weights between
member countries is fair in a relative sense. Fair weights are defined to be such as to
equalise voting power of citizens in all member countries. Second, a study of the effects
of varying the threshold both on the measures of absolute power of each member country
and the power to act of the Council itself. For each investigation two extreme scenarios
have been considered as envisaged by the Treaty: the union of 15, no new members
having acceded, and the maximum expansion, with 12 candidates having joined.
From the perspective of enlargement considered in general terms, it is proposed
that fair weights could be determined as a routine or simply technical matter, by means of
an algorithm, for any changes to the membership that may occur. This is applied to the
two extreme scenarios considered.
The findings of the analysis of fair weights are: first, that the weights laid down
by the Nice Treaty are approximately proportional to the voting power they represent;
second, that they are close to being fair for most members; third, that German and
Romanian citizens will be under-represented, Spanish and Polish citizens over-
represented.
25

The results of the analysis of the threshold are: first, that the power of the Council
to act will be very small because of the high level at which the threshold has always been
set (about 71%) and will continue to be set unless the treaty is amended; second, the
Treaty’s provision to raise it to almost 74% when many new members join makes this
aspect considerably worse; third, there is a trade-off between individual member
countries’ blocking powers and the power of the Council to act, but a direct relation
between a country’s overall measure of power and the power of the Council to act. The
main conclusion of this analysis is that decision making within the Council of the
European Union is likely to remain rigid because of members’ being overly concerned
with their own blocking powers, and for this to get worse with every enlargement.
REFERENCES
Baldwin, R.E., E.Berglof, F. Giavazzi and M. Widgren (2001), Nice Try: Should the Treaty of Nice be Ratified?, Monitoring European Integration 11. London: Centre for Economic Policy Research, June.
Banzhaf, John F (1965), “Weighted Voting Doesn’t Work: A Mathematical Analysis”, Rutgers Law Review, vol 19, 1965, 317-343
Coleman, Jam S.(1971), “Control of Collectivities and the Power of a Collectivity to Act,” in B. Lieberman, (ed.), Social Choice, pp 277-287; New York, Gordon and Breach.
Dubey, P. and L.S.Shapley (1979), “The Mathematical Properties of the Banzhaf Index”, Mathematics of Operations Research, vol 4, 99-131.
EU (2001), Treaty of Nice Amending the Treaty of the European Union, the Treaties Establishing the European Communities and Certain Related Acts, EU Document CONFER 4820/00 28 February.
Felsenthal, Dan S. and M. Machover (1998), The Measurement of Voting Power: Theory and Practice, Problems and Paradoxes; Cheltenham: Edward Elgar.
26

------------------------- (2000), Enlargement of the EU and Weighted Voting in its Council of Ministers, London: London School of Economics and Political Science, Centre for Philosophy of Natural and Social Science, VPP 01/00, http://www.lse.ac.uk/votingpower.
--------------------------- (2001a), “Myths and Meanings of Voting Power: Comments on a Symposium”, Journal of Theoretical Politics, 13(1),81-97.
---------------------------(2001b), “The Treaty of Nice and Qualified Majority Voting”, Social Choice and Welfare, 19, 3, 465-83.
Garrett, G. and G. Tsebelis (1996), "An Institutional Critique of Intergovernmentalism," International Organization, 1996, 50: 269-99.
------------ (1999) “Why Resist the Temptation of Power Indices in the EU” and “More Reasons to Resist the Temptation of Power Indices in the EU”, Journal of Theoretical Politics, 11 (3), 291-308 and 331-8.
Hosli, M. (1993), "The Admission of the European Free Trade Association States to the European Community: Effects on Voting Power in the European Community Council of Ministers," International Organization, 47, 629-43.
Hosli, M. (1995), ”The Balance between Small and Large: Effects of a Double-Majority System on Voting Power in the European Union”, International Studies Quarterly, 39, 351-70.
Hosli, M. (1996), “Coalitions and Power: Effects of Qualified Majority Voting in the Council of the European Union”, Journal of Common Market Studies, 34, 2, 255-73.
Hosli, M. (1998), An Institution’s Capacity to Act: What are the Effects of Majority Voting in the Council of the EU and the European Parliament?, Current European Issues; Maastricht, European Institute of Public Administration.
Lane. Jan-Erik and Sven Berg (1999), "Relevance of Voting Power", Journal of Theoretical Politics, 1999, vol. 11, no. 3, 309-19.
Laruelle, Annick and Mika Widgren (1998), “Is the Allocation of Voting Power among EU States Fair?”, Public Choice, 94, 317-339.
Leech, D. (2000a), "An Empirical Comparison of the Performance of Classical Power Indices," Warwick Economic Research Papers, No. 563, University of Warwick, August, Political Studies, forthcoming.
------------ (2000b), “Voting Power and the Governance of the International Monetary Fund,” CSGR Working Paper No. 68/01, Centre for the study of Globalisation and Regionalisation, University of Warwick, December 2000; forthcoming in Annals of Operations Research, special issue on Game Practice.
27

------------(2001a), ipexact: A Computer Program for Computing Measures of Power in a Weighted Voting Body, Department of Economics, University of Warwick.
------------(2001b), ipnice: A Computer Program for the Analysis of Qualified Majority Voting Power under the Treaty of Nice, Department of Economics, University of Warwick.
------------ (2001c), "Computing Power Indices for Large Weighted Voting Games", Warwick Economic Research Papers, Number 579 (revised January 2001).
Nurmi, H.(1982), "The Problem of the Right Distribution of Voting Power", in M.J.Holler (ed.) Power, Voting and Voting Power, 1982; Würzburg, Physica.
Nurmi, H. and T. Meskanen (1999), “A Priori Power Measures and the Institutions of the European Union”, European Journal of Political Research, 35 (2), 161-79.
Owen, Guillermo (1995), Game Theory, (3rd Edition); San Diego, Academic Press.
Penrose, L.S. (1946), "The Elementary Statistics of Majority Voting", Journal of the Royal Statistical Society, 109, 53-57.
Shapley, L. S. and M. Shubik (1954), “A Method for Evaluating the Distribution of Power in a Committee System,” American Political Science Review, 48, 787-792.
Sutter, Matthias (2000) “Fair Allocation and Re-weighting of Votes and Voting Power in the EU Before and After the Next Enlargement”, Journal of Theoretical Politics, 12(4),433-449.
Widgren (1994), “Voting Power in the EU and the Consequences of Two Different Enlargements”, European Economic Review, 38, 1153-70.
28

Figure 1:Flowchart of an Iterative Algorithm to Determine Weights
Update Weights:
wi = wi + λ(ti - βi), i=1,n
Test Convergence:
Is |βi - ti|<ε ∀ i? Stop
No
Yes
Calculate Power Indices:
β� = β�(w1, w2, ... , wn)
Input Data:
Targets ti Initial Weights wi i=1,n
29

Figure 2(a): N15 Weight, Power and Fair Weight by Population
0.00
2.00
4.00
6.00
8.00
10.00
12.00
14.00
16.00
0 1 2 3 4 5 6 7 8 9 10 11 12 13 14 15 16 17 18 19 20 21 22 23
Population %
Weight%Bz Index %ÃPop%Fair Weight %
Figure 2(b): N15 Weight, Power and Fair Weight by Country ÊÊ
0.00
5.00
10.00
15.00
20.00
GERMANY UK
FRANCE
ITALY
SPAIN
NETHERL
GREECE
BELGIUM
PORTUGAL
SWEDEN
AUSTRIA
DENMARK
FINLAND
IRELAND
LUXEMB
%
Weight%Bz Index %ÃPop%Fair Weight % Pop%
30

Figure 3(a): N27 Weight, Power and Fair Weight by Population ÊÊ
0.00
2.00
4.00
6.00
8.00
10.00
12.00
14.00
0 1 2 3 4 5 6 7 8 9 10 11 12 13 14 15 16 17 18
Population %
Weight %Bz Index % ÃPop.%Fair Weight%
Figure 3(b): N27 Weight, Power and Fair Weight by Country
0.00
5.00
10.00
15.00
GER
MA
NY
UK
FRA
NC
E
ITA
LY
SPA
IN
POLA
ND
RO
MA
NIA
NET
HER
L
GR
EEC
E
CZE
CH
REP
BEL
GIU
M
HU
NG
AR
Y
POR
TUG
AL
SWED
EN
BU
LGA
RIA
AU
STR
IA
SLO
VA
KIA
DEN
MA
RK
FIN
LAN
D
IREL
AN
D
LITH
UA
NI
LATV
IA
SLO
VEN
IA
ESTO
NIA
CY
PRU
S
LUX
EMB
MA
LTA
%
Weight %Bz Index % ÃPop.%Fair Weight% Pop.%
31

Figure 4(b): W15 Effect of the Threshold q on Power to Prevent Action ÊÊÊ
0
0.2
0.4
0.6
0.8
1
50% 60% 70% 80% 90% 100%
Threshold q (%)
GER,UK,FR,ITSPAIN NETHERL GR,BEL,PORTSW,AUSDEN,FIN,IRELUXEMB
71.3 = 169/237
Figure 4(a): W15 Effect of the Threshold on the Council's Power to Act ÊÊÊ
0
0.1
0.2
0.3
0.4
0.5
50% 60% 70% 80% 90% 100%
Threshold q (%)71.3
32

Figure 4(c): W15 Effect of the Threshold q on Power to Initiate Action ÊÊ
0
0.1
0.2
0.3
0.4
50% 60% 70% 80% 90% 100%
Threshold q (%)
GER,UK,FR,ITSPAIN NETHERL GR,BEL,PORTSW,AUSDEN,FIN,IRELUXEMB
71.3
Figure 4(d): W15 Effect of the Threshold q on the Penrose Measure, π'ÊÊÊ
0
0.1
0.2
0.3
0.4
50% 60% 70% 80% 90% 100%
Threshold q (%)
GER,UK,FR,ITSPAIN NETHERL GR,BEL,PORTSW,AUSDEN,FIN,IRELUXEMB
71.3
33
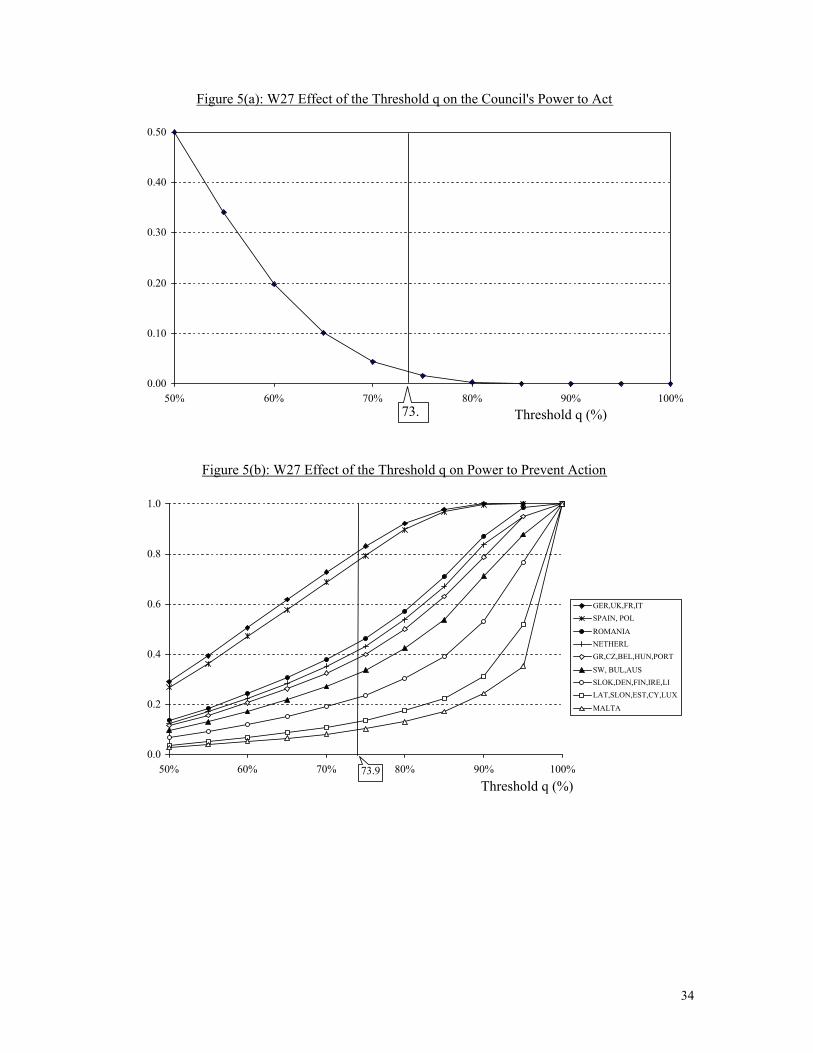
Figure 5(a): W27 Effect of the Threshold q on the Council's Power to Act
0.00
0.10
0.20
0.30
0.40
0.50
50% 60% 70% 80% 90% 100%Threshold q (%)73.
Figure 5(b): W27 Effect of the Threshold q on Power to Prevent Action
0.0
0.2
0.4
0.6
0.8
1.0
50% 60% 70% 80% 90% 100%Threshold q (%)
GER,UK,FR,ITSPAIN, POL
ROMANIA NETHERL GR,CZ,BEL,HUN,PORT
SW, BUL,AUSSLOK,DEN,FIN,IRE,LILAT,SLON,EST,CY,LUX
MALTA
73.9
34

Figure 5(c): W27 Effect of the Threshold q on Power to Initiate ActionÊÊÊ
0.00
0.05
0.10
0.15
0.20
0.25
0.30
50% 60% 70% 80% 90% 100%Threshold q (%)
GER,UK,FR,ITSPAIN, POL ROMANIA NETHERL GR,CZ,BEL,HUN,PORT SW, BUL,AUSSLOK,DEN,FIN,IRE,LILAT,SLON,EST,CY,LUX MALTA
73.9
Figure 5(d): W27 Effect of the Threshold q on the Penrose Power Measure πi
ÊÊÊ
0.00
0.05
0.10
0.15
0.20
0.25
0.30
0.35
50% 60% 70% 80% 90% 100%Threshold q (%)
GER,UK,FR,ITSPAIN, POL ROMANIA NETHERL GR,CZ,BEL,HUN,PORT SW, BUL,AUSSLOK,DEN,FIN,IRE,LILAT,SLON,EST,CY,LUX MALTA
73.9
35

Figure 6(a): W15 Power to Prevent Action versus Power of the Council to Ac
0
0.2
0.4
0.6
0.8
1
0 0.05 0.1 0.15 0.2 0.25 0.3 0.35 0.4 0.45 0.5
Power of the Council to Act
GER,UK,FR,ITSPAIN NETHERL GR,BEL,PORTSW,AUSDEN,FIN,IRELUXEMB
0.0822
Figure 6(b): W15 Power to Initiate Action versus Power of the Council to Act
0
0.05
0.1
0.15
0.2
0.25
0.3
0.35
0 0.05 0.1 0.15 0.2 0.25 0.3 0.35 0.4 0.45 0.5
Power of the Council to Act
Pow
er to
Initi
ate
Act
ion
GER,UK,FR,ITSPAIN NETHERL GR,BEL,PORTSW,AUSDEN,FIN,IRELUXEMB
0.0822
36
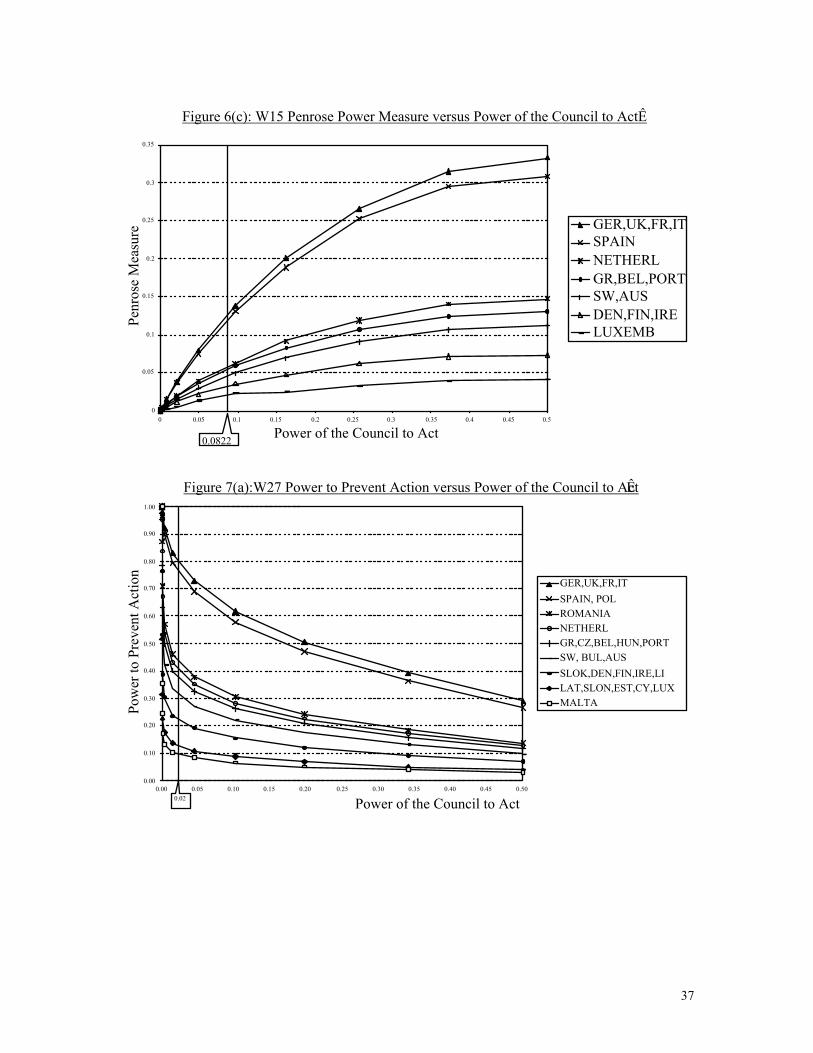
Figure 6(c): W15 Penrose Power Measure versus Power of the Council to ActÊ
0
0.05
0.1
0.15
0.2
0.25
0.3
0.35
0 0.05 0.1 0.15 0.2 0.25 0.3 0.35 0.4 0.45 0.5
Power of the Council to Act
Penr
ose
Mea
sure GER,UK,FR,IT
SPAIN NETHERL GR,BEL,PORTSW,AUSDEN,FIN,IRELUXEMB
0.0822
Figure 7(a):W27 Power to Prevent Action versus Power of the Council to ActÊ
0.00
0.10
0.20
0.30
0.40
0.50
0.60
0.70
0.80
0.90
1.00
0.00 0.05 0.10 0.15 0.20 0.25 0.30 0.35 0.40 0.45 0.50
Power of the Council to Act
Pow
er to
Pre
vent
Act
ion
GER,UK,FR,ITSPAIN, POL ROMANIA NETHERL GR,CZ,BEL,HUN,PORT SW, BUL,AUSSLOK,DEN,FIN,IRE,LILAT,SLON,EST,CY,LUX MALTA
0.02
37

Figure 7(b): W27 Power to Initiate Action versus the Council's Power to ActÊÊÊÊÊ
0.00
0.05
0.10
0.15
0.20
0.25
0.30
0.00 0.05 0.10 0.15 0.20 0.25 0.30 0.35 0.40 0.45 0.50
Power of the Council to Act
Pow
er to
Initi
ate
Act
ion
GER,UK,FR,ITSPAIN, POL ROMANIA NETHERL GR,CZ,BEL,HUN,PORT SW, BUL,AUSSLOK,DEN,FIN,IRE,LILAT,SLON,EST,CY,LUX MALTA
0.0
Figure 7(c): W27 Penrose Measure versus Power of the Council to Act
0.00
0.05
0.10
0.15
0.20
0.25
0.00 0.05 0.10 0.15 0.20 0.25 0.30 0.35 0.40 0.45 0.50
Power of the Council to Act
GER,UK,FR,IT
SPAIN, POL
ROMANIA
NETHERL
GR,CZ,BEL,HUN,PORT SW, BUL,AUS
SLOK,DEN,FIN,IRE,LI
0.02
0.30
38