Embed Size (px)
Citation preview

Designing Efficient Engines: Strategies Based Th d ion Thermodynamics
Jerald A. CatonTexas A&M UniversityCollege Station, TX
for
CRC Advanced Fuel & Engine Efficiency WorkshopCRC Advanced Fuel & Engine Efficiency Workshop
Hyatt Regency Baltimore Inner Harbor
Baltimore, MD
25 February 2014

Designing Efficient Engines: Strategies Based on ThermodynamicsThermodynamics
INTRODUCTION AND BACKGROUND
Insights from Thermodynamics
DESCRIPTION OF THE CYCLE SIMULATION
ENGINE AND OPERATING CONDITIONSENGINE AND OPERATING CONDITIONS
RESULTS AND DISCUSSION
Overall Results – Efficiencies
Parametric Results (extra)
Thermodynamics
Nit i O id R lt ( t )Nitric Oxide Results (extra)
Exergy Destruction (extra)
• SUMMARY AND CONCLUSIONS• SUMMARY AND CONCLUSIONS

INTRODUCTION AND BACKGROUND
-- Importance of Thermodynamics --
Often overlooked in discussions of engines Often overlooked in discussions of engines
Rich and long history related to engine developments
An IC engine is not a heat engine: not limited by Carnot efficiency
Combustion devices are subject to exergy destruction
IC engine design for high efficiency can be guided by g g g y g yunderstanding the thermodynamics
3

INTRODUCTION AND BACKGROUND
The importance of thermodynamics is demonstrated by comparing a conventional and high efficiency engine
Efficiency increases due to CR, lean operation and the use of EGR – what is the contribution of each?
What are the thermodynamic reasons for the increases of efficiency?increases of efficiency?
Not all items will be obvious or measureable.

THERMODYNAMIC ENGINE CYCLE SIMULATION
Features/Considerations:1. One common pressure2. Three gas temperatures3 Three volumes and masses
5
3. Three volumes and masses4. Separate heat transfer

PROCEDURES FOR SOLUTIONS
• ORDINARY DIFFERENTIAL EQUATIONSNUMERICAL TECHNIQUES EULERS• NUMERICAL TECHNIQUES: EULERS
• INITIAL CONDITIONS: T1, p1, Residual Fraction• BOUNDARY CONDITIONS: INLET & EXHAUST• SPECIFY SUBMODEL PARAMETERS:
- Thermodynamic properties (Heywood, 1988)- Heat transfer coefficient (Hohenberg, 1979; Chang et al., 2004)( g g )- Friction (Sandoval and Heywood, 2003)- Fuel mass rates- Flow rate parameters- Exergy and second law considerations- Nitric oxide kinetics (Dean and Bozzelli, 2000)- Other
6

SPECIFICATIONS FOR THE ENGINESPECIFICATIONS FOR THE ENGINE
PARAMETER VALUEEngine Automotive, V-8Bore/Stroke 102/88 mm (4.0/3.5 in)Displacement 5.7 liter (350 in3)bmep 900 kPaEngine speed 2000 rpmC b i i i MBTCombustion timing MBTGeometric compression ratio from 8:1 to 16:1Valve arrangement OHV 2 valves/cylinder
7
Valve arrangement OHV, 2 valves/cylinder

TWO ENGINE OPERATINGTWO ENGINE OPERATING CONDITIONS:
CONVENTIONAL CONVENTIONAL
HIGH EFFICIENCY
8

Operating Conditions
Parameter Conventional High Efficiencybmep (kPa) 900 900Speed (rpm) 2000 2000
CR 8 16burn 60° 30° 1 0 0 7 1.0 0.7
EGR (%) 0 45p (kPa) 92 170pinlet (kPa) 92 170pexh (kPa) 105 180
Timing MBT MBT
9
Timing MBT MBT

RESULTSRESULTS Overall efficiency gains
Comparison to experimentsp p
Contributions to efficiency increasey
Thermodynamic insightsy g
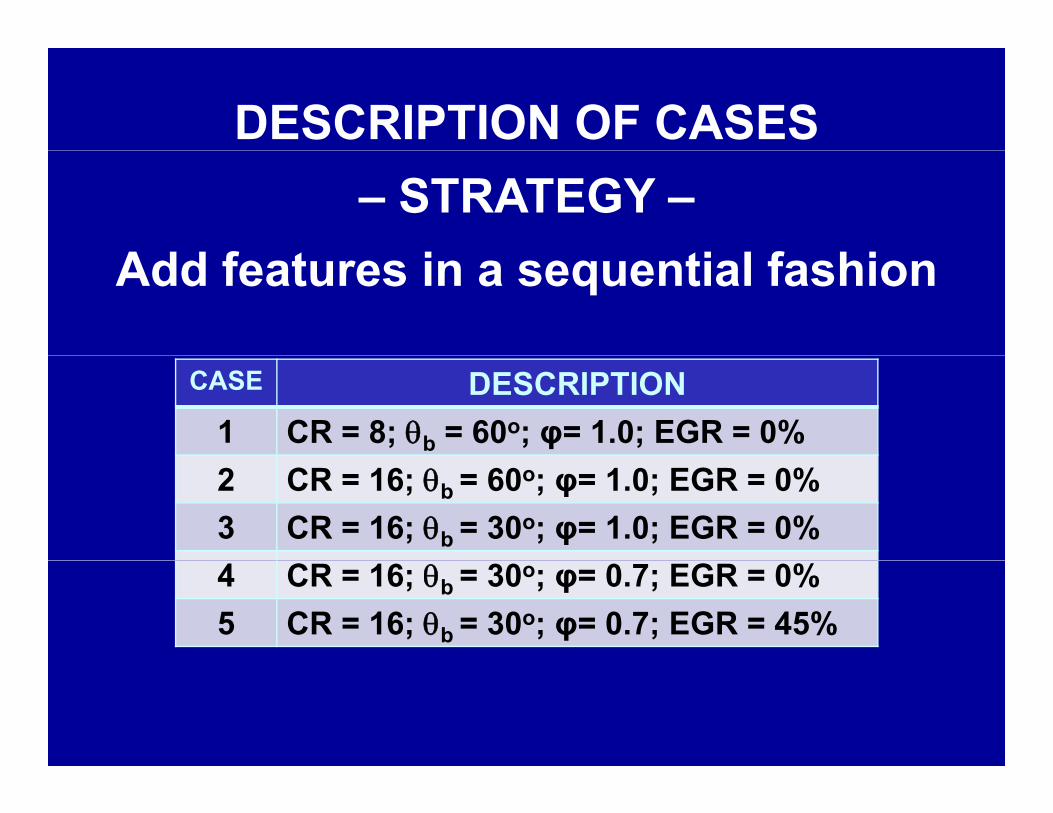
DESCRIPTION OF CASES– STRATEGY –
Add f t i ti l f hiAdd features in a sequential fashion
CASE DESCRIPTION1 CR = 8; b = 60o; φ= 1.0; EGR = 0%2 CR = 16; b = 60o; φ= 1.0; EGR = 0%3 CR = 16; b = 30o; φ= 1.0; EGR = 0%4 CR = 16; b = 30o; φ= 0.7; EGR = 0%5 CR = 16; b = 30o; φ= 0.7; EGR = 45%

Overall Efficiency (1/5)
Base60
bmep = 900 kPa2000 rpm
MBT Ti iPumpingLosses
60bmep = 900 kPa
2000 rpmMBT Ti i
PumpingLosses
cien
cy (%
)
50
55 MBT Timing
Gross IndicatedEfficiency
Losses
MechanicalFrictionci
ency
(%)
50
55 MBT Timing
Gross IndicatedEfficiency
Losses
MechanicalFriction
d B
rake
Effi
c
45Net Indicated
EfficiencyBrake
Efficiency
Friction
d B
rake
Effi
c
45Net Indicated
EfficiencyBrake
Efficiency
Friction
ndic
ated
and
35
40
5%ndic
ated
and
35
40
5%In
30
35
BAS
E
CR
= 1
6
b =
30o
=
0.7
EGR
= 4
5In
30
35
BAS
E
CR
= 1
6
b =
30o
=
0.7
EGR
= 4
5
Case
1 2 3 4 5
Case
1 2 3 4 5

Overall Efficiency (2/5)
Base60
bmep = 900 kPa2000 rpm
MBT Ti iPumpingLosses
60
bmep = 900 kPa2000 rpm
MBT Ti iPumpingLosses
Increase CR to 16
cien
cy (%
)
50
55 MBT Timing
Gross IndicatedEfficiency
Losses
MechanicalFrictionci
ency
(%)
50
55 MBT Timing
Gross IndicatedEfficiency
Losses
MechanicalFriction
d B
rake
Effi
c
45Net Indicated
EfficiencyBrake
Efficiency
Friction
d B
rake
Effi
c
45Net Indicated
EfficiencyBrake
Efficiency
Friction
ndic
ated
and
35
40
5%ndic
ated
and
35
40
5%In
30
35
BAS
E
CR
= 1
6
b =
30o
=
0.7
EGR
= 4
5In
30
35
BAS
E
CR
= 1
6
b =
30o
=
0.7
EGR
= 4
5
Case
1 2 3 4 5
Case
1 2 3 4 5

Overall Efficiency (3/5)
Base60
bmep = 900 kPa2000 rpm
MBT Ti iPumpingLosses
Increase CR to 16
Short Burn Duration
cien
cy (%
)
50
55 MBT Timing
Gross IndicatedEfficiency
Losses
MechanicalFriction
d B
rake
Effi
c
45Net Indicated
EfficiencyBrake
Efficiency
Friction
ndic
ated
an
35
40
5%1 2 3 4 5
I
30
35
BAS
E
CR
= 1
6
b =
30o
=
0.7
EGR
= 4
5
Case
1 2 3 4 5

Overall Efficiency (4/5)
Base60
bmep = 900 kPa2000 rpm Pumping
Losses
60bmep = 900 kPa
2000 rpm PumpingLosses
Increase CR to 16
Short Burn Duration
Lean Mixturecien
cy (%
)
50
55 MBT Timing
Gross IndicatedEfficiency
Losses
MechanicalFrictionci
ency
(%)
50
55 MBT Timing
Gross IndicatedEfficiency
Losses
MechanicalFriction Lean Mixture
d B
rake
Effi
c
45Net Indicated
EfficiencyBrake
Efficiency
Friction
d B
rake
Effi
c
45Net Indicated
EfficiencyBrake
Efficiency
Friction
ndic
ated
and
35
40
5%ndic
ated
and
35
40
5%1 2 3 4 5
I
30
35
BAS
E
CR
= 1
6
b =
30o
=
0.7
EGR
= 4
51 2 3 4 5
I
30
35
BAS
E
CR
= 1
6
b =
30o
=
0.7
EGR
= 4
5
Case
1 2 3 4 5
Case
1 2 3 4 5

Overall Efficiency (5/5)
55
60
bmep = 900 kPa2000 rpm
MBT TimingPumpingLosses
55
60
bmep = 900 kPa2000 rpm
MBT TimingPumpingLosses
Base
cien
cy (%
)
50
55 MBT Timing
Gross IndicatedEfficiency Mechanical
Frictioncien
cy (%
)
50
55 MBT Timing
Gross IndicatedEfficiency Mechanical
Friction
Increase CR to 16
Short Burn Duration
Lean Mixture
d B
rake
Effi
45Net Indicated
EfficiencyBrake
Efficiency
Friction
d B
rake
Effi
45Net Indicated
EfficiencyBrake
Efficiency
Friction Lean Mixture
Add 45% EGR
Indi
cate
d an
35
40
5%Indi
cate
d an
35
40
5%1 2 3 4 5
I
30
35
BAS
E
CR
= 1
6
b =
30o
=
0.7
EGR
= 4
51 2 3 4 5
I
30
35
BAS
E
CR
= 1
6
b =
30o
=
0.7
EGR
= 4
5
Case
1 2 3 4 5
Case
1 2 3 4 5

Overall Efficiency
Increase of indicated
60
bmep = 900 kPa2000 rpm
MBT Ti iPumpingLosses
60
bmep = 900 kPa2000 rpm
MBT Ti iPumpingLosses indicated
efficiencies: 37% to 53.9% (x 1.46)
16.9% increasecien
cy (%
)
50
55 MBT Timing
Gross IndicatedEfficiency
Losses
MechanicalFrictionci
ency
(%)
50
55 MBT Timing
Gross IndicatedEfficiency
Losses
MechanicalFriction 16.9% increase
Highest improvements from CR, lean and EGRd
Bra
ke E
ffic
45Net Indicated
EfficiencyBrake
Efficiency
Friction
= 16.9%d B
rake
Effi
c
45Net Indicated
EfficiencyBrake
Efficiency
Friction
= 16.9% CR, lean and EGR
Dilute operation requires higher inlet pressuresnd
icat
ed a
nd
35
40
5%
ndic
ated
and
35
40
5%
pressures
Brake values somewhat mitigated by
In
30
35
BAS
E
CR
= 1
6
b =
30o
=
0.7
EGR
= 4
5In
30
35
BAS
E
CR
= 1
6
b =
30o
=
0.7
EGR
= 4
5mitigated by increases of friction
Case
1 2 3 4 5
Case
1 2 3 4 5

Comparison to Experimental ResultsComparison to Experimental Results

Table 5. Comparisons to Results from [22]ITEM REFERENCE THIS WORKITEM REFERENCE
(Kokjohn et al. [22])
THIS WORK(High Eff
Case) B /St k ( ) 137/165 102/88Bore/Stroke (mm) 137/165 102/88Fuels Gasoline/Diesel Isooctane Inlet Pressure (kPa) 200 170 Geometric CR 16.1 16 EGR (%) 45.5 45 Equivalence Ratio 0.77 0.7qSpeed (rpm) 1300 2000 RESULTS: IMEP (kPa) 1100 1015IMEP
NET (kPa) 1100 1015
Net Ind Efficiency (%) 50 53.9 Peak Pressure (MPa) 12 12.0 Nitric Oxide (g/kW-h) 0.01 0.003

Effect of IndividualEffect of IndividualEngine Parametersg
(extra)

Thermodynamic Reasons forThermodynamic Reasons for Efficiency Increases

Energy Comparison
100
UnusedFuel
(0.7%)
bmep = 900 kPa2000 rpm
100
UnusedFuel
(0.7%)
bmep = 900 kPa2000 rpm
Gains in efficiency only partly due to%
) 80 (46.7%) (40.5%)
Net TransferOut Dueto Flows
%) 80 (46.7%) (40.5%)
Net TransferOut Dueto Flows
partly due to reduced heat losses – the rest is largely aN
ERG
Y (%
60(5.0%)
HeatT fN
ERG
Y (%
60(5.0%)
HeatT f is largely a
result of the increases of CR and ???
EN
20
40(15.6%)
TotalI di t d
Transfer = 16.9%EN
20
40(15.6%)
TotalI di t d
Transfer = 16.9%
1 20
20 (37.0%) (53.9%)IndicatedWork
C ti l Hi h Effi i1 20
20 (37.0%) (53.9%)IndicatedWork
C ti l Hi h Effi i1 2Conventional High Efficiency1 2Conventional High Efficiency

Heat Transfer Reductions77
Only a portion of the heat transfer reductions arebs
)
6
72000 rpm
bmep = 900 kPaMBT Timing, CR = 16
bs)
6
72000 rpm
bmep = 900 kPaMBT Timing, CR = 16
transfer reductions are converted to work
For these conditions, a 10 6% d ti f h tie
ncy
(%, a
b
4
5
ienc
y (%
, ab
4
5
10.6% reduction of heat losses increases the indicated thermal efficiency by 3 4% (abs)as
e of
Effi
c
2
3
rsion = 0.32
tm =
1.0
ase
of E
ffic
2
3
rsion = 0.32
tm =
1.0
efficiency by 3.4% (abs)
For different conditions, the factor of improvement
solu
te In
cre
0
1 Conversht
solu
te In
cre
0
1 Conversht
changes but is of the same order
Abs
2
-1 Decreasing htm
Abs
2
-1 Decreasing htm
Absolute Reduction of RHT (%, abs)
-4 -2 0 2 4 6 8 10 12 14 16-2
Absolute Reduction of RHT (%, abs)
-4 -2 0 2 4 6 8 10 12 14 16-2

Contributions to Efficiency Gains
Feature Incremental Gain of Indicated Efficiency
(%)
Relative Gain (%)
(%)Compression Ratio Increase 6.5 39Shorter Burn Duration 1.2 7Reduced Heat Transfer 3.4 20??? (by difference) 5.8 34Total 16.9% 100%

Ratio of Specific Heats1 351 35
Increased ratio of specific heats important )
1.35bmep = 900 kPa
2000 rpmMBT Timing4th Sequence)
1.35bmep = 900 kPa
2000 rpmMBT Timing4th Sequence
for conversion of thermal energy to work
Small increases yieldsion
str
oke)
1.305
Highsion
str
oke)
1.305
High Small increases yield large benefits
From simple “Otto” cycle may show that am
a (e
xpan
s
4
HighEGR
ma
(exp
ans
4
HighEGR
cycle, may show that a 5% increase of gamma results in about a 20% relative increase ofve
rage
Gam
1.25
1 3High
Leaner
vera
ge G
am
1.25
1 3High
Leaner
relative increase of efficiency (e.g., 30% to 36%)
Av
2
ShortBD
HighCRAv
2
ShortBD
HighCR
Net Indicated Efficiency (%)
35 40 45 50 55 601.20
Net Indicated Efficiency (%)
35 40 45 50 55 601.20

Contributions to Efficiency Gains
Feature Incremental Gain of Indicated Efficiency
(%)
Relative Gain (%)
(%)Compression Ratio Increase 6.5 39Shorter Burn Duration 1.2 7Reduced Heat Transfer 3.4 20Ratio of Specific Heats Increase 5.8 34Total 16.9% 100%

SUMMARY/CONCLUSIONS Completed a thermodynamic assessment of the
parametric changes for increased efficiency
Th i f i d The most important features are increased compression ratio, lean operation and EGR
R f th i CR d t Reasons for the gains are CR advantage, reduced heat losses and the increased ratio of specific heatsp
The role of increased ratio of specific heats is important and can account for 30% or more of pthe gains
Reducing heat losses even further can provide
27
additional gains and is thermodynamically favorable

28

Extra InformationExtra Information
29

Brief Discussion of ExergyBrief Discussion of Exergy

Energy and Exergy
100
UnusedFuel
(0.7%)
Destructiondue to
Inlet Mixing(0 9%)
Conventionalbmep = 900 kPa
2000 rpm = 1.0100
UnusedFuel
(0.7%)
Destructiondue to
Inlet Mixing(0 9%)
Conventionalbmep = 900 kPa
2000 rpm = 1.0
ERG
Y (%
)
80 (46.7%)
(0.9%)
Net TransferO t D
(20.4%)
CombustionDestroyed
ERG
Y (%
)
80 (46.7%)
(0.9%)
Net TransferO t D
(20.4%)
CombustionDestroyed
These results demonstrate the differences
Y O
R E
XE
60
(15 6%)
(28.9%)
Heat
Out Dueto Flows
Y O
R E
XE
60
(15 6%)
(28.9%)
Heat
Out Dueto Flows
differences between energy and exergy quantities
ENER
GY
20
40
(37 0%)
(15.6%) (13.0%)
Total
HeatTransfer
ENER
GY
20
40
(37 0%)
(15.6%) (13.0%)
Total
HeatTransfer
quantities
1 20
20 (37.0%) (36.2%)TotalIndicated
Work
EEnergy1 20
20 (37.0%) (36.2%)TotalIndicated
Work
EEnergy1 2ExergyEnergy1 2ExergyEnergy

Exergy Comparison
For high efficiency
100
UnusedFuel
(0.7%)
Destructiondue to
Inlet Mixing
bmep = 900 kPa2000 rpm
100
UnusedFuel
(0.7%)
Destructiondue to
Inlet Mixing
bmep = 900 kPa2000 rpm
engine, destruction of exergy i b t) 80
100
(24.0%)
Inlet Mixing(0.7%)
(20.4%) CombustionDestroyed
) 80
100
(24.0%)
Inlet Mixing(0.7%)
(20.4%) CombustionDestroyed
increases – but trade-offs are favorable for increasedXE
RG
Y (%
)
60(17.9%)
(28.9%)Net Transfer
Out Dueto Flows
(3.8%)
XER
GY
(%)
60(17.9%)
(28.9%)Net Transfer
Out Dueto Flows
(3.8%)increased thermal efficiencies
EX
40
(52 9%)
(13.0%)
(36 2%)Total
Indicated
HeatTransferEX
40
(52 9%)
(13.0%)
(36 2%)Total
Indicated
HeatTransfer
0
20 (52.9%)(36.2%) IndicatedWork
0
20 (52.9%)(36.2%) IndicatedWork
1 2High EfficiencyConventional1 2High EfficiencyConventional

Exergy Destruction
Increases of exergy d t ti l lst
ion
30
bmep = 900 kPa2000 rpmst
ion
30
bmep = 900 kPa2000 rpm destruction largely
due to dilution which results in lower combustionin
g C
ombu
srg
y) 25
2000 rpmMBT Timing4th Sequence
ing
Com
bus
rgy) 25
2000 rpmMBT Timing4th Sequence
lower combustion temperatures
truc
tion
Dur
(% fu
el e
xer
20truc
tion
Dur
(% fu
el e
xer
20
Exer
gy D
est
ASE
R =
16
b = 3
0o
= 0.
7
GR
= 4
5%
Exer
gy D
est
ASE
R =
16
b = 3
0o
= 0.
7
GR
= 4
5%Case
1 2 3 4 515 B
A C b ECase
1 2 3 4 515 B
A C b E

Brief Discussion of EmissionsBrief Discussion of Emissions

CO2 and NO Values1.21.2
y un
its)
0.8
1.0
29.2% reduction
y un
its)
0.8
1.0
29.2% reduction
CO
2 (a
rbitr
ary
0.4
0.6
CO
2 (a
rbitr
ary
0.4
0.6
Case
C
0.0
0.2
Conventional High EfficiencyCase
C
0.0
0.2
Conventional High Efficiency
15
20
15
20
Carbon Dioxide Estimates
O (g
/kW
-hr)
10
~100% reductionO (g
/kW
-hr)
10
~100% reductionN
0
5
C i l
N
0
5
C i lCase
Conventional High EfficiencyCase
Conventional High Efficiency
Nitric Oxide Estimates

Effect of Engine ParametersEffect of Engine Parameters

Equivalence Ratio5656
Lean operation provides efficiency gains54
56Net Indicated
Efficiency54
56Net Indicated
Efficiency
Gains are largely a result of reduced heat losses and higher gamma
lcy (%
)
50
52
HighEfficiency
CaseBrakecy
(%)
50
52
HighEfficiency
CaseBrake
values
Requires higher inlet pressuresal
Effi
cien
c
46
48Efficiency
al E
ffici
enc
46
48Efficiency
p
Brake values subject to higher frictionTh
erm
42
44Ther
m
42
44
Friction increases largely due to piston/rings/cylinder friction
40
42bmep = 900 kPa
EGR = 45%, b = 30o
2000 rpm, cr = 16MBT Timing
40
42bmep = 900 kPa
EGR = 45%, b = 30o
2000 rpm, cr = 16MBT Timing
friction
Equivalence Ratio
0.4 0.5 0.6 0.7 0.8 0.9 1.0 1.1 1.2 1.338
Equivalence Ratio
0.4 0.5 0.6 0.7 0.8 0.9 1.0 1.1 1.2 1.338

Exhaust Gas Recirculation5656
EGR provides efficiency gains
54
55bmep = 900 kPa = 0.7, b = 30o
2000 rpm, cr = 16MBT Timing
Net Indicated Efficiency54
55bmep = 900 kPa = 0.7, b = 30o
2000 rpm, cr = 16MBT Timing
Net Indicated Efficiency
Gains are largely a result of reduced heat losses and higher gamma
lcy (%
)
52
53
cy (%
)
52
53
values
Requires higher inlet pressures
mal
Effi
cien
c
50
51High
EfficiencyCase
mal
Effi
cien
c
50
51High
EfficiencyCase
p
Brake values subject to higher friction
Ther
m
48
49
Brake Efficiency
Ther
m
48
49
Brake Efficiency
Friction increases largely due to piston/rings/cylinder friction
46
47
46
47
friction
EGR (%)
0 10 20 30 40 50 6045
EGR (%)
0 10 20 30 40 50 6045

Compression Ratio6060
Increased CR is a significant factor55
bmep = 900 kPa = 0.7, b = 30o
2000 rpm, EGR = 45%MBT Timing55
bmep = 900 kPa = 0.7, b = 30o
2000 rpm, EGR = 45%MBT Timing
A consequence of the mechanical advantage and the greater
i ticy (%
)
50
HighEfficiency
CaseNet Indicated Efficiency
Brakecy (%
)
50
HighEfficiency
CaseNet Indicated Efficiency
Brake expansion ratio
Due to high dilution, spark knock not
mal
Effi
cien
c
45
BrakeEfficiency
mal
Effi
cien
c
45
BrakeEfficiency
pexpected to be an issue
Ther
m
40Ther
m
40
3535
Compression Ratio
4 6 8 10 12 14 16 18 2030
Compression Ratio
4 6 8 10 12 14 16 18 2030

Burn Duration5656
Decreasing burn duration has a modest impact
54
55bmep = 900 kPa
= 0.7, EGR = 45%2000 rpm, cr = 16
MBT Timing
Net Indicated Efficiency
54
55bmep = 900 kPa
= 0.7, EGR = 45%2000 rpm, cr = 16
MBT Timing
Net Indicated Efficiency
impact
The improvement diminishes for shorter d tinc
y (%
)
52
53
Hi hncy
(%)
52
53
Hi h durations
The difference between 60° and 30° burn m
al E
ffici
en
50
51High
EfficiencyCase
mal
Effi
cien
50
51High
EfficiencyCase
duration is about a factor of 3.5 higher pressure rise rate
Ther
m
47
48
49Brake EfficiencyTh
erm
47
48
49Brake Efficiency
45
46
47
45
46
47
b (oCA)
0 10 20 30 40 50 6045
b (oCA)
0 10 20 30 40 50 6045

Combustion Timing5656
All previous results for MBT timing54
55bmep = 900 kPa = 0.7, b = 30o
2000 rpm, cr = 16Net Indicated Efficiency54
55bmep = 900 kPa = 0.7, b = 30o
2000 rpm, cr = 16Net Indicated Efficiency
cy (%
)
52
53
cy (%
)
52
53
mal
Effi
cien
50
51High
EfficiencyCase
mal
Effi
cien
50
51High
EfficiencyCase
Ther
m
48
49
Brake Efficiency
Ther
m
48
49
Brake Efficiency
46
47Brake Efficiency
Retard46
47Brake Efficiency
Retard
Relative Combustion Timing (oCA)
-10 0 1045
Relative Combustion Timing (oCA)
-10 0 1045

Table 3. Conventional Engine Item Value
UsedHow Obtained
Table 3. Conventional Engine Item Value
UsedHow Obtained
Used bmep = 900 kPa, CR = 8, EGR = 0%, MBT timing Equivalence Ratio 1.0 inputEngine Speed (rpm) 2000 input
Used bmep = 900 kPa, CR = 8, EGR = 0%, MBT timing Equivalence Ratio 1.0 inputEngine Speed (rpm) 2000 inputg p ( p ) pMech Frictional mep (kPa) 81.3 from algorithm [19]Inlet Pressure (kPa) 92.1 inputExhaust Pressure (kPa) 105.0 input
26 0 d i d f MBT
g p ( p ) pMech Frictional mep (kPa) 81.3 from algorithm [19]Inlet Pressure (kPa) 92.1 inputExhaust Pressure (kPa) 105.0 input
26 0 d i d f MBTStart of Combustion (bTDC) 26.0 determined for MBTCombustion Duration (CA) 60 inputCylinder Wall Temp (K) 450 inputHeat transfer correlation Hohenberg [20]
Start of Combustion (bTDC) 26.0 determined for MBTCombustion Duration (CA) 60 inputCylinder Wall Temp (K) 450 inputHeat transfer correlation Hohenberg [20]Heat transfer correlation Hohenberg [20] Gross Ind thermal eff (%) 37.63 outputNet Ind thermal eff (%) 36.98 output
Heat transfer correlation Hohenberg [20] Gross Ind thermal eff (%) 37.63 outputNet Ind thermal eff (%) 36.98 outputet d t e a e (%) 36 98 outputBrake thermal eff (%) 33.92 output Exergy destruction comb (%) 20.37 output
et d t e a e (%) 36 98 outputBrake thermal eff (%) 33.92 output Exergy destruction comb (%) 20.37 outputMax press rise rate (kPa/CA) 152 output
Max press rise rate (kPa/CA) 152 output

Table 4. High Efficiency Engine Item Value How Obtained Table 4. High Efficiency Engine
Item Value How Obtained Used
bmep = 900 kPa, CR = 16, EGR = 45%, MBT timing Equivalence Ratio 0.7 inputE i S d ( ) 2000 i t
Used bmep = 900 kPa, CR = 16, EGR = 45%, MBT timing Equivalence Ratio 0.7 inputE i S d ( ) 2000 i tEngine Speed (rpm) 2000 inputMech Frictional mep (kPa) 115.9 from algorithm [19]Inlet Pressure (kPa) 169.5 inputExhaust Pressure (kPa) 179 5 input
Engine Speed (rpm) 2000 inputMech Frictional mep (kPa) 115.9 from algorithm [19]Inlet Pressure (kPa) 169.5 inputExhaust Pressure (kPa) 179 5 inputExhaust Pressure (kPa) 179.5 inputStart of Combustion (bTDC) 13.5 determined for MBTCombustion Duration (CA) 30 inputCylinder Wall Temp (K) 450 input
Exhaust Pressure (kPa) 179.5 inputStart of Combustion (bTDC) 13.5 determined for MBTCombustion Duration (CA) 30 inputCylinder Wall Temp (K) 450 inputy p ( ) pHeat transfer correlation Chang et al. [21] Gross Ind thermal eff (%) 54.95 output
y p ( ) pHeat transfer correlation Chang et al. [21] Gross Ind thermal eff (%) 54.95 outputNet Ind thermal eff (%) 53.92 outputBrake thermal eff (%) 47.79 output Exergy destruction comb (%) 24 01 output
Net Ind thermal eff (%) 53.92 outputBrake thermal eff (%) 47.79 output Exergy destruction comb (%) 24 01 outputExergy destruction comb (%) 24.01 outputMax press rise rate (kPa/CA) 536 outputExergy destruction comb (%) 24.01 outputMax press rise rate (kPa/CA) 536 output

Heat Transfer Reductions
Only a portion of the heat transfer reductions are1.0
1.2
Net Ind Eff
1.0
1.2
Net Ind Eff
transfer reductions are converted to work
For these conditions, a 50% d ti f h t
0.8
1.0
CR = 16, b = 30o
CR = 8, b = 60o
0.8
1.0
CR = 16, b = 30o
CR = 8, b = 60o
50% reduction of heat losses increases the indicated thermal efficiency by a factor ofAc
tual
/Bas
e
0.6
Actu
al/B
ase
0.6
efficiency by a factor of about 1.05
For different conditions,
A
0.4B
ase
Cas
eA
0.4B
ase
Cas
e
the factor of improvement changes but is of the same order
0.2bmep = 900 kPa
2000 rpmMBT Timing
htm0.2bmep = 900 kPa
2000 rpmMBT Timing
htm
Relative Heat Transfer (compared to base)
0 20 40 60 80 100 1200.0
Relative Heat Transfer (compared to base)
0 20 40 60 80 100 1200.0

45