Embed Size (px)
Citation preview
dickenson intellinetics 5690 2791 ICICI Annual Report 2004
Sp
ine s
ho
uld
be
ad
just
ed
by
Designed by Dickenson
10th A
nnual R
eport and A
ccounts 2003 - 2004
Creating value throughtransformation...
Sp
ine s
ho
uld
be
ad
just
ed
by
dickenson intellinetics 5690 2791 ICICI Annual Report 2004
The first 50 years of ICICI Group’s existence has been exhilarating. Our origin
was in itself a pioneering joint initiative of the Government of India, the World
Bank and Indian industry to channelise foreign and domestic resources into
India's development.
As the years went by, we expanded our horizons to play a vital and supportive
role across all areas of an increasingly diverse and vibrant economy. Led by
visionaries and sustained by our culture of entrepreneurship, we have
constantly transformed ourselves and reoriented our strategy to the needs of
the changing times.
Today, we are an internationally recognised Indian universal banking group
with leadership positions across the financial services space, providing
momentum to India’s growth aspirations.
The experiences of these five decades are the foundation for a future that we
believe will be exciting and full of opportunity - for our country and us.
The visual depiction in the following pages is an attempt by us to depict the nation's
development over the past five decades and our role during each decade.
Contents
Message from the Chairman 2
Board of Directors 4
Senior Management 4
Board Committees 5
Letter from the Managing Director & CEO 6
Product Portfolio 8
Directors’ Report 9
Auditors’ Certificate 33
Business Overview 34
Management’s Discussion and Analysis 46
Particulars of Employees under Section 217 (2A) of the Companies Act, 1956 60
Financials:
Auditors’ Report F1
Balance Sheet F2
Profit and Loss Account F3
Schedules & Notes F4
Cash Flow Statement F28
Statement Pursuant to Section 212 of the Companies Act, 1956 F30
Consolidated Financial Statements of ICICI Bank Limited and its Subsidiaries F31
Extracts from the Consolidated US GAAP Financial Statements F59
Enclosures:
! Notice
! Attendance Card and Form of Proxy
_____________________________________________________________
_____________________________________________________________________
___________________________________________________________________
_____________________________________________________________________
____________________________________________________
______________________________________________________________________
______________________________________________________________________
___________________________________________________________________
___________________________________________________________________
_____________________________________________________
__________________________
______________________________________________________________________
_______________________________________________________________________
________________________________________________________________
____________________________________________________________________
_________________________________________________________________
___________________________________
__________________________
____________________________________
dickenson intellinetics 5690 2791 ICICI Annual Report 2004
1

2
Message from the Chairman
The year 2004 is a watershed year for the ICICI group, as it marks the 50th year of our existence.
ICICI was formed in 1955 as an innovative experiment - a development banking institution in the
private sector, in a newly independent nation. Over the next few decades a number of visionary
leaders shaped the organisation into a premier provider of finance to Indian industry, actively
participating in the creation of industrial capacities and providing resources to support India's
entrepreneurs.
While being primarily a provider of long-term loans to the manufacturing sector, we sought to
respond to the needs of our clients in a growing and developing economy by expanding the range
of products and services that we offered to various client segments. During the 1980s, we set up
leasing operations and a venture capital company giving Indian businesses greater flexibility in
determining their financing structures. We were closely involved in institution building and the
development of the financial markets in India. We have participated in setting up a number of
institutions including a credit rating agency, a stock exchange and state level institutions, and have
been closely involved in policy-making over the years. This role of institution building continues
today with our involvement in setting up a commodities exchange and an asset reconstruction
company.
The process of diversification in the 1980s was the initiation of our move towards universal
banking. This gathered momentum in the 1990s with the setting up of ICICI Bank in 1994, and our
entry into insurance (both life and non-life) a few years later. It was during this period that we
identified the opportunity in retail finance, then a niche segment in the Indian financial sector. Over
dickenson intellinetics 5690 2791 ICICI Annual Report 2004
the next few years, we rapidly grew our retail banking franchise and made retail credit available to
a large customer base, thus giving an impetus to economic growth by supporting long and
medium term asset creation by Indian consumers, in the form of homes and automobiles. With
the merger of ICICI and ICICI Bank, we achieved the optimal legal and regulatory platform for
conducting the entire range of financial services businesses. It is indeed a matter of considerable
satisfaction that we have been able to successfully meet the challenges posed by the merger and
make considerable progress in realising its benefits.
Certain core strengths have anchored our journey of transformation and growth. These are our
outstanding employees, our focus on innovation, our use of technology and our unwavering
adherence to best practices in governance. The ICICI group has a strong tradition of attracting and
nurturing talent. It is our people and their energy and passion that have made our achievements
possible. We have created a performance-driven work ethic that rewards initiative and excellence.
Our focus on innovation and continuous learning from international experience and best practices
has given us the first mover advantage in many areas in the Indian financial sector. Technology has
been perhaps the single biggest differentiator for us; we have been able to effectively harness
technology for competitive advantage. We have created a governance structure with the Board as
its nerve centre, that seeks to balance the interests of all stakeholders and appropriately guide
decision making at all levels of the organisation.
The ICICI group has a vast array of opportunities before it. We believe that we have built
capabilities to fully capitalise on the potential in all areas of our business. While the growth
momentum in retail banking continues, the resurgence of Indian industry and the favourable
prospects for infrastructure development present an opportunity to leverage our strong skills in
this area. We are rolling out platforms for scaling up delivery of high quality financial services to
rural India and small enterprises. Our international operations and insurance businesses are also
making rapid progress. As we go forward, we will continue to be guided by our organisational
ethos of innovation with stability.
During this long journey, we have had the good fortune of continuing to enjoy the support of our
shareholders, who reposed their faith in the Board and the management. The confidence of the
shareholders has been a considerable source of strength for the Board and the employees. As we
step into a new decade of our existence, we continue to rely on this support and confidence, in all
our endeavours.
3
N. VAGHUL Chairman
dickenson intellinetics 5690 2791 ICICI Annual Report 2004
N. Vaghul
Uday M. Chitale
P. C. Ghosh
Satish C. Jha
S. B. Mathur
L. N. Mittal
Anupam Puri
Vinod Rai
Somesh R. Sathe
M. K. Sharma
P. M. Sinha
Marti G. Subrahmanyam
V. Prem Watsa
K. V. Kamath
Lalita D. Gupte
Kalpana Morparia
Chanda D. Kochhar
Nachiket Mor
Chairman
Managing Director & CEO
Joint Managing Director
Deputy Managing Director
Executive Director
Executive Director
SENIOR GENERAL MANAGERS
Bhargav Dasgupta
M. N. Gopinath
N. S. Kannan
Sanjiv Kerkar
Vishakha Mulye
Ramni Nirula
Nagesh Pinge
Madhabi Puri-Buch
K. Ramkumar
Balaji Swaminathan
V. Vaidyanathan
Jyotin MehtaGeneral Manager & Company Secretary
Board of Directors
4
Senior Management
dickenson intellinetics 5690 2791 ICICI Annual Report 2004
AGRICULTURE &SMALL ENTERPRISESBUSINESS COMMITTEE
AUDIT COMMITTEE
BOARD GOVERNANCE & REMUNERATION COMMITTEE
BUSINESS STRATEGY COMMITTEE
N. Vaghul, Chairman
Satish C. Jha
Somesh R. Sathe
M. K. Sharma
P. M. Sinha
Uday M. Chitale, Chairman
Somesh R. Sathe
M. K. Sharma
N. Vaghul, Chairman
Anupam Puri
P. M. Sinha
N. Vaghul, Chairman
Anupam Puri
M. K. Sharma
P. M. Sinha
K. V. Kamath
CREDIT COMMITTEE
FRAUD MONITORING COMMITTEE
RISK COMMITTEE
N. Vaghul, Chairman
Satish C. Jha
Somesh R. Sathe
M. K. Sharma
K. V. Kamath
Uday M. Chitale, Chairman
M. K. Sharma
K. V. Kamath
Kalpana Morparia
Chanda D. Kochhar
N. Vaghul, Chairman
Uday M. Chitale
Marti G. Subrahmanyam
V. Prem Watsa
K. V. Kamath
SHARE TRANSFER & SHAREHOLDERS’/ INVESTORS’ GRIEVANCE COMMITTEE
COMMITTEE OF DIRECTORS
ASSET LIABILITY MANAGEMENT COMMITTEE
Uday M. Chitale, Chairman
Somesh R. Sathe
Kalpana Morparia
Chanda D. Kochhar
K. V. Kamath, Chairman
Lalita D. Gupte
Kalpana Morparia
Chanda D. Kochhar
Nachiket Mor
Lalita D. Gupte, Chairperson
Kalpana Morparia
Chanda D. Kochhar
Nachiket Mor
Board Committees
5
dickenson intellinetics 5690 2791 ICICI Annual Report 2004

Dear Stakeholders,
The ICICI group is now in its 50th year. It has indeed been an exciting journey, from a development
bank which became a leading provider of long-term finance in India to a diversified universal
banking group present across the spectrum of financial services. The journey continues as we
make a foray into the international markets while consolidating our leadership position in the
Indian financial sector.
In 2002, ICICI and ICICI Bank merged to create India's second-largest bank. The strategic
objectives of the merger were to expand our operations across various market segments, diversify
our revenue streams and move to a more stable, low-cost funding profile. In fiscal 2003, the first
year after the merger, we focused on implementing a framework to realise these objectives. While
the benefits of the merger started flowing through in the same year, fiscal 2004 saw us achieve
these goals in substantial measure.
Several years ago, we had identified retail credit as the growth opportunity for Indian banking, and
began building our retail business. This has enabled us to capitalise on the robust growth in the
retail credit market over the last two years. The momentum that we witnessed in the retail credit
market in fiscal 2003 was sustained in fiscal 2004. We strengthened our leadership position in all
segments of this market, leveraging our strong distribution capabilities backed by credit and
analytical skills and technology. We also achieved rapid growth in our deposit base and continued
to replace ICICI's high-cost borrowings with lower cost deposits. With retail loans constituting over
50% of our loan portfolio and deposits constituting over 60% of our funding, we have diversified
Letter from the Managing Director & CEO
6
dickenson intellinetics 5690 2791 ICICI Annual Report 2004
our balance sheet significantly. This process of structural change and diversification has resulted
in improvement in our interest margins. At the same time, we have achieved steady growth in our
fee income, reflecting the growing range and scale of our operations in fee-based products and
services for both retail and corporate customers.
The competitive resurgence in Indian industry after a process of deep restructuring has had a
positive impact on the asset quality of the banking system and is expected to give rise to new
growth opportunities in corporate credit. The renewed policy focus on infrastructure
development is also expected to encourage investment in various infrastructure sectors. We are
well-positioned to leverage the emerging opportunities in project finance and corporate credit.
We are also seeking to enhance the delivery of financial services to under-served segments. We
have created a differentiated proposition for the small enterprises segment, leveraging our
technology capabilities to offer high quality banking services. Our focus now is on scaling up this
business and expanding our geographical coverage. We believe that rural India presents an
exciting opportunity. We have achieved the regulatory targets on agricultural lending and are
looking beyond these mandatory requirements to build an integrated model for extending
modern banking services to customers in rural areas.
Our international initiative, based on an understanding of local markets and their linkages with
India, is making rapid progress. Last year we commenced banking operations in the United
Kingdom, Canada and Singapore. We will continue to roll-out and expand our international
operations in line with regulatory approvals.
Our life and non-life insurance subsidiaries are market leaders among the private sector players in
their respective segments. While ICICI Prudential Life Insurance performed well on key
profitability and operating parameters, though it recorded an accounting loss under insurance
accounting norms, ICICI Lombard General Insurance achieved underwriting profitability in its
second full year of operations.
We seek to support all our initiatives with appropriate resources - financial, technical and human.
In view of the prospects for growth in various areas of our business, we strengthened our capital
base substantially by raising additional equity capital of Rs. 32.46 billion. This has significantly
enhanced our ability to capture the growth opportunities over the medium term.
We believe that we have built a robust foundation that will support growth across all our
businesses. We have demonstrated our capabilities across products, customer segments and
markets. We will continue to leverage this platform to achieve our aspirations and deliver value to
our stakeholders.
K. V. KAMATH Managing Director & CEO
7
dickenson intellinetics 5690 2791 ICICI Annual Report 2004
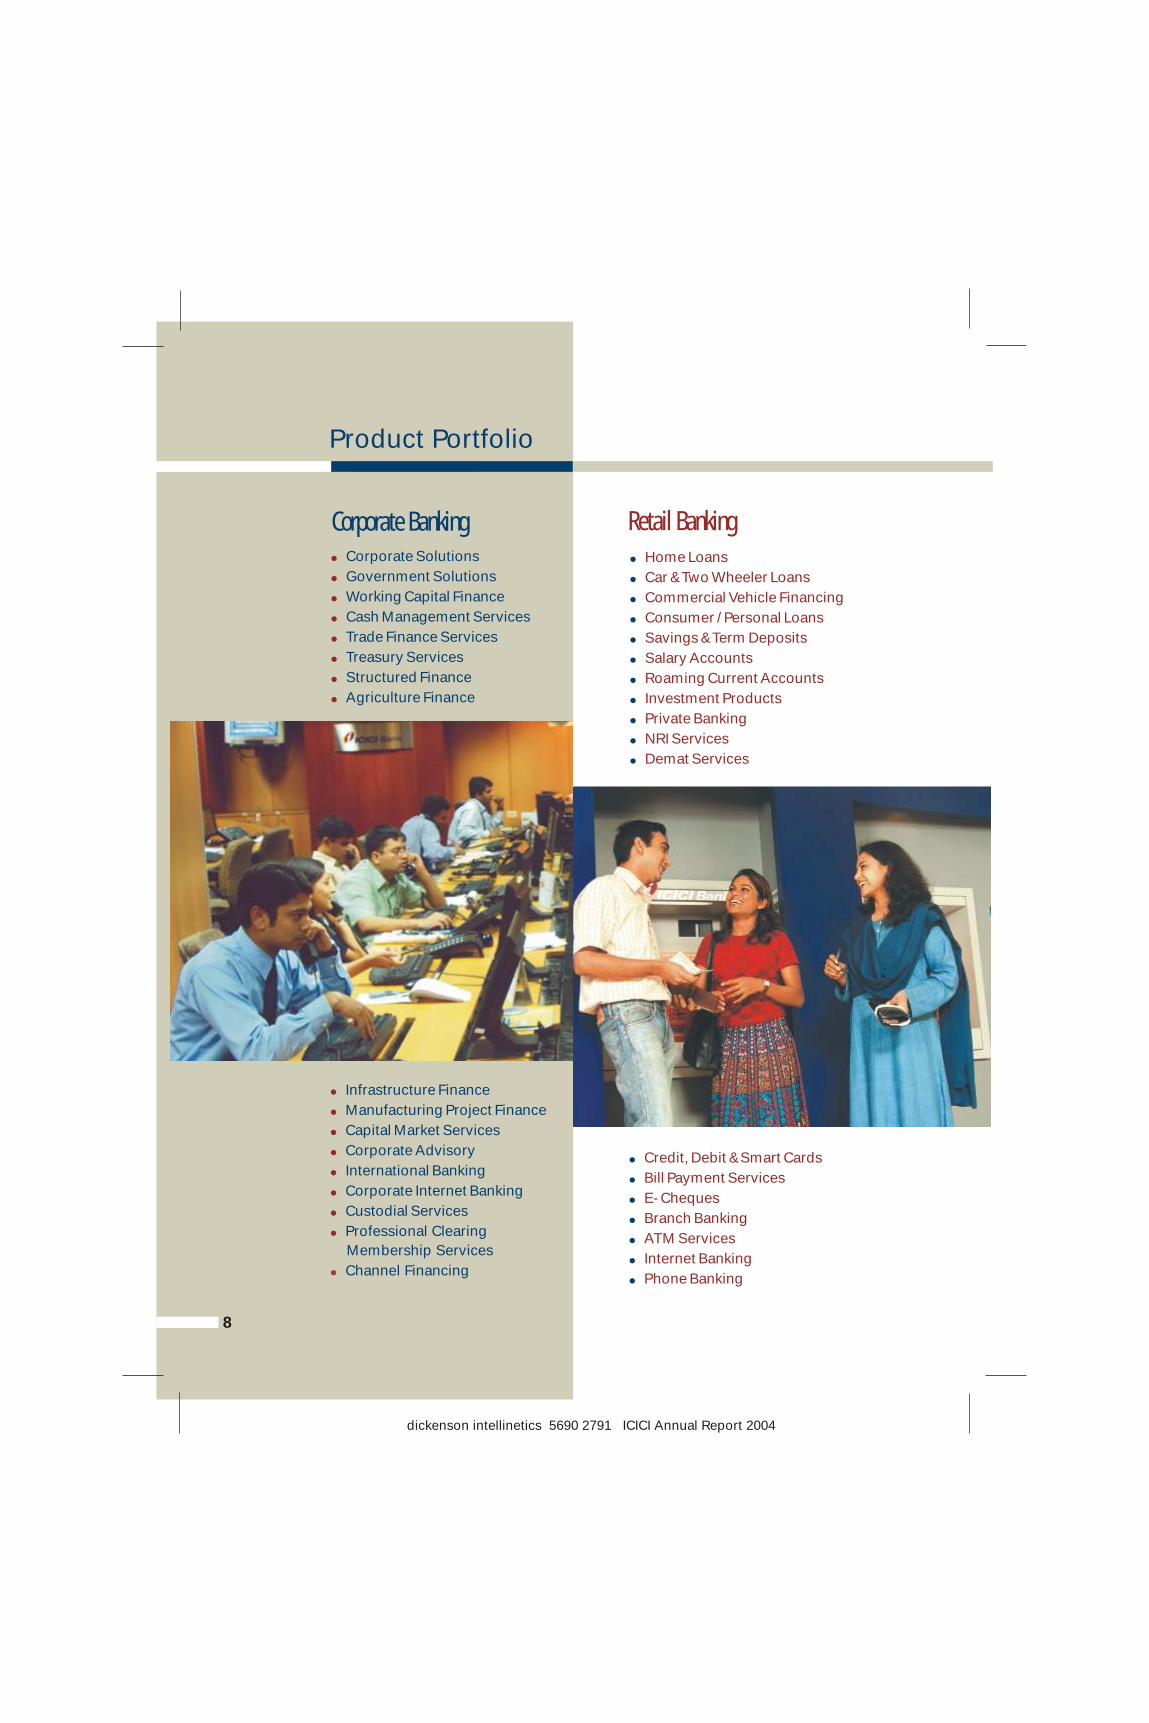
Corporate Banking
Product Portfolio
Retail Banking
!
!
!
!
!
!
!
!
Infrastructure Finance
Manufacturing Project Finance
Capital Market Services
Corporate Advisory
International Banking
Corporate Internet Banking
Custodial Services
Professional Clearing
Membership Services
Channel Financing!
!
!
!
!
!
!
!
!
Corporate Solutions
Government Solutions
Working Capital Finance
Cash Management Services
Trade Finance Services
Treasury Services
Structured Finance
Agriculture Finance
8
!
!
!
!
!
!
!
!
!
!
!
Home Loans
Car & Two Wheeler Loans
Commercial Vehicle Financing
Consumer / Personal Loans
Savings & Term Deposits
Salary Accounts
Roaming Current Accounts
Investment Products
Private Banking
NRI Services
Demat Services
!
!
!
!
!
!
!
Credit, Debit & Smart Cards
Bill Payment Services
E- Cheques
Branch Banking
ATM Services
Internet Banking
Phone Banking
dickenson intellinetics 5690 2791 ICICI Annual Report 2004
Directors’ Report
Your Directors have pleasure in presenting the Tenth Annual Report of ICICI Bank Limited with the
audited statement of accounts for the year ended March 31, 2004.
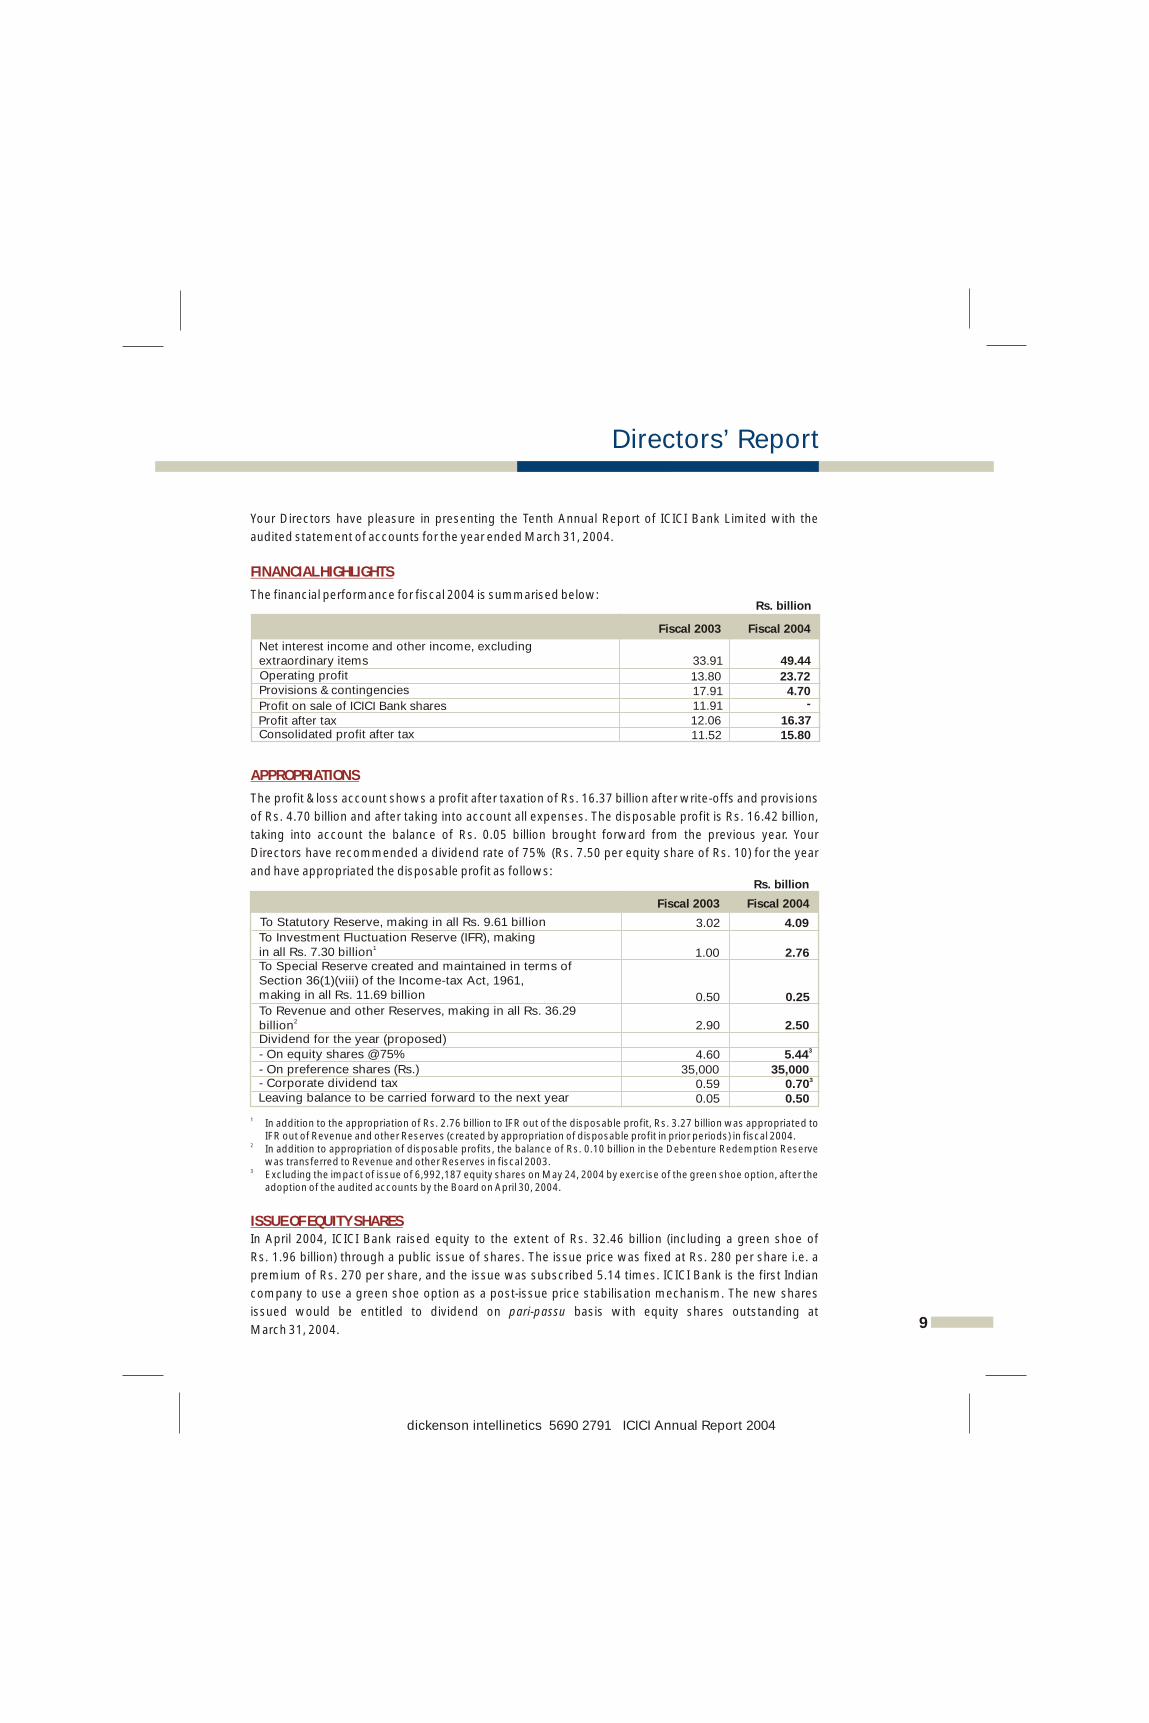
The financial performance for fiscal 2004 is summarised below:
The profit & loss account shows a profit after taxation of Rs. 16.37 billion after write-offs and provisions
of Rs. 4.70 billion and after taking into account all expenses. The disposable profit is Rs. 16.42 billion,
taking into account the balance of Rs. 0.05 billion brought forward from the previous year. Your
Directors have recommended a dividend rate of 75% (Rs. 7.50 per equity share of Rs. 10) for the year
and have appropriated the disposable profit as follows:
1 In addition to the appropriation of Rs. 2.76 billion to IFR out of the disposable profit, Rs. 3.27 billion was appropriated to IFR out of Revenue and other Reserves (created by appropriation of disposable profit in prior periods) in fiscal 2004.
2 In addition to appropriation of disposable profits, the balance of Rs. 0.10 billion in the Debenture Redemption Reserve was transferred to Revenue and other Reserves in fiscal 2003.
3 Excluding the impact of issue of 6,992,187 equity shares on May 24, 2004 by exercise of the green shoe option, after the adoption of the audited accounts by the Board on April 30, 2004.
In April 2004, ICICI Bank raised equity to the extent of Rs. 32.46 billion (including a green shoe of
Rs. 1.96 billion) through a public issue of shares. The issue price was fixed at Rs. 280 per share i.e. a
premium of Rs. 270 per share, and the issue was subscribed 5.14 times. ICICI Bank is the first Indian
company to use a green shoe option as a post-issue price stabilisation mechanism. The new shares
issued would be entitled to dividend on pari-passu basis with equity shares outstanding at
March 31, 2004.
FINANCIAL HIGHLIGHTS
APPROPRIATIONS
ISSUE OF EQUITY SHARES
9
Fiscal 2004
Fiscal 2003
33.91
49.44
Net interest income and other income, excluding extraordinary items
Operating profit
13.80
23.72
Provisions & contingencies
17.91
4.70
Profit on sale of ICICI Bank shares
11.91
-
Profit after tax 12.06 16.37Consolidated profit after tax 11.52 15.80
Rs. billion
Fiscal 2004Fiscal 2003
4.6035.44
35,000 35,0000.59 30.70
Dividend for the year (proposed)
- On equity shares @75%
- On preference shares (Rs.)- Corporate dividend taxLeaving balance to be carried forward to the next year 0.05 0.50
To Statutory Reserve, making in all Rs. 9.61 billion 3.02 4.09
1.00 2.76
To Investment Fluctuation Reserve (IFR), making 1in all Rs. 7.30 billion
0.50 0.25
To Special Reserve created and maintained in terms of Section 36(1)(viii) of the Income-tax Act, 1961, making in all Rs. 11.69 billion
2.90 2.50To Revenue and other Reserves, making in all Rs. 36.29
2billion
Rs. billion
dickenson intellinetics 5690 2791 ICICI Annual Report 2004
10
dickenson intellinetics 5690 2791 ICICI Annual Report 2004
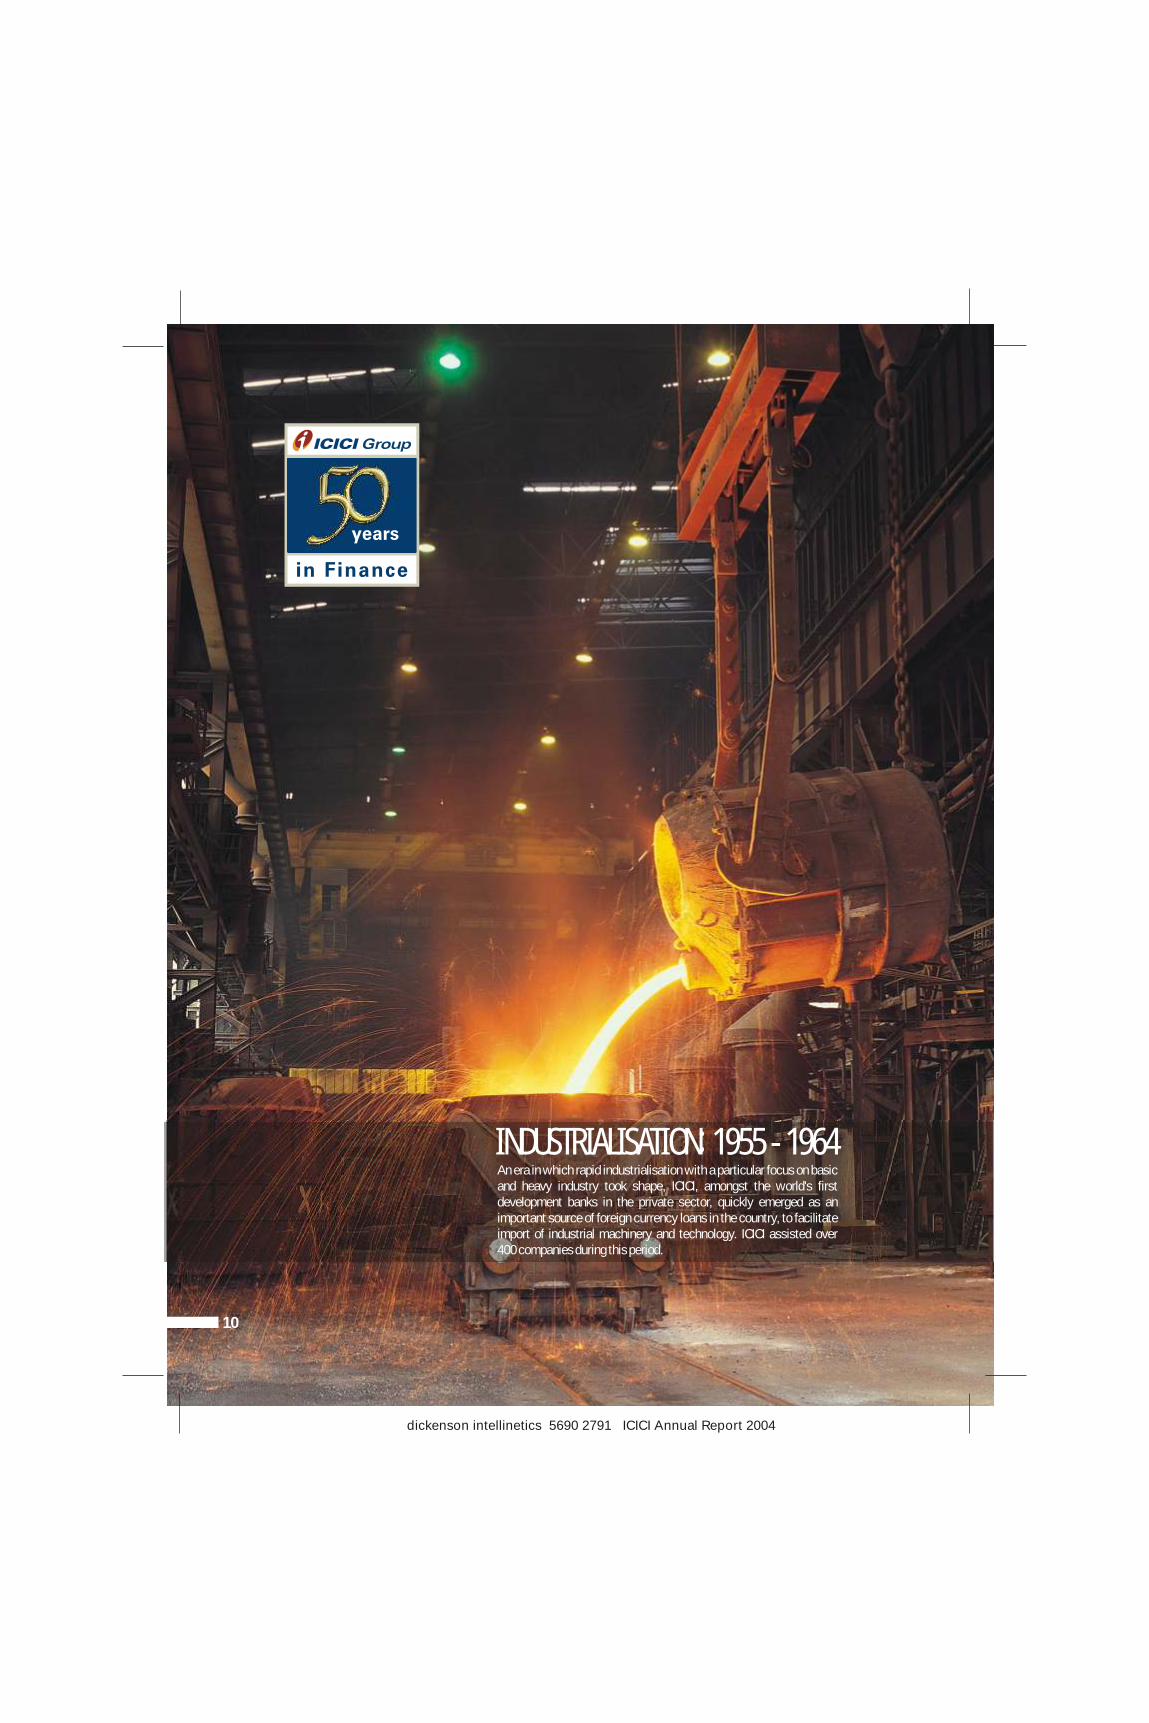
An era in which rapid industrialisation with a particular focus on basic
and heavy industry took shape, ICICI, amongst the world's first
development banks in the private sector, quickly emerged as an
important source of foreign currency loans in the country, to facilitate
import of industrial machinery and technology. ICICI assisted over
400 companies during this period.
:INDUSTRIALISATION 1955 - 1964
RESULTS FOR QUARTER ENDED JUNE 30, 2004
SUBSIDIARY COMPANIES
DIRECTORS
As per the audited accounts for the quarter ended June 30, 2004, ICICI Bank's profit after tax was
Rs. 4.31 billion as compared to Rs. 3.40 billion for the quarter ended June 30, 2003.
At March 31, 2004, ICICI Bank had 14 subsidiaries:
1 Subsidiary of ICICI Securities Limited2 Subsidiary of ICICI Securities Holdings Inc.
ICICI Bank acquired 100% stake in Transamerica Apple Distribution Finance Private Limited with effect
from May 7, 2003 and the name of the Company was changed to ICICI Distribution Finance Private
Limited with effect from June 3, 2003. ICICI Bank Canada was incorporated as a 100% subsidiary on
September 12, 2003.
As approved by the Central Government vide letter dated July 12, 2004 under Section 212(8) of the
Companies Act, 1956, copies of the balance sheet, profit & loss account, report of the Board of
Directors and report of the Auditors of the subsidiary companies have not been attached to the
accounts of ICICI Bank for fiscal 2004. ICICI Bank will make available these documents/details upon
request by any Member of ICICI Bank. These documents/details will be available on ICICI Bank's
website www.icicibank.com and will also be available for inspection by any Member of the Bank at its
Registered Office and Corporate Office and also at the Registered Office of the concerned subsidiary.
As required by Accounting Standard-21 (AS-21) issued by the Institute of Chartered Accountants of
India, ICICI Bank's consolidated financial statements included in this Annual Report incorporate the
accounts of its subsidiaries. A summary of key financials of ICICI Bank's subsidiaries is also included in
this Annual Report.
S.B. Mathur, Chairman, Life Insurance Corporation of India (LIC), which is among ICICI Bank's largest
institutional shareholders, was appointed as an additional Director effective January 29, 2004.
V. Prem Watsa was appointed as an additional Director effective January 29, 2004. He is the Chairman &
Chief Executive Officer of Fairfax Financial Holdings Limited (Fairfax). Fairfax is a financial services
holding company based in Canada with subsidiaries engaged in insurance, reinsurance, investment
management and insurance claims management. Lombard Canada Limited, ICICI Bank's joint venture
partner in general insurance, is a subsidiary of Fairfax.11
Domestic Subsidiaries International Subsidiaries
ICICI Securities Limited
ICICI Bank UK Limited
ICICI Venture Funds Management Company Limited
ICICI Bank Canada ICICI Prudential Life Insurance Company Limited 1ICICI Securities Holdings Inc.
ICICI Lombard General Insurance Company Limited 2ICICI Securities Inc.ICICI Home Finance Company Limited ICICI International LimitedICICI Investment Management Company LimitedICICI Trusteeship Services Limited
1ICICI Brokerage Services LimitedICICI Distribution Finance Private Limited
Directors’ Report
dickenson intellinetics 5690 2791 ICICI Annual Report 2004

12
dickenson intellinetics 5690 2791 ICICI Annual Report 2004
Having set the course for industrial development, the country now focused on
other sectors as well. This resulted in the green revolution for food sufficiency;
rise in exports to earn foreign exchange; development of industries in the
backward areas to broad-base growth; and encouragement to small
enterprises. Responding to the emerging needs, ICICI started export finance,
concessional funding in industrially backward areas and loans for small
enterprises. In this period, over 1,000 enterprises and 2,000 projects were
assisted by ICICI.
:REORGANISATION 1965 - 1974
Directors’ Report
R. Seshasayee, who was appointed as a Director effective May 3, 2002, resigned from the Board
effective October 31, 2003, in view of his increasing professional commitments in his executive
capacity at Ashok Leyland Limited and its group companies. The Board places on record its deep
appreciation of his invaluable contribution to the growth and development of the ICICI group.
Lalita D. Gupte has been re-appointed as Joint Managing Director upto October 31, 2006. Her
re-appointment was approved by the Members at their Extraordinary General Meeting held on
March 12, 2004 and has also been approved by Reserve Bank of India (RBI).
Kalpana Morparia has been elevated as Deputy Managing Director effective February 1, 2004.
S. Mukherji ceased to be a member of the Board effective February 1, 2004, consequent to his taking up
full-time executive responsibilities as Managing Director & CEO of ICICI Securities Limited
(ICICI Securities) effective that date. He has worked with erstwhile ICICI Limited and ICICI Bank for over
two decades and has vast experience in various areas. The Board places on record its deep
appreciation of his invaluable contribution as a wholetime Director of ICICI Bank and extends its best
wishes to him in his new role at ICICI Securities.
In terms of the provisions of the Articles of Association, Uday M. Chitale, Satish C. Jha, L.N. Mittal and
P. M. Sinha would retire by rotation at the forthcoming Annual General Meeting (AGM). Uday M. Chitale,
L.N. Mittal and P. M. Sinha, being eligible, offer themselves for re-appointment. RBI has vide its circular
dated September 9, 2002 stipulated an upper age limit of 70 years for the appointment of Directors on
the boards of private sector banks. Satish C. Jha, who completed 70 years of age on March 31, 2004
does not seek re-appointment. The Board places on record its deep appreciation of his invaluable
contribution as a Director of ICICI Bank. S.B. Mathur and V. Prem Watsa hold office up to the date of the
forthcoming AGM as provided under Article 135 of the Articles of Association, but are eligible for
appointment. Approval of the Members is being sought at the forthcoming AGM for the
re-appointment of Uday M. Chitale, L.N. Mittal and P. M. Sinha and the appointment of S. B. Mathur
(in the vacancy created by the retirement of Satish C. Jha) and V. Prem Watsa.
The Auditors, S.R. Batliboi & Co., Chartered Accountants, will retire at the ensuing AGM. The Board at
its Meeting held on April 30, 2004 has proposed the appointment of S. R. Batliboi & Co. as Auditors to
audit the accounts of ICICI Bank for fiscal 2005, and the approval of RBI for their appointment has been
obtained. You are requested to consider their appointment.
As required by the provisions of Section 217(2A) of the Companies Act, 1956, read with Companies
(Particulars of Employees) Rules, 1975, as amended, the names and other particulars of the employees
are set out in the Annexure to the Directors' Report.
Erstwhile ICICI Limited had a policy of appointing nominee directors on the boards of certain borrower
companies based on loan covenants, with a view to enable monitoring of the operations of those
AUDITORS
PERSONNEL
APPOINTMENT OF NOMINEE DIRECTORS ON THE BOARD OF ASSISTED COMPANIES
13
dickenson intellinetics 5690 2791 ICICI Annual Report 2004
14
dickenson intellinetics 5690 2791 ICICI Annual Report 2004
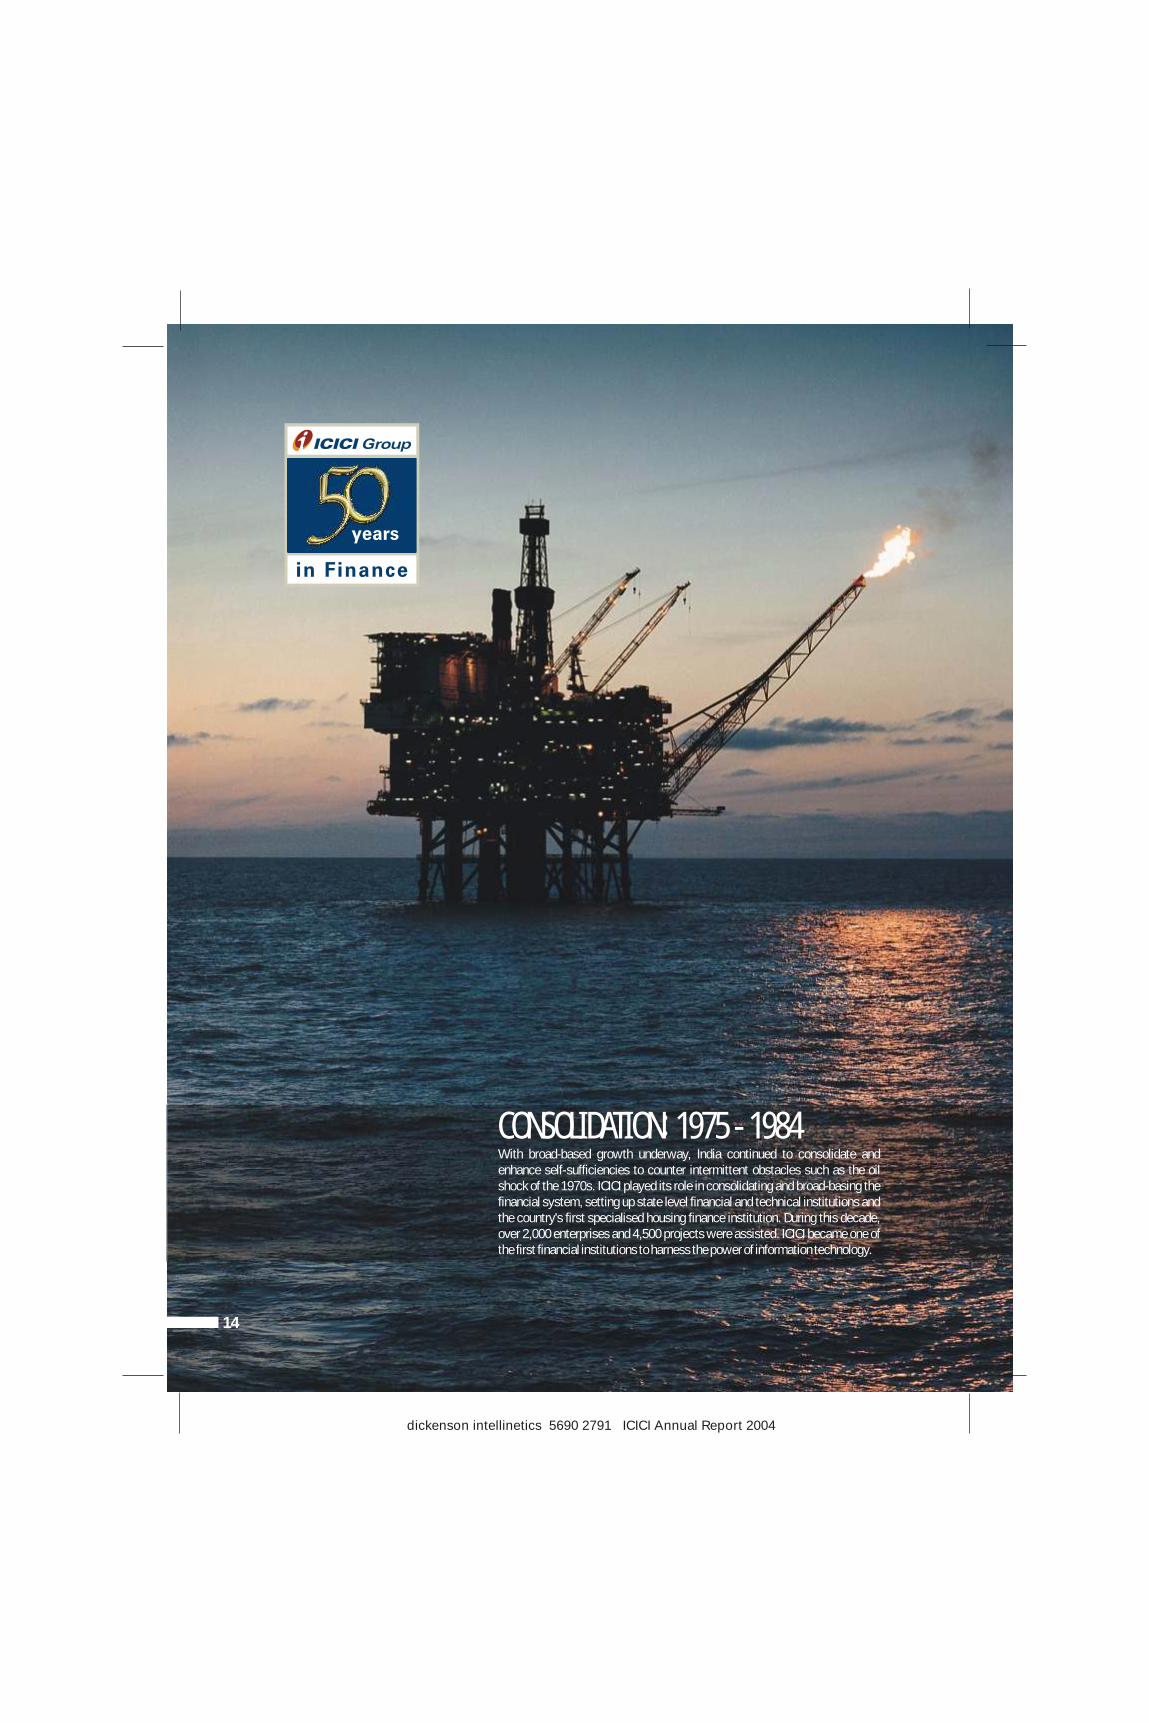
With broad-based growth underway, India continued to consolidate and
enhance self-sufficiencies to counter intermittent obstacles such as the oil
shock of the 1970s. ICICI played its role in consolidating and broad-basing the
financial system, setting up state level financial and technical institutions and
the country's first specialised housing finance institution. During this decade,
over 2,000 enterprises and 4,500 projects were assisted. ICICI became one of
the first financial institutions to harness the power of information technology.
:CONSOLIDATION 1975 - 1984
companies. Subsequent to the merger, ICICI Bank continues to nominate directors on the boards of
assisted companies. Apart from the Bank's employees, experienced professionals from the banking,
government and other sectors are appointed as nominee Directors. ICICI Bank has 112 nominee
Directors of whom 66 are employees of the Bank on the boards of 214 companies. ICICI Bank has a
Nominee Director Cell for maintaining records of nominee directorships.
ICICI Bank has established a tradition of best practices in corporate governance. The corporate
governance framework in ICICI Bank is based on an effective independent Board, the separation of the
Board's supervisory role from the executive management and the constitution of Board Committees,
generally comprising a majority of independent Directors and chaired by an independent Director, to
oversee critical areas.
ICICI Bank's corporate governance philosophy encompasses not only regulatory and legal
requirements, such as the terms of listing agreements with stock exchanges, but also several voluntary
practices aimed at a high level of business ethics, effective supervision and enhancement of value for
all stakeholders.
Whistle Blower Policy
In line with the best international governance practices and the Sarbanes-Oxley Act, ICICI Bank has
formulated a Whistle Blower Policy for the ICICI group. In terms of this policy, employees of ICICI Bank
and its group companies are free to raise issues, if any, which they may have on the accounting policies
and procedures adopted for any area or item and report the same to the Audit Committee through
appropriate channels. The above mechanism has been communicated within the Bank across all levels
and has been posted on ICICI Bank's intranet.
Prevention of Insider Trading
ICICI Bank has instituted a comprehensive code of conduct for prevention of insider trading namely,
ICICI Bank Code of Conduct for Prevention of Insider Trading in accordance with the requirements of
SEBI (Prohibition of Insider Trading) Regulations, 1992.
Code of Business Conduct and Ethics
The Board of Directors has approved a Code of Business Conduct and Ethics for Directors and
employees of ICICI Bank.
ICICI Bank has a broad-based Board of Directors, constituted in compliance with the Banking
Regulation Act, 1949, Companies Act, 1956 and listing agreements entered into with stock exchanges
and in accordance with best practices in corporate governance. The Board functions either as a full
Board or through various committees constituted to oversee specific operational areas. The Board has
constituted 10 committees, namely, Agriculture & Small Enterprises Business Committee, Audit
Committee, Board Governance & Remuneration Committee, Business Strategy Committee, Credit
Committee, Fraud Monitoring Committee, Risk Committee, Share Transfer & Shareholders'/Investors'
Grievance Committee, Committee of Directors and Asset Liability Management Committee. A majority
CORPORATE GOVERNANCE
I. Philosophy of Corporate Governance
II. Board of Directors
15
Directors’ Report
dickenson intellinetics 5690 2791 ICICI Annual Report 2004
16
dickenson intellinetics 5690 2791 ICICI Annual Report 2004
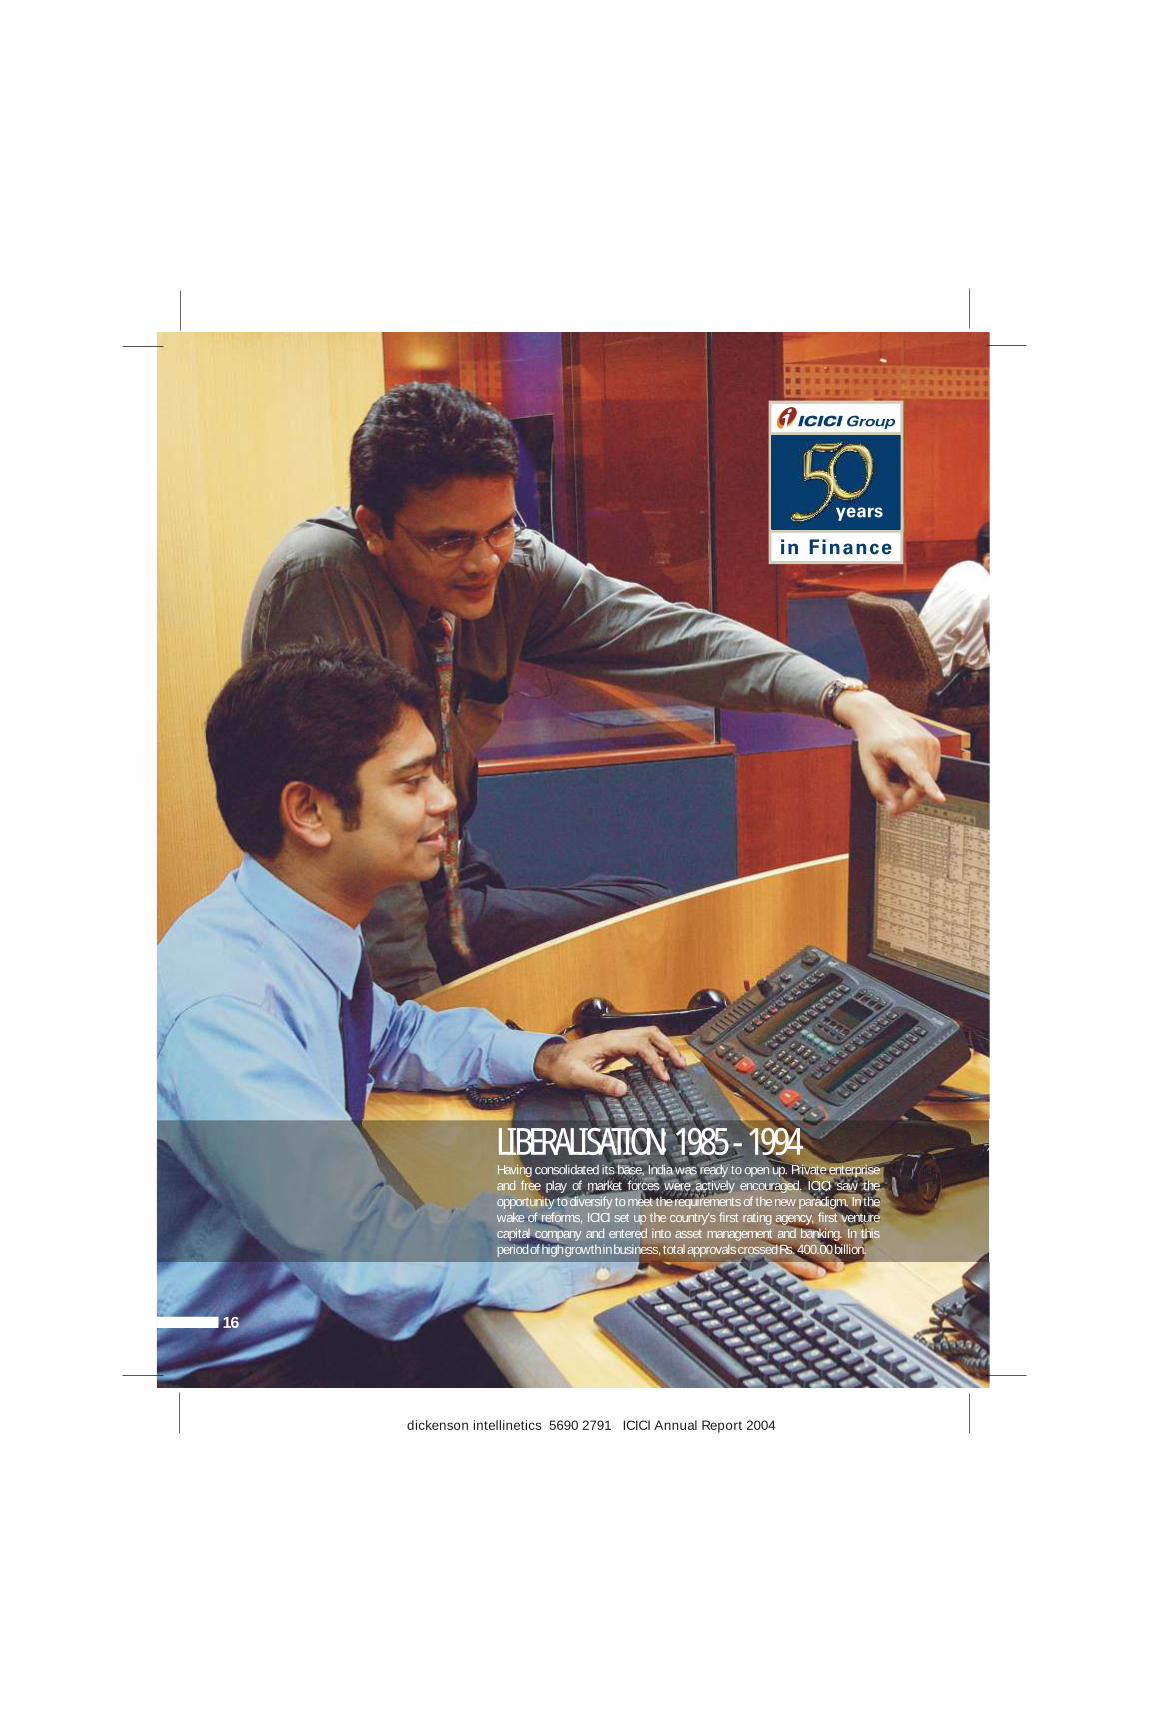
:LIBERALISATION 1985 - 1994Having consolidated its base, India was ready to open up. Private enterprise
and free play of market forces were actively encouraged. ICICI saw the
opportunity to diversify to meet the requirements of the new paradigm. In the
wake of reforms, ICICI set up the country's first rating agency, first venture
capital company and entered into asset management and banking. In this
period of high growth in business, total approvals crossed Rs. 400.00 billion.
Directors’ Report
of these Board Committees are chaired by independent professional Directors, and mainly consist of
independent Directors. The constitution of these Committees is given hereafter.
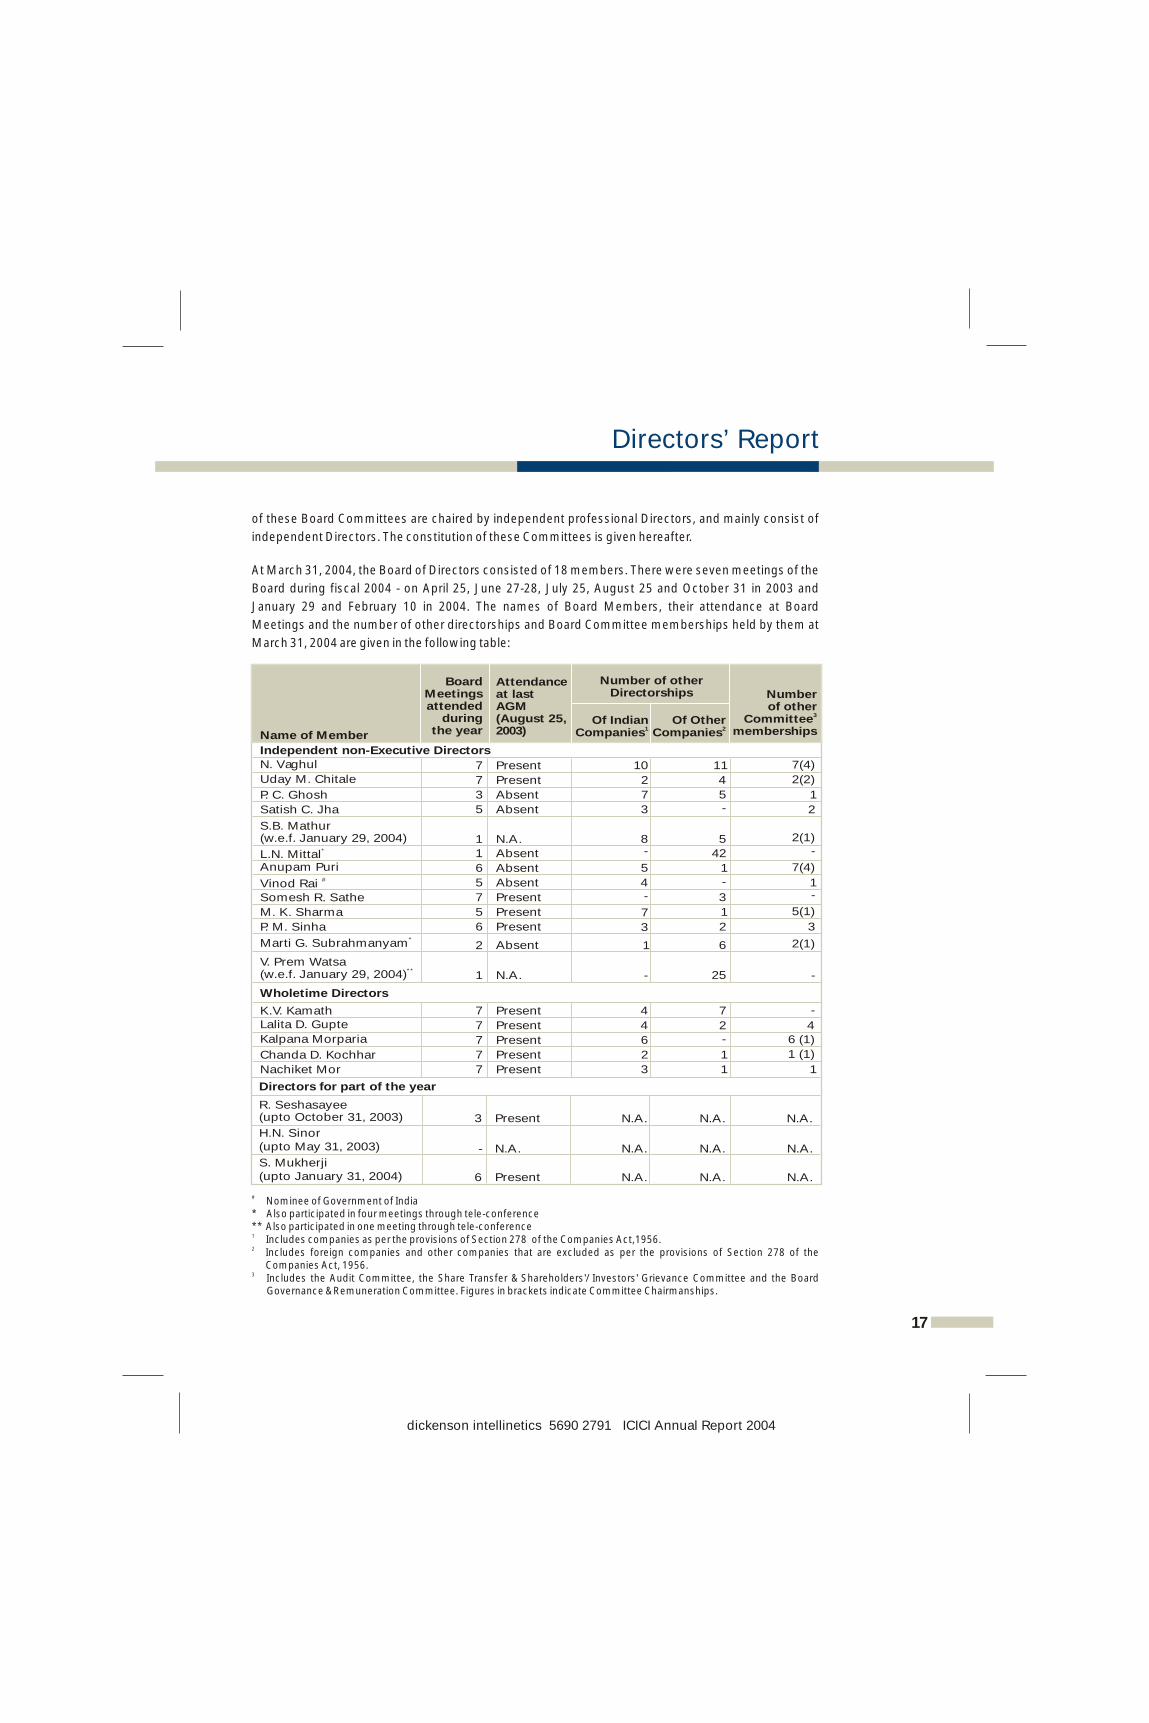
At March 31, 2004, the Board of Directors consisted of 18 members. There were seven meetings of the
Board during fiscal 2004 - on April 25, June 27-28, July 25, August 25 and October 31 in 2003 and
January 29 and February 10 in 2004. The names of Board Members, their attendance at Board
Meetings and the number of other directorships and Board Committee memberships held by them at
March 31, 2004 are given in the following table:
# Nominee of Government of India* Also participated in four meetings through tele-conference ** Also participated in one meeting through tele-conference1 Includes companies as per the provisions of Section 278 of the Companies Act,1956.2 Includes foreign companies and other companies that are excluded as per the provisions of Section 278 of the
Companies Act, 1956. 3 Includes the Audit Committee, the Share Transfer & Shareholders'/ Investors' Grievance Committee and the Board
Governance & Remuneration Committee. Figures in brackets indicate Committee Chairmanships.
17
Number of other Directorships
Name of Member
Board
Meetings attended
during the year
Attendance at last AGM (August 25, 2003)
Of Indian 1Companies
Of Other 2Companies
Number of other
3Committee memberships
Independent non-Executive Directors
N. Vaghul 7 Present 10 11 7(4)
Uday M. Chitale 7 Present 2 4 2(2)
P. C. Ghosh 3 Absent 7 5 1
Satish C. Jha
5
Absent 3
-
2
S.B. Mathur (w.e.f. January 29, 2004)
1
N.A. 8
5
2(1)
*L.N. Mittal 1 Absent - 42 -
Anupam Puri
6
Absent 5
1
7(4)
#Vinod Rai
5
Absent 4
-
1
Somesh R. Sathe
7
Present -
3
-
M. K. Sharma 5 Present 7 1 5(1)
P. M. Sinha
6
Present 3
2
3
*Marti G. Subrahmanyam
2
Absent 1
6
2(1)
V. Prem Watsa
**(w.e.f. January 29, 2004) 1 N.A. - 25 -
Wholetime Directors
K.V. Kamath 7 Present 4 7 -
Lalita D. Gupte 7 Present 4 2 4Kalpana Morparia
7
Present 6
-
6 (1) Chanda D. Kochhar 7 Present 2 1 1 (1)
Nachiket Mor 7 Present 3 1 1
Directors for part of the year
R. Seshasayee (upto October 31, 2003) 3
Present N.A.
N.A.
N.A.
H.N. Sinor (upto May 31, 2003)
-
N.A. N.A.
N.A.
N.A.
S. Mukherji (upto January 31, 2004) 6 Present N.A. N.A. N.A.
dickenson intellinetics 5690 2791 ICICI Annual Report 2004

18
dickenson intellinetics 5690 2791 ICICI Annual Report 2004
:GLOBALISATION 1995 - 2004India moved to integrate itself with the global economy. This created both
challenges and opportunities. ICICI enabled consumption-led growth by
accelerating the availability and affordability of retail finance and bringing
world class technology to banking. ICICI Bank became the first Indian bank to
list on the New York Stock Exchange and emerged as the leading universal
bank in India, going on to build an international footprint with the aim of
becoming a truly global Indian bank.

Directors’ Report
III. Agriculture & Small Enterprises Business Committee
IV. Audit Committee
V. Board Governance & Remuneration Committee
Terms of Reference
The functions of the Committee include review of the business strategy of the Bank in the agri-business
and small enterprises segments and review of the quality of the agricultural lending and small
enterprises finance credit portfolio.
Composition
The Agriculture & Small Enterprises Business Committee, constituted effective July 1, 2003, comprises
five independent Directors, namely, N. Vaghul, Satish C. Jha, Somesh R. Sathe, M. K. Sharma and
P. M. Sinha and is chaired by N. Vaghul.
There was one Meeting of the Committee during the year which was attended by all the Members of
the Committee.
Terms of Reference
The Committee provides direction to the audit and risk management function and monitors the quality
of internal and statutory audit. The responsibilities of the Audit Committee include overseeing of the
financial reporting process to ensure fairness, sufficiency and credibility of financial statements,
recommendation of appointment and removal of central and branch statutory auditors and fixation of
their remuneration, review of the annual financial statements before submission to the Board, review
of the adequacy of internal control systems and the internal audit function, review of compliance with
the inspection and audit reports of RBI and reports of statutory auditors, review of the findings of
internal investigations, discussion on the scope of audit with external auditors and examination of
reasons for substantial defaults, if any, in payment to stakeholders.
Composition
The Audit Committee comprises three independent Directors and is chaired by Uday M. Chitale. There
were six meetings of the Committee during the year. The details of composition of the Committee and
attendance at its Meetings are given in the following table:
1 Appointed as Alternate Chairman of the Audit Committee effective July 22, 2004.2 R. Seshasayee was the Chairman of the Audit Committee upto October 31, 2003. On his resignation, Uday M. Chitale
was elected as the Chairman of the Audit Committee effective January 29, 2004.
Terms of Reference
The functions of the Committee include recommendation of appointments to the Board, evaluation of
the performance of the Managing Director & CEO and wholetime Directors on pre-determined
parameters, recommendation to the Board of the remuneration (including performance bonus and
perquisites) to wholetime Directors, approval of the policy for and quantum of bonus payable to the
members of the staff, framing of guidelines for the Employees Stock Option Scheme and
Name of Member Number of Meetings attended
66 3
3
Uday M. Chitale, Chairman
Somesh R. Sathe 1M.K. Sharma (w.e.f. August 25, 2003)
2R. Seshasayee (upto October 31, 2003)
19
dickenson intellinetics 5690 2791 ICICI Annual Report 2004
recommendation of grant of stock options to the staff and wholetime Directors of ICICI Bank and its
subsidiary companies.
Composition
The Board Governance & Remuneration Committee comprises three independent Directors and is
chaired by N. Vaghul. There were three meetings of the Committee during the year. The details of
composition of the Committee and attendance at its Meetings are given in the following table:
Remuneration policy
The Board Governance & Remuneration Committee has the power to determine and recommend to the
Board the amount of remuneration, including performance/achievement bonus and perquisites,
payable to the wholetime Directors. The recommendations of the Committee are based on evaluation
of the wholetime Directors on certain parameters, as laid down by the Board as part of the self-
evaluation process.
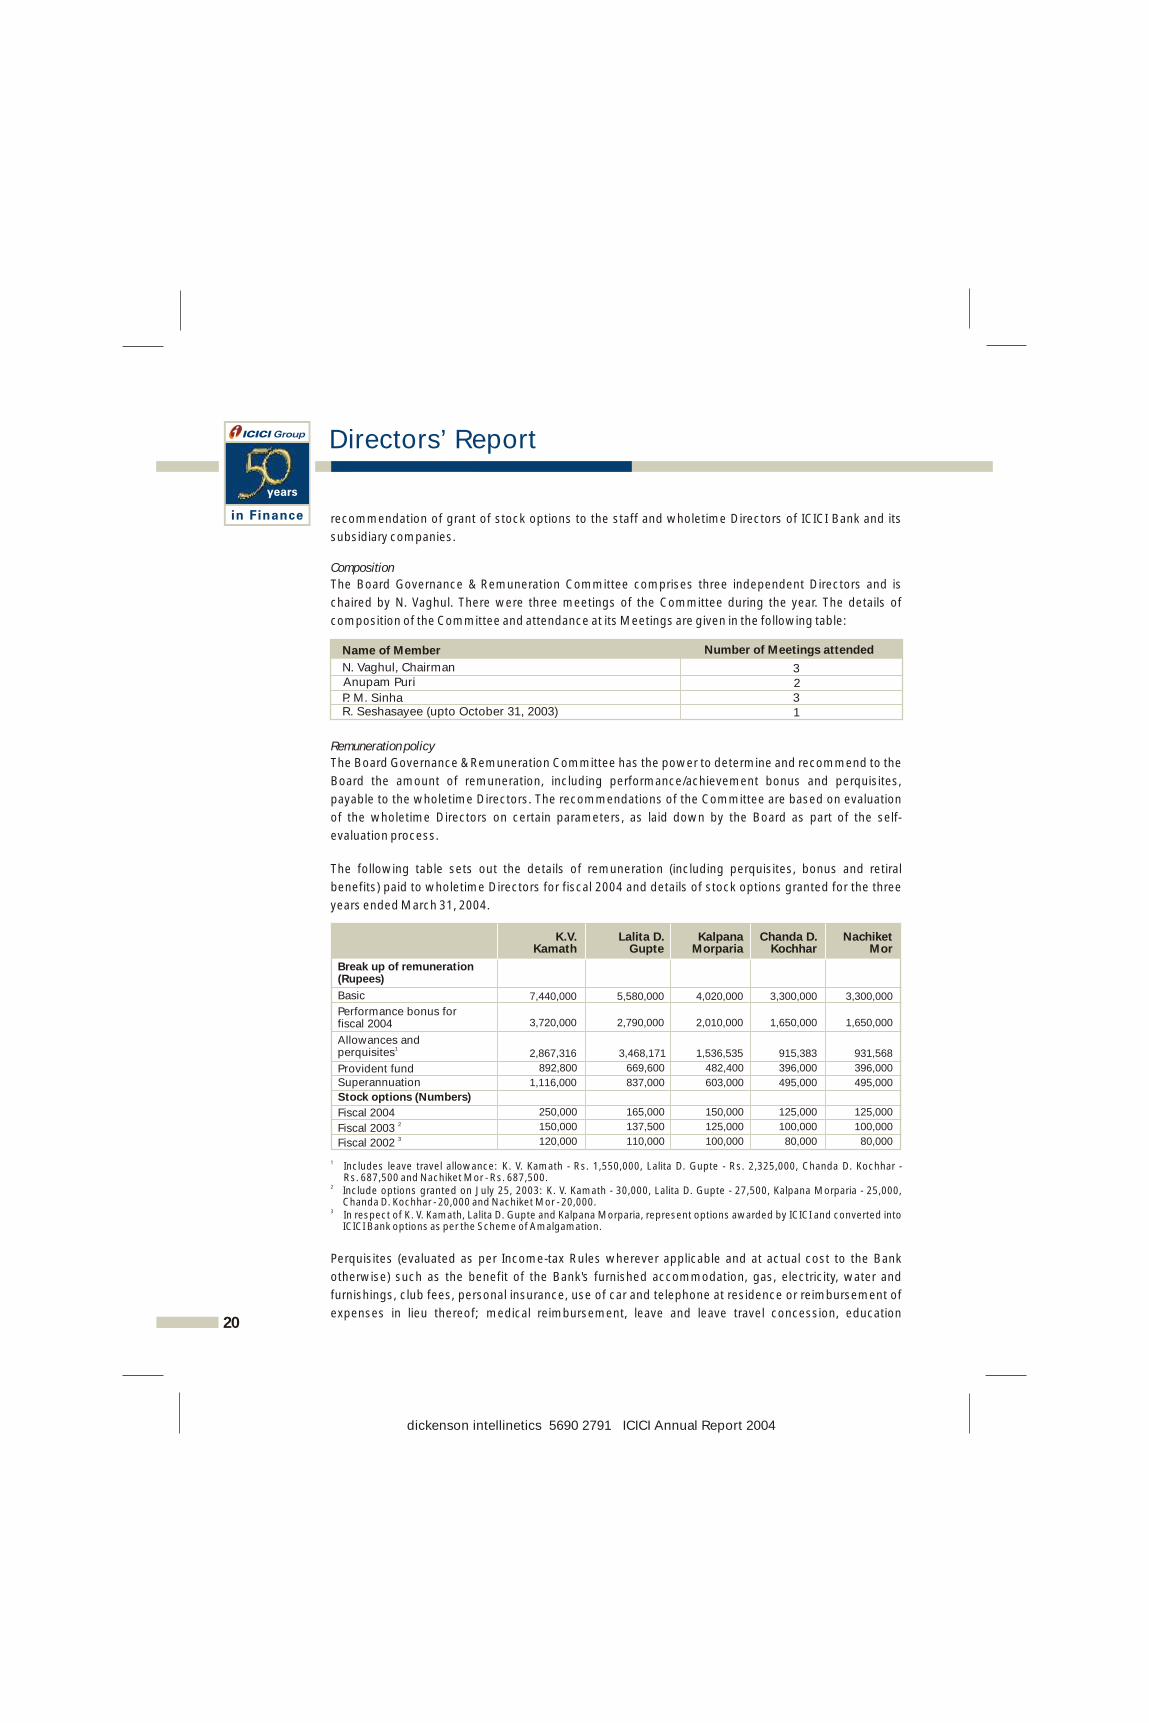
The following table sets out the details of remuneration (including perquisites, bonus and retiral
benefits) paid to wholetime Directors for fiscal 2004 and details of stock options granted for the three
years ended March 31, 2004.
1 Includes leave travel allowance: K. V. Kamath - Rs. 1,550,000, Lalita D. Gupte - Rs. 2,325,000, Chanda D. Kochhar - Rs. 687,500 and Nachiket Mor - Rs. 687,500.
2 Include options granted on July 25, 2003: K. V. Kamath - 30,000, Lalita D. Gupte - 27,500, Kalpana Morparia - 25,000, Chanda D. Kochhar - 20,000 and Nachiket Mor - 20,000.
3 In respect of K. V. Kamath, Lalita D. Gupte and Kalpana Morparia, represent options awarded by ICICI and converted into ICICI Bank options as per the Scheme of Amalgamation.
Perquisites (evaluated as per Income-tax Rules wherever applicable and at actual cost to the Bank
otherwise) such as the benefit of the Bank's furnished accommodation, gas, electricity, water and
furnishings, club fees, personal insurance, use of car and telephone at residence or reimbursement of
expenses in lieu thereof; medical reimbursement, leave and leave travel concession, education 20
Name of Member Number of Meetings attended
N. Vaghul, Chairman 32
31
Anupam Puri
P. M. SinhaR. Seshasayee (upto October 31, 2003)
Directors’ Report
Break up of remuneration (Rupees)
Basic 7,440,000 5,580,000 4,020,000 3,300,000 3,300,000
Provident fund 892,800 669,600 482,400 396,000 396,000
Superannuation 1,116,000 837,000 603,000 495,000 495,000
Stock options (Numbers)
Fiscal 2004 250,000 165,000 150,000 125,000 125,000
Performance bonus for fiscal 2004 3,720,000 2,790,000 2,010,000 1,650,000 1,650,000
Allowances and 1perquisites 2,867,316 3,468,171 1,536,535 915,383 931,568
2Fiscal 2003 150,000 137,500 125,000 100,000 100,000
120,000 110,000 100,000 80,000 80,000
Gupte MorpariaK.V.
KamathLalita D. Kalpana Chanda D.
KochharNachiket
Mor
3Fiscal 2002
dickenson intellinetics 5690 2791 ICICI Annual Report 2004
benefits, provident fund, superannuation fund and gratuity, were provided in accordance with the
scheme(s) and rule(s) applicable from time to time. If accommodation owned by the Bank was not
provided, the concerned wholetime Director was eligible for house rent allowance of Rs. 50,000 per
month and maintenance of accommodation including furniture, fixtures and furnishings, as may have
been provided by the Bank.
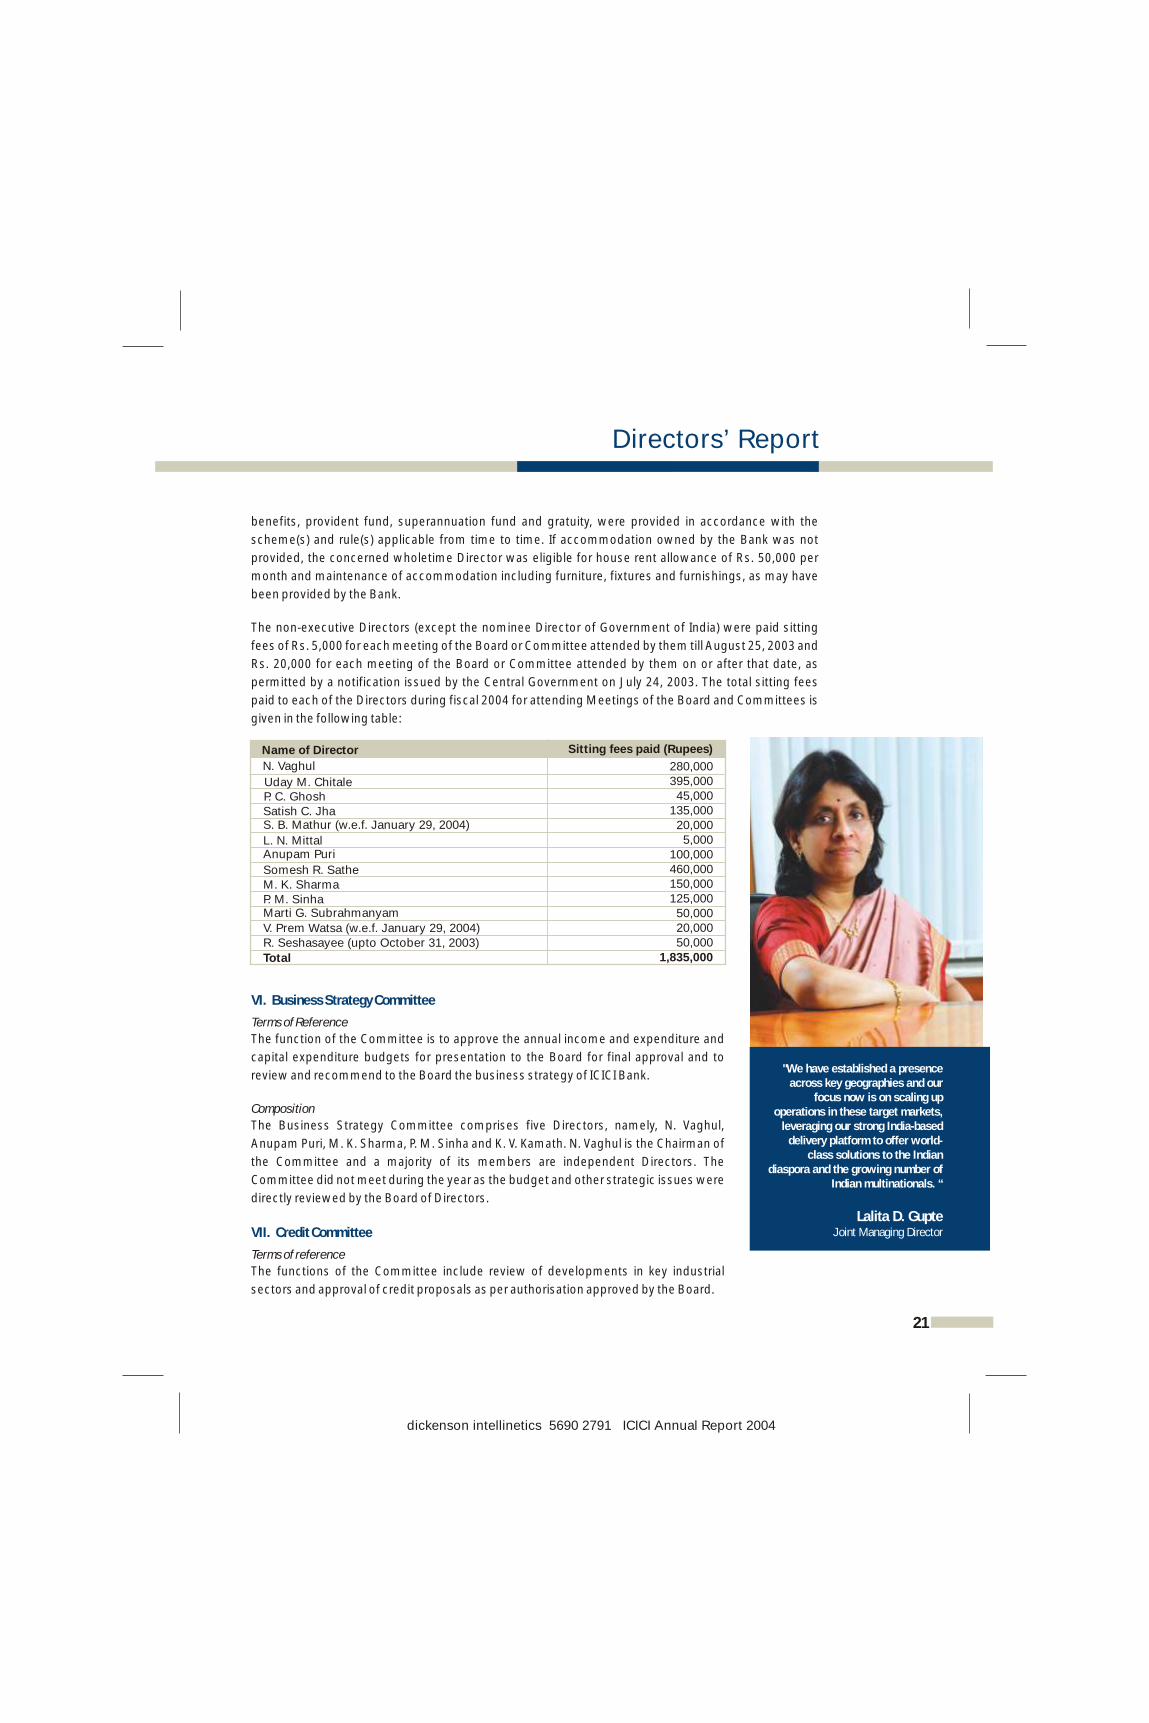
The non-executive Directors (except the nominee Director of Government of India) were paid sitting
fees of Rs. 5,000 for each meeting of the Board or Committee attended by them till August 25, 2003 and
Rs. 20,000 for each meeting of the Board or Committee attended by them on or after that date, as
permitted by a notification issued by the Central Government on July 24, 2003. The total sitting fees
paid to each of the Directors during fiscal 2004 for attending Meetings of the Board and Committees is
given in the following table:
Terms of Reference
The function of the Committee is to approve the annual income and expenditure and
capital expenditure budgets for presentation to the Board for final approval and to
review and recommend to the Board the business strategy of ICICI Bank.
Composition
The Business Strategy Committee comprises five Directors, namely, N. Vaghul,
Anupam Puri, M. K. Sharma, P. M. Sinha and K. V. Kamath. N. Vaghul is the Chairman of
the Committee and a majority of its members are independent Directors. The
Committee did not meet during the year as the budget and other strategic issues were
directly reviewed by the Board of Directors.
Terms of reference
The functions of the Committee include review of developments in key industrial
sectors and approval of credit proposals as per authorisation approved by the Board.
VI. Business Strategy Committee
VII. Credit Committee
Name of Director Sitting fees paid (Rupees)
N. Vaghul 280,000395,00045,000
135,000
Uday M. ChitaleP. C. Ghosh Satish C. Jha S. B. Mathur (w.e.f. January 29, 2004) 20,000
5,000100,000460,000
L. N. Mittal Anupam Puri
Somesh R. Sathe M. K. Sharma 150,000
125,00050,00020,000
P. M. Sinha Marti G. Subrahmanyam
V. Prem Watsa (w.e.f. January 29, 2004)R. Seshasayee (upto October 31, 2003) 50,000
1,835,000Total
21
Directors’ Report
"We have established a presence across key geographies and our
focus now is on scaling up operations in these target markets,
leveraging our strong India-based delivery platform to offer world-
class solutions to the Indian diaspora and the growing number of
Indian multinationals. “
Lalita D. GupteJoint Managing Director
dickenson intellinetics 5690 2791 ICICI Annual Report 2004
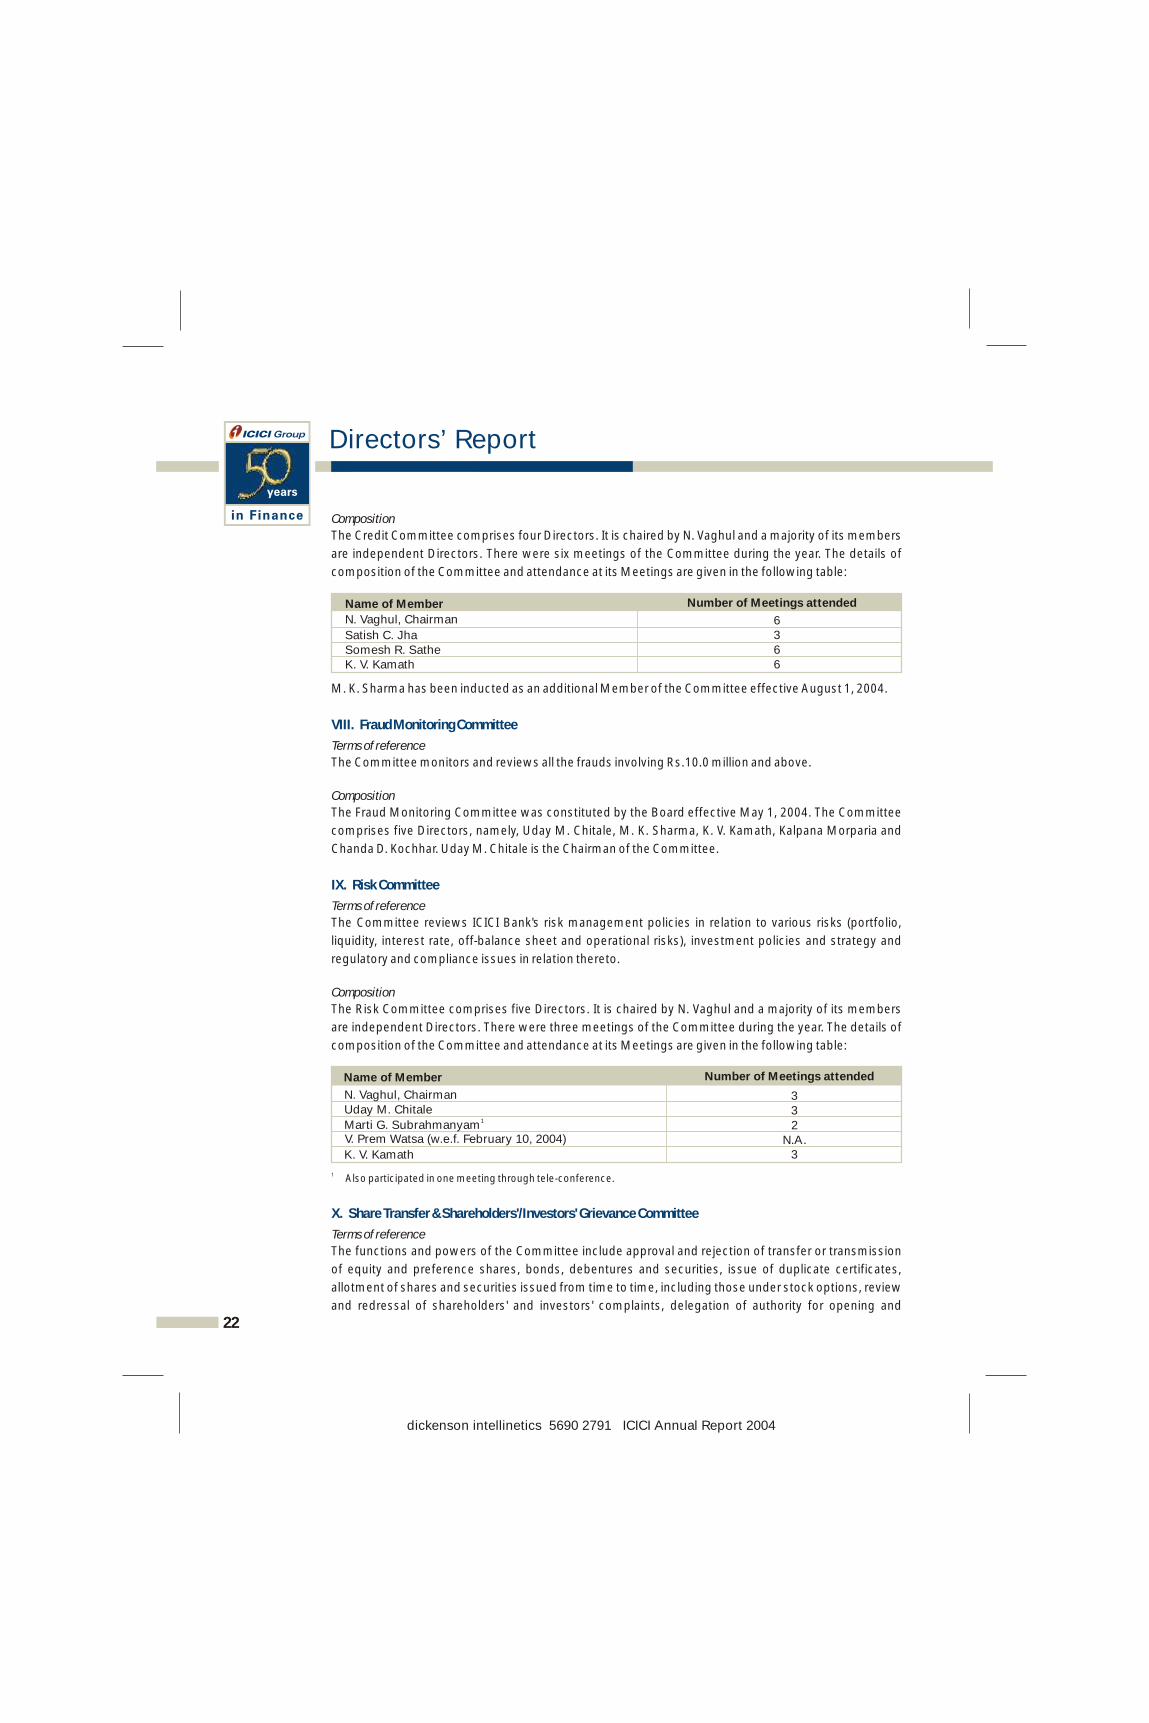
Composition
The Credit Committee comprises four Directors. It is chaired by N. Vaghul and a majority of its members
are independent Directors. There were six meetings of the Committee during the year. The details of
composition of the Committee and attendance at its Meetings are given in the following table:
M. K. Sharma has been inducted as an additional Member of the Committee effective August 1, 2004.
Terms of reference
The Committee monitors and reviews all the frauds involving Rs.10.0 million and above.
Composition
The Fraud Monitoring Committee was constituted by the Board effective May 1, 2004. The Committee
comprises five Directors, namely, Uday M. Chitale, M. K. Sharma, K. V. Kamath, Kalpana Morparia and
Chanda D. Kochhar. Uday M. Chitale is the Chairman of the Committee.
Terms of reference
The Committee reviews ICICI Bank's risk management policies in relation to various risks (portfolio,
liquidity, interest rate, off-balance sheet and operational risks), investment policies and strategy and
regulatory and compliance issues in relation thereto.
Composition
The Risk Committee comprises five Directors. It is chaired by N. Vaghul and a majority of its members
are independent Directors. There were three meetings of the Committee during the year. The details of
composition of the Committee and attendance at its Meetings are given in the following table:
1 Also participated in one meeting through tele-conference.
Terms of reference
The functions and powers of the Committee include approval and rejection of transfer or transmission
of equity and preference shares, bonds, debentures and securities, issue of duplicate certificates,
allotment of shares and securities issued from time to time, including those under stock options, review
and redressal of shareholders' and investors' complaints, delegation of authority for opening and
VIII. Fraud Monitoring Committee
IX. Risk Committee
X. Share Transfer & Shareholders'/Investors' Grievance Committee
Name of Member Number of Meetings attended
N. Vaghul, Chairman 63
66
Satish C. Jha Somesh R. SatheK. V. Kamath
22
Directors’ Report
dickenson intellinetics 5690 2791 ICICI Annual Report 2004
Name of Member Number of Meetings attended
N. Vaghul, Chairman 3Uday M. Chitale 3
1Marti G. Subrahmanyam 2 V. Prem Watsa (w.e.f. February 10, 2004) N.A. K. V. Kamath 3
Directors’ Report
operation of bank accounts for payment of interest, dividend and redemption of securities and the
listing of securities on stock exchanges.
Composition
The Share Transfer & Shareholders'/Investors' Grievance Committee comprises four Directors and is
chaired by Uday M. Chitale, an independent Director. There were 12 Meetings of the Committee during
the year. The details of composition of the Committee and attendance at its Meetings are given below:
Jyotin Mehta, General Manager & Company Secretary, is the Compliance Officer. Of
the total of 402 shareholder complaints received in fiscal 2004, 400 complaints were
processed to the satisfaction of shareholders. At March 31, 2004, 2 complaints were
pending. These complaints have been resolved in April 2004. No applications were
pending for transfer of shares as on March 31, 2004.
Terms of reference
The powers of the Committee include review of performance against targets for
various business segments, credit approvals as per authorisation approved by the
Board, approvals in respect of borrowing and treasury operations and premises and
property related matters.
Composition
The Committee of Directors comprises all five wholetime Directors and is chaired by
K.V. Kamath, Managing Director & CEO.
Terms of reference
The functions of the Committee include management of the balance sheet of the
Bank, review of the asset-liability profile of the Bank with a view to manage the market
risk exposure assumed by the Bank and deciding the deposit rates and Prime Lending
Rate (PLR) of the Bank.
Composition
The Asset Liability Management Committee comprises the Joint Managing Director,
Deputy Managing Director and two Executive Directors and is chaired by
Lalita D. Gupte, Joint Managing Director.
XI. Committee of Directors
XII. Asset Liability Management Committee
Name of Member Number of Meetings attended
Uday M. Chitale, Chairman
Somesh R. SatheH. N. Sinor (up to May 31, 2003)Kalpana Morparia
Chanda D. Kochhar (w.e.f. June 1, 2003)
1212
110
7
23
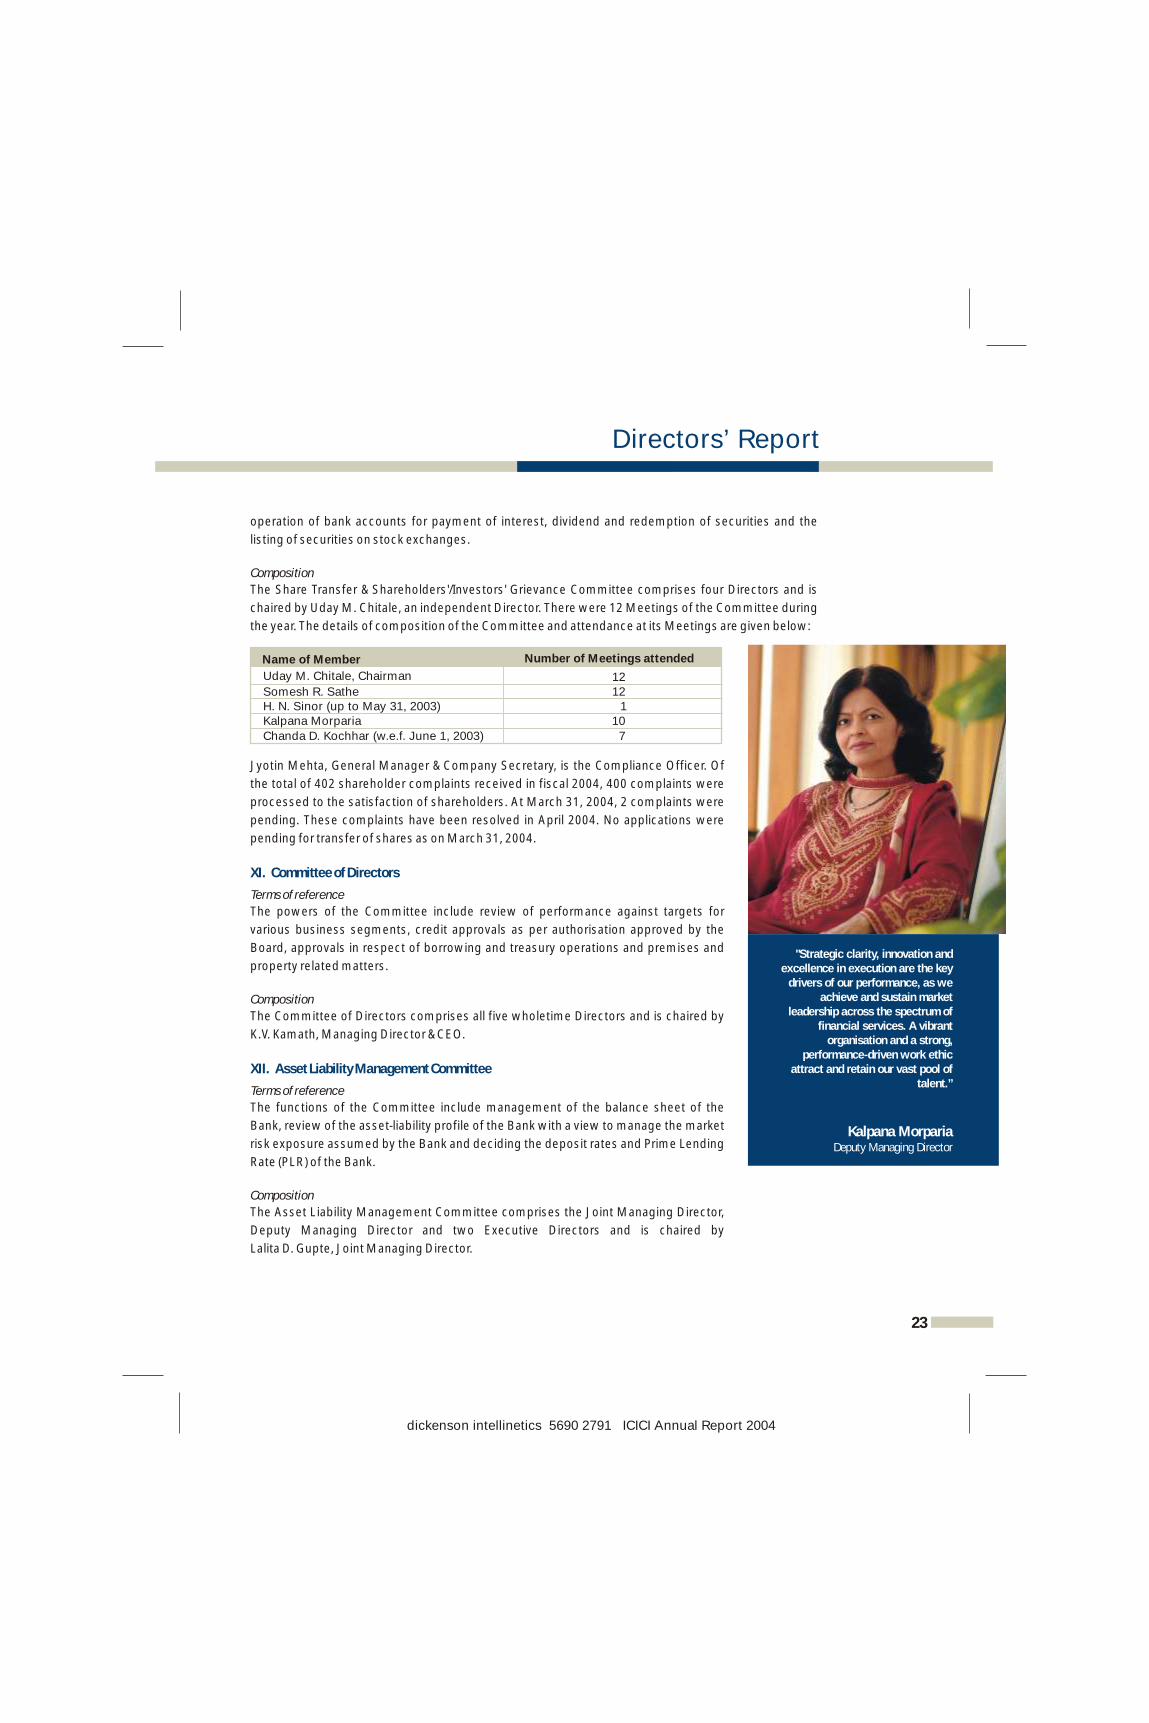
"Strategic clarity, innovation and excellence in execution are the key
drivers of our performance, as we achieve and sustain market
leadership across the spectrum of financial services. A vibrant
organisation and a strong, performance-driven work ethic
attract and retain our vast pool of talent.”
Kalpana MorpariaDeputy Managing Director
dickenson intellinetics 5690 2791 ICICI Annual Report 2004
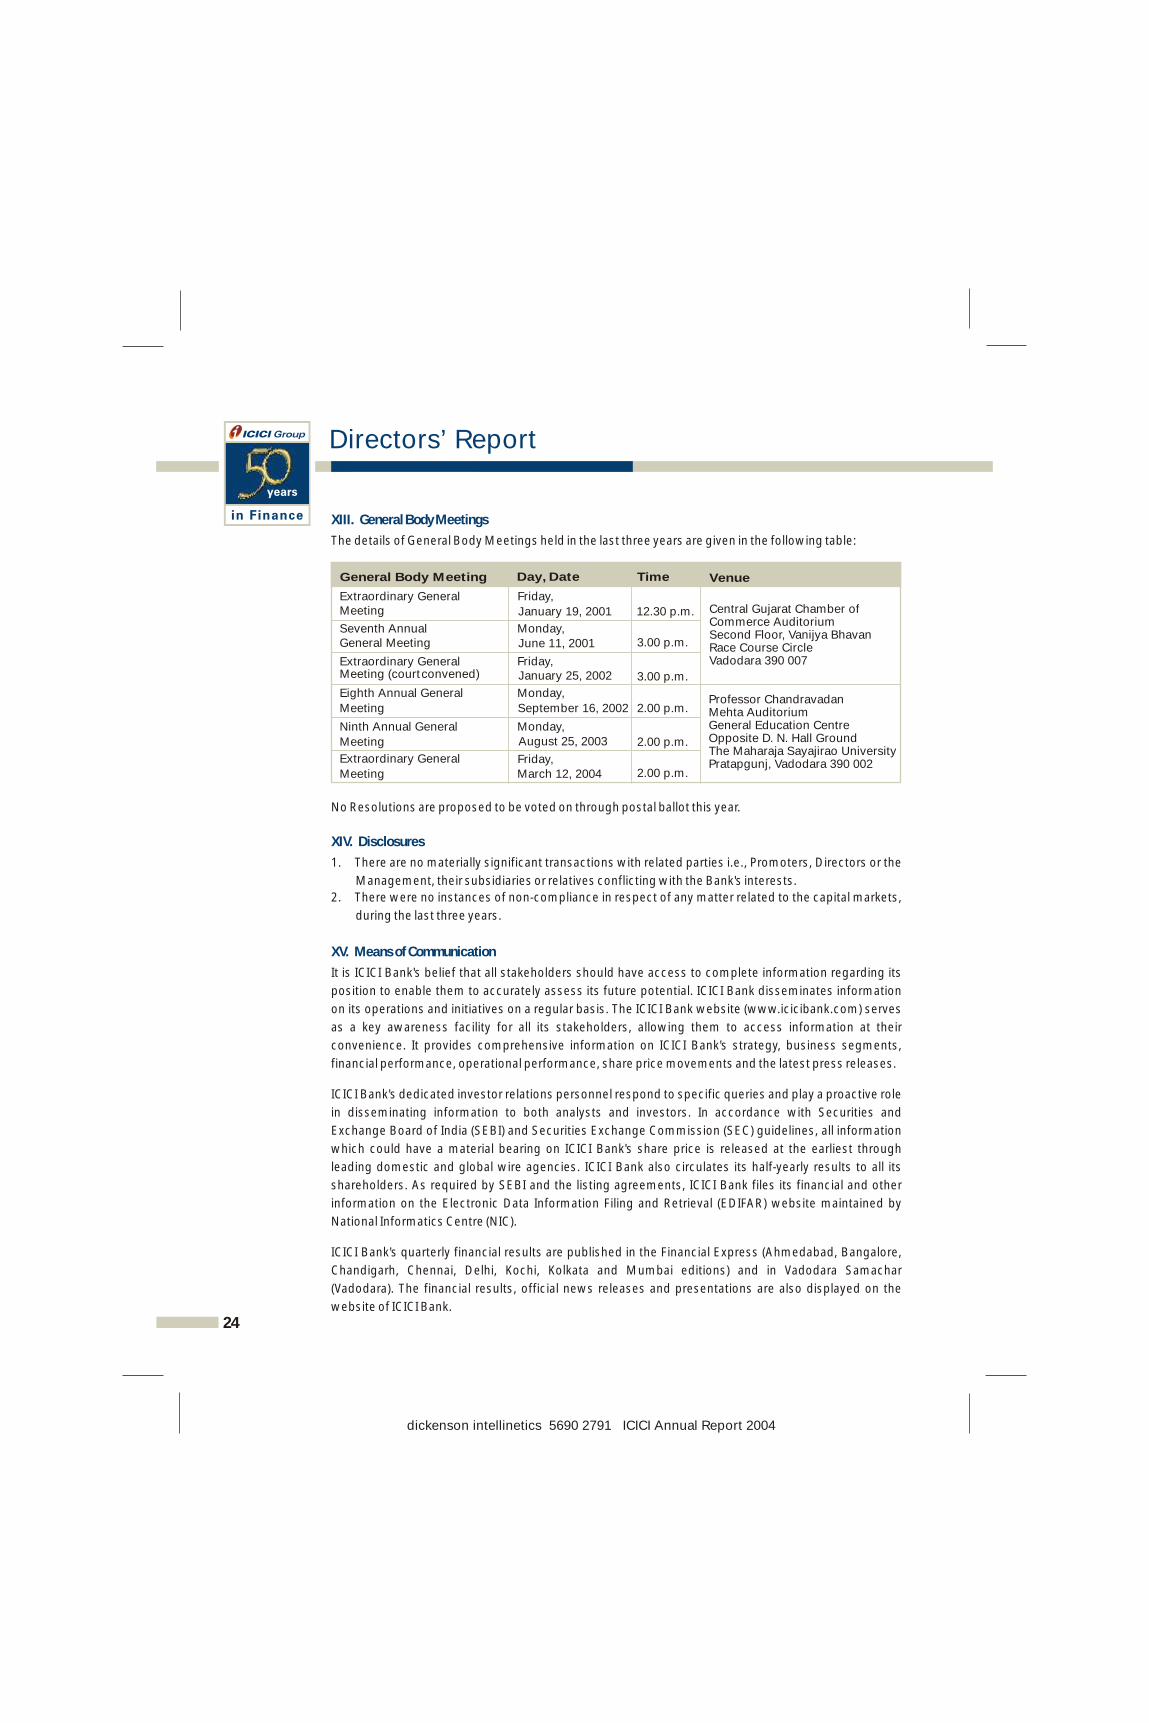
XIII. General Body Meetings
XIV. Disclosures
XV. Means of Communication
The details of General Body Meetings held in the last three years are given in the following table:
No Resolutions are proposed to be voted on through postal ballot this year.
1. There are no materially significant transactions with related parties i.e., Promoters, Directors or the
Management, their subsidiaries or relatives conflicting with the Bank's interests.
2. There were no instances of non-compliance in respect of any matter related to the capital markets,
during the last three years.
It is ICICI Bank's belief that all stakeholders should have access to complete information regarding its
position to enable them to accurately assess its future potential. ICICI Bank disseminates information
on its operations and initiatives on a regular basis. The ICICI Bank website (www.icicibank.com) serves
as a key awareness facility for all its stakeholders, allowing them to access information at their
convenience. It provides comprehensive information on ICICI Bank's strategy, business segments,
financial performance, operational performance, share price movements and the latest press releases.
ICICI Bank's dedicated investor relations personnel respond to specific queries and play a proactive role
in disseminating information to both analysts and investors. In accordance with Securities and
Exchange Board of India (SEBI) and Securities Exchange Commission (SEC) guidelines, all information
which could have a material bearing on ICICI Bank's share price is released at the earliest through
leading domestic and global wire agencies. ICICI Bank also circulates its half-yearly results to all its
shareholders. As required by SEBI and the listing agreements, ICICI Bank files its financial and other
information on the Electronic Data Information Filing and Retrieval (EDIFAR) website maintained by
National Informatics Centre (NIC).
ICICI Bank's quarterly financial results are published in the Financial Express (Ahmedabad, Bangalore,
Chandigarh, Chennai, Delhi, Kochi, Kolkata and Mumbai editions) and in Vadodara Samachar
(Vadodara). The financial results, official news releases and presentations are also displayed on the
website of ICICI Bank.
24
Directors’ Report
dickenson intellinetics 5690 2791 ICICI Annual Report 2004
General Body Meeting Day, Date Time Venue
Extraordinary General Meeting
Friday,
January 19, 2001 12.30 p.m.
Seventh Annual General Meeting
Monday, June 11, 2001 3.00 p.m.
Meeting (court convened)Extraordinary General Friday,
January 25, 2002 3.00 p.m.
Central Gujarat Chamber of Commerce Auditorium Second Floor, Vanijya Bhavan Race Course Circle Vadodara 390 007
Eighth Annual General
Meeting
Monday,
September 16, 2002 2.00 p.m.
Ninth Annual General
Meeting
Monday,August 25, 2003 2.00 p.m.
Extraordinary General
MeetingFriday, March 12, 2004 2.00 p.m.
Professor Chandravadan Mehta Auditorium General Education Centre Opposite D. N. Hall Ground The Maharaja Sayajirao University Pratapgunj, Vadodara 390 002
Directors’ Report
The Management's Discussion & Analysis forms part of the Annual Report.
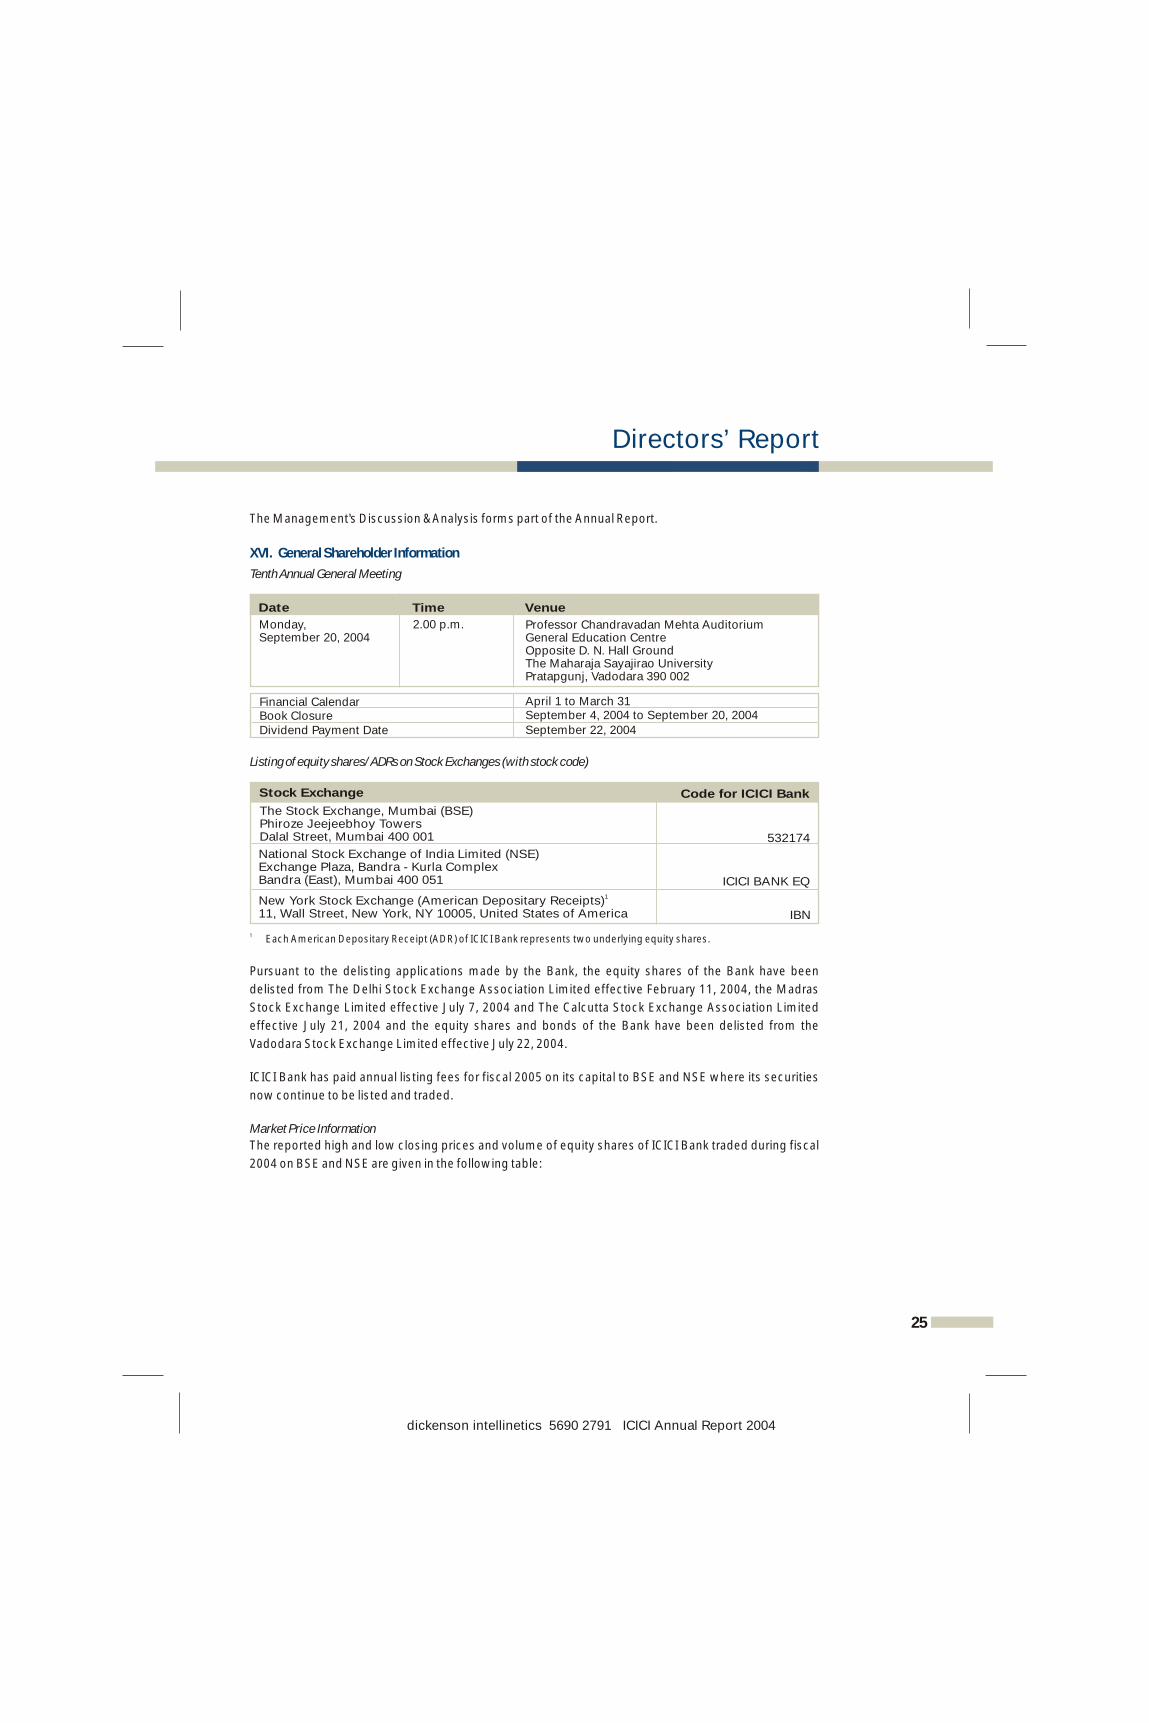
Tenth Annual General Meeting
Listing of equity shares/ ADRs on Stock Exchanges (with stock code)
1 Each American Depositary Receipt (ADR) of ICICI Bank represents two underlying equity shares.
Pursuant to the delisting applications made by the Bank, the equity shares of the Bank have been
delisted from The Delhi Stock Exchange Association Limited effective February 11, 2004, the Madras
Stock Exchange Limited effective July 7, 2004 and The Calcutta Stock Exchange Association Limited
effective July 21, 2004 and the equity shares and bonds of the Bank have been delisted from the
Vadodara Stock Exchange Limited effective July 22, 2004.
ICICI Bank has paid annual listing fees for fiscal 2005 on its capital to BSE and NSE where its securities
now continue to be listed and traded.
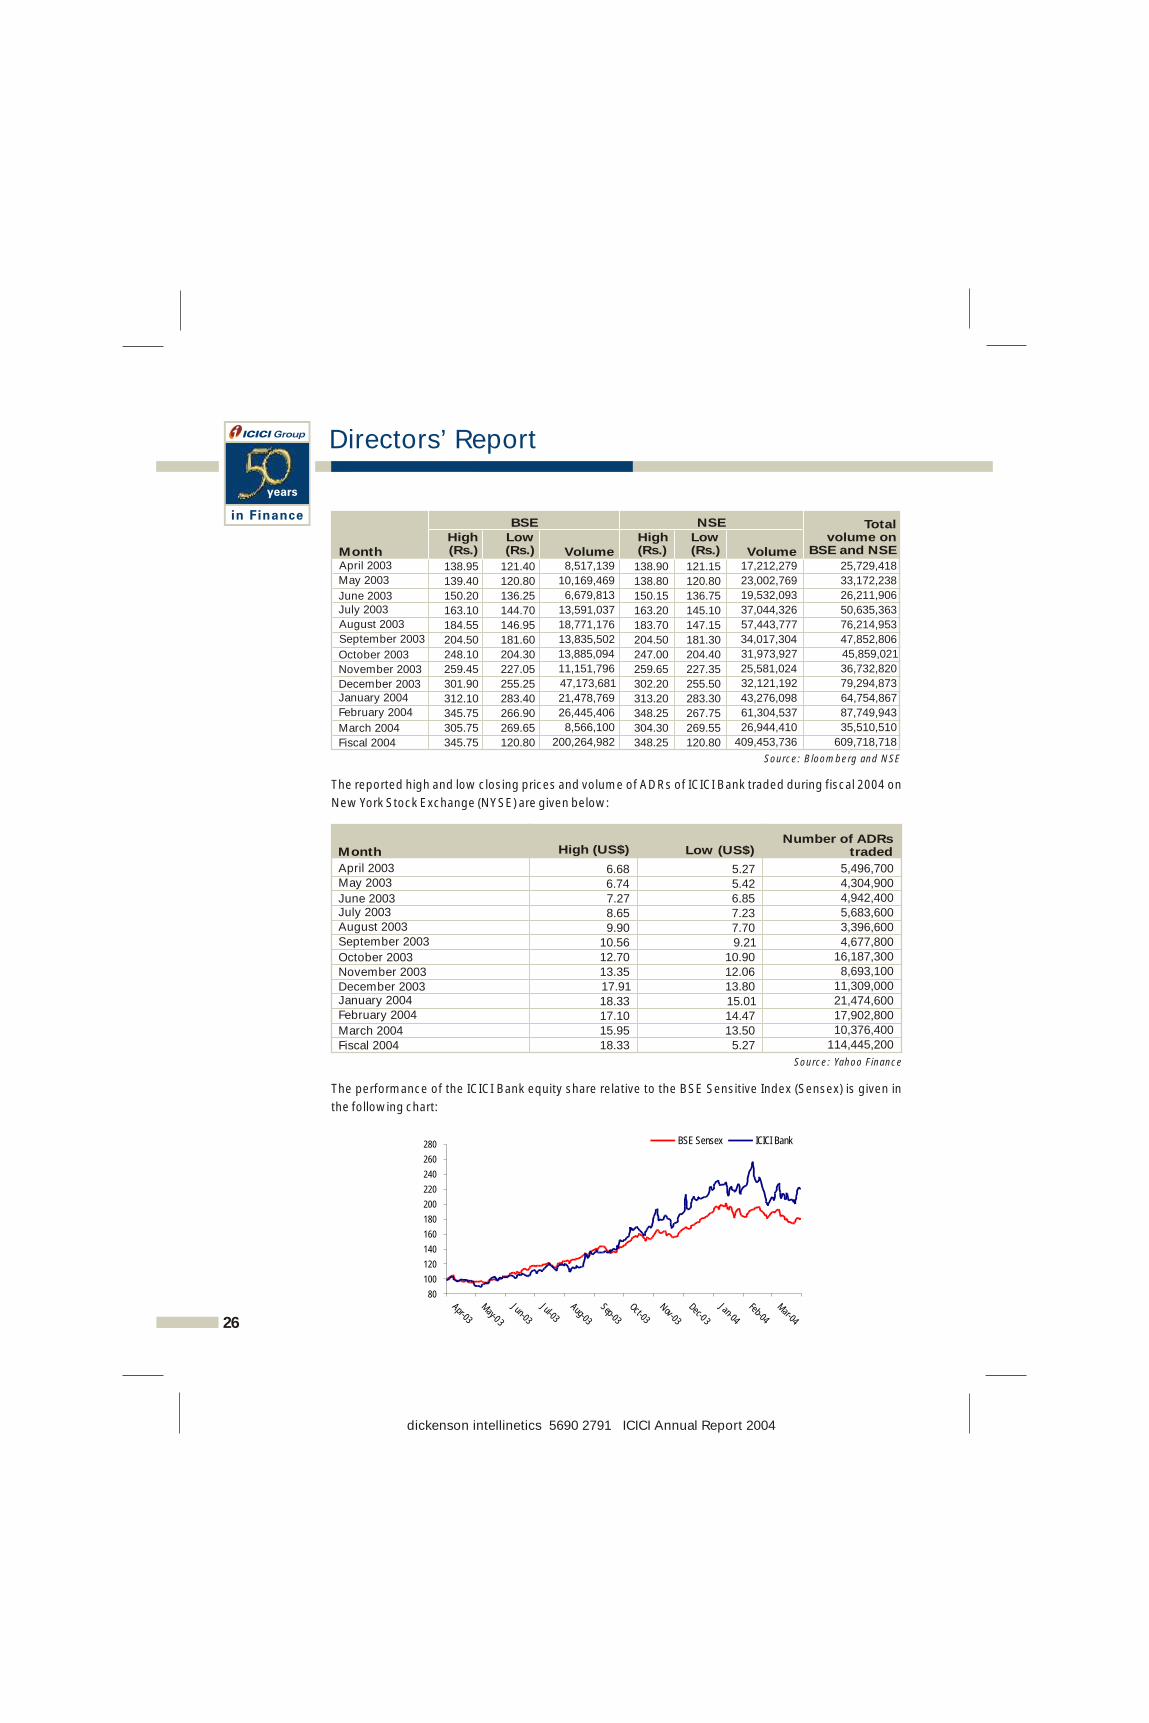
Market Price Information
The reported high and low closing prices and volume of equity shares of ICICI Bank traded during fiscal
2004 on BSE and NSE are given in the following table:
XVI. General Shareholder Information
Date Time Venue
Monday, September 20, 2004
2.00 p.m. Professor Chandravadan Mehta Auditorium General Education Centre Opposite D. N. Hall Ground The Maharaja Sayajirao University Pratapgunj, Vadodara 390 002
Financial CalendarBook ClosureDividend Payment Date
April 1 to March 31September 4, 2004 to September 20, 2004September 22, 2004
25
National Stock Exchange of India Limited (NSE) Exchange Plaza, Bandra - Kurla ComplexBandra (East), Mumbai 400 051
1 New York Stock Exchange (American Depositary Receipts)11, Wall Street, New York, NY 10005, United States of America
Stock Exchange
The Stock Exchange, Mumbai (BSE) Phiroze Jeejeebhoy Towers Dalal Street, Mumbai 400 001
ICICI BANK EQ
IBN
Code for ICICI Bank
532174
dickenson intellinetics 5690 2791 ICICI Annual Report 2004
Directors’ Report
The reported high and low closing prices and volume of ADRs of ICICI Bank traded during fiscal 2004 on
New York Stock Exchange (NYSE) are given below:
The performance of the ICICI Bank equity share relative to the BSE Sensitive Index (Sensex) is given in
the following chart:
Source: Yahoo Finance
Low (US$)Month High (US$)
Number of ADRs traded
April 2003May 2003
June 2003July 2003August 2003
September 2003
October 2003November 2003December 2003January 2004February 2004
March 2004Fiscal 2004
6.68 6.74 7.27 8.65 9.90 10.56 12.70 13.35 17.91 18.33 17.10 15.95 18.33
5.27 5.42 6.85 7.23 7.70 9.21 10.90 12.06 13.80 15.01 14.47 13.50 5.27
5,496,700 4,304,900 4,942,400
5,683,600 3,396,600 4,677,800 16,187,300 8,693,100 11,309,000 21,474,600 17,902,800 10,376,400
114,445,200
26
July 2003
August 2003
September 2003
October 2003
November 2003
December 2003January 2004
February 2004
March 2004
Fiscal 2004
37,044,326
57,443,777
34,017,304
31,973,927
25,581,024
32,121,192
43,276,098
61,304,537
26,944,410
409,453,736
50,635,363
76,214,953
47,852,806
45,859,021
36,732,820
79,294,873
64,754,867
87,749,943
35,510,510
609,718,718
Month
BSEHigh(Rs.)
NSE Total volume on
BSE and NSELow (Rs.) Volume
High(Rs.)
Low (Rs.) Volume
April 2003 17,212,279 25,729,418 May 2003 23,002,769 33,172,238
June 2003
163.10
184.55
204.50
248.10
259.45
301.90
312.10
345.75
305.75
345.75
138.95
139.40
150.20
144.70
146.95
181.60
204.30
227.05
255.25
283.40
266.90
269.65
120.80
121.40
120.80
136.25 13,591,037
18,771,176
13,835,502
13,885,094
11,151,796
47,173,681
21,478,769
26,445,406
8,566,100
200,264,982
8,517,139
10,169,469
6,679,813
163.20
183.70
204.50
247.00
259.65
302.20
313.20
348.25
304.30
348.25
138.90
138.80
150.15
145.10
147.15
181.30
204.40
227.35
255.50
283.30
267.75
269.55
120.80
121.15
120.80
136.75 19,532,093 26,211,906
Source: Bloomberg and NSE
80
100
120
140
160
180
200
220
240
260
280
Apr-03
May-03
Jun-03
Jul-03
Aug-03
Sep-03
Oct-03
Nov-03
Dec-03
Jan-04
Feb-04
Mar-04
BSE Sensex ICICI Bank
dickenson intellinetics 5690 2791 ICICI Annual Report 2004
Share Transfer System
ICICI Bank's investor services are handled by ICICI Infotech Limited (ICICI Infotech).
ICICI Infotech operates in the following main areas of business: software consultancy
and development, IT-enabled services, IT infrastructure and network and facilities
management services. ICICI Infotech has received the ISO-9001 certification for its
transaction processing activities.
As per SEBI guidelines, ICICI Bank's equity shares are being traded only in
dematerialised form. During the year, 6,028,463 equity shares of ICICI Bank were
transferred into electronic mode, involving 85,284 certificates. At March 31, 2004
about 96.19% of ICICI Bank's paid-up equity (including equity shares represented by
ADRs constituting 25.94% of the paid-up equity share capital) comprising
592,893,127 equity shares had been dematerialised.
Physical share transfers are registered and returned typically within a period of seven
days from the date of receipt, if the documents are correct and valid in all respects. A
letter is sent to the shareholder giving an option to receive shares in physical or
dematerialised mode. A period of 30 days is given to the shareholder for sending his
intimation. The shareholder then receives the shares in the form he exercises his
option for. However, effective February 10, 2004, SEBI has withdrawn its transfer-
cum-demat scheme. No applications for transfer of equity shares were pending as on
March 31, 2004.
The number of equity shares of ICICI Bank transferred during the last three years
(excluding electronic transfers of shares in dematerialised form) is given below:
As required under Clause 47(c) of the listing agreements entered into by ICICI Bank with stock
exchanges, a half yearly certificate is being obtained from a firm of practising Company Secretaries,
with regard to, inter alia, effecting transfer, transmission, sub-division, consolidation, renewal and
exchange of equity shares and bonds in the nature of debentures within one month of their lodgement.
The certificates are forwarded to stock exchanges where the equity shares are listed within 24 hours of
issuance and also placed before the Board.
In terms of SEBI's circular no. D&CC/FITTC/CIR-16 dated December 31, 2002, a Secretarial Audit is being
conducted on a quarterly basis by a firm of Chartered Accountants, for the purpose of, inter alia,
reconciliation of the total admitted equity shares with the depositories and in the physical form with the
total issued/paid-up equity capital of ICICI Bank. Certificates issued in this regard are placed before the
Share Transfer & Shareholders'/Investors' Grievance Committee and forwarded to stock exchanges
where the equity shares of ICICI Bank are listed.
For any share-related queries, please call ICICI Infotech at +91-22-5592 8000, fax your query to
+91-22-5592 8099 or email to [email protected].
Number of shares transferred 315,038 1,126,355 1,105,135
Fiscal 2003
Fiscal 2002 Fiscal 2004
Number of transfer deeds 2,114 8,140 17,675
27
Directors’ Report
"We are today the largest provider of retail finance in the country;
blending technology, distribution and product skills to offer
customer-friendly financial solutions. Going forward, we will
focus on further expanding our distribution and providing a superior
banking experience to our customers.”
Chanda D. KochharExecutive Director
dickenson intellinetics 5690 2791 ICICI Annual Report 2004
Directors’ Report
Registrar and Transfer Agent
The Registrar and Transfer Agent of ICICI Bank is ICICI Infotech Limited. Investor services related
queries may be directed to Padmanabhan Iyer at either of the addresses below:
ICICI Infotech Limited ICICI Infotech Limited
International Infotech Park Maratha Mandir Annex
Tower 5, 4th Floor, Navi Mumbai 400 705 Dr. A. R. Nair Road
Tel No.: +91-22-5592 8000 Mumbai Central
Fax: +91-22-5592 8099 Mumbai 400 008
Queries relating to the operational and financial performance of ICICI Bank may be addressed to:
Rakesh Jha/Anindya Banerjee
ICICI Bank Limited
ICICI Bank Towers
Bandra-Kurla Complex, Mumbai 400 051
Tel No. : +91-22-2653 1414
Fax No. : +91-22-2653 1175
E-mail : [email protected]
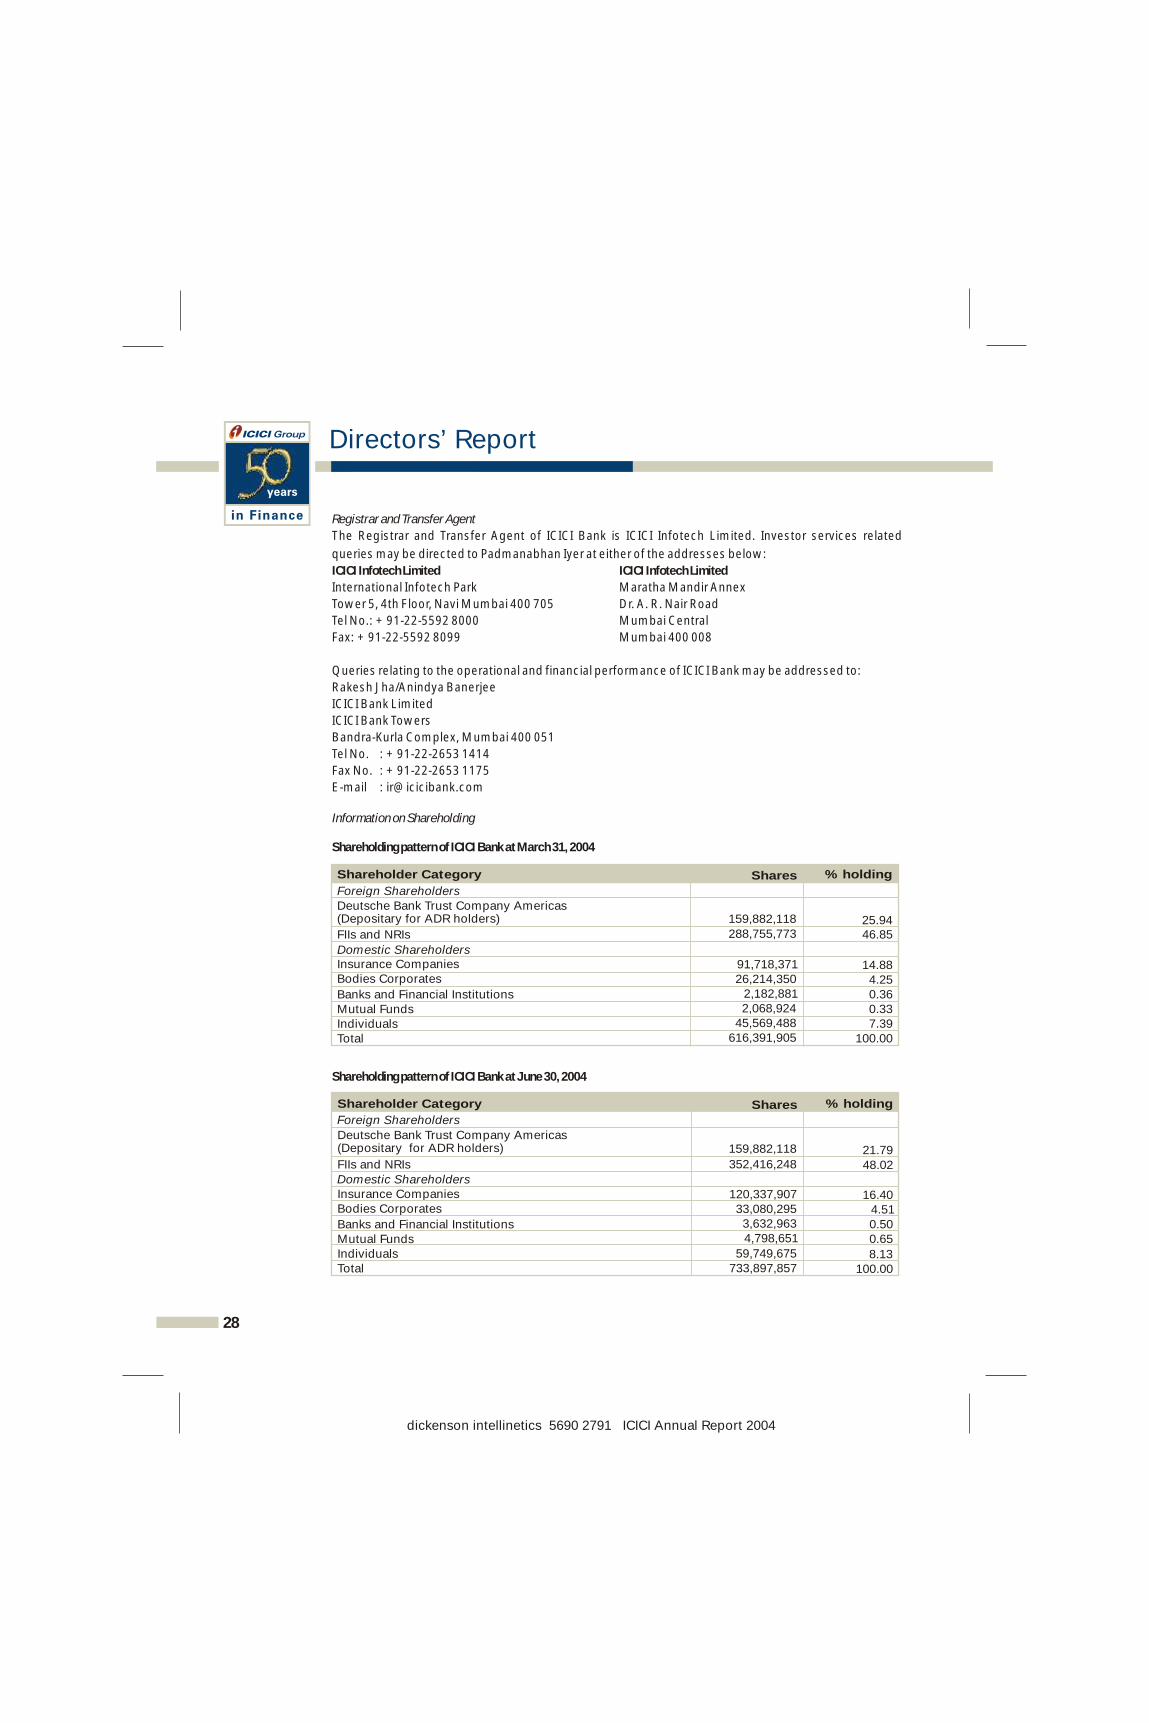
Information on Shareholding
Shareholding pattern of ICICI Bank at March 31, 2004
Shareholding pattern of ICICI Bank at June 30, 2004
28
FIIs and NRIs
Foreign Shareholders
Domestic Shareholders
288,755,773 46.85
Insurance Companies 91,718,371 14.88 Bodies Corporates 26,214,350 4.25 Banks and Financial Institutions 2,182,881 0.36 Mutual Funds 2,068,924 0.33Individuals 45,569,488 7.39 Total 616,391,905 100.00
FIIs and NRIs
Insurance CompaniesBodies Corporates
Banks and Financial InstitutionsMutual FundsIndividualsTotal
Shares Shareholder Category % holding
Deutsche Bank Trust Company Americas (Depositary for ADR holders) 159,882,118 21.79
352,416,248
48.02
120,337,907 16.40
33,080,295 4.51
3,632,963 0.50
4,798,651 0.65
59,749,675 8.13
733,897,857 100.00
Foreign Shareholders
Domestic Shareholders
Shares Shareholder Category % holding
Deutsche Bank Trust Company Americas (Depositary for ADR holders) 159,882,118 25.94
dickenson intellinetics 5690 2791 ICICI Annual Report 2004
Directors’ Report
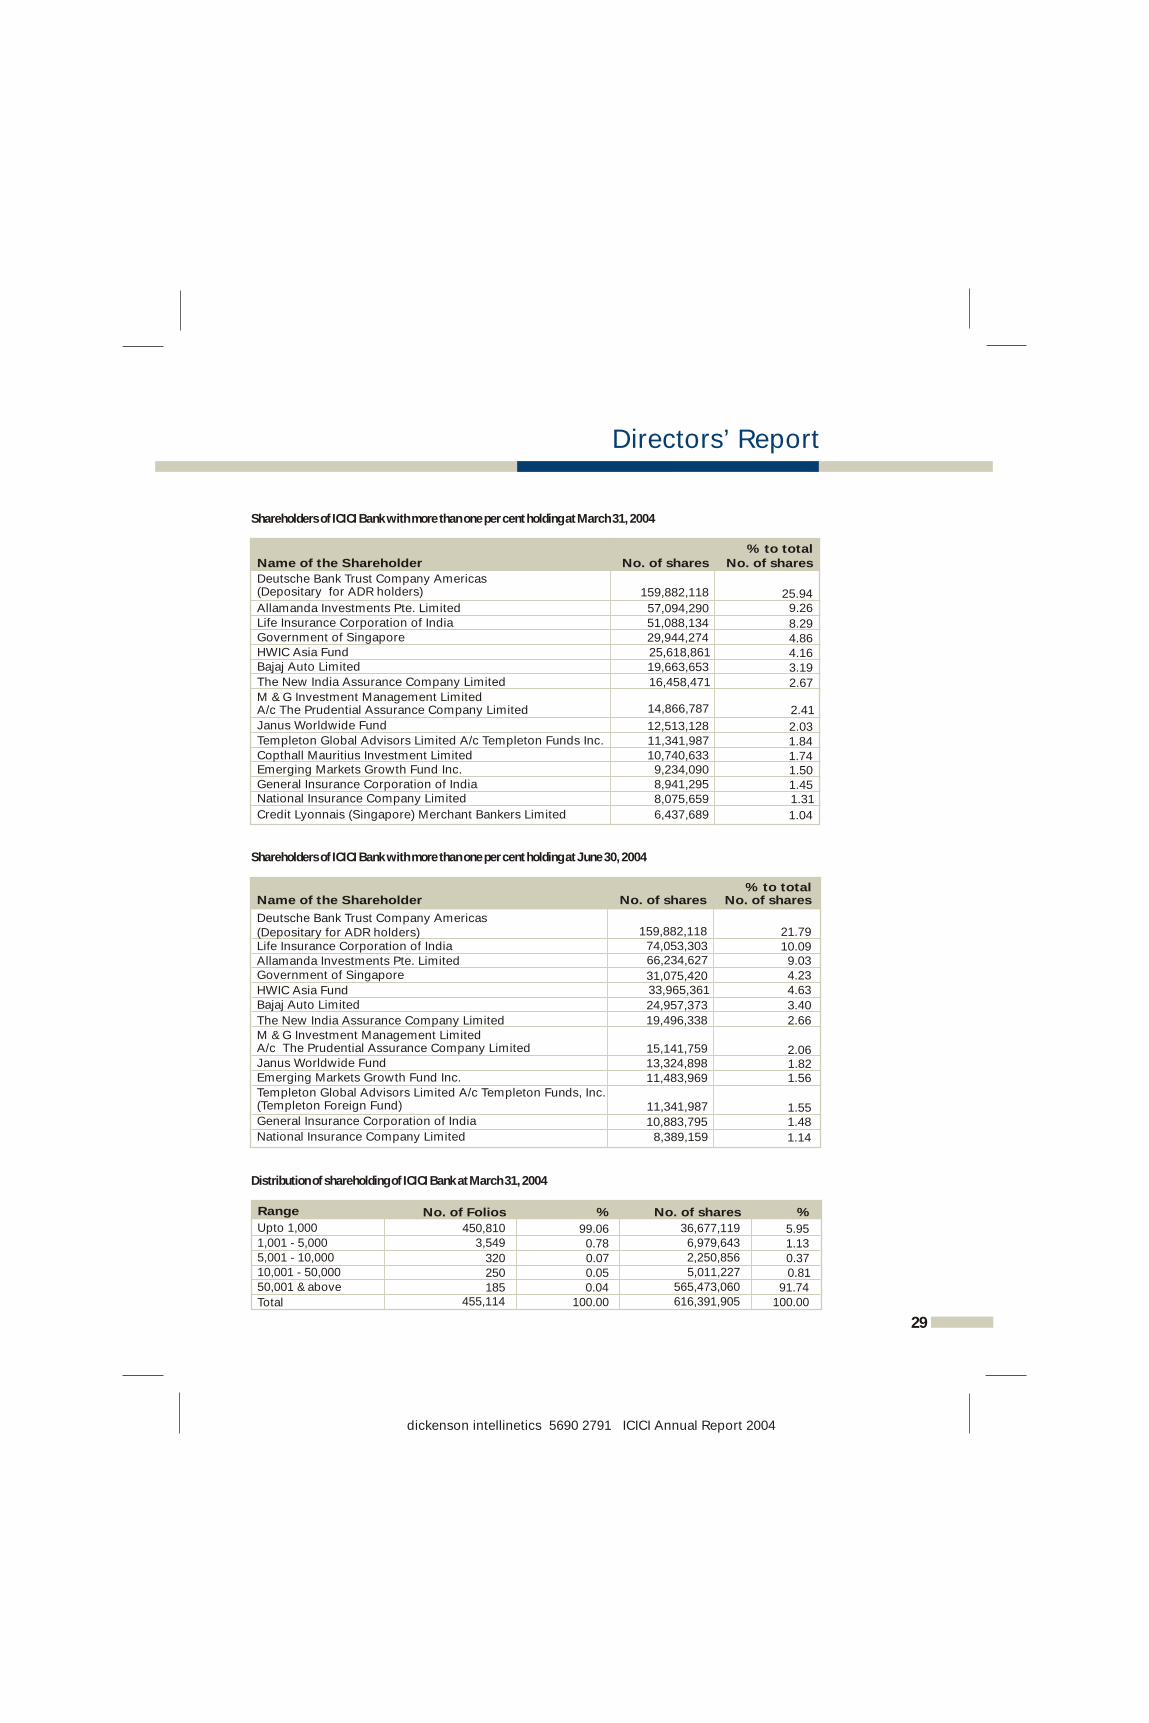
Shareholders of ICICI Bank with more than one per cent holding at March 31, 2004
Shareholders of ICICI Bank with more than one per cent holding at June 30, 2004
Distribution of shareholding of ICICI Bank at March 31, 2004
No. of shares
Name of the Shareholder
% to total No. of shares
159,882,118Deutsche Bank Trust Company Americas (Depositary for ADR holders) 25.94
Allamanda Investments Pte. Limited
57,094,290
9.26
Life Insurance Corporation of India
51,088,134
8.29
Government of Singapore
29,944,274
4.86
HWIC Asia Fund
25,618,861
4.16
Bajaj Auto Limited
19,663,653
3.19
The New India Assurance Company Limited
16,458,471
2.67
M & G Investment Management Limited A/c The Prudential Assurance Company Limited 14,866,787 2.41
Janus Worldwide Fund 12,513,128 2.03Templeton Global Advisors Limited A/c Templeton Funds Inc. 11,341,987 1.84Copthall Mauritius Investment Limited 10,740,633 1.74Emerging Markets Growth Fund Inc. 9,234,090 1.50General Insurance Corporation of India 8,941,295 1.45National Insurance Company Limited 8,075,659 1.31
Credit Lyonnais (Singapore) Merchant Bankers Limited 6,437,689 1.04
No. of shares
Name of the Shareholder
% to total No. of shares
159,882,118 21.7974,053,303 10.0966,234,627 9.03
31,075,420 4.2333,965,361 4.63
24,957,373 3.40
19,496,338 2.66
13,324,898 1.8211,483,969 1.56
10,883,795 1.48
Deutsche Bank Trust Company Americas(Depositary for ADR holders)Life Insurance Corporation of IndiaAllamanda Investments Pte. LimitedGovernment of Singapore
HWIC Asia FundBajaj Auto Limited
The New India Assurance Company Limited
15,141,759 2.06M & G Investment Management Limited A/c The Prudential Assurance Company LimitedJanus Worldwide FundEmerging Markets Growth Fund Inc.
11,341,987 1.55
Templeton Global Advisors Limited A/c Templeton Funds, Inc. (Templeton Foreign Fund)
General Insurance Corporation of India
National Insurance Company Limited 8,389,159 1.14
% Range No. of Folios %
Upto 1,000 450,810 99.06 36,677,119 5.95 1,001 - 5,000
3,549 0.78 6,979,643 1.13 5,001 - 10,000 320 0.07 2,250,856 0.37 10,001 - 50,000 250 0.05 5,011,227 0.81 50,001 & above 185 0.04 565,473,060 91.74 Total 455,114 100.00 616,391,905 100.00
No. of shares
29
dickenson intellinetics 5690 2791 ICICI Annual Report 2004
Directors’ Report
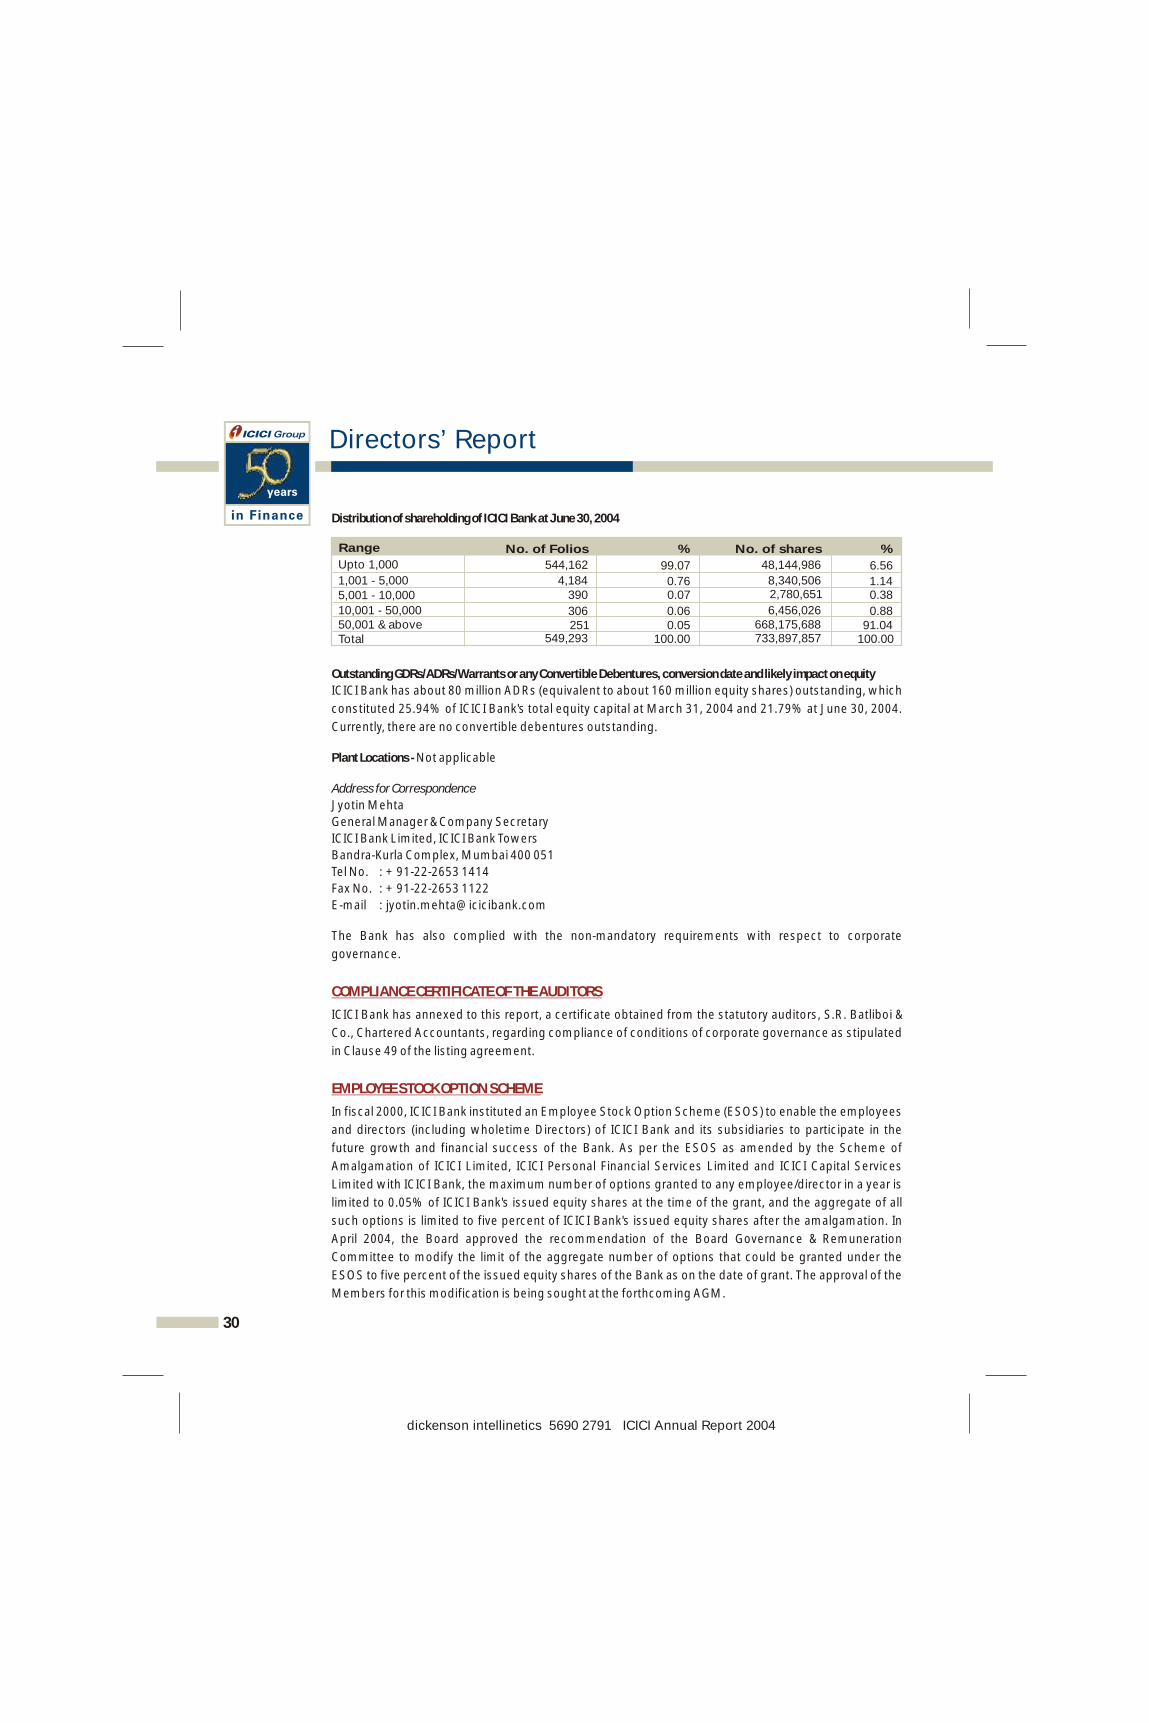
Distribution of shareholding of ICICI Bank at June 30, 2004
Outstanding GDRs/ADRs/Warrants or any Convertible Debentures, conversion date and likely impact on equity
ICICI Bank has about 80 million ADRs (equivalent to about 160 million equity shares) outstanding, which
constituted 25.94% of ICICI Bank's total equity capital at March 31, 2004 and 21.79% at June 30, 2004.
Currently, there are no convertible debentures outstanding.
Plant Locations - Not applicable
Address for Correspondence
Jyotin Mehta
General Manager & Company Secretary
ICICI Bank Limited, ICICI Bank Towers
Bandra-Kurla Complex, Mumbai 400 051
Tel No. : +91-22-2653 1414
Fax No. : +91-22-2653 1122
E-mail : [email protected]
The Bank has also complied with the non-mandatory requirements with respect to corporate
governance.
ICICI Bank has annexed to this report, a certificate obtained from the statutory auditors, S.R. Batliboi &
Co., Chartered Accountants, regarding compliance of conditions of corporate governance as stipulated
in Clause 49 of the listing agreement.
In fiscal 2000, ICICI Bank instituted an Employee Stock Option Scheme (ESOS) to enable the employees
and directors (including wholetime Directors) of ICICI Bank and its subsidiaries to participate in the
future growth and financial success of the Bank. As per the ESOS as amended by the Scheme of
Amalgamation of ICICI Limited, ICICI Personal Financial Services Limited and ICICI Capital Services
Limited with ICICI Bank, the maximum number of options granted to any employee/director in a year is
limited to 0.05% of ICICI Bank's issued equity shares at the time of the grant, and the aggregate of all
such options is limited to five percent of ICICI Bank's issued equity shares after the amalgamation. In
April 2004, the Board approved the recommendation of the Board Governance & Remuneration
Committee to modify the limit of the aggregate number of options that could be granted under the
ESOS to five percent of the issued equity shares of the Bank as on the date of grant. The approval of the
Members for this modification is being sought at the forthcoming AGM.
COMPLIANCE CERTIFICATE OF THE AUDITORS
EMPLOYEE STOCK OPTION SCHEME
30
% Range No. of Folios %
Upto 1,000
1,001 - 5,000
5,001 - 10,000
10,001 - 50,00050,001 & aboveTotal
No. of shares
544,162 99.07 48,144,986 6.56 4,184 0.76 8,340,506 1.14
390 0.07 2,780,651 0.38
306 0.06 6,456,026 0.88 251 0.05 668,175,688 91.04
549,293 100.00 733,897,857 100.00
dickenson intellinetics 5690 2791 ICICI Annual Report 2004
Directors’ Report
Options granted for fiscal 2003 and earlier years vest in a graded manner over a three-
year period, with 20%, 30% and 50% of the grants vesting in each year, commencing
not earlier than 12 months from the date of grant. In April 2004, the Board approved the
recommendation of the Board Governance & Remuneration Committee to modify the
vesting period of stock options such that all options granted for fiscal 2004 and beyond
vest in a graded manner over a four-year period, with 20%, 20%, 30% and 30% of the
grants vesting each year, commencing not earlier than 12 months from the date of grant.
Options can be exercised within 10 years from the date of grant or five years from the
date of vesting, whichever is later. The price of the options granted prior to June 30, 2003
is the closing market price on the stock exchange, which recorded the highest trading
volume on the date of grant. The price for options granted on or after June 30, 2003 is
equal to the average of the high and low market price of the equity shares in the two
week period preceding the date of grant of the options, on the stock exchange which
recorded the highest trading volume during the two week period.
On the basis of the recommendation of the Board Governance & Remuneration
Committee, the Board at its Meeting held on April 30, 2004 approved grant of 7.5 million
options for fiscal 2004 to eligible employees including wholetime Directors. Each option
confers on the employee a right to apply for one equity share of Rs. 10 of ICICI Bank at
Rs. 300.10, which is equivalent to the average of the high and low market price of the
equity shares in the two week period preceding the date of grant of the options, on the
stock exchange which recorded the highest trading volume during the two week period.
The total number of shares of ICICI Bank covered by the ESOS as approved by the
Members is 30, 651,570. Particulars of options granted by ICICI Bank as at July 21, 2004
are given below:
Options granted 28,941,975 Options vested 11,427,627 Options exercised 5,065,038
5,065,038 Number of shares allotted pursuant to exercise of options Options forfeited/lapsed 2,190,584
Extinguishment or modification of options -
Amount realised by exercise of options (Rs.) 740,675,541
Total number of options in force 21,686,353
31
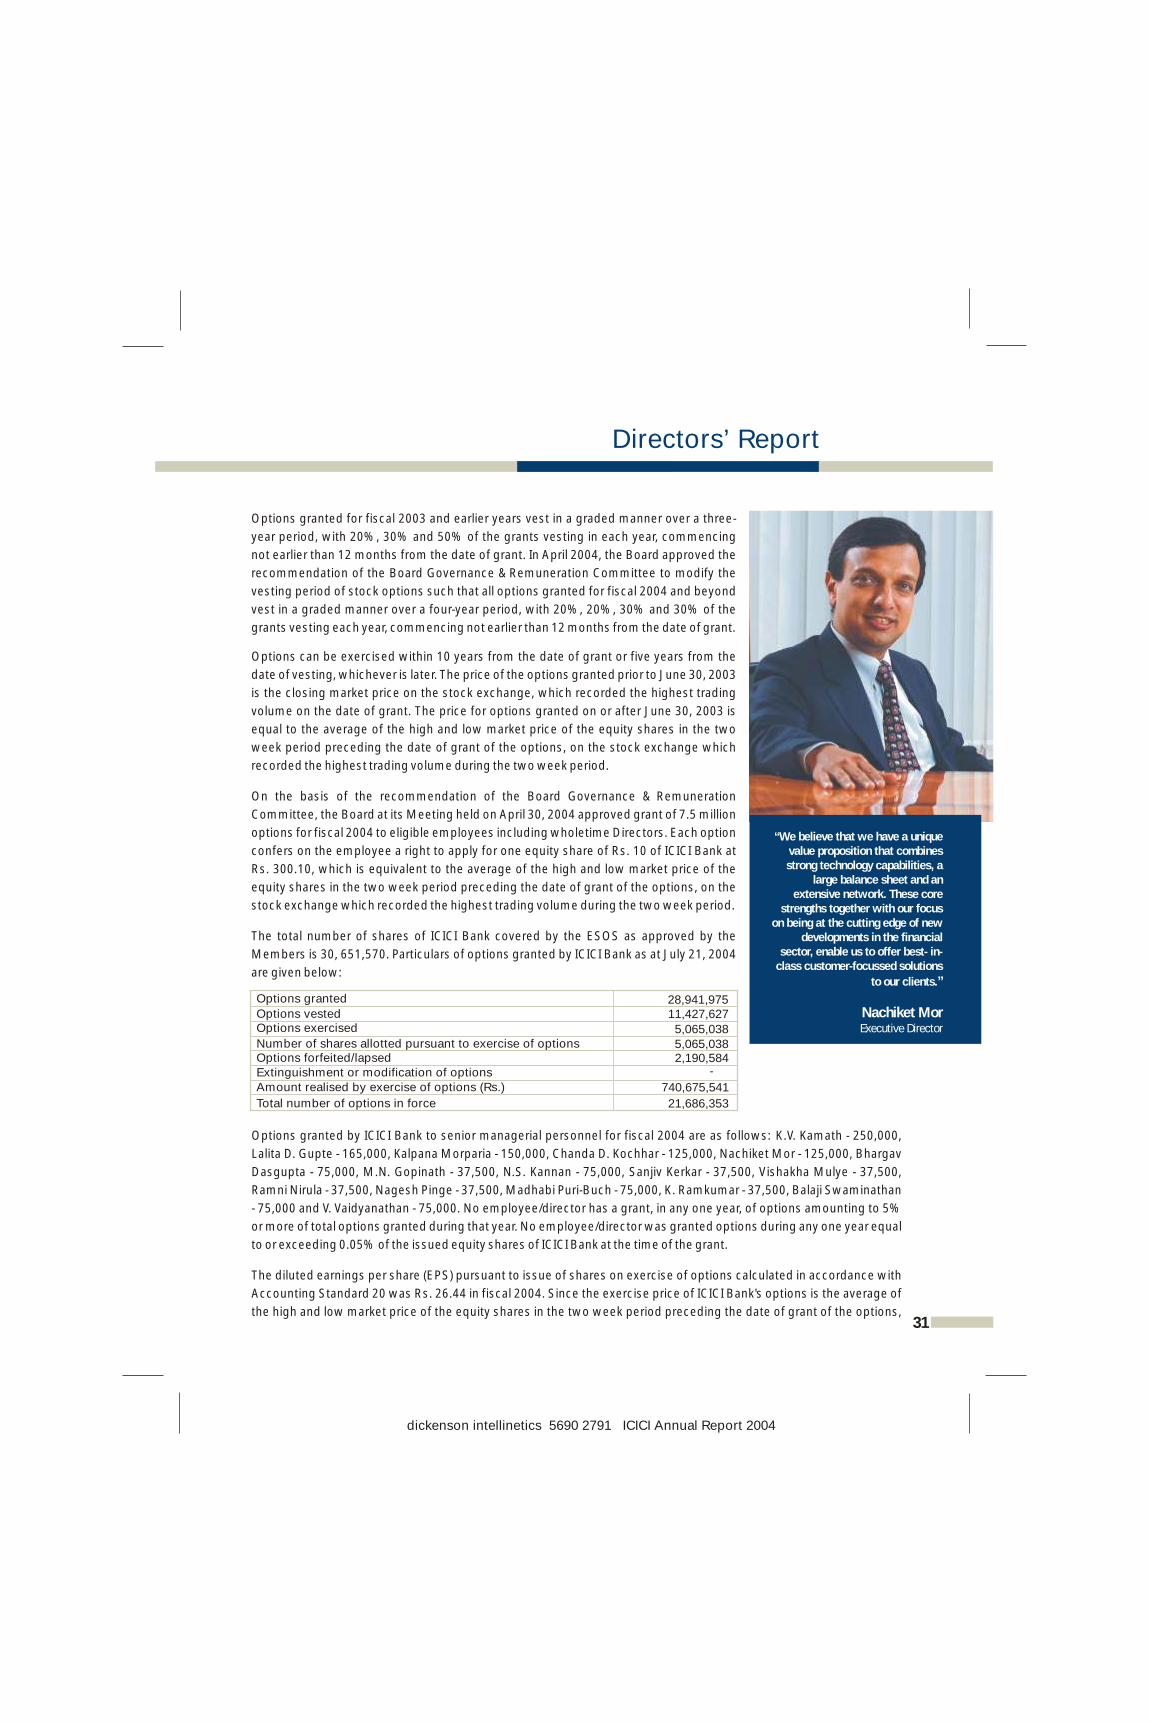
“We believe that we have a unique value proposition that combines strong technology capabilities, a
large balance sheet and an extensive network. These core
strengths together with our focus on being at the cutting edge of new
developments in the financial sector, enable us to offer best- in-
class customer-focussed solutions
to our clients.”
Nachiket MorExecutive Director
Options granted by ICICI Bank to senior managerial personnel for fiscal 2004 are as follows: K.V. Kamath - 250,000,
Lalita D. Gupte - 165,000, Kalpana Morparia - 150,000, Chanda D. Kochhar - 125,000, Nachiket Mor - 125,000, Bhargav
Dasgupta - 75,000, M.N. Gopinath - 37,500, N.S. Kannan - 75,000, Sanjiv Kerkar - 37,500, Vishakha Mulye - 37,500,
Ramni Nirula - 37,500, Nagesh Pinge - 37,500, Madhabi Puri-Buch - 75,000, K. Ramkumar - 37,500, Balaji Swaminathan
- 75,000 and V. Vaidyanathan - 75,000. No employee/director has a grant, in any one year, of options amounting to 5%
or more of total options granted during that year. No employee/director was granted options during any one year equal
to or exceeding 0.05% of the issued equity shares of ICICI Bank at the time of the grant.
The diluted earnings per share (EPS) pursuant to issue of shares on exercise of options calculated in accordance with
Accounting Standard 20 was Rs. 26.44 in fiscal 2004. Since the exercise price of ICICI Bank's options is the average of
the high and low market price of the equity shares in the two week period preceding the date of grant of the options,
dickenson intellinetics 5690 2791 ICICI Annual Report 2004
Directors’ Report
there is no compensation cost in fiscal 2004 based on the intrinsic value of options. However, if ICICI
Bank had used the fair value of options based on the Black-Scholes model, compensation costs in fiscal
2004 would have been higher by Rs. 324.0 million and proforma profit after tax would have been
Rs. 16.05 billion. On a proforma basis, ICICI Bank's basic and diluted earnings per share would have
been Rs. 26.13 and Rs. 25.92 respectively. The key assumptions used to estimate the fair value of
options are:
In respect of options granted in fiscal 2004, the weighted average price of the underlying share in
the market on the date of the option grant, the weighted average exercise price of the options and
the weighted average fair value of the options were Rs. 132.72 per share, Rs. 132.65 per option and
Rs. 46.23 per option respectively.
The Directors confirm:
1. that in the preparation of the annual accounts, the applicable accounting standards have been
followed, along with proper explanation relating to material departures;
2. that they have selected such accounting policies and applied them consistently and made
judgements and estimates that are reasonable and prudent, so as to give a true and fair view of the
state of affairs of the Bank at the end of the financial year and of the profit or loss of the Bank for that
period;
3. that they have taken proper and sufficient care for the maintenance of adequate accounting
records, in accordance with the provisions of the Banking Regulation Act, 1949 and the Companies
Act, 1956 for safeguarding the assets of the Bank and for preventing and detecting fraud and other
irregularities; and
4. that they have prepared the annual accounts on a going concern basis.
ICICI Bank is grateful to the Government of India, RBI, SEBI and overseas regulators for their continued
co-operation, support and advice. ICICI Bank wishes to thank its investors, the domestic and
international banking community, investment bankers, rating agencies and stock exchanges for their
support.
ICICI Bank would like to take this opportunity to express sincere thanks to its valued clients and
customers for their continued patronage. The Directors express their deep sense of appreciation to all
the employees, whose outstanding professionalism, commitment and initiative has made the
organisation's growth and success possible and continues to drive its progress. Finally, the Directors
wish to express their gratitude to the Members for their trust and support.
For and on behalf of the Board
Place : Mumbai N. VAGHUL
Date : July 23, 2004 Chairman
DIRECTORS' RESPONSIBILITY STATEMENT
ACKNOWLEDGEMENTS
Risk - free interest rate 5.122% - 5.939% Expected life 10 YearsExpected volatility 40.065%Expected dividends 4.060%
32
dickenson intellinetics 5690 2791 ICICI Annual Report 2004
33
To the Members of ICICI Bank Limited
We have examined the compliance of conditions of corporate governance by ICICI Bank Limited
(’Bank’), for the year ended on March 31, 2004, as stipulated in clause 49 of the Listing Agreements
entered into by the said Bank with stock exchanges.
The compliance of conditions of corporate governance is the responsibility of the management.
Our examination was limited to procedures and implementation thereof, adopted by the Bank for
ensuring the compliance of the conditions of the Corporate Governance. It is neither an audit nor
an expression of opinion on the financial statements of the Bank.
In our opinion and to the best of our information and according to the explanations given to us, we
certify that the Bank has complied with the conditions of Corporate Governance as stipulated in the
above-mentioned Listing Agreements.
We state that no investor grievances are pending for a period exceeding one month against the
Bank as per the records placed before the Share Transfer & Shareholders'/Investors' Grievance
Committee.
We further state that such compliance is neither an assurance as to the future viability of the Bank
nor the efficiency or effectiveness with which the management has conducted the affairs of the
Bank.
S.R. Batliboi & Co.
Chartered Accountants
per Viren H. Mehta
Partner
Membership No.: 048749
Mumbai : July 23, 2004
Auditors’ Certificate on Corporate Governance
dickenson intellinetics 5690 2791 ICICI Annual Report 2004
Business Overview
ECONOMIC OVERVIEW
The Indian economy recorded strong growth during fiscal 2004, in an environment of resurgent
industrial performance, agricultural recovery supported by a good monsoon, sustained services sector
growth and a global economic revival. The Central Statistical Organisation has estimated overall GDP
growth at 8.2% for fiscal 2004. While the agriculture sector grew by 9.1% in fiscal 2004 compared to a
negative growth of 5.2% in fiscal 2003, the industrial sector also recorded a higher growth of 6.8%
against 6.2% in the previous year. Industrial recovery was primarily driven by the manufacturing sector,
especially textiles, steel, cement and transport equipment. The services sector, which now accounts for
56% of India's GDP, grew by 8.5% in fiscal 2004 compared to 7.2% in fiscal 2003.
The above growth trends were accompanied by continued macro-economic stability, moderate
inflation, orderly currency market conditions and comfortable foreign exchange reserves. Exports in
dollar terms rose by 17.3% and exceeded US$ 60.00 billion in fiscal 2004. During April 2004, exports
rose by 19.9%. The current account recorded a surplus for the third consecutive year in fiscal 2004. The
current account showed a surplus of US$ 8.72 billion during fiscal 2004. The growth in exports was
largely driven by manufactured goods, particularly engineering goods, chemicals and related products
and gems and jewellery. Import of capital goods registered higher growth in fiscal 2004, reflecting
revival of investment demand in the economy. The growth in merchandise and services exports led to a
healthy current account position and was partially responsible for the rapid increase in foreign
exchange reserves, which stood at US$ 120.78 billion as of July 9, 2004. Non-debt capital inflows also
contributed significantly to the increase in foreign exchange reserves. The Indian rupee appreciated by
8.7% vis-à-vis the US Dollar during fiscal 2004 and then depreciated by 6.4% during the current fiscal
year, through July 22, 2004.
The year also witnessed buoyant capital markets, with improving valuations and renewed primary
market activity. The markets also saw significant structural changes and developments. Trading in
interest rate futures, which provides a mechanism for banks and financial institutions to hedge their
positions in a volatile interest rate regime, was introduced. Rolling settlement in the equity markets was
introduced in fiscal 2004.
The average annual rate of inflation in terms of the Wholesale Price Index (WPI) was 5.2% at the end of
March 2004. In view of India's resilience to shocks, reasonable level of food stocks and the comfortable
foreign exchange reserves, Reserve Bank of India (RBI), in its Annual Policy Statement for fiscal 2005,
stated that the price situation is unlikely to cause concern to macro stability in fiscal 2005. RBI has kept
key interest rates unchanged and has announced measures to increase flow of credit to agriculture,
small and medium enterprises and infrastructure and develop credit delivery mechanisms. The Union
Budget for fiscal 2005 has focused on stimulating investment in infrastructure and holistic development
of the rural economy, supported by revenue measures to address fiscal priorities. While agricultural
growth will depend on the monsoon, the growth prospects for fiscal 2005 based on the continued
growth momentum in industry and services, appear to be favourable.
FINANCIAL SECTOR OVERVIEW
Fiscal 2004 saw significant developments in the financial sector. In terms of credit growth, the banking
system continued to witness robust growth in retail credit, with indications of revival in corporate credit
demand as well. The year also saw significant growth in securitisation of debt, which is positive for the 34
dickenson intellinetics 5690 2791 ICICI Annual Report 2004

future of financial intermediation in India. Liquidity in the system continues to be strong supported by
steady deposit growth, with excess liquidity being absorbed by RBI's Liquidity Adjustment Facility and
the newly-introduced Market Stabilisation Scheme.
The year witnessed an improvement in the financial position of banks, with large provisions being
made against non-performing loans by utilising treasury gains arising from the declining interest rate
environment. The bond buyback scheme of the Government of India also provided banks an
opportunity to realise gains and cushion the impact of credit losses. Asset Reconstruction Company
(India) Limited was operationalised during the year and commenced acquisition of non-performing
assets. The Honourable Supreme Court has upheld the constitutional validity of the Securitisation and
Reconstruction of Financial Assets and Enforcement of Security Interest (SARFAESI) Act, 2002, thus
paving the way for speedy recovery of distressed secured debt.
The Indian banking system continued to make rapid progress towards international benchmarks and
best practices, with the adoption of the 90-day rule for recognition of non-performing assets effective
fiscal 2004, the accelerated provisioning norms announced recently and the introduction of capital
charge for market risk. Efficiency in the banking system, which plays a pivotal role in economic activity
was sought to be enhanced by the introduction of the Real Time Gross Settlement System.
As a result of the process of reform, the Indian banking system now operates in an increasingly more
efficient and competitive environment and is well-placed to support the larger economy to achieve
sustained growth.
ORGANISATION STRUCTURE
Our organisational structure is designed to be flexible and customer-focused, while seeking to ensure
effective control and supervision and consistency in standards across the organisation and align all
areas of operations to overall organisational objectives. The organisation structure is divided into four
principal groups - Retail Banking, Wholesale Banking, International Business and Corporate Centre.
The Retail Banking Group (RBG) is responsible for our products and services for retail customers and
small enterprises including various credit products, liability products (including our own products as
well as distribution of third party products) and transaction banking services.
The Wholesale Banking Group (WBG) is responsible for our products and services for corporate clients,
including credit and treasury products, project finance, structured finance and transaction banking
services. This group is also responsible for our securitisation activities. The Rural, Micro-banking &
Agri-business Group (RMAG) forms part of WBG. A separate dedicated team within WBG is
responsible for our proprietary trading activities. The Special Assets Management Group (SAMG) is
responsible for non-performing and restructured loans.
The International Business Group is responsible for our international operations, including our
operations in various overseas markets as well as our products and services for non-resident Indians
(NRIs) and our international trade finance and correspondent banking relationships.
The Corporate Centre comprises all shared services and corporate functions, including finance and
balance sheet management, secretarial, investor relations, risk management, legal, human resources
and corporate branding and communications. 35
Business Overview
dickenson intellinetics 5690 2791 ICICI Annual Report 2004
In addition to the above, there are certain specialised groups namely, Technology Management Group
(TMG) which is responsible for enterprise-wide technology initiatives, Organisational Excellence Group
(OEG) which is responsible for quality initiatives and Social Initiatives Group (SIG) which is responsible
for our social and community development activities.
BUSINESS REVIEW
During fiscal 2004, ICICI Bank continued to diversify its asset base and increase its market share in key
target areas by leveraging the synergies arising from the merger of ICICI with ICICI Bank and capitalising
on emerging opportunities. Focus on innovation in products, processes and distribution continued to
underpin all our initiatives.
Retail Banking
Retail banking is a key element of our growth strategy. Over the past few years, the Indian retail finance
market has witnessed a paradigm shift in consumer preferences and expectations from the banking
industry. There has been an upward movement of household income levels, thereby increasing the
saving potential of households, as also the increased acceptance of retail finance and the use of credit
to finance purchases.
We have capitalised on the growing retail opportunity in India and have emerged as a market leader in
retail credit. We follow a two-fold strategy: acquiring new customers by offering high value products
through a wide distribution network as well as cross-selling to existing customers and increasing
relationship sizes through customer-centric, innovative products and services. Our retail strategy is
backed by strong credit and operating processes and technology capabilities.
In fiscal 2004, we extended our market leadership to various segments of the retail credit business,
including home loans, car loans, personal loans and credit cards. Our total retail disbursements in fiscal
2004 (excluding vehicle inventory financing and increase in credit card receivables) were approximately
Rs. 288.00 billion. Our total retail portfolio increased from Rs. 191.60 billion at March 31, 2003 to Rs.
334.24 billion at March 31, 2004, constituting 54% of loans and 47% of customer assets. Cross-selling
has emerged as one of the significant drivers of retail credit growth. In fiscal 2004, cross-sell accounted
for approximately 20% of home loans and auto loans approved and approximately 50% of credit cards
issued. We continued our focus on retail deposits, which reduced our funding cost and enabled us to
create a stable funding base. Our deposit customer base in fiscal 2004 increased to 6.4 million.
At March 31, 2004, we had 413 branches and 56 extension counters across India. We continued to
expand our electronic channels, namely Internet banking, mobile banking, call centres and ATMs, and
migrate customer transaction volumes to these channels. During fiscal 2004, about 70% of customer
induced transactions took place through these channels. We increased our ATM network to 1,790 ATMs
in fiscal 2004, and entered into ATM sharing arrangements with other banks. Our call centers, with a
seating capacity of 1,750, handle more than 0.15 million customer contacts per day. At the same time,
we have focused on leveraging our physical infrastructure and offering customers enhanced
convenience and flexibility with the introduction of extended branch banking hours from 8 a.m. to
8 p.m., six days a week. This pioneering “8-to-8” initiative has so far been rolled out in 245 of our
branches. With the foundation of a strong multi-channel distribution network, we have successfully
developed a robust model for distribution of third party products like mutual funds, Government of India 36
Business Overview
dickenson intellinetics 5690 2791 ICICI Annual Report 2004
relief bonds, foreign exchange and insurance products, with market leadership in these areas. The third
party distribution model also enables us to offer the customer a complete basket of financial products,
while leveraging our distribution capability to earn fee income from third parties. www.ICICIdirect.com
(ICICIdirect) provides Internet-based share trading, with complete end-to-end integration for seamless
electronic trading on stock exchanges. ICICIdirect has a rating of “TxA1” from CRISIL, indicating
highest ability to service broking transactions.
We are also rolling out our strategy with regard to small enterprises, with a focus on liability products
and transaction banking services, as well as working capital loans to suppliers or dealers of large
corporations, and clusters of small enterprises that have a homogeneous profile. Our “Roaming
Current Account” product for small enterprises has been highly successful and we are seeking to
widen our product offering and client coverage in this segment.
Wholesale Banking
Our corporate banking strategy is based on providing comprehensive and customised financial
solutions to our corporate customers. In addition to growth in revenues and market share, we are
focused on generating adequate return on capital through risk-based pricing models and proactive
portfolio management.
Fiscal 2004 saw us building on our competencies in structured finance and leveraging them in path-
breaking securitisation deals of both corporate and retail asset pools. The focus in structured finance in
fiscal 2004 was also to develop the market for syndication and securitisation of loans. Our ability to take
large exposures, coupled with our deal structuring capabilities, made it possible for us to record
significant volumes of securitised assets in fiscal 2004. We have concluded the two largest auto-pool
securitisations in India.
With a view to further strengthen our sustainable sources of income, we increased our focus on trade
finance and cash management services. We have successfully used technology, both as an enabler
and a differentiator, to achieve high penetration levels in the transaction banking business. The
centralisation of processing facilities in fiscal 2003 was followed by enhanced focus on process
improvements and compliance resulting in over 70% of our processes being six-sigma compliant.
The corporate markets business focused on delivery of market solutions such as foreign exchange
products, derivatives and market-making in corporate bonds to our corporate clients. There was
significant growth in foreign exchange transactions, swaps and loan syndication. A key activity of this
business was continuous, broad-based market-making in various markets. A significant milestone was
achieved in the market making activity by expanding the product suite to include foreign exchange
options against Indian Rupee as RBI allowed them to be traded with effect from July 7, 2003. The Bank
has emerged as one of the largest market-makers in merchant as well as inter-bank markets for this
product.
We have strengthened our corporate relationships in fiscal 2004, gaining entry into lending consortia of
a number of large public sector units. We have achieved success in our public sector relationships
while keeping up momentum in the private sector that saw us consolidate on the foundations laid in the
previous years to become a key financial solutions provider for leading corporates. Our dedicated
37
Business Overview
dickenson intellinetics 5690 2791 ICICI Annual Report 2004
Government Banking Group focused on building and strengthening relationships with central and state
governments. We obtained the mandate for income tax collection across the country and sales tax
collection in two states.
The focus of our proprietary trading operations was to maximise profits from positions across key
markets including corporate bonds, government securities, interest-rate swap, equity and foreign
exchange markets.
Project Finance
The infrastructure sector in India is expected to witness significant growth. The road sector has
witnessed significant activity, particularly on account of the highway projects of National Highways
Authority of India (NHAI). The Government of India has embarked on a project for development of
10,000 kilometres of national highways, which envisages significant private sector participation. The
NHAI is also in the process of awarding projects on Build-Own-Transfer (BOT) basis as part of the second
phase of development of the North-South, East-West Corridor. In the port sector, significant
investments are expected to create additional container terminal and bulk cargo-handling capacities in
the country, including modernisation of existing major ports and setting up of green field ports. In the
airport sector, there are currently two green-field international airports proposed in Hyderabad and
Bangalore, as well as modernisation of Mumbai and Delhi airports. The power sector is expected to
benefit from implementation of comprehensive reforms both at the national and the state levels which
are likely to result in business opportunities across the power supply chain. In the oil and gas sector, the
fourth round of bidding for exploration blocks under New Exploration Licensing Policy has been
completed. The recent gas discovery in the Krishna-Godavari basin has generated significant interest
among multinational oil majors in the upstream oil sector in the country. Gas Authority of India Limited
(GAIL) has conceptualised a National Gas Grid project in phases linking various gas sources and
potential markets.
Fiscal 2004 was marked by significant industrial recovery driven by increased global demand and
improved competitive strength of Indian industry. The buoyancy in Index of Industrial Production was
contributed mainly by improved performance achieved by the metals, cement, automobile and
consumer durables sectors in the manufacturing and core industry segments. The core and the
manufacturing sector are expected to witness significant activity going forward.
We have, over the years, developed project-financing expertise across all the major sectors and are well
positioned to leverage the emerging opportunities in both infrastructure and manufacturing sectors.
We continue to maintain a leadership role in new policy initiatives in the project finance sector. ICICI
Bank was a member of the Task Forces on Power Sector Investments and Reforms and Interlinking of
Rivers, advised the Ministry of Communications and Telecom Regulatory Authority of India on the steps
needed for catalysing investments in the telecom sector and proactively formulated a new approach
with the Indian Railways for developing projects in public-private partnership. We are a member of the
inter-institutional group set up for evaluation and financial closure of infrastructure projects. Our project
finance business is focused on identifying and investing in attractive project finance opportunities and
on structuring and syndication of finance for large projects by leveraging our expertise in project
financing, and churning our project finance portfolio to prevent portfolio concentration and to manage
portfolio risk. We view our role not only as providers of project finance but also as arrangers and 38
Business Overview
dickenson intellinetics 5690 2791 ICICI Annual Report 2004
facilitators, creating appropriate financing structures that serve as financing and investment vehicles
for a wider range of market participants.
Rural banking and agri-business
In rural banking, our objective is to build an integrated and sustainable model for delivery of financial
services to rural India. We have achieved significant success in this area, meeting our agricultural
lending obligations as directed by RBI for two years in succession. Our agricultural finance portfolio at
March 19, 2004 was Rs. 42.06 billion, compared to about Rs. 22.67 billion at March 21, 2003. Our focus
in agricultural finance is to work towards efficiency across the entire value chain, to ensure value
realisation for the farmer while mitigating the credit risk assumed by us. We have created innovative
structured financial products such as water harvesting structures to enable continuous irrigation for
sugar farmers and retail focused products such as warehouse receipt based financing through third
party warehouses. We have successfully launched a multi channel strategy comprising mandi
branches targeting agri-intermediaries, micro finance institutions and cooperatives targeting focused
agri clusters, as well as the trader channel. During fiscal 2004 we concluded a pioneering micro-credit
securitisation and our subsidiary, ICICI Lombard General Insurance Company Limited successfully
piloted a weather insurance product. Going forward, we will seek to expand our rural outreach through
the development of cost-effective delivery channels. We have launched a successful pilot of low cost
channels with rural Internet kiosks and are the first Bank to build such a technology-based channel for
rural India. We have also developed a low cost ATM. We view the rural markets as a growth opportunity,
rather than targeting them only for meeting regulatory requirements. There is a need for an integrated
approach to rural banking, that will improve access to financial services and facilitate wider
participation in the mainstream economy, while earning sustainable returns and delivering value to our
stakeholders.
Special Assets Management
The Special Assets Management Group (SAMG) was setup to focus exclusively on resolution of large
non-performing assets and accounts under watch. SAMG has achieved significant success in this role,
through successful restructuring of several large projects and settlement of non-performing assets,
supported by the improving economic and industrial environment. Asset Reconstruction Company
(India) Limited (ARCIL) is now operational and acquired net non-performing assets aggregating
Rs. 12.51 billion from us in fiscal 2004.
International Business
We set up our international banking group in fiscal 2002 to cater to the cross-border needs of clients
and leverage on our domestic banking strengths to offer products internationally. The group has
adopted an organic and alliance-based strategy for facilitating a phased and progressive international
expansion. The initial focus was to tap the non-resident Indian (NRI) market segment across key
geographies, namely, the United States, Canada, the United Kingdom, South-East Asia and the Middle
East. Having established a strong franchise in the NRI business, the key objectives for fiscal 2004 were
to roll out operations across key overseas locations, build the ICICI Bank brand overseas, increase
market share in trade finance by leveraging and further strengthening correspondent banking
relationships and expand and strengthen franchise in NRI products.
39
Business Overview
dickenson intellinetics 5690 2791 ICICI Annual Report 2004
ICICI Bank currently has representative offices in the United States, United Arab Emirates, China and
Bangladesh, subsidiaries in the United Kingdom and Canada and branches in Singapore and Bahrain.
The Bank has also received regulatory approval to set up a representative office in South Africa and is
currently awaiting approval from the host country regulator to set up a subsidiary in Russia. ICICI Bank
has also received the approval of RBI for setting up branches in Sri Lanka and the United States.
Our overseas subsidiaries and branches launched several products during the financial year including
NRI banking products such as deposits, savings accounts and remittances, retail products such as
deposits and loans, cash-backed lending to small and medium enterprises and high net worth
individuals, trade finance and loan syndication. We have undertaken significant brand-building
initiatives in international markets and have emerged as one of the most recognised financial services
brands for NRIs, for a banking relationship in India. Over fiscal 2004, we have further built on our key
strengths in the NRI services business, which include strong customer relationships, competitive
pricing, comprehensive product suite, distribution and branch network in India and overseas
partnerships and alliances. We have over 160,000 NRI customers today. We are also exploring
opportunities in the international private banking segment to service the wealth management needs of
the large and growing population of affluent and high networth NRIs.
In order to increase our distribution reach overseas and capture a larger market share of the NRI
segment, we have forged alliances with several leading international banks. These alliances have
enabled us to provide greater value to our NRI customers by seamlessly catering to their local and India-
related banking needs.
We have also extensively expanded relationships with banks in new regions in fiscal 2004. We made a
foray into new markets, in particular the SAARC countries to capture the remittance and trade flows with
Nepal, Sri Lanka and Bangladesh. We also successfully raised US$ 300.00 million through an issue of
Euro bonds. International Financial Review rated this transaction as “Emerging Asia Bond Deal of the
Year”.
CREDIT RATING
ICICI Bank's credit ratings from various credit rating agencies are given below:
RISK MANAGEMENT
Risk is an integral part of the banking business and we aim at the delivery of superior shareholder value
by achieving an appropriate trade-off between risk and returns. We are exposed to various risks,
including credit risk, market risk and operational risk. Our risk management strategy is based on a clear
understanding of various risks, disciplined risk assessment and measurement procedures and
continuous monitoring. The policies and procedures established for this purpose are continuously
benchmarked with international best practices. The risk management function is supported by a
comprehensive range of quantitative and modeling tools developed by a dedicated risk analytics team.40
Business Overview
dickenson intellinetics 5690 2791 ICICI Annual Report 2004
Agency
Rating
Moody’s Investor Service (Moody’s) Baa3
Standard & Poors (S&P) BB
Credit Analysis & Research Limited (CARE) CARE AAA
Investment Information and Credit Rating Agency (ICRA) LAAA
We have set up two dedicated groups, the Risk Management Group (RMG) and the Compliance & Audit
Group (CAG) which are responsible for assessment, management and mitigation of risk in ICICI Bank.
These groups form part of the Corporate Centre, are completely independent of all business operations
and are accountable to the Risk and Audit Committees of the Board of Directors. RMG is further
organised into Credit Risk Management Group, Market Risk Management Group, Retail Risk
Management Group and Risk Analytics Group. CAG is further organized into the Credit Policies, RBI
Inspection & Anti-Money Laundering Group and the Internal Audit Group.
Credit Risk
Credit risk is the risk that a borrower is unable to meet its financial obligations to the lender. In respect of
corporate credit products, we measure, monitor and manage credit risk for each borrower and also at
the portfolio level. We have standardised credit approval processes, which include a well-established
procedure of comprehensive credit appraisal and rating. We have developed internal credit rating
methodologies for rating obligors as well as for products/ facilities. The rating factors in quantitative
and qualitative issues and credit enhancement features specific to the transaction. The rating serves as
a key input in the approval as well as post-approval credit processes. Credit rating, as a concept, has
been well internalised within the Bank. The rating for every borrower is reviewed at least annually and
for higher risk credits and large exposures on a more regular basis. Industry knowledge is constantly
updated through field visits, interactions with clients, regulatory bodies and industry experts. In
respect of retail credit products, we have a system of centralised approval of all products and policies
and monitoring of the retail portfolio. We continuously refine our retail credit parameters based on
portfolio analytics.
Market Risk
Market risk is the risk of loss resulting from changes in interest rates, foreign currency exchange rates,
equity prices and commodity prices. Our exposure to market risk is a function of our trading and asset-
liability management activities and our role as a financial intermediary in customer-related transactions.
The objective of market risk management is to minimise the impact of losses due to market risk, on
earnings and equity capital.
Market risk policies include asset-liability management (ALM) policies and policies for the investment
portfolio. ALM policies are approved by the Asset-Liability Management Committee (ALCO) of the
Board of Directors. ALCO's role encompasses stipulating liquidity and interest-rate risk limits,
monitoring risk levels by adherence to set limits, articulating the organisation's interest rate view and
determining business strategy in the light of the current and expected business environment. These
sets of policies and processes are articulated in the ALM policy. A separate set of policies for the
investment portfolio address issues related to investments in various investment products and are
approved by the Committee of Directors (COD) of the Board. RMG exercises independent control over
the process of market risk management and recommends changes in processes and methodologies
for measuring market risk.
Interest rate risk is measured through the use of re-pricing gap analysis and duration analysis. Liquidity
risk is measured through gap analysis. We ensure adequate liquidity at all times through systematic
funds planning and maintenance of liquid investments as well as by focusing on more stable funding
sources such as retail deposits. We mitigate our exposure to exchange rate risk by stipulating daily
stop-loss limits and position limits. 41
Business Overview
dickenson intellinetics 5690 2791 ICICI Annual Report 2004
The Treasury Middle Office Group monitors the asset-liability position under the supervision of the
ALCO. It also monitors treasury activities, including determining compliance with various exposure and
dealing limits, verifying the appropriateness and accuracy of various transactions, confirming these
transactions, tracking the daily funds position and all treasury-related management and regulatory
reporting.
Operational Risk
Operational risk can result from a variety of factors, including failure to obtain proper internal
authorisations, improperly documented transactions, failure of operational and information security
procedures, computer systems, software or equipment, fraud, inadequate training and employee
errors. We attempt to mitigate operational risk by maintaining a comprehensive system of internal
controls, establishing systems and procedures to monitor transactions, maintaining key back-up
procedures and undertaking regular contingency planning. Processes have been categorised based on
the frequency and impact of the operational risk that they carry. Based on this classification, mitigants
have been outlined to reduce the risk. We have initiated work on modelling the impact of losses arising
out of operational risk inherent in different processes as part of our approach towards the new Basel
Capital Accord.
The Middle Office Group monitors adherence to credit and investment procedures. The Internal Audit
Group undertakes a comprehensive audit of business groups and other functions, in accordance with a
risk-based audit plan. This plan allocates audit resources based on an assessment of the operational
risks in the various businesses. We have been a pioneer in the implementation of a risk-based audit
methodology in the Indian banking sector. The Internal Audit Group conceptualises and implements
improved systems of internal controls to minimize operational risk.
TREASURY
Effective fiscal 2004, we restructured our treasury operations to separate the balance sheet
management function (which now forms part of the Finance Group), the corporate markets business
and the proprietary trading activity (both of which are now part of the Wholesale Banking Group, as
described earlier). In fiscal 2004, the balance sheet management function managed interest rate
sensitivity by actively using rupee interest rate swaps as well as by rebalancing the duration of the
government securities portfolio held for compliance with statutory liquidity reserve (SLR) norms. During
the year, we also introduced the ICICI Bank Advance Rate (I-BAR), a benchmark prime lending rate in line
with the RBI and Indian Banks' Association (IBA) guidelines for pricing new loans.
In line with the expansion of international business of the bank, the treasury also expanded its
functioning across geographies internationally. A treasury function was set up at Singapore for
supporting operations of the Singapore branch. Similarly treasury operations were set up to support
operations of the Offshore Banking Unit at Mumbai.
INFORMATION TECHNOLOGY
We are at the forefront of usage of technology in the financial services sector in India. We use
information technology as a strategic tool for our business operations, to gain competitive advantage
and to improve overall productivity and efficiency of the organisation. All the technology initiatives are
42
Business Overview
dickenson intellinetics 5690 2791 ICICI Annual Report 2004
aimed at enhancing value, offering customers enhanced convenience and improved service while
optimizing costs. Our focus on technology emphasises enhanced level of customer services like 24/7
access and multi-channel banking; cost efficiency through automation and workflow management,
wider and focused market reach and opportunities for cross-selling; and the use of application of
information systems to effectively monitor and control risks. ICICI Bank has three technology groups,
namely, the Wholesale Product & Technology Group, the Retail Technology Group and the Technology
Management Group. The Wholesale and Retail Technology Groups are dedicated to the planning and
management of technology requirements for corporate and retail products, respectively. These groups
are embedded within the Retail and Wholesale Banking Groups to ensure effective synergy between
business operations and technology. The Technology Management Group, which reports to the
Managing Director & CEO, is responsible for enterprise-wide technology initiatives and policy and plays
a key role in identifying technologies for the future.
We use a combination of physical and electronic delivery channels to maximise customer choice and
convenience, which has helped differentiation of products in the marketplace. We have one of the
largest ATM networks in the country with 1,790 ATMs, and have also entered into ATM sharing
arrangements with other banks. We offer a wide range of information and transactional services to our
customers through our website on a 24/7 basis. We offer a secure and user-friendly platform for forex
trading through the Internet that makes it easy for customers to get live prices for the deals and transact
from virtually anywhere in the world.
HUMAN RESOURCES
At March 31, 2004 we had 13,609 employees. In fiscal 2004, we continued our focus on talent
management, in India and across other geographies where we are present, as an essential element of
our strategy and as a key management focus. Our talent management initiative involves enhancing our
talent pool through recruitment and capability development to support our commitments to our
stakeholders.
We undertake talent acquisition to bring new skills, competencies and experience into the organisation
and meet the requirements of rapidly growing businesses. We are a preferred employer, both in top
business schools and other educational institutions and in lateral recruitment. The wide range of career
opportunities offered across the entire spectrum of financial services and our focus on capability
development have ensured attraction of quality talent. We ensure high quality in our talent pool through
a stringent selection process with rigorous testing and profile matching procedures.
We believe that building a learning organisation is critical for being competitive in products and
services and meeting customer expectations. Classroom training programmes at a dedicated training
facility train, on an average, 1,600 employees a month. Advanced e-learning solutions are used by over
95% of employees and promote “anytime anywhere learning”. The share of e-learning in total training
is approximately 50%, compared to a global benchmark, as per a study by American Society for
Training & Development (ASTD) in 2002, of 20%. We build capability through encouraging cross-
functional movement, thereby leveraging talent across the organisation and providing new
opportunities to employees. We focus on leadership development as an integral part of talent
management. A study conducted by Hewitt Associates in 2003 places us in the top five “Companies for
Leaders” in the Asia-Pacific, in terms of building and managing talent. Various tools such as capability 43
Business Overview
dickenson intellinetics 5690 2791 ICICI Annual Report 2004
profiling, 360-degree feedback mechanisms, coaching and mentoring initiatives provide the base for
building leadership capabilities. Leadership development is also aligned with the performance
management system to identify, develop and nurture potential. The performance management system,
based on the balanced score card philosophy, also provides a structured platform to reinforce the
organisation's achievement-oriented culture. ICICI Bank has clearly defined performance parameters
and employee empowerment for achievement of goals.
ORGANISATIONAL EXCELLENCE
The Organisational Excellence Group, headed by a Senior General Manager who reports to the
Managing Director & CEO, is engaged in institutionalising quality in the Bank by building skills and
capabilities in various quality frameworks. The Group has evolved a holistic workplace transformation
model encompassing various quality methodologies including Five S and Six Sigma. This initiative is
aimed at improving workplaces, processes and customer touchpoints through a step-wise, structured
approach. A key initiative undertaken by the Group is the implementation of Five S, which endeavours to
address process and service issues through active involvement and participation at all levels in the
organisation. We are rolling out Five S across our offices and branches. The Group partners with
business units to help align quality initiatives with business targets. The Group also supports other ICICI
group companies in their quality initiatives.
COMMUNITY DEVELOPMENT
Our social initiatives are designed to improve the capacities of the poorest of the poor to participate in
the larger economy. We believe that optimising child health in the early years, providing universal
elementary education and maximising access to micro financial services are critical for facilitating
effective participation.
Early Child Health
Through our work in Early Child Health, we aim to maximise the proportion of infants born healthy and
ensure optimal growth and development outcomes in the first three years of life. In fiscal 2004, we
initiated projects to achieve these goals in urban areas. We entered into a partnership with the Society
for Nutrition Education and Health Action, Mumbai to (a) develop a scalable strategy for timely and
appropriate maternal and neonatal referrals (b) develop effective 'models' for delivery of antenatal,
postnatal and neonatal care services in urban areas and (c) innovate strategies of involving urban slum
communities to ensure timely access to and appropriate quality of services.
On the rural front, we consolidated our partnerships with the Government of Jharkhand and our various
non-government organization (NGO) partners including Krishi Gram Vikas Kendra, Ranchi and Child In
Need Institute, Kolkata. These partnerships have been formulated to pilot community based strategies
for converging the design and delivery of existing health and nutrition services and improving the quality
of Behaviour Change Communication.
Elementary Education
The aim of our work in elementary education is to maximise the number of 14 year-olds who have a
basic level of education. We believe education should at the very least enable every individual to
participate meaningfully in social, political and economic processes, and to avail of opportunities to 44
Business Overview
dickenson intellinetics 5690 2791 ICICI Annual Report 2004

learn advanced skills throughout life. During fiscal 2004, as a continuation of our strategy to improve
teacher performance, we focused on establishing / supporting resource organisations to build the
capacity of educational structures. Two resource organisations, Digantar and Vidya Bhawan Society,
were supported.
In fiscal 2004, we also initiated work with the Government of Chhattisgarh and with the resource
groups supported by it. The work involved several rounds of intensive workshops for training of the
state functionaries. The direct outcomes of this association are the preparation of curriculum, syllabus,
and textbooks for certain schooling levels.
Micro Financial Services
In this area, we have been working towards increasing the access of the poorest of the poor to financial
services including banking, credit, savings and insurance. The main elements of our strategy in micro
finance are creating interfaces between mainstream financial service providers/markets and
community-based organisations to maximise outreach, leveraging technology to reduce the costs of
micro finance delivery and catalysing the development of appropriate financial products for poor
households.
In fiscal 2004, we focussed on increasing access to micro financial services through a variety of
approaches. These include development of low cost Internet kiosks and entrepreneur channels. We
also entered into a partnership with SEWA Bank to increase its outreach from two hundred thousand to
a million poor women. A joint venture with Grameen Foundation USA was established with the
objective of increasing capital flows to micro finance institutions, which in turn would enable them to
expand their reach.
PUBLIC RECOGNITION
During fiscal 2004, we received several prestigious awards in recognition of our business strategies,
customer service levels, technology focus and human resource practices, including:
! “Best domestic commercial bank in India” by Asiamoney
! “Best emerging bank in India” by Global Finance
! “Best multi-channel strategy 2003” by the Banker Magazine, UK
! “Bank of the Year 2003, in India” by The Banker Magazine of UK
! “Excellence in Retail Financial Services 2003” award by Asian Bankers Journal
45
Business Overview
dickenson intellinetics 5690 2791 ICICI Annual Report 2004
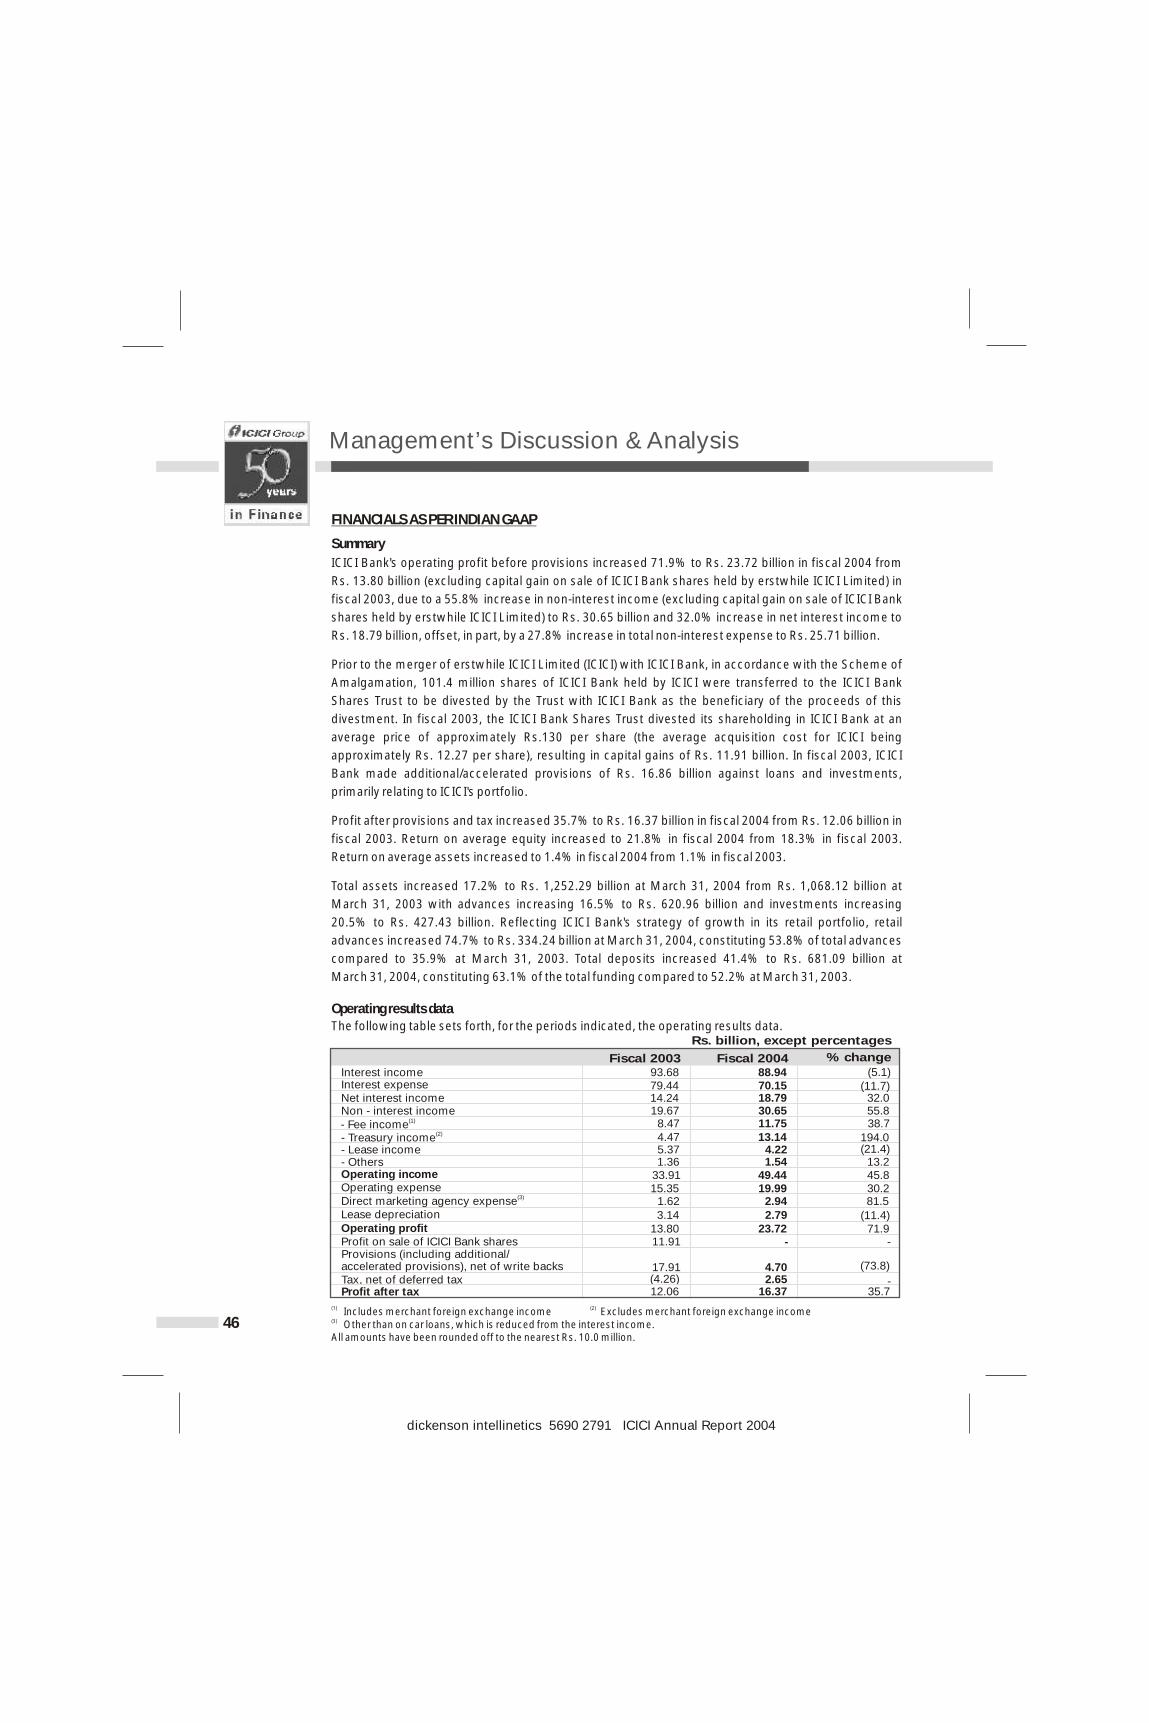
FINANCIALS AS PER INDIAN GAAP
Summary
ICICI Bank's operating profit before provisions increased 71.9% to Rs. 23.72 billion in fiscal 2004 from
Rs. 13.80 billion (excluding capital gain on sale of ICICI Bank shares held by erstwhile ICICI Limited) in
fiscal 2003, due to a 55.8% increase in non-interest income (excluding capital gain on sale of ICICI Bank
shares held by erstwhile ICICI Limited) to Rs. 30.65 billion and 32.0% increase in net interest income to
Rs. 18.79 billion, offset, in part, by a 27.8% increase in total non-interest expense to Rs. 25.71 billion.
Prior to the merger of erstwhile ICICI Limited (ICICI) with ICICI Bank, in accordance with the Scheme of
Amalgamation, 101.4 million shares of ICICI Bank held by ICICI were transferred to the ICICI Bank
Shares Trust to be divested by the Trust with ICICI Bank as the beneficiary of the proceeds of this
divestment. In fiscal 2003, the ICICI Bank Shares Trust divested its shareholding in ICICI Bank at an
average price of approximately Rs.130 per share (the average acquisition cost for ICICI being
approximately Rs. 12.27 per share), resulting in capital gains of Rs. 11.91 billion. In fiscal 2003, ICICI
Bank made additional/accelerated provisions of Rs. 16.86 billion against loans and investments,
primarily relating to ICICI's portfolio.
Profit after provisions and tax increased 35.7% to Rs. 16.37 billion in fiscal 2004 from Rs. 12.06 billion in
fiscal 2003. Return on average equity increased to 21.8% in fiscal 2004 from 18.3% in fiscal 2003.
Return on average assets increased to 1.4% in fiscal 2004 from 1.1% in fiscal 2003.
Total assets increased 17.2% to Rs. 1,252.29 billion at March 31, 2004 from Rs. 1,068.12 billion at
March 31, 2003 with advances increasing 16.5% to Rs. 620.96 billion and investments increasing
20.5% to Rs. 427.43 billion. Reflecting ICICI Bank's strategy of growth in its retail portfolio, retail
advances increased 74.7% to Rs. 334.24 billion at March 31, 2004, constituting 53.8% of total advances
compared to 35.9% at March 31, 2003. Total deposits increased 41.4% to Rs. 681.09 billion at
March 31, 2004, constituting 63.1% of the total funding compared to 52.2% at March 31, 2003.
Operating results dataThe following table sets forth, for the periods indicated, the operating results data.
(1) (2)Includes merchant foreign exchange income Excludes merchant foreign exchange income(3) Other than on car loans, which is reduced from the interest income.All amounts have been rounded off to the nearest Rs. 10.0 million.
46
Management’s Discussion & Analysis
dickenson intellinetics 5690 2791 ICICI Annual Report 2004
Profit after tax
12.06 16.37
Provisions (including additional/ accelerated provisions), net of write backs 17.91 4.70 (73.8)Tax, net of deferred tax (4.26) 2.65 -
35.7
Fiscal 2004 Fiscal 2003 % change
Rs. billion, except percentages
Interest incomeInterest expenseNet interest incomeNon - interest income
(1) - Fee income(2)- Treasury income
- Lease income- OthersOperating incomeOperating expense
(3)Direct marketing agency expenseLease depreciationOperating profit
93.6879.4414.2419.67
8.474.475.371.36
33.9115.35
1.623.14
13.80
88.9470.1518.7930.6511.7513.14
4.221.54
49.4419.99
2.942.79
23.72
(5.1)(11.7)
32.055.838.7
194.0(21.4)
13.245.830.281.5
(11.4)71.9
Profit on sale of ICICI Bank shares 11.91 --
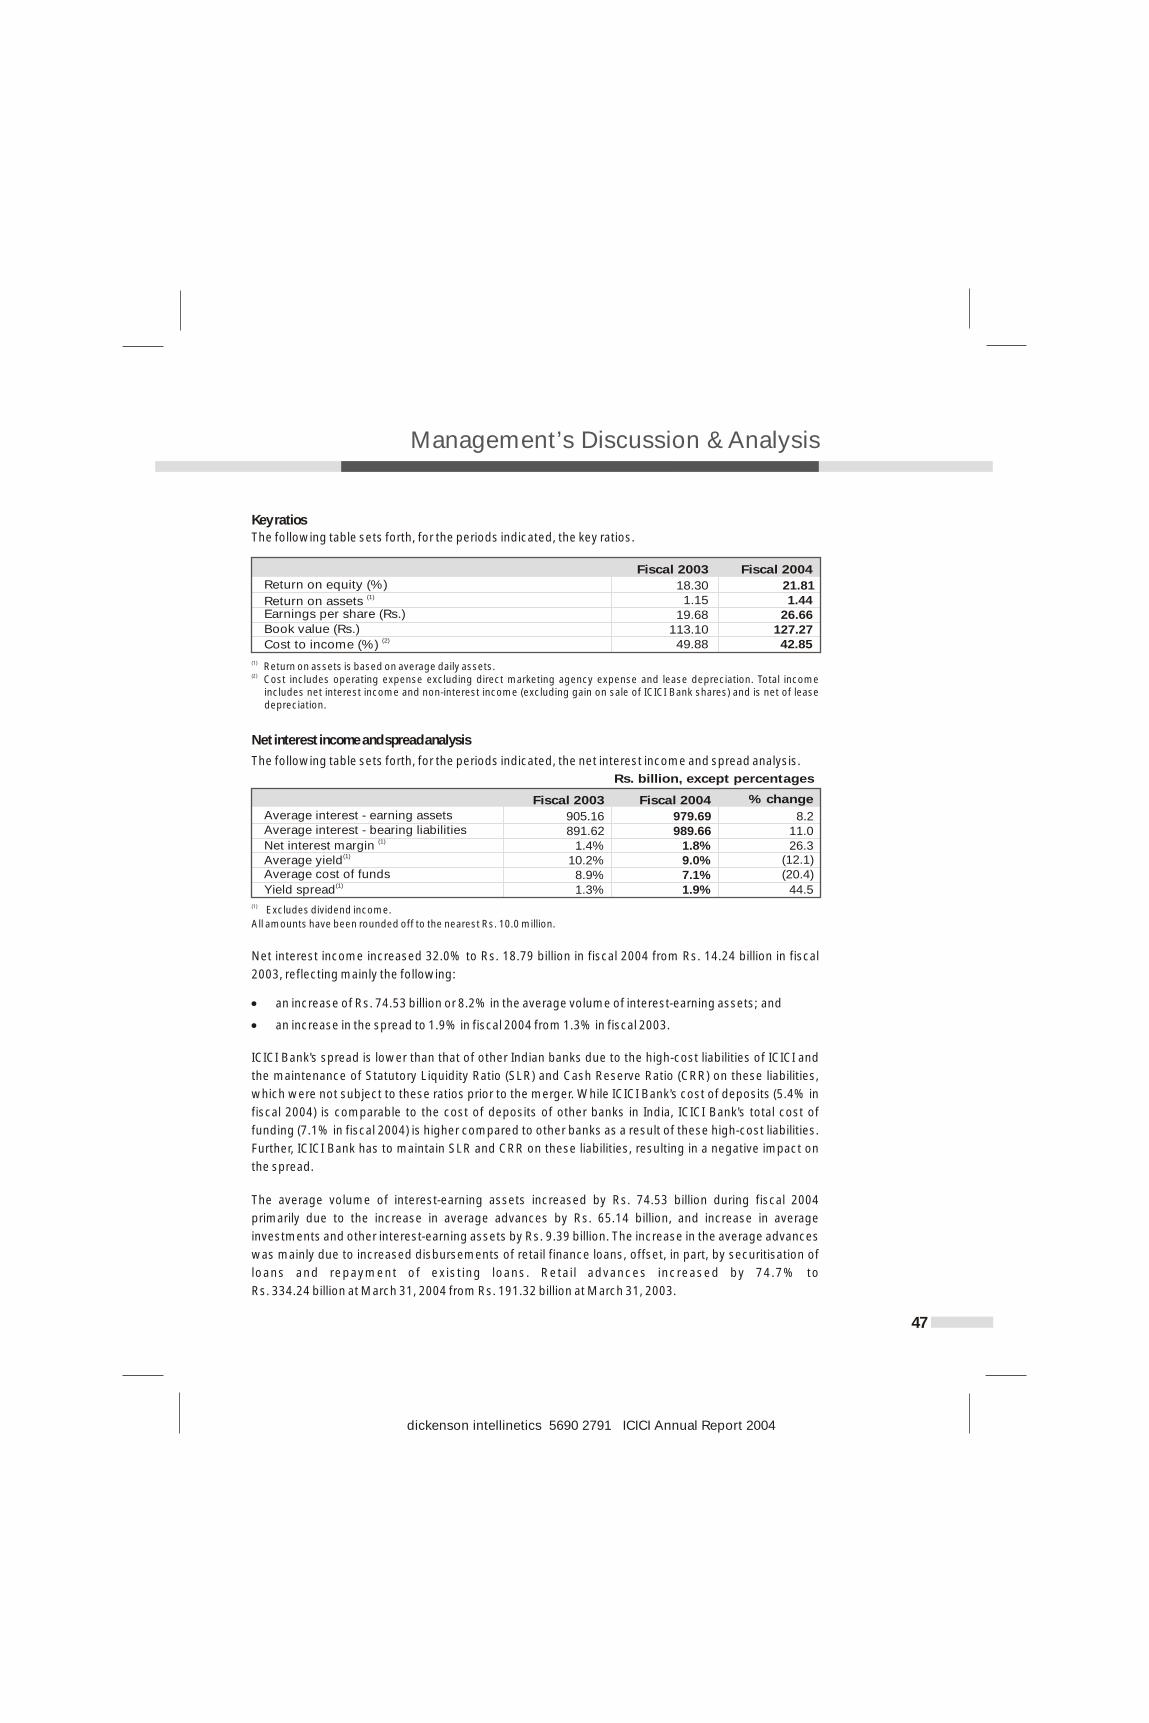
Key ratiosThe following table sets forth, for the periods indicated, the key ratios.
(1) Return on assets is based on average daily assets.(2) Cost includes operating expense excluding direct marketing agency expense and lease depreciation. Total income
includes net interest income and non-interest income (excluding gain on sale of ICICI Bank shares) and is net of lease depreciation.
Net interest income and spread analysis
The following table sets forth, for the periods indicated, the net interest income and spread analysis.
(1) Excludes dividend income.
All amounts have been rounded off to the nearest Rs. 10.0 million.
Net interest income increased 32.0% to Rs. 18.79 billion in fiscal 2004 from Rs. 14.24 billion in fiscal
2003, reflecting mainly the following:
! an increase of Rs. 74.53 billion or 8.2% in the average volume of interest-earning assets; and
! an increase in the spread to 1.9% in fiscal 2004 from 1.3% in fiscal 2003.
ICICI Bank's spread is lower than that of other Indian banks due to the high-cost liabilities of ICICI and
the maintenance of Statutory Liquidity Ratio (SLR) and Cash Reserve Ratio (CRR) on these liabilities,
which were not subject to these ratios prior to the merger. While ICICI Bank's cost of deposits (5.4% in
fiscal 2004) is comparable to the cost of deposits of other banks in India, ICICI Bank's total cost of
funding (7.1% in fiscal 2004) is higher compared to other banks as a result of these high-cost liabilities.
Further, ICICI Bank has to maintain SLR and CRR on these liabilities, resulting in a negative impact on
the spread.
The average volume of interest-earning assets increased by Rs. 74.53 billion during fiscal 2004
primarily due to the increase in average advances by Rs. 65.14 billion, and increase in average
investments and other interest-earning assets by Rs. 9.39 billion. The increase in the average advances
was mainly due to increased disbursements of retail finance loans, offset, in part, by securitisation of
loans and repayment of existing loans. Retail advances increased by 74.7% to
Rs. 334.24 billion at March 31, 2004 from Rs. 191.32 billion at March 31, 2003.
47
Management’s Discussion & Analysis
dickenson intellinetics 5690 2791 ICICI Annual Report 2004
Fiscal 2004
Fiscal 2003
Return on equity (%) 18.30 21.81(1)Return on assets 1.15 1.44
Earnings per share (Rs.) 19.68 26.66Book value (Rs.) 113.10 127.27
(2)Cost to income (%) 49.88 42.85
Fiscal 2004
Fiscal 2003 % change
Rs. billion, except percentages
Average interest - earning assets 905.16 979.69 8.2Average interest - bearing liabilities 891.62 989.66 11.0
(1)Net interest margin 1.4% 1.8% 26.3(1)Average yield 10.2% 9.0% (12.1)
Average cost of funds 8.9% 7.1% (20.4)(1)Yield spread 1.3% 1.9% 44.5
Management’s Discussion & Analysis
While both interest income and interest expense declined in line with the declining interest rate trend in
the economy, interest expense declined more sharply than interest income. Total interest income
decreased 5.1% to Rs. 88.94 billion in fiscal 2004 from Rs. 93.68 billion in fiscal 2003 primarily due to a
decline of 1.2% in yield on interest-earning assets, offset, in part, by an increase of 8.2% in the average
interest-earning assets to Rs. 979.69 billion. Yield on average interest-earning assets decreased to 9.0%
in fiscal 2004 from 10.2% in fiscal 2003 primarily due to the generally declining interest rate
environment. While the yield on average advances declined 1.3% to 10.7% in fiscal 2004, the yield on
average investments declined 1.7% to 7.1% in fiscal 2004.
Total interest expense decreased 11.7% to Rs. 70.15 billion in fiscal 2004 from Rs. 79.44 billion in fiscal
2003, primarily due to a decline of 1.8% in the cost of funds offset, in part, by a 11.0% increase in
average interest-bearing liabilities to Rs. 989.66 billion. Cost of funds decreased to 7.1% for fiscal 2004
from 8.9% for fiscal 2003 primarily due to the increased proportion of deposits in ICICI Bank's funding on
account of repayments of higher cost borrowings of ICICI as well as a reduction in the cost of deposits
to 5.4% from 6.8%. Total deposits at March 31, 2004 constituted 63.1% of ICICI Bank's funding
(comprising deposits and borrowings) compared to 52.2% at March 31, 2003. The cost of borrowings
also declined to 9.2% for fiscal 2004 from 10.2% during fiscal 2003 primarily due to the repayment of
higher cost ICICI borrowings and the lower rate of interest on new borrowings. As ICICI's higher cost
borrowings mature, ICICI Bank's cost of funds is expected to decline further.
As a result of the 1.8% decline in the cost of funds, offset, in part by a 1.2% decline in yield on average
interest-earning assets, net interest margin increased to 1.8% for fiscal 2004 from 1.4% for fiscal 2003.
Net interest margin is, however, expected to continue to be lower than other banks in India until the
borrowings of ICICI are repaid.
Non-interest income
For the purpose of analysis below, total non-interest income excludes capital gains of Rs. 11.91 billion
realised in fiscal 2003 on sale of ICICI Bank shares held by ICICI which were transferred to a trust at the
time of the merger.
Non-interest income increased by 55.8% in fiscal 2004 to Rs. 30.65 billion from Rs. 19.67 billion in fiscal
2003 primarily due to increase in income from treasury-related activities by 194.0% to Rs. 13.14 billion in
fiscal 2004 and 38.7% increase in fee income (including merchant foreign exchange income, which is
profit on foreign exchange transactions in the nature of fee income), offset, in part by a 21.4% decline in
lease income.
Fee income increased by 38.7% primarily due to growth in fee income from retail products and services,
including fees arising from retail asset products like home loans and credit cards and retail liability-
related income like account servicing charges, and an increase in transaction banking fee income from
corporate clients. Fee income includes merchant foreign exchange income amounting to Rs. 0.90
billion in fiscal 2004 and Rs. 0.53 billion in fiscal 2003.
48
dickenson intellinetics 5690 2791 ICICI Annual Report 2004
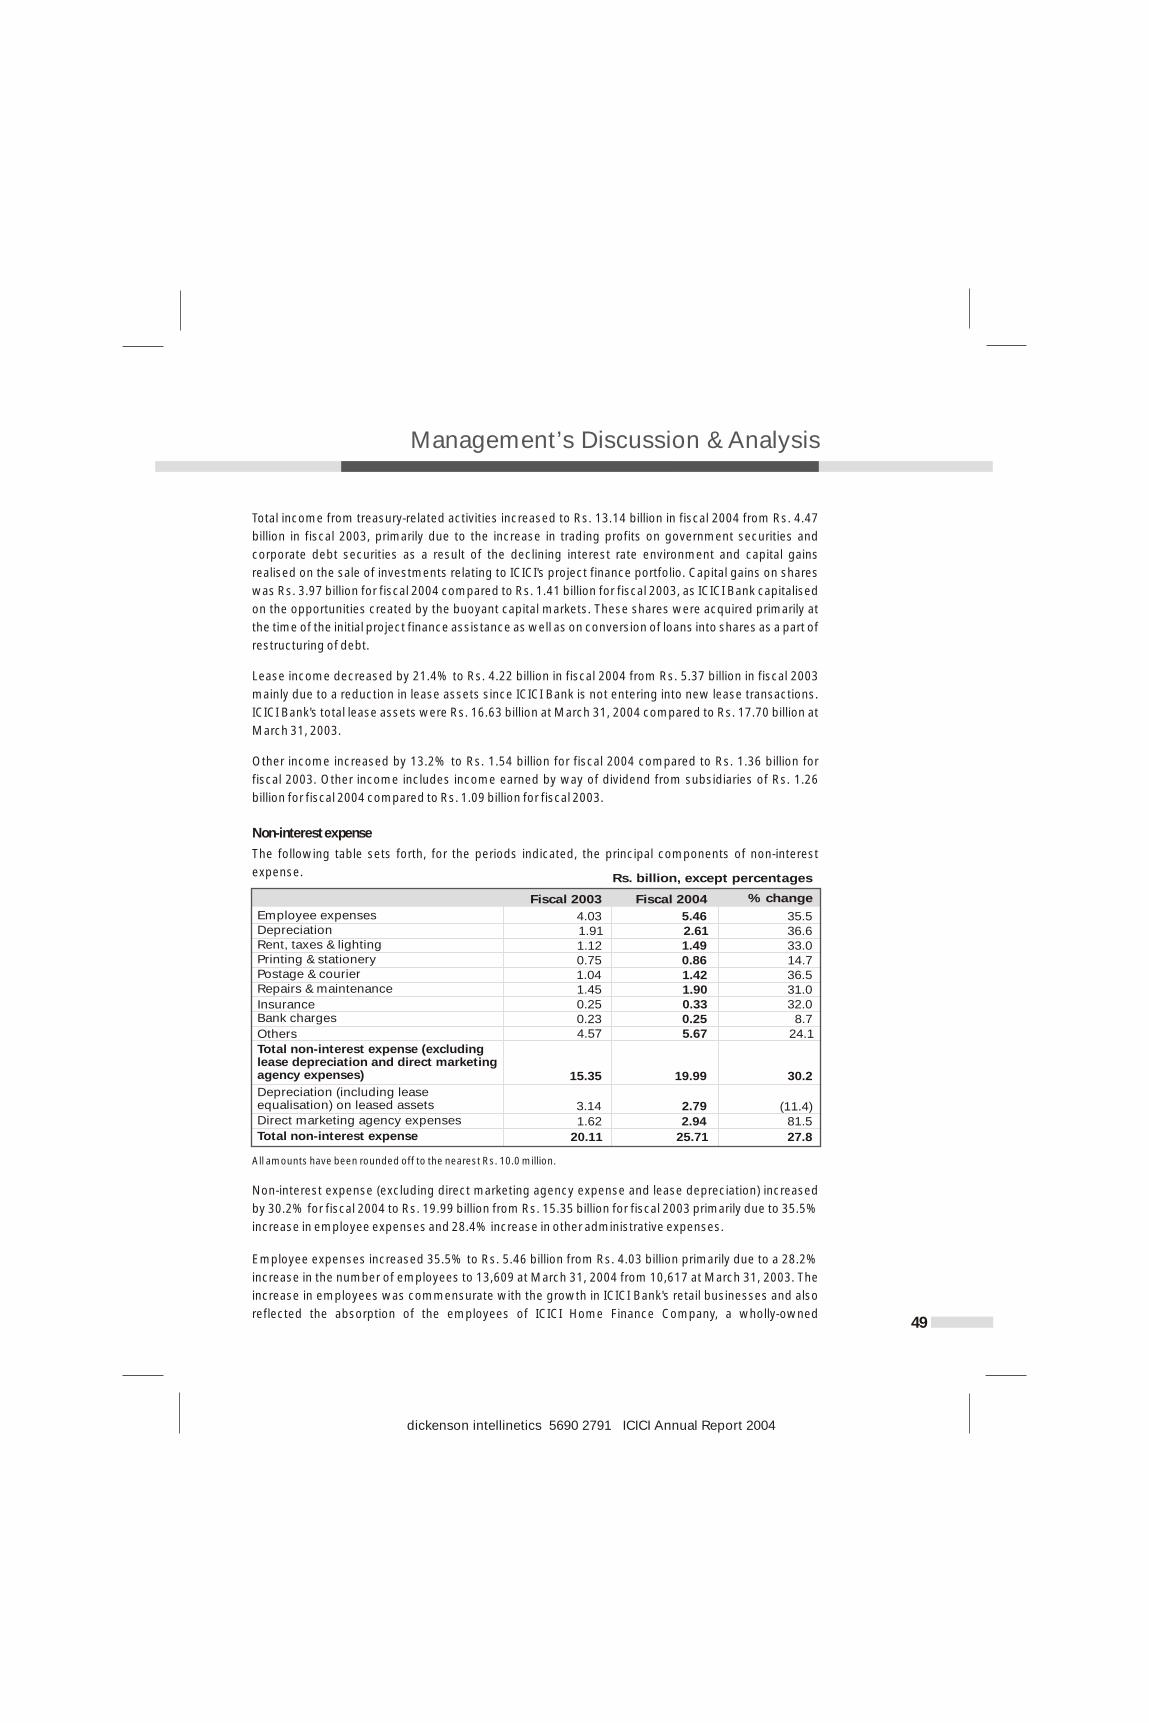
Management’s Discussion & Analysis
Total income from treasury-related activities increased to Rs. 13.14 billion in fiscal 2004 from Rs. 4.47
billion in fiscal 2003, primarily due to the increase in trading profits on government securities and
corporate debt securities as a result of the declining interest rate environment and capital gains
realised on the sale of investments relating to ICICI's project finance portfolio. Capital gains on shares
was Rs. 3.97 billion for fiscal 2004 compared to Rs. 1.41 billion for fiscal 2003, as ICICI Bank capitalised
on the opportunities created by the buoyant capital markets. These shares were acquired primarily at
the time of the initial project finance assistance as well as on conversion of loans into shares as a part of
restructuring of debt.
Lease income decreased by 21.4% to Rs. 4.22 billion in fiscal 2004 from Rs. 5.37 billion in fiscal 2003
mainly due to a reduction in lease assets since ICICI Bank is not entering into new lease transactions.
ICICI Bank's total lease assets were Rs. 16.63 billion at March 31, 2004 compared to Rs. 17.70 billion at
March 31, 2003.
Other income increased by 13.2% to Rs. 1.54 billion for fiscal 2004 compared to Rs. 1.36 billion for
fiscal 2003. Other income includes income earned by way of dividend from subsidiaries of Rs. 1.26
billion for fiscal 2004 compared to Rs. 1.09 billion for fiscal 2003.
Non-interest expense
The following table sets forth, for the periods indicated, the principal components of non-interest
expense.
All amounts have been rounded off to the nearest Rs. 10.0 million.
Non-interest expense (excluding direct marketing agency expense and lease depreciation) increased
by 30.2% for fiscal 2004 to Rs. 19.99 billion from Rs. 15.35 billion for fiscal 2003 primarily due to 35.5%
increase in employee expenses and 28.4% increase in other administrative expenses.
Employee expenses increased 35.5% to Rs. 5.46 billion from Rs. 4.03 billion primarily due to a 28.2%
increase in the number of employees to 13,609 at March 31, 2004 from 10,617 at March 31, 2003. The
increase in employees was commensurate with the growth in ICICI Bank's retail businesses and also
reflected the absorption of the employees of ICICI Home Finance Company, a wholly-owned
49
dickenson intellinetics 5690 2791 ICICI Annual Report 2004
Fiscal 2004
Fiscal 2003 % change
35.536.633.0
14.7
36.531.032.0
8.724.1
81.5
Employee expenses DepreciationRent, taxes & lightingPrinting & stationeryPostage & courierRepairs & maintenance
InsuranceBank charges
Others
Direct marketing agency expenses
Total non-interest expense
4.031.911.120.751.041.450.250.23 4.57
1.62
20.11
5.462.611.490.861.421.900.330.25 5.67
30.2
Total non-interest expense (excluding lease depreciation and direct marketing agency expenses) 15.35 19.99
(11.4)Depreciation (including lease equalisation) on leased assets 3.14 2.79
2.94
25.71 27.8
Rs. billion, except percentages
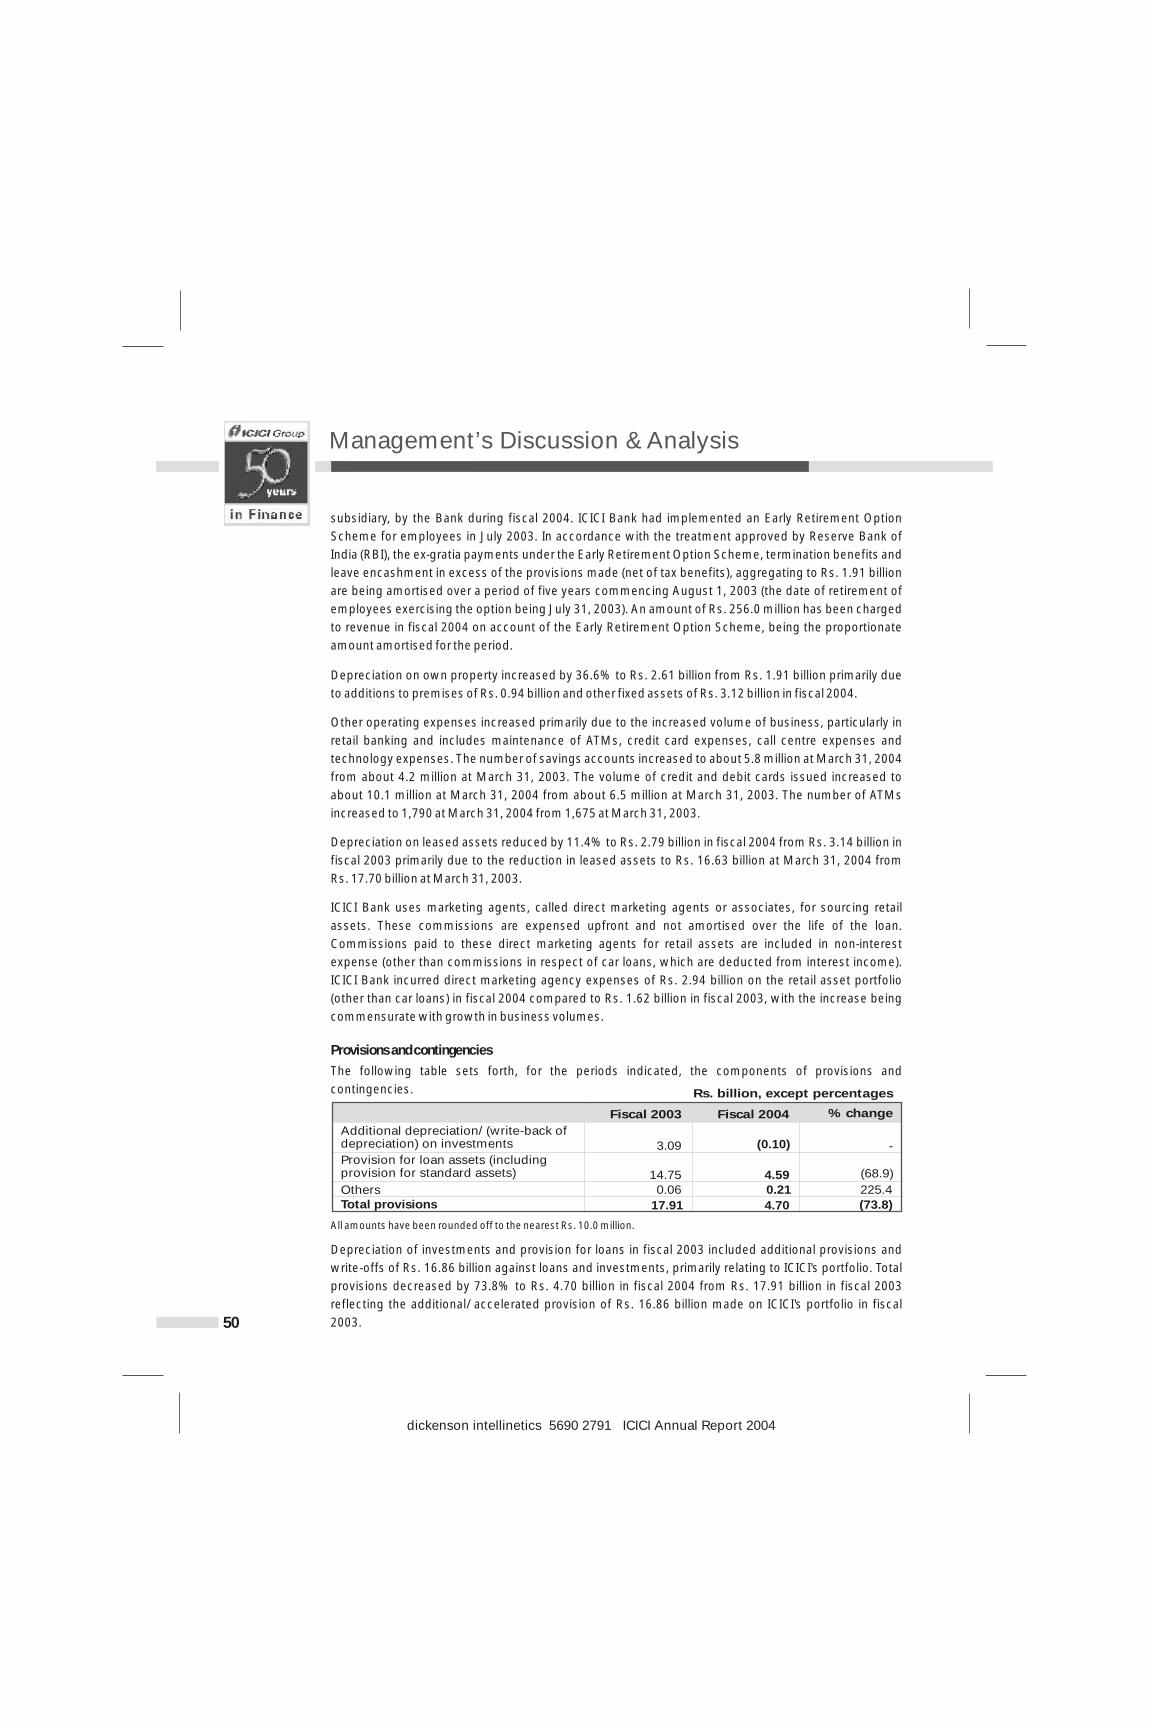
Management’s Discussion & Analysis
subsidiary, by the Bank during fiscal 2004. ICICI Bank had implemented an Early Retirement Option
Scheme for employees in July 2003. In accordance with the treatment approved by Reserve Bank of
India (RBI), the ex-gratia payments under the Early Retirement Option Scheme, termination benefits and
leave encashment in excess of the provisions made (net of tax benefits), aggregating to Rs. 1.91 billion
are being amortised over a period of five years commencing August 1, 2003 (the date of retirement of
employees exercising the option being July 31, 2003). An amount of Rs. 256.0 million has been charged
to revenue in fiscal 2004 on account of the Early Retirement Option Scheme, being the proportionate
amount amortised for the period.
Depreciation on own property increased by 36.6% to Rs. 2.61 billion from Rs. 1.91 billion primarily due
to additions to premises of Rs. 0.94 billion and other fixed assets of Rs. 3.12 billion in fiscal 2004.
Other operating expenses increased primarily due to the increased volume of business, particularly in
retail banking and includes maintenance of ATMs, credit card expenses, call centre expenses and
technology expenses. The number of savings accounts increased to about 5.8 million at March 31, 2004
from about 4.2 million at March 31, 2003. The volume of credit and debit cards issued increased to
about 10.1 million at March 31, 2004 from about 6.5 million at March 31, 2003. The number of ATMs
increased to 1,790 at March 31, 2004 from 1,675 at March 31, 2003.
Depreciation on leased assets reduced by 11.4% to Rs. 2.79 billion in fiscal 2004 from Rs. 3.14 billion in
fiscal 2003 primarily due to the reduction in leased assets to Rs. 16.63 billion at March 31, 2004 from
Rs. 17.70 billion at March 31, 2003.
ICICI Bank uses marketing agents, called direct marketing agents or associates, for sourcing retail
assets. These commissions are expensed upfront and not amortised over the life of the loan.
Commissions paid to these direct marketing agents for retail assets are included in non-interest
expense (other than commissions in respect of car loans, which are deducted from interest income).
ICICI Bank incurred direct marketing agency expenses of Rs. 2.94 billion on the retail asset portfolio
(other than car loans) in fiscal 2004 compared to Rs. 1.62 billion in fiscal 2003, with the increase being
commensurate with growth in business volumes.
Provisions and contingencies
The following table sets forth, for the periods indicated, the components of provisions and
contingencies.
All amounts have been rounded off to the nearest Rs. 10.0 million.
Depreciation of investments and provision for loans in fiscal 2003 included additional provisions and
write-offs of Rs. 16.86 billion against loans and investments, primarily relating to ICICI's portfolio. Total
provisions decreased by 73.8% to Rs. 4.70 billion in fiscal 2004 from Rs. 17.91 billion in fiscal 2003
reflecting the additional/ accelerated provision of Rs. 16.86 billion made on ICICI's portfolio in fiscal
2003.50
dickenson intellinetics 5690 2791 ICICI Annual Report 2004
Fiscal 2004
Fiscal 2003 % change
Rs. billion, except percentages
OthersTotal provisions
Additional depreciation/ (write-back of depreciation) on investments 3.09 (0.10) -Provision for loan assets (including provision for standard assets) 14.75 4.59 (68.9)
0.06 0.21 225.4
17.91 4.70 (73.8)
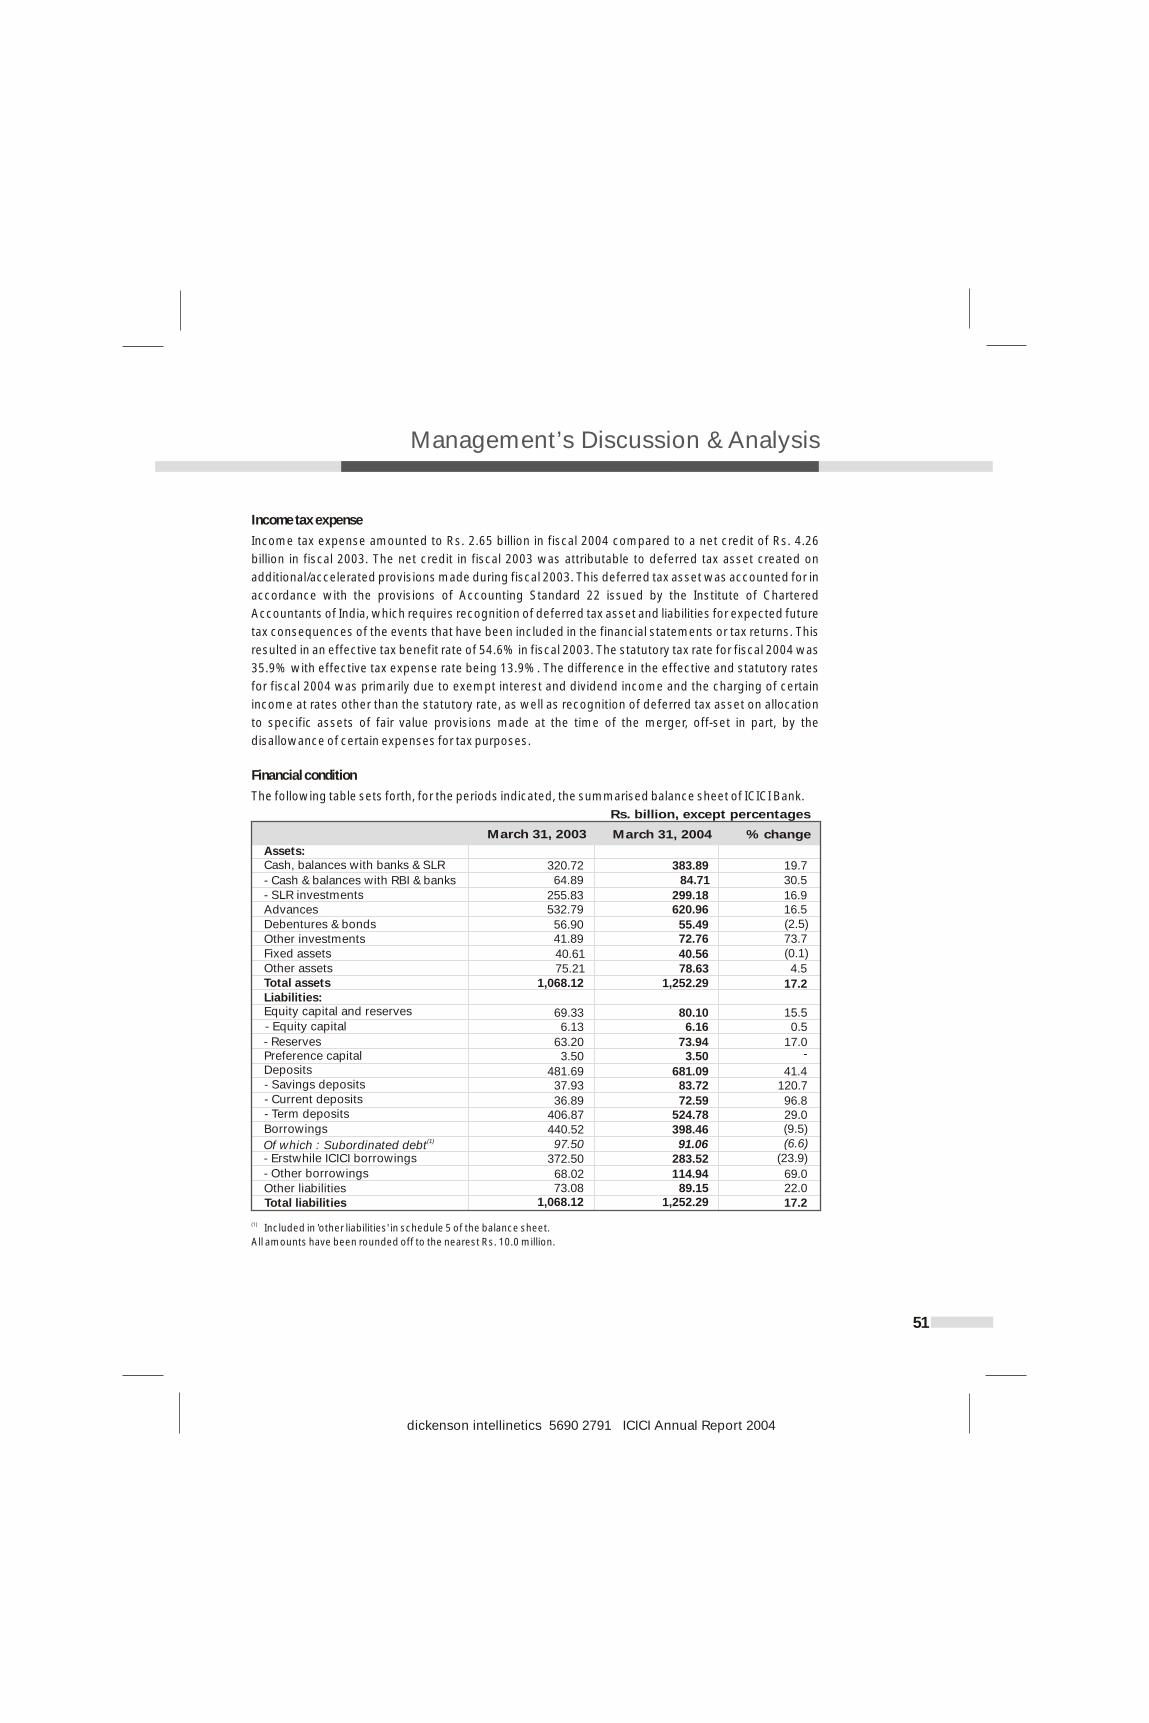
Management’s Discussion & Analysis
Income tax expense
Income tax expense amounted to Rs. 2.65 billion in fiscal 2004 compared to a net credit of Rs. 4.26
billion in fiscal 2003. The net credit in fiscal 2003 was attributable to deferred tax asset created on
additional/accelerated provisions made during fiscal 2003. This deferred tax asset was accounted for in
accordance with the provisions of Accounting Standard 22 issued by the Institute of Chartered
Accountants of India, which requires recognition of deferred tax asset and liabilities for expected future
tax consequences of the events that have been included in the financial statements or tax returns. This
resulted in an effective tax benefit rate of 54.6% in fiscal 2003. The statutory tax rate for fiscal 2004 was
35.9% with effective tax expense rate being 13.9%. The difference in the effective and statutory rates
for fiscal 2004 was primarily due to exempt interest and dividend income and the charging of certain
income at rates other than the statutory rate, as well as recognition of deferred tax asset on allocation
to specific assets of fair value provisions made at the time of the merger, off-set in part, by the
disallowance of certain expenses for tax purposes.
Financial condition
The following table sets forth, for the periods indicated, the summarised balance sheet of ICICI Bank.
(1) Included in 'other liabilities' in schedule 5 of the balance sheet.
All amounts have been rounded off to the nearest Rs. 10.0 million.
51
dickenson intellinetics 5690 2791 ICICI Annual Report 2004
Rs. billion, except percentages
March 31, 2004
March 31, 2003 % change
Assets: Cash, balances with banks & SLR 320.72 383.89 19.7
- Cash & balances with RBI & banks 64.89 84.71 30.5
- SLR investments 255.83 299.18 16.9
Advances 532.79 620.96 16.5
Debentures & bonds 56.90 55.49 (2.5)
Other investments 41.89 72.76 73.7
Fixed assets 40.61 40.56 (0.1)
Other assets 75.21 78.63 4.5
Total assets 1,068.12 1,252.29 17.2
Liabilities: Equity capital and reserves 69.33 80.10 15.5
- Equity capital 6.13 6.16 0.5
- Reserves 63.20 73.94 17.0
Preference capital 3.50 3.50 -
Deposits 481.69 681.09 41.4
- Savings deposits 37.93 83.72 120.7
- Current deposits 36.89 72.59 96.8
- Term deposits 406.87 524.78 29.0
Borrowings 440.52 398.46 (9.5) (1) Of which : Subordinated debt 97.50 91.06 (6.6)
- Erstwhile ICICI borrowings 372.50 283.52 (23.9)
- Other borrowings 68.02 114.94 69.0
Other liabilities 73.08 89.15 22.0Total liabilities 1,068.12 1,252.29 17.2
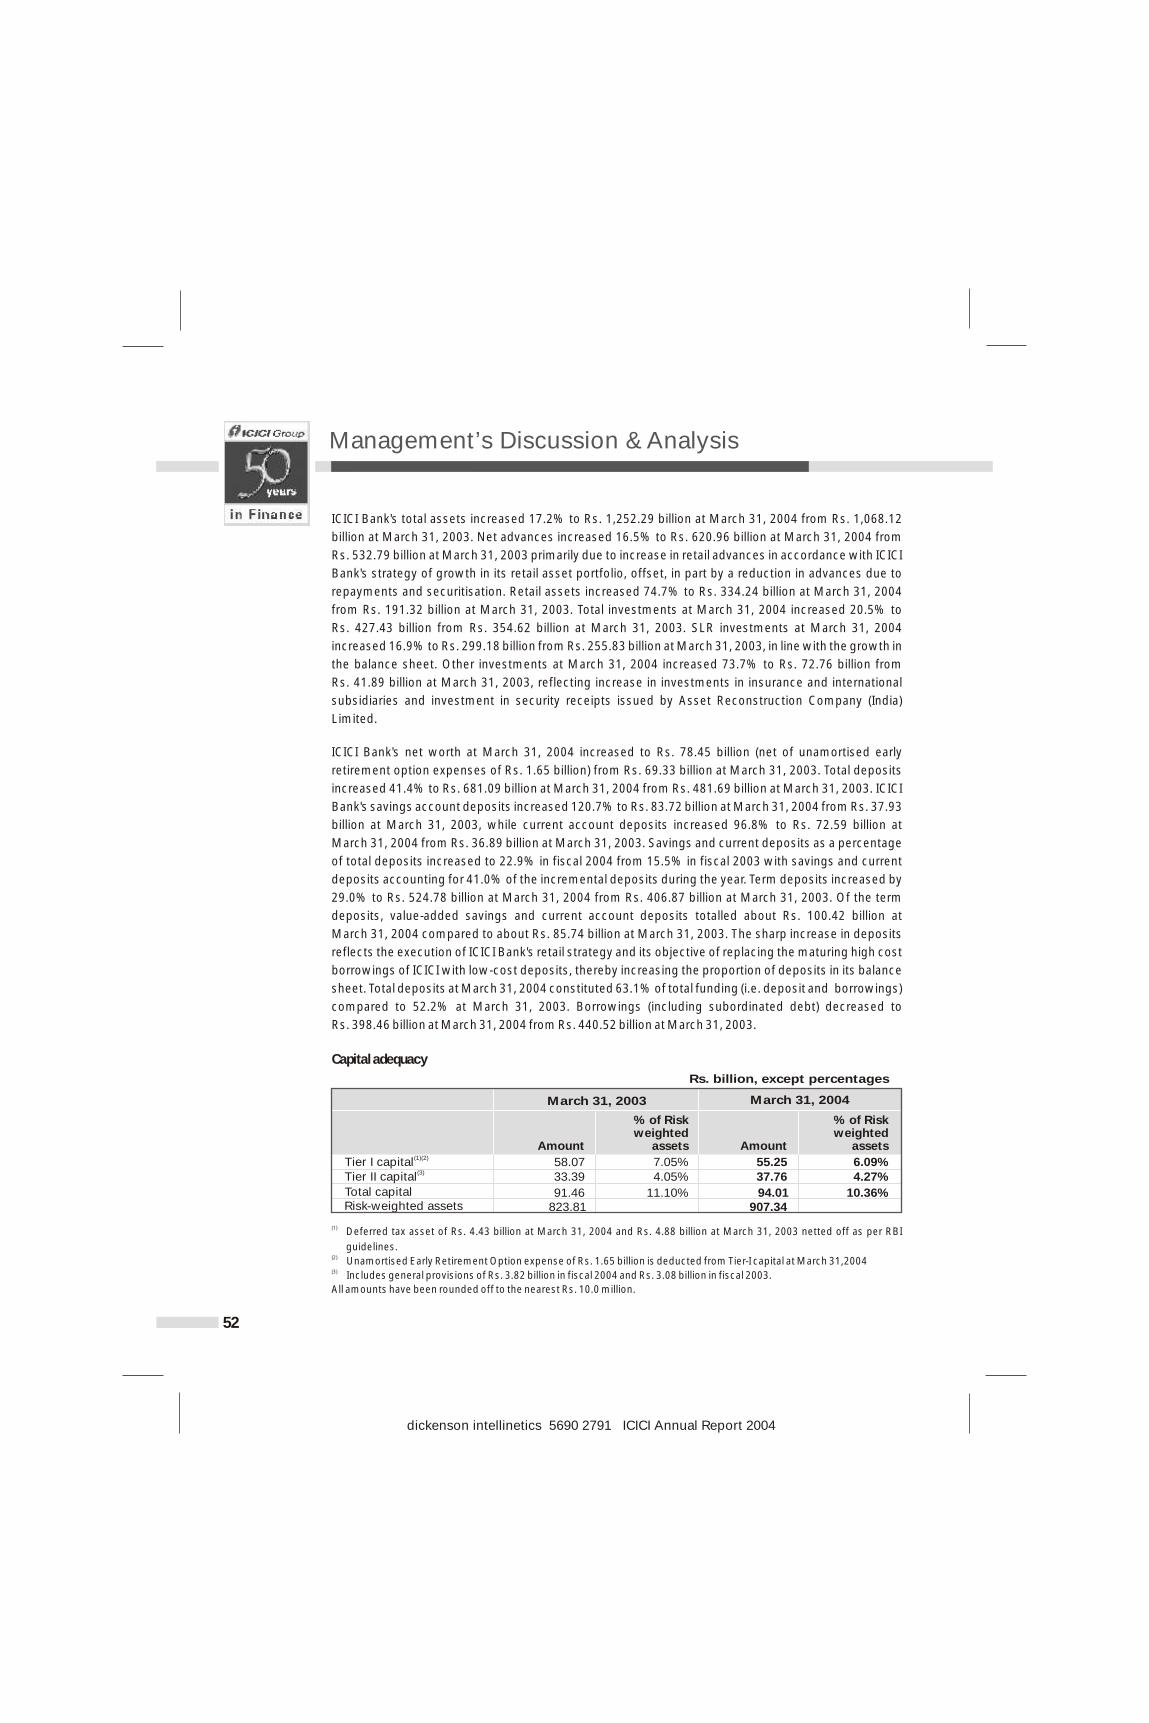
Management’s Discussion & Analysis
ICICI Bank's total assets increased 17.2% to Rs. 1,252.29 billion at March 31, 2004 from Rs. 1,068.12
billion at March 31, 2003. Net advances increased 16.5% to Rs. 620.96 billion at March 31, 2004 from
Rs. 532.79 billion at March 31, 2003 primarily due to increase in retail advances in accordance with ICICI
Bank's strategy of growth in its retail asset portfolio, offset, in part by a reduction in advances due to
repayments and securitisation. Retail assets increased 74.7% to Rs. 334.24 billion at March 31, 2004
from Rs. 191.32 billion at March 31, 2003. Total investments at March 31, 2004 increased 20.5% to
Rs. 427.43 billion from Rs. 354.62 billion at March 31, 2003. SLR investments at March 31, 2004
increased 16.9% to Rs. 299.18 billion from Rs. 255.83 billion at March 31, 2003, in line with the growth in
the balance sheet. Other investments at March 31, 2004 increased 73.7% to Rs. 72.76 billion from
Rs. 41.89 billion at March 31, 2003, reflecting increase in investments in insurance and international
subsidiaries and investment in security receipts issued by Asset Reconstruction Company (India)
Limited.
ICICI Bank's net worth at March 31, 2004 increased to Rs. 78.45 billion (net of unamortised early
retirement option expenses of Rs. 1.65 billion) from Rs. 69.33 billion at March 31, 2003. Total deposits
increased 41.4% to Rs. 681.09 billion at March 31, 2004 from Rs. 481.69 billion at March 31, 2003. ICICI
Bank's savings account deposits increased 120.7% to Rs. 83.72 billion at March 31, 2004 from Rs. 37.93
billion at March 31, 2003, while current account deposits increased 96.8% to Rs. 72.59 billion at
March 31, 2004 from Rs. 36.89 billion at March 31, 2003. Savings and current deposits as a percentage
of total deposits increased to 22.9% in fiscal 2004 from 15.5% in fiscal 2003 with savings and current
deposits accounting for 41.0% of the incremental deposits during the year. Term deposits increased by
29.0% to Rs. 524.78 billion at March 31, 2004 from Rs. 406.87 billion at March 31, 2003. Of the term
deposits, value-added savings and current account deposits totalled about Rs. 100.42 billion at
March 31, 2004 compared to about Rs. 85.74 billion at March 31, 2003. The sharp increase in deposits
reflects the execution of ICICI Bank's retail strategy and its objective of replacing the maturing high cost
borrowings of ICICI with low-cost deposits, thereby increasing the proportion of deposits in its balance
sheet. Total deposits at March 31, 2004 constituted 63.1% of total funding (i.e. deposit and borrowings)
compared to 52.2% at March 31, 2003. Borrowings (including subordinated debt) decreased to
Rs. 398.46 billion at March 31, 2004 from Rs. 440.52 billion at March 31, 2003.
Capital adequacy
(1) Deferred tax asset of Rs. 4.43 billion at March 31, 2004 and Rs. 4.88 billion at March 31, 2003 netted off as per RBI
guidelines.(2) Unamortised Early Retirement Option expense of Rs. 1.65 billion is deducted from Tier-I capital at March 31,2004(3) Includes general provisions of Rs. 3.82 billion in fiscal 2004 and Rs. 3.08 billion in fiscal 2003.
All amounts have been rounded off to the nearest Rs. 10.0 million.
52
dickenson intellinetics 5690 2791 ICICI Annual Report 2004
March 31, 2004
Rs. billion, except percentages
March 31, 2003
Amount Amount
% of Risk weighted
assets
% of Risk weighted
assets(1)(2)Tier I capital
58.07 7.05% 55.25 6.09%(3)Tier II capital
33.39 4.05% 37.76 4.27%
Total capital
91.46 11.10% 94.01 10.36%Risk-weighted assets
823.81 907.34
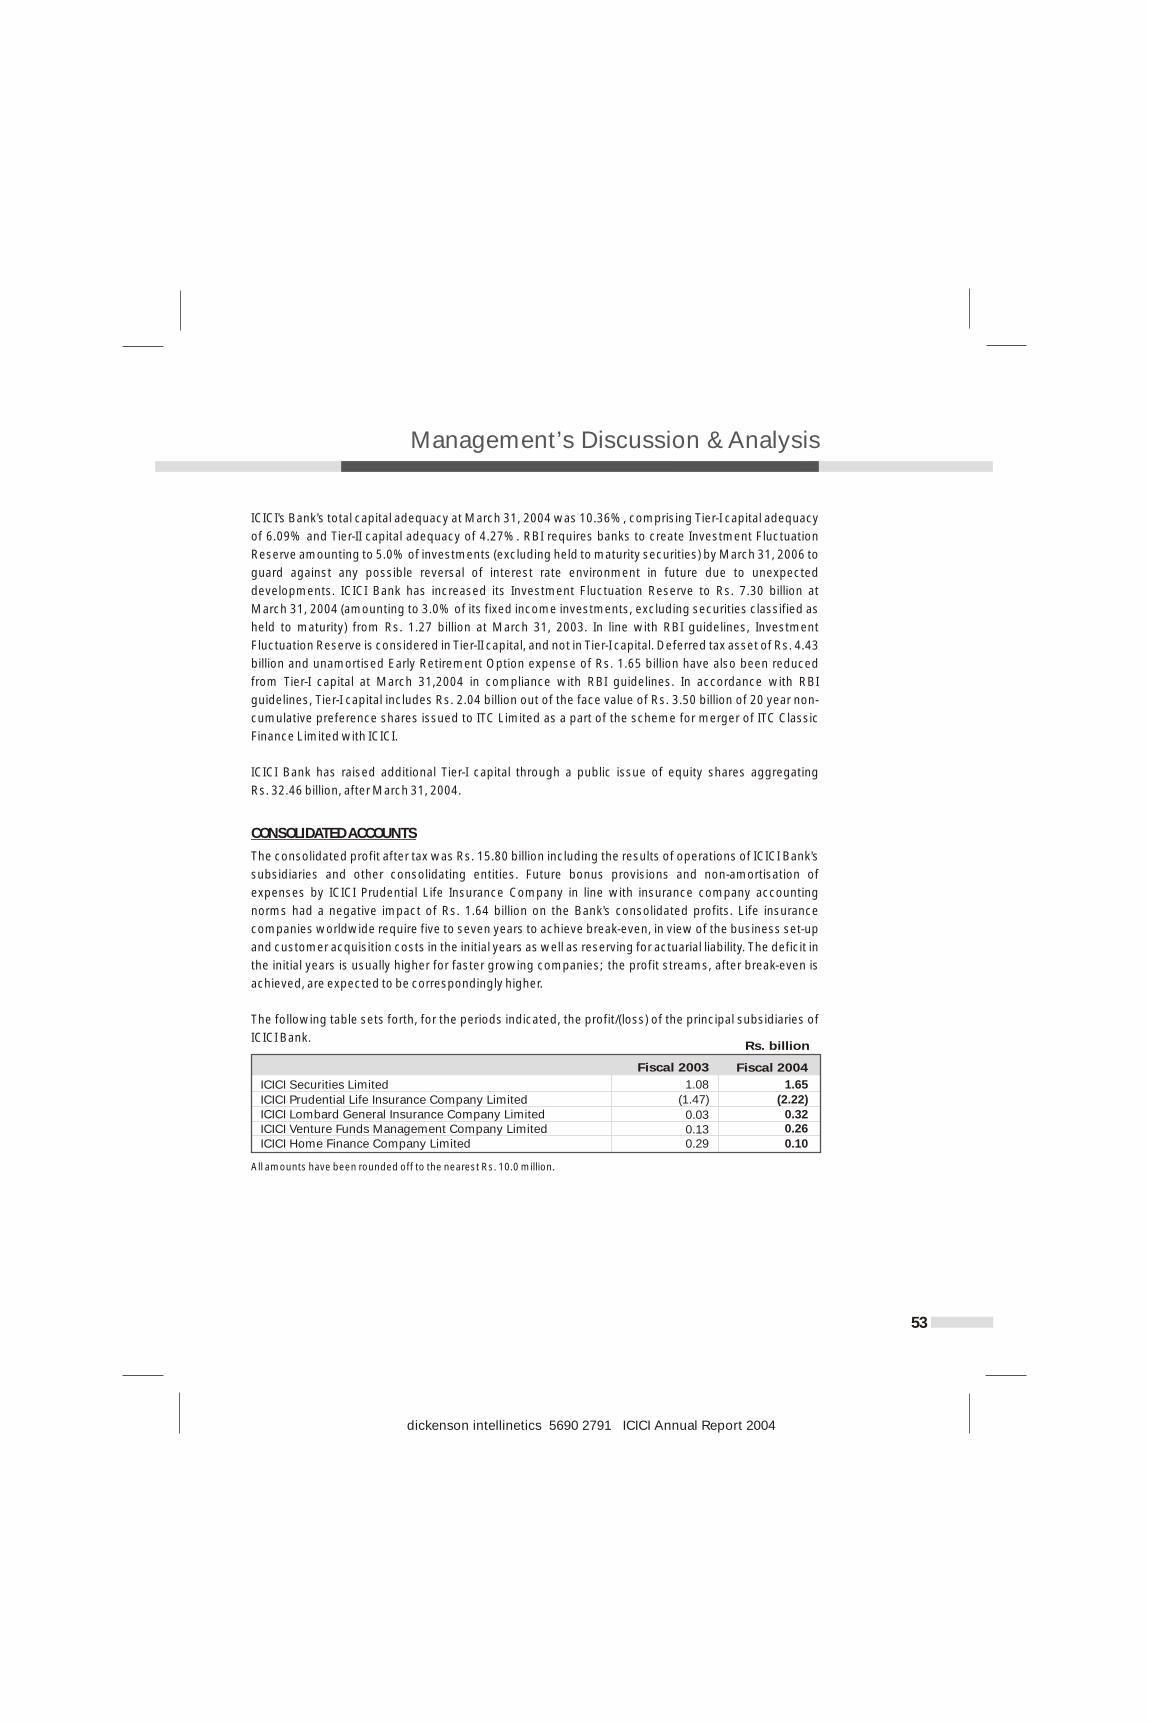
Management’s Discussion & Analysis
ICICI's Bank's total capital adequacy at March 31, 2004 was 10.36%, comprising Tier-I capital adequacy
of 6.09% and Tier-II capital adequacy of 4.27%. RBI requires banks to create Investment Fluctuation
Reserve amounting to 5.0% of investments (excluding held to maturity securities) by March 31, 2006 to
guard against any possible reversal of interest rate environment in future due to unexpected
developments. ICICI Bank has increased its Investment Fluctuation Reserve to Rs. 7.30 billion at
March 31, 2004 (amounting to 3.0% of its fixed income investments, excluding securities classified as
held to maturity) from Rs. 1.27 billion at March 31, 2003. In line with RBI guidelines, Investment
Fluctuation Reserve is considered in Tier-II capital, and not in Tier-I capital. Deferred tax asset of Rs. 4.43
billion and unamortised Early Retirement Option expense of Rs. 1.65 billion have also been reduced
from Tier-I capital at March 31,2004 in compliance with RBI guidelines. In accordance with RBI
guidelines, Tier-I capital includes Rs. 2.04 billion out of the face value of Rs. 3.50 billion of 20 year non-
cumulative preference shares issued to ITC Limited as a part of the scheme for merger of ITC Classic
Finance Limited with ICICI.
ICICI Bank has raised additional Tier-I capital through a public issue of equity shares aggregating
Rs. 32.46 billion, after March 31, 2004.
CONSOLIDATED ACCOUNTS
The consolidated profit after tax was Rs. 15.80 billion including the results of operations of ICICI Bank's
subsidiaries and other consolidating entities. Future bonus provisions and non-amortisation of
expenses by ICICI Prudential Life Insurance Company in line with insurance company accounting
norms had a negative impact of Rs. 1.64 billion on the Bank's consolidated profits. Life insurance
companies worldwide require five to seven years to achieve break-even, in view of the business set-up
and customer acquisition costs in the initial years as well as reserving for actuarial liability. The deficit in
the initial years is usually higher for faster growing companies; the profit streams, after break-even is
achieved, are expected to be correspondingly higher.
The following table sets forth, for the periods indicated, the profit/(loss) of the principal subsidiaries of
ICICI Bank.
All amounts have been rounded off to the nearest Rs. 10.0 million.
53
dickenson intellinetics 5690 2791 ICICI Annual Report 2004
Fiscal 2004
Rs. billion
Fiscal 2003
ICICI Securities Limited
ICICI Prudential Life Insurance Company LimitedICICI Lombard General Insurance Company LimitedICICI Venture Funds Management Company LimitedICICI Home Finance Company Limited
1.08 1.65
(1.47) (2.22) 0.03 0.32 0.13 0.26
0.29 0.10
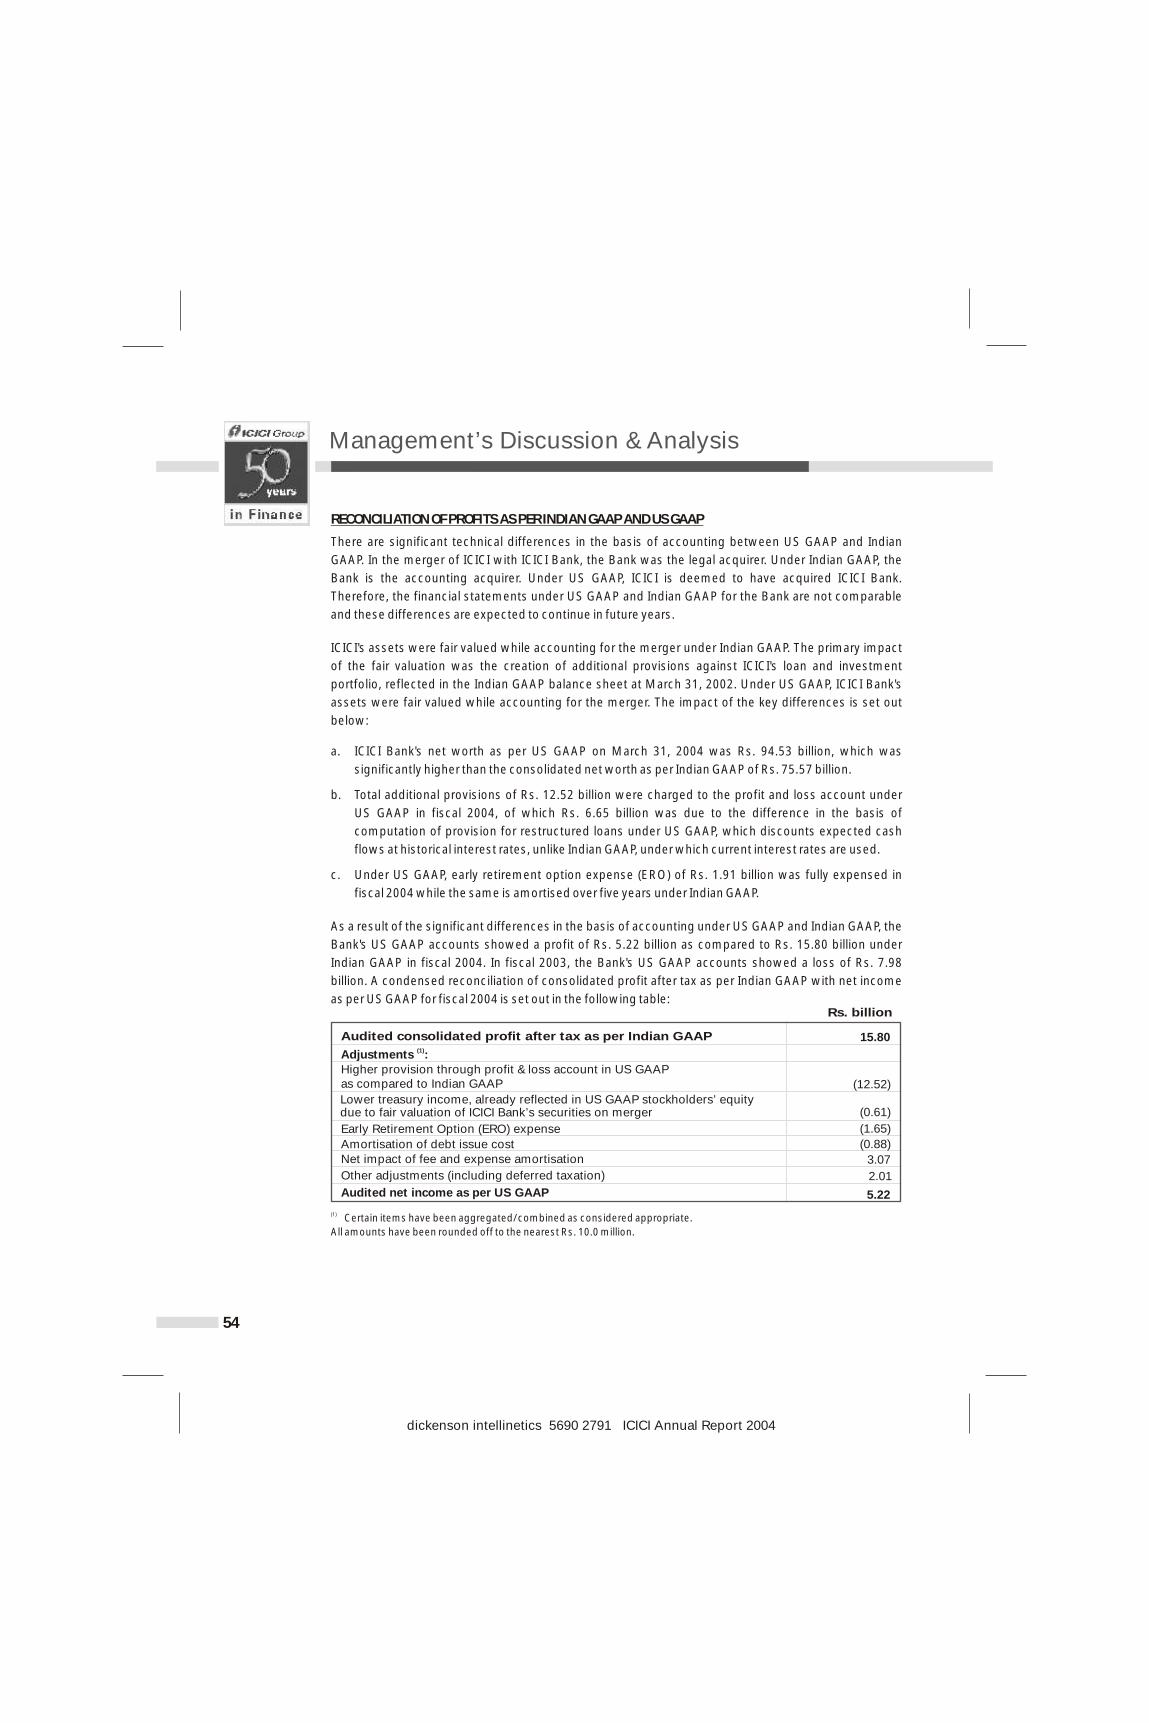
Management’s Discussion & Analysis
RECONCILIATION OF PROFITS AS PER INDIAN GAAP AND US GAAP
There are significant technical differences in the basis of accounting between US GAAP and Indian
GAAP. In the merger of ICICI with ICICI Bank, the Bank was the legal acquirer. Under Indian GAAP, the
Bank is the accounting acquirer. Under US GAAP, ICICI is deemed to have acquired ICICI Bank.
Therefore, the financial statements under US GAAP and Indian GAAP for the Bank are not comparable
and these differences are expected to continue in future years.
ICICI's assets were fair valued while accounting for the merger under Indian GAAP. The primary impact
of the fair valuation was the creation of additional provisions against ICICI's loan and investment
portfolio, reflected in the Indian GAAP balance sheet at March 31, 2002. Under US GAAP, ICICI Bank's
assets were fair valued while accounting for the merger. The impact of the key differences is set out
below:
a. ICICI Bank's net worth as per US GAAP on March 31, 2004 was Rs. 94.53 billion, which was
significantly higher than the consolidated net worth as per Indian GAAP of Rs. 75.57 billion.
b. Total additional provisions of Rs. 12.52 billion were charged to the profit and loss account under
US GAAP in fiscal 2004, of which Rs. 6.65 billion was due to the difference in the basis of
computation of provision for restructured loans under US GAAP, which discounts expected cash
flows at historical interest rates, unlike Indian GAAP, under which current interest rates are used.
c. Under US GAAP, early retirement option expense (ERO) of Rs. 1.91 billion was fully expensed in
fiscal 2004 while the same is amortised over five years under Indian GAAP.
As a result of the significant differences in the basis of accounting under US GAAP and Indian GAAP, the
Bank's US GAAP accounts showed a profit of Rs. 5.22 billion as compared to Rs. 15.80 billion under
Indian GAAP in fiscal 2004. In fiscal 2003, the Bank's US GAAP accounts showed a loss of Rs. 7.98
billion. A condensed reconciliation of consolidated profit after tax as per Indian GAAP with net income
as per US GAAP for fiscal 2004 is set out in the following table:
(1) Certain items have been aggregated/ combined as considered appropriate.
All amounts have been rounded off to the nearest Rs. 10.0 million.
54
dickenson intellinetics 5690 2791 ICICI Annual Report 2004
Audited consolidated profit after tax as per Indian GAAP
Rs. billion
(1)Adjustments : Higher provision through profit & loss account in US GAAP as compared to Indian GAAP (12.52)
15.80
(0.61)
Net impact of fee and expense amortisation
(1.65)
(0.88)
2.01
Early Retirement Option (ERO) expense
Amortisation of debt issue cost
3.07
Lower treasury income, already reflected in US GAAP stockholders’ equity due to fair valuation of ICICI Bank’s securities on merger
Other adjustments (including deferred taxation)
Audited net income as per US GAAP 5.22
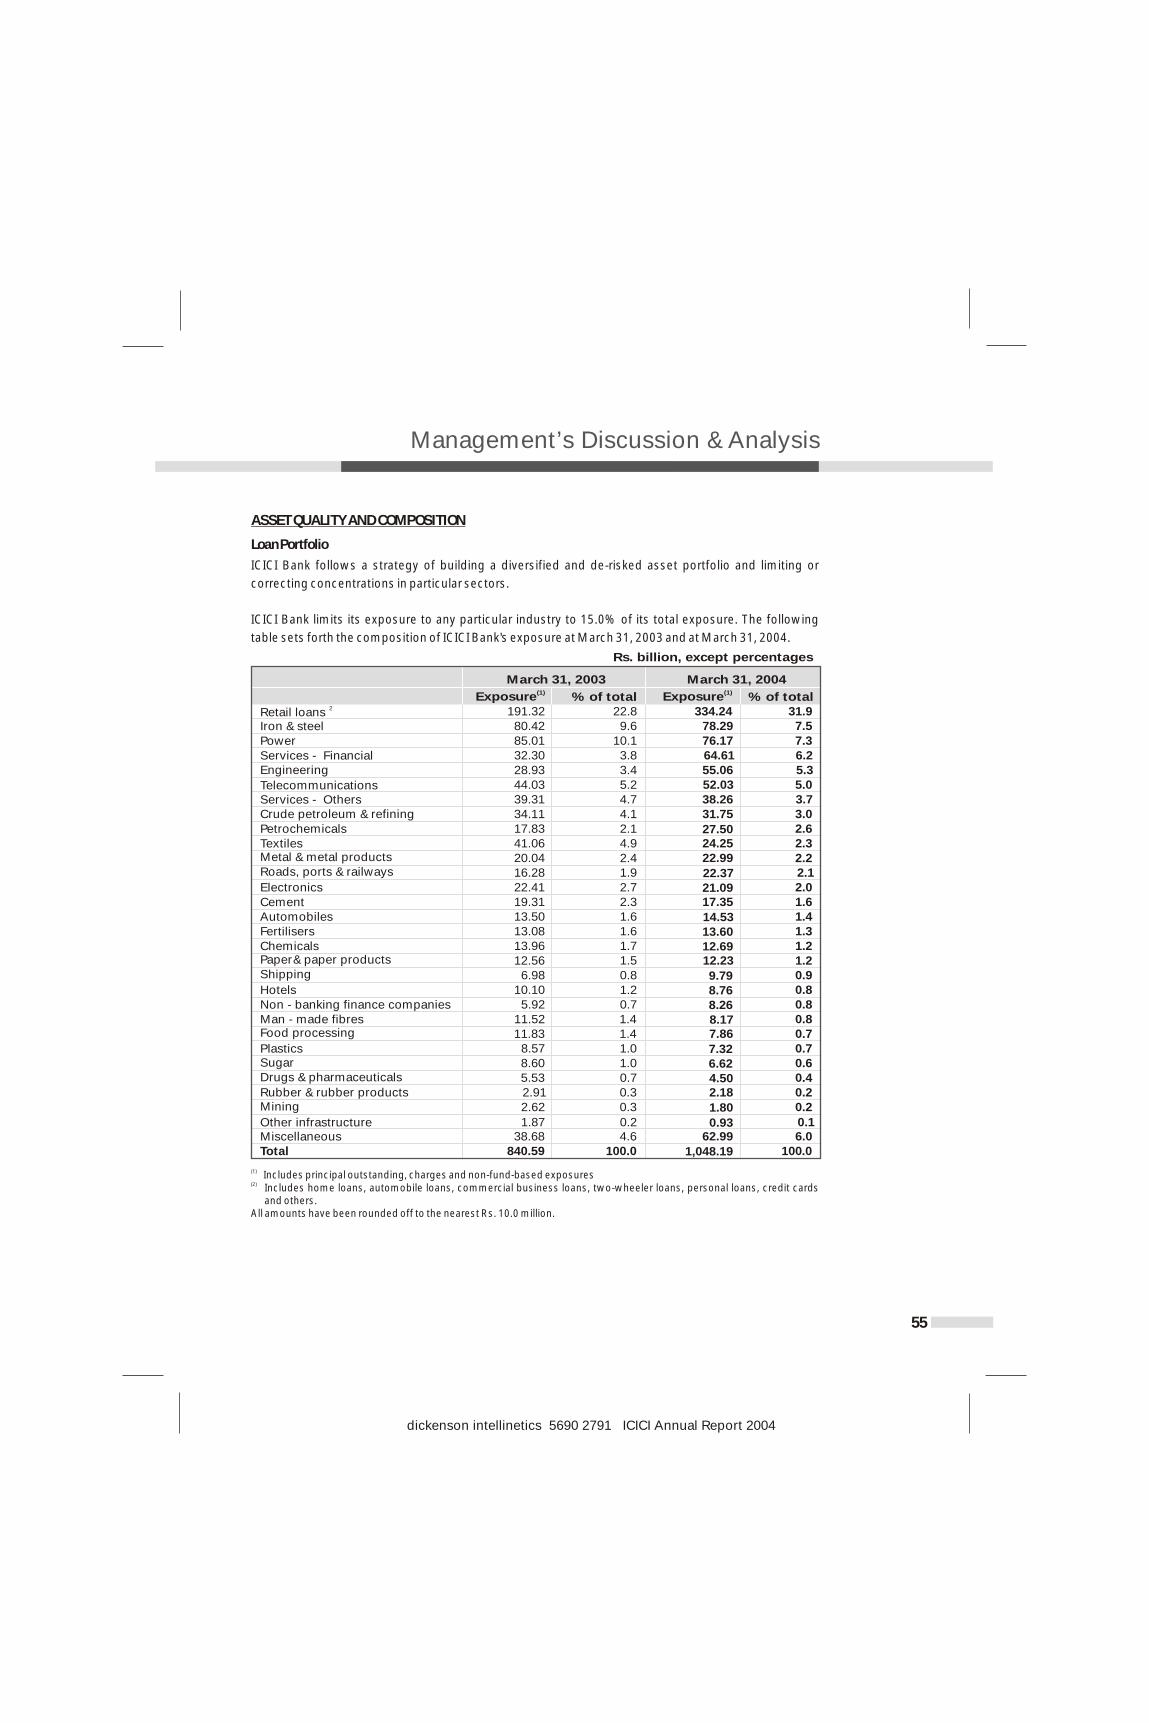
Management’s Discussion & Analysis
ASSET QUALITY AND COMPOSITION
Loan Portfolio
ICICI Bank follows a strategy of building a diversified and de-risked asset portfolio and limiting or
correcting concentrations in particular sectors.
ICICI Bank limits its exposure to any particular industry to 15.0% of its total exposure. The following
table sets forth the composition of ICICI Bank's exposure at March 31, 2003 and at March 31, 2004.
(1) Includes principal outstanding, charges and non-fund-based exposures (2) Includes home loans, automobile loans, commercial business loans, two-wheeler loans, personal loans, credit cards
and others.All amounts have been rounded off to the nearest Rs. 10.0 million.
55
dickenson intellinetics 5690 2791 ICICI Annual Report 2004
March 31, 2003
Rs. billion, except percentages
March 31, 2004
% of total(1)Exposure% of total
(1)Exposure2Retail loans
Iron & steelPowerServices - Financial Engineering
TelecommunicationsServices - OthersCrude petroleum & refiningPetrochemicalsTextilesMetal & metal productsRoads, ports & railways
ElectronicsCementAutomobilesFertilisersChemicalsPaper & paper productsShipping
HotelsNon - banking finance companiesMan - made fibresFood processing
PlasticsSugarDrugs & pharmaceuticals
Rubber & rubber productsMining
Other infrastructureMiscellaneousTotal
191.3280.4285.0132.3028.9344.0339.3134.1117.8341.0620.0416.2822.4119.3113.5013.0813.9612.56
6.9810.10
5.9211.5211.83
8.578.605.532.912.62
1.8738.68
840.59
22.89.6
10.13.83.45.24.74.12.14.92.41.92.72.31.61.61.71.50.81.20.71.41.41.01.00.70.30.3
0.24.6
100.0
334.2478.2976.1764.6155.0652.0338.2631.75
27.5024.2522.99
22.3721.0917.35
14.5313.6012.6912.23
9.798.768.268.177.86
7.326.624.502.18
1.80
0.9362.99
1,048.19
31.97.57.36.25.35.03.73.02.62.32.22.12.01.61.41.31.21.20.90.80.80.80.70.70.60.40.20.2
0.16.0
100.0
Management’s Discussion & Analysis
At March 31, 2004, the three largest industry exposures were iron & steel (7.5%), power (7.3%) and
financial services (6.2%).
As per applicable RBI guidelines, the exposure ceiling for a single borrower is 15.0% of total capital
funds and for a group of borrowers is 40.0% of total capital funds. However, in the case of financing for
infrastructure projects, the limit for a single borrower may be extended to 20.0% of total capital funds
and for a group may be extended to 50.0% of total capital funds. RBI has recently announced that banks
may, with the approval of their Boards, enhance the exposure to a borrower up to further 5.0% of total
capital funds, subject to certain disclosure requirements. Total capital funds comprise Tier-I and Tier-II
capital as defined for determining capital adequacy.
The largest borrower at March 31, 2004 accounted for approximately 2.2% of ICICI Bank's total
exposure and 24.9% of ICICI Bank's total capital funds. RBI had permitted the Bank to exceed the
exposure limit for this borrower. The largest borrower group at March 31, 2004 accounted for
approximately 4.6% of ICICI Bank's total exposure and 53.1% of ICICI Bank's total capital funds, which is
within the prescribed limit taking into account infrastructure financing. RBI had permitted the Bank to
exceed the exposure limit for this borrower group.
Directed lending
In its letter dated April 26, 2002 granting its approval for the merger, RBI had stipulated that since ICICI's
advances transferred to the Bank were not subject to the priority sector lending requirement, the Bank
was required to maintain priority sector lending of 50.0% of the Bank's net bank credit on the residual
portion of its advances (i.e. the portion of its total advances excluding advances of ICICI at year-end
fiscal 2002, henceforth referred to as residual net bank credit). This additional 10.0% priority sector
lending requirement will apply until such time the bank's aggregate priority sector advances reach a
level of 40.0% of its total net bank credit. RBI's existing instructions on sub-targets under priority sector
lending and eligibility of certain types of investments/ funds for qualification as priority sector advances
apply to the Bank.
At March 19, 2004, which was the last reporting Friday for the quarter-ended March 31, 2004, the Bank's
priority sector loans were Rs. 144.57 billion, constituting 79.5% of its residual net bank credit against
the requirement of 50.0%. Of the total priority sector loans, advances to the agricultural sector were
Rs. 42.06 billion (Previous year: Rs. 22.67 billion) which constituted 23.1% of the Bank's residual net
bank credit against the requirement of 18.0%.
Classification of loan assets
All loans are classified as per RBI guidelines into performing and non-performing assets. Under these
guidelines, effective year-end fiscal 2004, a term loan is classified as non-performing if any amount of
interest or principal remains overdue for more than 90 days (as against the period of 180 days stipulated
earlier). Similarly, an overdraft or cash credit facility is classified as non-performing if the account
remains out of order for a period of 90 days and a bill is classified as non-performing if the account
remains overdue for more than 90 days. Further, non-performing assets are classified into sub-standard,
doubtful and loss assets. The Bank had classified an asset as non-performing if any amount remained
overdue for more than 90 days, effective June 30, 2003.
56
dickenson intellinetics 5690 2791 ICICI Annual Report 2004
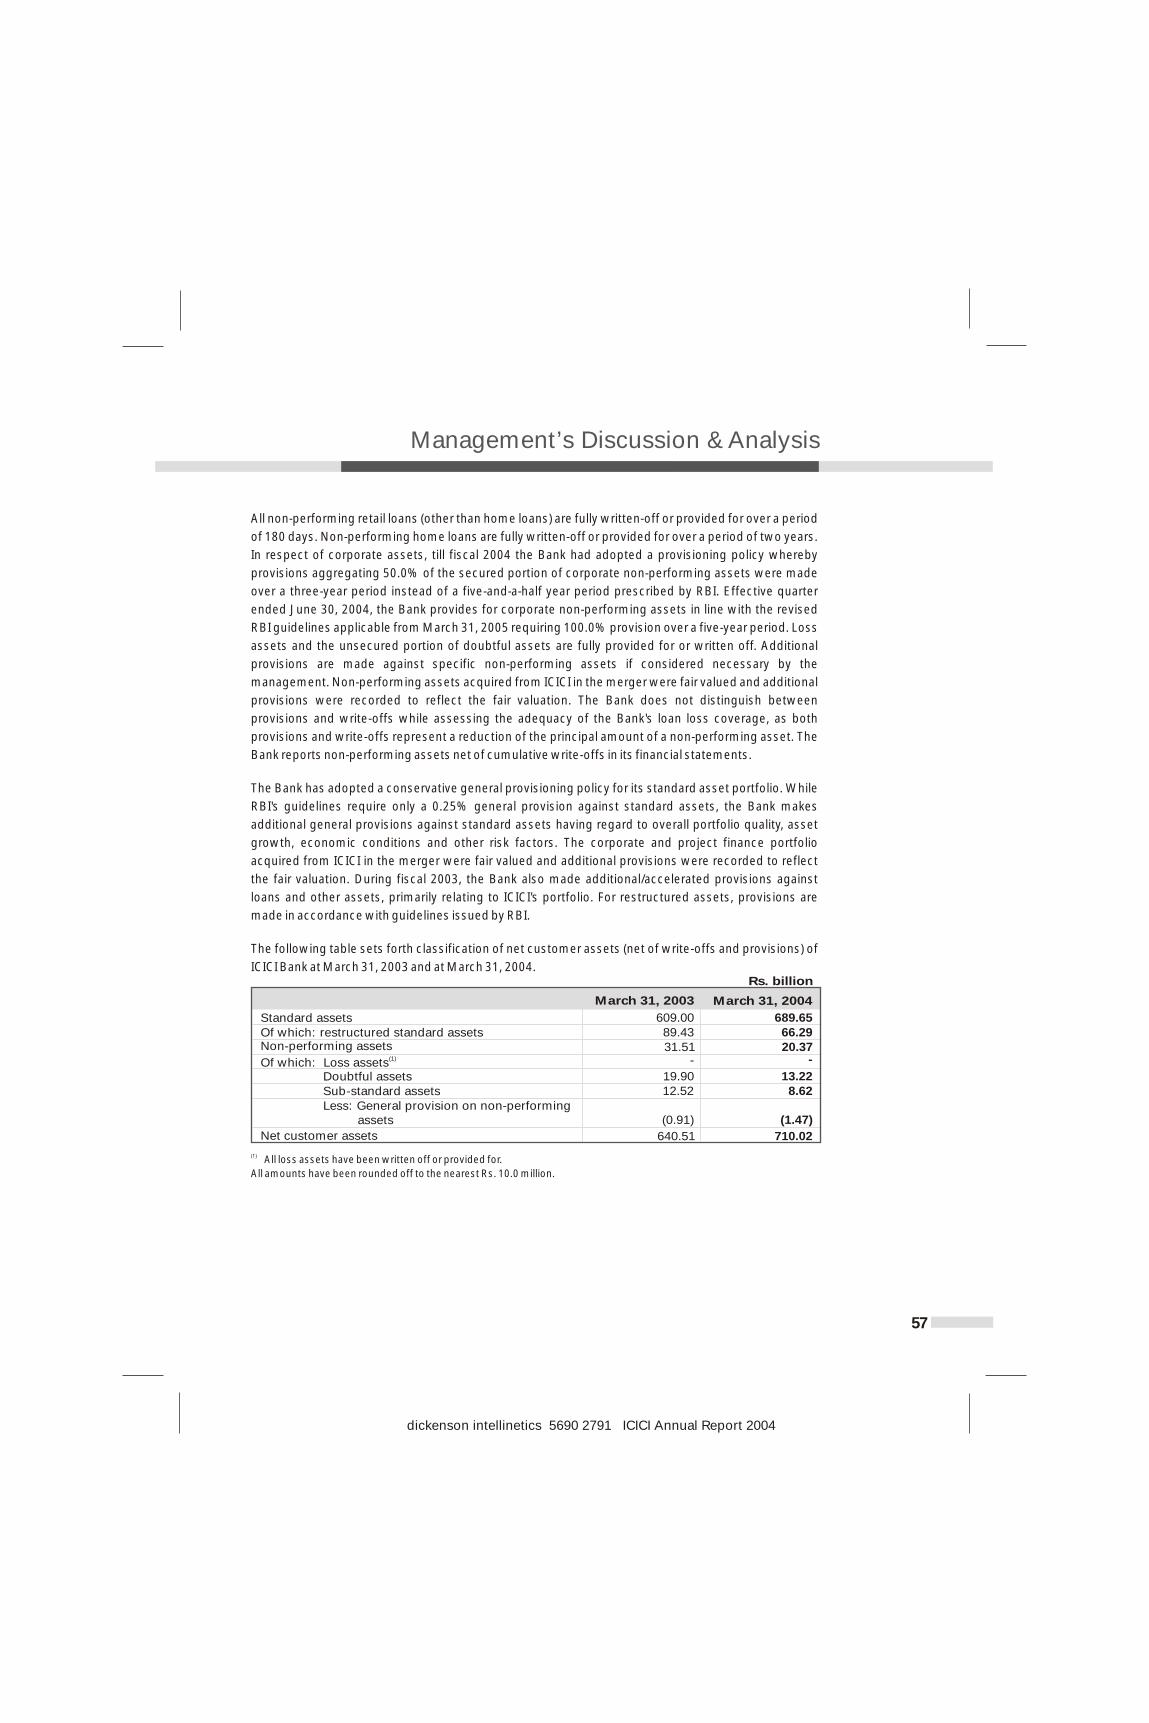
Management’s Discussion & Analysis
All non-performing retail loans (other than home loans) are fully written-off or provided for over a period
of 180 days. Non-performing home loans are fully written-off or provided for over a period of two years.
In respect of corporate assets, till fiscal 2004 the Bank had adopted a provisioning policy whereby
provisions aggregating 50.0% of the secured portion of corporate non-performing assets were made
over a three-year period instead of a five-and-a-half year period prescribed by RBI. Effective quarter
ended June 30, 2004, the Bank provides for corporate non-performing assets in line with the revised
RBI guidelines applicable from March 31, 2005 requiring 100.0% provision over a five-year period. Loss
assets and the unsecured portion of doubtful assets are fully provided for or written off. Additional
provisions are made against specific non-performing assets if considered necessary by the
management. Non-performing assets acquired from ICICI in the merger were fair valued and additional
provisions were recorded to reflect the fair valuation. The Bank does not distinguish between
provisions and write-offs while assessing the adequacy of the Bank's loan loss coverage, as both
provisions and write-offs represent a reduction of the principal amount of a non-performing asset. The
Bank reports non-performing assets net of cumulative write-offs in its financial statements.
The Bank has adopted a conservative general provisioning policy for its standard asset portfolio. While
RBI's guidelines require only a 0.25% general provision against standard assets, the Bank makes
additional general provisions against standard assets having regard to overall portfolio quality, asset
growth, economic conditions and other risk factors. The corporate and project finance portfolio
acquired from ICICI in the merger were fair valued and additional provisions were recorded to reflect
the fair valuation. During fiscal 2003, the Bank also made additional/accelerated provisions against
loans and other assets, primarily relating to ICICI's portfolio. For restructured assets, provisions are
made in accordance with guidelines issued by RBI.
The following table sets forth classification of net customer assets (net of write-offs and provisions) of
ICICI Bank at March 31, 2003 and at March 31, 2004.
(1) All loss assets have been written off or provided for.
All amounts have been rounded off to the nearest Rs. 10.0 million.
57
dickenson intellinetics 5690 2791 ICICI Annual Report 2004
March 31, 2004
Rs. billion
March 31, 2003
Standard assets 609.00 689.65Of which: restructured standard assets 89.43 66.29Non-performing assets 31.51 20.37
(1)Of which: Loss assets --
Doubtful assets 19.90 13.22Sub-standard assetsLess: General provision on non-performing assets
12.52 8.62
Net customer assets
(0.91)
640.51
(1.47)
710.02
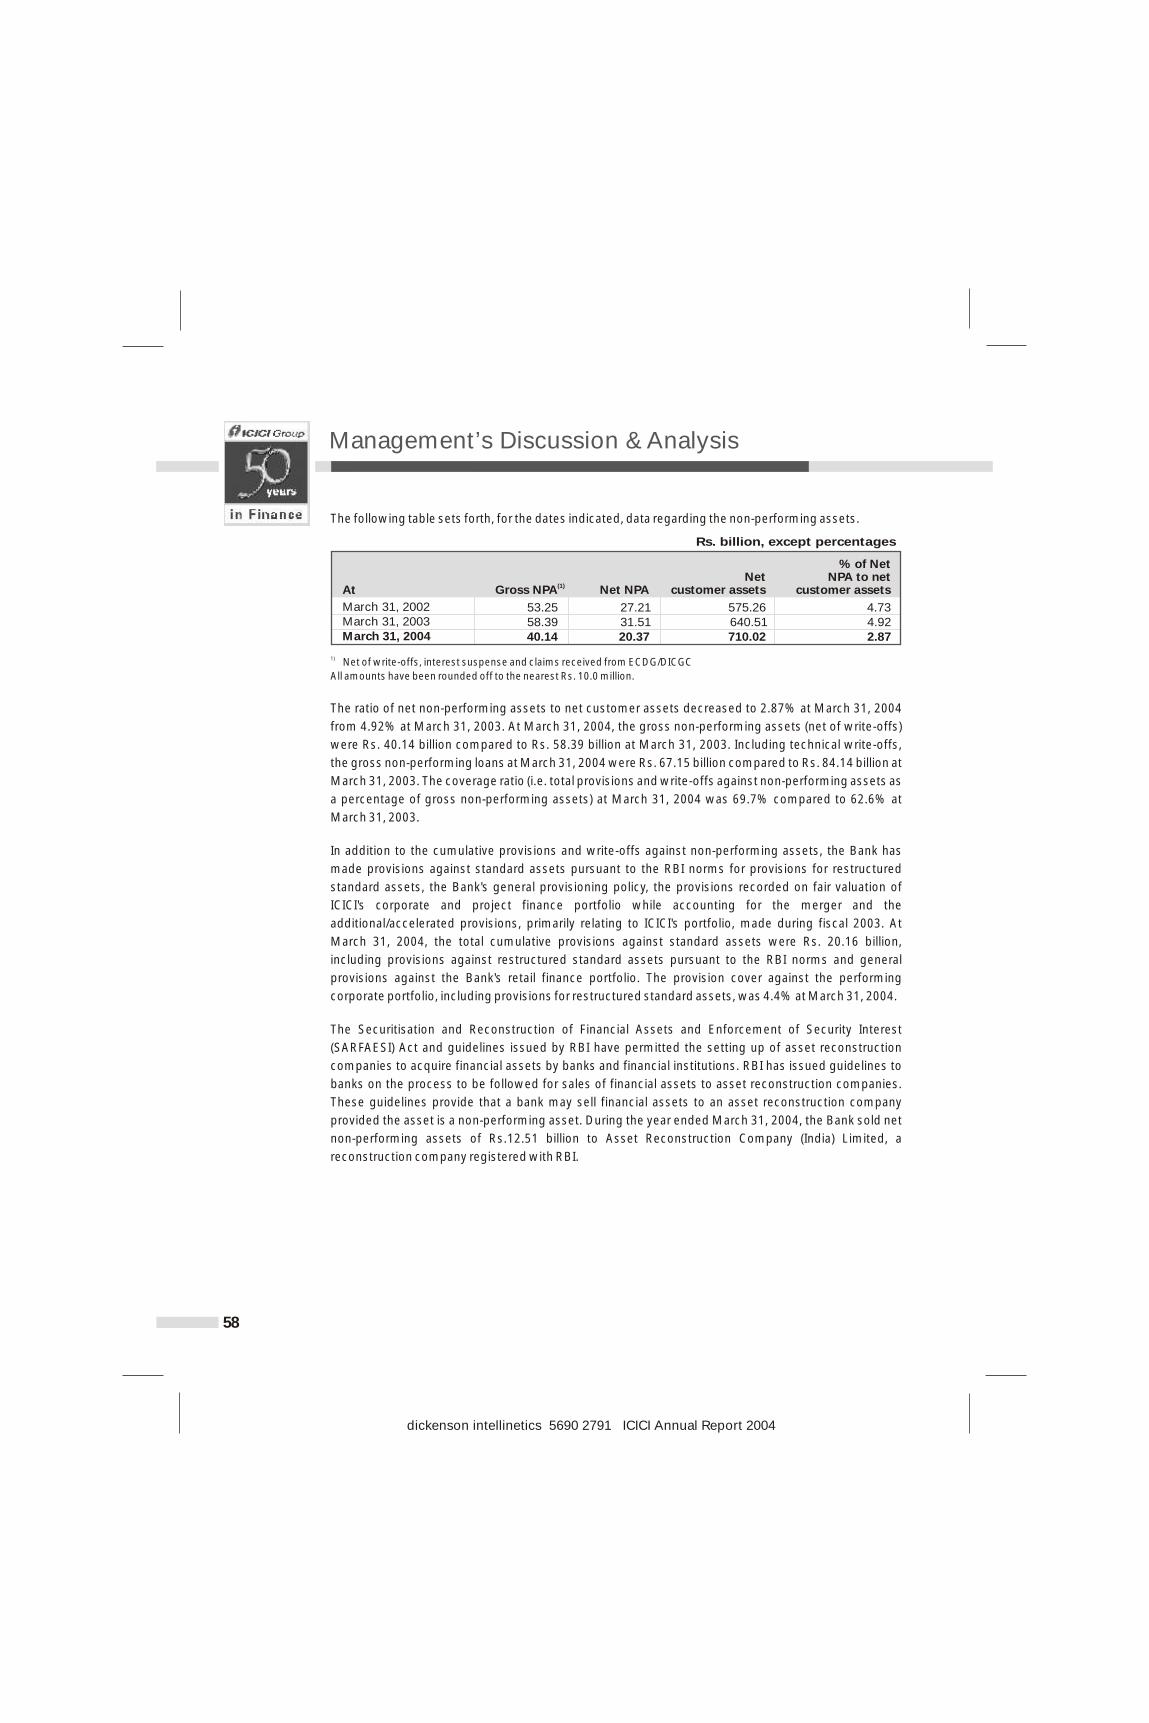
Management’s Discussion & Analysis
The following table sets forth, for the dates indicated, data regarding the non-performing assets.
1) Net of write-offs, interest suspense and claims received from ECDG/DICGC
All amounts have been rounded off to the nearest Rs. 10.0 million.
The ratio of net non-performing assets to net customer assets decreased to 2.87% at March 31, 2004
from 4.92% at March 31, 2003. At March 31, 2004, the gross non-performing assets (net of write-offs)
were Rs. 40.14 billion compared to Rs. 58.39 billion at March 31, 2003. Including technical write-offs,
the gross non-performing loans at March 31, 2004 were Rs. 67.15 billion compared to Rs. 84.14 billion at
March 31, 2003. The coverage ratio (i.e. total provisions and write-offs against non-performing assets as
a percentage of gross non-performing assets) at March 31, 2004 was 69.7% compared to 62.6% at
March 31, 2003.
In addition to the cumulative provisions and write-offs against non-performing assets, the Bank has
made provisions against standard assets pursuant to the RBI norms for provisions for restructured
standard assets, the Bank's general provisioning policy, the provisions recorded on fair valuation of
ICICI's corporate and project finance portfolio while accounting for the merger and the
additional/accelerated provisions, primarily relating to ICICI's portfolio, made during fiscal 2003. At
March 31, 2004, the total cumulative provisions against standard assets were Rs. 20.16 billion,
including provisions against restructured standard assets pursuant to the RBI norms and general
provisions against the Bank's retail finance portfolio. The provision cover against the performing
corporate portfolio, including provisions for restructured standard assets, was 4.4% at March 31, 2004.
The Securitisation and Reconstruction of Financial Assets and Enforcement of Security Interest
(SARFAESI) Act and guidelines issued by RBI have permitted the setting up of asset reconstruction
companies to acquire financial assets by banks and financial institutions. RBI has issued guidelines to
banks on the process to be followed for sales of financial assets to asset reconstruction companies.
These guidelines provide that a bank may sell financial assets to an asset reconstruction company
provided the asset is a non-performing asset. During the year ended March 31, 2004, the Bank sold net
non-performing assets of Rs.12.51 billion to Asset Reconstruction Company (India) Limited, a
reconstruction company registered with RBI.
58
dickenson intellinetics 5690 2791 ICICI Annual Report 2004
Rs. billion, except percentages
At(1)Gross NPA
Net NPA
Net customer assets
% of Net NPA to net
customer assets
March 31, 2002 53.25 27.21 575.26 4.73March 31, 2003 58.39 31.51 640.51 4.92March 31, 2004 40.14 20.37 710.02 2.87
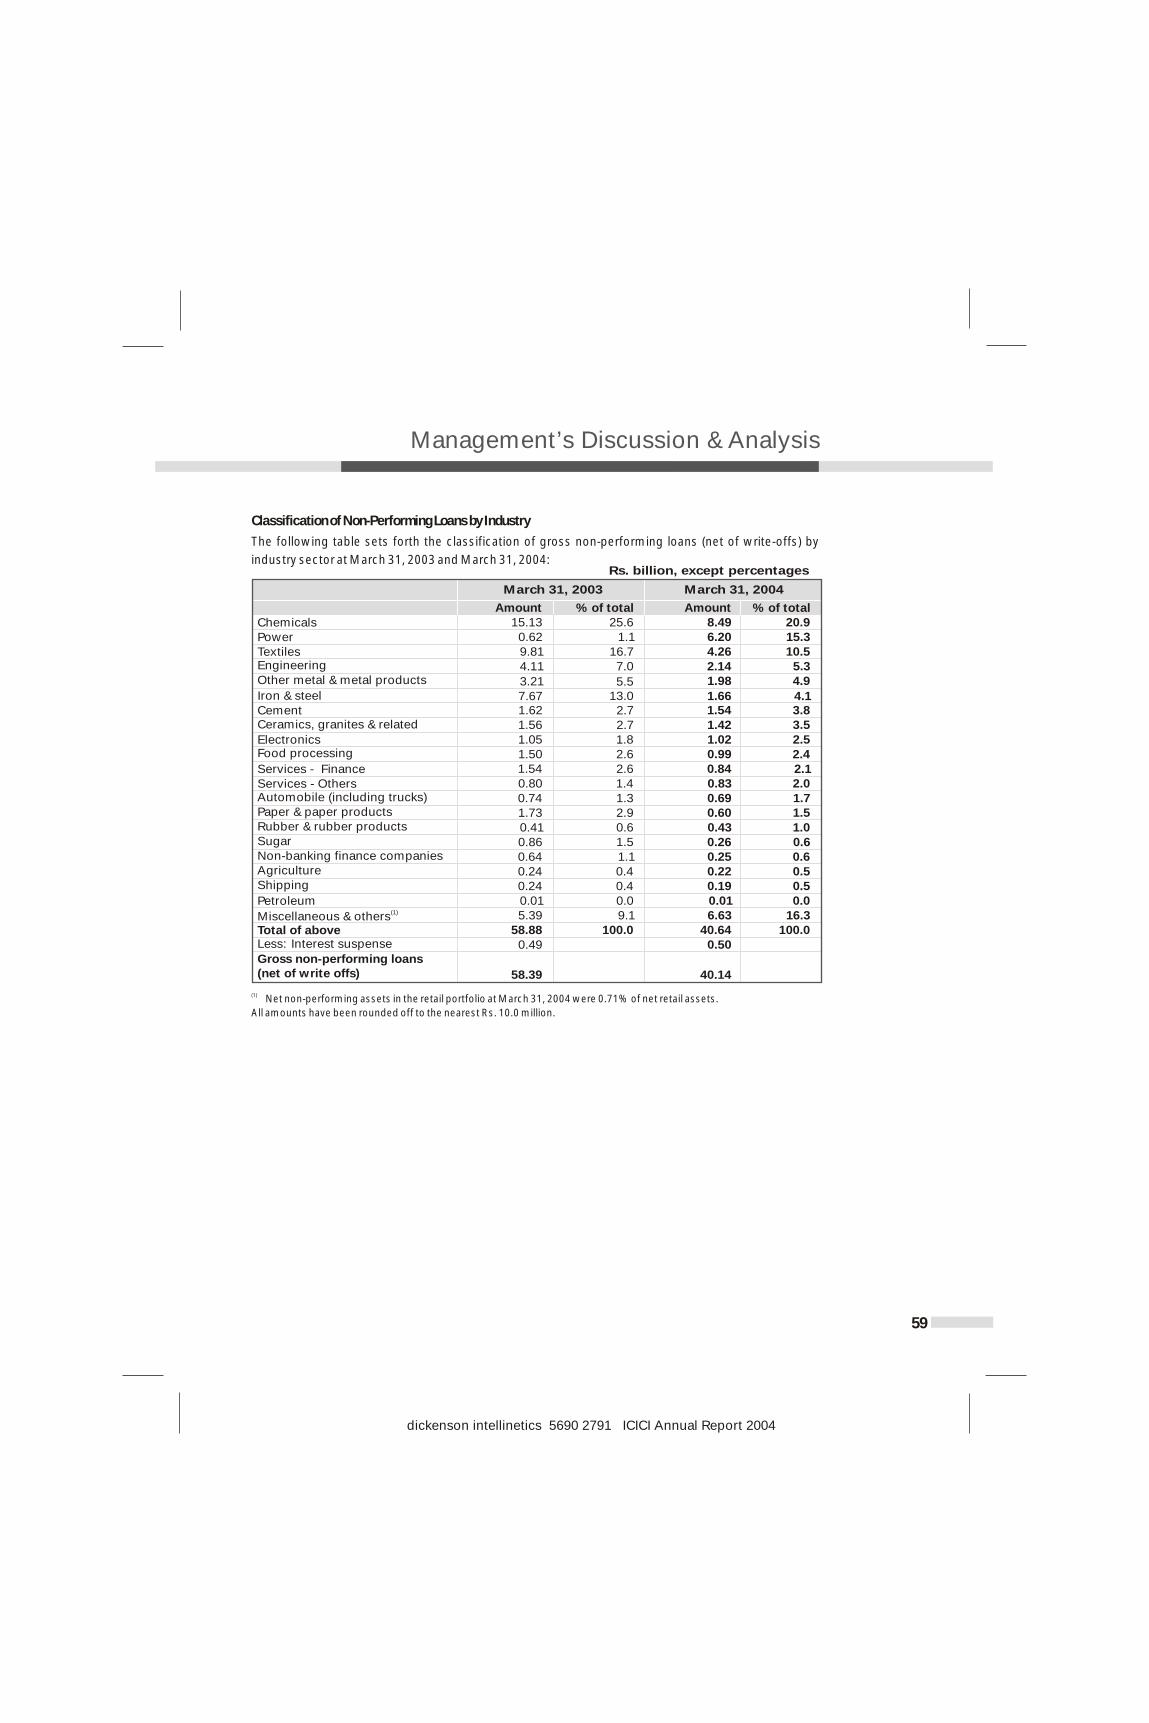
Management’s Discussion & Analysis
dickenson intellinetics 5690 2791 ICICI Annual Report 2004
Classification of Non-Performing Loans by Industry
The following table sets forth the classification of gross non-performing loans (net of write-offs) by
industry sector at March 31, 2003 and March 31, 2004:
(1) Net non-performing assets in the retail portfolio at March 31, 2004 were 0.71% of net retail assets.
All amounts have been rounded off to the nearest Rs. 10.0 million.
59
March 31, 2004
Rs. billion, except percentages
March 31, 2003
Amount Amount
% of total % of total
Services - Finance
Chemicals 15.13 25.6 8.49 20.9 Power 0.62 1.1 6.20 15.3 Textiles 9.81 16.7 4.26 10.5 Engineering 4.11 7.0 2.14 5.3 Other metal & metal products
7.67 13.0
1.98 4.9 Iron & steel
3.21 5.51.66 4.1
Cement 1.62 2.7 1.54 3.8 Ceramics, granites & related 1.56 2.7 1.42 3.5 Electronics 1.05 1.8 1.02 2.5 Food processing 1.50 2.6 0.99 2.4
1.54 2.6 0.84 2.1 Services - Others 0.80 1.4 0.83 2.0 Automobile (including trucks) 0.74 1.3 0.69 1.7 Paper & paper products 1.73 2.9 0.60 1.5 Rubber & rubber products 0.41 0.6 0.43 1.0 Sugar 0.86 1.5 0.26 0.6 Non-banking finance companies 0.64 1.1 0.25 0.6 Agriculture 0.24 0.4 0.22 0.5 Shipping 0.24 0.4 0.19 0.5 Petroleum 0.01 0.0 0.01 0.0
(1)Miscellaneous & others 5.39 9.1 6.63 16.3 Total of above 58.88 100.0 40.64 100.0 Less: Interest suspense 0.49 0.50Gross non-performing loans(net of write offs) 58.39 40.14
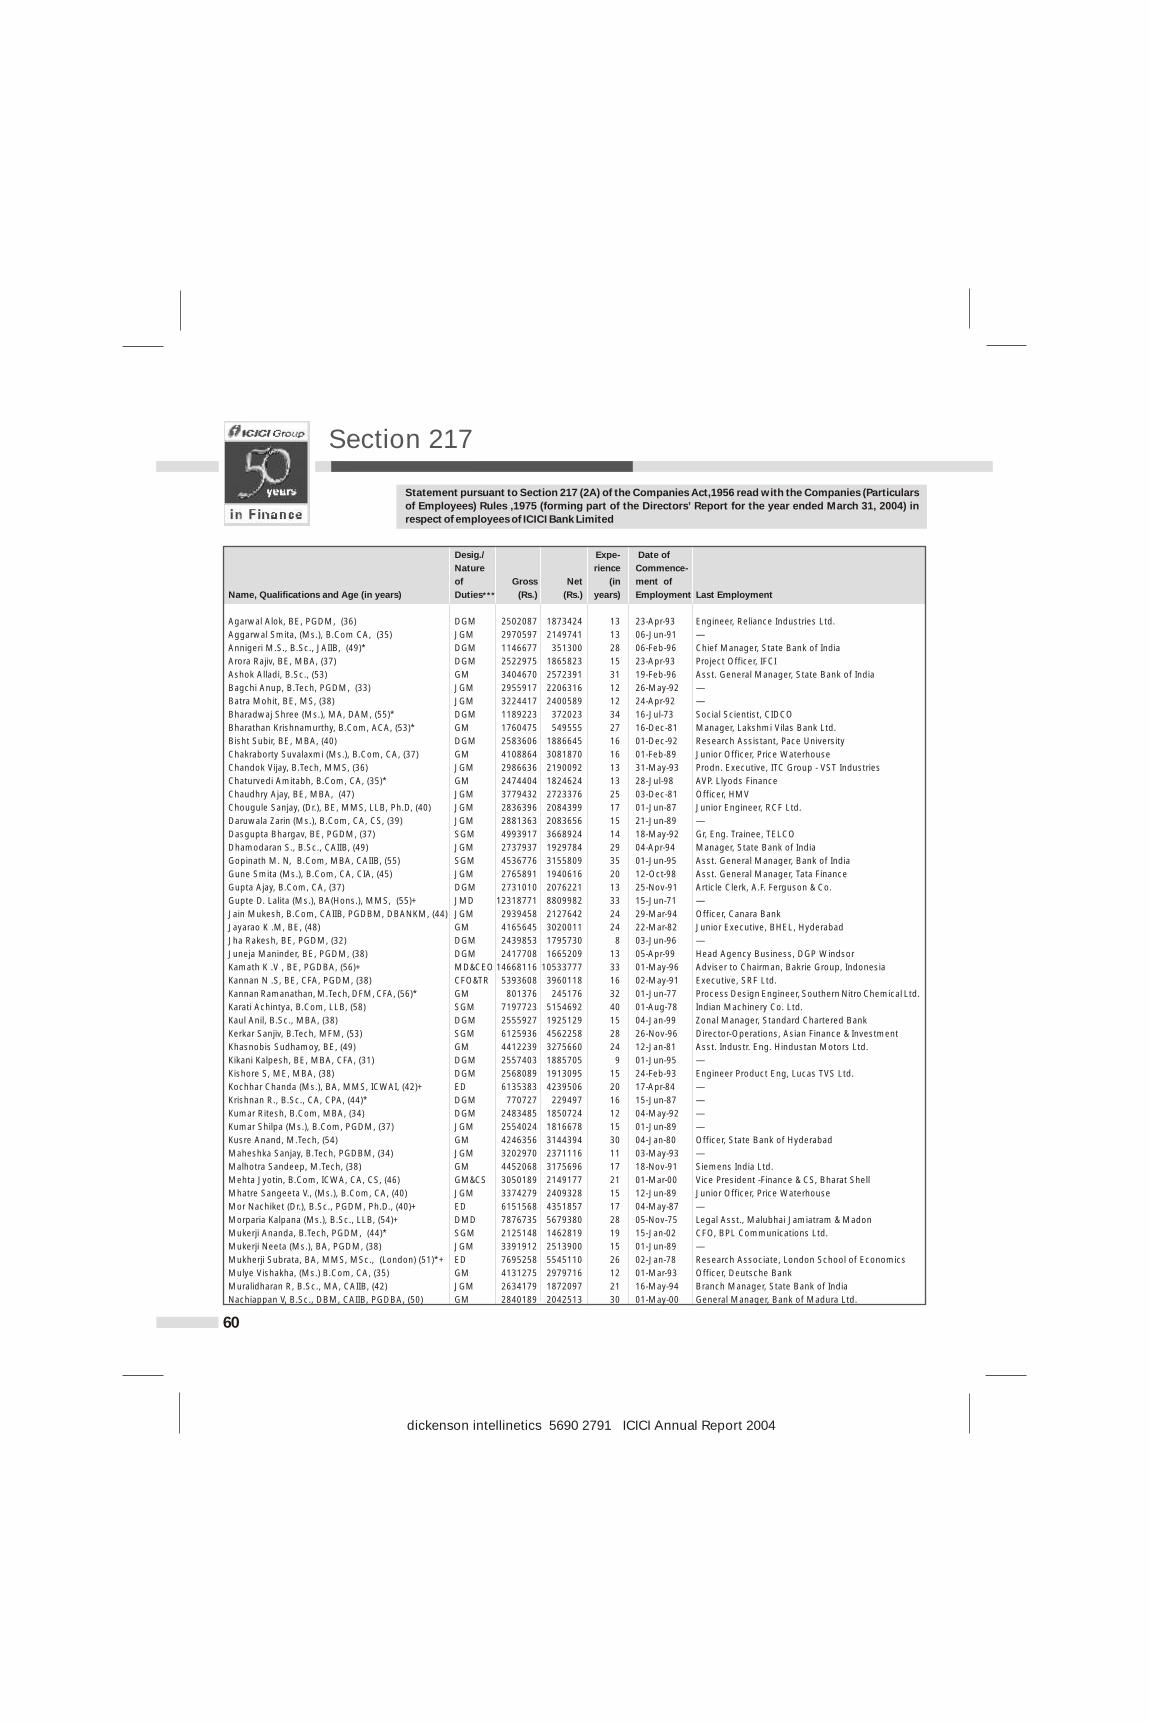
dickenson intellinetics 5690 2791 ICICI Annual Report 2004
Section 217
Statement pursuant to Section 217 (2A) of the Companies Act,1956 read with the Companies (Particulars of Employees) Rules ,1975 (forming part of the Directors’ Report for the year ended March 31, 2004) in respect of employees of ICICI Bank Limited
60
Desig./ Expe- Date of
Nature rience Commence-
of Gross Net (in ment of
Name, Qualifications and Age (in years) Duties*** (Rs.) (Rs.) years) Employment Last Employment
Agarwal Alok, BE, PGDM, (36) DGM 2502087 1873424 13 23-Apr-93 Engineer, Reliance Industries Ltd.
Aggarwal Smita, (Ms.), B.Com CA, (35) JGM 2970597 2149741 13 06-Jun-91 —
Annigeri M.S., B.Sc., JAIIB, (49)* DGM 1146677 351300 28 06-Feb-96 Chief Manager, State Bank of India
Arora Rajiv, BE, MBA, (37) DGM 2522975 1865823 15 23-Apr-93 Project Officer, IFCI
Ashok Alladi, B.Sc., (53) GM 3404670 2572391 31 19-Feb-96 Asst. General Manager, State Bank of India
Bagchi Anup, B.Tech, PGDM, (33) JGM 2955917 2206316 12 26-May-92 —
Batra Mohit, BE, MS, (38) JGM 3224417 2400589 12 24-Apr-92 —
Bharadwaj Shree (Ms.), MA, DAM, (55)* DGM 1189223 372023 34 16-Jul-73 Social Scientist, CIDCO
Bharathan Krishnamurthy, B.Com, ACA, (53)* GM 1760475 549555 27 16-Dec-81 Manager, Lakshmi Vilas Bank Ltd.
Bisht Subir, BE, MBA, (40) DGM 2583606 1886645 16 01-Dec-92 Research Assistant, Pace University
Chakraborty Suvalaxmi (Ms.), B.Com, CA, (37) GM 4108864 3081870 16 01-Feb-89 Junior Officer, Price Waterhouse
Chandok Vijay, B.Tech, MMS, (36) JGM 2986636 2190092 13 31-May-93 Prodn. Executive, ITC Group - VST Industries
Chaturvedi Amitabh, B.Com, CA, (35)* GM 2474404 1824624 13 28-Jul-98 AVP. Llyods Finance
Chaudhry Ajay, BE, MBA, (47) JGM 3779432 2723376 25 03-Dec-81 Officer, HMV
Chougule Sanjay, (Dr.), BE, MMS, LLB, Ph.D, (40) JGM 2836396 2084399 17 01-Jun-87 Junior Engineer, RCF Ltd.
Daruwala Zarin (Ms.), B.Com, CA, CS, (39) JGM 2881363 2083656 15 21-Jun-89 —
Dasgupta Bhargav, BE, PGDM, (37) SGM 4993917 3668924 14 18-May-92 Gr, Eng. Trainee, TELCO
Dhamodaran S., B.Sc., CAIIB, (49) JGM 2737937 1929784 29 04-Apr-94 Manager, State Bank of India
Gopinath M. N, B.Com, MBA, CAIIB, (55) SGM 4536776 3155809 35 01-Jun-95 Asst. General Manager, Bank of India
Gune Smita (Ms.), B.Com, CA, CIA, (45) JGM 2765891 1940616 20 12-Oct-98 Asst. General Manager, Tata Finance
Gupta Ajay, B.Com, CA, (37) DGM 2731010 2076221 13 25-Nov-91 Article Clerk, A.F. Ferguson & Co.
Gupte D. Lalita (Ms.), BA(Hons.), MMS, (55)+ JMD 12318771 8809982 33 15-Jun-71 —
Jain Mukesh, B.Com, CAIIB, PGDBM, DBANKM, (44) JGM 2939458 2127642 24 29-Mar-94 Officer, Canara Bank
Jayarao K .M, BE, (48) GM 4165645 3020011 24 22-Mar-82 Junior Executive, BHEL, Hyderabad
Jha Rakesh, BE, PGDM, (32) DGM 2439853 1795730 8 03-Jun-96 —
Juneja Maninder, BE, PGDM, (38) DGM 2417708 1665209 13 05-Apr-99 Head Agency Business, DGP Windsor
Kamath K .V , BE, PGDBA, (56)+ MD&CEO 14668116 10533777 33 01-May-96 Adviser to Chairman, Bakrie Group, Indonesia
Kannan N .S, BE, CFA, PGDM, (38) CFO&TR 5393608 3960118 16 02-May-91 Executive, SRF Ltd.
Kannan Ramanathan, M.Tech, DFM, CFA, (56)* GM 801376 245176 32 01-Jun-77 Process Design Engineer, Southern Nitro Chemical Ltd.
Karati Achintya, B.Com, LLB, (58) SGM 7197723 5154692 40 01-Aug-78 Indian Machinery Co. Ltd.
Kaul Anil, B.Sc., MBA, (38) DGM 2555927 1925129 15 04-Jan-99 Zonal Manager, Standard Chartered Bank
Kerkar Sanjiv, B.Tech, MFM, (53) SGM 6125936 4562258 28 26-Nov-96 Director-Operations, Asian Finance & Investment
Khasnobis Sudhamoy, BE, (49) GM 4412239 3275660 24 12-Jan-81 Asst. Industr. Eng. Hindustan Motors Ltd.
Kikani Kalpesh, BE, MBA, CFA, (31) DGM 2557403 1885705 9 01-Jun-95 —
Kishore S, ME, MBA, (38) DGM 2568089 1913095 15 24-Feb-93 Engineer Product Eng, Lucas TVS Ltd.
Kochhar Chanda (Ms.), BA, MMS, ICWAI, (42)+ ED 6135383 4239506 20 17-Apr-84 —
Krishnan R., B.Sc., CA, CPA, (44)* DGM 770727 229497 16 15-Jun-87 —
Kumar Ritesh, B.Com, MBA, (34) DGM 2483485 1850724 12 04-May-92 —
Kumar Shilpa (Ms.), B.Com, PGDM, (37) JGM 2554024 1816678 15 01-Jun-89 —
Kusre Anand, M.Tech, (54) GM 4246356 3144394 30 04-Jan-80 Officer, State Bank of Hyderabad
Maheshka Sanjay, B.Tech, PGDBM, (34) JGM 3202970 2371116 11 03-May-93 —
Malhotra Sandeep, M.Tech, (38) GM 4452068 3175696 17 18-Nov-91 Siemens India Ltd.
Mehta Jyotin, B.Com, ICWA, CA, CS, (46) GM&CS 3050189 2149177 21 01-Mar-00 Vice President -Finance & CS, Bharat Shell
Mhatre Sangeeta V., (Ms.), B.Com, CA, (40) JGM 3374279 2409328 15 12-Jun-89 Junior Officer, Price Waterhouse
Mor Nachiket (Dr.), B.Sc., PGDM, Ph.D., (40)+ ED 6151568 4351857 17 04-May-87 —
Morparia Kalpana (Ms.), B.Sc., LLB, (54)+ DMD 7876735 5679380 28 05-Nov-75 Legal Asst., Malubhai Jamiatram & Madon
Mukerji Ananda, B.Tech, PGDM, (44)* SGM 2125148 1462819 19 15-Jan-02 CFO, BPL Communications Ltd.
Mukerji Neeta (Ms.), BA, PGDM, (38) JGM 3391912 2513900 15 01-Jun-89 —
Mukherji Subrata, BA, MMS, MSc., (London) (51)*+ ED 7695258 5545110 26 02-Jan-78 Research Associate, London School of Economics
Mulye Vishakha, (Ms.) B.Com, CA, (35) GM 4131275 2979716 12 01-Mar-93 Officer, Deutsche Bank
Muralidharan R, B.Sc., MA, CAIIB, (42) JGM 2634179 1872097 21 16-May-94 Branch Manager, State Bank of India
Nachiappan V, B.Sc., DBM, CAIIB, PGDBA, (50) GM 2840189 2042513 30 01-May-00 General Manager, Bank of Madura Ltd.
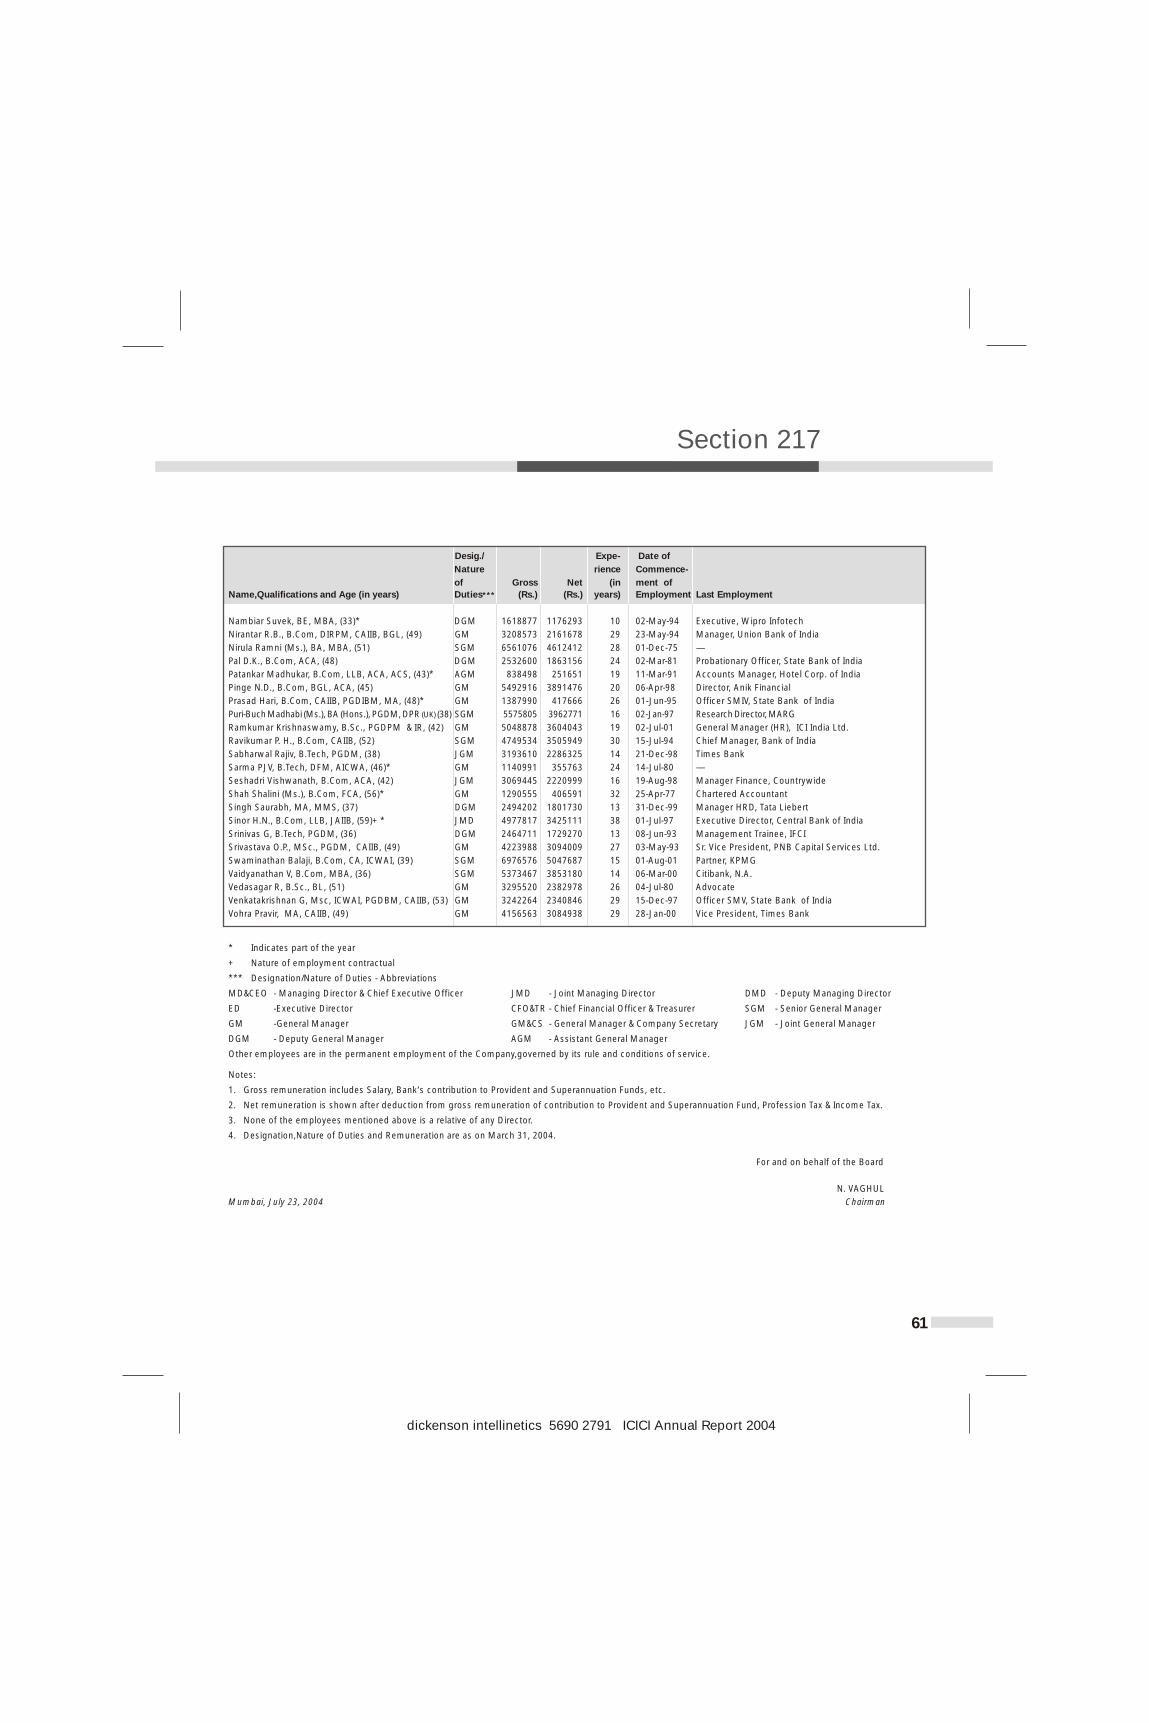
dickenson intellinetics 5690 2791 ICICI Annual Report 2004
Section 217
61
Desig./ Expe- Date of
Nature rience Commence-
of Gross Net (in ment of
Name,Qualifications and Age (in years) Duties*** (Rs.) (Rs.) years) Employment Last Employment
Nambiar Suvek, BE, MBA, (33)* DGM 1618877 1176293 10 02-May-94 Executive, Wipro Infotech
Nirantar R.B., B.Com, DIRPM, CAIIB, BGL, (49) GM 3208573 2161678 29 23-May-94 Manager, Union Bank of India
Nirula Ramni (Ms.), BA, MBA, (51) SGM 6561076 4612412 28 01-Dec-75 —
Pal D.K., B.Com, ACA, (48) DGM 2532600 1863156 24 02-Mar-81 Probationary Officer, State Bank of India
Patankar Madhukar, B.Com, LLB, ACA, ACS, (43)* AGM 838498 251651 19 11-Mar-91 Accounts Manager, Hotel Corp. of India
Pinge N.D., B.Com, BGL, ACA, (45) GM 5492916 3891476 20 06-Apr-98 Director, Anik Financial
Prasad Hari, B.Com, CAIIB, PGDIBM, MA, (48)* GM 1387990 417666 26 01-Jun-95 Officer SMIV, State Bank of India
Puri-Buch Madhabi (Ms.), BA (Hons.), PGDM, DPR (UK) (38) SGM 5575805 3962771 16 02-Jan-97 Research Director, MARG
Ramkumar Krishnaswamy, B.Sc., PGDPM & IR, (42) GM 5048878 3604043 19 02-Jul-01 General Manager (HR), ICI India Ltd.
Ravikumar P. H., B.Com, CAIIB, (52) SGM 4749534 3505949 30 15-Jul-94 Chief Manager, Bank of India
Sabharwal Rajiv, B.Tech, PGDM, (38) JGM 3193610 2286325 14 21-Dec-98 Times Bank
Sarma PJV, B.Tech, DFM, AICWA, (46)* GM 1140991 355763 24 14-Jul-80 —
Seshadri Vishwanath, B.Com, ACA, (42) JGM 3069445 2220999 16 19-Aug-98 Manager Finance, Countrywide
Shah Shalini (Ms.), B.Com, FCA, (56)* GM 1290555 406591 32 25-Apr-77 Chartered Accountant
Singh Saurabh, MA, MMS, (37) DGM 2494202 1801730 13 31-Dec-99 Manager HRD, Tata Liebert
Sinor H.N., B.Com, LLB, JAIIB, (59)+* JMD 4977817 3425111 38 01-Jul-97 Executive Director, Central Bank of India
Srinivas G, B.Tech, PGDM, (36) DGM 2464711 1729270 13 08-Jun-93 Management Trainee, IFCI
Srivastava O.P., MSc., PGDM, CAIIB, (49) GM 4223988 3094009 27 03-May-93 Sr. Vice President, PNB Capital Services Ltd.
Swaminathan Balaji, B.Com, CA, ICWAI, (39) SGM 6976576 5047687 15 01-Aug-01 Partner, KPMG
Vaidyanathan V, B.Com, MBA, (36) SGM 5373467 3853180 14 06-Mar-00 Citibank, N.A.
Vedasagar R, B.Sc., BL, (51) GM 3295520 2382978 26 04-Jul-80 Advocate
Venkatakrishnan G, Msc, ICWAI, PGDBM, CAIIB, (53) GM 3242264 2340846 29 15-Dec-97 Officer SMV, State Bank of India
Vohra Pravir, MA, CAIIB, (49) GM 4156563 3084938 29 28-Jan-00 Vice President, Times Bank
* Indicates part of the year
+ Nature of employment contractual
*** Designation/Nature of Duties - Abbreviations
MD&CEO - Managing Director & Chief Executive Officer JMD - Joint Managing Director DMD - Deputy Managing Director
ED -Executive Director CFO&TR - Chief Financial Officer & Treasurer SGM - Senior General Manager
GM -General Manager GM&CS - General Manager & Company Secretary JGM - Joint General Manager
DGM - Deputy General Manager AGM - Assistant General Manager
Other employees are in the permanent employment of the Company,governed by its rule and conditions of service.
Notes:
1. Gross remuneration includes Salary, Bank’s contribution to Provident and Superannuation Funds, etc.
2. Net remuneration is shown after deduction from gross remuneration of contribution to Provident and Superannuation Fund, Profession Tax & Income Tax.
3. None of the employees mentioned above is a relative of any Director.
4. Designation,Nature of Duties and Remuneration are as on March 31, 2004.
For and on behalf of the Board
N. VAGHUL
Mumbai, July 23, 2004 Chairman

financials
dickenson intellinetics 5690 2791 ICICI Annual Report 2004
62
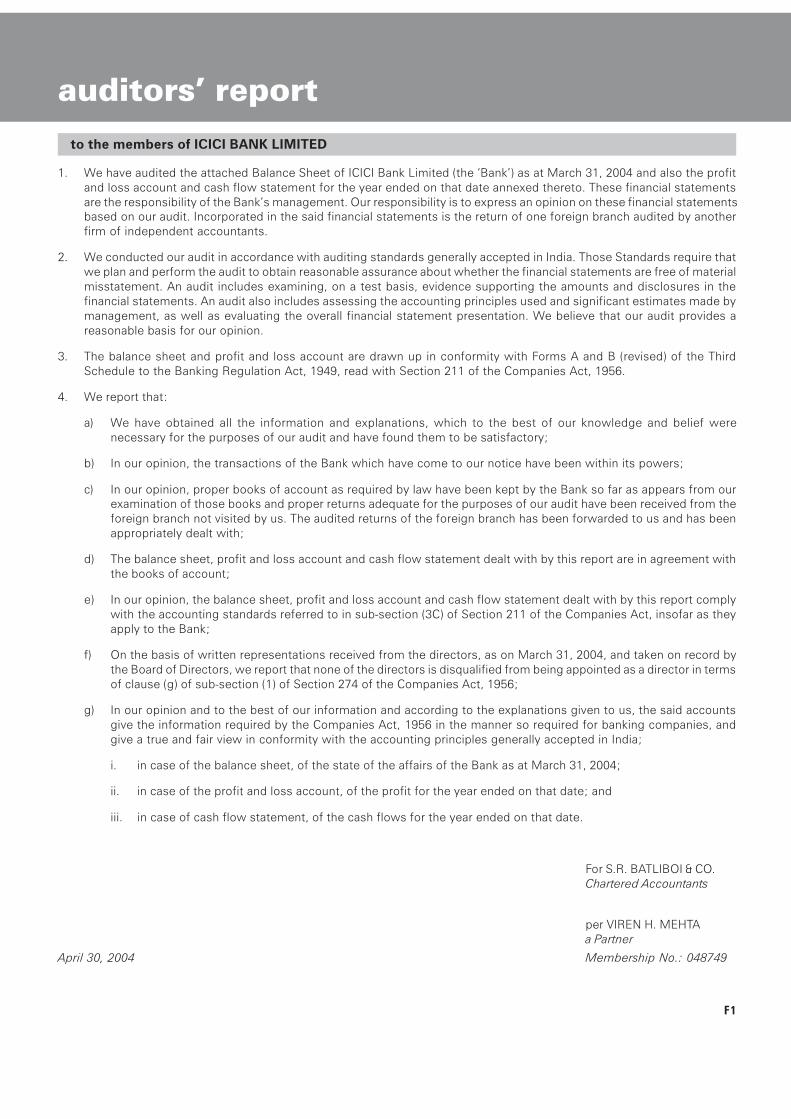
F1
auditors� reportto the members of ICICI BANK LIMITED
1. We have audited the attached Balance Sheet of ICICI Bank Limited (the �Bank�) as at March 31, 2004 and also the profitand loss account and cash flow statement for the year ended on that date annexed thereto. These financial statementsare the responsibility of the Bank�s management. Our responsibility is to express an opinion on these financial statementsbased on our audit. Incorporated in the said financial statements is the return of one foreign branch audited by anotherfirm of independent accountants.
2. We conducted our audit in accordance with auditing standards generally accepted in India. Those Standards require thatwe plan and perform the audit to obtain reasonable assurance about whether the financial statements are free of materialmisstatement. An audit includes examining, on a test basis, evidence supporting the amounts and disclosures in thefinancial statements. An audit also includes assessing the accounting principles used and significant estimates made bymanagement, as well as evaluating the overall financial statement presentation. We believe that our audit provides areasonable basis for our opinion.
3. The balance sheet and profit and loss account are drawn up in conformity with Forms A and B (revised) of the ThirdSchedule to the Banking Regulation Act, 1949, read with Section 211 of the Companies Act, 1956.
4. We report that:
a) We have obtained all the information and explanations, which to the best of our knowledge and belief werenecessary for the purposes of our audit and have found them to be satisfactory;
b) In our opinion, the transactions of the Bank which have come to our notice have been within its powers;
c) In our opinion, proper books of account as required by law have been kept by the Bank so far as appears from ourexamination of those books and proper returns adequate for the purposes of our audit have been received from theforeign branch not visited by us. The audited returns of the foreign branch has been forwarded to us and has beenappropriately dealt with;
d) The balance sheet, profit and loss account and cash flow statement dealt with by this report are in agreement withthe books of account;
e) In our opinion, the balance sheet, profit and loss account and cash flow statement dealt with by this report complywith the accounting standards referred to in sub-section (3C) of Section 211 of the Companies Act, insofar as theyapply to the Bank;
f) On the basis of written representations received from the directors, as on March 31, 2004, and taken on record bythe Board of Directors, we report that none of the directors is disqualified from being appointed as a director in termsof clause (g) of sub-section (1) of Section 274 of the Companies Act, 1956;
g) In our opinion and to the best of our information and according to the explanations given to us, the said accountsgive the information required by the Companies Act, 1956 in the manner so required for banking companies, andgive a true and fair view in conformity with the accounting principles generally accepted in India;
i. in case of the balance sheet, of the state of the affairs of the Bank as at March 31, 2004;
ii. in case of the profit and loss account, of the profit for the year ended on that date; and
iii. in case of cash flow statement, of the cash flows for the year ended on that date.
For S.R. BATLIBOI & CO.Chartered Accountants
per VIREN H. MEHTAa Partner
April 30, 2004 Membership No.: 048749
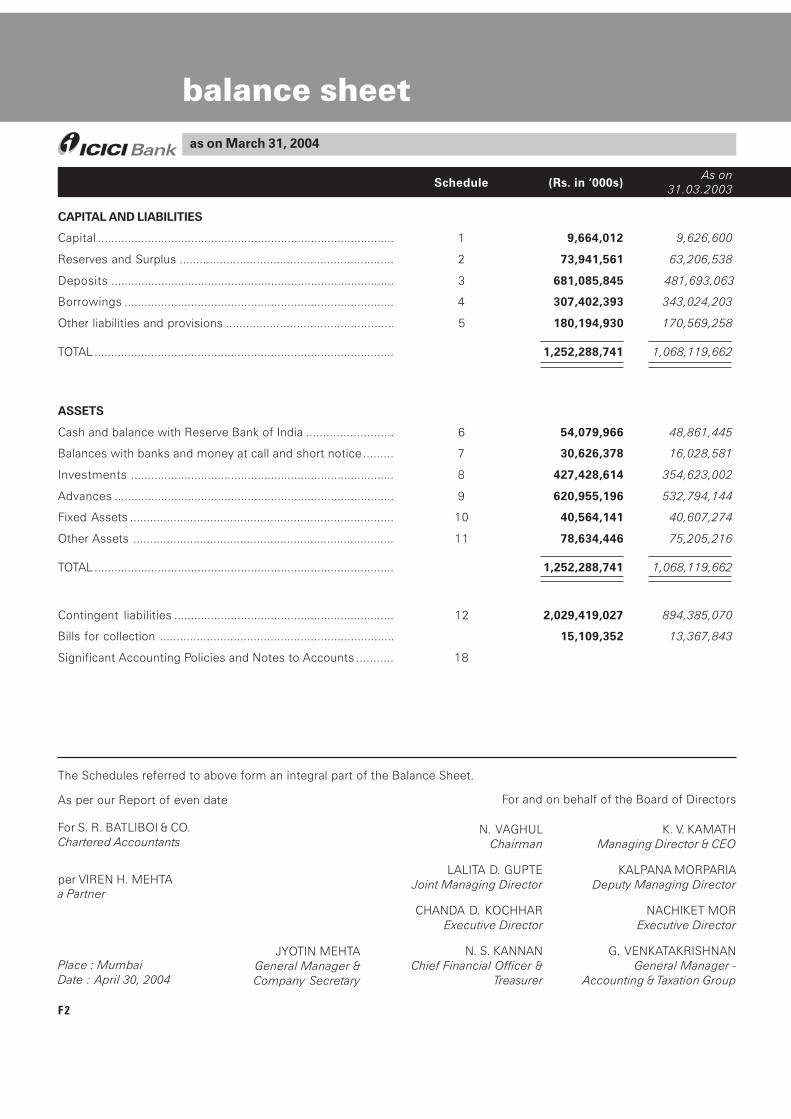
F2
balance sheet
As onSchedule (Rs. in �000s) 31.03.2003
CAPITAL AND LIABILITIES
Capital ......................................................................................... 1 9,664,012 9,626,600
Reserves and Surplus ................................................................ 2 73,941,561 63,206,538
Deposits ..................................................................................... 3 681,085,845 481,693,063
Borrowings ................................................................................. 4 307,402,393 343,024,203
Other liabilities and provisions .................................................. 5 180,194,930 170,569,258
TOTAL .......................................................................................... 1,252,288,741 1,068,119,662
ASSETS
Cash and balance with Reserve Bank of India .......................... 6 54,079,966 48,861,445
Balances with banks and money at call and short notice ......... 7 30,626,378 16,028,581
Investments ............................................................................... 8 427,428,614 354,623,002
Advances .................................................................................... 9 620,955,196 532,794,144
Fixed Assets ............................................................................... 10 40,564,141 40,607,274
Other Assets .............................................................................. 11 78,634,446 75,205,216
TOTAL .......................................................................................... 1,252,288,741 1,068,119,662
Contingent liabilities .................................................................. 12 2,029,419,027 894,385,070
Bills for collection ...................................................................... 15,109,352 13,367,843
Significant Accounting Policies and Notes to Accounts ........... 18
N. VAGHULChairman
LALITA D. GUPTEJoint Managing Director
CHANDA D. KOCHHAR Executive Director
N. S. KANNANChief Financial Officer &
Treasurer
K. V. KAMATHManaging Director & CEO
KALPANA MORPARIADeputy Managing Director
NACHIKET MOR Executive Director
G. VENKATAKRISHNANGeneral Manager -
Accounting & Taxation Group
JYOTIN MEHTA General Manager &Company Secretary
For S. R. BATLIBOI & CO.Chartered Accountants
per VIREN H. MEHTAa Partner
Place : MumbaiDate : April 30, 2004
As per our Report of even date For and on behalf of the Board of Directors
The Schedules referred to above form an integral part of the Balance Sheet.
as on March 31, 2004
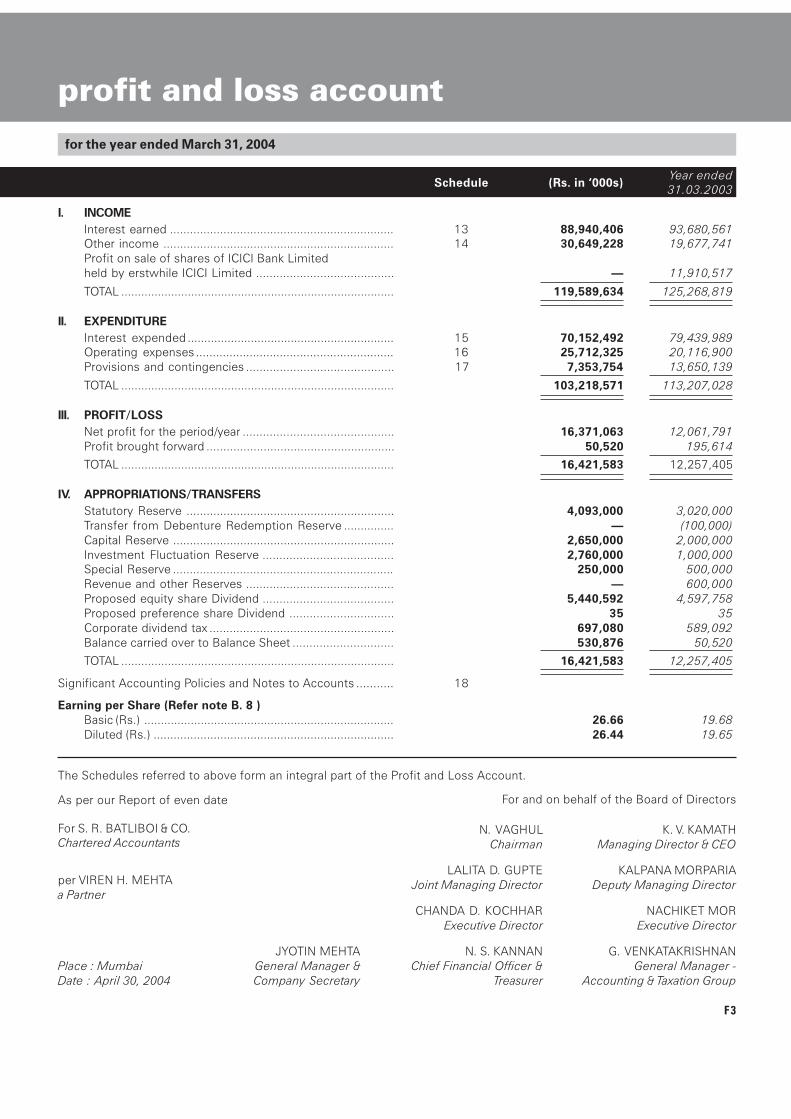
F3
profit and loss account
I. INCOMEInterest earned ................................................................... 13 88,940,406 93,680,561Other income ..................................................................... 14 30,649,228 19,677,741Profit on sale of shares of ICICI Bank Limitedheld by erstwhile ICICI Limited ......................................... � 11,910,517
TOTAL .................................................................................. 119,589,634 125,268,819
II. EXPENDITUREInterest expended .............................................................. 15 70,152,492 79,439,989Operating expenses ........................................................... 16 25,712,325 20,116,900Provisions and contingencies ............................................ 17 7,353,754 13,650,139
TOTAL .................................................................................. 103,218,571 113,207,028
III. PROFIT/LOSSNet profit for the period/year ............................................. 16,371,063 12,061,791Profit brought forward ........................................................ 50,520 195,614
TOTAL .................................................................................. 16,421,583 12,257,405
IV. APPROPRIATIONS/TRANSFERSStatutory Reserve .............................................................. 4,093,000 3,020,000Transfer from Debenture Redemption Reserve ............... � (100,000)Capital Reserve .................................................................. 2,650,000 2,000,000Investment Fluctuation Reserve ....................................... 2,760,000 1,000,000Special Reserve .................................................................. 250,000 500,000Revenue and other Reserves ............................................ � 600,000Proposed equity share Dividend ....................................... 5,440,592 4,597,758Proposed preference share Dividend ............................... 35 35Corporate dividend tax ....................................................... 697,080 589,092Balance carried over to Balance Sheet .............................. 530,876 50,520
TOTAL .................................................................................. 16,421,583 12,257,405
Significant Accounting Policies and Notes to Accounts ........... 18
Earning per Share (Refer note B. 8 )Basic (Rs.) ........................................................................... 26.66 19.68Diluted (Rs.) ........................................................................ 26.44 19.65
for the year ended March 31, 2004
JYOTIN MEHTA General Manager &Company Secretary
For S. R. BATLIBOI & CO.Chartered Accountants
per VIREN H. MEHTAa Partner
Place : MumbaiDate : April 30, 2004
As per our Report of even date For and on behalf of the Board of Directors
The Schedules referred to above form an integral part of the Profit and Loss Account.
Year endedSchedule (Rs. in �000s) 31.03.2003
N. VAGHULChairman
LALITA D. GUPTEJoint Managing Director
CHANDA D. KOCHHAR Executive Director
N. S. KANNANChief Financial Officer &
Treasurer
K. V. KAMATHManaging Director & CEO
KALPANA MORPARIADeputy Managing Director
NACHIKET MOR Executive Director
G. VENKATAKRISHNANGeneral Manager -
Accounting & Taxation Group
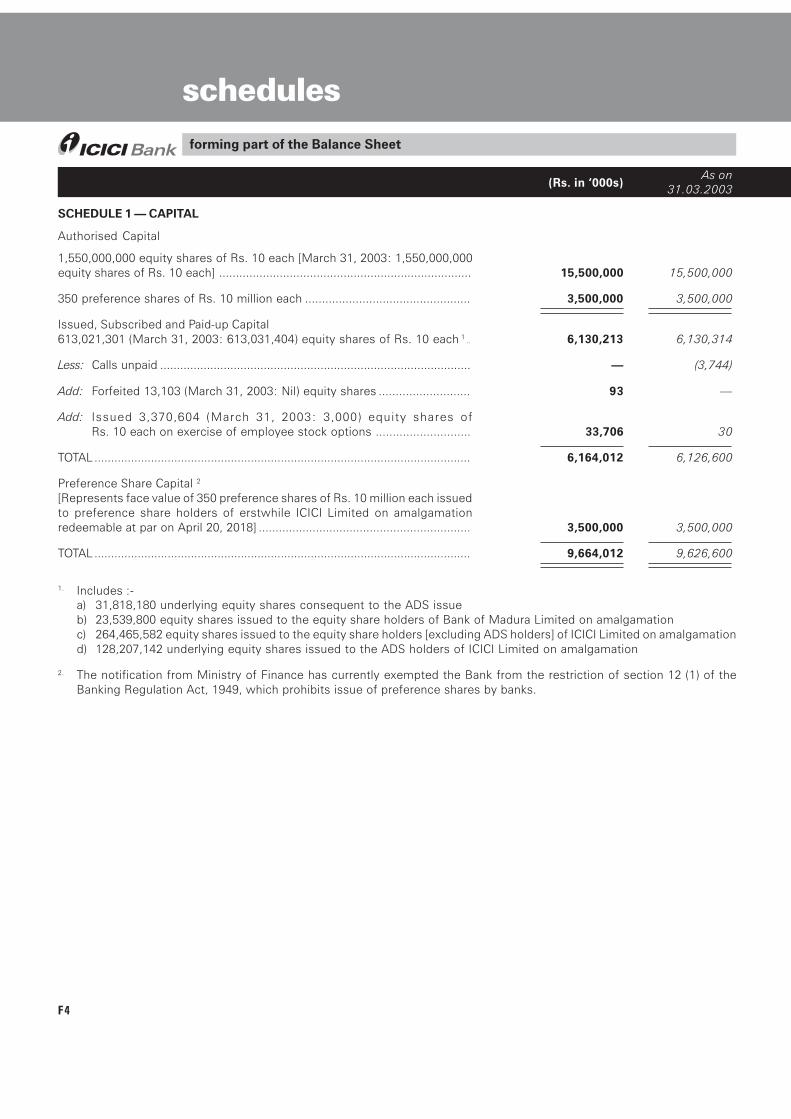
F4
forming part of the Balance Sheet
SCHEDULE 1 � CAPITAL
Authorised Capital
1,550,000,000 equity shares of Rs. 10 each [March 31, 2003: 1,550,000,000equity shares of Rs. 10 each] ........................................................................... 15,500,000 15,500,000
350 preference shares of Rs. 10 million each ................................................. 3,500,000 3,500,000
Issued, Subscribed and Paid-up Capital613,021,301 (March 31, 2003: 613,031,404) equity shares of Rs. 10 each 1 .. 6,130,213 6,130,314
Less: Calls unpaid ............................................................................................. � (3,744)
Add: Forfeited 13,103 (March 31, 2003: Nil) equity shares ........................... 93 �
Add: Issued 3,370,604 (March 31, 2003: 3,000) equity shares ofRs. 10 each on exercise of employee stock options ............................ 33,706 30
TOTAL ................................................................................................................. 6,164,012 6,126,600
Preference Share Capital 2
[Represents face value of 350 preference shares of Rs. 10 million each issuedto preference share holders of erstwhile ICICI Limited on amalgamationredeemable at par on April 20, 2018] ............................................................... 3,500,000 3,500,000
TOTAL ................................................................................................................. 9,664,012 9,626,600
1. Includes :-a) 31,818,180 underlying equity shares consequent to the ADS issueb) 23,539,800 equity shares issued to the equity share holders of Bank of Madura Limited on amalgamationc) 264,465,582 equity shares issued to the equity share holders [excluding ADS holders] of ICICI Limited on amalgamationd) 128,207,142 underlying equity shares issued to the ADS holders of ICICI Limited on amalgamation
2. The notification from Ministry of Finance has currently exempted the Bank from the restriction of section 12 (1) of theBanking Regulation Act, 1949, which prohibits issue of preference shares by banks.
schedules
As on(Rs. in �000s) 31.03.2003
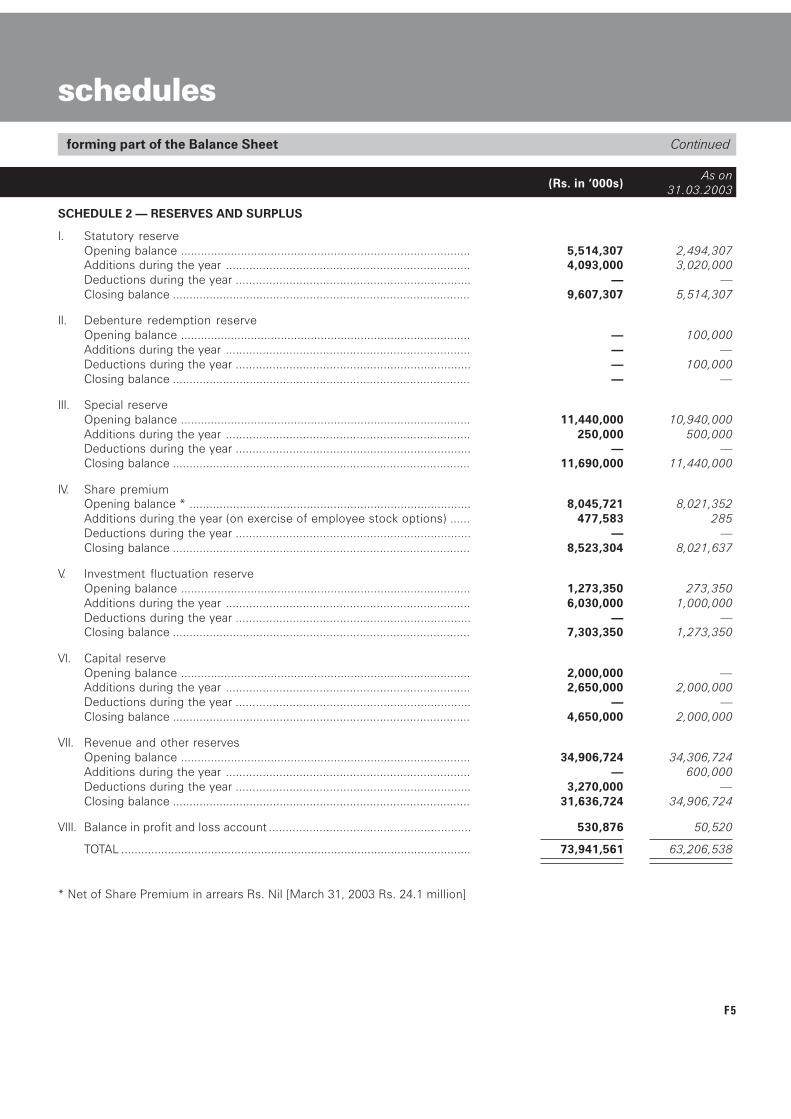
F5
forming part of the Balance Sheet Continued
SCHEDULE 2 � RESERVES AND SURPLUS
I. Statutory reserveOpening balance ....................................................................................... 5,514,307 2,494,307Additions during the year ......................................................................... 4,093,000 3,020,000Deductions during the year ...................................................................... � �Closing balance ......................................................................................... 9,607,307 5,514,307
II. Debenture redemption reserveOpening balance ....................................................................................... � 100,000Additions during the year ......................................................................... � �Deductions during the year ...................................................................... � 100,000Closing balance ......................................................................................... � �
III. Special reserveOpening balance ....................................................................................... 11,440,000 10,940,000Additions during the year ......................................................................... 250,000 500,000Deductions during the year ...................................................................... � �Closing balance ......................................................................................... 11,690,000 11,440,000
IV. Share premiumOpening balance * .................................................................................... 8,045,721 8,021,352Additions during the year (on exercise of employee stock options) ...... 477,583 285Deductions during the year ...................................................................... � �Closing balance ......................................................................................... 8,523,304 8,021,637
V. Investment fluctuation reserveOpening balance ....................................................................................... 1,273,350 273,350Additions during the year ......................................................................... 6,030,000 1,000,000Deductions during the year ...................................................................... � �Closing balance ......................................................................................... 7,303,350 1,273,350
VI. Capital reserveOpening balance ....................................................................................... 2,000,000 �Additions during the year ......................................................................... 2,650,000 2,000,000Deductions during the year ...................................................................... � �Closing balance ......................................................................................... 4,650,000 2,000,000
VII. Revenue and other reservesOpening balance ....................................................................................... 34,906,724 34,306,724Additions during the year ......................................................................... � 600,000Deductions during the year ...................................................................... 3,270,000 �Closing balance ......................................................................................... 31,636,724 34,906,724
VIII. Balance in profit and loss account ............................................................ 530,876 50,520
TOTAL ......................................................................................................... 73,941,561 63,206,538
* Net of Share Premium in arrears Rs. Nil [March 31, 2003 Rs. 24.1 million]
schedules
As on(Rs. in �000s) 31.03.2003
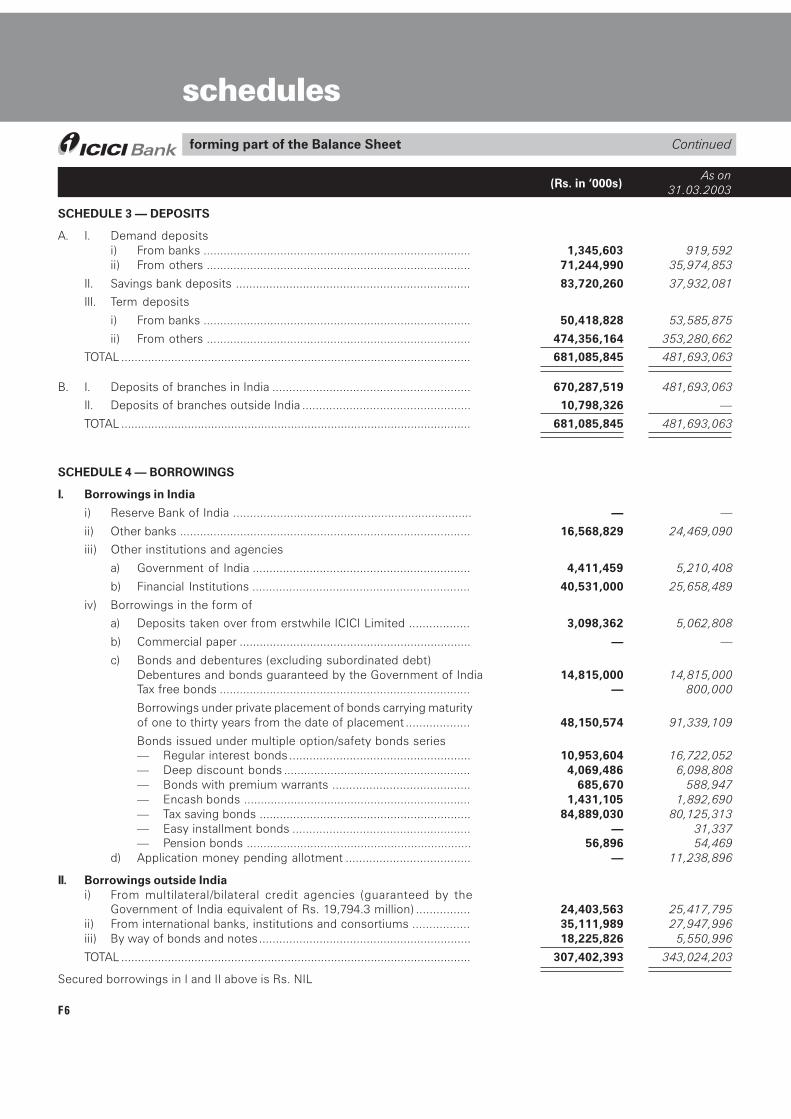
F6
As on(Rs. in �000s) 31.03.2003
forming part of the Balance Sheet
SCHEDULE 3 � DEPOSITS
A. I. Demand depositsi) From banks ................................................................................ 1,345,603 919,592ii) From others ............................................................................... 71,244,990 35,974,853
II. Savings bank deposits ...................................................................... 83,720,260 37,932,081
III. Term deposits
i) From banks ................................................................................ 50,418,828 53,585,875
ii) From others ............................................................................... 474,356,164 353,280,662
TOTAL ......................................................................................................... 681,085,845 481,693,063
B. I. Deposits of branches in India ........................................................... 670,287,519 481,693,063
II. Deposits of branches outside India .................................................. 10,798,326 �
TOTAL ......................................................................................................... 681,085,845 481,693,063
SCHEDULE 4 � BORROWINGS
I. Borrowings in India
i) Reserve Bank of India ....................................................................... � �
ii) Other banks ....................................................................................... 16,568,829 24,469,090
iii) Other institutions and agencies
a) Government of India ................................................................. 4,411,459 5,210,408
b) Financial Institutions ................................................................. 40,531,000 25,658,489
iv) Borrowings in the form of
a) Deposits taken over from erstwhile ICICI Limited .................. 3,098,362 5,062,808
b) Commercial paper ..................................................................... � �
c) Bonds and debentures (excluding subordinated debt)Debentures and bonds guaranteed by the Government of India 14,815,000 14,815,000Tax free bonds ........................................................................... � 800,000
Borrowings under private placement of bonds carrying maturityof one to thirty years from the date of placement ................... 48,150,574 91,339,109
Bonds issued under multiple option/safety bonds series� Regular interest bonds ...................................................... 10,953,604 16,722,052� Deep discount bonds ........................................................ 4,069,486 6,098,808� Bonds with premium warrants ......................................... 685,670 588,947� Encash bonds .................................................................... 1,431,105 1,892,690� Tax saving bonds ............................................................... 84,889,030 80,125,313� Easy installment bonds ..................................................... � 31,337� Pension bonds ................................................................... 56,896 54,469
d) Application money pending allotment ..................................... � 11,238,896
II. Borrowings outside Indiai) From multilateral/bilateral credit agencies (guaranteed by the
Government of India equivalent of Rs. 19,794.3 million) ................ 24,403,563 25,417,795ii) From international banks, institutions and consortiums ................. 35,111,989 27,947,996iii) By way of bonds and notes............................................................... 18,225,826 5,550,996
TOTAL ......................................................................................................... 307,402,393 343,024,203
Secured borrowings in I and II above is Rs. NIL
schedulesContinued
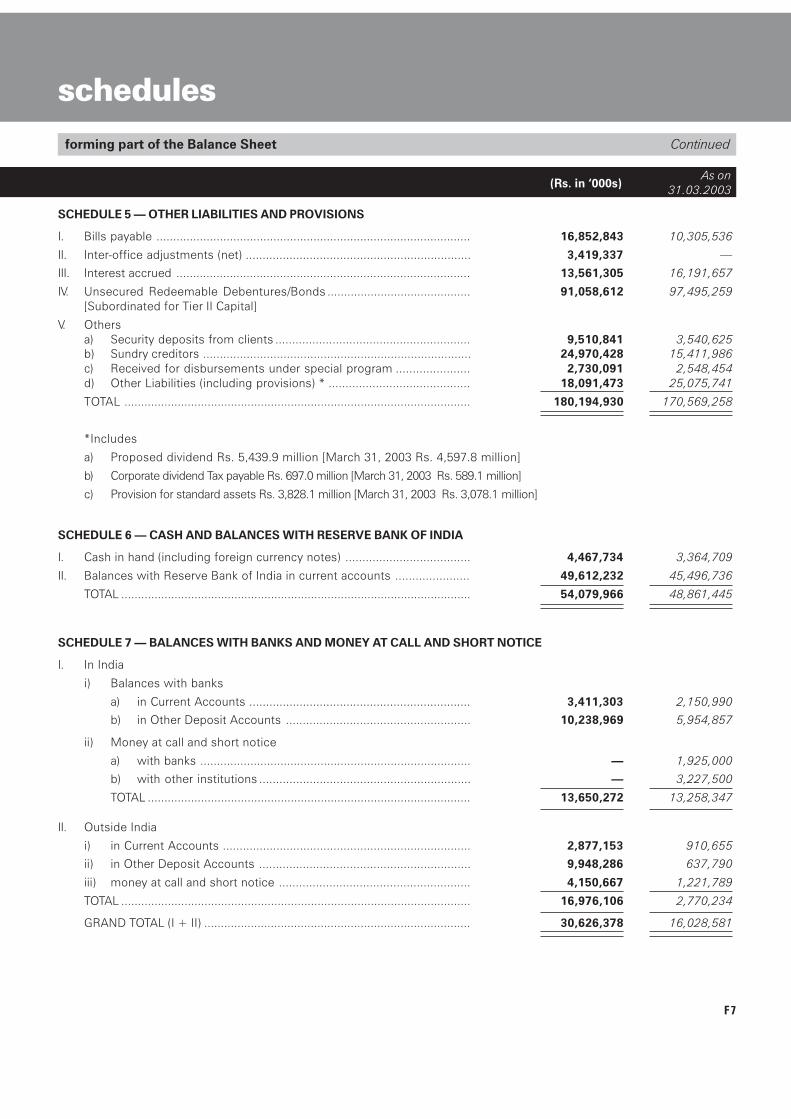
F7
forming part of the Balance Sheet
SCHEDULE 5 � OTHER LIABILITIES AND PROVISIONS
I. Bills payable .............................................................................................. 16,852,843 10,305,536
II. Inter-office adjustments (net) ................................................................... 3,419,337 �
III. Interest accrued ........................................................................................ 13,561,305 16,191,657
IV. Unsecured Redeemable Debentures/Bonds ........................................... 91,058,612 97,495,259[Subordinated for Tier II Capital]
V. Othersa) Security deposits from clients .......................................................... 9,510,841 3,540,625b) Sundry creditors ................................................................................ 24,970,428 15,411,986c) Received for disbursements under special program ...................... 2,730,091 2,548,454d) Other Liabilities (including provisions) * .......................................... 18,091,473 25,075,741
TOTAL ........................................................................................................ 180,194,930 170,569,258
*Includes
a) Proposed dividend Rs. 5,439.9 million [March 31, 2003 Rs. 4,597.8 million]
b) Corporate dividend Tax payable Rs. 697.0 million [March 31, 2003 Rs. 589.1 million]
c) Provision for standard assets Rs. 3,828.1 million [March 31, 2003 Rs. 3,078.1 million]
SCHEDULE 6 � CASH AND BALANCES WITH RESERVE BANK OF INDIA
I. Cash in hand (including foreign currency notes) ..................................... 4,467,734 3,364,709
II. Balances with Reserve Bank of India in current accounts ...................... 49,612,232 45,496,736
TOTAL ......................................................................................................... 54,079,966 48,861,445
SCHEDULE 7 � BALANCES WITH BANKS AND MONEY AT CALL AND SHORT NOTICE
I. In India
i) Balances with banks
a) in Current Accounts .................................................................. 3,411,303 2,150,990
b) in Other Deposit Accounts ....................................................... 10,238,969 5,954,857
ii) Money at call and short notice
a) with banks ................................................................................. � 1,925,000
b) with other institutions ............................................................... � 3,227,500
TOTAL ................................................................................................. 13,650,272 13,258,347
II. Outside India
i) in Current Accounts .......................................................................... 2,877,153 910,655
ii) in Other Deposit Accounts ............................................................... 9,948,286 637,790
iii) money at call and short notice ......................................................... 4,150,667 1,221,789
TOTAL ......................................................................................................... 16,976,106 2,770,234
GRAND TOTAL (I + II) ................................................................................ 30,626,378 16,028,581
schedulesContinued
As on(Rs. in �000s) 31.03.2003
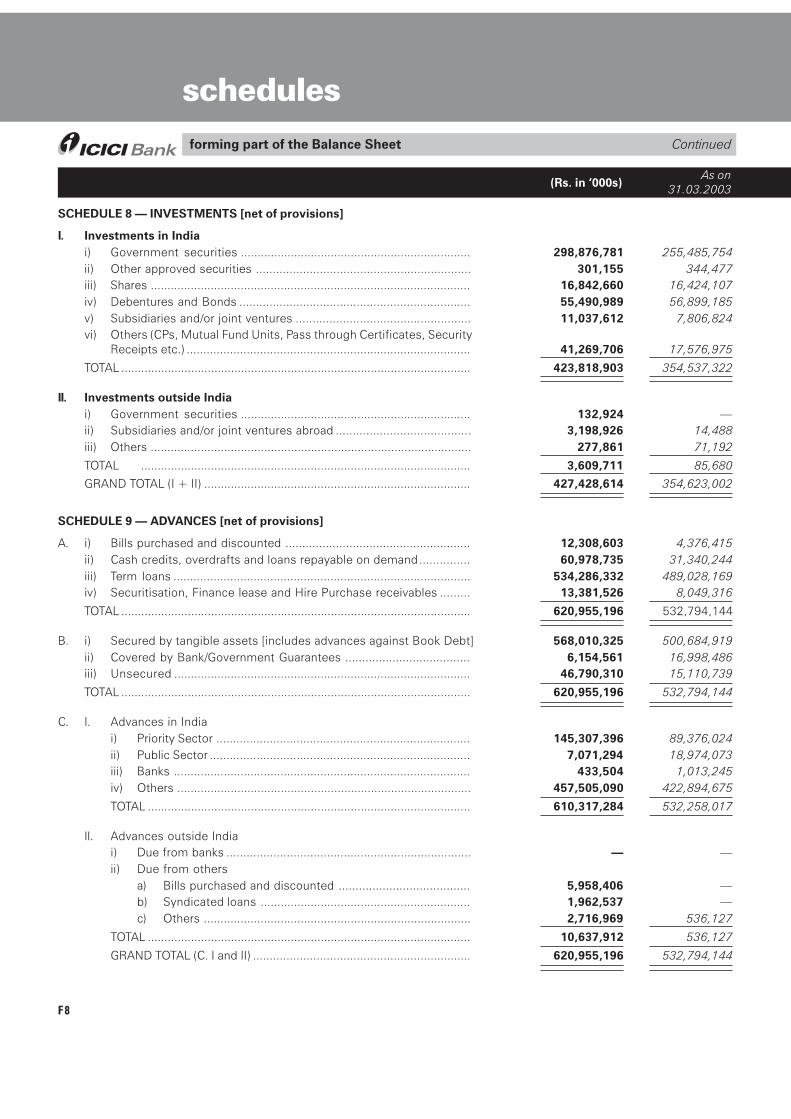
F8
As on(Rs. in �000s) 31.03.2003
schedules
SCHEDULE 8 � INVESTMENTS [net of provisions]
I. Investments in Indiai) Government securities ..................................................................... 298,876,781 255,485,754ii) Other approved securities ................................................................ 301,155 344,477iii) Shares ................................................................................................ 16,842,660 16,424,107iv) Debentures and Bonds ..................................................................... 55,490,989 56,899,185v) Subsidiaries and/or joint ventures .................................................... 11,037,612 7,806,824vi) Others (CPs, Mutual Fund Units, Pass through Certificates, Security
Receipts etc.) ..................................................................................... 41,269,706 17,576,975
TOTAL ......................................................................................................... 423,818,903 354,537,322
II. Investments outside Indiai) Government securities ..................................................................... 132,924 �ii) Subsidiaries and/or joint ventures abroad ........................................ 3,198,926 14,488iii) Others ................................................................................................ 277,861 71,192
TOTAL ................................................................................................... 3,609,711 85,680
GRAND TOTAL (I + II) ................................................................................ 427,428,614 354,623,002
SCHEDULE 9 � ADVANCES [net of provisions]
A. i) Bills purchased and discounted ....................................................... 12,308,603 4,376,415ii) Cash credits, overdrafts and loans repayable on demand............... 60,978,735 31,340,244iii) Term loans ......................................................................................... 534,286,332 489,028,169iv) Securitisation, Finance lease and Hire Purchase receivables ......... 13,381,526 8,049,316
TOTAL ......................................................................................................... 620,955,196 532,794,144
B. i) Secured by tangible assets [includes advances against Book Debt] 568,010,325 500,684,919ii) Covered by Bank/Government Guarantees ..................................... 6,154,561 16,998,486iii) Unsecured ......................................................................................... 46,790,310 15,110,739
TOTAL ......................................................................................................... 620,955,196 532,794,144
C. I. Advances in Indiai) Priority Sector ............................................................................ 145,307,396 89,376,024ii) Public Sector .............................................................................. 7,071,294 18,974,073iii) Banks ......................................................................................... 433,504 1,013,245iv) Others ........................................................................................ 457,505,090 422,894,675
TOTAL ................................................................................................. 610,317,284 532,258,017
II. Advances outside Indiai) Due from banks ......................................................................... � �ii) Due from others
a) Bills purchased and discounted ....................................... 5,958,406 �b) Syndicated loans ............................................................... 1,962,537 �c) Others ................................................................................ 2,716,969 536,127
TOTAL ................................................................................................. 10,637,912 536,127
GRAND TOTAL (C. I and II) ................................................................. 620,955,196 532,794,144
forming part of the Balance Sheet Continued
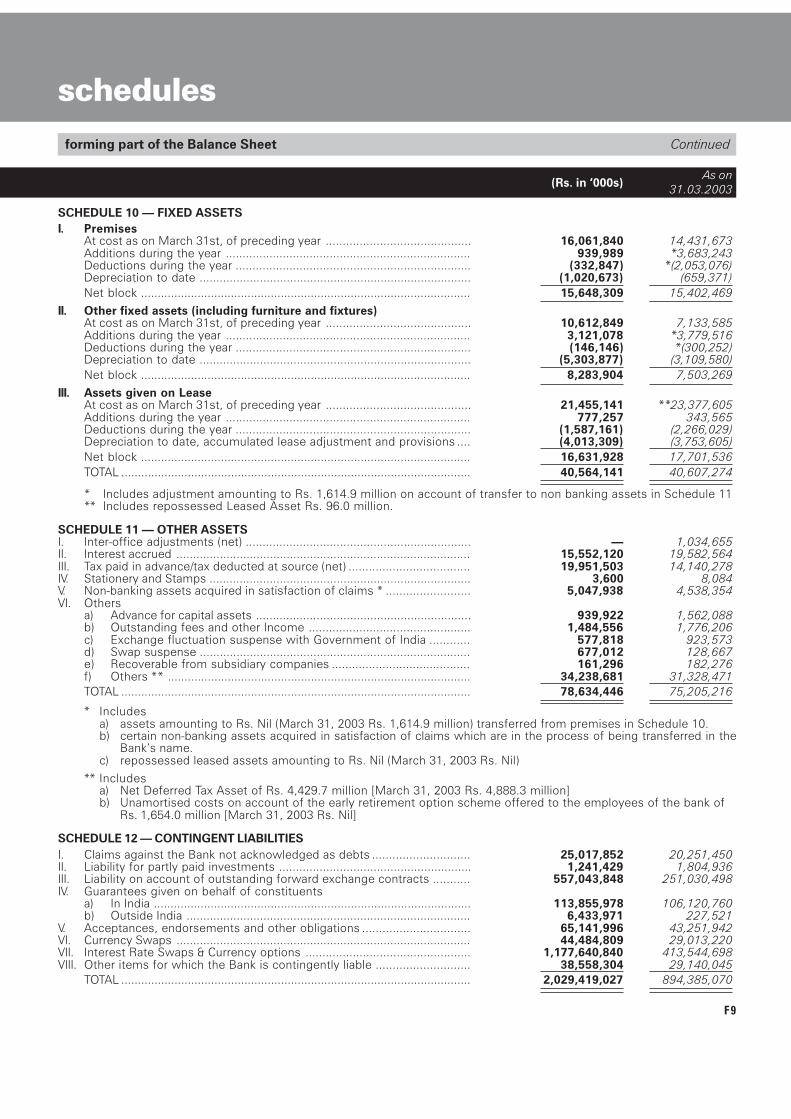
F9
SCHEDULE 10 � FIXED ASSETSI. Premises
At cost as on March 31st, of preceding year ........................................... 16,061,840 14,431,673Additions during the year ......................................................................... 939,989 *3,683,243Deductions during the year ...................................................................... (332,847) *(2,053,076)Depreciation to date ................................................................................. (1,020,673) (659,371)Net block ................................................................................................... 15,648,309 15,402,469
II. Other fixed assets (including furniture and fixtures)At cost as on March 31st, of preceding year ........................................... 10,612,849 7,133,585Additions during the year ......................................................................... 3,121,078 *3,779,516Deductions during the year ...................................................................... (146,146) *(300,252)Depreciation to date ................................................................................. (5,303,877) (3,109,580)Net block ................................................................................................... 8,283,904 7,503,269
III. Assets given on LeaseAt cost as on March 31st, of preceding year ........................................... 21,455,141 **23,377,605Additions during the year ......................................................................... 777,257 343,565Deductions during the year ...................................................................... (1,587,161) (2,266,029)Depreciation to date, accumulated lease adjustment and provisions .... (4,013,309) (3,753,605)Net block ................................................................................................... 16,631,928 17,701,536TOTAL ......................................................................................................... 40,564,141 40,607,274
* Includes adjustment amounting to Rs. 1,614.9 million on account of transfer to non banking assets in Schedule 11** Includes repossessed Leased Asset Rs. 96.0 million.
SCHEDULE 11 � OTHER ASSETSI. Inter-office adjustments (net) ................................................................... � 1,034,655II. Interest accrued ........................................................................................ 15,552,120 19,582,564III. Tax paid in advance/tax deducted at source (net) .................................... 19,951,503 14,140,278IV. Stationery and Stamps .............................................................................. 3,600 8,084V. Non-banking assets acquired in satisfaction of claims * ......................... 5,047,938 4,538,354VI. Others
a) Advance for capital assets ................................................................ 939,922 1,562,088b) Outstanding fees and other Income ................................................ 1,484,556 1,776,206c) Exchange fluctuation suspense with Government of India ............ 577,818 923,573d) Swap suspense ................................................................................. 677,012 128,667e) Recoverable from subsidiary companies ......................................... 161,296 182,276f) Others ** ........................................................................................... 34,238,681 31,328,471TOTAL ......................................................................................................... 78,634,446 75,205,216
* Includesa) assets amounting to Rs. Nil (March 31, 2003 Rs. 1,614.9 million) transferred from premises in Schedule 10.b) certain non-banking assets acquired in satisfaction of claims which are in the process of being transferred in the
Bank�s name.c) repossessed leased assets amounting to Rs. Nil (March 31, 2003 Rs. Nil)
** Includesa) Net Deferred Tax Asset of Rs. 4,429.7 million [March 31, 2003 Rs. 4,888.3 million]b) Unamortised costs on account of the early retirement option scheme offered to the employees of the bank of
Rs. 1,654.0 million [March 31, 2003 Rs. Nil]
SCHEDULE 12 � CONTINGENT LIABILITIESI. Claims against the Bank not acknowledged as debts ............................. 25,017,852 20,251,450II. Liability for partly paid investments ......................................................... 1,241,429 1,804,936III. Liability on account of outstanding forward exchange contracts ........... 557,043,848 251,030,498IV. Guarantees given on behalf of constituents
a) In India ............................................................................................... 113,855,978 106,120,760b) Outside India ..................................................................................... 6,433,971 227,521
V. Acceptances, endorsements and other obligations ................................ 65,141,996 43,251,942VI. Currency Swaps ........................................................................................ 44,484,809 29,013,220VII. Interest Rate Swaps & Currency options ................................................. 1,177,640,840 413,544,698VIII. Other items for which the Bank is contingently liable ............................ 38,558,304 29,140,045
TOTAL ......................................................................................................... 2,029,419,027 894,385,070
schedulesforming part of the Balance Sheet Continued
As on(Rs. in �000s) 31.03.2003
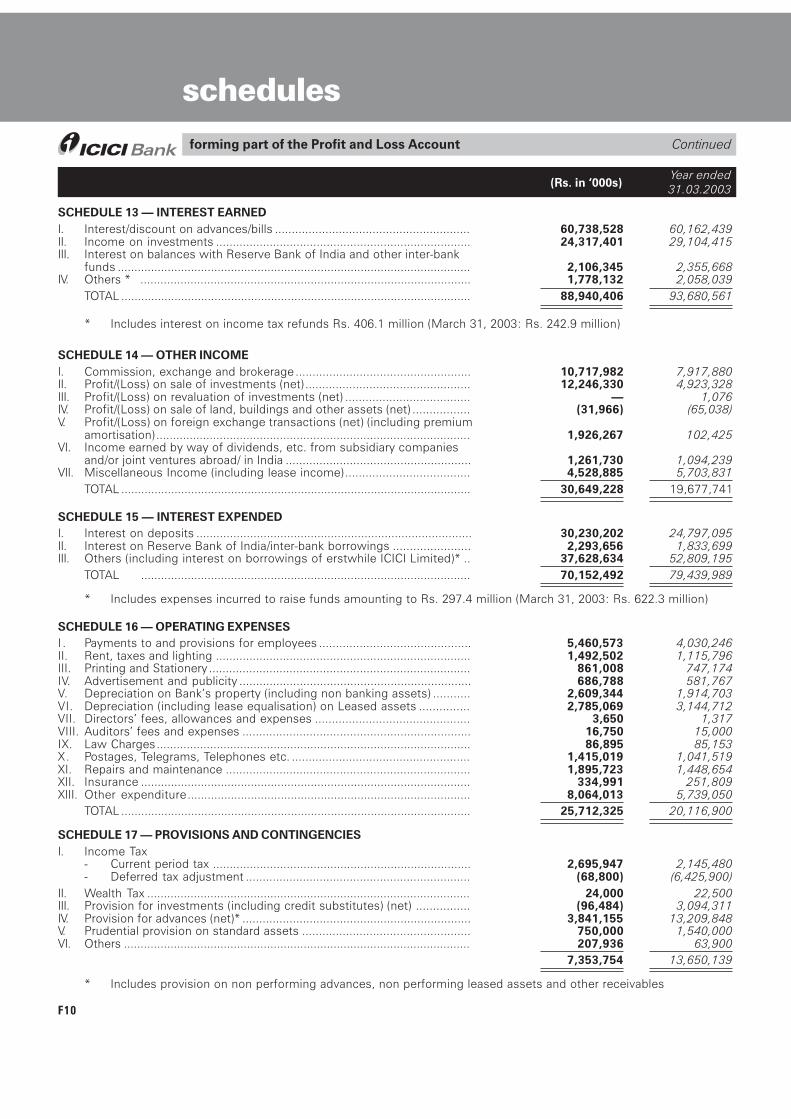
F10
forming part of the Profit and Loss Account Continued
schedules
Year ended(Rs. in �000s) 31.03.2003
SCHEDULE 13 � INTEREST EARNEDI. Interest/discount on advances/bills .......................................................... 60,738,528 60,162,439II. Income on investments ............................................................................ 24,317,401 29,104,415III. Interest on balances with Reserve Bank of India and other inter-bank
funds .......................................................................................................... 2,106,345 2,355,668IV. Others * ................................................................................................... 1,778,132 2,058,039
TOTAL ......................................................................................................... 88,940,406 93,680,561
* Includes interest on income tax refunds Rs. 406.1 million (March 31, 2003: Rs. 242.9 million)
SCHEDULE 14 � OTHER INCOMEI. Commission, exchange and brokerage .................................................... 10,717,982 7,917,880II. Profit/(Loss) on sale of investments (net) ................................................. 12,246,330 4,923,328III. Profit/(Loss) on revaluation of investments (net) ..................................... � 1,076IV. Profit/(Loss) on sale of land, buildings and other assets (net) ................. (31,966) (65,038)V. Profit/(Loss) on foreign exchange transactions (net) (including premium
amortisation) .............................................................................................. 1,926,267 102,425VI. Income earned by way of dividends, etc. from subsidiary companies
and/or joint ventures abroad/ in India ....................................................... 1,261,730 1,094,239VII. Miscellaneous Income (including lease income)..................................... 4,528,885 5,703,831
TOTAL ......................................................................................................... 30,649,228 19,677,741
SCHEDULE 15 � INTEREST EXPENDEDI. Interest on deposits .................................................................................. 30,230,202 24,797,095II. Interest on Reserve Bank of India/inter-bank borrowings ....................... 2,293,656 1,833,699III. Others (including interest on borrowings of erstwhile ICICI Limited)* .. 37,628,634 52,809,195
TOTAL ................................................................................................... 70,152,492 79,439,989
* Includes expenses incurred to raise funds amounting to Rs. 297.4 million (March 31, 2003: Rs. 622.3 million)
SCHEDULE 16 � OPERATING EXPENSESI . Payments to and provisions for employees ............................................. 5,460,573 4,030,246II. Rent, taxes and lighting ............................................................................ 1,492,502 1,115,796III. Printing and Stationery .............................................................................. 861,008 747,174IV. Advertisement and publicity ..................................................................... 686,788 581,767V. Depreciation on Bank�s property (including non banking assets) ........... 2,609,344 1,914,703VI. Depreciation (including lease equalisation) on Leased assets ............... 2,785,069 3,144,712VII. Directors� fees, allowances and expenses .............................................. 3,650 1,317VIII. Auditors� fees and expenses .................................................................... 16,750 15,000IX. Law Charges.............................................................................................. 86,895 85,153X. Postages, Telegrams, Telephones etc. ..................................................... 1,415,019 1,041,519XI. Repairs and maintenance ......................................................................... 1,895,723 1,448,654XII. Insurance ................................................................................................... 334,991 251,809XIII. Other expenditure..................................................................................... 8,064,013 5,739,050
TOTAL ......................................................................................................... 25,712,325 20,116,900
SCHEDULE 17 � PROVISIONS AND CONTINGENCIESI. Income Tax
- Current period tax ............................................................................. 2,695,947 2,145,480- Deferred tax adjustment ................................................................... (68,800) (6,425,900)
II. Wealth Tax ................................................................................................. 24,000 22,500III. Provision for investments (including credit substitutes) (net) ................ (96,484) 3,094,311IV. Provision for advances (net)* .................................................................... 3,841,155 13,209,848V. Prudential provision on standard assets .................................................. 750,000 1,540,000VI. Others ........................................................................................................ 207,936 63,900
7,353,754 13,650,139
* Includes provision on non performing advances, non performing leased assets and other receivables
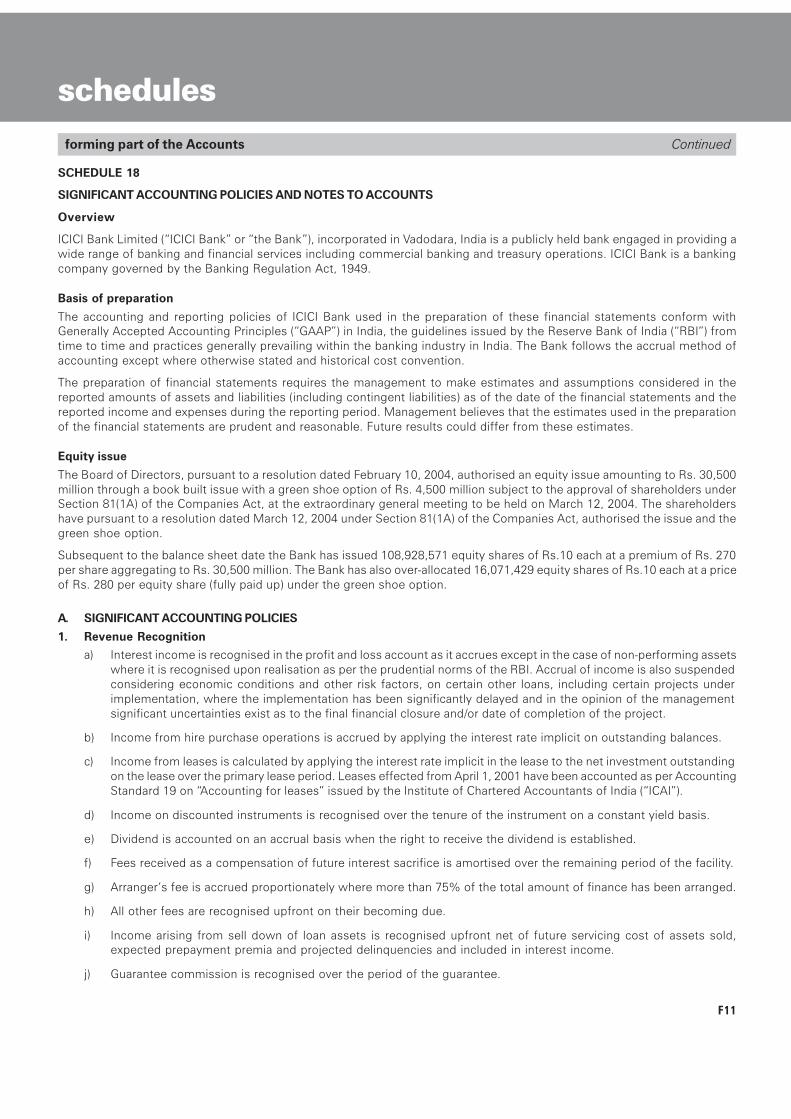
F11
forming part of the Accounts Continued
schedules
SCHEDULE 18
SIGNIFICANT ACCOUNTING POLICIES AND NOTES TO ACCOUNTS
Overview
ICICI Bank Limited (�ICICI Bank� or �the Bank�), incorporated in Vadodara, India is a publicly held bank engaged in providing awide range of banking and financial services including commercial banking and treasury operations. ICICI Bank is a bankingcompany governed by the Banking Regulation Act, 1949.
Basis of preparation
The accounting and reporting policies of ICICI Bank used in the preparation of these financial statements conform withGenerally Accepted Accounting Principles (�GAAP�) in India, the guidelines issued by the Reserve Bank of India (�RBI�) fromtime to time and practices generally prevailing within the banking industry in India. The Bank follows the accrual method ofaccounting except where otherwise stated and historical cost convention.
The preparation of financial statements requires the management to make estimates and assumptions considered in thereported amounts of assets and liabilities (including contingent liabilities) as of the date of the financial statements and thereported income and expenses during the reporting period. Management believes that the estimates used in the preparationof the financial statements are prudent and reasonable. Future results could differ from these estimates.
Equity issue
The Board of Directors, pursuant to a resolution dated February 10, 2004, authorised an equity issue amounting to Rs. 30,500million through a book built issue with a green shoe option of Rs. 4,500 million subject to the approval of shareholders underSection 81(1A) of the Companies Act, at the extraordinary general meeting to be held on March 12, 2004. The shareholdershave pursuant to a resolution dated March 12, 2004 under Section 81(1A) of the Companies Act, authorised the issue and thegreen shoe option.
Subsequent to the balance sheet date the Bank has issued 108,928,571 equity shares of Rs.10 each at a premium of Rs. 270per share aggregating to Rs. 30,500 million. The Bank has also over-allocated 16,071,429 equity shares of Rs.10 each at a priceof Rs. 280 per equity share (fully paid up) under the green shoe option.
A. SIGNIFICANT ACCOUNTING POLICIES
1. Revenue Recognition
a) Interest income is recognised in the profit and loss account as it accrues except in the case of non-performing assetswhere it is recognised upon realisation as per the prudential norms of the RBI. Accrual of income is also suspendedconsidering economic conditions and other risk factors, on certain other loans, including certain projects underimplementation, where the implementation has been significantly delayed and in the opinion of the managementsignificant uncertainties exist as to the final financial closure and/or date of completion of the project.
b) Income from hire purchase operations is accrued by applying the interest rate implicit on outstanding balances.
c) Income from leases is calculated by applying the interest rate implicit in the lease to the net investment outstandingon the lease over the primary lease period. Leases effected from April 1, 2001 have been accounted as per AccountingStandard 19 on �Accounting for leases� issued by the Institute of Chartered Accountants of India (�ICAI�).
d) Income on discounted instruments is recognised over the tenure of the instrument on a constant yield basis.
e) Dividend is accounted on an accrual basis when the right to receive the dividend is established.
f) Fees received as a compensation of future interest sacrifice is amortised over the remaining period of the facility.
g) Arranger�s fee is accrued proportionately where more than 75% of the total amount of finance has been arranged.
h) All other fees are recognised upfront on their becoming due.
i) Income arising from sell down of loan assets is recognised upfront net of future servicing cost of assets sold,expected prepayment premia and projected delinquencies and included in interest income.
j) Guarantee commission is recognised over the period of the guarantee.

F12
forming part of the Accounts Continued
schedules
2. Investments
Investments are valued in accordance with the extant RBI guidelines on investment classification and valuation as under:
a) All investments are categorised into �Held to Maturity�, �Available for sale� and �Trading�. Reclassifications, if any, inany category are accounted for as per the RBI guidelines. Under each category the investments are further classifiedunder (a) Government securities (b) other approved securities (c) shares (d) bonds and debentures (e) subsidiariesand joint ventures and (f) others.
b) �Held to Maturity� securities are carried at their acquisition cost or at amortised cost if acquired at a premium over theface value. A provision is made for other than temporary diminution.
c) �Available for sale� and �Trading� securities are valued periodically as per RBI guidelines.
The market/fair value for the purpose of periodical valuation of quoted investments included in the Available for Saleand Held for Trading categories is the market price of the scrip as available from the trades/quotes on the stockexchanges, SGL account transactions, price list of RBI or prices declared by Primary Dealers Association of Indiajointly with Fixed Income Money Market and Derivatives Association (�FIMMDA�), periodically.
The market/fair value of unquoted SLR securities included in the �Available for Sale� and �Trading� categories is as perthe rates put out by FIMMDA.
The valuation of non-SLR securities, other than those quoted on the stock exchanges, wherever linked to the Yield-to-Maturity (�YTM�) rates, is with a mark-up (reflecting associated credit risk) over the YTM rates for governmentsecurities put out by FIMMDA.
The unquoted equity shares are valued at the book value, if the latest balance sheet is available or at Re. 1.
Securities are valued scrip-wise and depreciation/appreciation aggregated for each category. Net appreciation ineach basket if any, being unrealised, is ignored, while net depreciation is provided for.
d) Costs such as brokerage, commission etc., pertaining to investments, paid at the time of acquisition, are charged torevenue.
e) Broken period interest on debt instruments is treated as a revenue item.
f) Investments in subsidiaries/joint ventures are categorised as �Held to Maturity� in accordance with the RBI guidelines.
g) Profit on sale of investment in the �Held to Maturity� category is credited to the revenue account and thereafter isappropriated, (net of applicable taxes and statutory reserve requirements) to capital reserve.
h) At each reporting year-end, security receipts issued by the asset reconstruction company are valued in accordancewith the guidelines applicable to non-SLR instruments prescribed by RBI from time to time. Accordingly, in casewhere the security receipts issued by the asset reconstruction company are limited to the actual realisation of thefinancial assets assigned to the instruments in the concerned scheme, the Bank reckons the Net Asset Value(�NAV�), obtained from the asset reconstruction company from time to time, for valuation of such investments ateach reporting period end.
3. Provisions/Write-offs on loans and other credit facilities
a) All credit exposures are classified as per the RBI guidelines, into performing and non-performing assets. Further,non-performing assets are classified into sub-standard, doubtful and loss assets based on the criteria stipulated bythe RBI. Provisions are made on substandard and doubtful assets at rates equal to or higher than those prescribedby the RBI. The secured portion of the substandard and doubtful assets is provided for at 50% over a three-yearperiod instead of five and a half years as prescribed by the RBI. Loss assets and unsecured portion of doubtful assetsare fully provided/written off. Additional provisions are made against specific non-performing assets over and abovewhat is stated above, if in the opinion of the management, increased provisions are necessary.
b) For restructured/rescheduled assets, provision is made in accordance with the guidelines issued by the RBI, whichrequires the present value of the interest sacrifice be provided at the time of restructuring.
c) In the case of other than restructured loan accounts classified as NPAs, the account is reclassified as �standard�account if arrears of interest and principal are fully paid by the borrower.
In respect of non-performing loan accounts subject to restructuring, asset category is upgraded to standard accountif the borrower demonstrates, over a minimum period of one year, the ability to repay the loan in accordance with thecontractual terms.
F13
forming part of the Accounts Continued
d) The Bank has incorporated the assets taken over from erstwhile ICICI Limited (�ICICI�) in its books at carryingvalues as appearing in the books of ICICI with a provision made based on the fair valuation exercise carried outby an independent firm. To the extent future provisions are required on the assets taken over from ICICI, theprovision created on fair valuation of the assets at the time of the amalgamation is used.
e) Amounts recovered against other debts written off in earlier years and provisions no longer considered necessaryin the context of the current status of the borrower are recognised in the Profit and Loss Account.
f) In addition to the general provision of 0.25% made on standard assets in accordance with the RBI guidelines, theBank maintains general provisions to cover potential credit losses which are inherent in any loan portfolio but notidentified. For standard assets, additional general provisions are determined having regard to overall portfolioquality, asset growth, economic conditions and other risk factors.
g) In addition to the provisions required to be held according to the asset classification status, provisions are heldfor individual country exposure (other than for home country). The countries are categorised into seven riskcategories namely insignificant, low, moderate, high, very high, restricted and off-credit and provisioning madeon exposures exceeding 90 days on a graded scale ranging from 0.25% to 100%. For exposures with contractualmaturity of less than 90 days, 25% of the normal provision requirement is held. If the country exposure (net) ofthe Bank in respect of each country does not exceed 2% of the total funded assets, no provision is maintainedon such country exposure.
4. Fixed assets and depreciation
a) Premises and other fixed assets are carried at cost less accumulated depreciation. Depreciation is charged over theestimated useful life of a fixed asset on a �straight line� basis. The rates of depreciation for fixed assets, which arenot lower than the rates prescribed in Schedule XIV of the Companies Act, 1956, are as follows:
Asset Depreciat ion Rate
Premises owned by the Bank .................................................................................. 1.63%Improvements to leasehold premises .................................................................... 1.63% or over the lease period,
whichever is higherATMs ......................................................................................................................... 12.50%Plant and machinery like air conditioners, xerox machines, etc. ........................... 10%Furniture and fixtures............................................................................................... 15%Motor vehicles .......................................................................................................... 20%Computers ................................................................................................................ 33.33%Others (including software and system development expenses) ......................... 25%
b) Depreciation on leased assets is made on a straight-line basis at the higher of the rates determined with referenceto the primary period of lease and the rates specified in Schedule XIV to the Companies Act, 1956.
c) Assets purchased/sold during the year are depreciated on the basis of actual number of days the asset has been putto use.
d) Items costing less than Rs. 5,000 are depreciated at the rate of 100%.
5. Foreign currency transactions
a) Income and expenditure items are translated at the exchange rates prevailing on the date of the transaction.Monetary assets and liabilities are translated at closing exchange rates notified by the Foreign Exchange Dealers�Association of India (�FEDAI�) at the balance sheet date and the resulting profits/losses are included in the profit andloss account.
b) Outstanding forward exchange contracts are stated at contracted rates and are revalued at the exchange ratesnotified by FEDAI for specified maturities and at interpolated rates for contracts of in-between maturities. Theresultant gains or losses are recognised in the profit and loss account.
c) Contingent Liabilities on account of guarantees, endorsements and other obligations are stated at the exchangerates notified by FEDAI at the balance sheet date.
schedules
F14
forming part of the Accounts Continued
6. Accounting for Derivative Contracts
The Bank enters into derivative contracts such as foreign currency options, interest rate and currency swaps and crosscurrency interest rate swaps to hedge on-balance sheet assets and liabilities or for trading purposes.
The swap contracts entered to hedge on-balance sheet assets and liabilities are structured in such a way that they bearan opposite and offsetting impact with the underlying on-balance sheet items. The impact of such derivative instrumentsare correlated with the movement of underlying assets and accounted pursuant to the principles of hedge accounting.
Trading swaps and foreign currency options, outstanding at the balance sheet date are marked to market and theresulting loss, if any, is recorded in the profit and loss account.
7. Employee Stock Option Scheme (�ESOS�)
The Bank has formulated an Employees Stock Option Scheme. The scheme provides that employees are granted anoption to acquire equity shares of the Bank that vests in graded manner. The options may be exercised within a specifiedperiod. The Bank follows the intrinsic value method for computing the compensation cost, if any, for all options granted.
8. Staff Retirement Benefits
For employees covered under group gratuity scheme and group superannuation scheme of LIC, gratuity andsuperannuation charge to profit and loss account is on the basis of premium charged by LIC. Provision for gratuity andpension for other employees and leave encashment liability are determined as per actuarial valuation. Defined contributionsfor Provident Fund are charged to the profit and loss account based on contributions made in terms of the scheme.
The Bank provides for pension, a deferred retirement plan covering certain employees. The plan provides for a pensionpayment on a monthly basis to these employees on their retirement based on the respective employee�s salary andyears of employment with the Bank. Employees covered by the pension plan are not eligible for benefits under theprovident fund plan, a defined contribution plan. The pension plan is funded through periodic contributions to a fund set-up by the Bank and administered by a Board of Trustees. Such contributions are actuarially determined.
9. Income Taxes
Income tax expense is the aggregate amount of current tax and deferred tax charge. Current year taxes are determinedin accordance with the Income Tax Act, 1961. Deferred tax adjustments comprise of changes in the deferred tax assetsor liabilities during the period.
Deferred tax assets and liabilities are recognised for the future tax consequences of timing differences arising betweenthe carrying values of assets and liabilities and their respective tax basis and operating carry forward losses. Deferred taxassets are recognised only after giving due consideration to prudence. Deferred tax asset and liabilities are measuredusing tax rates and tax laws that have been enacted or substantially enacted by the balance sheet date. The impact onaccount of changes in the deferred tax assets and liabilities is also recognised in the income statement.
Deferred tax assets are recognised and reassessed at each year end, based upon management�s judgement as towhether realisation is considered reasonably certain. Deferred tax assets are recognised on carry forward of unabsorbeddepreciation and tax losses only if there is virtual certainty that such deferred tax asset can be realised against futureprofits.
10. Translation of the Financial Statements of Foreign Offices
In accordance with the guidelines issued by the RBI, all assets, liabilities, income and expenditure of the foreignrepresentative offices and branches of the Bank have been converted at the closing rate prevailing on the balance sheetdate. The resultant gains or losses are recognised in the profit and loss account.
B. NOTES FORMING PART OF THE ACCOUNTS
1. Information about business and geographical segments
The Bank reports its operations into the following segments:
� Consumer and Commercial Banking comprising the retail and corporate banking business of the Bank.� Investment Banking comprising the treasury of the Bank.
Inter-segment transactions are generally based on transfer pricing measures as determined by management. Income,expenses, assets and liabilities are either specifically identified with individual segments or are allocated to segments ona systematic basis.
schedules
F15
forming part of the Accounts Continued
Based on such allocations, segmental Balance Sheet as on March 31, 2004 and segmental Profit & Loss account for theyear ended March 31, 2004 have been prepared.
(Rupees in million)
Consumer and Investment Totalcommercial banking banking
Particulars For the For the For the For the For the For theyear ended year ended year ended year ended year ended year ended
31.03.04 31.03.03 31.03.04 31.03.03 31.03.04 31.03.03
1. Revenue ................................... 95,819.3 92,717.0 34,819.3 29,157.5 130,638.6 121,874.5
2. Less :Inter segment revenue .. � � � � (11,049.0) (8,515.6)
3. Total revenue (1)�(2) ................. � � � � 119,589.6 113,358.9
4. Operating profit (i.e. Profitbefore unallocated expenses,extraordinary profit, and tax) .... 12,984.2 9,456.0 10,996.6 4,346.1 23,980.8 13,802.1
5. Unallocated expenses ............. � � � � 256.0 �
6. Profit on sale of shares of ICICIBank Limited held by erstwhileICICI Limited ............................. � � � 11,910.0 � 11,910.0
7. Provisions (net) ......................... 5,542.8 17,305.7 (840.1) 602.4 4,702.7 17,908.1
8. Profit before tax ........................ 7,441.4 (7,849.7) 11,836.7 15,653.7 19,022.1 7,804.0
9. Income tax expenses (net) /(net deferred tax credit) ............ � � � � 2,651.1 (4,257.8)
10. Net profit(8)�(9) ........................ � � � � 16,371.0 12,061.8
11. Segment assets ........................ 771,726.4 685,550.8 454,527.0 363,550.4 1,226,253.4 1,049,101.2
12. Unallocated assets ................... � � � � 26,035.3 19,018.5
13. Total assets(11)+(12) ............... � � � � 1,252,288.7 1,068,119.7
14. Segment liabilities ................... 978,706.4 800,361.9 273,582.3 267,757.8 1,252,288.7 1,068,119.7
15. Unallocated liabilities ............... � � � � � �
16. Total liabilities(14)+(15) ............ 978,706.4 800,361.9 273,582.3 267,757.8 1,252,288.7 1,068,119.7
The business operations of the Bank are largely concentrated in India. Activities outside India are restricted to resourcemobilisation in international markets. The assets and income from foreign operations are not significant to the overalloperations of the Bank and have accordingly not been disclosed.
2. Preference Shares
Certain Government securities amounting to Rs. 1,455.1 million (March 31, 2003: Rs. 1,244.8 million) have been earmarkedagainst redemption of preference share capital, which falls due for redemption on April 20, 2018 as per the original issueterms.
3. Subordinated Debt
Subordinated debt includes index bonds amounting to Rs. 110.4 million (March 31, 2003: Rs. 95.8 million) which carry adetachable warrant entitling bondholders to a right to receive an amount linked to the BSE Sensitive Index (�Sensex�) perterms of the issue. The liability of the Bank arising out of changes in the Sensex has been hedged by earmarking itsinvestments of an equivalent amount in the UTI Index Equity Fund whose value is based on the Sensex. The Bank has notissued any subordinated debt during the year.
schedules

F16
forming part of the Accounts Continued
4. Employee Stock Option Scheme
In terms of employee stock option scheme, the maximum number of options granted to any eligible employee in afinancial year shall not exceed 0.05% of the issued equity shares of the Bank at the time of grant of the options andaggregate of all such options granted to the eligible employees shall not exceed 5% of the aggregate number of theissued equity shares of the Bank subsequent to the amalgamation of ICICI, ICICI Capital Services Limited and ICICIPersonal Financial Services Limited with the Bank and the issuance of equity shares by the Bank pursuant to theamalgamation of ICICI, ICICI Capital Services Limited and ICICI Personal Financial Services Limited, with the Bank.
In terms of the Scheme, 15,964,982 options (March 31, 2003: 12,610,275 options) granted to eligible employees wereoutstanding at March 31, 2004.
A summary of the status of the Bank�s option plan is given below:Year ended Year ended
March 31, 2004 March 31, 2003
Option shares Option shares outstanding outstanding
Outstanding at the beginning of the year ................................................ 12,610,275 13,343,625Add:Granted during the year .................................................................... 7,491,800 �Less: Forfeited/lapsed during the year ..................................................... 766,489 730,350Exercised during the year ......................................................................... 3,370,604 3,000Outstanding at the end of the year .......................................................... 15,964,982 12,610,275
5. Early Retirement Option (�ERO�)
The Bank has implemented Early Retirement Option Scheme 2003 to its employees in July 2003. All employees who hadcompleted 40 years of age and seven years of service with the Bank (including period of service with entities amalgamatedwith the Bank) were eligible for the ERO.
In accordance with the treatment approved by the RBI, the ex-gratia payments under ERO and termination benefits andleave encashment in excess of the provisions made (net of tax benefits), aggregating to Rs. 1,910.0 million are beingamortised over a period of five years commencing August 1, 2003 (the date of retirement of employees exercising theOption being July 31, 2003).
During the year, an amount of Rs. 256.0 million has been charged to revenue on account of ERO Scheme being theproportionate amount amortised for the eight month period ended March 31, 2004.
6. Deferred Tax
On March 31, 2004, the Bank has recorded net deferred tax asset of Rs. 4,429.7 million (March 31, 2003 : Rs. 4,888.3million) which has been included in other assets.
A composition of deferred tax assets and liabilities into major items is given below:(Rupees in million)
Year ended Year endedMarch 31, 2004 March 31, 2003
Deferred tax assetAmortisation of premium on investments .............................................. � 527.4Provision for bad and doubtful debts ....................................................... 13,434.1 12,988.7Others ................................................................................................... 202.4 855.3
13,636.5 14,371.4Less: Deferred tax liability
Depreciation on fixed assets ....................................................... 8,970.6 9,246.9Others ............................................................................................ 236.2 236.2
9,206.8 9,483.1
Net Deferred Tax Asset/(Liability) ............................................................. 4,429.7 4,888.3
schedules
F17
forming part of the Accounts Continued
7. Related party transactions
The Bank has transactions with its subsidiaries (including joint ventures), associates (including joint ventures) and directors.The following represent the significant transactions between the Bank and such related parties:
Insurance services
During the year ended March 31, 2004 the Bank paid insurance premium to insurance joint ventures amounting toRs. 157.2 million (2003: Rs. 163.7 million). During the year ended March 31, 2004 the Bank received claims frominsurance subsidiaries amounting to Rs. 85.6 million (2003: Rs. 58.0 million).
Fees
During the year ended March 31, 2004 the Bank received fees from its insurance joint ventures amounting to Rs. 65.3million (2003: Rs. 17.1 million).
Lease of premises and facilities
During the year ended March 31, 2004, the Bank received for lease of premises, facilities and other administrative costsfrom subsidiaries and joint ventures amounting to Rs. 361.9 million (2003: Rs. 247.4 million).
Sale of housing loan portfolio
During the year ended March 31, 2004, the Bank sold housing loan portfolio to its subsidiaries amounting to Rs. 18,317.2million (2003: Rs. Nil).
Secondment of employees
During the year ended March 31, 2004, the Bank received Rs.14.2 million (2003: Rs. 27.7 million) from subsidiaries andjoint ventures for secondment of employees.
Sale of investments
During the year ended March 31, 2004, the Bank sold certain investments to its associates amounting to Rs. 3,234.1million (2003: Rs. 2,369.2 million). On the sales made to the associates, the Bank accounted for a gain of Rs. 199.2 million(2003: Rs. 542.7 million).
Reimbursement of expenses
During the year ended March 31, 2004, the Bank reimbursed expenses to its subsidiaries amounting to Rs. 2,075.7million (2003: Rs. 1,422.3 million).
Brokerage paid
During the year ended March 31, 2004, the Bank paid brokerage to its subsidiaries amounting to Rs. 5.7 million(2003: Rs. 1.5 million).
Custodial charges received
During the year ended March 31, 2004, the Bank received custodial charges from its associates amounting to Rs. 4.7million (2003: Rs. 7.6 million).
Interest paid
During the year ended March 31, 2004, the Bank paid interest to its subsidiaries and joint ventures amounting to Rs. 67.9million (2003: Rs.118.8 million) and to its associates amounting to Rs. 9.5 million (2003: Rs. 0.9 million).
Interest received
During the year ended March 31, 2004 the Bank received interest from its subsidiaries and joint ventures amounting toRs. 327.2 million (2003: Rs. 471.2 million) and from its Key Management Personnel@ Rs. 0.4 million (2003: Rs. 0.5million).
Dividend received
During the year ended March 31, 2004 the Bank received dividend from its subsidiaries and joint ventures amounting toRs. 1,289.7 million (2003: Rs. 1,094.2 million).
Remuneration to directors
Remuneration paid to the executive directors of the Bank during the year ended March 31, 2004 was Rs. 58.5 million(2003: Rs. 41.0 million).
schedules
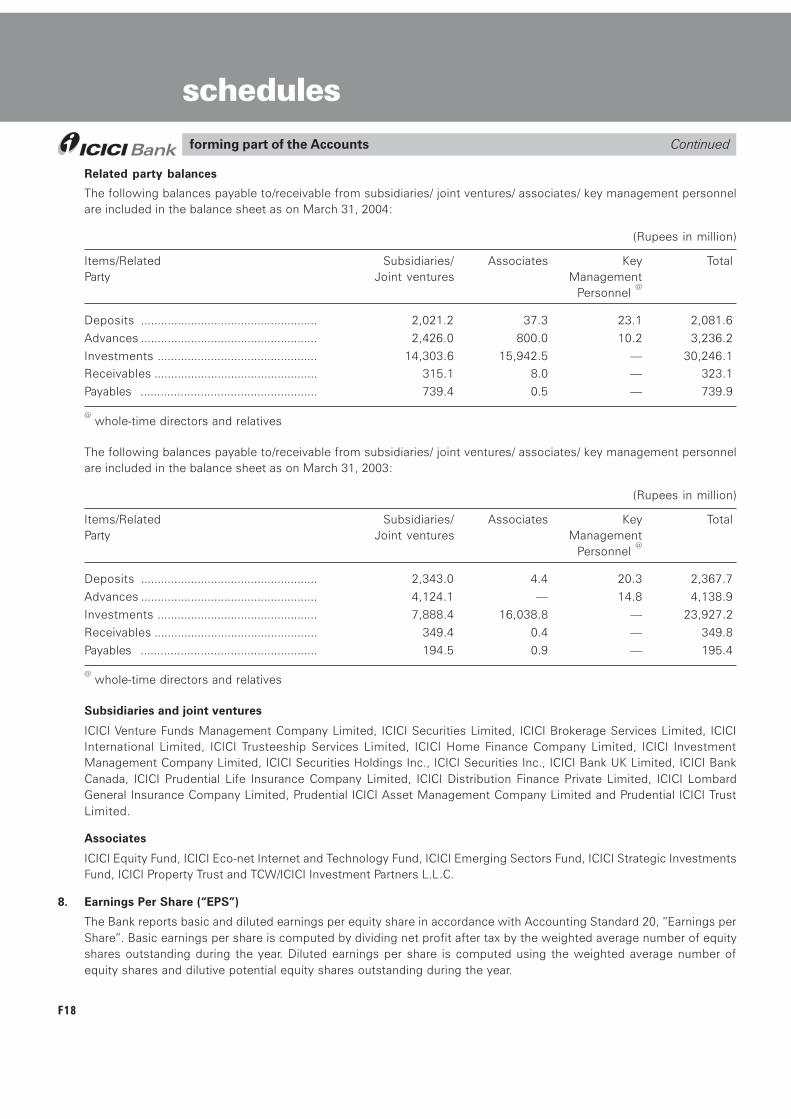
F18
forming part of the Accounts Continued
Related party balances
The following balances payable to/receivable from subsidiaries/ joint ventures/ associates/ key management personnelare included in the balance sheet as on March 31, 2004:
(Rupees in million)
Items/Related Subsidiaries/ Associates Key TotalParty Joint ventures Management
Personnel @
Deposits ..................................................... 2,021.2 37.3 23.1 2,081.6Advances ..................................................... 2,426.0 800.0 10.2 3,236.2Investments ................................................ 14,303.6 15,942.5 � 30,246.1Receivables ................................................. 315.1 8.0 � 323.1Payables ..................................................... 739.4 0.5 � 739.9
@ whole-time directors and relatives
The following balances payable to/receivable from subsidiaries/ joint ventures/ associates/ key management personnelare included in the balance sheet as on March 31, 2003:
(Rupees in million)
Items/Related Subsidiaries/ Associates Key TotalParty Joint ventures Management
Personnel @
Deposits ..................................................... 2,343.0 4.4 20.3 2,367.7Advances ..................................................... 4,124.1 � 14.8 4,138.9Investments ................................................ 7,888.4 16,038.8 � 23,927.2Receivables ................................................. 349.4 0.4 � 349.8Payables ..................................................... 194.5 0.9 � 195.4
@ whole-time directors and relatives
Subsidiaries and joint ventures
ICICI Venture Funds Management Company Limited, ICICI Securities Limited, ICICI Brokerage Services Limited, ICICIInternational Limited, ICICI Trusteeship Services Limited, ICICI Home Finance Company Limited, ICICI InvestmentManagement Company Limited, ICICI Securities Holdings Inc., ICICI Securities Inc., ICICI Bank UK Limited, ICICI BankCanada, ICICI Prudential Life Insurance Company Limited, ICICI Distribution Finance Private Limited, ICICI LombardGeneral Insurance Company Limited, Prudential ICICI Asset Management Company Limited and Prudential ICICI TrustLimited.
Associates
ICICI Equity Fund, ICICI Eco-net Internet and Technology Fund, ICICI Emerging Sectors Fund, ICICI Strategic InvestmentsFund, ICICI Property Trust and TCW/ICICI Investment Partners L.L.C.
8. Earnings Per Share (�EPS�)
The Bank reports basic and diluted earnings per equity share in accordance with Accounting Standard 20, �Earnings perShare�. Basic earnings per share is computed by dividing net profit after tax by the weighted average number of equityshares outstanding during the year. Diluted earnings per share is computed using the weighted average number ofequity shares and dilutive potential equity shares outstanding during the year.
schedules
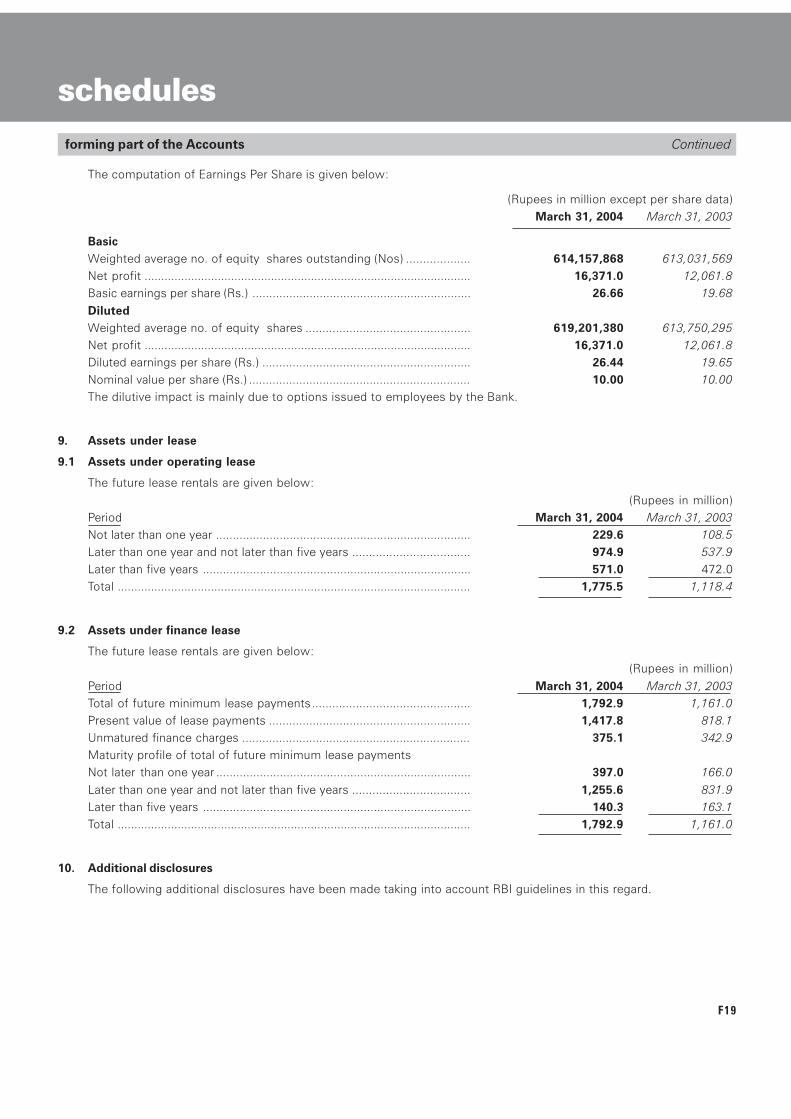
F19
forming part of the Accounts Continued
The computation of Earnings Per Share is given below:
(Rupees in million except per share data)March 31, 2004 March 31, 2003
BasicWeighted average no. of equity shares outstanding (Nos) ................... 614,157,868 613,031,569Net profit .................................................................................................. 16,371.0 12,061.8Basic earnings per share (Rs.) ................................................................. 26.66 19.68DilutedWeighted average no. of equity shares ................................................. 619,201,380 613,750,295Net profit .................................................................................................. 16,371.0 12,061.8Diluted earnings per share (Rs.) .............................................................. 26.44 19.65Nominal value per share (Rs.) .................................................................. 10.00 10.00The dilutive impact is mainly due to options issued to employees by the Bank.
9. Assets under lease
9.1 Assets under operating lease
The future lease rentals are given below:(Rupees in million)
Period March 31, 2004 March 31, 2003Not later than one year ............................................................................ 229.6 108.5Later than one year and not later than five years ................................... 974.9 537.9Later than five years ................................................................................ 571.0 472.0Total .......................................................................................................... 1,775.5 1,118.4
9.2 Assets under finance lease
The future lease rentals are given below:(Rupees in million)
Period March 31, 2004 March 31, 2003Total of future minimum lease payments............................................... 1,792.9 1,161.0Present value of lease payments ............................................................ 1,417.8 818.1Unmatured finance charges .................................................................... 375.1 342.9Maturity profile of total of future minimum lease paymentsNot later than one year ............................................................................ 397.0 166.0Later than one year and not later than five years ................................... 1,255.6 831.9Later than five years ................................................................................ 140.3 163.1Total .......................................................................................................... 1,792.9 1,161.0
10. Additional disclosures
The following additional disclosures have been made taking into account RBI guidelines in this regard.
schedules
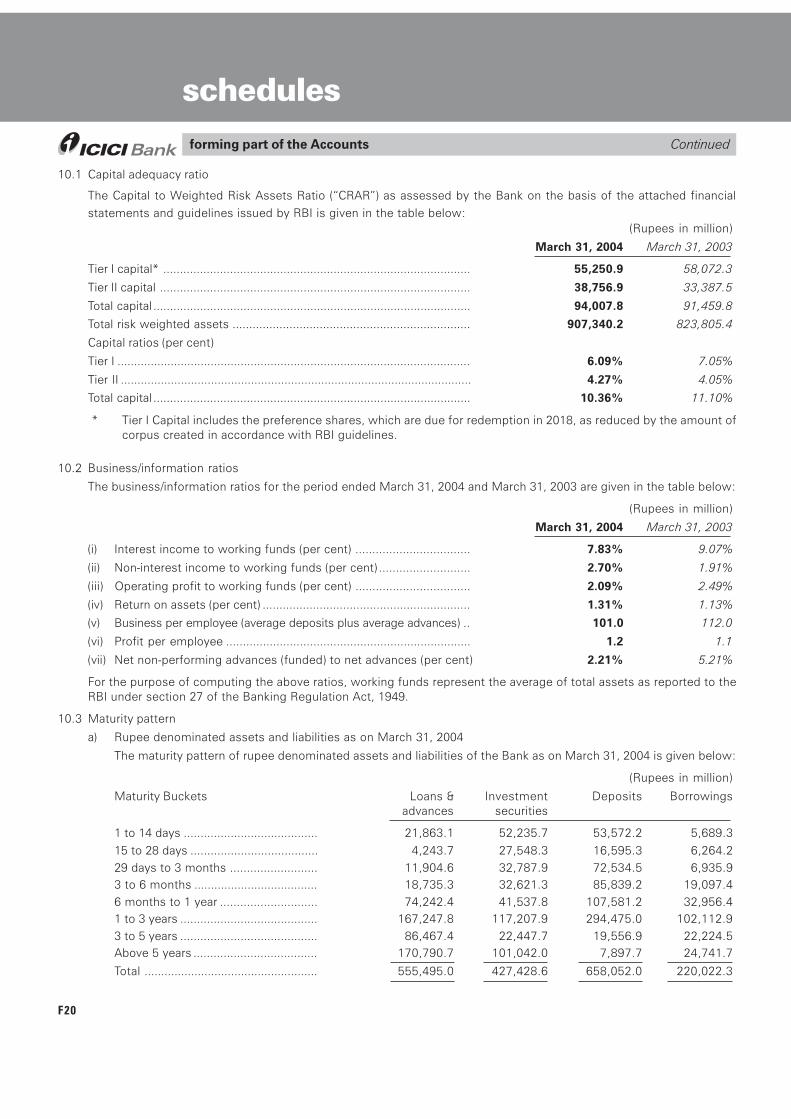
F20
schedulesforming part of the Accounts Continued
10.1 Capital adequacy ratio
The Capital to Weighted Risk Assets Ratio (�CRAR�) as assessed by the Bank on the basis of the attached financialstatements and guidelines issued by RBI is given in the table below:
(Rupees in million)
March 31, 2004 March 31, 2003
Tier I capital* ............................................................................................ 55,250.9 58,072.3
Tier II capital ............................................................................................. 38,756.9 33,387.5
Total capital ............................................................................................... 94,007.8 91,459.8
Total risk weighted assets ....................................................................... 907,340.2 823,805.4
Capital ratios (per cent)
Tier I .......................................................................................................... 6.09% 7.05%
Tier II ......................................................................................................... 4.27% 4.05%
Total capital ............................................................................................... 10.36% 11.10%
* Tier I Capital includes the preference shares, which are due for redemption in 2018, as reduced by the amount ofcorpus created in accordance with RBI guidelines.
10.2 Business/information ratios
The business/information ratios for the period ended March 31, 2004 and March 31, 2003 are given in the table below:
(Rupees in million)
March 31, 2004 March 31, 2003
(i) Interest income to working funds (per cent) .................................. 7.83% 9.07%
(ii) Non-interest income to working funds (per cent) ........................... 2.70% 1.91%
(iii) Operating profit to working funds (per cent) .................................. 2.09% 2.49%
(iv) Return on assets (per cent) .............................................................. 1.31% 1.13%
(v) Business per employee (average deposits plus average advances) .. 101.0 112.0
(vi) Profit per employee ......................................................................... 1.2 1.1
(vii) Net non-performing advances (funded) to net advances (per cent) 2.21% 5.21%
For the purpose of computing the above ratios, working funds represent the average of total assets as reported to theRBI under section 27 of the Banking Regulation Act, 1949.
10.3 Maturity pattern
a) Rupee denominated assets and liabilities as on March 31, 2004
The maturity pattern of rupee denominated assets and liabilities of the Bank as on March 31, 2004 is given below:
(Rupees in million)
Maturity Buckets Loans & Investment Deposits Borrowings advances securities
1 to 14 days ........................................ 21,863.1 52,235.7 53,572.2 5,689.315 to 28 days ...................................... 4,243.7 27,548.3 16,595.3 6,264.229 days to 3 months .......................... 11,904.6 32,787.9 72,534.5 6,935.93 to 6 months ..................................... 18,735.3 32,621.3 85,839.2 19,097.46 months to 1 year ............................. 74,242.4 41,537.8 107,581.2 32,956.41 to 3 years ......................................... 167,247.8 117,207.9 294,475.0 102,112.93 to 5 years ......................................... 86,467.4 22,447.7 19,556.9 22,224.5Above 5 years ..................................... 170,790.7 101,042.0 7,897.7 24,741.7
Total .................................................... 555,495.0 427,428.6 658,052.0 220,022.3
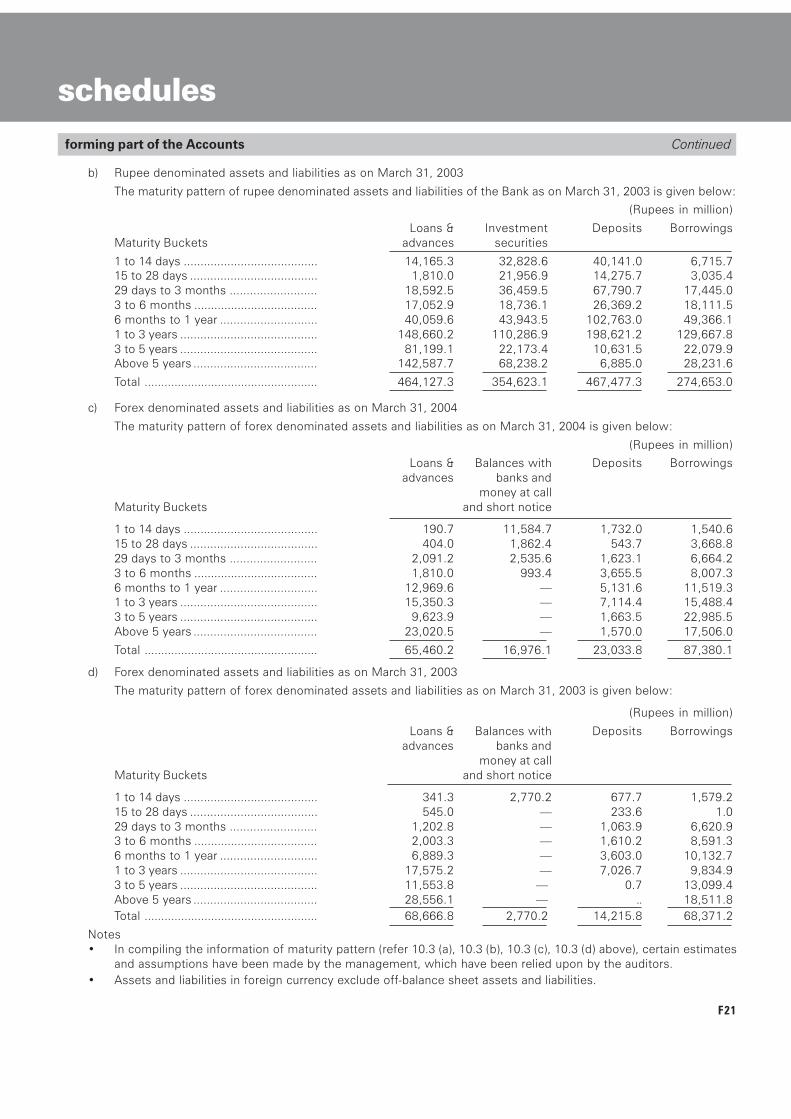
F21
forming part of the Accounts Continued
schedules
b) Rupee denominated assets and liabilities as on March 31, 2003
The maturity pattern of rupee denominated assets and liabilities of the Bank as on March 31, 2003 is given below:
(Rupees in million)
Loans & Investment Deposits BorrowingsMaturity Buckets advances securities
1 to 14 days ........................................ 14,165.3 32,828.6 40,141.0 6,715.715 to 28 days ...................................... 1,810.0 21,956.9 14,275.7 3,035.429 days to 3 months .......................... 18,592.5 36,459.5 67,790.7 17,445.03 to 6 months ..................................... 17,052.9 18,736.1 26,369.2 18,111.56 months to 1 year ............................. 40,059.6 43,943.5 102,763.0 49,366.11 to 3 years ......................................... 148,660.2 110,286.9 198,621.2 129,667.83 to 5 years ......................................... 81,199.1 22,173.4 10,631.5 22,079.9Above 5 years ..................................... 142,587.7 68,238.2 6,885.0 28,231.6
Total .................................................... 464,127.3 354,623.1 467,477.3 274,653.0
c) Forex denominated assets and liabilities as on March 31, 2004
The maturity pattern of forex denominated assets and liabilities as on March 31, 2004 is given below:
(Rupees in million)
Loans & Balances with Deposits Borrowings advances banks and
money at callMaturity Buckets and short notice
1 to 14 days ........................................ 190.7 11,584.7 1,732.0 1,540.615 to 28 days ...................................... 404.0 1,862.4 543.7 3,668.829 days to 3 months .......................... 2,091.2 2,535.6 1,623.1 6,664.23 to 6 months ..................................... 1,810.0 993.4 3,655.5 8,007.36 months to 1 year ............................. 12,969.6 � 5,131.6 11,519.31 to 3 years ......................................... 15,350.3 � 7,114.4 15,488.43 to 5 years ......................................... 9,623.9 � 1,663.5 22,985.5Above 5 years ..................................... 23,020.5 � 1,570.0 17,506.0
Total .................................................... 65,460.2 16,976.1 23,033.8 87,380.1
d) Forex denominated assets and liabilities as on March 31, 2003
The maturity pattern of forex denominated assets and liabilities as on March 31, 2003 is given below:
(Rupees in million)
Loans & Balances with Deposits Borrowings advances banks and
money at callMaturity Buckets and short notice
1 to 14 days ........................................ 341.3 2,770.2 677.7 1,579.215 to 28 days ...................................... 545.0 � 233.6 1.029 days to 3 months .......................... 1,202.8 � 1,063.9 6,620.93 to 6 months ..................................... 2,003.3 � 1,610.2 8,591.36 months to 1 year ............................. 6,889.3 � 3,603.0 10,132.71 to 3 years ......................................... 17,575.2 � 7,026.7 9,834.93 to 5 years ......................................... 11,553.8 � 0.7 13,099.4Above 5 years ..................................... 28,556.1 � .. 18,511.8Total .................................................... 68,666.8 2,770.2 14,215.8 68,371.2
Notes� In compiling the information of maturity pattern (refer 10.3 (a), 10.3 (b), 10.3 (c), 10.3 (d) above), certain estimates
and assumptions have been made by the management, which have been relied upon by the auditors.� Assets and liabilities in foreign currency exclude off-balance sheet assets and liabilities.
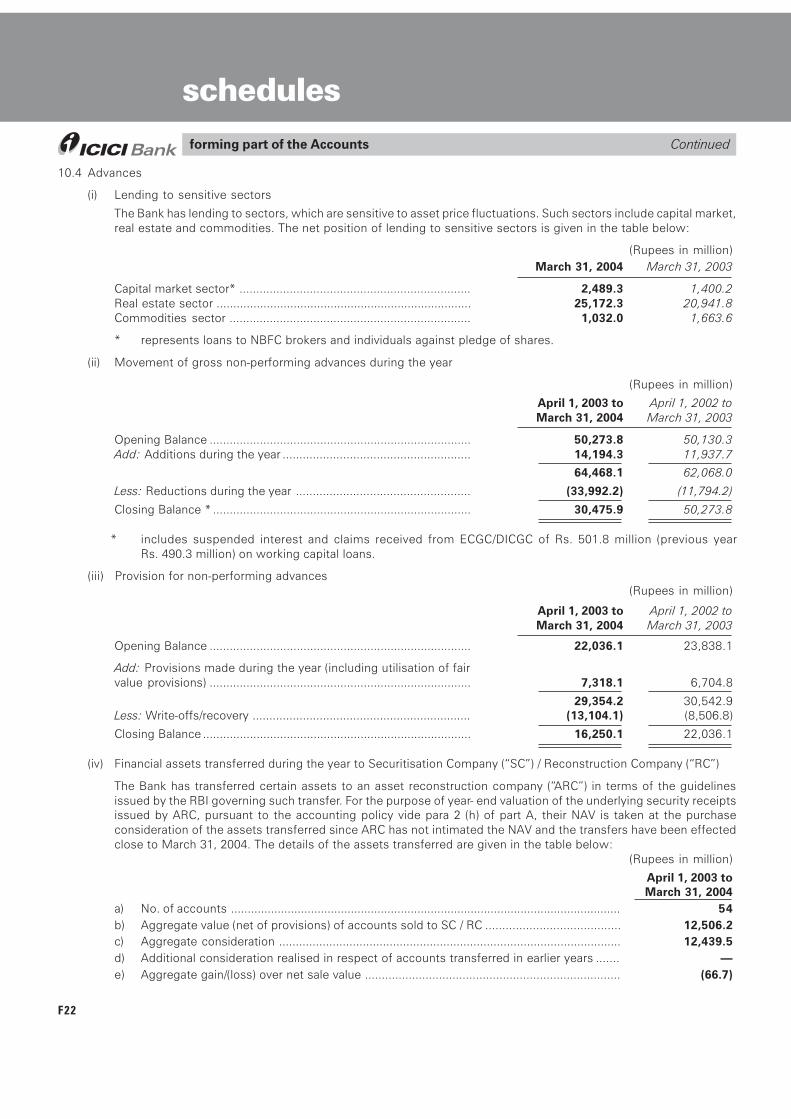
F22
schedulesforming part of the Accounts Continued
10.4 Advances
(i) Lending to sensitive sectors
The Bank has lending to sectors, which are sensitive to asset price fluctuations. Such sectors include capital market,real estate and commodities. The net position of lending to sensitive sectors is given in the table below:
(Rupees in million)March 31, 2004 March 31, 2003
Capital market sector* ..................................................................... 2,489.3 1,400.2Real estate sector ............................................................................ 25,172.3 20,941.8Commodities sector ........................................................................ 1,032.0 1,663.6
* represents loans to NBFC brokers and individuals against pledge of shares.
(ii) Movement of gross non-performing advances during the year
(Rupees in million)
April 1, 2003 to April 1, 2002 to March 31, 2004 March 31, 2003
Opening Balance .............................................................................. 50,273.8 50,130.3Add: Additions during the year ........................................................ 14,194.3 11,937.7
64,468.1 62,068.0
Less: Reductions during the year .................................................... (33,992.2) (11,794.2)
Closing Balance * ............................................................................. 30,475.9 50,273.8
* includes suspended interest and claims received from ECGC/DICGC of Rs. 501.8 million (previous yearRs. 490.3 million) on working capital loans.
(iii) Provision for non-performing advances(Rupees in million)
April 1, 2003 to April 1, 2002 to March 31, 2004 March 31, 2003
Opening Balance .............................................................................. 22,036.1 23,838.1
Add: Provisions made during the year (including utilisation of fairvalue provisions) .............................................................................. 7,318.1 6,704.8
29,354.2 30,542.9Less: Write-offs/recovery ................................................................. (13,104.1) (8,506.8)
Closing Balance ................................................................................ 16,250.1 22,036.1
(iv) Financial assets transferred during the year to Securitisation Company (�SC�) / Reconstruction Company (�RC�)
The Bank has transferred certain assets to an asset reconstruction company (�ARC�) in terms of the guidelinesissued by the RBI governing such transfer. For the purpose of year- end valuation of the underlying security receiptsissued by ARC, pursuant to the accounting policy vide para 2 (h) of part A, their NAV is taken at the purchaseconsideration of the assets transferred since ARC has not intimated the NAV and the transfers have been effectedclose to March 31, 2004. The details of the assets transferred are given in the table below:
(Rupees in million)
April 1, 2003 toMarch 31, 2004
a) No. of accounts ..................................................................................................................... 54b) Aggregate value (net of provisions) of accounts sold to SC / RC ........................................ 12,506.2c) Aggregate consideration ...................................................................................................... 12,439.5d) Additional consideration realised in respect of accounts transferred in earlier years ....... �e) Aggregate gain/(loss) over net sale value ............................................................................ (66.7)
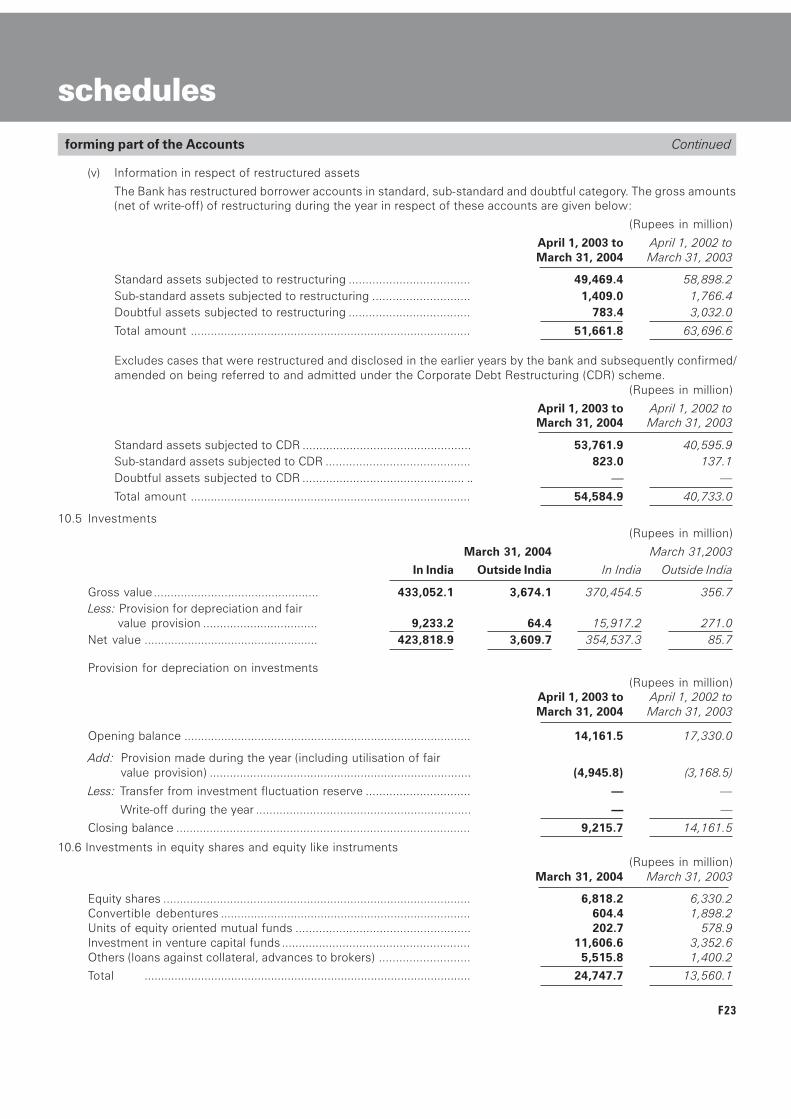
F23
(v) Information in respect of restructured assets
The Bank has restructured borrower accounts in standard, sub-standard and doubtful category. The gross amounts(net of write-off) of restructuring during the year in respect of these accounts are given below:
(Rupees in million)
April 1, 2003 to April 1, 2002 to March 31, 2004 March 31, 2003
Standard assets subjected to restructuring .................................... 49,469.4 58,898.2Sub-standard assets subjected to restructuring ............................. 1,409.0 1,766.4Doubtful assets subjected to restructuring .................................... 783.4 3,032.0
Total amount .................................................................................... 51,661.8 63,696.6
Excludes cases that were restructured and disclosed in the earlier years by the bank and subsequently confirmed/amended on being referred to and admitted under the Corporate Debt Restructuring (CDR) scheme.
(Rupees in million)
April 1, 2003 to April 1, 2002 to March 31, 2004 March 31, 2003
Standard assets subjected to CDR .................................................. 53,761.9 40,595.9Sub-standard assets subjected to CDR ........................................... 823.0 137.1Doubtful assets subjected to CDR ................................................ .. � �
Total amount .................................................................................... 54,584.9 40,733.0
10.5 Investments(Rupees in million)
March 31, 2004 March 31,2003
In India Outside India In India Outside India
Gross value ................................................. 433,052.1 3,674.1 370,454.5 356.7Less: Provision for depreciation and fair
value provision .................................. 9,233.2 64.4 15,917.2 271.0Net value .................................................... 423,818.9 3,609.7 354,537.3 85.7
Provision for depreciation on investments(Rupees in million)
April 1, 2003 to April 1, 2002 to March 31, 2004 March 31, 2003
Opening balance ...................................................................................... 14,161.5 17,330.0
Add: Provision made during the year (including utilisation of fairvalue provision) .............................................................................. (4,945.8) (3,168.5)
Less: Transfer from investment fluctuation reserve ............................... � �
Write-off during the year ................................................................ � �
Closing balance ........................................................................................ 9,215.7 14,161.5
10.6 Investments in equity shares and equity like instruments(Rupees in million)
March 31, 2004 March 31, 2003
Equity shares ............................................................................................ 6,818.2 6,330.2Convertible debentures ........................................................................... 604.4 1,898.2Units of equity oriented mutual funds .................................................... 202.7 578.9Investment in venture capital funds ........................................................ 11,606.6 3,352.6Others (loans against collateral, advances to brokers) ........................... 5,515.8 1,400.2
Total .................................................................................................. 24,747.7 13,560.1
forming part of the Accounts Continued
schedules
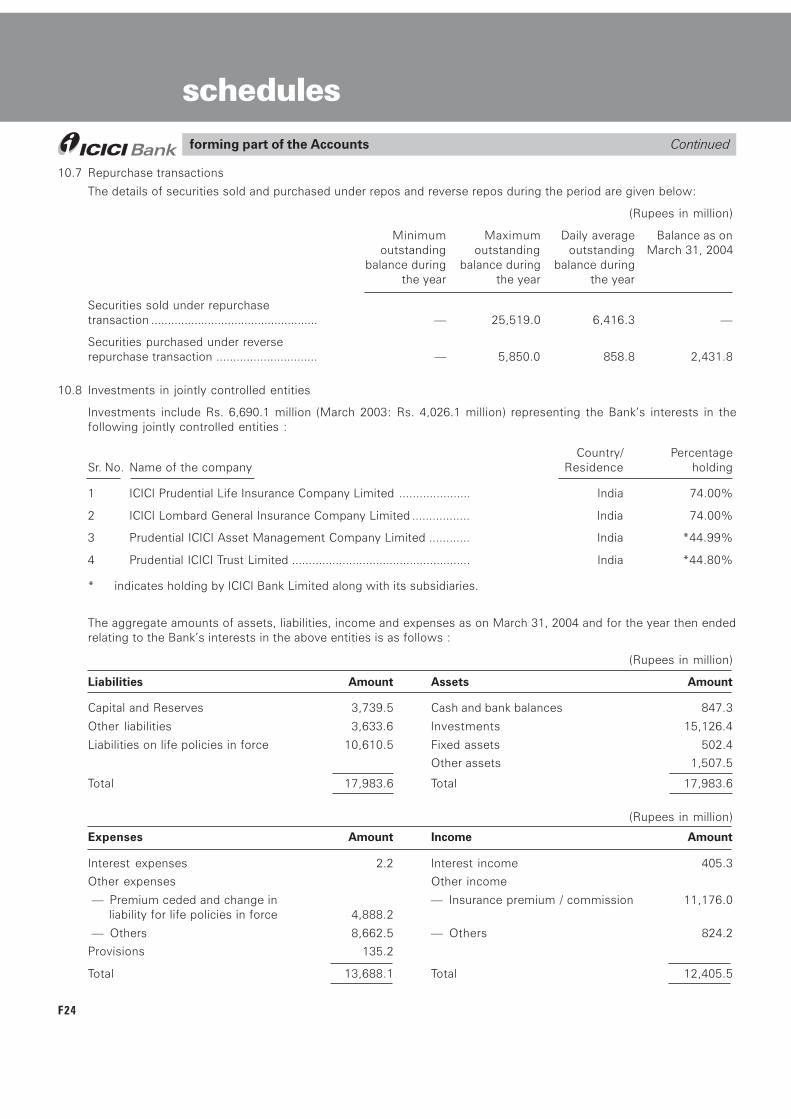
F24
10.7 Repurchase transactions
The details of securities sold and purchased under repos and reverse repos during the period are given below:
(Rupees in million)
Minimum Maximum Daily average Balance as onoutstanding outstanding outstanding March 31, 2004
balance during balance during balance during the year the year the year
Securities sold under repurchasetransaction .................................................. � 25,519.0 6,416.3 �
Securities purchased under reverserepurchase transaction .............................. � 5,850.0 858.8 2,431.8
10.8 Investments in jointly controlled entities
Investments include Rs. 6,690.1 million (March 2003: Rs. 4,026.1 million) representing the Bank�s interests in thefollowing jointly controlled entities :
Country/ PercentageSr. No. Name of the company Residence holding
1 ICICI Prudential Life Insurance Company Limited ..................... India 74.00%
2 ICICI Lombard General Insurance Company Limited ................. India 74.00%
3 Prudential ICICI Asset Management Company Limited ............ India *44.99%
4 Prudential ICICI Trust Limited ..................................................... India *44.80%
* indicates holding by ICICI Bank Limited along with its subsidiaries.
The aggregate amounts of assets, liabilities, income and expenses as on March 31, 2004 and for the year then endedrelating to the Bank�s interests in the above entities is as follows :
(Rupees in million)
Liabilities Amount Assets Amount
Capital and Reserves 3,739.5 Cash and bank balances 847.3
Other liabilities 3,633.6 Investments 15,126.4
Liabilities on life policies in force 10,610.5 Fixed assets 502.4
Other assets 1,507.5
Total 17,983.6 Total 17,983.6
(Rupees in million)
Expenses Amount Income Amount
Interest expenses 2.2 Interest income 405.3
Other expenses Other income
� Premium ceded and change in � Insurance premium / commission 11,176.0liability for life policies in force 4,888.2
� Others 8,662.5 � Others 824.2
Provisions 135.2
Total 13,688.1 Total 12,405.5
schedulesforming part of the Accounts Continued
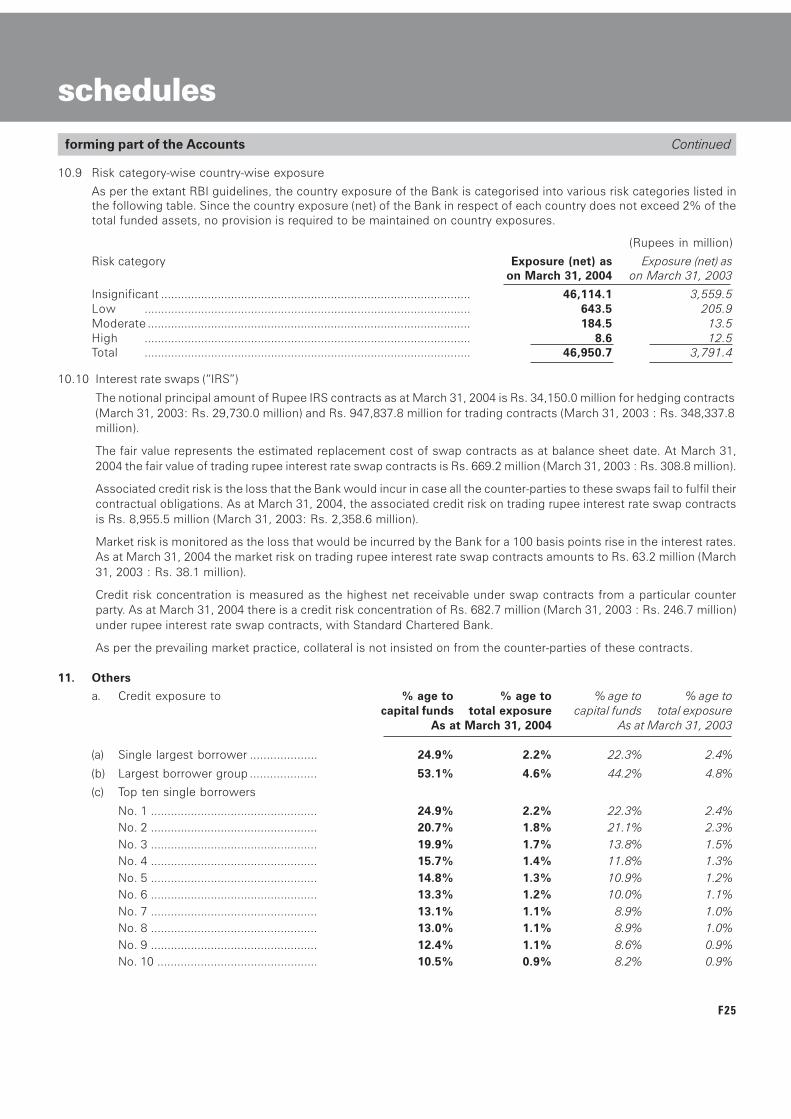
F25
10.9 Risk category-wise country-wise exposure
As per the extant RBI guidelines, the country exposure of the Bank is categorised into various risk categories listed inthe following table. Since the country exposure (net) of the Bank in respect of each country does not exceed 2% of thetotal funded assets, no provision is required to be maintained on country exposures.
(Rupees in million)
Risk category Exposure (net) as Exposure (net) ason March 31, 2004 on March 31, 2003
Insignificant ............................................................................................. 46,114.1 3,559.5Low .................................................................................................. 643.5 205.9Moderate ................................................................................................. 184.5 13.5High .................................................................................................. 8.6 12.5Total .................................................................................................. 46,950.7 3,791.4
10.10 Interest rate swaps (�IRS�)
The notional principal amount of Rupee IRS contracts as at March 31, 2004 is Rs. 34,150.0 million for hedging contracts(March 31, 2003: Rs. 29,730.0 million) and Rs. 947,837.8 million for trading contracts (March 31, 2003 : Rs. 348,337.8million).
The fair value represents the estimated replacement cost of swap contracts as at balance sheet date. At March 31,2004 the fair value of trading rupee interest rate swap contracts is Rs. 669.2 million (March 31, 2003 : Rs. 308.8 million).
Associated credit risk is the loss that the Bank would incur in case all the counter-parties to these swaps fail to fulfil theircontractual obligations. As at March 31, 2004, the associated credit risk on trading rupee interest rate swap contractsis Rs. 8,955.5 million (March 31, 2003: Rs. 2,358.6 million).
Market risk is monitored as the loss that would be incurred by the Bank for a 100 basis points rise in the interest rates.As at March 31, 2004 the market risk on trading rupee interest rate swap contracts amounts to Rs. 63.2 million (March31, 2003 : Rs. 38.1 million).
Credit risk concentration is measured as the highest net receivable under swap contracts from a particular counterparty. As at March 31, 2004 there is a credit risk concentration of Rs. 682.7 million (March 31, 2003 : Rs. 246.7 million)under rupee interest rate swap contracts, with Standard Chartered Bank.
As per the prevailing market practice, collateral is not insisted on from the counter-parties of these contracts.
11. Others
a. Credit exposure to % age to % age to % age to % age tocapital funds total exposure capital funds total exposure
As at March 31, 2004 As at March 31, 2003
(a) Single largest borrower .................... 24.9% 2.2% 22.3% 2.4%
(b) Largest borrower group .................... 53.1% 4.6% 44.2% 4.8%
(c) Top ten single borrowers
No. 1 .................................................. 24.9% 2.2% 22.3% 2.4%No. 2 .................................................. 20.7% 1.8% 21.1% 2.3%No. 3 .................................................. 19.9% 1.7% 13.8% 1.5%No. 4 .................................................. 15.7% 1.4% 11.8% 1.3%No. 5 .................................................. 14.8% 1.3% 10.9% 1.2%No. 6 .................................................. 13.3% 1.2% 10.0% 1.1%No. 7 .................................................. 13.1% 1.1% 8.9% 1.0%No. 8 .................................................. 13.0% 1.1% 8.9% 1.0%No. 9 .................................................. 12.4% 1.1% 8.6% 0.9%No. 10 ................................................ 10.5% 0.9% 8.2% 0.9%
forming part of the Accounts Continued
schedules
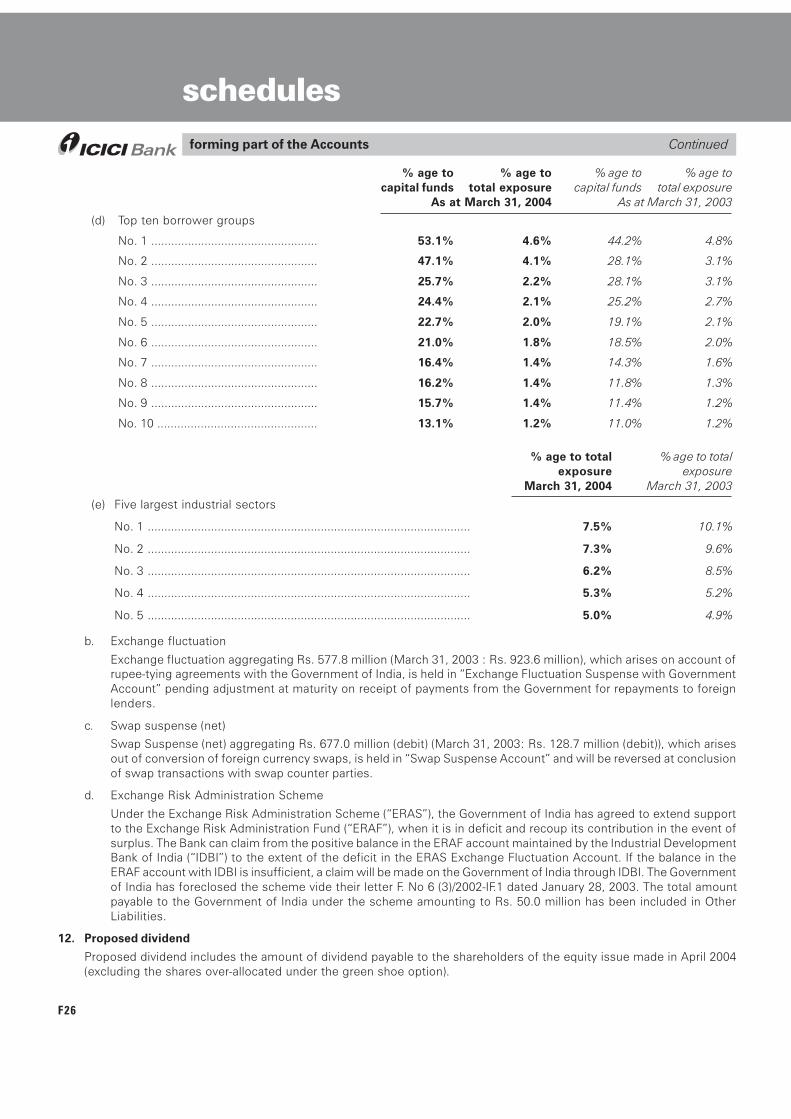
F26
schedulesforming part of the Accounts Continued
% age to % age to % age to % age tocapital funds total exposure capital funds total exposure
As at March 31, 2004 As at March 31, 2003
(d) Top ten borrower groups
No. 1 .................................................. 53.1% 4.6% 44.2% 4.8%
No. 2 .................................................. 47.1% 4.1% 28.1% 3.1%
No. 3 .................................................. 25.7% 2.2% 28.1% 3.1%
No. 4 .................................................. 24.4% 2.1% 25.2% 2.7%
No. 5 .................................................. 22.7% 2.0% 19.1% 2.1%
No. 6 .................................................. 21.0% 1.8% 18.5% 2.0%
No. 7 .................................................. 16.4% 1.4% 14.3% 1.6%
No. 8 .................................................. 16.2% 1.4% 11.8% 1.3%
No. 9 .................................................. 15.7% 1.4% 11.4% 1.2%
No. 10 ................................................ 13.1% 1.2% 11.0% 1.2%
% age to total % age to totalexposure exposure
March 31, 2004 March 31, 2003
(e) Five largest industrial sectors
No. 1 ................................................................................................. 7.5% 10.1%
No. 2 ................................................................................................. 7.3% 9.6%
No. 3 ................................................................................................. 6.2% 8.5%
No. 4 ................................................................................................. 5.3% 5.2%
No. 5 ................................................................................................. 5.0% 4.9%
b. Exchange fluctuation
Exchange fluctuation aggregating Rs. 577.8 million (March 31, 2003 : Rs. 923.6 million), which arises on account ofrupee-tying agreements with the Government of India, is held in �Exchange Fluctuation Suspense with GovernmentAccount� pending adjustment at maturity on receipt of payments from the Government for repayments to foreignlenders.
c. Swap suspense (net)
Swap Suspense (net) aggregating Rs. 677.0 million (debit) (March 31, 2003: Rs. 128.7 million (debit)), which arisesout of conversion of foreign currency swaps, is held in �Swap Suspense Account� and will be reversed at conclusionof swap transactions with swap counter parties.
d. Exchange Risk Administration Scheme
Under the Exchange Risk Administration Scheme (�ERAS�), the Government of India has agreed to extend supportto the Exchange Risk Administration Fund (�ERAF�), when it is in deficit and recoup its contribution in the event ofsurplus. The Bank can claim from the positive balance in the ERAF account maintained by the Industrial DevelopmentBank of India (�IDBI�) to the extent of the deficit in the ERAS Exchange Fluctuation Account. If the balance in theERAF account with IDBI is insufficient, a claim will be made on the Government of India through IDBI. The Governmentof India has foreclosed the scheme vide their letter F. No 6 (3)/2002-IF.1 dated January 28, 2003. The total amountpayable to the Government of India under the scheme amounting to Rs. 50.0 million has been included in OtherLiabilities.
12. Proposed dividend
Proposed dividend includes the amount of dividend payable to the shareholders of the equity issue made in April 2004(excluding the shares over-allocated under the green shoe option).
F27
forming part of the Accounts Continued
schedules
13. Cash and cash equivalents
Cash and cash equivalents include cash in hand, balances with RBI, balances with other banks and money at call and shortnotice.
14. Contingent liability
The Income-tax authorities have disallowed deduction in respect of specific provisions for bad debts made by erstwhileICICI Limited in prior years on account of retrospective amendment to section 36(1)(vii) of the Income Tax Act, 1961 (the�Act�). The total potential tax impact of such disallowances is Rs. 2,765.9 million, which is included in the contingentliability and is disputed by the Bank in appeals. Based on a legal opinion, the Bank is of the view that the disputed amountwould alternatively be deductible under the provisions of the Act as business loss. Further, as the provision is taxdeductible in the year of write-off, the Bank is eligible to create a deferred tax asset and accordingly, there is no revenueimpact.
15. Comparative figures
Figures of the previous year have been regrouped to conform to the current year�s presentation.
Signatures To Schedules 1 To 18 For and on behalf of the Board of Directors
N. VAGHULChairman
LALITA D. GUPTEJoint Managing Director
CHANDA D. KOCHHAR Executive Director
N. S. KANNANChief Financial Officer &
Treasurer
K. V. KAMATHManaging Director & CEO
KALPANA MORPARIADeputy Managing Director
NACHIKET MOR Executive Director
G. VENKATAKRISHNANGeneral Manager -
Accounting & Taxation Group
JYOTIN MEHTA General Manager &Company Secretary
For S. R. BATLIBOI & CO.Chartered Accountants
per VIREN H. MEHTAa Partner
Place : MumbaiDate : April 30, 2004
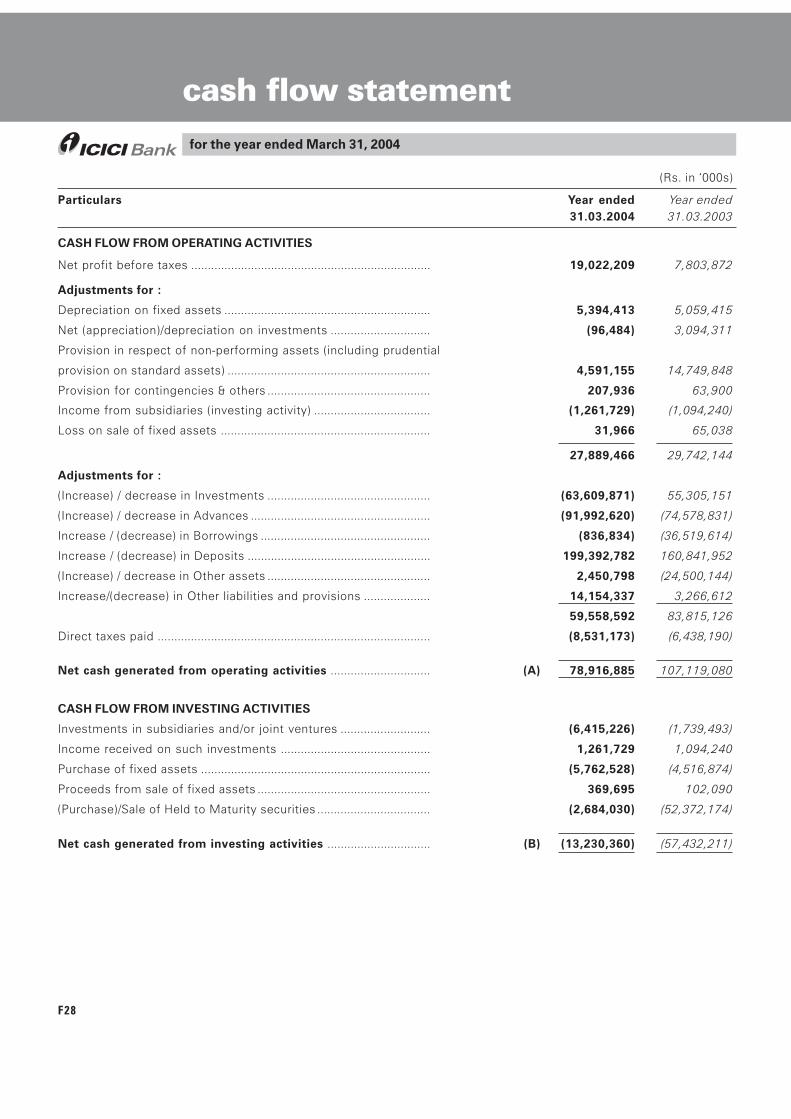
F28
cash flow statementfor the year ended March 31, 2004
(Rs. in �000s)
Particulars Year ended Year ended31.03.2004 31.03.2003
CASH FLOW FROM OPERATING ACTIVITIES
Net profit before taxes ........................................................................ 19,022,209 7,803,872
Adjustments for :
Depreciation on fixed assets .............................................................. 5,394,413 5,059,415
Net (appreciation)/depreciation on investments .............................. (96,484) 3,094,311
Provision in respect of non-performing assets (including prudential
provision on standard assets) ............................................................. 4,591,155 14,749,848
Provision for contingencies & others ................................................. 207,936 63,900
Income from subsidiaries (investing activity) ................................... (1,261,729) (1,094,240)
Loss on sale of fixed assets ............................................................... 31,966 65,038
27,889,466 29,742,144
Adjustments for :
(Increase) / decrease in Investments ................................................. (63,609,871) 55,305,151
(Increase) / decrease in Advances ...................................................... (91,992,620) (74,578,831)
Increase / (decrease) in Borrowings ................................................... (836,834) (36,519,614)
Increase / (decrease) in Deposits ....................................................... 199,392,782 160,841,952
(Increase) / decrease in Other assets ................................................. 2,450,798 (24,500,144)
Increase/(decrease) in Other liabilities and provisions .................... 14,154,337 3,266,612
59,558,592 83,815,126
Direct taxes paid .................................................................................. (8,531,173) (6,438,190)
Net cash generated from operating activities .............................. (A) 78,916,885 107,119,080
CASH FLOW FROM INVESTING ACTIVITIES
Investments in subsidiaries and/or joint ventures ........................... (6,415,226) (1,739,493)
Income received on such investments ............................................. 1,261,729 1,094,240
Purchase of fixed assets ..................................................................... (5,762,528) (4,516,874)
Proceeds from sale of fixed assets .................................................... 369,695 102,090
(Purchase)/Sale of Held to Maturity securities .................................. (2,684,030) (52,372,174)
Net cash generated from investing activities ............................... (B) (13,230,360) (57,432,211)
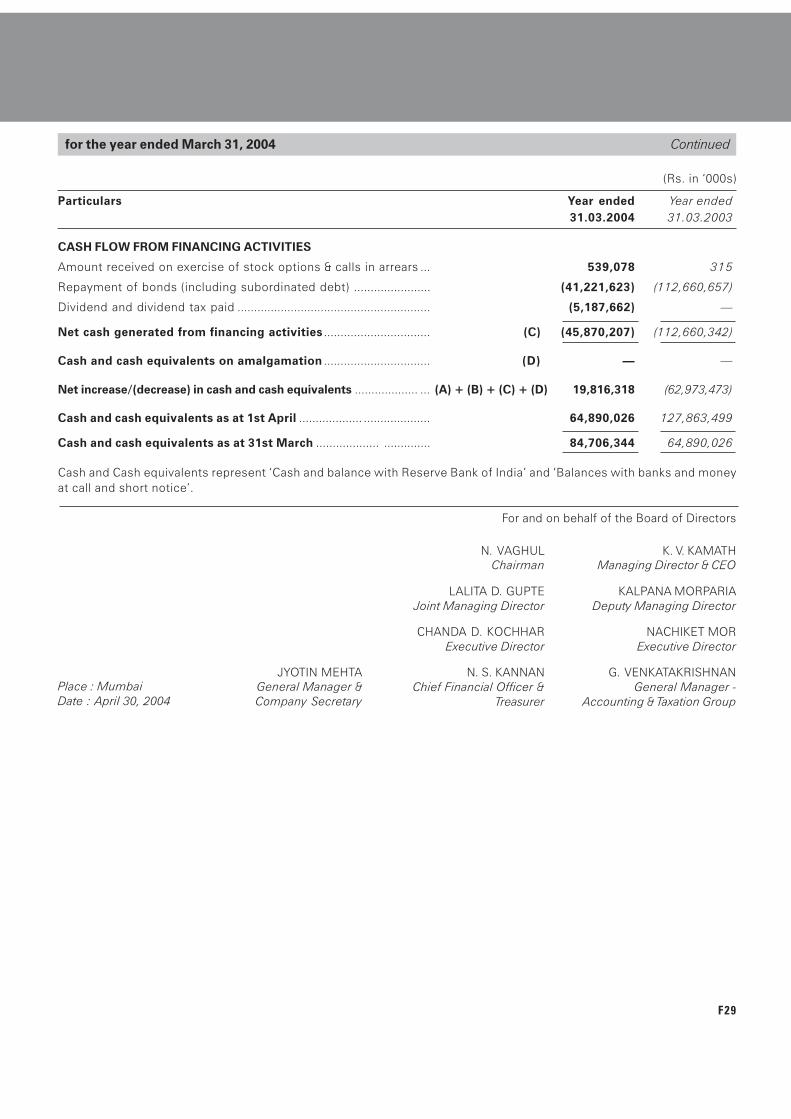
F29
For and on behalf of the Board of Directors
N. VAGHULChairman
LALITA D. GUPTEJoint Managing Director
CHANDA D. KOCHHAR Executive Director
N. S. KANNANChief Financial Officer &
Treasurer
K. V. KAMATHManaging Director & CEO
KALPANA MORPARIADeputy Managing Director
NACHIKET MOR Executive Director
G. VENKATAKRISHNANGeneral Manager -
Accounting & Taxation Group
JYOTIN MEHTA General Manager &Company Secretary
Place : MumbaiDate : April 30, 2004
CASH FLOW FROM FINANCING ACTIVITIES
Amount received on exercise of stock options & calls in arrears ... 539,078 315
Repayment of bonds (including subordinated debt) ....................... (41,221,623) (112,660,657)
Dividend and dividend tax paid .......................................................... (5,187,662) �
Net cash generated from financing activities ................................ (C) (45,870,207) (112,660,342)
Cash and cash equivalents on amalgamation ................................ (D) � �
Net increase/(decrease) in cash and cash equivalents ................... ... (A) + (B) + (C) + (D) 19,816,318 (62,973,473)
Cash and cash equivalents as at 1st April ................... .................... 64,890,026 127,863,499
Cash and cash equivalents as at 31st March ................... .............. 84,706,344 64,890,026
Cash and Cash equivalents represent �Cash and balance with Reserve Bank of India� and �Balances with banks and moneyat call and short notice�.
(Rs. in �000s)
Particulars Year ended Year ended31.03.2004 31.03.2003
for the year ended March 31, 2004 Continued
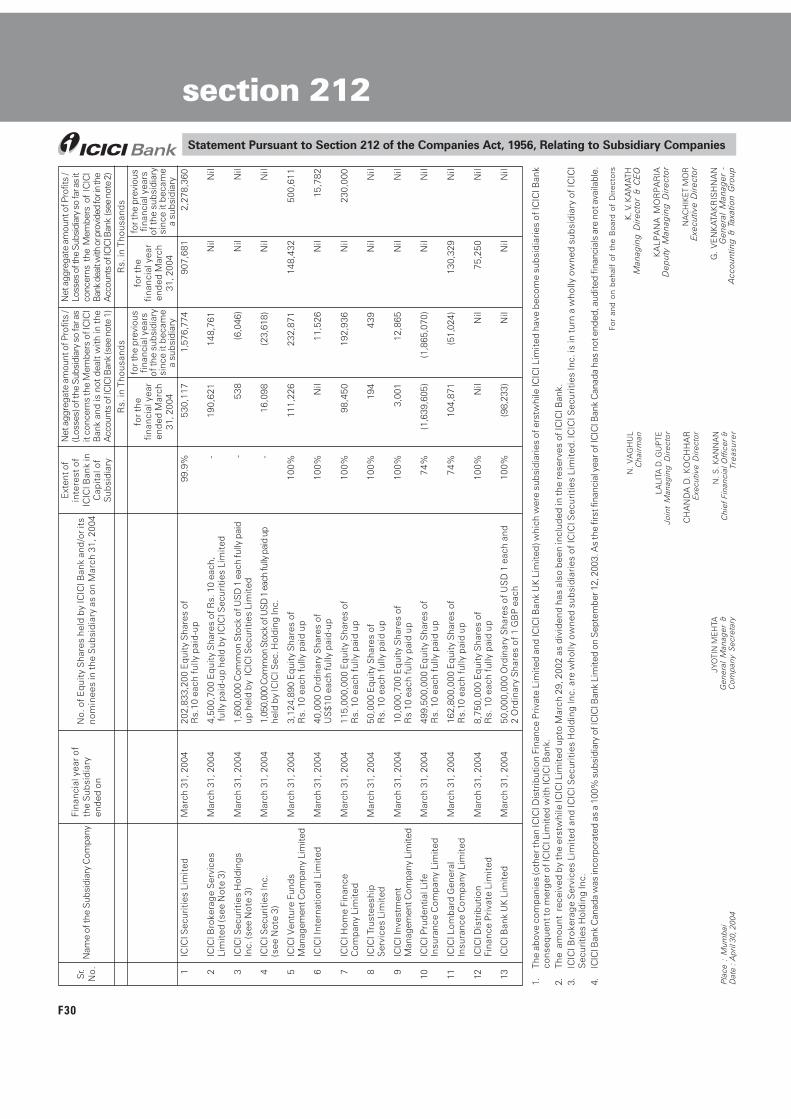
F30
For
and
on b
ehal
f of
the
Boa
rd o
f D
irec
tors
N.
VA
GH
UL
Cha
irm
an
LALI
TA D
. GU
PTE
Join
t M
anag
ing
Dir
ecto
r
CH
AN
DA
D. K
OC
HH
AR
Exe
cutiv
e D
irec
tor
N. S
. KA
NN
AN
Chi
ef F
inan
cial
Off
icer
&Tr
eas
ure
r
K. V
. KA
MAT
HM
anag
ing
Dir
ecto
r &
CE
O
KA
LPA
NA
MO
RP
AR
IAD
eput
y M
anag
ing
Dir
ecto
r
NA
CH
IKE
T M
OR
Exe
cutiv
e D
irec
tor
G.
VE
NK
ATA
KR
ISH
NA
NG
ener
al M
anag
er -
Acc
ount
ing
& T
axat
ion
Gro
up
JYO
TIN
ME
HTA
Gen
eral
Man
ager
&C
omp
any
Secr
etar
y
Statement Pursuant to Section 212 of the Companies Act, 1956, Relating to Subsidiary Companies
1.Th
e ab
ove
com
pani
es (o
ther
than
ICIC
I Dis
trib
utio
n Fi
nanc
e P
rivat
e Li
mite
d an
d IC
ICI B
ank
UK
Lim
ited)
whi
ch w
ere
subs
idia
ries
of e
rstw
hile
ICIC
I Lim
ited
have
bec
ome
subs
idia
ries
of IC
ICI B
ank
cons
eque
nt to
mer
ger o
f IC
ICI L
imite
d w
ith IC
ICI B
ank.
2.Th
e a
mou
nt r
ecei
ved
by th
e er
stw
hile
ICIC
I Lim
ited
upt
o M
arch
29,
200
2 as
div
iden
d ha
s al
so b
een
incl
uded
in th
e re
serv
es o
f IC
ICI B
ank.
3.IC
ICI B
roke
rag
e S
ervi
ces
Lim
ited
and
ICIC
I Sec
urit
ies
Hol
ding
Inc.
are
who
lly o
wne
d s
ubsi
diar
ies
of IC
ICI S
ecur
itie
s Li
mit
ed. I
CIC
I Sec
urit
ies
Inc.
is in
turn
a w
holly
ow
ned
subs
idia
ry o
f IC
ICI
Sec
uriti
es H
oldi
ng In
c.4.
ICIC
I Ban
k C
anad
a w
as in
corp
orat
ed a
s a
100%
sub
sidi
ary
of IC
ICI B
ank
Lim
ited
on S
epte
mbe
r 12,
200
3. A
s th
e fir
st fi
nanc
ial y
ear o
f IC
ICI B
ank
Can
ada
has
not e
nded
, aud
ited
finan
cial
s ar
e no
t ava
ilabl
e.
1IC
ICI S
ecur
ities
Lim
ited
Mar
ch 3
1, 2
004
202,
833,
200
Equ
ity S
hare
s of
99.9
%53
0,11
71,
576,
774
907,
681
2,2
78,3
60R
s.10
eac
h fu
lly p
aid-
up
2IC
ICI B
roke
rage
Ser
vice
sM
arch
31,
200
44,
500,
700
Equ
ity S
hare
s of
Rs.
10
each
,-
190
,621
148
,761
Nil
Nil
Lim
ited
(see
Not
e 3)
fully
pai
d-up
hel
d by
ICIC
I Sec
uriti
es L
imite
d
3IC
ICI S
ecur
ities
Hol
ding
sM
arch
31,
200
41,
600,
000
Com
mon
Sto
ck o
f USD
1 e
ach
fully
pai
d-
538
(6,0
46)
Nil
Nil
Inc.
(see
Not
e 3)
up h
eld
by I
CIC
I Sec
uriti
es L
imite
d
4IC
ICI S
ecur
ities
Inc.
Mar
ch 3
1, 2
004
1,05
0,00
0 C
omm
on S
tock
of U
SD 1
eac
h fu
lly p
aid
up-
16,
098
(23,
618)
Nil
Nil
(see
Not
e 3)
held
by
ICIC
I Sec
. Hol
ding
Inc.
5IC
ICI V
entu
re F
unds
Mar
ch 3
1, 2
004
3,12
4,89
0 E
quity
Sha
res
of10
0% 1
11,2
26 2
32,8
71 1
48,4
32 5
00,6
11M
anag
emen
t Com
pany
Lim
ited
Rs.
10
each
fully
pai
d up
6IC
ICI I
nter
natio
nal L
imite
dM
arch
31,
200
440
,000
Ord
inar
y S
hare
s of
100%
Nil
11,
526
Nil
15,
782
US
$10
each
fully
pai
d-up
7IC
ICI H
ome
Fina
nce
Mar
ch 3
1, 2
004
115,
000,
000
Equ
ity S
hare
s of
100%
98,
450
192
,936
Nil
230
,000
Com
pany
Lim
ited
Rs.
10
each
fully
pai
d up
8IC
ICI T
rust
eesh
ipM
arch
31,
200
450
,000
Equ
ity S
hare
s of
100%
194
439
Nil
Nil
Ser
vice
s Li
mite
dR
s. 1
0 ea
ch fu
lly p
aid
up
9IC
ICI I
nves
tmen
tM
arch
31,
200
410
,000
,700
Equ
ity S
hare
s of
100%
3,0
01 1
2,86
5 N
il N
ilM
anag
emen
t Com
pany
Lim
ited
Rs
10 e
ach
fully
pai
d up
10IC
ICI P
rude
ntia
l Life
Mar
ch 3
1, 2
004
499,
500,
000
Equ
ity S
hare
s of
74%
(1,6
39,6
05)
(1,8
65,0
70)
Nil
Nil
Insu
ranc
e C
ompa
ny L
imit
edR
s. 1
0 ea
ch fu
lly p
aid
up
11IC
ICI L
omba
rd G
ener
alM
arch
31,
200
416
2,80
0,00
0 E
quity
Sha
res
of74
% 1
04,8
71 (5
1,02
4) 1
30,3
29 N
ilIn
sura
nce
Com
pany
Lim
ited
Rs.
10 e
ach
fully
pai
d up
12IC
ICI D
istr
ibut
ion
Mar
ch 3
1, 2
004
8,75
0,00
0 E
quity
Sha
res
of10
0% N
il N
il 7
5,25
0 N
ilFi
nanc
e P
riva
te L
imit
edR
s. 1
0 ea
ch fu
lly p
aid
up
13IC
ICI B
ank
UK
Lim
ited
Mar
ch 3
1, 2
004
50,0
00,0
00 O
rdin
ary
Sha
res
of U
SD
1 e
ach
and
100%
(98,
233)
Nil
Nil
Nil
2 O
rdin
ary
Sha
res
of 1
GB
P e
ach
Sr.
No.
Nam
e of
the
Subs
idia
ry C
ompa
nyFi
nanc
ial y
ear o
fth
e S
ubsi
diar
yen
ded
on
No.
of E
quit
y S
hare
s he
ld b
y IC
ICI B
ank
and/
or it
sno
min
ees
in th
e S
ubsi
diar
y as
on
Mar
ch 3
1, 2
004
Ext
ent o
fin
tere
st o
fIC
ICI B
ank
inC
apit
al o
fS
ubsi
diar
y
Net
agg
rega
te a
mou
nt o
f Pro
fits
/(L
osse
s) o
f the
Sub
sidi
ary
so fa
r as
it co
ncer
ns th
e M
embe
rs o
f IC
ICI
Ban
k an
d is
not
dea
lt w
ith in
the
Acc
ount
s of
ICIC
I Ban
k (s
ee n
ote
1)
Net
agg
rega
te a
mou
nt o
f Pro
fits
/Lo
sses
of t
he S
ubsi
diar
y so
far a
s it
conc
erns
the
Mem
bers
of
ICIC
IBa
nk d
ealt w
ith o
r pro
vided
for in
the
Acc
ount
s of
ICIC
I Ban
k (s
ee n
ote
2)R
s. in
Tho
usan
dsR
s. in
Tho
usan
ds
for t
hefi
nanc
ial y
ear
ende
d M
arch
31, 2
004
for t
hefi
nanc
ial y
ear
ende
d M
arch
31, 2
004
for t
he p
revi
ous
finan
cial
yea
rsof
the
subs
idia
rysi
nce
it be
cam
ea
subs
idia
ry
for t
he p
revi
ous
finan
cial
yea
rsof
the
subs
idia
rysi
nce
it be
cam
ea
subs
idia
ry
Pla
ce :
Mum
bai
Dat
e : A
pril
30, 2
004
section 212
F31
Consolidated financial statements ofICICI Bank Limited and
its subsidiaries
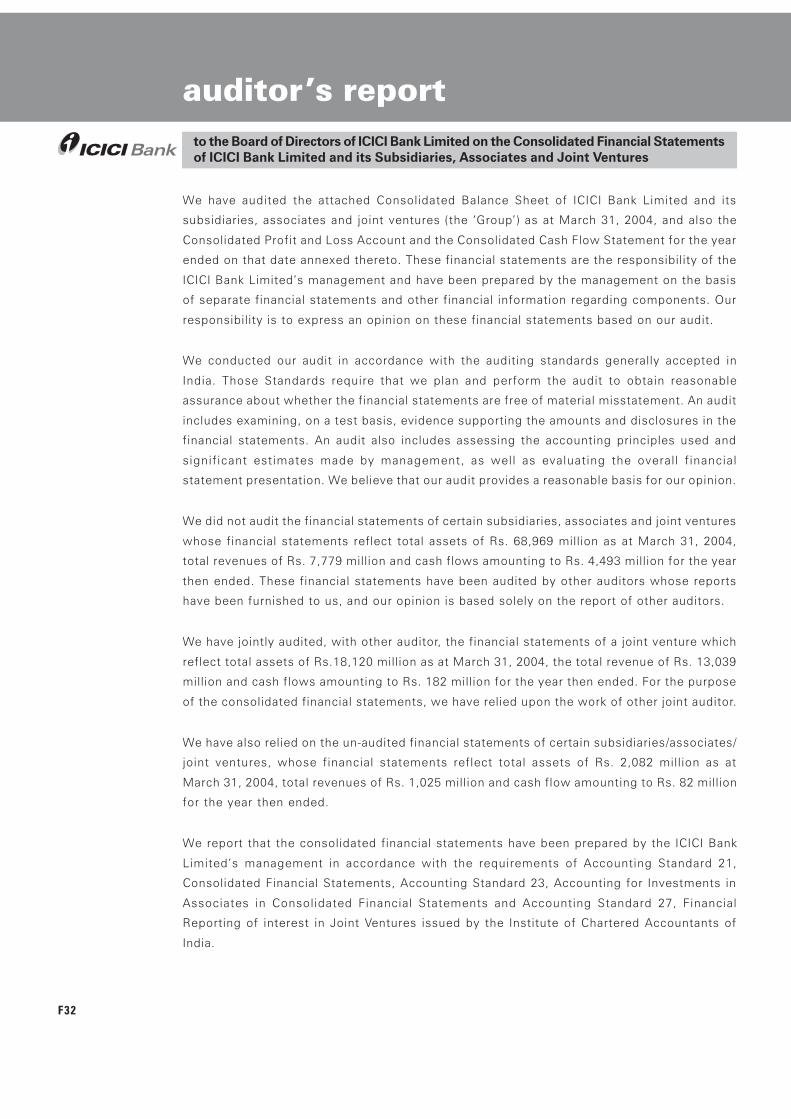
F32
auditor�s reportto the Board of Directors of ICICI Bank Limited on the Consolidated Financial Statementsof ICICI Bank Limited and its Subsidiaries, Associates and Joint Ventures
We have audited the attached Consolidated Balance Sheet of ICICI Bank Limited and its
subsidiaries, associates and joint ventures (the �Group�) as at March 31, 2004, and also the
Consolidated Profit and Loss Account and the Consolidated Cash Flow Statement for the year
ended on that date annexed thereto. These financial statements are the responsibility of the
ICICI Bank Limited�s management and have been prepared by the management on the basis
of separate financial statements and other financial information regarding components. Our
responsibility is to express an opinion on these financial statements based on our audit.
We conducted our audit in accordance with the auditing standards generally accepted in
India. Those Standards require that we plan and perform the audit to obtain reasonable
assurance about whether the financial statements are free of material misstatement. An audit
includes examining, on a test basis, evidence supporting the amounts and disclosures in the
financial statements. An audit also includes assessing the accounting principles used and
significant estimates made by management, as well as evaluating the overall financial
statement presentation. We believe that our audit provides a reasonable basis for our opinion.
We did not audit the financial statements of certain subsidiaries, associates and joint ventures
whose financial statements reflect total assets of Rs. 68,969 million as at March 31, 2004,
total revenues of Rs. 7,779 million and cash flows amounting to Rs. 4,493 million for the year
then ended. These financial statements have been audited by other auditors whose reports
have been furnished to us, and our opinion is based solely on the report of other auditors.
We have jointly audited, with other auditor, the financial statements of a joint venture which
reflect total assets of Rs.18,120 million as at March 31, 2004, the total revenue of Rs. 13,039
million and cash flows amounting to Rs. 182 million for the year then ended. For the purpose
of the consolidated financial statements, we have relied upon the work of other joint auditor.
We have also relied on the un-audited financial statements of certain subsidiaries/associates/
joint ventures, whose financial statements reflect total assets of Rs. 2,082 million as at
March 31, 2004, total revenues of Rs. 1,025 million and cash flow amounting to Rs. 82 million
for the year then ended.
We report that the consolidated financial statements have been prepared by the ICICI Bank
Limited�s management in accordance with the requirements of Accounting Standard 21,
Consolidated Financial Statements, Accounting Standard 23, Accounting for Investments in
Associates in Consolidated Financial Statements and Accounting Standard 27, Financial
Reporting of interest in Joint Ventures issued by the Institute of Chartered Accountants of
India.

F33
Based on our audit and on consideration of reports of other auditors on separate financial
statements and on the consideration of the un-audited financial statements and on the other
financial information of the components, and to the best of our information and according to
explanations given to us, we are of the opinion that the attached consolidated financial
statements gives a true and fair view in conformity with the accounting principles generally
accepted in India:
a. in the case of the consolidated balance sheet, of the state of affairs of the Group as at
March 31, 2004;
b. in the case of the consolidated profit and loss account, of the profit for the year ended on
that date; and
c. in the case of the consolidated cash flow statement, the cash flows for the year ended on
that date.
For S. R. BATLIBOI & CO.Chartered Accountants
per VIREN H. MEHTAa Partner
Membership No.: 048749Mumbai: April 30, 2004
Continued
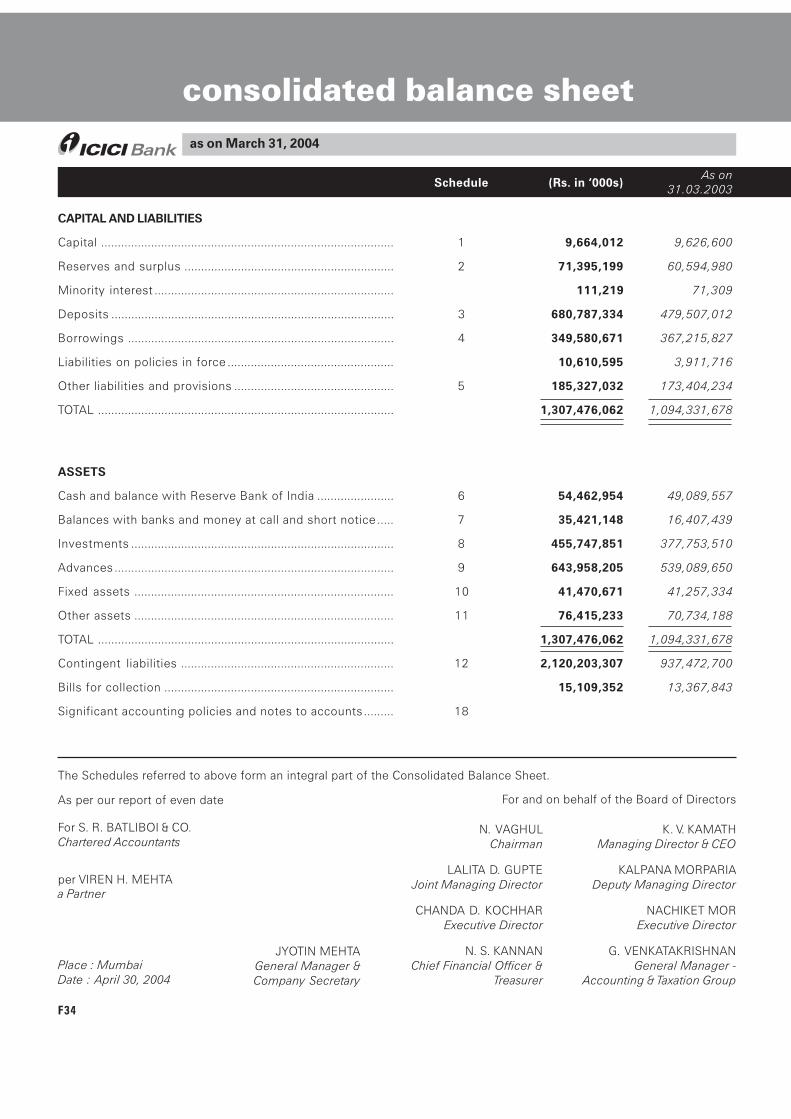
F34
consolidated balance sheet
As onSchedule (Rs. in �000s) 31.03.2003
CAPITAL AND LIABILITIES
Capital ........................................................................................ 1 9,664,012 9,626,600
Reserves and surplus ............................................................... 2 71,395,199 60,594,980
Minority interest ........................................................................ 111,219 71,309
Deposits ..................................................................................... 3 680,787,334 479,507,012
Borrowings ................................................................................ 4 349,580,671 367,215,827
Liabilities on policies in force .................................................. 10,610,595 3,911,716
Other liabilities and provisions ................................................ 5 185,327,032 173,404,234
TOTAL ......................................................................................... 1,307,476,062 1,094,331,678
ASSETS
Cash and balance with Reserve Bank of India ....................... 6 54,462,954 49,089,557
Balances with banks and money at call and short notice ..... 7 35,421,148 16,407,439
Investments ............................................................................... 8 455,747,851 377,753,510
Advances .................................................................................... 9 643,958,205 539,089,650
Fixed assets .............................................................................. 10 41,470,671 41,257,334
Other assets .............................................................................. 11 76,415,233 70,734,188
TOTAL ......................................................................................... 1,307,476,062 1,094,331,678
Contingent liabilities ................................................................ 12 2,120,203,307 937,472,700
Bills for collection ..................................................................... 15,109,352 13,367,843
Significant accounting policies and notes to accounts......... 18
N. VAGHULChairman
LALITA D. GUPTEJoint Managing Director
CHANDA D. KOCHHAR Executive Director
N. S. KANNANChief Financial Officer &
Treasurer
K. V. KAMATHManaging Director & CEO
KALPANA MORPARIADeputy Managing Director
NACHIKET MOR Executive Director
G. VENKATAKRISHNANGeneral Manager -
Accounting & Taxation Group
JYOTIN MEHTA General Manager &Company Secretary
For S. R. BATLIBOI & CO.Chartered Accountants
per VIREN H. MEHTAa Partner
Place : MumbaiDate : April 30, 2004
As per our report of even date For and on behalf of the Board of Directors
The Schedules referred to above form an integral part of the Consolidated Balance Sheet.
as on March 31, 2004
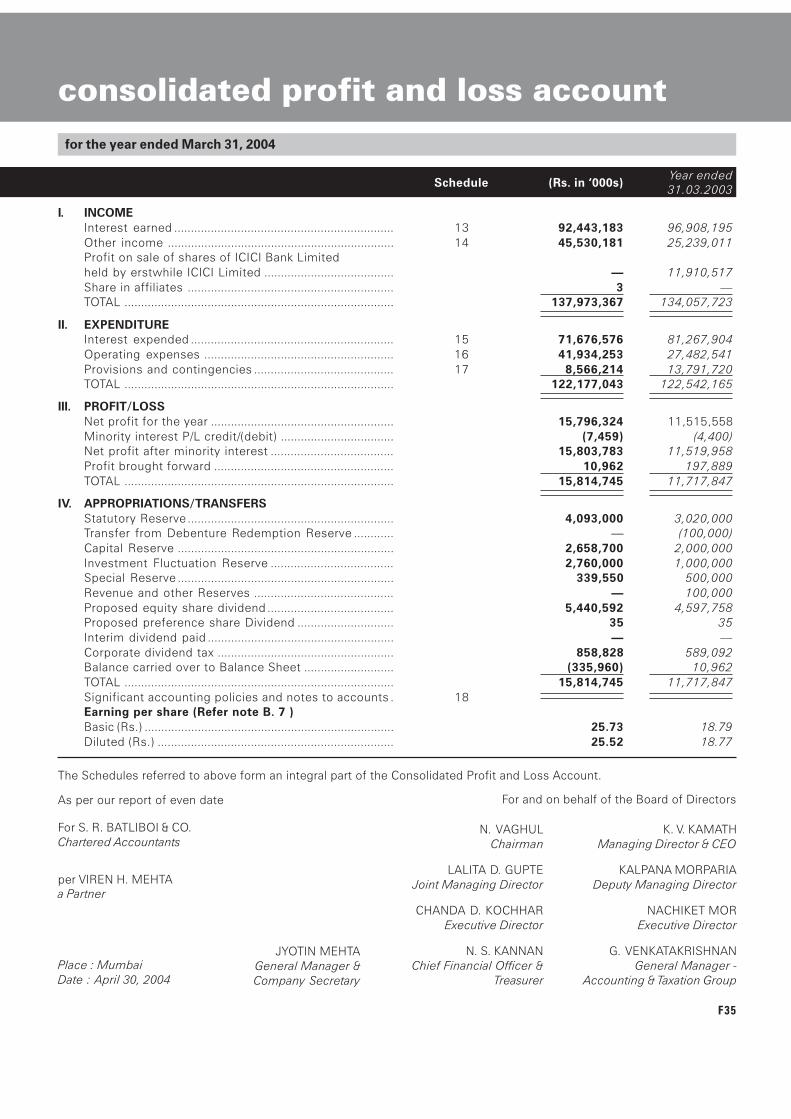
F35
consolidated profit and loss account
I. INCOMEInterest earned .................................................................. 13 92,443,183 96,908,195Other income .................................................................... 14 45,530,181 25,239,011Profit on sale of shares of ICICI Bank Limitedheld by erstwhile ICICI Limited ....................................... � 11,910,517Share in affiliates .............................................................. 3 �TOTAL ................................................................................. 137,973,367 134,057,723
II. EXPENDITUREInterest expended ............................................................. 15 71,676,576 81,267,904Operating expenses ......................................................... 16 41,934,253 27,482,541Provisions and contingencies .......................................... 17 8,566,214 13,791,720TOTAL ................................................................................. 122,177,043 122,542,165
III. PROFIT/LOSSNet profit for the year ....................................................... 15,796,324 11,515,558Minority interest P/L credit/(debit) .................................. (7,459) (4,400)Net profit after minority interest ..................................... 15,803,783 11,519,958Profit brought forward ...................................................... 10,962 197,889TOTAL ................................................................................. 15,814,745 11,717,847
IV. APPROPRIATIONS/TRANSFERSStatutory Reserve .............................................................. 4,093,000 3,020,000Transfer from Debenture Redemption Reserve ............ � (100,000)Capital Reserve ................................................................. 2,658,700 2,000,000Investment Fluctuation Reserve ..................................... 2,760,000 1,000,000Special Reserve ................................................................. 339,550 500,000Revenue and other Reserves .......................................... � 100,000Proposed equity share dividend ...................................... 5,440,592 4,597,758Proposed preference share Dividend ............................. 35 35Interim dividend paid ........................................................ � �Corporate dividend tax ..................................................... 858,828 589,092Balance carried over to Balance Sheet ........................... (335,960) 10,962TOTAL ................................................................................. 15,814,745 11,717,847Significant accounting policies and notes to accounts . 18Earning per share (Refer note B. 7 )Basic (Rs.) ........................................................................... 25.73 18.79Diluted (Rs.) ....................................................................... 25.52 18.77
for the year ended March 31, 2004
JYOTIN MEHTA General Manager &Company Secretary
For S. R. BATLIBOI & CO.Chartered Accountants
per VIREN H. MEHTAa Partner
Place : MumbaiDate : April 30, 2004
As per our report of even date For and on behalf of the Board of Directors
The Schedules referred to above form an integral part of the Consolidated Profit and Loss Account.
N. VAGHULChairman
LALITA D. GUPTEJoint Managing Director
CHANDA D. KOCHHARExecutive Director
N. S. KANNANChief Financial Officer &
Treasurer
K. V. KAMATHManaging Director & CEO
KALPANA MORPARIADeputy Managing Director
NACHIKET MOR Executive Director
G. VENKATAKRISHNANGeneral Manager -
Accounting & Taxation Group
Year endedSchedule (Rs. in �000s) 31.03.2003
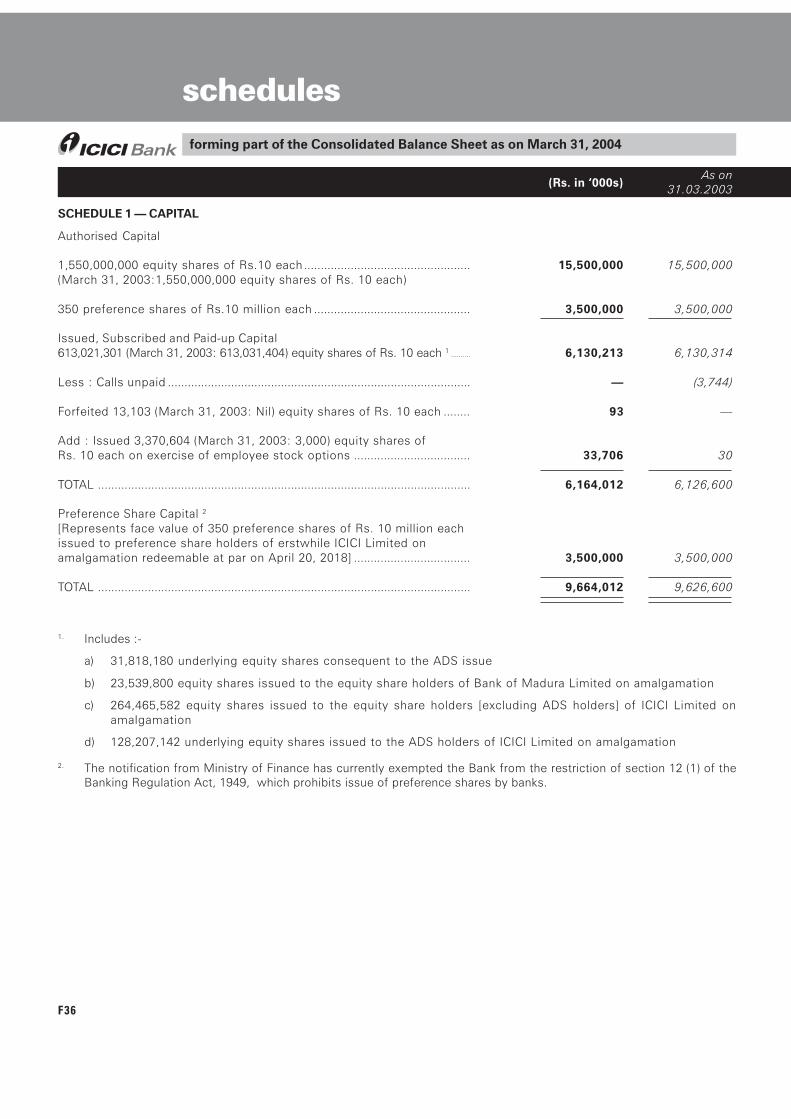
F36
As on(Rs. in �000s) 31.03.2003
forming part of the Consolidated Balance Sheet as on March 31, 2004
SCHEDULE 1 � CAPITAL
Authorised Capital
1,550,000,000 equity shares of Rs.10 each .................................................. 15,500,000 15,500,000(March 31, 2003:1,550,000,000 equity shares of Rs. 10 each)
350 preference shares of Rs.10 million each ............................................... 3,500,000 3,500,000
Issued, Subscribed and Paid-up Capital613,021,301 (March 31, 2003: 613,031,404) equity shares of Rs. 10 each 1 .......... 6,130,213 6,130,314
Less : Calls unpaid ........................................................................................... � (3,744)
Forfeited 13,103 (March 31, 2003: Nil) equity shares of Rs. 10 each ........ 93 �
Add : Issued 3,370,604 (March 31, 2003: 3,000) equity shares ofRs. 10 each on exercise of employee stock options ................................... 33,706 30
TOTAL ................................................................................................................ 6,164,012 6,126,600
Preference Share Capital 2
[Represents face value of 350 preference shares of Rs. 10 million eachissued to preference share holders of erstwhile ICICI Limited onamalgamation redeemable at par on April 20, 2018] ................................... 3,500,000 3,500,000
TOTAL ................................................................................................................ 9,664,012 9,626,600
1. Includes :-
a) 31,818,180 underlying equity shares consequent to the ADS issue
b) 23,539,800 equity shares issued to the equity share holders of Bank of Madura Limited on amalgamation
c) 264,465,582 equity shares issued to the equity share holders [excluding ADS holders] of ICICI Limited onamalgamation
d) 128,207,142 underlying equity shares issued to the ADS holders of ICICI Limited on amalgamation
2. The notification from Ministry of Finance has currently exempted the Bank from the restriction of section 12 (1) of theBanking Regulation Act, 1949, which prohibits issue of preference shares by banks.
schedules
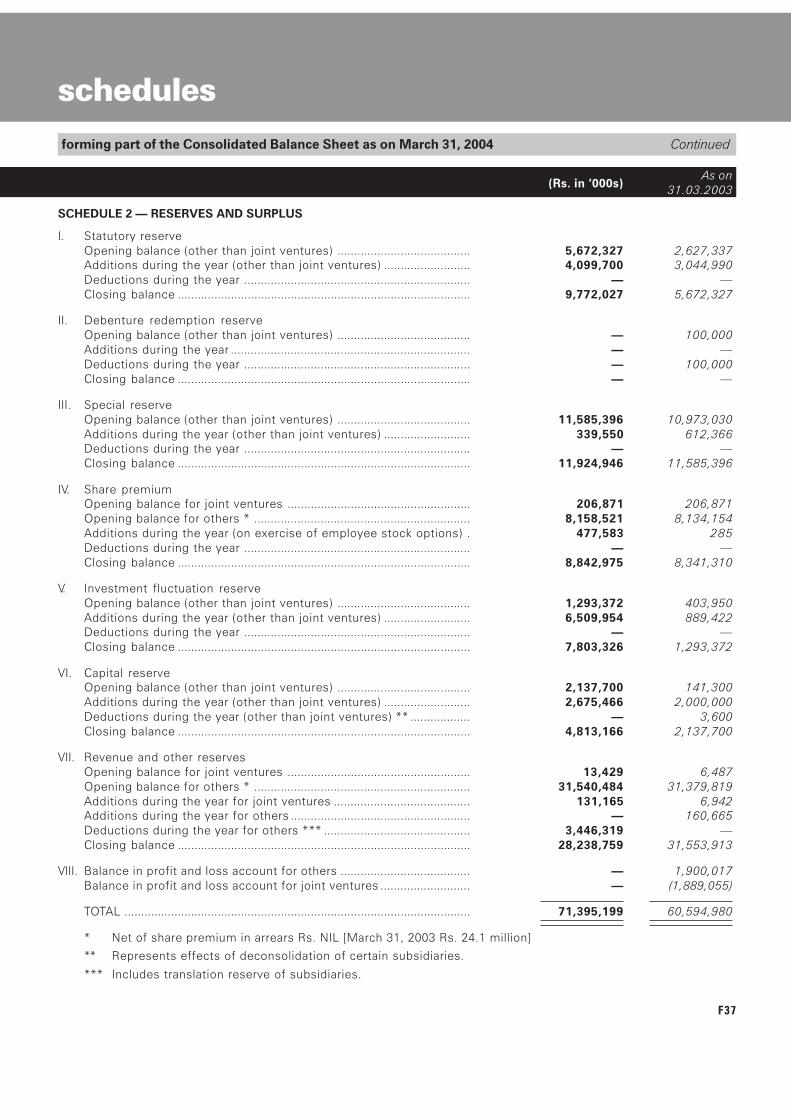
F37
forming part of the Consolidated Balance Sheet as on March 31, 2004 Continued
SCHEDULE 2 � RESERVES AND SURPLUS
I. Statutory reserveOpening balance (other than joint ventures) ........................................ 5,672,327 2,627,337Additions during the year (other than joint ventures) .......................... 4,099,700 3,044,990Deductions during the year .................................................................... � �Closing balance ........................................................................................ 9,772,027 5,672,327
II. Debenture redemption reserveOpening balance (other than joint ventures) ........................................ � 100,000Additions during the year ........................................................................ � �Deductions during the year .................................................................... � 100,000Closing balance ........................................................................................ � �
III. Special reserveOpening balance (other than joint ventures) ........................................ 11,585,396 10,973,030Additions during the year (other than joint ventures) .......................... 339,550 612,366Deductions during the year .................................................................... � �Closing balance ........................................................................................ 11,924,946 11,585,396
IV. Share premiumOpening balance for joint ventures ....................................................... 206,871 206,871Opening balance for others * ................................................................. 8,158,521 8,134,154Additions during the year (on exercise of employee stock options) . 477,583 285Deductions during the year .................................................................... � �Closing balance ........................................................................................ 8,842,975 8,341,310
V. Investment fluctuation reserveOpening balance (other than joint ventures) ........................................ 1,293,372 403,950Additions during the year (other than joint ventures) .......................... 6,509,954 889,422Deductions during the year .................................................................... � �Closing balance ........................................................................................ 7,803,326 1,293,372
VI. Capital reserveOpening balance (other than joint ventures) ........................................ 2,137,700 141,300Additions during the year (other than joint ventures) .......................... 2,675,466 2,000,000Deductions during the year (other than joint ventures) ** .................. � 3,600Closing balance ........................................................................................ 4,813,166 2,137,700
VII. Revenue and other reservesOpening balance for joint ventures ....................................................... 13,429 6,487Opening balance for others * ................................................................. 31,540,484 31,379,819Additions during the year for joint ventures ......................................... 131,165 6,942Additions during the year for others ...................................................... � 160,665Deductions during the year for others *** ............................................ 3,446,319 �Closing balance ........................................................................................ 28,238,759 31,553,913
VIII. Balance in profit and loss account for others ....................................... � 1,900,017Balance in profit and loss account for joint ventures ........................... � (1,889,055)
TOTAL ........................................................................................................ 71,395,199 60,594,980
* Net of share premium in arrears Rs. NIL [March 31, 2003 Rs. 24.1 million]
** Represents effects of deconsolidation of certain subsidiaries.
*** Includes translation reserve of subsidiaries.
schedules
As on(Rs. in �000s) 31.03.2003
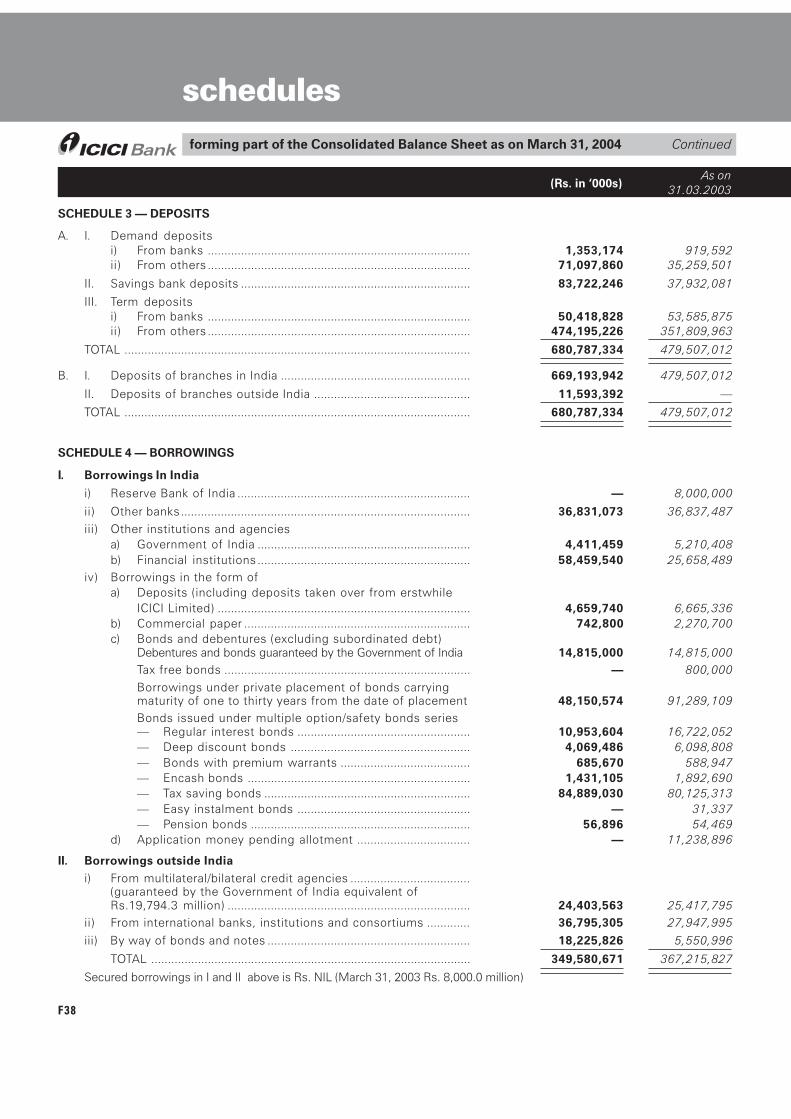
F38
As on(Rs. in �000s) 31.03.2003
SCHEDULE 3 � DEPOSITS
A. I. Demand depositsi) From banks ............................................................................... 1,353,174 919,592ii) From others ............................................................................... 71,097,860 35,259,501
II. Savings bank deposits ..................................................................... 83,722,246 37,932,081
III. Term depositsi) From banks ............................................................................... 50,418,828 53,585,875ii) From others ............................................................................... 474,195,226 351,809,963
TOTAL ........................................................................................................ 680,787,334 479,507,012
B. I. Deposits of branches in India ......................................................... 669,193,942 479,507,012
II. Deposits of branches outside India ............................................... 11,593,392 �
TOTAL ........................................................................................................ 680,787,334 479,507,012
SCHEDULE 4 � BORROWINGS
I. Borrowings In India
i) Reserve Bank of India ...................................................................... � 8,000,000
ii) Other banks....................................................................................... 36,831,073 36,837,487iii) Other institutions and agencies
a) Government of India ................................................................ 4,411,459 5,210,408b) Financial institutions ................................................................ 58,459,540 25,658,489
iv) Borrowings in the form ofa) Deposits (including deposits taken over from erstwhile
ICICI Limited) ............................................................................ 4,659,740 6,665,336b) Commercial paper .................................................................... 742,800 2,270,700c) Bonds and debentures (excluding subordinated debt)
Debentures and bonds guaranteed by the Government of India 14,815,000 14,815,000Tax free bonds .......................................................................... � 800,000Borrowings under private placement of bonds carryingmaturity of one to thirty years from the date of placement 48,150,574 91,289,109Bonds issued under multiple option/safety bonds series� Regular interest bonds .................................................... 10,953,604 16,722,052� Deep discount bonds ...................................................... 4,069,486 6,098,808� Bonds with premium warrants ....................................... 685,670 588,947� Encash bonds ................................................................... 1,431,105 1,892,690� Tax saving bonds .............................................................. 84,889,030 80,125,313� Easy instalment bonds .................................................... � 31,337� Pension bonds .................................................................. 56,896 54,469
d) Application money pending allotment .................................. � 11,238,896
II. Borrowings outside Indiai) From multilateral/bilateral credit agencies ....................................
(guaranteed by the Government of India equivalent ofRs.19,794.3 million) ......................................................................... 24,403,563 25,417,795
ii) From international banks, institutions and consortiums ............. 36,795,305 27,947,995iii) By way of bonds and notes ............................................................. 18,225,826 5,550,996
TOTAL ................................................................................................ 349,580,671 367,215,827
Secured borrowings in I and II above is Rs. NIL (March 31, 2003 Rs. 8,000.0 million)
schedulesContinuedforming part of the Consolidated Balance Sheet as on March 31, 2004
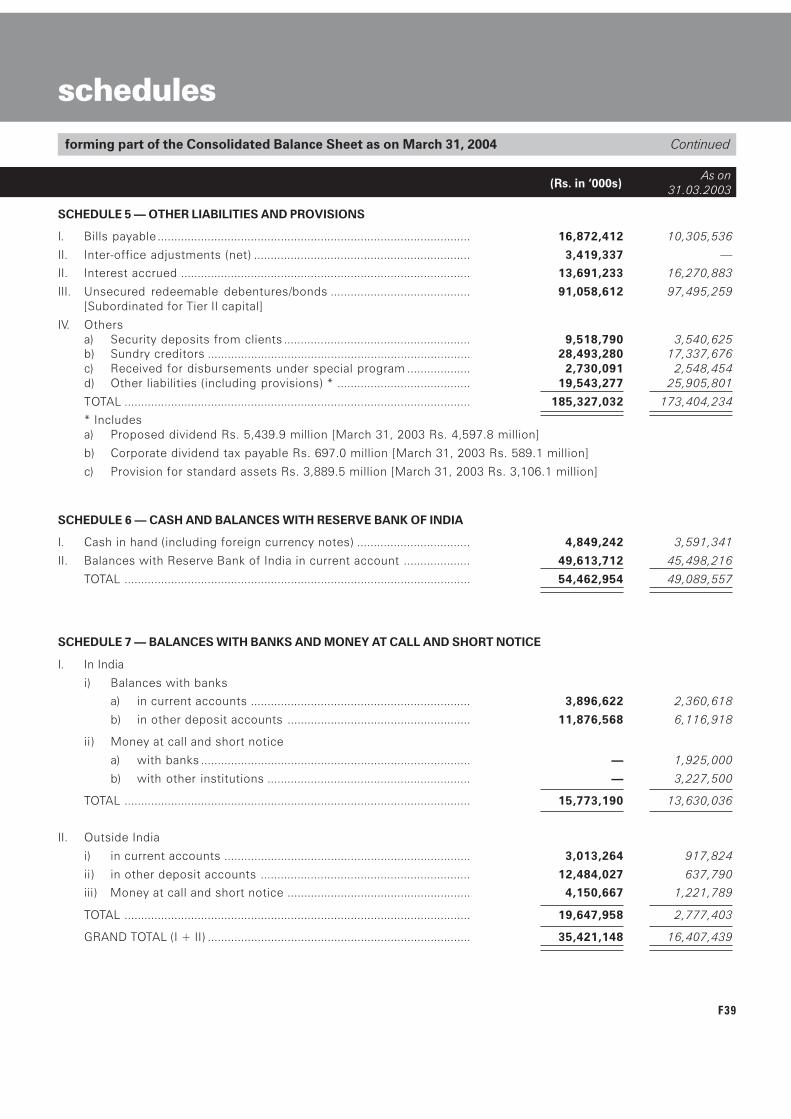
F39
SCHEDULE 5 � OTHER LIABILITIES AND PROVISIONS
I. Bills payable .............................................................................................. 16,872,412 10,305,536
II. Inter-office adjustments (net) ................................................................. 3,419,337 �
II. Interest accrued ....................................................................................... 13,691,233 16,270,883
III. Unsecured redeemable debentures/bonds .......................................... 91,058,612 97,495,259[Subordinated for Tier II capital]
IV. Othersa) Security deposits from clients ........................................................ 9,518,790 3,540,625b) Sundry creditors ............................................................................... 28,493,280 17,337,676c) Received for disbursements under special program ................... 2,730,091 2,548,454d) Other liabilities (including provisions) * ........................................ 19,543,277 25,905,801
TOTAL ........................................................................................................ 185,327,032 173,404,234
* Includesa) Proposed dividend Rs. 5,439.9 million [March 31, 2003 Rs. 4,597.8 million]
b) Corporate dividend tax payable Rs. 697.0 million [March 31, 2003 Rs. 589.1 million]
c) Provision for standard assets Rs. 3,889.5 million [March 31, 2003 Rs. 3,106.1 million]
SCHEDULE 6 � CASH AND BALANCES WITH RESERVE BANK OF INDIA
I. Cash in hand (including foreign currency notes) .................................. 4,849,242 3,591,341
II. Balances with Reserve Bank of India in current account .................... 49,613,712 45,498,216
TOTAL ........................................................................................................ 54,462,954 49,089,557
SCHEDULE 7 � BALANCES WITH BANKS AND MONEY AT CALL AND SHORT NOTICE
I. In India
i) Balances with banks
a) in current accounts .................................................................. 3,896,622 2,360,618
b) in other deposit accounts ....................................................... 11,876,568 6,116,918
ii) Money at call and short notice
a) with banks ................................................................................. � 1,925,000
b) with other institutions ............................................................. � 3,227,500
TOTAL ........................................................................................................ 15,773,190 13,630,036
II. Outside India
i) in current accounts .......................................................................... 3,013,264 917,824
ii) in other deposit accounts ............................................................... 12,484,027 637,790
iii) Money at call and short notice ....................................................... 4,150,667 1,221,789
TOTAL ........................................................................................................ 19,647,958 2,777,403
GRAND TOTAL (I + II) ............................................................................... 35,421,148 16,407,439
schedulesContinued
As on(Rs. in �000s) 31.03.2003
forming part of the Consolidated Balance Sheet as on March 31, 2004
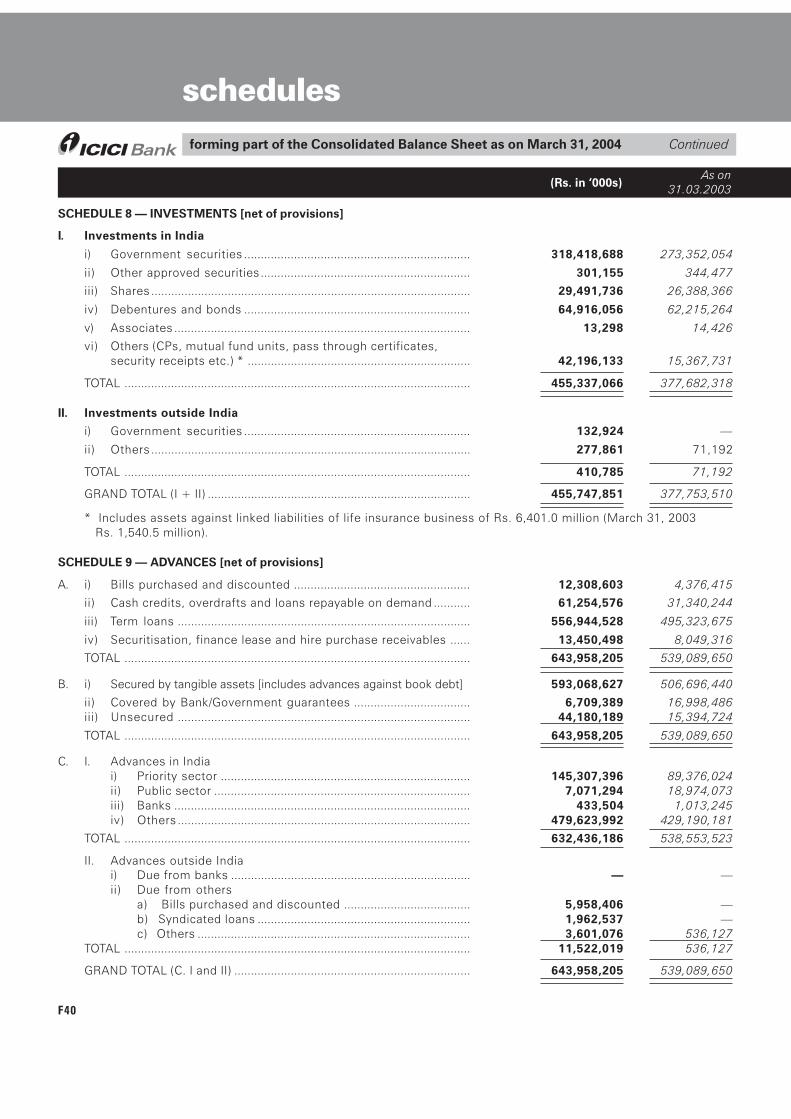
F40
As on(Rs. in �000s) 31.03.2003
schedules
SCHEDULE 8 � INVESTMENTS [net of provisions]
I. Investments in India
i) Government securities .................................................................... 318,418,688 273,352,054
ii) Other approved securities ............................................................... 301,155 344,477
iii) Shares ................................................................................................ 29,491,736 26,388,366
iv) Debentures and bonds .................................................................... 64,916,056 62,215,264
v) Associates ......................................................................................... 13,298 14,426
vi) Others (CPs, mutual fund units, pass through certificates,security receipts etc.) * ................................................................... 42,196,133 15,367,731
TOTAL ........................................................................................................ 455,337,066 377,682,318
II. Investments outside India
i) Government securities .................................................................... 132,924 �
ii) Others ................................................................................................ 277,861 71,192
TOTAL ........................................................................................................ 410,785 71,192
GRAND TOTAL (I + II) ............................................................................... 455,747,851 377,753,510
* Includes assets against linked liabilities of life insurance business of Rs. 6,401.0 million (March 31, 2003 Rs. 1,540.5 million).
SCHEDULE 9 � ADVANCES [net of provisions]
A. i) Bills purchased and discounted ..................................................... 12,308,603 4,376,415
ii) Cash credits, overdrafts and loans repayable on demand ........... 61,254,576 31,340,244
iii) Term loans ........................................................................................ 556,944,528 495,323,675
iv) Securitisation, finance lease and hire purchase receivables ...... 13,450,498 8,049,316
TOTAL ........................................................................................................ 643,958,205 539,089,650
B. i) Secured by tangible assets [includes advances against book debt] 593,068,627 506,696,440
ii) Covered by Bank/Government guarantees ................................... 6,709,389 16,998,486iii) Unsecured ........................................................................................ 44,180,189 15,394,724
TOTAL ........................................................................................................ 643,958,205 539,089,650
C. I. Advances in Indiai) Priority sector ........................................................................... 145,307,396 89,376,024ii) Public sector ............................................................................. 7,071,294 18,974,073iii) Banks ......................................................................................... 433,504 1,013,245iv) Others ........................................................................................ 479,623,992 429,190,181
TOTAL ........................................................................................................ 632,436,186 538,553,523
II. Advances outside Indiai) Due from banks ........................................................................ � �ii) Due from others
a) Bills purchased and discounted ...................................... 5,958,406 �b) Syndicated loans ................................................................ 1,962,537 �c) Others .................................................................................. 3,601,076 536,127
TOTAL ........................................................................................................ 11,522,019 536,127
GRAND TOTAL (C. I and II) ....................................................................... 643,958,205 539,089,650
Continuedforming part of the Consolidated Balance Sheet as on March 31, 2004
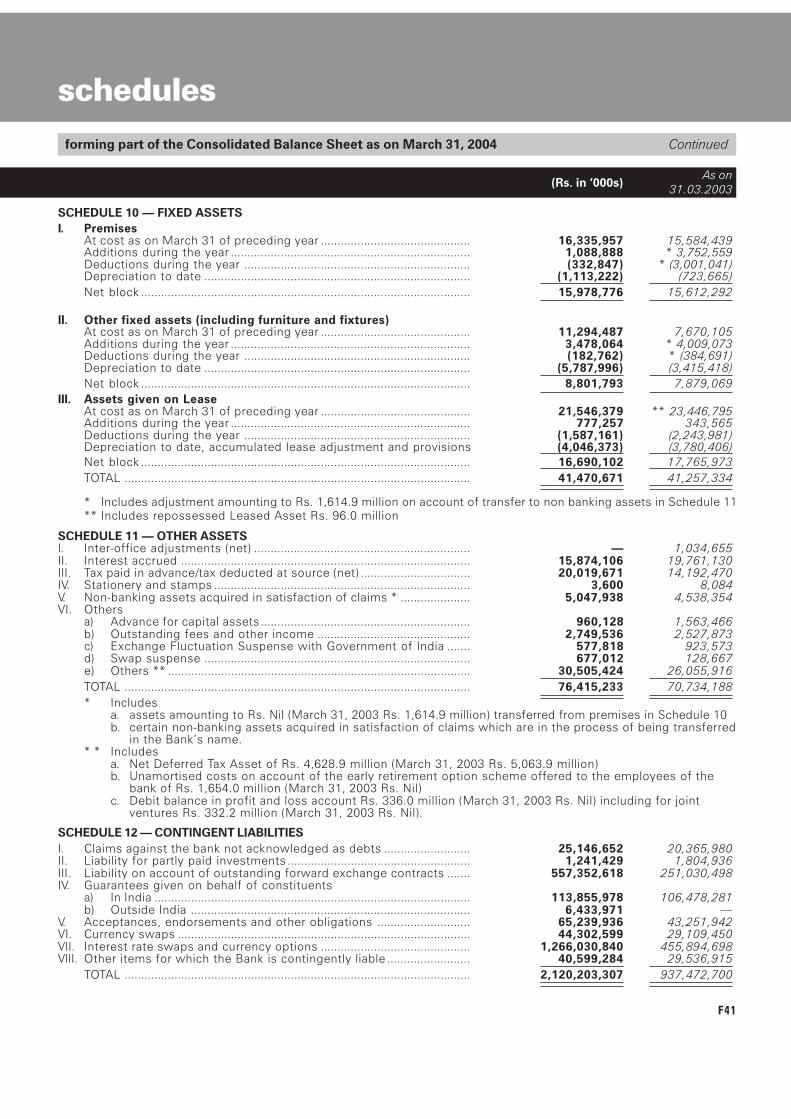
F41
SCHEDULE 10 � FIXED ASSETSI. Premises
At cost as on March 31 of preceding year ............................................. 16,335,957 15,584,439Additions during the year ........................................................................ 1,088,888 * 3,752,559Deductions during the year .................................................................... (332,847) * (3,001,041)Depreciation to date ................................................................................ (1,113,222) (723,665)Net block ................................................................................................... 15,978,776 15,612,292
II. Other fixed assets (including furniture and fixtures)At cost as on March 31 of preceding year ............................................. 11,294,487 7,670,105Additions during the year ........................................................................ 3,478,064 * 4,009,073Deductions during the year .................................................................... (182,762) * (384,691)Depreciation to date ................................................................................ (5,787,996) (3,415,418)Net block ................................................................................................... 8,801,793 7,879,069
III. Assets given on LeaseAt cost as on March 31 of preceding year ............................................. 21,546,379 ** 23,446,795Additions during the year ........................................................................ 777,257 343,565Deductions during the year .................................................................... (1,587,161) (2,243,981)Depreciation to date, accumulated lease adjustment and provisions (4,046,373) (3,780,406)Net block ................................................................................................... 16,690,102 17,765,973TOTAL ........................................................................................................ 41,470,671 41,257,334
* Includes adjustment amounting to Rs. 1,614.9 million on account of transfer to non banking assets in Schedule 11** Includes repossessed Leased Asset Rs. 96.0 million
SCHEDULE 11 � OTHER ASSETSI. Inter-office adjustments (net) ................................................................. � 1,034,655II. Interest accrued ....................................................................................... 15,874,106 19,761,130III. Tax paid in advance/tax deducted at source (net) ................................. 20,019,671 14,192,470IV. Stationery and stamps ............................................................................. 3,600 8,084V. Non-banking assets acquired in satisfaction of claims * ..................... 5,047,938 4,538,354VI. Others
a) Advance for capital assets ............................................................... 960,128 1,563,466b) Outstanding fees and other income .............................................. 2,749,536 2,527,873c) Exchange Fluctuation Suspense with Government of India ....... 577,818 923,573d) Swap suspense ................................................................................ 677,012 128,667e) Others ** ........................................................................................... 30,505,424 26,055,916TOTAL ........................................................................................................ 76,415,233 70,734,188* Includes
a. assets amounting to Rs. Nil (March 31, 2003 Rs. 1,614.9 million) transferred from premises in Schedule 10b. certain non-banking assets acquired in satisfaction of claims which are in the process of being transferred
in the Bank�s name.* * Includes
a. Net Deferred Tax Asset of Rs. 4,628.9 million (March 31, 2003 Rs. 5,063.9 million)b. Unamortised costs on account of the early retirement option scheme offered to the employees of the
bank of Rs. 1,654.0 million (March 31, 2003 Rs. Nil)c. Debit balance in profit and loss account Rs. 336.0 million (March 31, 2003 Rs. Nil) including for joint
ventures Rs. 332.2 million (March 31, 2003 Rs. Nil).
SCHEDULE 12 � CONTINGENT LIABILITIESI. Claims against the bank not acknowledged as debts .......................... 25,146,652 20,365,980II. Liability for partly paid investments ....................................................... 1,241,429 1,804,936III. Liability on account of outstanding forward exchange contracts ....... 557,352,618 251,030,498IV. Guarantees given on behalf of constituents
a) In India ............................................................................................... 113,855,978 106,478,281b) Outside India .................................................................................... 6,433,971 �
V. Acceptances, endorsements and other obligations ............................ 65,239,936 43,251,942VI. Currency swaps ........................................................................................ 44,302,599 29,109,450VII. Interest rate swaps and currency options ............................................. 1,266,030,840 455,894,698VIII. Other items for which the Bank is contingently liable ......................... 40,599,284 29,536,915
TOTAL ........................................................................................................ 2,120,203,307 937,472,700
schedulesContinued
As on(Rs. in �000s) 31.03.2003
forming part of the Consolidated Balance Sheet as on March 31, 2004
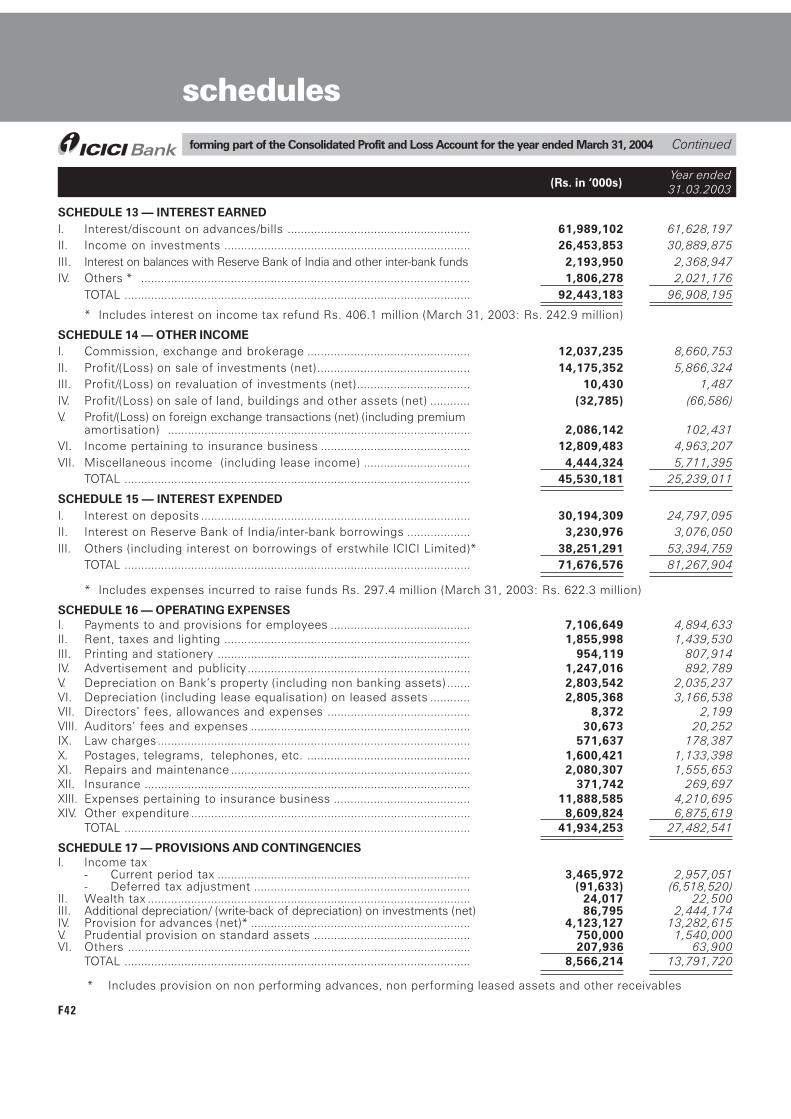
F42
forming part of the Consolidated Profit and Loss Account for the year ended March 31, 2004 Continued
schedules
Year ended(Rs. in �000s) 31.03.2003
SCHEDULE 13 � INTEREST EARNEDI. Interest/discount on advances/bills ....................................................... 61,989,102 61,628,197II. Income on investments .......................................................................... 26,453,853 30,889,875III. Interest on balances with Reserve Bank of India and other inter-bank funds 2,193,950 2,368,947IV. Others * ................................................................................................... 1,806,278 2,021,176
TOTAL ........................................................................................................ 92,443,183 96,908,195
* Includes interest on income tax refund Rs. 406.1 million (March 31, 2003: Rs. 242.9 million)
SCHEDULE 14 � OTHER INCOMEI. Commission, exchange and brokerage ................................................. 12,037,235 8,660,753II. Profit/(Loss) on sale of investments (net).............................................. 14,175,352 5,866,324III. Profit/(Loss) on revaluation of investments (net) .................................. 10,430 1,487IV. Profit/(Loss) on sale of land, buildings and other assets (net) ............ (32,785) (66,586)V. Profit/(Loss) on foreign exchange transactions (net) (including premium
amortisation) ........................................................................................... 2,086,142 102,431VI. Income pertaining to insurance business ............................................. 12,809,483 4,963,207VII. Miscellaneous income (including lease income) ................................ 4,444,324 5,711,395
TOTAL ........................................................................................................ 45,530,181 25,239,011
SCHEDULE 15 � INTEREST EXPENDEDI. Interest on deposits ................................................................................. 30,194,309 24,797,095II. Interest on Reserve Bank of India/inter-bank borrowings ................... 3,230,976 3,076,050III. Others (including interest on borrowings of erstwhile ICICI Limited)* 38,251,291 53,394,759
TOTAL ........................................................................................................ 71,676,576 81,267,904
* Includes expenses incurred to raise funds Rs. 297.4 million (March 31, 2003: Rs. 622.3 million)
SCHEDULE 16 � OPERATING EXPENSESI. Payments to and provisions for employees .......................................... 7,106,649 4,894,633II. Rent, taxes and lighting .......................................................................... 1,855,998 1,439,530III. Printing and stationery ............................................................................ 954,119 807,914IV. Advertisement and publicity ................................................................... 1,247,016 892,789V. Depreciation on Bank�s property (including non banking assets) ....... 2,803,542 2,035,237VI. Depreciation (including lease equalisation) on leased assets ............ 2,805,368 3,166,538VII. Directors� fees, allowances and expenses ........................................... 8,372 2,199VIII. Auditors� fees and expenses .................................................................. 30,673 20,252IX. Law charges.............................................................................................. 571,637 178,387X. Postages, telegrams, telephones, etc. ................................................. 1,600,421 1,133,398XI. Repairs and maintenance ........................................................................ 2,080,307 1,555,653XII. Insurance .................................................................................................. 371,742 269,697XIII. Expenses pertaining to insurance business ......................................... 11,888,585 4,210,695XIV. Other expenditure .................................................................................... 8,609,824 6,875,619
TOTAL ........................................................................................................ 41,934,253 27,482,541
SCHEDULE 17 � PROVISIONS AND CONTINGENCIESI. Income tax
- Current period tax ............................................................................ 3,465,972 2,957,051- Deferred tax adjustment ................................................................. (91,633) (6,518,520)
II. Wealth tax ................................................................................................. 24,017 22,500III. Additional depreciation/ (write-back of depreciation) on investments (net) 86,795 2,444,174IV. Provision for advances (net)* .................................................................. 4,123,127 13,282,615V. Prudential provision on standard assets ............................................... 750,000 1,540,000VI. Others ....................................................................................................... 207,936 63,900
TOTAL ........................................................................................................ 8,566,214 13,791,720
* Includes provision on non performing advances, non performing leased assets and other receivables
F43
forming part of the Consolidated Accounts Continued
schedules
SCHEDULE 18
SIGNIFICANT ACCOUNTING POLICIES AND NOTES TO ACCOUNTS
Overview
ICICI Bank Limited together with its subsidiaries, joint ventures and associates (collectively, the Group) is a diversifiedfinancial services group providing a variety of banking and financial services including project finance, working capitalfinance, venture capital finance, investment banking, treasury products and services, retail banking and broking.
ICICI Bank Limited (�ICICI Bank� or �the Bank�), incorporated in Vadodara, India is a publicly held bank engaged inproviding a wide range of banking and financial services including commercial banking and treasury operations. ICICIBank is a banking company governed by the Banking Regulation Act, 1949.
Principles of consolidationThe consolidated financial statements include the accounts of ICICI Bank Limited, its subsidiaries, associates and jointventures.
The Bank consolidates all subsidiaries as defined in accounting standard (�AS�) 21 �Consolidated Financial Statements�issued by the Institute of Chartered Accountants of India (�ICAI�) on line by line basis by adding together like items ofassets, liabilities, income and expenses. Further, the Bank accounts for investments in associates as defined by AS 23�Accounting for Investments in Associates in Consolidated Financial Statements� by the equity method of accounting.The Bank has investments in certain joint ventures, which have been consolidated by the proportionate consolidationmethod as required by AS 27 on �Financial Reporting of Interests in Joint Ventures.�
Basis of preparationThe accounting and reporting policies of the Group used in the preparation of these financial statements conform withthe Accounting Standards issued by ICAI, the guidelines issued by the Reserve Bank of India (�RBI�), Insurance Regulatoryand Development Association (�IRDA�) and National Housing Bank (�NHB�) from time to time as applicable to relevantcompanies and generally accepted accounting principles prevailing in India.
The Group follows the accrual method of accounting except where otherwise stated and historical cost convention.
The preparation of financial statements requires the management to make estimates and assumptions considered in thereported amounts of assets and liabilities (including contingent liabilities) as of the date of the financial statements andthe reported income and expenses during the reporting period. Management believes that the estimates used in thepreparation of the financial statements are prudent and reasonable. Future results could differ from these estimates.
The consolidated financial statements include the results of the following entities:
Sr. Name of the company Country/ Relation OwnershipNo. residence interest
1. ICICI Securities Limited India Subsidiary 99.92%2. ICICI Brokerage Services Limited India Subsidiary 99.92%3. ICICI Securities Inc. USA Subsidiary 99.92%4. ICICI Securities Holding Inc. USA Subsidiary 99.92%5. ICICI Venture Funds
Management Company Limited India Subsidiary 99.99%6. ICICI Home Finance Company Limited India Subsidiary 100.00%7. ICICI Trusteeship Services Limited India Subsidiary 100.00%8. ICICI Investment
Management Company Limited India Subsidiary 100.00%9. ICICI International Limited Mauritius Subsidiary 100.00%10. ICICI Bank UK Limited United Kingdom Subsidiary 100.00%11. ICICI Distribution Finance Private Limited India Subsidiary 100.00%12. ICICI Bank Canada Canada Subsidiary 100.00%13. ICICI Property Trust India Direct holding 100.00%14. ICICI Eco-net Internet & Technology Fund India Direct holding 92.12%15. ICICI Equity Fund India Direct holding 100.00%16. ICICI Emerging Sectors Fund India Direct holding 98.88%17. ICICI Strategic Investments Fund India Direct holding 100.00%
F44
The financial statements of the subsidiaries used in the consolidation are drawn upto the same reporting date as that ofthe Bank, i.e. year ended March 31, 2004.
ICICI Bank Canada was incorporated as a 100% subsidiary of ICICI Bank Limited on September 12, 2003. The CanadaDeposit Insurance Corporation, admitted the Bank to its membership on September 24, 2003, giving it the ability tomobilize retail deposits from across Canada.
During the year the Bank has acquired 100% stake in Transamerica Apple Distribution Finance Private Limited witheffect from May 7, 2003. Subsequently with effect from June 3, 2003 the name has been changed to ICICI DistributionFinance Private Limited.
As per the approval of the RBI dated March 31, 2003 received by the Bank for the above acquisition, the Bank is required toinitiate proceedings for the voluntary winding up of the company after the business is transferred to the Bank�s balancesheet. Hence, the financials of this company are not prepared on a going concern basis.
Adjustments relating to the recoverability and the classification of recorded asset amount or to amounts and classification ofliabilities that may be necessary on winding up of the company have been made on management�s assessment of the same.
All assets and liabilities have been stated at net realisable value.
The investment in TCW/ICICI Investment Partners L.L.C. (holding of the Bank is 50%) is accounted under equity methodas per AS 23.
The Bank has adopted AS 27 and the investments in the following companies have been accounted in accordance withthe provisions of AS 27 :-
Sr. Name of the company Country/ PercentageNo. residence holding
1 ICICI Prudential Life Insurance Company Limited India 74.00%
2 ICICI Lombard General Insurance Company Limited India 74.00%
3 Prudential ICICI Asset Management Company Limited India **44.99%
4 Prudential ICICI Trust Limited India **44.80%
** Indicates holding by ICICI Bank Limited along with its subsidiaries.
Equity issue of ICICI Bank Limited
The Board of Directors, pursuant to a resolution dated February 10, 2004, authorised an equity issue amounting toRs. 30,500 million through a book built issue with a green shoe option of Rs. 4,500 million subject to the approval ofshareholders under Section 81(1A) of the Companies Act, at the extraordinary general meeting to be held on March 12,2004. The shareholders have pursuant to a resolution dated March 12, 2004 under Section 81(1A) of the Companies Act,authorised the issue and the green shoe option.
Subsequent to the balance sheet date the Bank has issued 108,928,571 equity shares of Rs.10 each at a premium ofRs. 270 per share aggregating to Rs. 30,500 million. The Bank has also over-allocated 16,071,429 equity shares of Rs.10each at a price of Rs. 280 per equity share (fully paid up) under the green shoe option.
A. SIGNIFICANT ACCOUNTING POLICIES
1. Revenue Recognition
ICICI Bank Limited
a) Interest income is recognised in the profit and loss account as it accrues except in the case of non-performing assetswhere it is recognised upon realisation as per the prudential norms of the RBI. Accrual of income is also suspendedconsidering economic conditions and other risk factors, on certain other loans, including certain projects underimplementation, where the implementation has been significantly delayed and in the opinion of the managementsignificant uncertainties exist as to the final financial closure and/or date of completion of the project.
b) Income from hire purchase operations is accrued by applying the interest rate implicit on outstandingbalances.
forming part of the Consolidated Account Continued
schedules
F45
c) Income from leases is calculated by applying the interest rate implicit in the lease to the net investmentoutstanding on the lease over the primary lease period. Leases effected from April 1, 2001 have been accountedas per Accounting Standard 19 on �Accounting for leases� issued by the ICAI.
d) Income on discounted instruments is recognised over the tenure of the instrument on a constant yield basis.
e) Dividend is accounted on an accrual basis when the right to receive the dividend is established.
f) Fees received as a compensation of future interest sacrifice is amortised over the remaining period of thefacility.
g) Arranger�s fee is accrued proportionately where more than 75% of the total amount of finance has beenarranged.
h) All other fees are recognised upfront on their becoming due.
i) Income arising from sell down of loan assets is recognised upfront net of future servicing cost of assets soldand projected delinquencies and included in Interest income.
j) Guarantee commission is recognised over the period of the guarantee.
Other entities
k) Fees earned on non-fund based activities such as issue management, loan syndication, financial advisoryservices etc., are recognised based on the stage of completion of assignments and the bills raised for therecovery of fees.
l) Income from brokerage activities is recognised as income on the trade date of the transaction. Relatedexpenditure incurred for procuring business are accounted for as procurement expenses.
m) In case of life insurance business, insurance premium is recognised as income when due. Uncollected premiumon lapsed policies is recognised as income when such policies are reinstated. For linked business, premium isrecognised when the associated units are allotted. Fees on linked policies is recognised when due.
In case of general insurance business, insurance premium is recognised as income over the contract period orover the period of risk. Any subsequent revision to premium is recognised over the remaining period of risk orcontract period. Adjustments to premium income arising on cancellation of policies is recognised in the year inwhich it is cancelled. Premium deficiency is recognised if the sum of expected claim costs, related expensesand maintenance costs exceeds related reserves for unexpired risks.
Commission on reinsurance business is recognized at the inception of the contract as income in the year ofceding the risk.
2. Investments
ICICI Bank Limited
Investments are valued in accordance with the extant RBI guidelines on investment classification and valuation asunder:
a) All investments are categorised into �Held to Maturity�, �Available for sale� and �Trading�. Reclassifications, ifany, in any category are accounted for as per the RBI guidelines. Under each category the investments arefurther classified under (a) Government securities (b) other approved securities (c) shares (d) bonds anddebentures (e) subsidiaries and joint ventures and (f) others.
b) �Held to Maturity� securities are carried at their acquisition cost or at amortised cost if acquired at a premiumover the face value. A provision is made for other than temporary diminution.
c) �Available for sale� and �Trading� securities are valued periodically as per RBI guidelines.
The market/fair value for the purpose of periodical valuation of quoted investments included in the �Availablefor Sale� and �Held for Trading� categories is the market price of the scrip as available from the trades/quoteson the stock exchanges, SGL account transactions, price list of RBI or prices declared by Primary DealersAssociation of India jointly with Fixed Income Money Market and Derivatives Association (�FIMMDA�)periodically.The market/fair value of unquoted SLR securities included in the �Available for Sale� and �Trading� categories isas per the rates put out by FIMMDA.
forming part of the Consolidated Account Continued
schedules
F46
The valuation of non-SLR securities, other than those quoted on the stock exchanges, wherever linked to theYield-to-Maturity (�YTM�) rates, is with a mark-up (reflecting associated credit risk) over the YTM rates forgovernment securities put out by FIMMDA.
The unquoted equity shares are valued at the book value, if the latest balance sheet is available or at Re. 1.
Securities are valued scrip-wise and depreciation/appreciation aggregated for each category. Net appreciationin each basket if any, being unrealised, is ignored, while net depreciation is provided for.
d) Costs such as brokerage, commission etc., pertaining to investments, paid at the time of acquisition, arecharged to revenue.
e) Broken period interest on debt instruments is treated as a revenue item.
f) Investments in subsidiaries/joint ventures are categorised as �Held to Maturity� in accordance with the RBIguidelines.
g) Profit on sale of investment in the �Held to Maturity� category is credited to the revenue account and thereafteris appropriated (net of applicable taxes and statutory reserve requirements) to capital reserve.
h) At each reporting year-end, security receipts issued by the asset reconstruction company are valued in accordancewith the guidelines applicable to non-SLR instruments prescribed by RBI from time to time. Accordingly, in casewhere the security receipts issued by the asset reconstruction company are limited to the actual realisation ofthe financial assets assigned to the instruments in the concerned scheme, the Bank reckons the Net AssetValue (NAV), obtained from the asset reconstruction company from time to time, for valuation of such investmentsat each reporting period end.
Other entities
In case of investments by ICICI Equity Fund, ICICI Eco-net Internet and Technology Fund, ICICI Emerging SectorsFund and ICICI Strategic Investments Fund, brokerage, commission and stamp duty are included in the cost ofacquisition while front-end fees earned are netted off from cost of investments.
ICICI Equity Fund, ICICI Eco-net Internet and Technology Fund, ICICI Emerging Sectors Fund and Strategic InvestmentFund (schemes of ICICI Venture Capital Fund) value their investments as per Securities and Exchange Board of India(�SEBI�) guidelines issued from time to time. Total investments of these funds amount to Rs. 16,778.1 million.Unrealised gains and temporary losses on investments are recognised as components of investors� equity and aredealt with under Unrealised Investment Reserve.
ICICI International Limited values its investments in accordance with International Accounting Standard (�IAS�) 39(Financial Instruments: Recognition and Measurement). Total investments of the subsidiary amount to Rs. 13.1 million.
ICICI Securities Limited, ICICI Brokerage Services Limited, ICICI Securities Inc., and ICICI Securities Holding Inc.,include brokerage and stamp duty payable to arrive at the cost of investments. However, in respect of securitiesheld as stock-in-trade, brokerage and stamp duty are written off as revenue expenditure. Commission earned inrespect of securities held as stock-in-trade and investments acquired from the primary market and on devolvementare adjusted from the cost of acquisition. Total investments of such subsidiaries amount to Rs. 22,456.2 million.
Other entities other than ICICI Bank UK Limited and ICICI Bank Canada value their investments as per AS 13�Accounting for Investments� issued by ICAI. Total investments of such subsidiaries amount to Rs. 943.4 million.
Insurance joint ventures
ICICI Prudential Life Insurance Company Limited and ICICI Lombard General Insurance Company Limited are governedby Insurance Act 1938 which value their investments in accordance with the provisions of Insurance Regulatory andDevelopment Authority Regulation, 2002. Total investments of these two joint ventures amount to Rs. 14,698.1million.
In case of insurance joint ventures, unrealised gain / loss arising on account of such valuation is taken to equityunder the head �Fair Value change account�.
3. Provisions/Write-offs on loans and other credit facilities
ICICI Bank Limited
a) All credit exposures are classified as per the RBI guidelines, into performing and non-performing assets. Further,non-performing assets are classified into sub-standard, doubtful and loss assets based on the criteria stipulated bythe RBI. Provisions are made on substandard and doubtful assets at rates equal to or higher than those prescribed by
forming part of the Consolidated Account
schedulesContinued
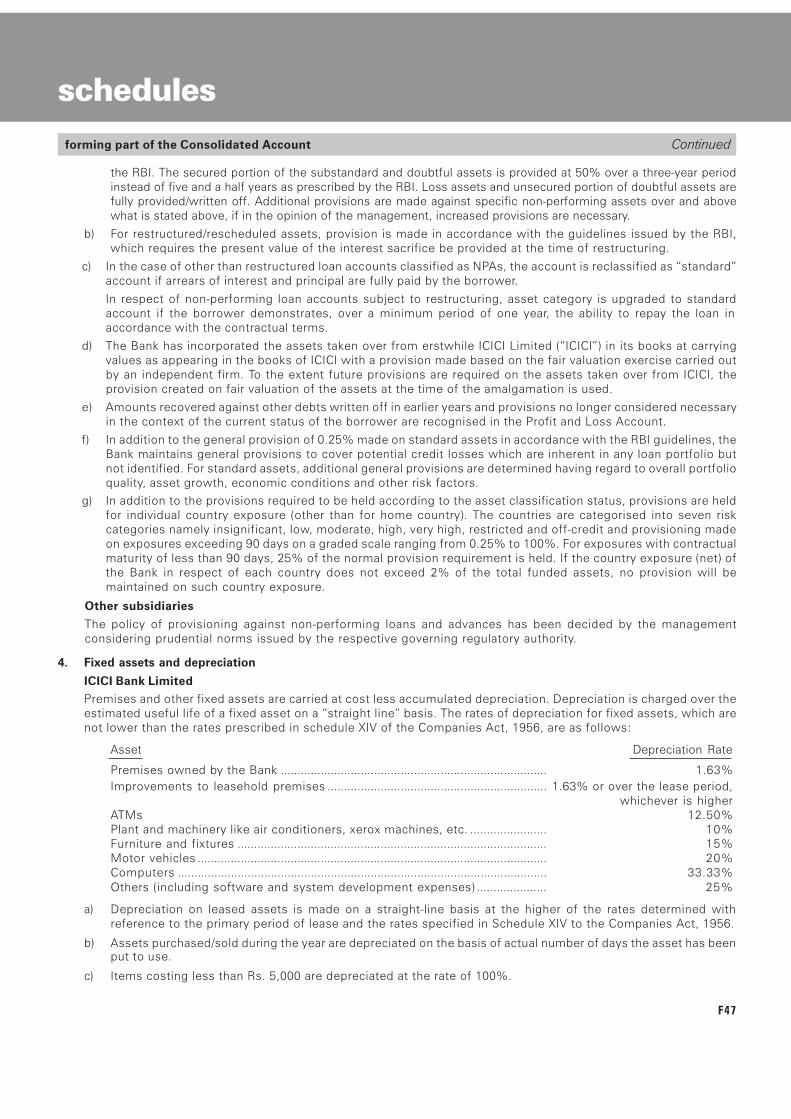
F47
the RBI. The secured portion of the substandard and doubtful assets is provided at 50% over a three-year periodinstead of five and a half years as prescribed by the RBI. Loss assets and unsecured portion of doubtful assets arefully provided/written off. Additional provisions are made against specific non-performing assets over and abovewhat is stated above, if in the opinion of the management, increased provisions are necessary.
b) For restructured/rescheduled assets, provision is made in accordance with the guidelines issued by the RBI,which requires the present value of the interest sacrifice be provided at the time of restructuring.
c) In the case of other than restructured loan accounts classified as NPAs, the account is reclassified as �standard�account if arrears of interest and principal are fully paid by the borrower.
In respect of non-performing loan accounts subject to restructuring, asset category is upgraded to standardaccount if the borrower demonstrates, over a minimum period of one year, the ability to repay the loan inaccordance with the contractual terms.
d) The Bank has incorporated the assets taken over from erstwhile ICICI Limited (�ICICI�) in its books at carryingvalues as appearing in the books of ICICI with a provision made based on the fair valuation exercise carried outby an independent firm. To the extent future provisions are required on the assets taken over from ICICI, theprovision created on fair valuation of the assets at the time of the amalgamation is used.
e) Amounts recovered against other debts written off in earlier years and provisions no longer considered necessaryin the context of the current status of the borrower are recognised in the Profit and Loss Account.
f) In addition to the general provision of 0.25% made on standard assets in accordance with the RBI guidelines, theBank maintains general provisions to cover potential credit losses which are inherent in any loan portfolio butnot identified. For standard assets, additional general provisions are determined having regard to overall portfolioquality, asset growth, economic conditions and other risk factors.
g) In addition to the provisions required to be held according to the asset classification status, provisions are heldfor individual country exposure (other than for home country). The countries are categorised into seven riskcategories namely insignificant, low, moderate, high, very high, restricted and off-credit and provisioning madeon exposures exceeding 90 days on a graded scale ranging from 0.25% to 100%. For exposures with contractualmaturity of less than 90 days, 25% of the normal provision requirement is held. If the country exposure (net) ofthe Bank in respect of each country does not exceed 2% of the total funded assets, no provision will bemaintained on such country exposure.
Other subsidiaries
The policy of provisioning against non-performing loans and advances has been decided by the managementconsidering prudential norms issued by the respective governing regulatory authority.
4. Fixed assets and depreciation
ICICI Bank LimitedPremises and other fixed assets are carried at cost less accumulated depreciation. Depreciation is charged over theestimated useful life of a fixed asset on a �straight line� basis. The rates of depreciation for fixed assets, which arenot lower than the rates prescribed in schedule XIV of the Companies Act, 1956, are as follows:
Asset Depreciation Rate
Premises owned by the Bank ................................................................................ 1.63%Improvements to leasehold premises .................................................................. 1.63% or over the lease period,
whichever is higherATMs 12.50%Plant and machinery like air conditioners, xerox machines, etc. ....................... 10%Furniture and fixtures ............................................................................................. 15%Motor vehicles ......................................................................................................... 20%Computers ............................................................................................................... 33.33%Others (including software and system development expenses) ..................... 25%
a) Depreciation on leased assets is made on a straight-line basis at the higher of the rates determined withreference to the primary period of lease and the rates specified in Schedule XIV to the Companies Act, 1956.
b) Assets purchased/sold during the year are depreciated on the basis of actual number of days the asset has beenput to use.
c) Items costing less than Rs. 5,000 are depreciated at the rate of 100%.
forming part of the Consolidated Account
schedulesContinued
F48
Other entitiesd) In case of ICICI Venture Funds Management Company Limited, depreciation on assets, other than leased
assets, is charged on written down value method in accordance with the provisions of Schedule XIV of theCompanies Act, 1956. The gross block, accumulated depreciation and net block in respect of such fixed assetsas on March 31, 2004 for the subsidiary was Rs. 87.6 million, Rs. 40.7 million and Rs. 46.9 million respectively.
e) In case of ICICI Securities Limited, ICICI Brokerage Services Limited, ICICI Securities Holding Inc. and ICICISecurities Inc., depreciation on assets, other than leased assets and improvements to leased property, ischarged on written down value method in accordance with the provisions of Schedule XIV of the CompaniesAct, 1956. The gross block, accumulated depreciation and net block in respect of such fixed assets as on March31, 2004 for these subsidiaries was Rs. 195.3 million, Rs. 87.8 million and Rs. 107.5 million respectively.
f) In case of Prudential ICICI Asset Management Company Limited, fixed assets other than leasehold improvementsare depreciated at written down value method based on economic lives of the assets as estimated by themanagement. The gross block, accumulated depreciation and net block in respect of such fixed assets as onMarch 31, 2004 was Rs. 138.9 million, Rs. 101.5 million and Rs. 37.4 million respectively.
g) In case of ICICI Bank Canada, fixed assets other than leasehold improvements are depreciated using straight-line method over the estimated useful lives of the assets as estimated by the management. The gross block,accumulated depreciation and net block in respect of such fixed assets as on March 31, 2004 was Rs. 45.9million, Rs. 1.6 million and Rs. 44.3 million respectively.
h) In case of ICICI Bank UK, fixed assets other than leasehold improvements are depreciated using straight-linemethod over the estimated useful economic lives of the assets as estimated by the management. The grossblock, accumulated depreciation and net block in respect of such fixed assets as on March 31, 2004 wasRs. 80.8 million, Rs. 8.8 million and Rs. 72.0 million respectively.
5. Foreign currency transactionsICICI Bank Limiteda) Income and expenditure items are translated at the exchange rates prevailing on the date of the transaction.
Monetary assets and liabilities are translated at closing exchange rates notified by the Foreign Exchange Dealers�Association of India (�FEDAI�) at the balance sheet date and the resulting profits/losses are included in theprofit and loss account.
b) Outstanding forward exchange contracts are stated at contracted rates and are revalued at the exchange ratesnotified by FEDAI for specified maturities and at interpolated rates for contracts of in-between maturities. Theresultant gains or losses are recognised in the profit and loss account.
c) Contingent liabilities on account of guarantees, endorsements and other obligations are stated at the exchangerates notified by FEDAI at the balance sheet date.
Other entities
Financial statements of foreign subsidiaries/associates � ICICI Securities Holding Inc., ICICI Securities Inc., ICICIBank UK Limited, ICICI Bank Canada, ICICI International Limited and TCW/ICICI Investment Partners L.L.C. have beenconverted in accordance with Accounting Standard 11 on �The effects of changes in foreign exchange rates�.
6. Accounting for derivative contracts
ICICI Bank LimitedThe Bank enters into derivative contracts such as foreign currency options, interest rate and currency swaps andcross currency interest rate swaps to hedge on-balance sheet assets and liabilities or for trading purposes.
The swap contracts entered to hedge on-balance sheet assets and liabilities are structured in such a way that theybear an opposite and offsetting impact with the underlying on-balance sheet items. The impact of such derivativeinstruments are correlated with the movement of underlying assets and accounted pursuant to the principles ofhedge accounting.
Trading swaps and foreign currency options, outstanding at the balance sheet date are marked to market and theresulting loss, if any, is recorded in the profit and loss account.
Other entitiesIn case of ICICI Securities Limited and its subsidiaries,a) The gains are recognised only on settlement / expiry of the derivative instruments.b) All open positions are marked to market and the unrealised gains / loss are netted off on a scrip-wise basis.
Mark-to-market gains, if any, are not recognised.c) Debit / credit balances on open positions are shown as current assets / liabilities, as the case may be.
forming part of the Consolidated Account
schedulesContinued
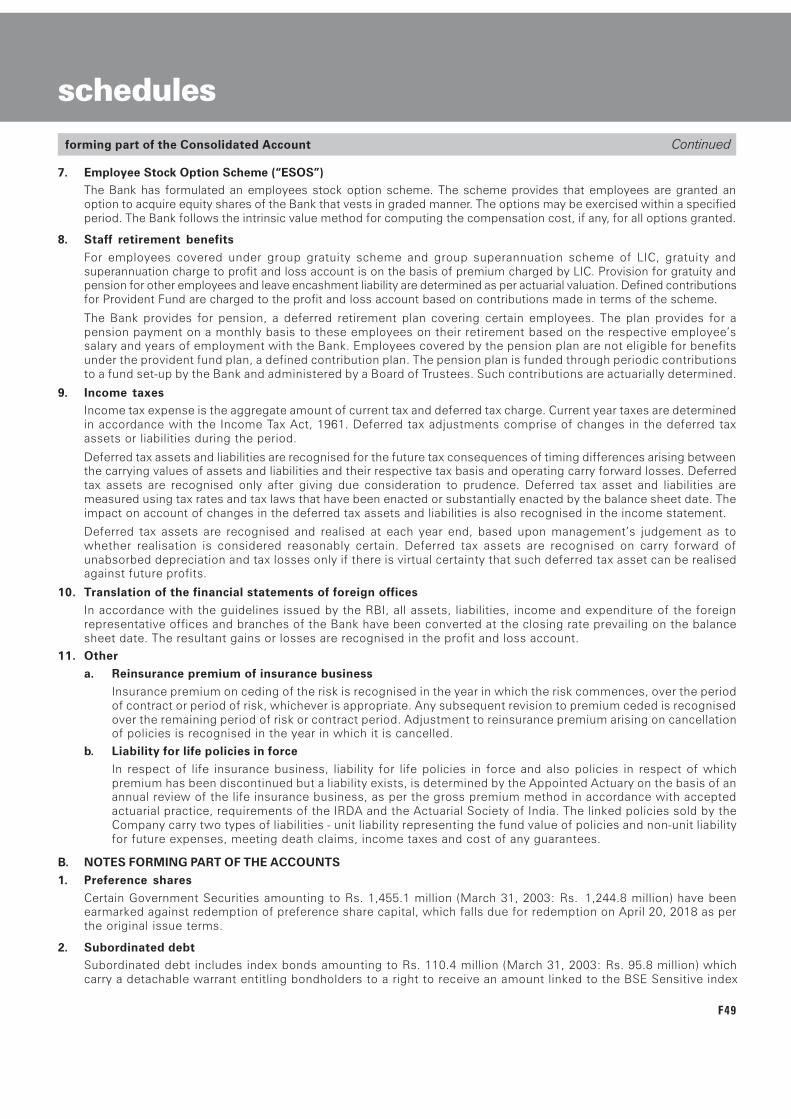
F49
7. Employee Stock Option Scheme (�ESOS�)The Bank has formulated an employees stock option scheme. The scheme provides that employees are granted anoption to acquire equity shares of the Bank that vests in graded manner. The options may be exercised within a specifiedperiod. The Bank follows the intrinsic value method for computing the compensation cost, if any, for all options granted.
8. Staff retirement benefitsFor employees covered under group gratuity scheme and group superannuation scheme of LIC, gratuity andsuperannuation charge to profit and loss account is on the basis of premium charged by LIC. Provision for gratuity andpension for other employees and leave encashment liability are determined as per actuarial valuation. Defined contributionsfor Provident Fund are charged to the profit and loss account based on contributions made in terms of the scheme.
The Bank provides for pension, a deferred retirement plan covering certain employees. The plan provides for apension payment on a monthly basis to these employees on their retirement based on the respective employee�ssalary and years of employment with the Bank. Employees covered by the pension plan are not eligible for benefitsunder the provident fund plan, a defined contribution plan. The pension plan is funded through periodic contributionsto a fund set-up by the Bank and administered by a Board of Trustees. Such contributions are actuarially determined.
9. Income taxesIncome tax expense is the aggregate amount of current tax and deferred tax charge. Current year taxes are determinedin accordance with the Income Tax Act, 1961. Deferred tax adjustments comprise of changes in the deferred taxassets or liabilities during the period.
Deferred tax assets and liabilities are recognised for the future tax consequences of timing differences arising betweenthe carrying values of assets and liabilities and their respective tax basis and operating carry forward losses. Deferredtax assets are recognised only after giving due consideration to prudence. Deferred tax asset and liabilities aremeasured using tax rates and tax laws that have been enacted or substantially enacted by the balance sheet date. Theimpact on account of changes in the deferred tax assets and liabilities is also recognised in the income statement.
Deferred tax assets are recognised and realised at each year end, based upon management�s judgement as towhether realisation is considered reasonably certain. Deferred tax assets are recognised on carry forward ofunabsorbed depreciation and tax losses only if there is virtual certainty that such deferred tax asset can be realisedagainst future profits.
10. Translation of the financial statements of foreign officesIn accordance with the guidelines issued by the RBI, all assets, liabilities, income and expenditure of the foreignrepresentative offices and branches of the Bank have been converted at the closing rate prevailing on the balancesheet date. The resultant gains or losses are recognised in the profit and loss account.
11. Othera. Reinsurance premium of insurance business
Insurance premium on ceding of the risk is recognised in the year in which the risk commences, over the periodof contract or period of risk, whichever is appropriate. Any subsequent revision to premium ceded is recognisedover the remaining period of risk or contract period. Adjustment to reinsurance premium arising on cancellationof policies is recognised in the year in which it is cancelled.
b. Liability for life policies in forceIn respect of life insurance business, liability for life policies in force and also policies in respect of whichpremium has been discontinued but a liability exists, is determined by the Appointed Actuary on the basis of anannual review of the life insurance business, as per the gross premium method in accordance with acceptedactuarial practice, requirements of the IRDA and the Actuarial Society of India. The linked policies sold by theCompany carry two types of liabilities - unit liability representing the fund value of policies and non-unit liabilityfor future expenses, meeting death claims, income taxes and cost of any guarantees.
B. NOTES FORMING PART OF THE ACCOUNTS1. Preference shares
Certain Government Securities amounting to Rs. 1,455.1 million (March 31, 2003: Rs. 1,244.8 million) have beenearmarked against redemption of preference share capital, which falls due for redemption on April 20, 2018 as perthe original issue terms.
2. Subordinated debtSubordinated debt includes index bonds amounting to Rs. 110.4 million (March 31, 2003: Rs. 95.8 million) whichcarry a detachable warrant entitling bondholders to a right to receive an amount linked to the BSE Sensitive index
forming part of the Consolidated Account
schedulesContinued
F50
(�Sensex�) per terms of the issue. The liability of the Bank arising out of changes in the Sensex has been hedged byearmarking its investments of an equivalent amount in the UTI Index Equity Fund whose value is based on theSensex. The Bank has not issued any subordinated debt during the year.
3. Employee stock option scheme
In terms of employee stock option scheme, the maximum number of options granted to any eligible employee in afinancial year shall not exceed 0.05% of the issued equity shares of the Bank at the time of grant of the options andaggregate of all such options granted to the eligible employees shall not exceed 5% of the aggregate number of theissued equity shares of the Bank subsequent to the amalgamation of ICICI, ICICI Capital Services Limited and ICICIPersonal Financial Services Limited with the Bank and the issuance of equity shares by the Bank pursuant to theamalgamation of ICICI, ICICI Capital Services Limited and ICICI Personal Financial Services Limited with the Bank.
In terms of the Scheme, 15,964,982 options (March 31, 2003: 12,610,275 options) granted to eligible employeeswere outstanding at March 31, 2004.
A summary of the status of the Bank�s option plan is given below:
Year ended Year endedMarch 31,2004 March 31,2003
Option shares Option sharesoutstanding outstanding
Outstanding at the beginning of the year ............................................. 12,610,275 13,343,625
Add : Granted during the year .......................................................... 7,491,800 �
Less: Forfeited/lapsed during the year ............................................ 766,489 730,350
Exercised during the year ....................................................... 3,370,604 3,000
Outstanding at the end of the year ........................................................ 15,964,982 12,610,275
4. Early retirement option (�ERO�)The Bank has implemented Early Retirement Option scheme 2003 to its employees in July 2003. All employeeswho had completed 40 years of age and seven years of service with the Bank (including period of service withentities amalgamated with the Bank) were eligible for the ERO.
In accordance with the treatment approved by the RBI, the ex-gratia payments under ERO and termination benefitsand leave encashment in excess of the provisions made (net of tax benefits), aggregating to Rs. 1,910.0 million arebeing amortised over a period of five years commencing August 1, 2003 (the date of retirement of employeesexercising the Option being July 31, 2003).
During the year, an amount of Rs. 256.0 million has been charged to revenue on account of ERO scheme being theproportionate amount amortised for the eight month period ended March 31, 2004.
5. Deferred taxOn March 31, 2004, the Group has recorded net deferred tax asset of Rs. 4,628.8 million, (March 31, 2003 :Rs. 5,063.9 million) which has been included in Other Assets.A composition of deferred tax assets and liabilities into major items is given below:
(Rupees in million)
Particulars March 31, 2004 March 31, 2003
Deferred tax assetAmortisation of premium on investments .......................................... .. � 527.4Provision for bad and doubtful debts .................................................... 13,664.6 13,164.1Others ....................................................................................................... 254.3 889.3
13,918.9 14,580.8Less : Deferred tax liability
Depreciation on fixed assets .................................................. 9,001.5 9,275.0Others ........................................................................................ 288.6 241.9
9,290.1 9,516.9Net Deferred tax asset/(liability) ............................................................. 4,628.8 5,063.9
forming part of the Consolidated Account
schedulesContinued
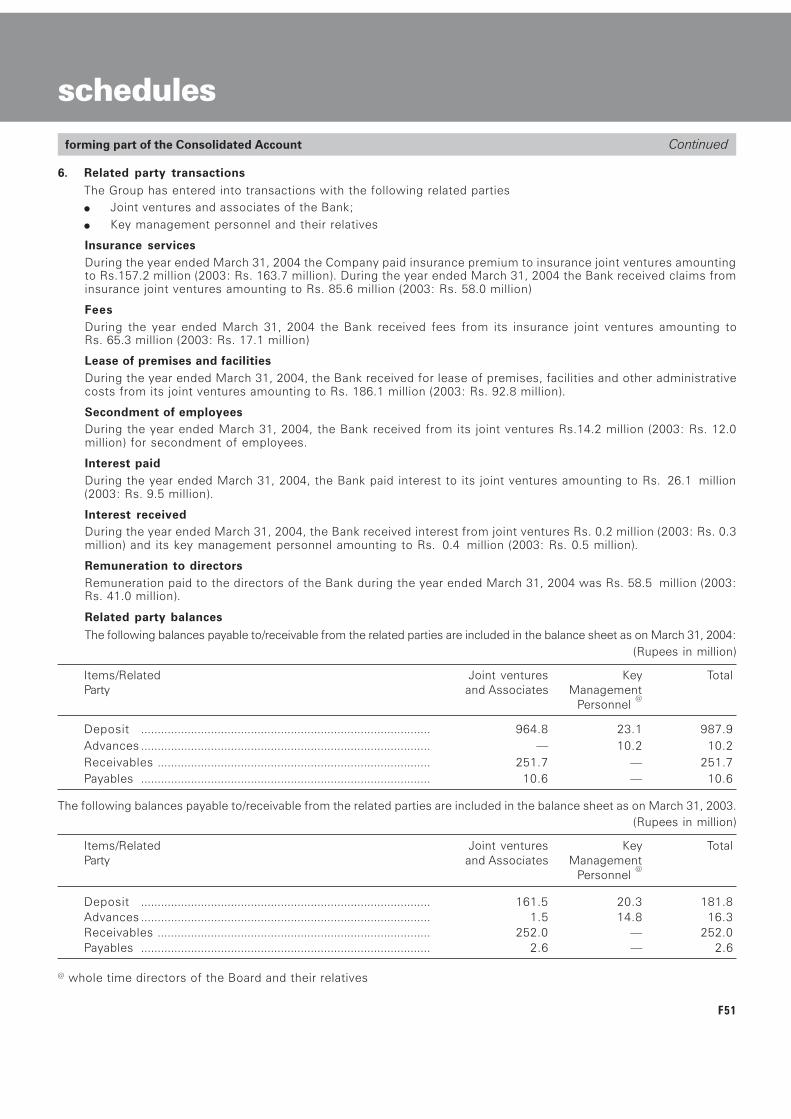
F51
6. Related party transactionsThe Group has entered into transactions with the following related parties● Joint ventures and associates of the Bank;● Key management personnel and their relatives
Insurance servicesDuring the year ended March 31, 2004 the Company paid insurance premium to insurance joint ventures amountingto Rs.157.2 million (2003: Rs. 163.7 million). During the year ended March 31, 2004 the Bank received claims frominsurance joint ventures amounting to Rs. 85.6 million (2003: Rs. 58.0 million)
FeesDuring the year ended March 31, 2004 the Bank received fees from its insurance joint ventures amounting toRs. 65.3 million (2003: Rs. 17.1 million)
Lease of premises and facilitiesDuring the year ended March 31, 2004, the Bank received for lease of premises, facilities and other administrativecosts from its joint ventures amounting to Rs. 186.1 million (2003: Rs. 92.8 million).
Secondment of employeesDuring the year ended March 31, 2004, the Bank received from its joint ventures Rs.14.2 million (2003: Rs. 12.0million) for secondment of employees.
Interest paidDuring the year ended March 31, 2004, the Bank paid interest to its joint ventures amounting to Rs. 26.1 million(2003: Rs. 9.5 million).
Interest receivedDuring the year ended March 31, 2004, the Bank received interest from joint ventures Rs. 0.2 million (2003: Rs. 0.3million) and its key management personnel amounting to Rs. 0.4 million (2003: Rs. 0.5 million).
Remuneration to directorsRemuneration paid to the directors of the Bank during the year ended March 31, 2004 was Rs. 58.5 million (2003:Rs. 41.0 million).
Related party balancesThe following balances payable to/receivable from the related parties are included in the balance sheet as on March 31, 2004:
(Rupees in million)
Items/Related Joint ventures Key TotalParty and Associates Management
Personnel @
Deposit ....................................................................................... 964.8 23.1 987.9Advances ....................................................................................... � 10.2 10.2Receivables .................................................................................. 251.7 � 251.7Payables ....................................................................................... 10.6 � 10.6
The following balances payable to/receivable from the related parties are included in the balance sheet as on March 31, 2003.(Rupees in million)
Items/Related Joint ventures Key TotalParty and Associates Management
Personnel @
Deposit ....................................................................................... 161.5 20.3 181.8Advances ....................................................................................... 1.5 14.8 16.3Receivables .................................................................................. 252.0 � 252.0Payables ....................................................................................... 2.6 � 2.6
@ whole time directors of the Board and their relatives
forming part of the Consolidated Account
schedulesContinued
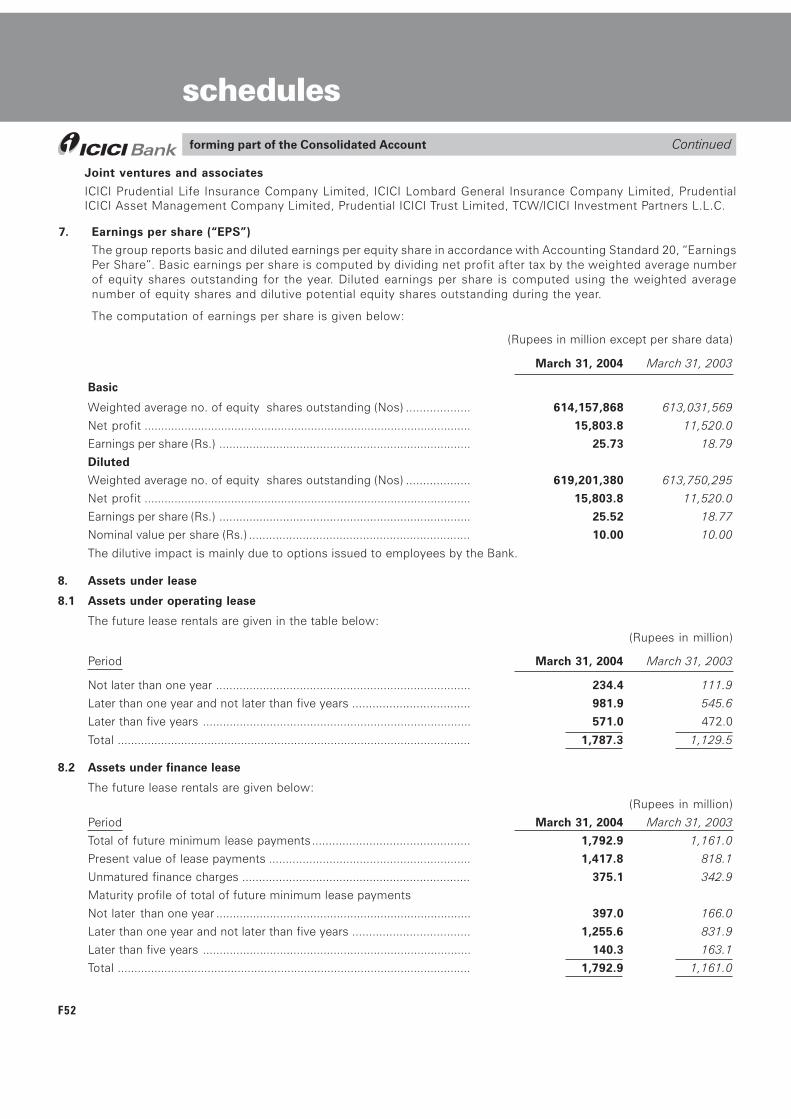
F52
Joint ventures and associates
ICICI Prudential Life Insurance Company Limited, ICICI Lombard General Insurance Company Limited, PrudentialICICI Asset Management Company Limited, Prudential ICICI Trust Limited, TCW/ICICI Investment Partners L.L.C.
7. Earnings per share (�EPS�)
The group reports basic and diluted earnings per equity share in accordance with Accounting Standard 20, �EarningsPer Share�. Basic earnings per share is computed by dividing net profit after tax by the weighted average numberof equity shares outstanding for the year. Diluted earnings per share is computed using the weighted averagenumber of equity shares and dilutive potential equity shares outstanding during the year.
The computation of earnings per share is given below:
(Rupees in million except per share data)
March 31, 2004 March 31, 2003
Basic
Weighted average no. of equity shares outstanding (Nos) ................... 614,157,868 613,031,569
Net profit .................................................................................................. 15,803.8 11,520.0
Earnings per share (Rs.) ........................................................................... 25.73 18.79
Diluted
Weighted average no. of equity shares outstanding (Nos) ................... 619,201,380 613,750,295
Net profit .................................................................................................. 15,803.8 11,520.0
Earnings per share (Rs.) ........................................................................... 25.52 18.77
Nominal value per share (Rs.) .................................................................. 10.00 10.00
The dilutive impact is mainly due to options issued to employees by the Bank.
8. Assets under lease
8.1 Assets under operating lease
The future lease rentals are given in the table below:(Rupees in million)
Period March 31, 2004 March 31, 2003
Not later than one year ............................................................................ 234.4 111.9
Later than one year and not later than five years ................................... 981.9 545.6
Later than five years ................................................................................ 571.0 472.0
Total .......................................................................................................... 1,787.3 1,129.5
8.2 Assets under finance lease
The future lease rentals are given below:(Rupees in million)
Period March 31, 2004 March 31, 2003
Total of future minimum lease payments............................................... 1,792.9 1,161.0
Present value of lease payments ............................................................ 1,417.8 818.1
Unmatured finance charges .................................................................... 375.1 342.9
Maturity profile of total of future minimum lease payments
Not later than one year ............................................................................ 397.0 166.0
Later than one year and not later than five years ................................... 1,255.6 831.9
Later than five years ................................................................................ 140.3 163.1
Total .......................................................................................................... 1,792.9 1,161.0
forming part of the Consolidated Account
schedulesContinued

F53
9. Other
a. Exchange fluctuation
Exchange fluctuation aggregating Rs. 577.8 million (March 31, 2003 : Rs. 923.6 million), which arises onaccount of rupee-tying agreements with the Government of India, is held in �Exchange Fluctuation Suspensewith Government Account� pending adjustment at maturity on receipt of payments from the Governmentfor repayments to foreign lenders.
b. Swap suspense (net)
Swap suspense (net) aggregating Rs. 677.0 million (debit) (March 31, 2003 : Rs. 128.7 million (debit)),which arises out of conversion of foreign currency swaps, is held in �Swap Suspense Account� and will bereversed at conclusion of swap transactions with swap counter parties.
c. Exchange Risk Administration Scheme
Under the Exchange Risk Administration Scheme (�ERAS�), the Government of India has agreed toextend support to the Exchange Risk Administration Fund (�ERAF�), when it is in deficit and recoupits contribution in the event of surplus. The Bank can claim from the positive balance in the ERAFaccount maintained by the Industrial Development Bank of India (IDBI) to the extent of the deficit inthe ERAS Exchange Fluctuation Account. If the balance in the ERAF account with IDBI is insufficient,a cla im wi l l be made on the Government of India through IDBI. The Government of India hasforeclosed the scheme vide their letter F. No 6 (3)/2002-IF.1 dated January 28, 2003. The total amountpayable to the Government of India under the scheme amounting to Rs. 50.0 mil l ion has beenincluded in other l iabil it ies.
10. Proposed dividend
Proposed dividend includes the amount of dividend payable to the shareholders of the equity issue made inApril 2004 (excluding the shares over-allocated under the green shoe option).
11. The profit and loss account for the year ended March 31, 2004, reports appropriations made by ICICI Bankand appropriation of profits made by the subsidiaries amounting to Rs. 513.0 mill ion have not beenconsidered.
12. Information about business and geographical segments
The Group reports its operations into the following segments:
● Consumer and commercial banking comprising the retail and corporate banking business of the Bank,ICICI Home Finance Company Limited, ICICI Bank UK Limited, ICICI Bank Canada and ICICI DistributionFinance Private Limited.
● Investment banking comprising the treasury of the Bank, the investment banking business of ICICISecurities Limited and its subsidiaries ICICI Venture Funds Management Company Limited, ICICI Eco-netInternet & Technology Fund, ICICI Equity Fund, ICICI Strategic Investments Fund, ICICI Emerging SectorFund and ICICI International Limited
● Others comprising ICICI Lombard General Insurance Company Limited, ICICI Prudential Life InsuranceCompany Limited, Prudential ICICI Asset Management Company Limited, Prudential ICICI Trust Limited,ICICI Property Trust, ICICI Investment Management Company Limited, ICICI Trusteeship ServicesLimited and TCW/ICICI Investment Partner L.L.C. whose individual business is presently not materialin relation to the consolidated financials.
Inter segment transactions are generally based on transfer pricing measures as determined bymanagement. Income, expenses, assets and liabilities are either specifically identifiable with individualsegments or have been allocated to segments on a systematic basis.
Based on such allocations, Segmental balance sheet as on March 31, 2004 and segmental profit & lossaccount for the period ended March 31, 2004 have been prepared.
forming part of the Consolidated Account
schedulesContinued
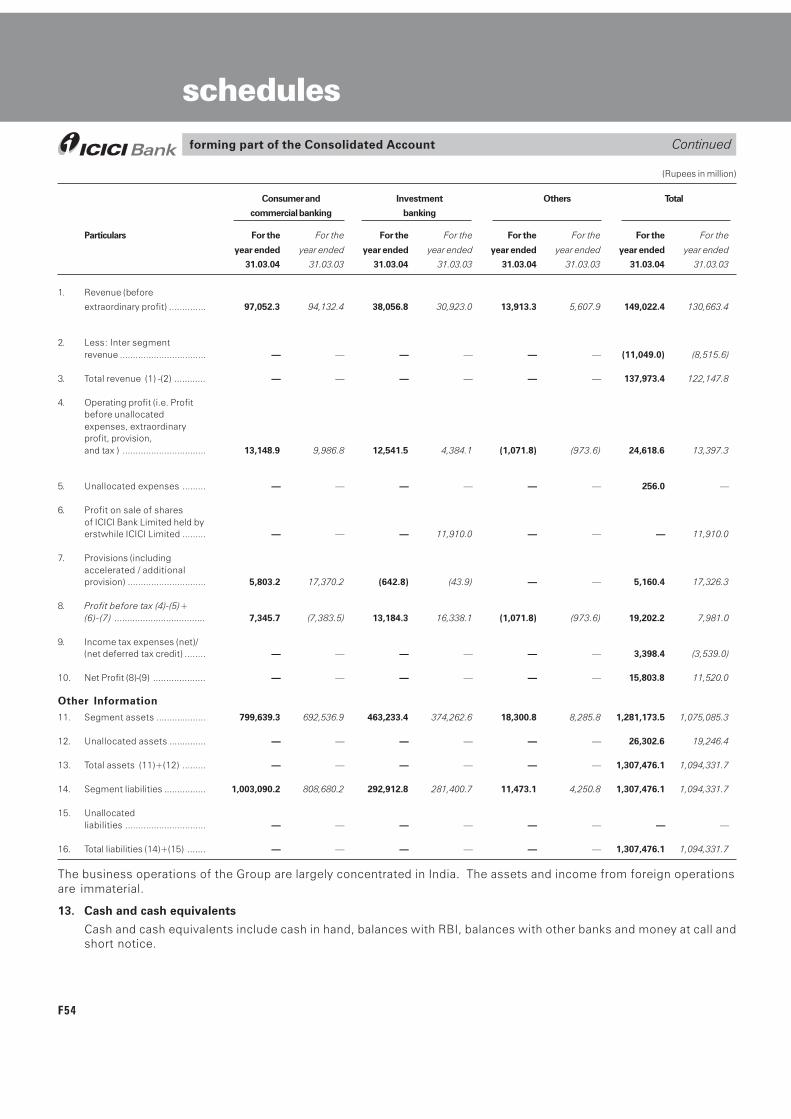
F54
(Rupees in million)
Consumer and Investment Others Total
commercial banking banking
Particulars For the For the For the For the For the For the For the For the
year ended year ended year ended year ended year ended year ended year ended year ended
31.03.04 31.03.03 31.03.04 31.03.03 31.03.04 31.03.03 31.03.04 31.03.03
1. Revenue (before
extraordinary profit) .............. 97,052.3 94,132.4 38,056.8 30,923.0 13,913.3 5,607.9 149,022.4 130,663.4
2. Less: Inter segmentrevenue ................................. � � � � � � (11,049.0) (8,515.6)
3. Total revenue (1) -(2) ............ � � � � � � 137,973.4 122,147.8
4. Operating profit (i.e. Profitbefore unallocatedexpenses, extraordinaryprofit, provision,and tax ) ................................ 13,148.9 9,986.8 12,541.5 4,384.1 (1,071.8) (973.6) 24,618.6 13,397.3
5. Unallocated expenses ......... � � � � � � 256.0 �
6. Profit on sale of sharesof ICICI Bank Limited held byerstwhile ICICI Limited ......... � � � 11,910.0 � � � 11,910.0
7. Provisions (includingaccelerated / additionalprovision) .............................. 5,803.2 17,370.2 (642.8) (43.9) � � 5,160.4 17,326.3
8. Profit before tax (4)-(5)+(6)-(7) ................................... 7,345.7 (7,383.5) 13,184.3 16,338.1 (1,071.8) (973.6) 19,202.2 7,981.0
9. Income tax expenses (net)/(net deferred tax credit) ........ � � � � � � 3,398.4 (3,539.0)
10. Net Profit (8)-(9) .................... � � � � � � 15,803.8 11,520.0
Other Information
11. Segment assets ................... 799,639.3 692,536.9 463,233.4 374,262.6 18,300.8 8,285.8 1,281,173.5 1,075,085.3
12. Unallocated assets .............. � � � � � � 26,302.6 19,246.4
13. Total assets (11)+(12) ......... � � � � � � 1,307,476.1 1,094,331.7
14. Segment liabilities ................ 1,003,090.2 808,680.2 292,912.8 281,400.7 11,473.1 4,250.8 1,307,476.1 1,094,331.7
15. Unallocatedliabilities ............................... � � � � � � � �
16. Total liabilities (14)+(15) ....... � � � � � � 1,307,476.1 1,094,331.7
forming part of the Consolidated Account
schedules
The business operations of the Group are largely concentrated in India. The assets and income from foreign operationsare immaterial.
13. Cash and cash equivalents
Cash and cash equivalents include cash in hand, balances with RBI, balances with other banks and money at call andshort notice.
Continued
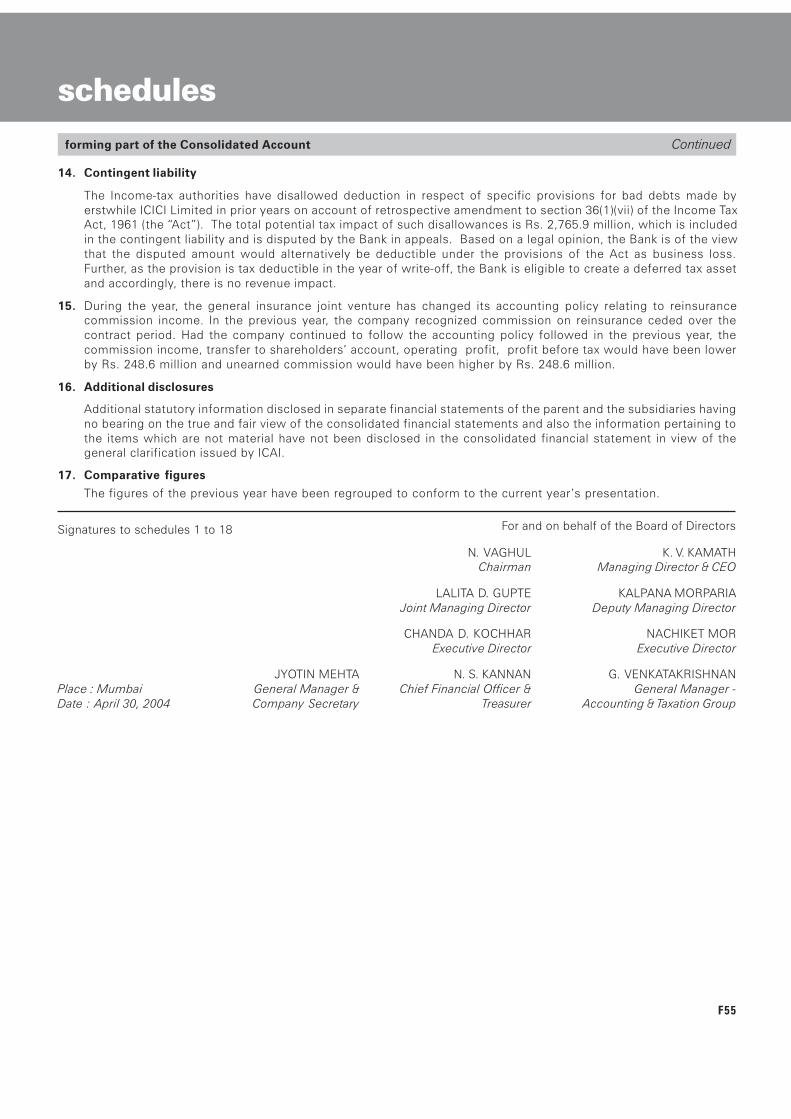
F55
14. Contingent liability
The Income-tax authorities have disallowed deduction in respect of specific provisions for bad debts made byerstwhile ICICI Limited in prior years on account of retrospective amendment to section 36(1)(vii) of the Income TaxAct, 1961 (the �Act�). The total potential tax impact of such disallowances is Rs. 2,765.9 million, which is includedin the contingent liability and is disputed by the Bank in appeals. Based on a legal opinion, the Bank is of the viewthat the disputed amount would alternatively be deductible under the provisions of the Act as business loss.Further, as the provision is tax deductible in the year of write-off, the Bank is eligible to create a deferred tax assetand accordingly, there is no revenue impact.
15. During the year, the general insurance joint venture has changed its accounting policy relating to reinsurancecommission income. In the previous year, the company recognized commission on reinsurance ceded over thecontract period. Had the company continued to follow the accounting policy followed in the previous year, thecommission income, transfer to shareholders� account, operating profit, profit before tax would have been lowerby Rs. 248.6 million and unearned commission would have been higher by Rs. 248.6 million.
16. Additional disclosures
Additional statutory information disclosed in separate financial statements of the parent and the subsidiaries havingno bearing on the true and fair view of the consolidated financial statements and also the information pertaining tothe items which are not material have not been disclosed in the consolidated financial statement in view of thegeneral clarification issued by ICAI.
17. Comparative figures
The figures of the previous year have been regrouped to conform to the current year�s presentation.
Signatures to schedules 1 to 18 For and on behalf of the Board of Directors
N. VAGHULChairman
LALITA D. GUPTEJoint Managing Director
CHANDA D. KOCHHAR Executive Director
N. S. KANNANChief Financial Officer &
Treasurer
K. V. KAMATHManaging Director & CEO
KALPANA MORPARIADeputy Managing Director
NACHIKET MOR Executive Director
G. VENKATAKRISHNANGeneral Manager -
Accounting & Taxation Group
JYOTIN MEHTA General Manager &Company Secretary
Place : MumbaiDate : April 30, 2004
forming part of the Consolidated Account
schedulesContinued
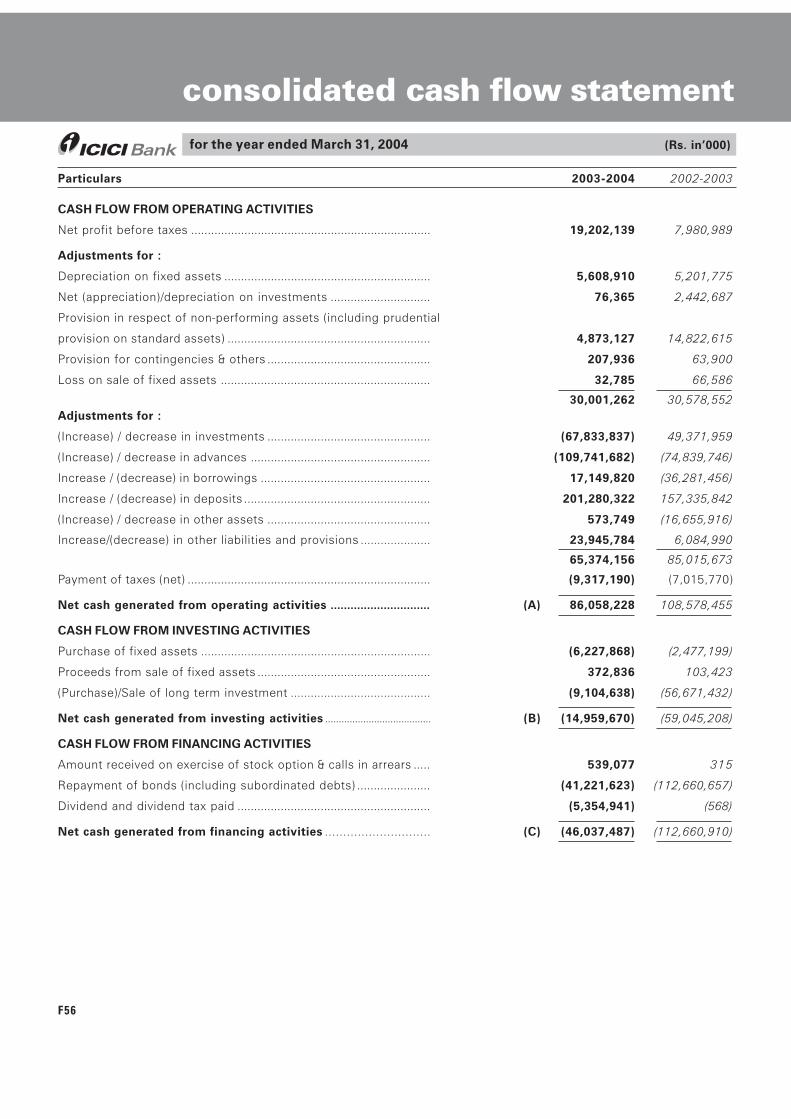
F56
consolidated cash flow statementfor the year ended March 31, 2004
Particulars 2003-2004 2002-2003
CASH FLOW FROM OPERATING ACTIVITIES
Net profit before taxes ........................................................................ 19,202,139 7,980,989
Adjustments for :
Depreciation on fixed assets .............................................................. 5,608,910 5,201,775
Net (appreciation)/depreciation on investments .............................. 76,365 2,442,687
Provision in respect of non-performing assets (including prudential
provision on standard assets) ............................................................. 4,873,127 14,822,615
Provision for contingencies & others ................................................. 207,936 63,900
Loss on sale of fixed assets ............................................................... 32,785 66,586
30,001,262 30,578,552Adjustments for :
(Increase) / decrease in investments ................................................. (67,833,837) 49,371,959
(Increase) / decrease in advances ...................................................... (109,741,682) (74,839,746)
Increase / (decrease) in borrowings ................................................... 17,149,820 (36,281,456)
Increase / (decrease) in deposits ........................................................ 201,280,322 157,335,842
(Increase) / decrease in other assets ................................................. 573,749 (16,655,916)
Increase/(decrease) in other liabilities and provisions ..................... 23,945,784 6,084,990
65,374,156 85,015,673
Payment of taxes (net) ......................................................................... (9,317,190) (7,015,770)
Net cash generated from operating activities .............................. (A) 86,058,228 108,578,455
CASH FLOW FROM INVESTING ACTIVITIES
Purchase of fixed assets ..................................................................... (6,227,868) (2,477,199)
Proceeds from sale of fixed assets .................................................... 372,836 103,423
(Purchase)/Sale of long term investment .......................................... (9,104,638) (56,671,432)
Net cash generated from investing activities ....................................... (B) (14,959,670) (59,045,208)
CASH FLOW FROM FINANCING ACTIVITIES
Amount received on exercise of stock option & calls in arrears ..... 539,077 315
Repayment of bonds (including subordinated debts) ...................... (41,221,623) (112,660,657)
Dividend and dividend tax paid .......................................................... (5,354,941) (568)
Net cash generated from financing activities ............................. (C) (46,037,487) (112,660,910)
(Rs. in�000)

F57
N. VAGHULChairman
LALITA D. GUPTEJoint Managing Director
CHANDA D. KOCHHAR Executive Director
N. S. KANNANChief Financial Officer &
Treasurer
K. V. KAMATHManaging Director & CEO
KALPANA MORPARIADeputy Managing Director
NACHIKET MOR Executive Director
G. VENKATAKRISHNANGeneral Manager -
Accounting & Taxation Group
JYOTIN MEHTA General Manager &Company Secretary
Place : MumbaiDate : April 30, 2004
Cash and cash equivalents represent �Cash and balances with Reserve Bank of India� and �Balances with banks and money at call and short notice�As per our report of even date For and on behalf of the Board of Directors
For S.R. BATLIBOI & CO.Chartered Accountants
per VIREN H. MEHTAa Partner
Particulars 2003-2004 2002-2003
Continuedfor the year ended March 31, 2004
Effect of consolidation of new subsidiary / deconsolidation
of subsidiary on cash & cash equivalents .................................... (D) (673,965) (49,968)
Net increase/(decrease) in cash and cash equivalents .............. (A)+(B)+(C)+(D) 24,387,106 (63,177,631)
Cash and cash equivalents as at 1st April ................................... 65,496,996 128,674,627
Cash and cash equivalents as at 31st March .............................. 89,884,102 65,496,996
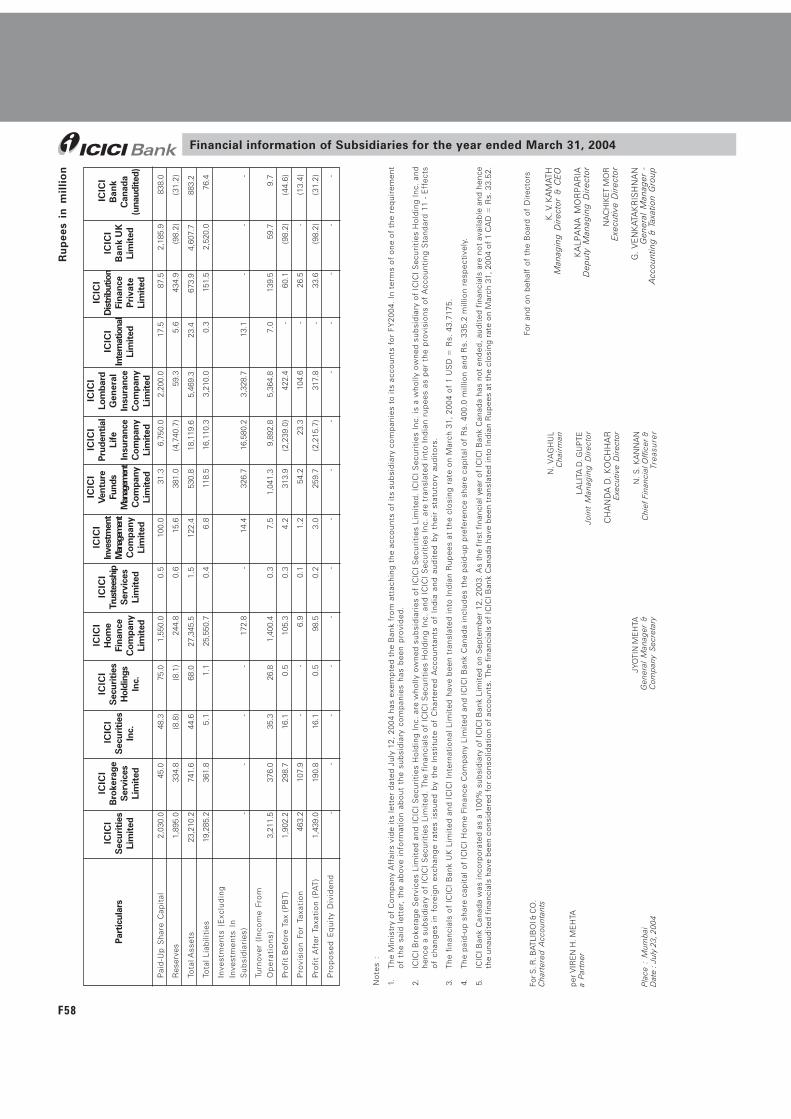
F58
Financial information of Subsidiaries for the year ended March 31, 2004
No
tes
:
1.Th
e M
inis
try
of
Co
mp
any
Aff
airs
vid
e it
s le
tter
dat
ed J
uly
12,
2004
has
exe
mp
ted
the
Ban
k fr
om
att
achi
ng t
he a
cco
unts
of
its
sub
sid
iary
co
mp
anie
s to
its
acco
unts
fo
r FY
2004
. In
ter
ms
of
one
of
the
req
uire
men
to
f th
e sa
id l
ette
r, t
he a
bo
ve i
nfo
rmat
ion
abo
ut t
he s
ubsi
dia
ry c
om
pan
ies
has
bee
n p
rovi
ded
.
2.IC
ICI
Bro
kera
ge
Ser
vice
s Li
mit
ed a
nd I
CIC
I S
ecur
itie
s H
old
ing
Inc
. ar
e w
holly
ow
ned
sub
sid
iari
es o
f IC
ICI
Sec
urit
ies
Lim
ited
. IC
ICI
Sec
urit
ies
Inc.
is a
who
lly o
wne
d s
ubsi
dia
ry o
f IC
ICI
Sec
urit
ies
Ho
ldin
g I
nc.
and
henc
e a
sub
sid
iary
of
ICIC
I S
ecur
itie
s Li
mit
ed.
The
fina
ncia
ls o
f IC
ICI
Sec
urit
ies
Ho
ldin
g I
nc.
and
IC
ICI
Sec
urit
ies
Inc.
are
tra
nsla
ted
int
o I
ndia
n ru
pee
s as
per
the
pro
visi
ons
of
Acc
oun
ting
Sta
ndar
d 1
1 -
Eff
ects
of
chan
ges
in
fore
ign
exch
ang
e ra
tes
issu
ed b
y th
e In
stit
ute
of
Cha
rter
ed A
cco
unta
nts
of
Ind
ia a
nd a
udit
ed b
y th
eir
stat
uto
ry a
udit
ors
.
3.Th
e fi
nanc
ials
of
ICIC
I B
ank
UK
Lim
ited
and
IC
ICI
Inte
rnat
iona
l Lim
ited
hav
e b
een
tran
slat
ed in
to I
ndia
n R
upee
s at
the
clo
sing
rat
e o
n M
arch
31,
200
4 o
f 1
US
D =
Rs.
43.
7175
.
4.Th
e p
aid
-up
sha
re c
apit
al o
f IC
ICI
Ho
me
Fina
nce
Co
mp
any
Lim
ited
and
IC
ICI
Ban
k C
anad
a in
clud
es t
he p
aid
-up
pre
fere
nce
shar
e ca
pit
al o
f R
s. 4
00.0
mill
ion
and
Rs.
335
.2 m
illio
n re
spec
tive
ly.
5.IC
ICI B
ank
Can
ada
was
inco
rpo
rate
d a
s a
100%
sub
sid
iary
of
ICIC
I Ban
k Li
mit
ed o
n S
epte
mb
er 1
2, 2
003.
As
the
firs
t fi
nanc
ial y
ear
of IC
ICI B
ank
Can
ada
has
not
end
ed, a
udit
ed f
inan
cial
s ar
e no
t av
aila
ble
and
hen
ceth
e un
aud
ited
fin
anci
als
have
bee
n co
nsid
ered
for
con
solid
atio
n of
acc
ount
s. T
he f
inan
cial
s of
ICIC
I Ban
k C
anad
a ha
ve b
een
tran
slat
ed in
to In
dia
n R
upee
s at
the
clo
sing
rat
e on
Mar
ch 3
1, 2
004
of 1
CA
D =
Rs.
33.
52.
For
and
on b
ehal
f of
the
Boa
rd o
f D
irec
tors
N.
VA
GH
UL
Cha
irm
an
LALI
TA D
. GU
PTE
Join
t M
anag
ing
Dir
ecto
r
CH
AN
DA
D. K
OC
HH
AR
Exe
cutiv
e D
irec
tor
N. S
. KA
NN
AN
Chi
ef F
inan
cial
Off
icer
&Tr
eas
ure
r
K. V
. KA
MAT
HM
anag
ing
Dir
ecto
r &
CE
O
KA
LPA
NA
MO
RP
AR
IAD
eput
y M
anag
ing
Dir
ecto
r
NA
CH
IKE
T M
OR
Exe
cutiv
e D
irec
tor
G.
VE
NK
ATA
KR
ISH
NA
NG
ener
al M
anag
er -
Acc
ount
ing
& T
axat
ion
Gro
up
JYO
TIN
ME
HTA
Gen
eral
Man
ager
&C
omp
any
Secr
etar
y
For S
. R. B
ATLI
BO
I & C
O.
Cha
rter
ed A
ccou
ntan
ts
per V
IRE
N H
. ME
HTA
a P
artn
er
Pla
ce :
Mum
bai
Dat
e : J
uly
23, 2
004
Ru
pee
s in
mil
lio
n
Pai
d-U
p S
hare
Cap
ital
2,0
30.0
45.
0 4
8.3
75.
0 1
,550
.0 0
.5 1
00.0
31.
3 6
,750
.0 2
,200
.0 1
7.5
87.
5 2
,185
.9 8
38.0
Res
erve
s 1
,895
.0 3
34.8
(8.8
) (8
.1)
244
.8 0
.6 1
5.6
381
.0 (4
,740
.7)
59.
3 5
.6 4
34.9
(98.
2) (3
1.2)
Tota
l Ass
ets
23,
210.
2 7
41.6
44.
6 6
8.0
27,
345.
5 1
.5 1
22.4
530
.8 1
8,11
9.6
5,4
69.3
23.
4 6
73.9
4,6
07.7
883
.2
Tota
l Lia
bili
ties
19,
285.
2 3
61.8
5.1
1.1
25,
550.
7 0
.4 6
.8 1
18.5
16,
110.
3 3
,210
.0 0
.3 1
51.5
2,5
20.0
76.
4
Inve
stm
ents
(E
xclu
din
gIn
vest
men
ts I
nS
ub
sid
iari
es)
- -
- -
172
.8-
14.
4 3
26.7
16,
580.
2 3
,328
.7 1
3.1
- -
-
Turn
ove
r (I
nco
me
Fro
mO
pe
rati
on
s) 3
,211
.5 3
76.0
35.
3 2
6.8
1,4
00.4
0.3
7.5
1,0
41.3
9,8
92.8
5,3
64.8
7.0
139
.5 5
9.7
9.7
Pro
fit
Bef
ore
Tax
(P
BT)
1,9
02.2
298
.7 1
6.1
0.5
105
.3 0
.3 4
.2 3
13.9
(2,2
39.0
) 4
22.4
- 6
0.1
(98.
2) (4
4.6)
Pro
visi
on
Fo
r Ta
xati
on
463
.2 1
07.9
- -
6.9
0.1
1.2
54.
2 2
3.3
104
.6 -
26.
5 -
(13.
4)
Pro
fit
Aft
er T
axat
ion
(PA
T) 1
,439
.0 1
90.8
16.
1 0
.5 9
8.5
0.2
3.0
259
.7 (2
,215
.7)
317
.8 -
33.
6 (9
8.2)
(31.
2)
Pro
po
sed
Eq
uit
y D
ivid
end
--
- -
- -
- -
- -
--
- -
Part
icul
ars
ICIC
IB
ank
Can
ada
(una
udite
d)
ICIC
IS
ecur
itie
sLi
mit
ed
ICIC
IB
roke
rage
Ser
vice
sLi
mit
ed
ICIC
IS
ecur
itie
sIn
c.
ICIC
IS
ecur
itie
sH
oldi
ngs
Inc.
ICIC
IH
ome
Fina
nce
Com
pany
Lim
ited
ICIC
ITr
uste
eshi
pS
ervi
ces
Lim
ited
ICIC
IIn
vest
men
tM
anag
emen
tC
ompa
nyLi
mit
ed
ICIC
IVe
ntur
eFu
nds
Man
agem
ent
Com
pany
Lim
ited
ICIC
IPr
uden
tial
Life
Insu
ranc
eC
ompa
nyLi
mit
ed
ICIC
ILo
mba
rdG
ener
alIn
sura
nce
Com
pany
Lim
ited
ICIC
IIn
tern
atio
nal
Lim
ited
ICIC
ID
istr
ibut
ion
Fina
nce
Priv
ate
Lim
ited
ICIC
IB
ank
UK
Lim
ited
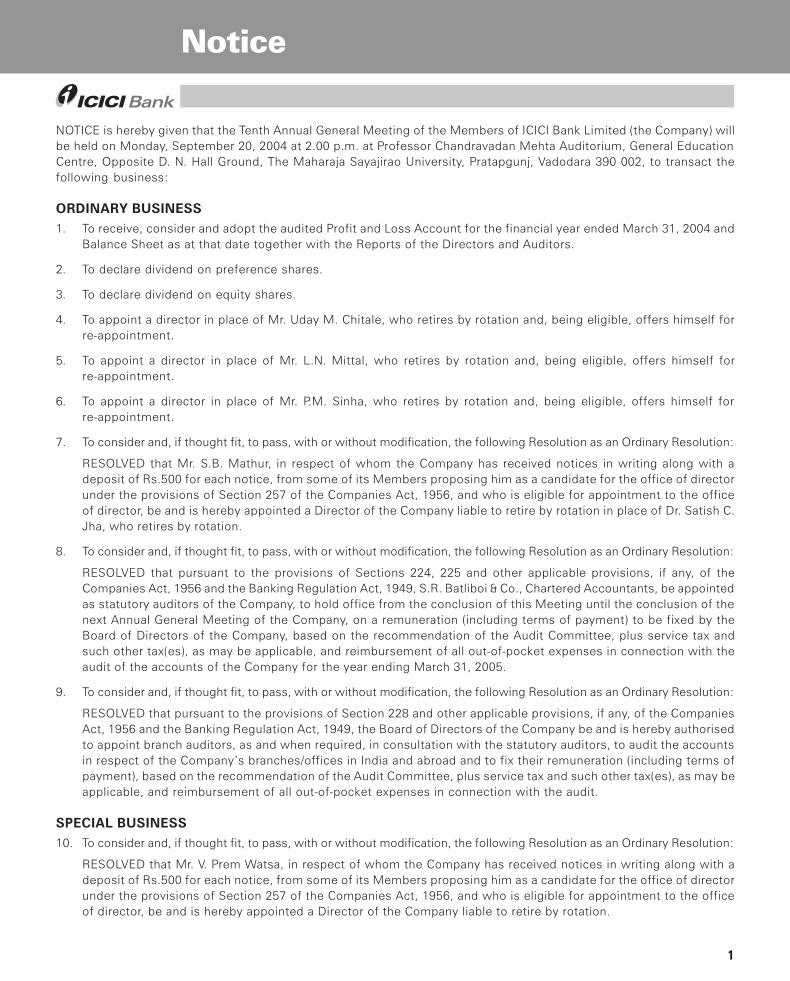
1
NOTICE is hereby given that the Tenth Annual General Meeting of the Members of ICICI Bank Limited (the Company) willbe held on Monday, September 20, 2004 at 2.00 p.m. at Professor Chandravadan Mehta Auditorium, General EducationCentre, Opposite D. N. Hall Ground, The Maharaja Sayajirao University, Pratapgunj, Vadodara 390 002, to transact thefollowing business:
ORDINARY BUSINESS1. To receive, consider and adopt the audited Profit and Loss Account for the financial year ended March 31, 2004 and
Balance Sheet as at that date together with the Reports of the Directors and Auditors.
2. To declare dividend on preference shares.
3. To declare dividend on equity shares.
4. To appoint a director in place of Mr. Uday M. Chitale, who retires by rotation and, being eligible, offers himself forre-appointment.
5. To appoint a director in place of Mr. L.N. Mittal, who retires by rotation and, being eligible, offers himself forre-appointment.
6. To appoint a director in place of Mr. P.M. Sinha, who retires by rotation and, being eligible, offers himself forre-appointment.
7. To consider and, if thought fit, to pass, with or without modification, the following Resolution as an Ordinary Resolution:
RESOLVED that Mr. S.B. Mathur, in respect of whom the Company has received notices in writing along with adeposit of Rs.500 for each notice, from some of its Members proposing him as a candidate for the office of directorunder the provisions of Section 257 of the Companies Act, 1956, and who is eligible for appointment to the officeof director, be and is hereby appointed a Director of the Company liable to retire by rotation in place of Dr. Satish C.Jha, who retires by rotation.
8. To consider and, if thought fit, to pass, with or without modification, the following Resolution as an Ordinary Resolution:
RESOLVED that pursuant to the provisions of Sections 224, 225 and other applicable provisions, if any, of theCompanies Act, 1956 and the Banking Regulation Act, 1949, S.R. Batliboi & Co., Chartered Accountants, be appointedas statutory auditors of the Company, to hold office from the conclusion of this Meeting until the conclusion of thenext Annual General Meeting of the Company, on a remuneration (including terms of payment) to be fixed by theBoard of Directors of the Company, based on the recommendation of the Audit Committee, plus service tax andsuch other tax(es), as may be applicable, and reimbursement of all out-of-pocket expenses in connection with theaudit of the accounts of the Company for the year ending March 31, 2005.
9. To consider and, if thought fit, to pass, with or without modification, the following Resolution as an Ordinary Resolution:
RESOLVED that pursuant to the provisions of Section 228 and other applicable provisions, if any, of the CompaniesAct, 1956 and the Banking Regulation Act, 1949, the Board of Directors of the Company be and is hereby authorisedto appoint branch auditors, as and when required, in consultation with the statutory auditors, to audit the accountsin respect of the Company�s branches/offices in India and abroad and to fix their remuneration (including terms ofpayment), based on the recommendation of the Audit Committee, plus service tax and such other tax(es), as may beapplicable, and reimbursement of all out-of-pocket expenses in connection with the audit.
SPECIAL BUSINESS10. To consider and, if thought fit, to pass, with or without modification, the following Resolution as an Ordinary Resolution:
RESOLVED that Mr. V. Prem Watsa, in respect of whom the Company has received notices in writing along with adeposit of Rs.500 for each notice, from some of its Members proposing him as a candidate for the office of directorunder the provisions of Section 257 of the Companies Act, 1956, and who is eligible for appointment to the officeof director, be and is hereby appointed a Director of the Company liable to retire by rotation.
Notice
2
11. To consider and, if thought fit, to pass, with or without modification, the following Resolution as an Ordinary Resolution:
RESOLVED that, in partial modification of the Resolution passed by the Members at their Eighth Annual General Meeting(AGM) held on September 16, 2002, vide Item No.13 of the Notice convening that Meeting, relating to the appointmentand payment of remuneration to Mr. K.V. Kamath as the Managing Director & CEO, the salary range of Mr. K.V. Kamath,effective April 1, 2004, be revised to Rs.600,000 - Rs.1,050,000 per month and the performance bonus to be paid to himbe modified from 100% of the annual salary to the average percentage of performance bonus paid to the employees,subject to such approvals as may be required, other terms and conditions of the appointment remaining the same.
RESOLVED FURTHER that the Board or any Committee thereof, be and is hereby authorised to decide the remuneration(salary, perquisites and bonus) payable to Mr. K.V. Kamath, within the terms approved by the Members at their AGMheld on September 16, 2002, revised and modified as above, subject to such approvals as may be required.
12. To consider and, if thought fit, to pass, with or without modification, the following Resolution as an Ordinary Resolution:
RESOLVED that, in partial modification of the Resolution passed by the Members at their Extraordinary General Meeting(EGM) held on March 12, 2004, vide Item No.2 of the Notice convening that Meeting, relating to the re-appointment ofMs. Lalita D. Gupte as the Joint Managing Director, the salary range of Ms. Lalita D. Gupte, effective April 1, 2004, berevised to Rs.400,000 - Rs.900,000 per month and the performance bonus to be paid to her be modified from 100% ofthe annual salary to the average percentage of performance bonus paid to the employees, subject to such approvals asmay be required, other terms and conditions of the re-appointment remaining the same.
RESOLVED FURTHER that the Board or any Committee thereof, be and is hereby authorised to decide the remuneration(salary, perquisites and bonus) payable to Ms. Lalita D. Gupte, within the terms approved by the Members at theirEGM held on March 12, 2004, revised and modified as above, subject to such approvals as may be required.
13. To consider and, if thought fit, to pass, with or without modification, the following Resolution as an Ordinary Resolution:
RESOLVED that, in partial modification of the Resolution passed by the Members at their Eighth Annual GeneralMeeting (AGM) held on September 16, 2002, vide Item No.17 of the Notice convening that Meeting, relating to theappointment and payment of remuneration to Ms. Kalpana Morparia as the Executive Director (since elevated as theDeputy Managing Director effective February 1, 2004), the salary range of Ms. Kalpana Morparia, effective April 1,2004, be revised to Rs.300,000 - Rs.900,000 per month and the performance bonus to be paid to her be modifiedfrom 100% of the annual salary to the average percentage of performance bonus paid to the employees, subject tosuch approvals as may be required, other terms and conditions of the appointment remaining the same.
RESOLVED FURTHER that the Board or any Committee thereof, be and is hereby authorised to decide the remuneration(salary, perquisites and bonus) payable to Ms. Kalpana Morparia, within the terms approved by the Members at theirAGM held on September 16, 2002, revised and modified as above, subject to such approvals as may be required.
14. To consider and, if thought fit, to pass, with or without modification, the following Resolution as an Ordinary Resolution:
RESOLVED that, in partial modification of the Resolution passed by the Members at their Eighth Annual General Meeting(AGM) held on September 16, 2002, vide Item No.20 of the Notice convening that Meeting, relating to the payment ofremuneration to Ms. Chanda D. Kochhar as the Executive Director, the salary range of Ms. Chanda D. Kochhar, effectiveApril 1, 2004, be revised to Rs.200,000 - Rs.500,000 per month and the performance bonus to be paid to her be modifiedfrom 100% of the annual salary to the average percentage of performance bonus paid to the employees, subject to suchapprovals as may be required, other terms and conditions of the appointment remaining the same.
RESOLVED FURTHER that the Board or any Committee thereof, be and is hereby authorised to decide the remuneration(salary, perquisites and bonus) payable to Ms. Chanda D. Kochhar, within the terms approved by the Members at theirAGM held on September 16, 2002, revised and modified as above, subject to such approvals as may be required.
15. To consider and, if thought fit, to pass, with or without modification, the following Resolution as an Ordinary Resolution:
RESOLVED that, in partial modification of the Resolution passed by the Members at their Eighth Annual General Meeting(AGM) held on September 16, 2002, vide Item No.21 of the Notice convening that Meeting, relating to the payment ofremuneration to Dr. Nachiket Mor as the Executive Director, the salary range of Dr. Nachiket Mor, effective April 1, 2004,be revised to Rs.200,000 - Rs.500,000 per month and the performance bonus to be paid to him be modified from 100%
3
of the annual salary to the average percentage of performance bonus paid to the employees, subject to such approvalsas may be required, other terms and conditions of the appointment remaining the same.
RESOLVED FURTHER that the Board or any Committee thereof, be and is hereby authorised to decide the remuneration(salary, perquisites and bonus) payable to Dr. Nachiket Mor, within the terms approved by the Members at their AGMheld on September 16, 2002, revised and modified as above, subject to such approvals as may be required.
16. To consider and, if thought fit, to pass, with or without modification, the following Resolution as a Special Resolution:
RESOLVED that pursuant to the provisions of Section 81 and other applicable provisions, if any, of the Companies Act, 1956(including any amendment thereto or re-enactment thereof), and in accordance with the provisions of the Memorandumand Articles of Association of the Company and the regulations/guidelines, prescribed by Securities and Exchange Board ofIndia or any other relevant authority, from time to time, to the extent applicable and subject to such approvals, consents,permissions and sanctions, as may be required, and subject to such conditions as may be prescribed by any of them whilegranting such approvals, consents, permissions and sanctions, which the Board of Directors of the Company (hereinafterreferred to as �the Board�, which term shall be deemed to include any Committee constituted/to be constituted by theBoard to exercise its powers including the powers conferred by this Resolution) is hereby authorised to accept, the Boardbe and is hereby authorised on behalf of the Company, to create, offer, issue and allot, to or for the benefit of such person(s)as are in the permanent employment and the Directors (including the wholetime Directors) of the Company, at any time,equity shares of the Company and/or warrants (whether attached to any security or not) with an option exercisable by thewarrant-holder to subscribe for equity shares/equity linked securities and/or bonds, debentures, preference shares or othersecurities convertible into equity shares at such price, in such manner, during such period, in one or more tranches and onsuch terms and conditions as the Board may decide prior to the issue and offer thereof, for, or which upon exercise orconversion could give rise to the issue of a number of equity shares not exceeding in aggregate (including any equityshares issued pursuant to the Resolution at Item No.17 of the Notice), five per cent of the aggregate of the number ofissued equity shares of the Company, from time to time, on the date(s) of the grant of option(s) under ICICI Bank EmployeesStock Option Scheme (ESOS), as placed at the Meeting.
RESOLVED FURTHER that subject to the terms stated herein, the equity shares allotted pursuant to the aforesaidResolution shall in all respects rank pari passu inter se as also with the then existing equity shares of the Company.
RESOLVED FURTHER that for the purpose of giving effect to any creation, offer, issue or allotment of equity sharesor securities or instruments representing the same, as described above, the Board be and is hereby authorised onbehalf of the Company to do all such acts, deeds, matters and things as it may, in its absolute discretion, deemnecessary or desirable for such purpose, and with power on behalf of the Company to settle all questions, difficultiesor doubts that may arise in regard to such issue(s) or allotment(s) (including to amend or modify any of the terms ofsuch issue or allotment), as it may, in its absolute discretion deem fit, without being required to seek any furtherconsent or approval of the Members.
RESOLVED FURTHER that the Board be and is hereby authorised to vary or modify the terms of ESOS in accordance withany guidelines or regulations that may be issued, from time to time, by any appropriate authority unless such variation,modification or alteration is detrimental to the interests of the employees/Directors (including the wholetime Directors).
RESOLVED FURTHER that the Board be and is hereby authorised to delegate all or any of the powers hereinconferred to any Committee of Directors, or any one or more of the wholetime Directors of the Company.
17. To consider and, if thought fit, to pass, with or without modification, the following Resolution as a Special Resolution:
RESOLVED that pursuant to the provisions of Section 81 and other applicable provisions, if any, of the Companies Act, 1956(including any amendment thereto or re-enactment thereof), and in accordance with the provisions of the Memorandumand Articles of Association of the Company and the regulations/guidelines, prescribed by Securities and Exchange Board ofIndia or any other relevant authority, from time to time, to the extent applicable and subject to such approvals, consents,permissions and sanctions, as may be required, and subject to such conditions as may be prescribed by any of them whilegranting such approvals, consents, permissions and sanctions, which the Board of Directors of the Company (hereinafterreferred to as �the Board�, which term shall be deemed to include any Committee constituted/to be constituted by theBoard to exercise its powers including the powers conferred by this Resolution) is hereby authorised to accept, the Boardbe and is hereby authorised on behalf of the Company, to create, offer, issue and allot, to or for the benefit of such person(s)
4
as are in the permanent employment and the Directors (including the wholetime Directors) of a subsidiary company and aholding company of the Company, at any time, equity shares of the Company and/or warrants (whether attached to anysecurity or not) with an option exercisable by the warrant-holder to subscribe for equity shares/equity linked securities and/or bonds, debentures, preference shares or other securities convertible into equity shares at such price, in such manner,during such period, in one or more tranches and on such terms and conditions as the Board may decide prior to the issueand offer thereof, for, or which upon exercise or conversion could give rise to the issue of a number of equity shares notexceeding in aggregate (including any equity shares issued pursuant to the Resolution at Item No.16 of the Notice), five percent of the aggregate of the number of issued equity shares of the Company, from time to time, on the date(s) of the grantof option(s) under ICICI Bank Employees Stock Option Scheme, as placed at the Meeting.
RESOLVED FURTHER that subject to the terms stated herein, the equity shares allotted pursuant to the aforesaidResolution shall in all respects rank pari passu inter se as also with the then existing equity shares of the Company.
RESOLVED FURTHER that for the purpose of giving effect to any creation, offer, issue or allotment of equity sharesor securities or instruments representing the same, as described above, the Board be and is hereby authorised onbehalf of the Company to do all such acts, deeds, matters and things as it may, in its absolute discretion, deemnecessary or desirable for such purpose, and with power on behalf of the Company to settle all questions, difficultiesor doubts that may arise in regard to such issue(s) or allotment(s) (including to amend or modify any of the terms ofsuch issue or allotment), as it may, in its absolute discretion deem fit, without being required to seek any furtherconsent or approval of the Members.
RESOLVED FURTHER that the Board be and is hereby authorised to delegate all or any of the powers hereinconferred to any Committee of Directors, or any one or more of the wholetime Directors of the Company.
NOTES :a) The relative Explanatory Statement pursuant to Section 173(2) of the Companies Act, 1956, in respect of each of the
Item Nos.7 and 10 to 17 set out in the Notice is annexed hereto.
b) A MEMBER ENTITLED TO ATTEND AND VOTE IS ENTITLED TO APPOINT A PROXY TO ATTEND AND, ON A POLL, TOVOTE INSTEAD OF HIMSELF. SUCH A PROXY NEED NOT BE A MEMBER OF THE COMPANY. PROXIES, IN ORDER TOBE VALID AND EFFECTIVE, MUST BE DELIVERED AT THE REGISTERED OR CORPORATE OFFICE OF THE COMPANYNOT LATER THAN FORTY-EIGHT HOURS BEFORE THE COMMENCEMENT OF THE MEETING.
c) Members holding shares in physical form are requested to immediately notify change in their address, if any, to theRegistrar and Transfer Agent of the Company namely, ICICl lnfotech Limited, Maratha Mandir Annexe, Dr. A. R. NairRoad, Mumbai Central, Mumbai 400 008, quoting their Folio Number(s). Members holding shares in electronic formmay update such details with their respective Depository Participant(s).
d) Members are requested to note that the Company�s shares are under compulsory demat trading for all investors.Members are, therefore, requested to dematerialise their shareholding to avoid inconvenience.
e) The equity shares/bonds of the Company have been delisted from the stock exchanges at Chennai, Delhi, Kolkataand Vadodara. The equity shares/bonds will continue to be listed and traded on The Stock Exchange, Mumbai (BSE)and National Stock Exchange of India Limited (NSE).
f) The Register of Members and the Share Transfer Book of the Company will remain closed from Saturday,September 4, 2004 to Monday, September 20, 2004 (both days inclusive).
Dividend for the year ended March 31, 2004, at Rs.7.50 per fully paid-up equity share, if declared at the Meeting, willbe paid on and from Wednesday, September 22, 2004:
(i) to those Members, holding shares in physical form, whose names appear on the Register of Members of theCompany, at the close of business hours on Monday, September 20, 2004, after giving effect to all validtransfers in physical form lodged with the Company and its Registrar and Transfer Agent on or before Friday,September 3, 2004; and
(ii) in respect of shares held in electronic form, on the basis of beneficial ownership as per the details furnished byNational Securities Depository Limited (NSDL) and Central Depository Services (India) Limited (CDSL) at theclose of business hours on Friday, September 3, 2004.
5
In terms of the directives of Securities and Exchange Board of India, shares issued by companies should rank pari passuin all respects, including dividend entitlement, and hence, the equity shares allotted/to be allotted by the Companyduring the period April 1, 2004 to September 3, 2004 under the ICICI Bank Employees Stock Option Scheme and theequity shares allotted under the public issue (including allotment under Green Shoe Option) in April/May 2004 will beentitled for full dividend that may be declared at the Meeting for the financial year ended March 31, 2004.
In terms of the Call Notice dated May 31, 2004, the holders of partly paid equity shares issued under the public issuein April 2004 were required to pay the call money on or before June 23, 2004. In terms of the provisions of Article175 of the Articles of Association of the Company read with Section 93 of the Companies Act, 1956, dividend will bepaid to the holders of equity shares on which calls are in arrears, in proportion to the amount of capital paid-up oneach share as on September 3, 2004, being the date before the closure of the Register of Members and the ShareTransfer Book of the Company.
g) In order to avoid fraudulent encashment of dividend warrants, Members are requested to send to the Registrar andTransfer Agent of the Company, at the above mentioned address, on or before September 3, 2004, the informationrelating to the name and address of their banker, branch, PIN code and particulars of the bank account, under thesignature of the Sole/First joint holder. This information will be printed on the dividend warrants.
h) Pursuant to the provisions of Section 205A of the Companies Act, 1956, the amount of unclaimed dividend up to thefinancial year ended March 31, 1996 has been transferred to the General Revenue Account of the Central Governmentas required by the Companies Unpaid Dividend (Transfer to General Revenue Account of the Central Government)Rules, 1978.
Pursuant to the provisions of Section 205C of the Companies Act, 1956, the amount of dividend remaining unclaimedfor a period of seven years from the date of its transfer to the Unpaid Dividend Account of the Company is requiredto be transferred to the Investor Education and Protection Fund (IEPF) established by the Central Government and,thereafter, no payments shall be made by the Company or by the IEPF in respect of such amounts.
Members who have not yet encashed their dividend warrant(s) for the financial year ended March 31, 1997 and subsequentyears are requested to submit their claims to the Registrar and Transfer Agent of the Company without any delay.
i) Members may avail of the nomination facility as provided under Section 109A of the Companies Act, 1956.
j) Pursuant to the requirements on corporate governance under the listing agreements entered into with the stockexchanges, the information about the Directors proposed to be appointed/re-appointed is given in the Annexure tothe Notice.
k) Members desirous of getting any information about the accounts and operations of the Company are requested towrite to the Company at least seven days before the date of the Meeting to enable the Company to keep theinformation ready at the Meeting.
l) All the documents referred to in the Notice and Explanatory Statement will be available for inspection by theMembers at the Registered and Corporate Office of the Company between 10.30 a.m. and 12.30 p.m. on all workingdays from the date hereof up to the date of the Meeting.
By Order of the Board
JYOTIN MEHTAMumbai, July 23, 2004 General Manager &
Company Secretary
Registered Office: Corporate Office:Landmark ICICI Bank TowersRace Course Circle Bandra-Kurla ComplexVadodara 390 007 Mumbai 400 051
6
Explanatory Statement
Item No.7Although not strictly necessary, the Explanatory Statement is being given in respect of Item No.7 of the Notice.Mr. S.B. Mathur, who has been appointed as an additional Director under Section 260 of the Companies Act, 1956 effectiveJanuary 29, 2004 holds office up to the date of the Tenth Annual General Meeting of the Company as provided under Article135 of the Articles of Association of the Company and is eligible for appointment. In terms of Section 257 of the CompaniesAct, 1956, the Company has received notices in writing along with a deposit of Rs.500 for each notice, from some of itsMembers signifying their intention to propose the candidature of Mr. S.B. Mathur for the office of director.
In terms of Reserve Bank of India�s Circular dated June 20, 2002 read with Circular dated September 9, 2002 with respectto the Report of the Consultative Group of Directors of Banks/Financial Institutions (Report of Dr. A.S. Ganguly Group),certain criteria are prescribed for appointment of directors on the board of directors of private sector banks. One of thecriteria stipulates that the person to be appointed should be between 35 and 70 years of age. Dr. Satish C. Jha hascompleted 70 years of age on March 31, 2004. In view of the same, Dr. Satish C. Jha, who retires by rotation at thisMeeting, does not seek re-appointment.
In view of the above, the Directors recommend the appointment of Mr. S.B. Mathur in place of Dr. Satish C. Jha.
Except Mr. S.B. Mathur, no Director is in any way concerned or interested in the Resolution at Item No.7 of the Notice.
Item No.10Mr. V. Prem Watsa, who has been appointed as an additional Director under Section 260 of the Companies Act, 1956effective January 29, 2004 holds office up to the date of the Tenth Annual General Meeting of the Company as providedunder Article 135 of the Articles of Association of the Company and is eligible for appointment. In terms of Section 257 ofthe Companies Act, 1956, the Company has received notices in writing along with a deposit of Rs.500 for each notice, fromsome of its Members signifying their intention to propose the candidature of Mr. V. Prem Watsa for the office of director.
The Directors recommend the appointment of Mr. V. Prem Watsa.
Except Mr. V. Prem Watsa, no Director is in any way concerned or interested in the Resolution at Item No.10 of the Notice.
Item Nos.11 to 15The Members had approved the remuneration of the wholetime Directors, from time to time, comprising salary andperquisites and bonus up to 100% of salary. Reserve Bank of India (RBI) has now issued guidelines stating that performancebonus to wholetime directors should not exceed average percentage of performance bonus paid to employees andboard of directors may review the monthly remuneration in view of the same. Pursuant to RBI�s guidelines, the Board, atits Meeting held on April 30, 2004 had, based on the recommendations of the Board Governance & RemunerationCommittee, approved, subject to the approval of RBI and the Members, re-alignment of the compensation structure forthe wholetime Directors, with an increase in the basic salary requiring change in the salary ranges approved earlier, whilerestricting the performance bonus to the average percentage of performance bonus paid to the employees. RBI videletters dated June 10, 2004 and July 7, 2004 had approved the payment of performance bonus to the wholetimeDirectors for FY2004 and monthly salary payable to them for FY2005, respectively.
The Directors recommend the adoption of the Resolutions at Item Nos.11 to 15 of the Notice, and if adopted, thisExplanatory Statement together with the accompanying Notice, be treated as an abstract under Section 302 of theCompanies Act, 1956.
No Director is in any way concerned or interested in the Resolutions at Item Nos.11 to 15 of the Notice exceptMr. K.V. Kamath, Ms. Lalita D. Gupte, Ms. Kalpana Morparia, Ms. Chanda D. Kochhar and Dr. Nachiket Mor, to the extent ofmodification in the terms of their remuneration.
Item Nos.16 and 17The Members, at their Extraordinary General Meeting held on February 21, 2000, had approved the grant of options tothe employees and Directors (including the wholetime Directors) of the Company and its holding company/subsidiarycompanies, if any, under the ICICI Bank Employees Stock Option Scheme (ESOS). In terms of Clause 9 of the Scheme ofAmalgamation of ICICI Limited, ICICI Capital Services Limited and ICICI Personal Financial Services Limited with ICICIBank Limited, ESOS was amended to the effect that the aggregate of all options granted under ESOS shall not exceed 5%of the aggregate of the number of issued equity shares of the Company after coming into effect of the amalgamation.
Explanatory Statement under Section 173(2) of the Companies Act, 1956
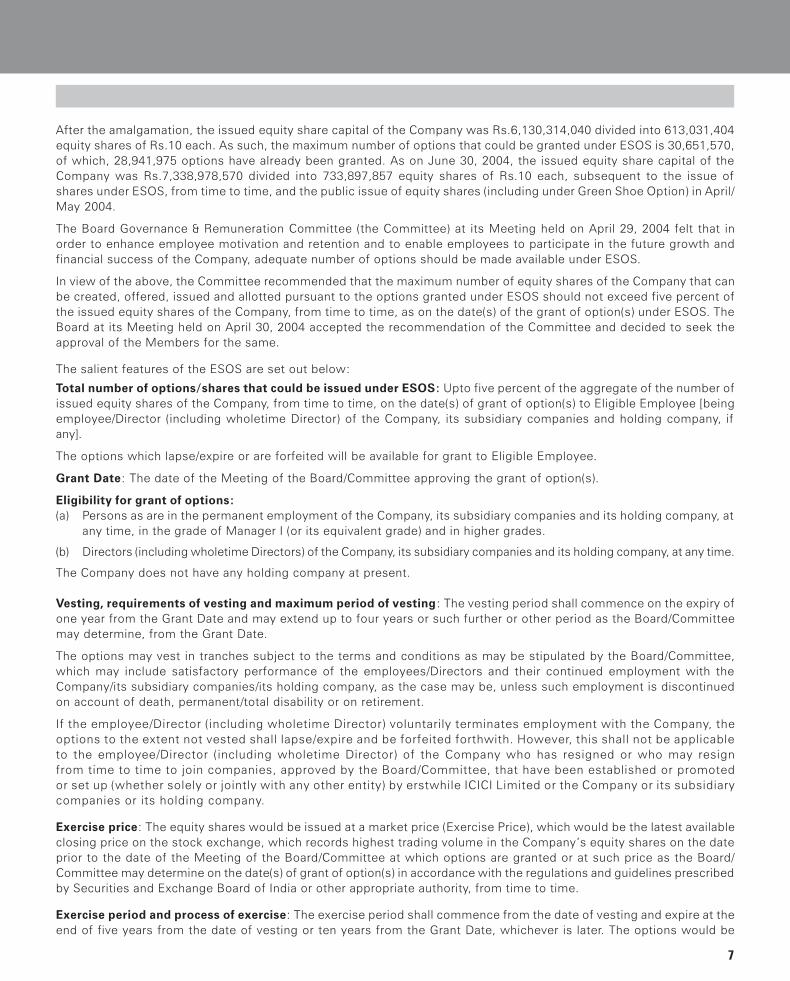
7
After the amalgamation, the issued equity share capital of the Company was Rs.6,130,314,040 divided into 613,031,404equity shares of Rs.10 each. As such, the maximum number of options that could be granted under ESOS is 30,651,570,of which, 28,941,975 options have already been granted. As on June 30, 2004, the issued equity share capital of theCompany was Rs.7,338,978,570 divided into 733,897,857 equity shares of Rs.10 each, subsequent to the issue ofshares under ESOS, from time to time, and the public issue of equity shares (including under Green Shoe Option) in April/May 2004.
The Board Governance & Remuneration Committee (the Committee) at its Meeting held on April 29, 2004 felt that inorder to enhance employee motivation and retention and to enable employees to participate in the future growth andfinancial success of the Company, adequate number of options should be made available under ESOS.
In view of the above, the Committee recommended that the maximum number of equity shares of the Company that canbe created, offered, issued and allotted pursuant to the options granted under ESOS should not exceed five percent ofthe issued equity shares of the Company, from time to time, as on the date(s) of the grant of option(s) under ESOS. TheBoard at its Meeting held on April 30, 2004 accepted the recommendation of the Committee and decided to seek theapproval of the Members for the same.
The salient features of the ESOS are set out below:
Total number of options/shares that could be issued under ESOS: Upto five percent of the aggregate of the number ofissued equity shares of the Company, from time to time, on the date(s) of grant of option(s) to Eligible Employee [beingemployee/Director (including wholetime Director) of the Company, its subsidiary companies and holding company, ifany].
The options which lapse/expire or are forfeited will be available for grant to Eligible Employee.
Grant Date: The date of the Meeting of the Board/Committee approving the grant of option(s).
Eligibility for grant of options:(a) Persons as are in the permanent employment of the Company, its subsidiary companies and its holding company, at
any time, in the grade of Manager I (or its equivalent grade) and in higher grades.
(b) Directors (including wholetime Directors) of the Company, its subsidiary companies and its holding company, at any time.
The Company does not have any holding company at present.
Vesting, requirements of vesting and maximum period of vesting: The vesting period shall commence on the expiry ofone year from the Grant Date and may extend up to four years or such further or other period as the Board/Committeemay determine, from the Grant Date.
The options may vest in tranches subject to the terms and conditions as may be stipulated by the Board/Committee,which may include satisfactory performance of the employees/Directors and their continued employment with theCompany/its subsidiary companies/its holding company, as the case may be, unless such employment is discontinuedon account of death, permanent/total disability or on retirement.
If the employee/Director (including wholetime Director) voluntarily terminates employment with the Company, theoptions to the extent not vested shall lapse/expire and be forfeited forthwith. However, this shall not be applicableto the employee/Director (including wholetime Director) of the Company who has resigned or who may resignfrom time to time to join companies, approved by the Board/Committee, that have been established or promotedor set up (whether solely or jointly with any other entity) by erstwhile ICICI Limited or the Company or its subsidiarycompanies or its holding company.
Exercise price: The equity shares would be issued at a market price (Exercise Price), which would be the latest availableclosing price on the stock exchange, which records highest trading volume in the Company�s equity shares on the dateprior to the date of the Meeting of the Board/Committee at which options are granted or at such price as the Board/Committee may determine on the date(s) of grant of option(s) in accordance with the regulations and guidelines prescribedby Securities and Exchange Board of India or other appropriate authority, from time to time.
Exercise period and process of exercise: The exercise period shall commence from the date of vesting and expire at theend of five years from the date of vesting or ten years from the Grant Date, whichever is later. The options would be
8
exercisable by submitting the requisite application form/exercise notice to the Company or such other person as theCompany may prescribe, subject to conditions for payment of Exercise Price in the manner prescribed by the Board/Committee.
Appraisal process: The Board/Committee shall determine the eligibility criteria for the employees and the Directors(including wholetime Directors) under ESOS based on evaluation of the employees/Directors on various parameters,such as length of service, grade, performance, technical knowledge, leadership qualities, merit, contribution and conduct,future potential, etc., and such other factors as may be deemed appropriate by it.
Maximum number of options to be issued per employee and in aggregate: The maximum number of options grantedto any Eligible Employee in a year will not exceed 0.05% of the issued equity shares of the Company at the time ofgranting of the options. The aggregate of all such options granted shall not exceed five percent of the aggregate of thenumber of issued equity shares of the Company, from time to time, on the date(s) of grant of option(s).
Disclosure and accounting policies: The Company shall comply with the disclosure and accounting policies prescribedby Securities and Exchange Board of India (SEBI) and any other appropriate authority, from time to time.
Method of valuation: The Company follows the intrinsic value method for computing the compensation cost, if any, forthe options granted. The difference between the compensation cost so calculated and compensation cost that wouldhave been recognised if the Company had used fair value method and its impact on the profits and earnings per share isdisclosed in the Directors� Report. The fair value is determined using the Black-Scholes model.
In terms of the provisions of Section 81(1A) and other applicable provisions, if any, of the Companies Act, 1956 and SEBI(Employee Stock Option Scheme and Employee Stock Purchase Scheme) Guidelines, 1999, approval of the Members issought to issue equity shares, pursuant to the options granted under ESOS, not exceeding in aggregate, five percent ofthe number of issued equity shares of the Company, from time to time, as on the date(s) of grant of option(s) under ESOS.The Board/Committee shall have the absolute authority to vary or modify the terms of ESOS in accordance with theregulations and guidelines prescribed by SEBI or regulations that may be issued by any appropriate authority, from timeto time, unless such variation, modification or alteration is detrimental to the interests of the employees/Directors(including wholetime Directors).
The Directors recommend the adoption of the Resolutions at Item Nos.16 and 17 of the Notice.
All the Directors are interested in the Resolutions at Item Nos.16 and 17 of the Notice to the extent of the benefit theymay derive under ESOS.
By Order of the Board
JYOTIN MEHTAGeneral Manager &
Mumbai, July 23, 2004 Company Secretary
Registered Office: Corporate Office:Landmark ICICI Bank TowersRace Course Circle Bandra-Kurla ComplexVadodara 390 007 Mumbai 400 051

9
Annexure
PURSUANT TO CLAUSE 49 OF THE LISTING AGREEMENT WITH THE STOCK EXCHANGES, FOLLOWINGINFORMATION IS FURNISHED ABOUT THE DIRECTORS PROPOSED TO BE APPOINTED/RE-APPOINTED
1. Mr. Uday M. Chitale was first appointed on the Board on August 21, 1997. He is a Chartered Accountant byprofession and has been in practice since 1975. He is a senior partner of M.P. Chitale and Company and M.P. Chitaleand Associates, Chartered Accountants. His professional expertise and experience encompasses corporate auditingand accounting, business advisory and commercial dispute resolution.
Other Directorships Committee Memberships
Name of Company Name of Committee
Crossdomain Solutions Private Limited GMR Energy LimitedDFK Consulting Services (India) Private Limited Audit Committee, ChairmanDFK International (the Netherlands) ICICI Bank LimitedGMR Energy Limited Audit Committee, ChairmanIndian Council for Dispute Resolution Fraud Monitoring Committee, Chairman
Share Transfer & Shareholders�/Investors� Grievance Committee, ChairmanRisk Committee
2. Mr. L.N. Mittal was first appointed on the Board on May 3, 2002. He holds a Bachelor�s degree in Commerce(Magna-cum-Laude). He is the Chairman of the LNM Group, one of the world�s largest producers of steel, withexperience in industry and management.
Other Directorships Committee Memberships
Name of Company Name of Committee
Artha Limited NilCaribean Ispat LimitedGalmatias LimitedGrupo Ispat International SA de CVIrish Ispat LimitedIscor LimitedIspat (US) Holdings Inc.Ispat Annaba SpaIspat Europe Group SAIspat Inland Holdings Inc.Ispat Inland Inc.Ispat Inland LPIspat International Investments SLIspat International LimitedIspat International NVIspat Karmet JSCIspat Mexicana SA de CVIspat Sidbec Inc.Ispat Sidex Holdings BVIspat Sidex SAIspat Tebessa SpaLNM Capital LimitedLNM Holdings BVLNM Holdings NVLNM Internet Ventures LimitedLucre LimitedNestor LimitedNuav LimitedPratham UK LimitedPT Ispat IndoTommyfield LimitedIspat Nova Hut a.s., Chairman (Supervisory Board)Ispat Polska Stal S.A., President (Supervisory Board)
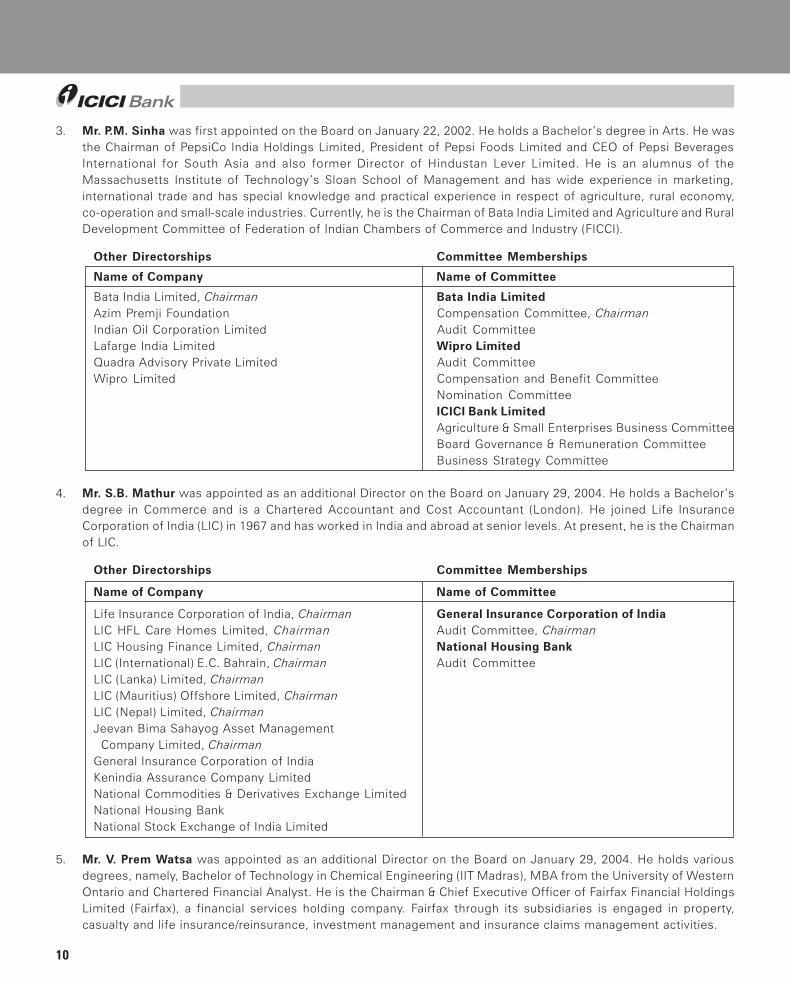
10
3. Mr. P.M. Sinha was first appointed on the Board on January 22, 2002. He holds a Bachelor�s degree in Arts. He wasthe Chairman of PepsiCo India Holdings Limited, President of Pepsi Foods Limited and CEO of Pepsi BeveragesInternational for South Asia and also former Director of Hindustan Lever Limited. He is an alumnus of theMassachusetts Institute of Technology�s Sloan School of Management and has wide experience in marketing,international trade and has special knowledge and practical experience in respect of agriculture, rural economy,co-operation and small-scale industries. Currently, he is the Chairman of Bata India Limited and Agriculture and RuralDevelopment Committee of Federation of Indian Chambers of Commerce and Industry (FICCI).
Other Directorships Committee Memberships
Name of Company Name of Committee
Bata India Limited, Chairman Bata India LimitedAzim Premji Foundation Compensation Committee, ChairmanIndian Oil Corporation Limited Audit CommitteeLafarge India Limited Wipro LimitedQuadra Advisory Private Limited Audit CommitteeWipro Limited Compensation and Benefit Committee
Nomination CommitteeICICI Bank LimitedAgriculture & Small Enterprises Business CommitteeBoard Governance & Remuneration CommitteeBusiness Strategy Committee
4. Mr. S.B. Mathur was appointed as an additional Director on the Board on January 29, 2004. He holds a Bachelor�sdegree in Commerce and is a Chartered Accountant and Cost Accountant (London). He joined Life InsuranceCorporation of India (LlC) in 1967 and has worked in India and abroad at senior levels. At present, he is the Chairmanof LlC.
Other Directorships Committee Memberships
Name of Company Name of Committee
Life Insurance Corporation of India, Chairman General Insurance Corporation of IndiaLIC HFL Care Homes Limited, Chairman Audit Committee, ChairmanLIC Housing Finance Limited, Chairman National Housing BankLIC (International) E.C. Bahrain, Chairman Audit CommitteeLIC (Lanka) Limited, ChairmanLIC (Mauritius) Offshore Limited, ChairmanLIC (Nepal) Limited, ChairmanJeevan Bima Sahayog Asset Management Company Limited, ChairmanGeneral Insurance Corporation of IndiaKenindia Assurance Company LimitedNational Commodities & Derivatives Exchange LimitedNational Housing BankNational Stock Exchange of India Limited
5. Mr. V. Prem Watsa was appointed as an additional Director on the Board on January 29, 2004. He holds variousdegrees, namely, Bachelor of Technology in Chemical Engineering (IIT Madras), MBA from the University of WesternOntario and Chartered Financial Analyst. He is the Chairman & Chief Executive Officer of Fairfax Financial HoldingsLimited (Fairfax), a financial services holding company. Fairfax through its subsidiaries is engaged in property,casualty and life insurance/reinsurance, investment management and insurance claims management activities.
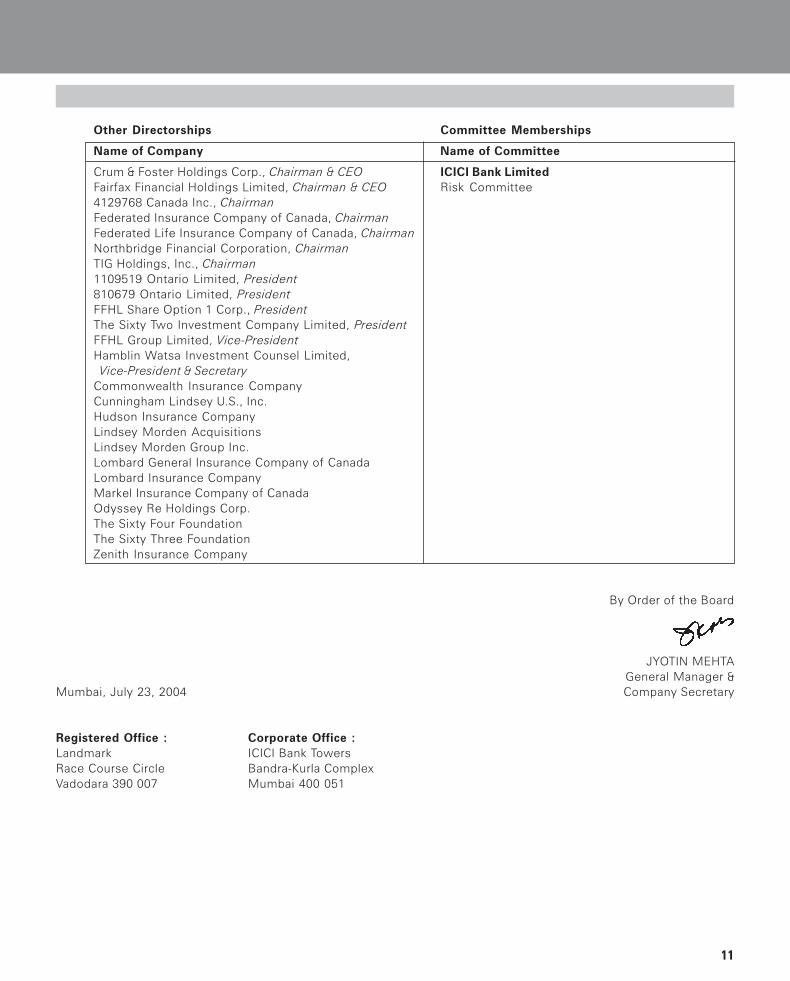
11
Other Directorships Committee Memberships
Name of Company Name of Committee
Crum & Foster Holdings Corp., Chairman & CEO ICICI Bank LimitedFairfax Financial Holdings Limited, Chairman & CEO Risk Committee4129768 Canada Inc., ChairmanFederated Insurance Company of Canada, ChairmanFederated Life Insurance Company of Canada, ChairmanNorthbridge Financial Corporation, ChairmanTIG Holdings, Inc., Chairman1109519 Ontario Limited, President810679 Ontario Limited, PresidentFFHL Share Option 1 Corp., PresidentThe Sixty Two Investment Company Limited, PresidentFFHL Group Limited, Vice-PresidentHamblin Watsa Investment Counsel Limited, Vice-President & SecretaryCommonwealth Insurance CompanyCunningham Lindsey U.S., Inc.Hudson Insurance CompanyLindsey Morden AcquisitionsLindsey Morden Group Inc.Lombard General Insurance Company of CanadaLombard Insurance CompanyMarkel Insurance Company of CanadaOdyssey Re Holdings Corp.The Sixty Four FoundationThe Sixty Three FoundationZenith Insurance Company
By Order of the Board
JYOTIN MEHTAGeneral Manager &
Mumbai, July 23, 2004 Company Secretary
Registered Office : Corporate Office :Landmark ICICI Bank TowersRace Course Circle Bandra-Kurla ComplexVadodara 390 007 Mumbai 400 051
ContentsConsolidated balance sheets .................................................................................................................................................... 60
Consolidated statements of operations ........................................................................................................................... 61 - 62
Consolidated statements of stockholders' equity & other comprehensive income ........................................................... 63
Consolidated statements of cash flows ........................................................................................................................... 64 - 65
EXTRACTS FROM THE
CONSOLIDATED US GAAP
FINANCIAL STATEMENTS OF
ICICI BANK LIMITED
AND ITS SUBSIDIARIES
FOR THE FINANCIAL YEAR ENDED MARCH 31, 2004
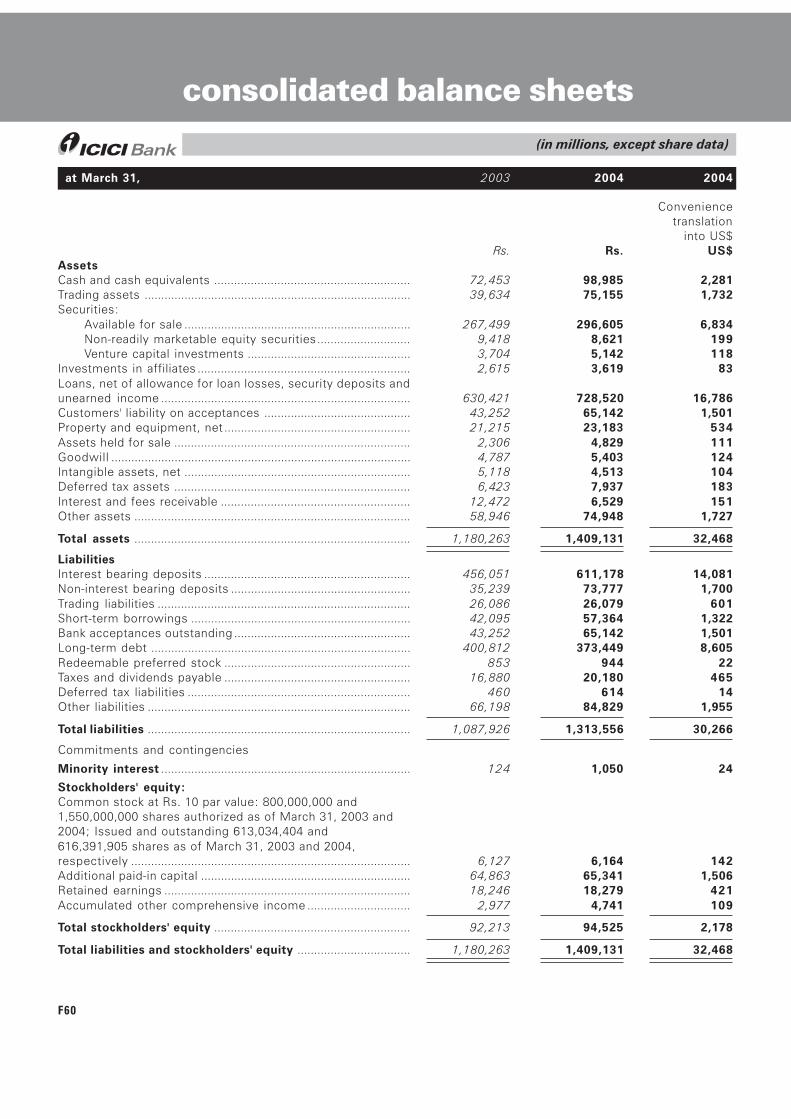
F60
(in millions, except share data)
Conveniencetranslation
into US$Rs. Rs. US$
AssetsCash and cash equivalents ........................................................... 72,453 98,985 2,281Trading assets ................................................................................ 39,634 75,155 1,732Securities:
Available for sale .................................................................... 267,499 296,605 6,834Non-readily marketable equity securities............................ 9,418 8,621 199Venture capital investments ................................................. 3,704 5,142 118
Investments in affiliates ................................................................ 2,615 3,619 83Loans, net of allowance for loan losses, security deposits andunearned income ........................................................................... 630,421 728,520 16,786Customers' liability on acceptances ............................................ 43,252 65,142 1,501Property and equipment, net ........................................................ 21,215 23,183 534Assets held for sale ....................................................................... 2,306 4,829 111Goodwill .......................................................................................... 4,787 5,403 124Intangible assets, net .................................................................... 5,118 4,513 104Deferred tax assets ....................................................................... 6,423 7,937 183Interest and fees receivable ......................................................... 12,472 6,529 151Other assets ................................................................................... 58,946 74,948 1,727
Total assets ................................................................................... 1,180,263 1,409,131 32,468
LiabilitiesInterest bearing deposits .............................................................. 456,051 611,178 14,081Non-interest bearing deposits ...................................................... 35,239 73,777 1,700Trading liabilities ............................................................................ 26,086 26,079 601Short-term borrowings .................................................................. 42,095 57,364 1,322Bank acceptances outstanding ..................................................... 43,252 65,142 1,501Long-term debt .............................................................................. 400,812 373,449 8,605Redeemable preferred stock ........................................................ 853 944 22Taxes and dividends payable ........................................................ 16,880 20,180 465Deferred tax liabilities ................................................................... 460 614 14Other liabilities ............................................................................... 66,198 84,829 1,955
Total liabilities ............................................................................... 1,087,926 1,313,556 30,266
Commitments and contingencies
Minority interest ........................................................................... 124 1,050 24
Stockholders' equity:Common stock at Rs. 10 par value: 800,000,000 and1,550,000,000 shares authorized as of March 31, 2003 and2004; Issued and outstanding 613,034,404 and616,391,905 shares as of March 31, 2003 and 2004,respectively .................................................................................... 6,127 6,164 142Additional paid-in capital ............................................................... 64,863 65,341 1,506Retained earnings .......................................................................... 18,246 18,279 421Accumulated other comprehensive income ............................... 2,977 4,741 109
Total stockholders' equity ........................................................... 92,213 94,525 2,178
Total liabilities and stockholders' equity .................................. 1,180,263 1,409,131 32,468
consolidated balance sheets
at March 31, 2003 2004 2004
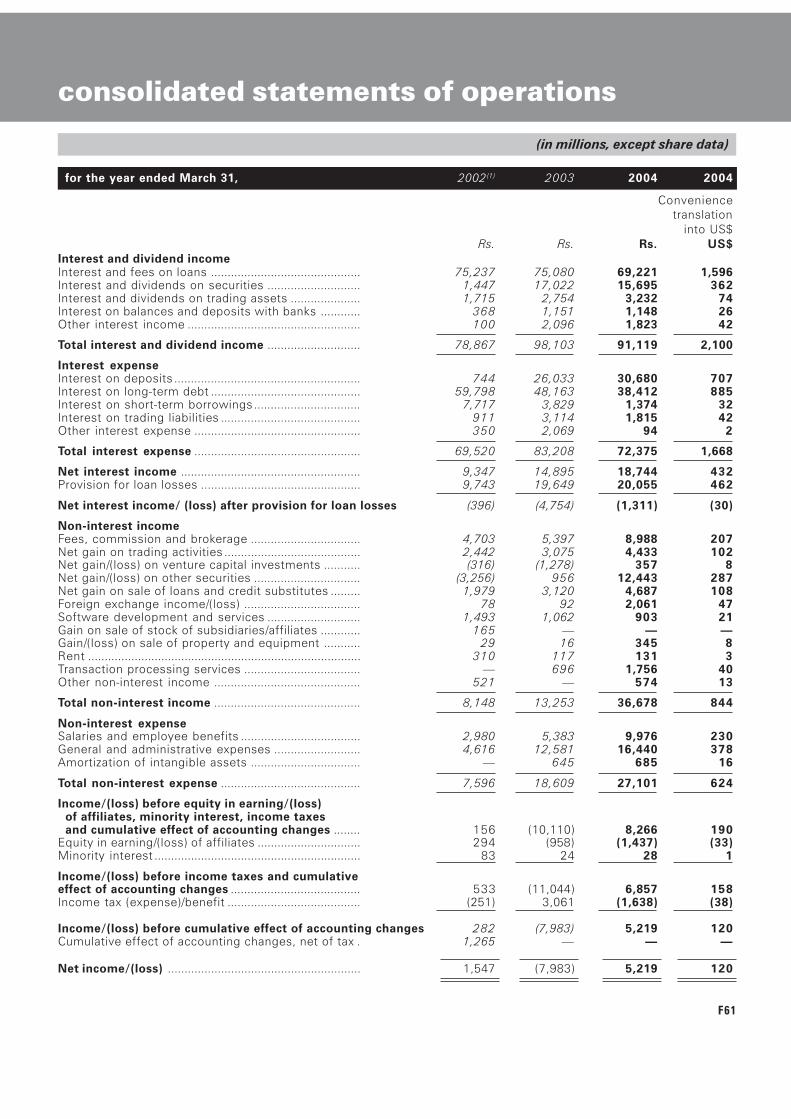
F61
Conveniencetranslation
into US$Rs. Rs. Rs. US$
Interest and dividend incomeInterest and fees on loans ............................................. 75,237 75,080 69,221 1,596Interest and dividends on securities ............................ 1,447 17,022 15,695 362Interest and dividends on trading assets ..................... 1,715 2,754 3,232 74Interest on balances and deposits with banks ............ 368 1,151 1,148 26Other interest income .................................................... 100 2,096 1,823 42
Total interest and dividend income ............................ 78,867 98,103 91,119 2,100
Interest expenseInterest on deposits ........................................................ 744 26,033 30,680 707Interest on long-term debt ............................................. 59,798 48,163 38,412 885Interest on short-term borrowings ................................ 7,717 3,829 1,374 32Interest on trading liabilities .......................................... 911 3,114 1,815 42Other interest expense .................................................. 350 2,069 94 2
Total interest expense .................................................. 69,520 83,208 72,375 1,668
Net interest income ...................................................... 9,347 14,895 18,744 432Provision for loan losses ................................................ 9,743 19,649 20,055 462
Net interest income/ (loss) after provision for loan losses (396) (4,754) (1,311) (30)
Non-interest incomeFees, commission and brokerage ................................. 4,703 5,397 8,988 207Net gain on trading activities ......................................... 2,442 3,075 4,433 102Net gain/(loss) on venture capital investments ........... (316) (1,278) 357 8Net gain/(loss) on other securities ................................ (3,256) 956 12,443 287Net gain on sale of loans and credit substitutes ......... 1,979 3,120 4,687 108Foreign exchange income/(loss) ................................... 78 92 2,061 47Software development and services ............................ 1,493 1,062 903 21Gain on sale of stock of subsidiaries/affiliates ............ 165 � � �Gain/(loss) on sale of property and equipment ........... 29 16 345 8Rent .................................................................................. 310 117 131 3Transaction processing services ................................... � 696 1,756 40Other non-interest income ............................................ 521 � 574 13
Total non-interest income ............................................ 8,148 13,253 36,678 844
Non-interest expenseSalaries and employee benefits .................................... 2,980 5,383 9,976 230General and administrative expenses .......................... 4,616 12,581 16,440 378Amortization of intangible assets ................................. � 645 685 16
Total non-interest expense .......................................... 7,596 18,609 27,101 624
Income/(loss) before equity in earning/(loss) of affiliates, minority interest, income taxes and cumulative effect of accounting changes ........ 156 (10,110) 8,266 190Equity in earning/(loss) of affiliates ............................... 294 (958) (1,437) (33)Minority interest .............................................................. 83 24 28 1
Income/(loss) before income taxes and cumulativeeffect of accounting changes ....................................... 533 (11,044) 6,857 158Income tax (expense)/benefit ........................................ (251) 3,061 (1,638) (38)
Income/(loss) before cumulative effect of accounting changes 282 (7,983) 5,219 120Cumulative effect of accounting changes, net of tax . 1,265 � � �
Net income/(loss) .......................................................... 1,547 (7,983) 5,219 120
for the year ended March 31, 2002(1) 2003 2004 2004
(in millions, except share data)
consolidated statements of operations
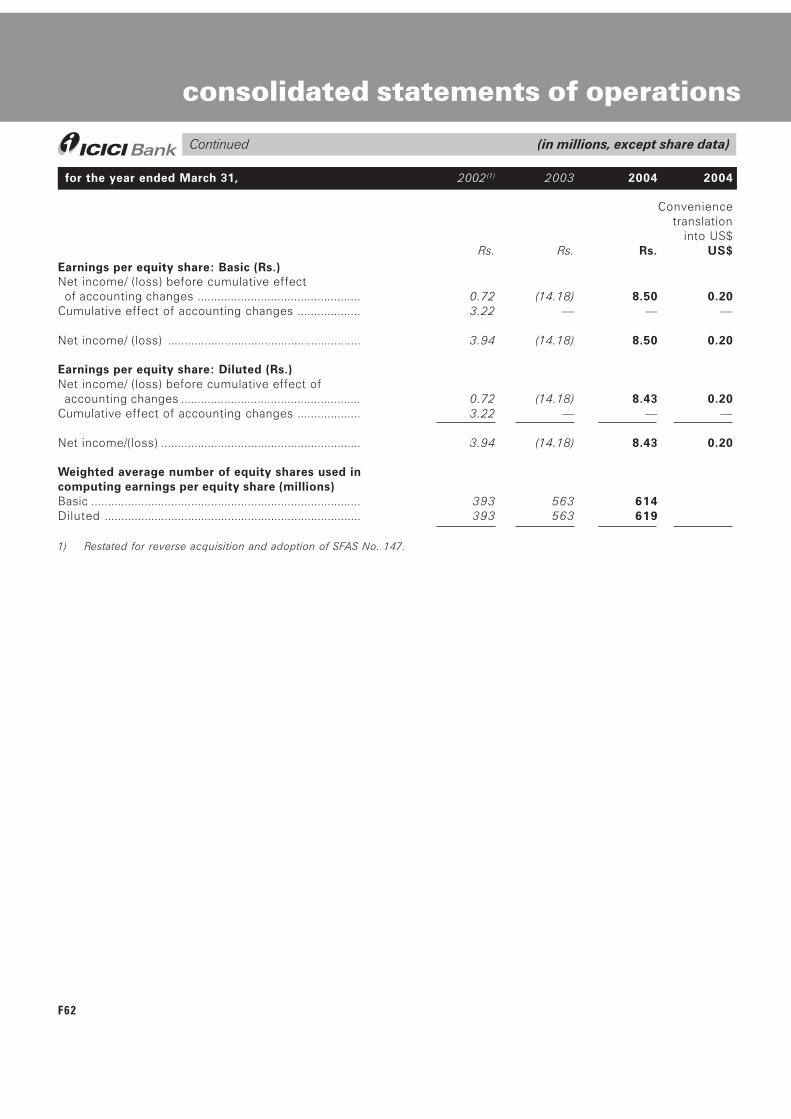
F62
Earnings per equity share: Basic (Rs.)Net income/ (loss) before cumulative effect of accounting changes ................................................. 0.72 (14.18) 8.50 0.20Cumulative effect of accounting changes ................... 3.22 � � �
Net income/ (loss) .......................................................... 3.94 (14.18) 8.50 0.20
Earnings per equity share: Diluted (Rs.)Net income/ (loss) before cumulative effect of accounting changes ...................................................... 0.72 (14.18) 8.43 0.20Cumulative effect of accounting changes ................... 3.22 � � �
Net income/(loss) ............................................................ 3.94 (14.18) 8.43 0.20
Weighted average number of equity shares used incomputing earnings per equity share (millions)Basic ................................................................................. 393 563 614Diluted ............................................................................. 393 563 619
1) Restated for reverse acquisition and adoption of SFAS No. 147.
for the year ended March 31, 2002(1) 2003 2004 2004
Continued (in millions, except share data)
Conveniencetranslation
into US$Rs. Rs. Rs. US$
consolidated statements of operations
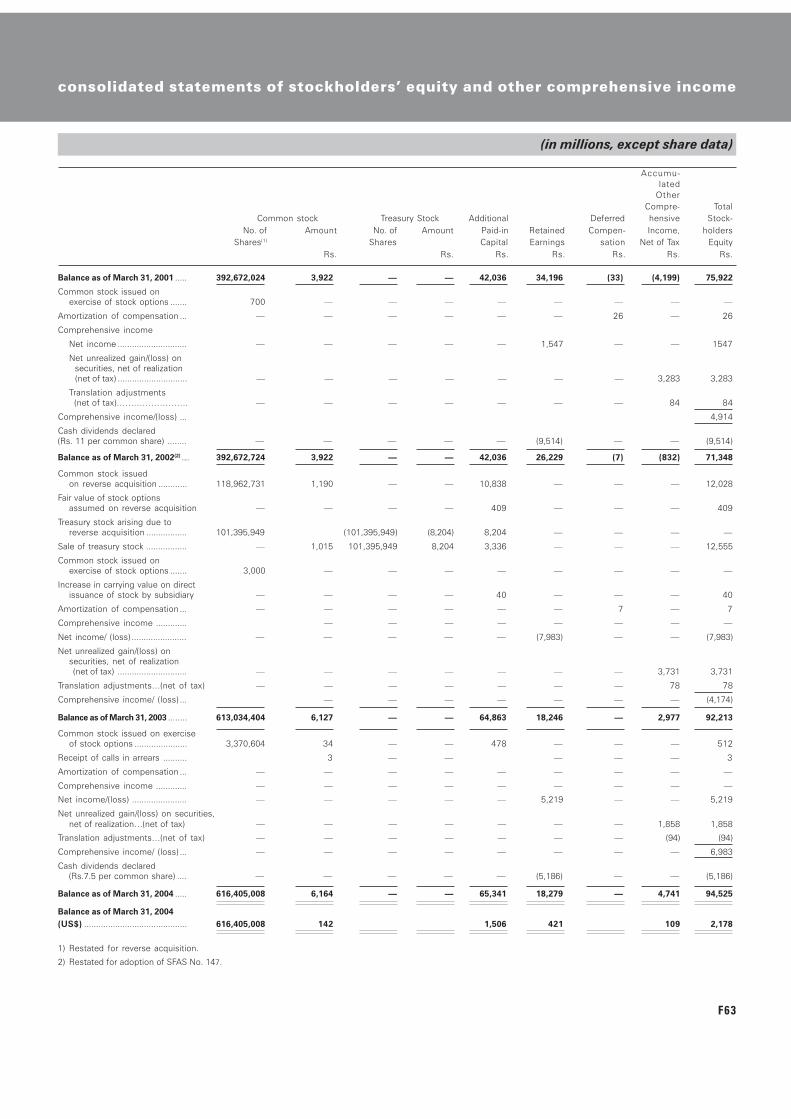
F63
(in millions, except share data)
consolidated statements of stockholders� equity and other comprehensive income
Accumu-lated
OtherCompre- Total
Common stock Treasury Stock Additional Deferred hensive Stock-No. of Amount No. of Amount Paid-in Retained Compen- Income, holders
Shares(1) Shares Capital Earnings sation Net of Tax EquityRs. Rs. Rs. Rs. Rs. Rs. Rs.
Balance as of March 31, 2001 ..... 392,672,024 3,922 � � 42,036 34,196 (33) (4,199) 75,922
Common stock issued onexercise of stock options ....... 700 � � � � � � � �
Amortization of compensation ... � � � � � � 26 � 26
Comprehensive income
Net income ............................. � � � � � 1,547 � � 1547
Net unrealized gain/(loss) on securities, net of realization (net of tax) ............................. � � � � � � � 3,283 3,283
Translation adjustments (net of tax)��������. � � � � � � � 84 84
Comprehensive income/(loss) ... 4,914
Cash dividends declared(Rs. 11 per common share) ........ � � � � � (9,514) � � (9,514)
Balance as of March 31, 2002(2) ..... 392,672,724 3,922 � � 42,036 26,229 (7) (832) 71,348
Common stock issuedon reverse acquisition ............ 118,962,731 1,190 � � 10,838 � � � 12,028
Fair value of stock optionsassumed on reverse acquisition � � � � 409 � � � 409
Treasury stock arising due toreverse acquisition ................. 101,395,949 (101,395,949) (8,204) 8,204 � � � �
Sale of treasury stock ................. � 1,015 101,395,949 8,204 3,336 � � � 12,555
Common stock issued onexercise of stock options ....... 3,000 � � � � � � � �
Increase in carrying value on directissuance of stock by subsidiary � � � � 40 � � � 40
Amortization of compensation ... � � � � � � 7 � 7
Comprehensive income ............. � � � � � � � �
Net income/ (loss) ....................... � � � � � (7,983) � � (7,983)
Net unrealized gain/(loss) onsecurities, net of realization (net of tax) ............................. � � � � � � � 3,731 3,731
Translation adjustments�(net of tax) � � � � � � � 78 78
Comprehensive income/ (loss) ... � � � � � � � (4,174)
Balance as of March 31, 2003 ........ 613,034,404 6,127 � � 64,863 18,246 � 2,977 92,213
Common stock issued on exerciseof stock options ...................... 3,370,604 34 � � 478 � � � 512
Receipt of calls in arrears .......... 3 � � � � � 3
Amortization of compensation ... � � � � � � � � �
Comprehensive income ............. � � � � � � � � �
Net income/(loss) ....................... � � � � � 5,219 � � 5,219
Net unrealized gain/(loss) on securities,net of realization�(net of tax) � � � � � � � 1,858 1,858
Translation adjustments�(net of tax) � � � � � � � (94) (94)
Comprehensive income/ (loss) ... � � � � � � � � 6,983
Cash dividends declared(Rs.7.5 per common share) .... � � � � � (5,186) � � (5,186)
Balance as of March 31, 2004 ..... 616,405,008 6,164 � � 65,341 18,279 � 4,741 94,525
Balance as of March 31, 2004(US$) ........................................... 616,405,008 142 1,506 421 109 2,178
1) Restated for reverse acquisition.
2) Restated for adoption of SFAS No. 147.
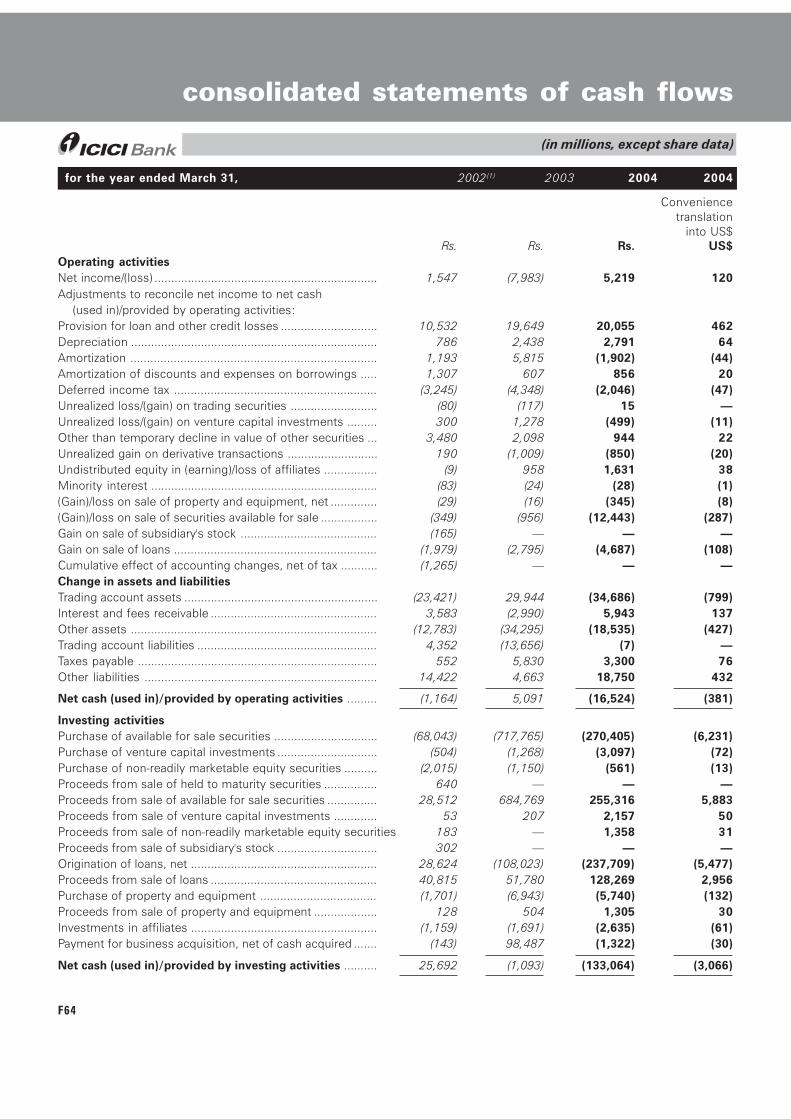
F64
Conveniencetranslation
into US$Rs. Rs. Rs. US$
Operating activitiesNet income/(loss) ................................................................... 1,547 (7,983) 5,219 120Adjustments to reconcile net income to net cash
(used in)/provided by operating activities:Provision for loan and other credit losses ............................. 10,532 19,649 20,055 462Depreciation .......................................................................... 786 2,438 2,791 64Amortization .......................................................................... 1,193 5,815 (1,902) (44)Amortization of discounts and expenses on borrowings ..... 1,307 607 856 20Deferred income tax ............................................................. (3,245) (4,348) (2,046) (47)Unrealized loss/(gain) on trading securities .......................... (80) (117) 15 �Unrealized loss/(gain) on venture capital investments ......... 300 1,278 (499) (11)Other than temporary decline in value of other securities ... 3,480 2,098 944 22Unrealized gain on derivative transactions ........................... 190 (1,009) (850) (20)Undistributed equity in (earning)/loss of affiliates ................ (9) 958 1,631 38Minority interest .................................................................... (83) (24) (28) (1)(Gain)/loss on sale of property and equipment, net .............. (29) (16) (345) (8)(Gain)/loss on sale of securities available for sale ................. (349) (956) (12,443) (287)Gain on sale of subsidiary's stock ......................................... (165) � � �Gain on sale of loans ............................................................. (1,979) (2,795) (4,687) (108)Cumulative effect of accounting changes, net of tax ........... (1,265) � � �Change in assets and liabilitiesTrading account assets .......................................................... (23,421) 29,944 (34,686) (799)Interest and fees receivable .................................................. 3,583 (2,990) 5,943 137Other assets .......................................................................... (12,783) (34,295) (18,535) (427)Trading account liabilities ...................................................... 4,352 (13,656) (7) �Taxes payable ........................................................................ 552 5,830 3,300 76Other liabilities ...................................................................... 14,422 4,663 18,750 432
Net cash (used in)/provided by operating activities ......... (1,164) 5,091 (16,524) (381)
Investing activitiesPurchase of available for sale securities ............................... (68,043) (717,765) (270,405) (6,231)Purchase of venture capital investments .............................. (504) (1,268) (3,097) (72)Purchase of non-readily marketable equity securities .......... (2,015) (1,150) (561) (13)Proceeds from sale of held to maturity securities ................ 640 � � �Proceeds from sale of available for sale securities ............... 28,512 684,769 255,316 5,883Proceeds from sale of venture capital investments ............. 53 207 2,157 50Proceeds from sale of non-readily marketable equity securities 183 � 1,358 31Proceeds from sale of subsidiary's stock .............................. 302 � � �Origination of loans, net ........................................................ 28,624 (108,023) (237,709) (5,477)Proceeds from sale of loans .................................................. 40,815 51,780 128,269 2,956Purchase of property and equipment ................................... (1,701) (6,943) (5,740) (132)Proceeds from sale of property and equipment ................... 128 504 1,305 30Investments in affiliates ........................................................ (1,159) (1,691) (2,635) (61)Payment for business acquisition, net of cash acquired ....... (143) 98,487 (1,322) (30)
Net cash (used in)/provided by investing activities .......... 25,692 (1,093) (133,064) (3,066)
for the year ended March 31, 2002(1) 2003 2004 2004
(in millions, except share data)
consolidated statements of cash flows

F65
Continued (in millions, except share data)
consolidated statements of cash flows
Conveniencetranslation
into US$Rs. Rs. Rs. US$
Financing activitiesIncrease in deposits, net ....................................................... 1,308 158,290 193,741 4,464Proceeds/ Repayment from short-term borrowings, net ...... (28,852) (30,118) 15,269 352Proceeds from other borrowings .......................................... 5,787 � � �Proceeds from issuances of long-term debt ......................... 158,905 10,631 114,712 2,643Repayment of long-term debt ............................................... (142,019) (124,979) (142,931) (3,293)Proceeds from issuance of common stock .......................... � 13,155 515 12Proceeds from issuance of common stock by subsidiary .... 390 � � �Cash dividends paid .............................................................. (9,514) � (5,186) (119)
Net cash provided by/(used in) financing activities .......... (13,995) 26,979 176,120 4,059
Effect of exchange rate on cash and cash equivalents ......... (14) � � �
Net increase/(decrease) in cash and cash equivalents ......... 10,519 30,977 26,532 612Cash and cash equivalents at the beginning of the year ...... 30,957 41,476 72,453 1,669
Cash and cash equivalents at the end of the year ............ 41,476 72,453 98,985 2,281
Supplementary information:
Cash paid for:Taxes ................................................................................. 4,505 1,027 3,313 76
Non-cash items:Foreclosed assets ............................................................. 1,188 673 1,087 25Conversion of loan to equity shares ................................. 1,586 4,495 1,162 27Transfer of securities from held to maturity category to available for sale category ........................... 866 � � �Change in unrealized gain/(loss) on securities available for sale, net ..................................... 3,283 5,205 2,507 58
Acquisitions
Fair value of net assets acquired, excludingcash and cash equivalents ................................................ (37,948) 642 15
Shares issued ........................................................................ 118,965,731 3,370,604 77,664Treasury stock ........................................................................ 8,204 � �
1) Restated for reverse acquisition and adoption of SFAS No. 147
for the year ended March 31, 2002(1) 2003 2004 2004
REGISTERED OFFICE
LandmarkRace Course Circle, Vadodara 390 007
CORPORATE OFFICE
ICICI Bank TowersBandra-Kurla Complex, Mumbai 400 051
STATUTORY AUDITORS
S. R. Batliboi & Co.Chartered Accountants
Express Towers, 6th Floor,Nariman Point, Mumbai 400 021
REGISTRAR AND TRANSFER AGENTS
ICICI Infotech LimitedMaratha Mandir Annexe
Dr. A. R. Nair Road,Mumbai Central, Mumbai 400 008