Embed Size (px)
Citation preview

Course Information○
Lecture Notes○
Pp. 73 - 75 Kramer○
Appendix B7 Kramer○
Reading Assignment
Responsespectra.pdf (Chopra)○
ASCE 7-05.pdf○
Sakaria time history○
Other Materials
Baseline correct the time history and plot the acceleration,
velocity and displacement records. Use the quadratic function for the baseline correction. (5 points)
□
Determine peak ground acceleration (pga) from the time history.
(5 points)
□
Develop and plot a pseudo acceleration response spectrum for
this record at 5 percent damping using Seismosignal. (5 points)
□
Determine the predominate period. (5 points)□
Scale the record by 1.5 (increase the acceleration values by 50
percent) and replot the pseudo acceleration response spectrum. (5 points)
□
For the Sakaria acceleration time history do the following:
Install Seismosignal software on your computer○
Install the ground motion hazards java program from the United States
Geological Survey (USGS) on your computer
○
http://earthquake.usgs.gov/hazards/designmaps/grdmotion.php
Install Google Earth on your computer and find the latitude and longitude
of the Meldrum Civil Engineering (MCEB).
○
Use these coordinates and USGS java software to find the Ss and S1 values
for the MCEB. (10 points)
○
Assume the MCEB is found on a site class C soil.
Show all calculations and inputs to calculations. Check your solution
against the design spectrum calculated by the USGS java calculator.
Use the Ss and S1 values above and ASCE 7-05 to develop a design
spectrum for the MCEB. (20 points)
○
Homework Assignment #1
© Steven F. Bartlett, 2011
Design SpectraSunday, August 14, 20113:32 PM
Design Spectra Page 1
© Steven F. Bartlett, 2014
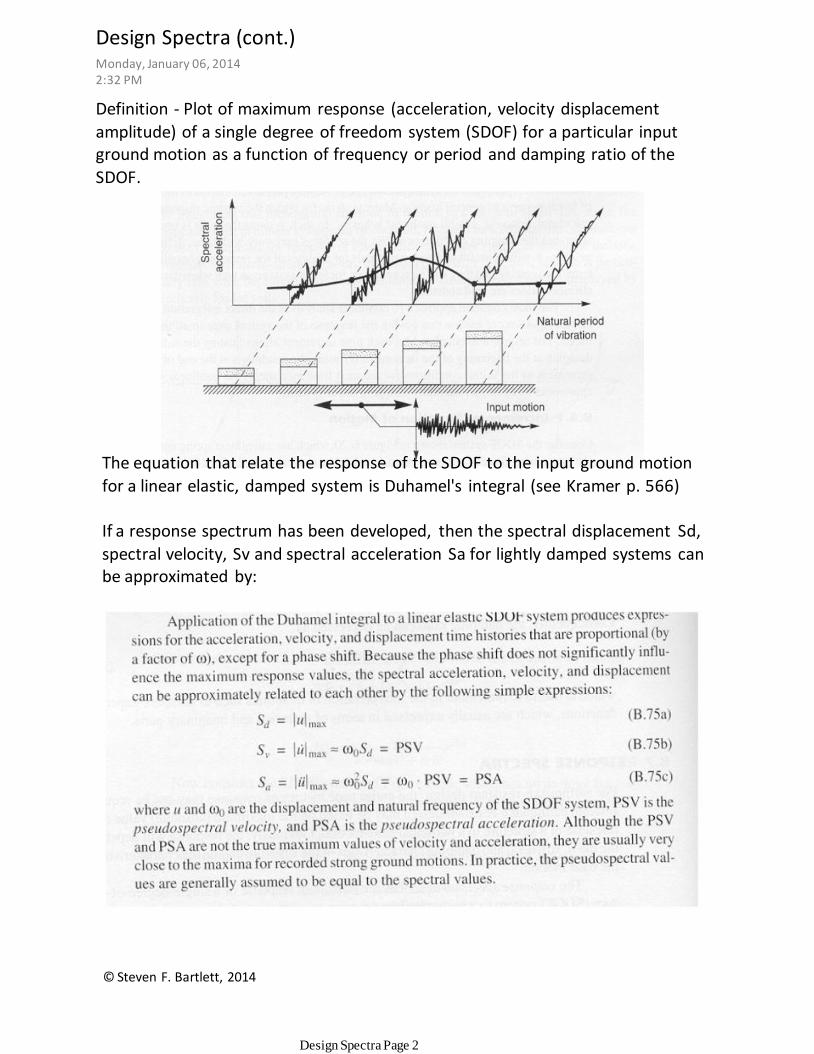
Definition - Plot of maximum response (acceleration, velocity displacement
amplitude) of a single degree of freedom system (SDOF) for a particular input ground motion as a function of frequency or period and damping ratio of the
SDOF.
The equation that relate the response of the SDOF to the input ground motion
for a linear elastic, damped system is Duhamel's integral (see Kramer p. 566)
If a response spectrum has been developed, then the spectral displacement Sd,
spectral velocity, Sv and spectral acceleration Sa for lightly damped systems can be approximated by:
Design Spectra (cont.)Monday, January 06, 20142:32 PM
Design Spectra Page 2

© Steven F. Bartlett, 2011
Stiffness and Damping Representation3:32 PM
Design Spectra Page 3

Design Spectra Page 4

An acceleration response spectrum, such as that above, is widely used in
geotechnical and structural engineering.
○
It expresses the maximum acceleration response of a single degree of
freedom system (SDOF) as a function of period for a given level of structural damping (usually 5 percent, unless otherwise stated.)
○
The above spectrum is not a design spectrum. It is jagged because it
represents a spectrum for a given time history.
○
Seismosignal is recommended□
Software is usually used to do this conversion.
An acceleration time history can be converted to an acceleration response
spectrum which represents the response of the SDOF for the given input motion.
○
Important Concepts:
Damp. 5.0%
Period [sec]
3210
Response A
ccele
ratio
n [g]
1.8
1.7
1.6
1.5
1.4
1.3
1.2
1.1
1
0.9
0.8
0.7
0.6
0.5
0.4
0.3
0.2
0.1
0
Time [sec]
876543210
Accele
ratio
n [g]
0.8
0.6
0.4
0.2
0
-0.2
-0.4
Acceleration time history (ground surface)
Acceleration Response Spectrum for above time history from SeismosignalTM
© Steven F. Bartlett, 2011
Plotting Response Spectra for an Earthquake (cont.)Sunday, August 14, 20113:32 PM
Design Spectra Page 5

Empirical attenuation relations (CVEEN 6330)○
Building code design spectra (CVEEN 6330 and CVEEN 7330)○
Equivalent Linear Techniques (computer program SHAKE or DEEPSOIL)
(CVEEN 7330)
FEM (finite element methods) (computer program DEEPSOIL)
(CVEEN 7330)
□
FDM (finite difference methods) (computer program FLAC)
(CVEEN 6330 and CVEEN 7330)
□
Nonlinear Techniques (CVEEN 6330 and CVEEN 7330)
Site-specific Ground Response Analyses (CVEEN 6330 and CVEEN 7330)○
Methods of Developing Design Spectra and Design Strong Motion
© Steven F. Bartlett, 2011
Representing Earthquake Motion in DesignSunday, August 14, 20113:32 PM
Design Spectra Page 6

Ss and S1 are obtained from the United States Geological Survey National Strong
Motion Program. The link for this computer program (Java Script) is given in the homework assignment.
© Steven F. Bartlett, 2011
Development of Design Spectra using ASCE 7-05Sunday, August 14, 20113:32 PM
Design Spectra Page 7

© Steven F. Bartlett, 2011
ASCE 7-05 (cont.)Sunday, August 14, 20113:32 PM
Design Spectra Page 8

© Steven F. Bartlett, 2011
ASCE 7-05 (cont.)Sunday, August 14, 20113:32 PM
Design Spectra Page 9

0.00
0.10
0.20
0.30
0.40
0.50
0.60
0.70
0.80
0.90
1.00
1.10
1.20
1.30
1.40
1.50
1.60
1.70
1.80
1.90
2.00
2.10
0 0.5 1 1.5 2
Sp
ectr
al accele
rati
on
(g
)
Period (s)
Generic Design Spectrum from ASCE 7-05
ASCE 7-05 Spectrum - Site Class D
Sa =0.4 SDS a T = 0 Sa = pga
To Sa = SDS
Ts = SD1/SDS
Sa = SD1/T
© Steven F. Bartlett, 2011
ASCE 7-05 (cont.)Sunday, August 14, 20113:32 PM
Design Spectra Page 10

ASCE 7-05 (cont.)3:32 PM
Design Spectra Page 11

Blank3:32 PM
Design Spectra Page 12