Embed Size (px)
Citation preview

01/04/2015
1
Design Optimization
Cyril Pernet
Centre for Clinical Brain Sciences (CCBS) Neuroimaging Sciences
Edinburgh 2015: biennial SPM course
Optimization?
• Making a design that is the most favourable or desirable, given some restrictions.
• Optimization for signal processing
• Optimization for statistics:
- Detection
- Estimation

01/04/2015
2
Optimization: a signal processing perspective
fMRI noise • It exists different sources of noise which can interfere with the
experiment (determines the SNR):
Thermal (intrinsic) noise
System noise: static field inhomogeneities (scanner drift = resonance frequency H+), nonlinearities and instabilities on the gradient fields, off-resonance or loading effects in the radiofrequency transmitter and receiver coils
Physiological noise: cardiac / respiratory activity (aliasing pblm) / motion

01/04/2015
3
fMRI noise
• Thermal noise is produced due to the thermal motion of electrons inside the subject's body and in the large electronic circuits of the MRI scanner.
• Thermal noise is produced due to the thermal motion of electrons inside the subject's body and in the large electronic circuits of the MRI scanner.
This type of intrinsic scanner noise is uncorrelated to the task and the hemodynamic signal, and therefore can be described as “white” noise. This type of noise increases with increased resolution, i.e. for smaller voxel size.
fMRI noise • System Noise: Nyquist N/2 Ghost. EPI scans using a zig-zag
trajectory in k-space can suffer from ghosting artefacts in the phase encoding direction (a single ghost shifted by half a FOV). The reason comes reading of the pulse echos that are not in phase. Ask your MRI physicist: shimming / gradient coils / eddy currents (always there because switching gradients on/off quickly).
http://mri-q.com/nyquist-n2-ghosts.html

01/04/2015
4
fMRI noise • System Noise: Susceptibility artefacts are caused by changes of
the magnetic susceptibility like the signal from regions of different properties (brain/air). Artefacts can also be caused by the presence of magnetic material in proximity of the gradients, e.g. implants, braces.
• System Noise: Scanner drift. Drift is created most probably by the small instability of scanner gradients. It can create slow changes in voxel intensity over time (2 sessions = 2 mean intensities).
http://www.mritutor.org http://www.mr-tip.com http://mri-q.com McKinstry & Jarett 2004
fMRI noise
• Physiological noise : The pulsation of the blood and changes connected to breathing can change blood flow and oxygenation.
• These factors create high frequency signal artefacts, for example, the cardiac cycle is too fast (500 ms) to be sampled with a relatively average TR (2000 ms – but see new multiband EPI). However, when this is the case, the variability become attributed to a lower frequency (aliasing), creating an even larger problem.

01/04/2015
5
fMRI noise
Respiratory-induced noise is dominant near the edges of the brain as well as near in the larger veins and in the ventricles (Lund et al., 2006)
fMRI noise
Cardiac-induced noise is dominant near larger vessels, e.g. medial cerebral artery and Circle of Willis (Lund et al., 2006)
01/04/2015
6
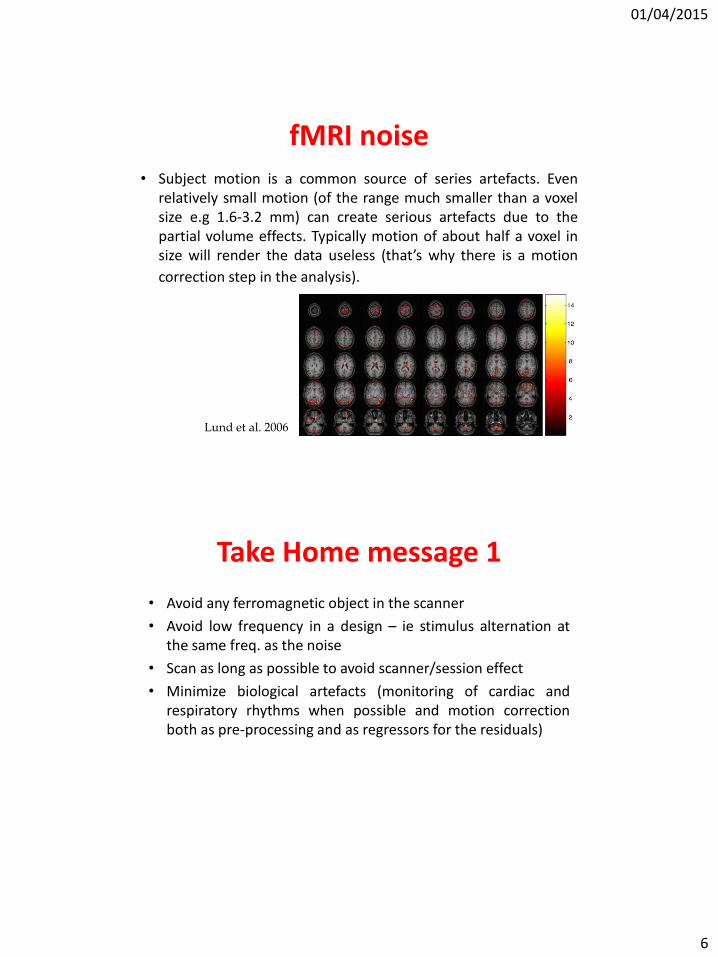
fMRI noise • Subject motion is a common source of series artefacts. Even
relatively small motion (of the range much smaller than a voxel size e.g 1.6-3.2 mm) can create serious artefacts due to the partial volume effects. Typically motion of about half a voxel in size will render the data useless (that’s why there is a motion
correction step in the analysis).
Lund et al. 2006
Take Home message 1
• Avoid any ferromagnetic object in the scanner
• Avoid low frequency in a design – ie stimulus alternation at the same freq. as the noise
• Scan as long as possible to avoid scanner/session effect
• Minimize biological artefacts (monitoring of cardiac and respiratory rhythms when possible and motion correction both as pre-processing and as regressors for the residuals)
01/04/2015
7
Optimization: a statistical perspective
fMRI designs

01/04/2015
8
Blocked designs
• Powerful in terms of detection, i.e. to determine which voxels are activated.
• Poor estimation power, i.e. a weak ability to determine the time course of the response summation of hemodynamic responses.
Ex: 1 stimulus every 1 sec / 3 sec / 5 sec
TR: 2.5 sec Highpass filter: 128Hz
=
Blocked designs
• The advantage of short ISI is that the response is greater than for long ISI because responses to different stimuli summate thus increasing the response amplitude
The disadvantage of short ISI is that it exists an hemodynamic refractoriness period, a neuronal refractoriness period, i.e. late neuronal components may be interrupted by early components of next stimulus. There is also a cost for task related performances (particularly for patients), trade off rate/performance.
1Hz 0.3Hz 0.2Hz

01/04/2015
9
• Modelling blocks vs. events: It is extremely important to distinguish between the experimental design (blocked or event related) and the neural model (epoch or event).
Blocked designs
=3 =5
Block design and block model = the parameter estimates (β) reflect the fit for the whole blocks; i.e. activation for stimuli presented at higher rate elicited more activations than those presented at lower rate.
0.5 Hz 0.25 Hz Block design but event model = the parameter estimates (β) reflect the fit for the each event; i.e. activation for stimuli presented at lower rate elicited more activations than those presented at higher rate (we have twice as many stimuli at 0.5 than 0.25Hz but the mean activity isn’t the double, the response per stimuli must be less)
=11 =9
• Signal strength varies with the length of blocks.
With short blocks (less than 10s), the signal does not return
to baseline during null-blocks decreasing the strength of the signal.
Blocked designs
With long block lengths, a large response is evoked during the task blocks and the response returns to baseline during null-blocks.
5 / 10 / 15 / 30 sec
01/04/2015
10
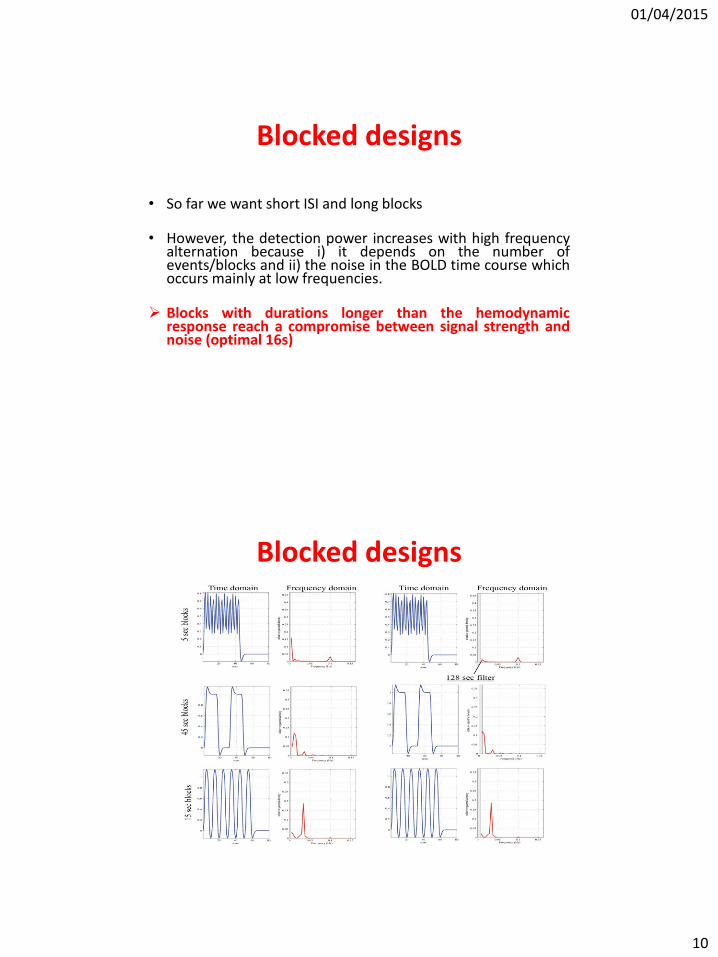
• So far we want short ISI and long blocks
• However, the detection power increases with high frequency
alternation because i) it depends on the number of events/blocks and ii) the noise in the BOLD time course which occurs mainly at low frequencies.
Blocks with durations longer than the hemodynamic response reach a compromise between signal strength and noise (optimal 16s)
Blocked designs
Blocked designs

01/04/2015
11
• Controlled block designs (ie with rest/control periods) ensure non overlap of hemodynamic response
• Can use betas (or t-values) from GLM per block for a classifier
• Multiple exemplars of stimulus class presented within block
Blocked designs for MVPA
Haxby et al, 2001: • 8 participants • 8 stimulus classes • 8 blocks per run • 12 runs • Betas input to classifier
One-back repetition in blocks of 24 sec ISI 1500ms 12 sec between blocks
• Controlled block designs (ie with rest/control periods) ensure non overlap of hemodynamic response
• Can use betas (or t-values) from GLM per block for a classifier
• Multiple exemplars of stimulus class presented within block
Blocked designs for MVPA
Haxby et al, 2001: • 8 participants • 8 stimulus classes • 8 blocks per run • 12 runs • Betas input to classifier

01/04/2015
12
Example of a Periodic designs
Event-related designs
Alternates two conditions A A B A B B A B every 20 sec
• Estimation power of event-related design is often good as they allow to inquire the hemodynamic shape for each condition and compare parameters such as the amplitude or the timing between conditions.
• By contrast, the detection power is relatively weak in comparison with blocked design. This is explained by the simple fact that experimental power depends on the number of events that are averaged.
Event-related designs

01/04/2015
13
Event-related designs
• Jittering to sample different ‘points’
• Stimuli are closely spaced in time, i.e. there is an overlap of the hemodynamic responses.
• Raw signal uninterpretable but trials can be in a total random sequence such as it is highly resistant to habituation, set, and expectation.
• By introducing ‘null events’ one creates differential ISI, i.e. differential overlaps between hemodynamic responses which allows a full characterization of this response.
Rapid Event-related designs
A + B A A A A + + + + B B B Time

01/04/2015
14
• Jittered designs rely on the likelihood of a given ISI following each stimulus (stationary stochastic designs)
• Randomized designs rely on the likelihood of a stimulus being presented at each time point.
• Semirandon designs, rely on the systematic probability variation of stimuli over time (dynamic stochastic designs)
Rapid Event-related designs
Adaptation designs
• fMRI adaptation designs (afMRI) use the refractory period to enquire functional differences within a given voxel.
• The predicted hemodynamic response relies often on a linear prediction. This means that for an impulse (a short-duration stimulus), the hemodynamic system responds in the same manner. The parameters of the hemodynamic response are then directly interpreted as reflecting both the intensity and the duration of the neural response given the scaling (the magnitude of the system output is proportional to the system input) and superposition (the total response to a set of inputs is the sum of individual inputs) properties of linear systems .

01/04/2015
15
• The hemodynamic response is linear for ISI > 6s and nearly linear down to ISI ~ 3s. If the ISI is short, the response to a subsequent stimuli is weaker than for a longer ISI (Boynton and al., 1996, J Neurosci 16, 4207-4221; Dale & Buckner, 1997, Hum Br Map 5, 329-340). This phenomenon is known as the hemodynamic refractory period.
1st:0.21 2nd:0.17 3rd:0.12
Adaptation designs
Extension of adaptation: carry over
- Continuous carry-over can be used to estimate simultaneously the difference in neural activity between stimuli (for the purpose of distributed pattern analysis) as well as the effect of one stimulus upon another (carry-over effects ~ adaptation).
- Direct and carry-over effects are orthogonal when the order of presentation of stimuli is serially first-order balanced, i.e. each stimulus is preceded equally often by every other stimulus (including self-adjacencies).
Adaptation designs

01/04/2015
16
Extension of adaptation: carry over
http://www.cfn.upenn.edu/aguirre/wiki/public:continuous_carry-over_for_bold_fmri
Adaptation designs
Extension of adaptation: carry over
http://www.cfn.upenn.edu/aguirre/wiki/public:continuous_carry-over_for_bold_fmri
Adaptation designs

01/04/2015
17
• Classifications are more accurate with limited number of classes = Multiple exemplars per class/category for classification study. Use the same number of samples/exemplars per class to avoid bias toward most frequent stimuli.
How many stimuli ?
• RSA on the other end necessitate stimulus rich designs = Numerous, non-repeated stimuli
(Kriegeskorte 2008)
• For univariate analysis, dynamic stochastic designs (pseudo-random) offers the maximum power. One issue is that with large number of classes, the spacing becomes large – ie gets close to the noise.
• Mumford et al. 2014 showed that for multivariate analysis, only randomized designs are appropriate. Importantly, to avoid a bias due to collinearity and autocorrelation, the randimization must be performed across subjects as well.
Which order for my stimuli ?

01/04/2015
18
• Mumford et al. 2014.
Which order for my stimuli ?
For RSA, pseudorandom designs lead to artificial differences. Alternating and random are Better, no matter the ISI (doesn’t need to be slow !)
Mixed designs
• Stimuli are displayed in discrete blocks investigate sustained processes and brain responses (state-
related processes). This is different from semirandom designs where, whatever the stimulation rate, we assume that the process is always the same (looking for transient activity for each stimulus).
• Within each block multiple types of events because different types of stimuli, transient responses are
likely to occurs. • Mixed designs can investigate interaction between processes
working at different time-scales.

01/04/2015
19
• Example: Chawla et al. 1999.
• Epochs of attention to motion or color
(same stimulus display, i.e. moving
green colored dots). During each
block, red moving dots appeared and
the subjects had to detect target
stimuli (7% faster red dots or brighter).
• Optimization
• Randomized, some long SOAs to ‘de-
correlate’ epoch and event-related.
attention to motion
attention to color
Interaction between attention and
stimulus motion change in V5
Mixed designs
(from R. Henson
http://www.fil.ion.ucl.ac.uk/spm/course/slides05/ppt/event.ppt)
Take Home message 2
• Choose your design according to your topic:
• Detection (block designs), Estimation (event-related designs), Estimation of event during different ‘states’( mixed designs), How works a region (afMRI).
• Think frequency, decorrelation and sequence order.
• Think what is going to be the main analysis (depending on the goal): univariate vs multivariate.

01/04/2015
20
Statistical Efficiency
Y = X+e (data=model*reg coef + error)
= (XT X)-1 XTY (we search )
= C (contrast = combination of )
t = / (std * sqrt(C (XT X)-1 CT) ) (usual t-test effect / error)
‘noise’ variance and design variance
Eff = 1 / trace (C (XTX)-1 CT) (you want the error to be small)
Optimize the covariance matrix = increase the variability
fMRI designs & efficiency

01/04/2015
21
(XTX) is the information matrix which reflects the orthogonality (correlation) of the regressors
corr(ij) = cov(ij) / sqrt (var(i) var(j)) ; if one decorrelates i and j by construction, this means cov(ij) decreases
If conditions are highly correlated (e.g. when i present, j absent, r = -1), the trace of (XTX) -1 increases and Eff decreases; conversely decorrelating ij will increase Eff
fMRI designs & efficiency
• Decorrelating i and j
fMRI designs & efficiency
01/04/2015
22
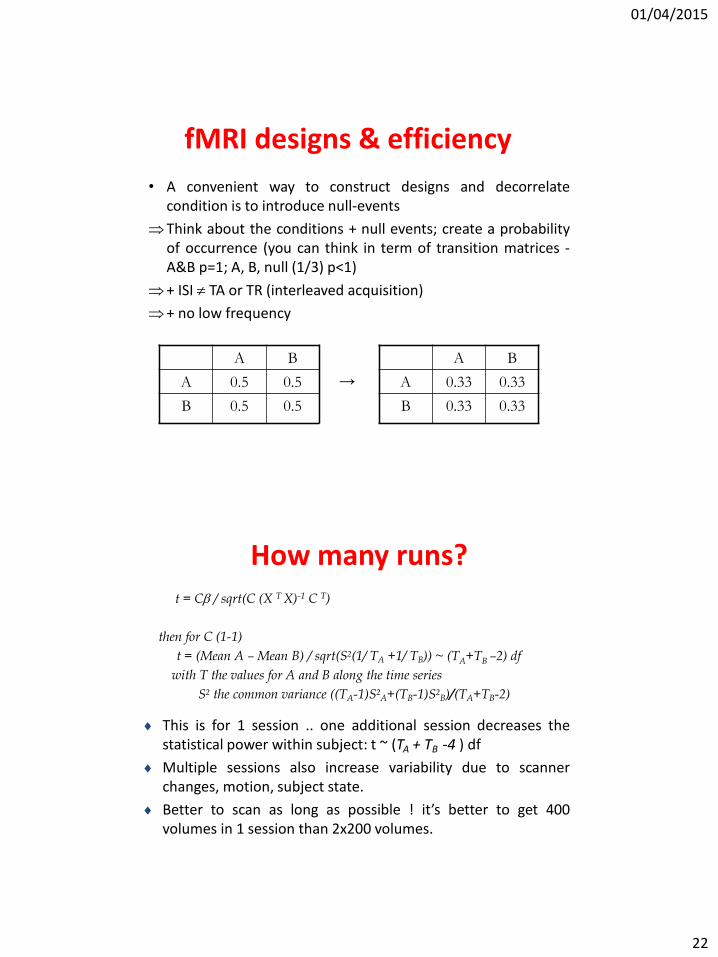
• A convenient way to construct designs and decorrelate condition is to introduce null-events
Think about the conditions + null events; create a probability of occurrence (you can think in term of transition matrices - A&B p=1; A, B, null (1/3) p<1)
+ ISI TA or TR (interleaved acquisition)
+ no low frequency
A B
A 0.5 0.5
B 0.5 0.5
A B
A 0.33 0.33
B 0.33 0.33
→
fMRI designs & efficiency
t = C / sqrt(C (X T X)-1 C T)
then for C (1-1)
t = (Mean A – Mean B) / sqrt(S²(1/ TA +1/ TB)) ~ (TA+TB –2) df
with T the values for A and B along the time series
S² the common variance ((TA-1)S²A+(TB-1)S²B)/(TA+TB-2)
This is for 1 session .. one additional session decreases the statistical power within subject: t ~ (TA + TB -4 ) df
Multiple sessions also increase variability due to scanner changes, motion, subject state.
Better to scan as long as possible ! it’s better to get 400 volumes in 1 session than 2x200 volumes.
How many runs?

01/04/2015
23
• Any collinearity and autocorrelation bias the results of MVPA.
• Correlations and cross-validation between runs are better.
How many runs? revised
Better to scan as long as possible ! it’s better to get 4*100 volumes in 4 sessions than 1x400 volumes (Courtanche 2012, Mumford, 2014).
Take Home message 3
• Decorrelatate as much as possible the conditions
• Introduce null events
• Avoid low frequency in the design to oppose conditions
• Long sessions are better than short ones but multiple sessions are needed for MVPA

01/04/2015
24
References
• Birn, RM., Cox, RW. Bandettini, PA. (2002) Detection versus Estimation in Event-Related fMRI: Choosing the Optimal Stimulus Timing. NeuroImage, 15, 252-264 • Boynton, GM., Engel, SA., Glover, GH., Heeger, DJ. (1996) Linear Systems Analysis of Functional Magnetic Resonance Imaging in Human V1. J Neurosci, 16, 4207-4221 • Courtanche, M & Thompson-Schill, S.L. (2012). The advantage of brief fMRI acquisition runs for multi-voxel pattern detection across runs. NeuroImage, 61, 1113-1119. • Dale, AM., Buckner, RL. (1997) Selective averaging of rapidly presented individual trials using fMRI. Hum Br Map, 5, 329-340 • Friston, K., Josephs, O., Zarahn, E., Henson, R.N. & Dale, A. (1999) Stochastic designs in event-related fMRI. NeuroImage, 10, 607-619

01/04/2015
25
• Grill-Spector, K., Hensom, R., Martin, A. (2003) Repetition and the
brain: neural models of stimulus-specific effects. TICS, 10, 14-23
• Henson R. (2007) Efficient Experimental design for fMRI (pp 193-210),
In Statistical Parametric Mapping: The analysis of functional brain
imaging data, Academic Press
• Liu, TT., Frank, LR., Wong, EC., Buxton, RB. (2001) Detection Power,
Estimation Efficiency, and Predictability in Event-Related fMRI.
NeuroImage, 13, 759-773
• Lund, TE., Madsen, KH., Sidaros, K., Luo, W-L., Nichols, T. (2006) Non-
white noise in fMRI: Does modelling have an impact? NeuroImage,
29, 54-66
• Mumford, J., Davis, T., Poldrack, R. (2014). The impact of study design
on pattern analysis. NeuroImage, 103, 130-138
• Savoy, R. (2005) Experimental design in brain activation MRI:
Cautionary tales. Br Res Bul, 67, 361-367
websites Henson R. – design efficiency: http://www.mrc-cbu.cam.ac.uk/Imaging/Common/fMRI-efficiency.shtml Pernet C. – general design considerations http://www.sbirc.ed.ac.uk/cyril/cp_fmri.html Convolution: http://mathworld.wolfram.com/Convolution.html Covariance matrix: http://en.wikipedia.org/wiki/Covariance_matrix Optimization tools http://surfer.nmr.mgh.harvard.edu/optseq/ http://www.columbia.edu/cu/psychology/tor/software.htm http://jasonkao.myweb.uga.edu/research.htm