Embed Size (px)
Citation preview

DESIGN OPTIMISATION OF VEHICLE COMPONENTS FOR FULL FRONTAL
CRASH
By
Pulkit Sharma
Ram Mohan Telikicherla
Sai Nizampatnam
Viswanathan Parthasarathy
MAE-598- 2016-TEAM 10
05/02/2016
ABSTRACT
Vehicular passive energy absorption plays an important part during frontal crash for passenger
safety. Optimization of the frontal components is the key to increasing energy absorption due to
large parameters. A full frontal crash of Volvo V40 model has been done in this project using
ANSYS Explicit Dynamics module. Simplified geometry to represent major energy absorption
mechanism of the individual components involved in frontal crash have been modelled on
ANSYS modeler and analyzed under standard test conditions. The components considered for
optimization are bumper cover stiffener, energy absorber, bumper cross-beam and chassis
longitudinal member. MOGA and NLPQL implemented in ANSYS is utilized to optimize the
geometries for individual components to give maximum energy absorption. The optimized
geometry of each component was finally assembled together and analyzed again in under the
same conditions.

TABLE OF CONTENTS
1. PROBLEM STATEMENT:
2. NOMENCLATURE:
3. BUMPER COVER STIFFENER
3.1 MATHEMATICAL MODEL:
3.1.1 OBJECTIVE FUNCTION:
3.1.2 STIFFENER PROPERTIES:
3.1.3 DESIGN PARAMETERS:
3.1.4 CONSTRAINTS:
3.2 MODEL ANALYSIS:
3.2.1 ANALYSIS METHOD AND BOUNDARY CONDITIONS:
3.3 OPTIMIZATION STUDY:
3.3.1 DESIGN OF EXPERIMENTS:
3.3.2 SENSITIVITY ANALYSIS:
3.3.3 OPTIMISATION METHOD:
3.4 DISCUSSION OF RESULTS:
4. ENERGY ABSORBER
4.1 MATHEMATICAL MODEL:
4.1.1 OBJECTIVE FUNCTION:
4.1.2 ENERGY ABSORBER PROPERTIES AND DIMENSIONS:
4.1.3 DESIGN PARAMETERS:
4.1.4 CONSTRAINTS:
4.2 MODEL ANALYSIS:
4.2.1 ANALYSIS METHOD AND BOUNDARY CONDITIONS:
4.3 OPTIMIZATION STUDY:
4.3.1 DESIGN OF EXPERIMENTS:
4.3.2 SENSITIVITY ANALYSIS:
4.3.3 OPTIMISATION METHOD:
4.4 DISCUSSION OF RESULTS:
5. BUMPER CROSS BEAM:
5.1 MATHEMATICAL MODEL:
5.1.1 OBJECTIVE FUNCTION:
5.1.2 DESIGN PARAMETERS:
5.1.3 CONSTRAINTS:
5.2 MODEL ANALYSIS:

5.2.1 ANALYSIS METHODOLOGY AND BOUNDARY CONDITIONS:
5.3 OPTIMIZATION STUDY:
5.3.1 DESIGN OF EXPERIMENTS:
5.3.2 OPTIMIZATION METHOD:
5.4 DISCUSSION OF RESULTS:
6. CHASSIS LONGITUDINAL BEAM
6.1 MATHEMATICAL MODEL:
6.1.1 OBJECTIVE FUNCTION:
6.1.2 DESIGN PARAMETERS:
6.1.3 CONSTRAINTS:
6.2 MODEL ANALYSIS:
6.2.1 ASSUMPTIONS:
6.2.2 ANALYSIS METHOD AND BOUNDARY CONDITIONS:
6.3 OPTIMIZATION STUDY:
6.3.1 DESIGN OF EXPERIMENTS:
6.3.2 SENSITIVITY ANALYSIS:
6.3.3 OPTIMISATION METHOD:
6.4 DISCUSSION OF RESULTS:
COMPARISON BETWEEN BASE AND OPTIMIZED DESIGN:
7. INTEGRATION STUDY:

1. PROBLEM STATEMENT
The automobile industry is trying to improve three themes which are energy conservation,
safety and comfort. Further, due to the humongous increase of vehicles on the road, many
research universities are focusing on improving the vehicle safety standards [1,2]. Given the
current volume of vehicles on the road, a lot safety measures are being developed in order to
safeguard the passengers, which in turn means to make the vehicles to absorb more energy
during vehicle collision. In the current study, design optimization of full- frontal structure of
a vehicle to increase the energy absorption is conducted. There are four sub-systems in the
frontal structure, namely Bumper cover stiffener, Energy absorber, Bumper longitudinal
beam and chassis member.
Fig.1: Extruded view of frontal crash components on vehicle
Numerous analysis was studied in order to carry out simulations of full frontal structure on
ANSYS. Douglas Gabauer et al. [3] Studied about injury criteria during a road side vehicle
collision. They have analyzed the Head Injury Criterion (HIC) and Acceleration Severity
Index (ASI) for each simulation to find correlation between the both. Energy absorption and
design optimization of the full – frontal structure wasn’t discussed in this paper.
Zhida Shen et al. [4] presented the FEA modeling of the whole vehicle to increase the safety
standards in the vehicle. They have analyzed for different parameters in order to find an
optimal solution to meet their main objective. They have done for whole vehicle collision for
high- velocity, low- velocity impact as well as the side wise collision. This model however
doesn’t optimize the design of vehicle.
Hao Chen et al. [5] studied the energy absorption on the whole vehicle and carried out the
orthogonal design optimization, structural optimization using LS-DYNA. They have carried
out the analysis on bumper cross beam (A), bumper cross thickness material (B), energy
absorber groove distance (C) and front longitudinal beam groove member (D) along with 3
levels of each factor. Under these parameters, they have found their best condition to absorb
51% of energy during a collision.
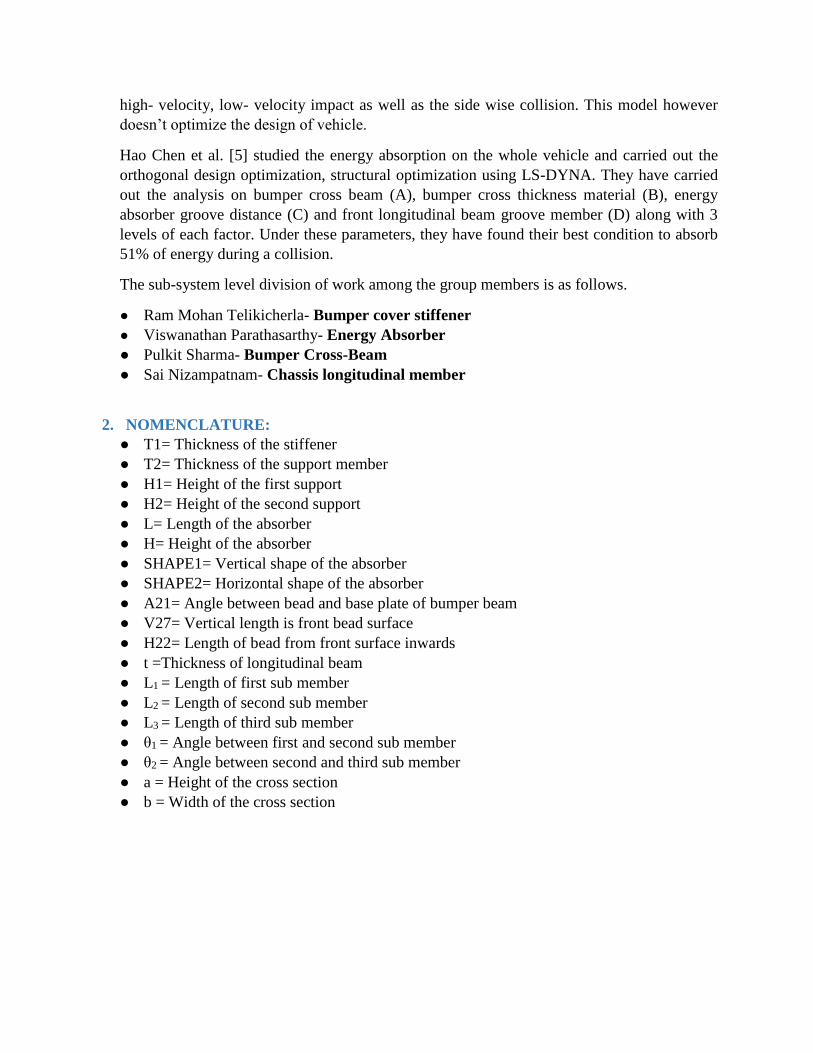
The sub-system level division of work among the group members is as follows.
● Ram Mohan Telikicherla- Bumper cover stiffener
● Viswanathan Parathasarthy- Energy Absorber
● Pulkit Sharma- Bumper Cross-Beam ● Sai Nizampatnam- Chassis longitudinal member
2. NOMENCLATURE:
● T1= Thickness of the stiffener ● T2= Thickness of the support member ● H1= Height of the first support ● H2= Height of the second support ● L= Length of the absorber ● H= Height of the absorber
● SHAPE1= Vertical shape of the absorber ● SHAPE2= Horizontal shape of the absorber ● A21= Angle between bead and base plate of bumper beam
● V27= Vertical length is front bead surface
● H22= Length of bead from front surface inwards
● t =Thickness of longitudinal beam
● L1 = Length of first sub member
● L2 = Length of second sub member
● L3 = Length of third sub member
● θ1 = Angle between first and second sub member
● θ2 = Angle between second and third sub member
● a = Height of the cross section
● b = Width of the cross section

3. BUMPER COVER STIFFENER
3.1 MATHEMATICAL MODEL:
3.1.1 OBJECTIVE FUNCTION: The objective of the problem is to maximize the energy that can be absorbed by the stiffener
and minimize the equivalent Von-misses stress in the member during low velocity crash.
From literature it has been found that the component taken for optimization is useful for
energy absorption during low velocity crash. A stiffener is a component that is attached
behind the bumper cover and it is the main member in the assembly that absorbs maximum
energy during low velocity crash.
3.1.2 STIFFENER PROPERTIES: ● Material- Aluminum alloy ● Weight of the stiffener- 3.3 kgs. ● Height of the stiffener- 197 mm ● Width of the stiffener- 1310 mm ● Depth of the stiffener- 202 mm All dimensions are in millimeters and the weight is in kilograms. The dimensions and
material properties has been taken from manufacturer’s data sheet and has not been
optimized.
3.1.3 DESIGN PARAMETERS: The design parameters taken for the optimization study are thickness of the stiffener,
thickness of the support, height of first support and height of the second support.
Fig.2: Top view and side view of the stiffener member

Fig.3: Cross section of the stiffener with design parameters
Fig.4: Isometric view of the stiffener with wall.
3.1.4 CONSTRAINTS: The upper bounds and lower bounds for each design parameter that has been taken to optimize
has been constrained within the range given below in Table 1.
Table 1: Design parameters with initial values and bounds.
DESIGN PARAMETER INTIAL
VALUE UPPER BOUND LOWER
BOUND
T1 Thickness of stiffener 10 11 9
T2 Thickness of support 5 5.5 4.5
H1 Height of the first support 6 6.5 5.5
T1-Thickness of the stiffener
H2- Height of the second support
H1-Height of the first support
T2-Thickness of the support

H2 Height of the second support 6 6.5 5.5
All dimensions are in (mm).
3.2 MODEL ANALYSIS:
3.2.1ANALYSIS METHOD AND BOUNDARY CONDITIONS: Explicit dynamics analysis has been performed on the central stiffener by fixing the stiffener and
giving velocity to the wall. The reason to choose explicit dynamics analysis in ANSYS is
because in the absence of LS-DYNA if a crash simulation has to be performed then explicit
dynamics module will provide the best possible results. The boundary conditions that have been
taken for getting the results that can be compared with literature are as following.
The bumper cover stiffener has been fixed at the end faces. This has been done because in the
assembly the stiffener component is snap fitted onto the main frame of the car body and during
crash the end members are fixed and the stiffener fails at the center. A wall was modelled and
given an initial velocity to show the deformation of the stiffener due to varying velocity.
3.3 OPTIMIZATION STUDY:
3.3.1 DESIGN OF EXPERIMENTS: LATIN- HYPERCUBE SAMPLING ALGORITHM:
In order to perform the design of experiments on ANSYS Workbench, Latin- hypercube
algorithm has been used. The reason to use this algorithm is because as there are more number of
inputs variables that increase the number of simulation runs which also increases the number of
permutations. Latin hypercube sampling algorithm developed by McKay et al., offers a proven
mechanism to reduce the number of simulation runs needed to complete the sensitivity analysis.
Fig.5: Design of experiments input
The number of samples in the above picture taken from ANSYS Workbench shows the number
of data points taken to run the design of experiments.

3.3.2 SENSITIVITY ANALYSIS:
Fig.6: Sensitivity analysis of design parameters with output data
The above sensitivity analysis tells that the stiffener thickness, support thickness and height of
second support are very sensitive to the energy absorption and equivalent von-misses stress.
3.3.3 OPTIMISATION METHOD:
Fig.7: Candidate points that are obtained after running MOGA for optimization
The optimization method used in this subsystem is MOGA (Multiple objective genetic
algorithm). The reason to choose this algorithm is because there are two conflicting objective
functions. They are:
1. Maximizing the energy absorption.
2. Minimizing the equivalent Von-Misses stress.
These parameters are conflicting since the energy absorption calculation in ANSYS is done by
taking the maximum strain energy and the stress is calculated by taking the maximum equivalent
Von-misses stress. The two parameters taken are interdependent and there is system level trade-
off in order to get the optimal design.

3.4 DISCUSSION OF RESULTS: From the optimization study the point where there is maximum energy absorption and minimum
equivalent stress is candidate point 2 from the below results.
Fig.8: Candidate point showing the percentage variation from initial value
We can see that the variation in the three candidate points is very less. This clearly tells us that
the results obtained are repeatable.
Fig.9: Cross section of the stiffener with optimized values.
T1= 10.686 mm
H2= 5.6972mm
H1= 5.5103 mm
T2= 4.5267 mm
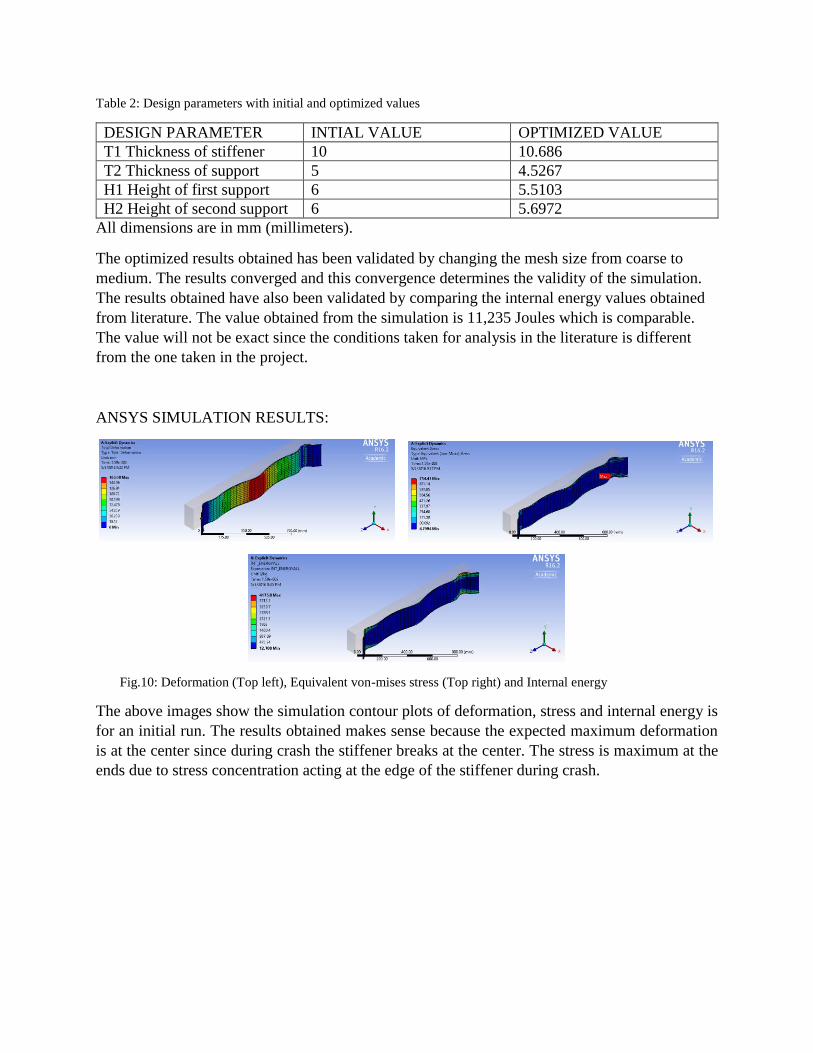
Table 2: Design parameters with initial and optimized values
DESIGN PARAMETER INTIAL VALUE OPTIMIZED VALUE
T1 Thickness of stiffener 10 10.686
T2 Thickness of support 5 4.5267
H1 Height of first support 6 5.5103
H2 Height of second support 6 5.6972
All dimensions are in mm (millimeters).
The optimized results obtained has been validated by changing the mesh size from coarse to
medium. The results converged and this convergence determines the validity of the simulation.
The results obtained have also been validated by comparing the internal energy values obtained
from literature. The value obtained from the simulation is 11,235 Joules which is comparable.
The value will not be exact since the conditions taken for analysis in the literature is different
from the one taken in the project.
ANSYS SIMULATION RESULTS:
Fig.10: Deformation (Top left), Equivalent von-mises stress (Top right) and Internal energy
The above images show the simulation contour plots of deformation, stress and internal energy is
for an initial run. The results obtained makes sense because the expected maximum deformation
is at the center since during crash the stiffener breaks at the center. The stress is maximum at the
ends due to stress concentration acting at the edge of the stiffener during crash.

4. ENERGY ABSORBER Energy absorber is key member which is fixed in the stiffener. It’s mainly used in low-velocity
impact such that the other component’s damage is restricted. In the current work, we have
modelled energy absorber with the same dimensions as on Volvo V40.
4.1 MATHEMATICAL MODEL:
4.1.1 OBJECTIVE FUNCTION: The main objective of the project is to maximize the energy that can be absorbed by the energy
absorber. After studying numerous analysis done by different authors and it’s found that the
optimization of energy absorber for a low-velocity collision would be useful rather than a higher-
velocity one. In order to increase the energy absorption, the shape of the absorber is
parameterized within the original dimension of the car to avoid any conflict with other parts of
systems.
4.1.2 ENERGY ABSORBER PROPERTIES AND DIMENSIONS: ● Material – Polyurethane
● Mass – 0.45474 kg
● Height of the absorber – 105 mm
● Length of the absorber – 76 mm
● Horizontal shape of the absorber – 44.828 mm
● Vertical Shape of the absorber – 22.146 mm
4.1.3 DESIGN PARAMETERS: There are two energy absorbers attached to the stiffener which is symmetrical in shape and
properties, so we have taken only one energy absorber to improve the energy absorber and
multiply the result obtained by a factor of 2. The geometrical parameters of the absorber as
shown in the figure 11 and the shape of the absorber is shown in figure 12 below would be
varied to increase the energy absorption.
Fig.11: Model of the energy absorber
Height
Length
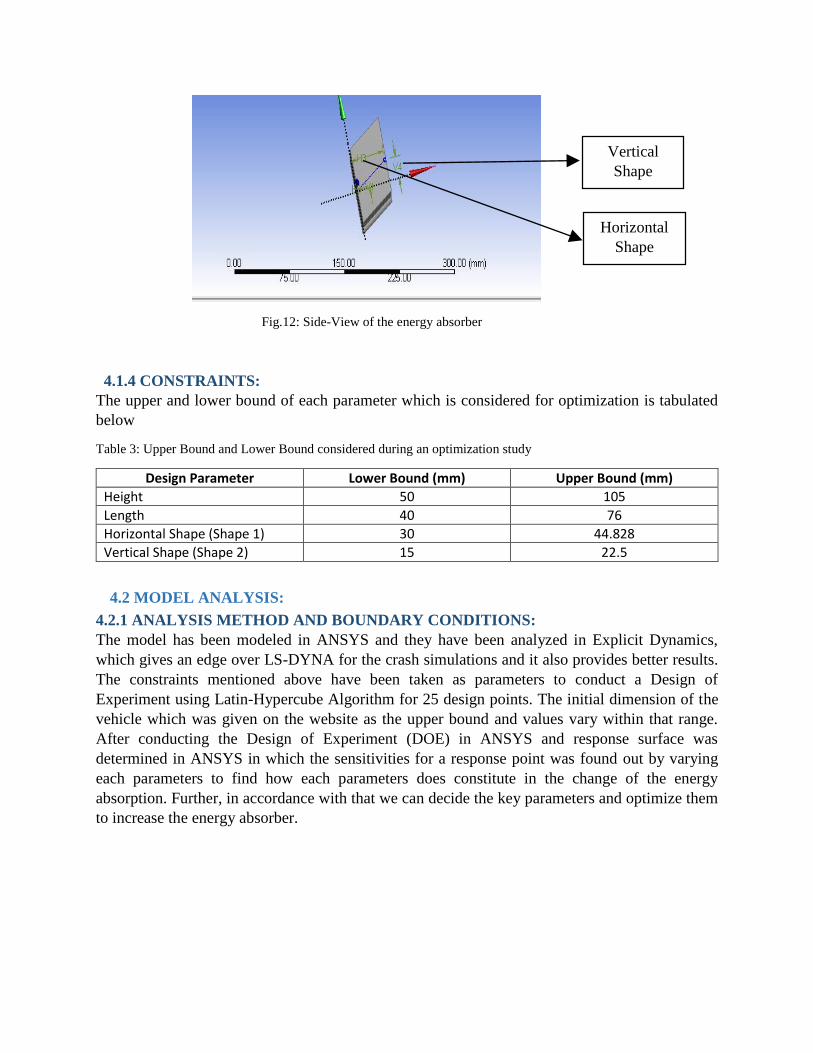
Fig.12: Side-View of the energy absorber
4.1.4 CONSTRAINTS: The upper and lower bound of each parameter which is considered for optimization is tabulated
below
Table 3: Upper Bound and Lower Bound considered during an optimization study
Design Parameter Lower Bound (mm) Upper Bound (mm)
Height 50 105
Length 40 76
Horizontal Shape (Shape 1) 30 44.828
Vertical Shape (Shape 2) 15 22.5
4.2 MODEL ANALYSIS:
4.2.1 ANALYSIS METHOD AND BOUNDARY CONDITIONS: The model has been modeled in ANSYS and they have been analyzed in Explicit Dynamics,
which gives an edge over LS-DYNA for the crash simulations and it also provides better results.
The constraints mentioned above have been taken as parameters to conduct a Design of
Experiment using Latin-Hypercube Algorithm for 25 design points. The initial dimension of the
vehicle which was given on the website as the upper bound and values vary within that range.
After conducting the Design of Experiment (DOE) in ANSYS and response surface was
determined in ANSYS in which the sensitivities for a response point was found out by varying
each parameters to find how each parameters does constitute in the change of the energy
absorption. Further, in accordance with that we can decide the key parameters and optimize them
to increase the energy absorber.
Vertical
Shape
Horizontal
Shape
The boundary conditions that have been taken for getting the results that can be compared with
literature are as following. Assuming the vehicle structure in which energy absorber is fixed at
the end face. This is means that the energy absorber is fitted to the stiffener of the vehicle and
during a collision (low-velocity) impact, energy absorber fails at the front. For the simulations,
wall was modeled and initial velocity was given to see the deformation of the energy absorber
and energy absorbed by the part.
4.3 OPTIMIZATION STUDY:
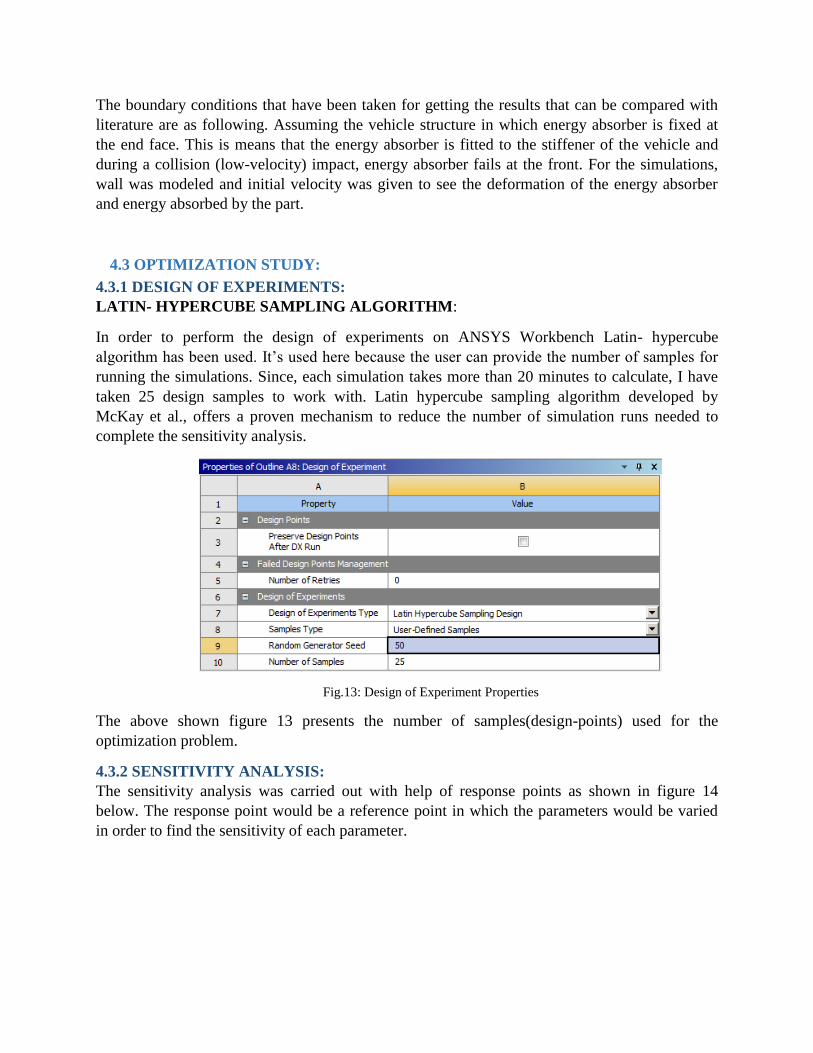
4.3.1 DESIGN OF EXPERIMENTS: LATIN- HYPERCUBE SAMPLING ALGORITHM:
In order to perform the design of experiments on ANSYS Workbench Latin- hypercube
algorithm has been used. It’s used here because the user can provide the number of samples for
running the simulations. Since, each simulation takes more than 20 minutes to calculate, I have
taken 25 design samples to work with. Latin hypercube sampling algorithm developed by
McKay et al., offers a proven mechanism to reduce the number of simulation runs needed to
complete the sensitivity analysis.
Fig.13: Design of Experiment Properties
The above shown figure 13 presents the number of samples(design-points) used for the
optimization problem.
4.3.2 SENSITIVITY ANALYSIS: The sensitivity analysis was carried out with help of response points as shown in figure 14
below. The response point would be a reference point in which the parameters would be varied
in order to find the sensitivity of each parameter.

Fig.14: Response Point Data
The below figure 15 represents the sensitivity of each parameter with the response points. From
the figure, we can observe that the length of the absorber is more sensitive to the energy
absorbed by the sub-system and similarly vertical shape of the absorber is more sensitive to the
total deformation. The response surface was determined by ANSYS and we observed how the
output parameters react to the input parameters.
Fig.15: Sensitivity Analysis of the Sub-System
4.3.3 OPTIMISATION METHOD: The optimization method used in this subsystem is NLPQL (Non-Linear Programming by
Quadratic Lagrangian). The reason to choose this algorithm is because there was only one
objective function and one constraint. It uses a quadratic approximation of a Lagrangian function
and a linearization of the constraints. The parameters taken are interdependent and there is
system level trade-off in order to get the optimal design.
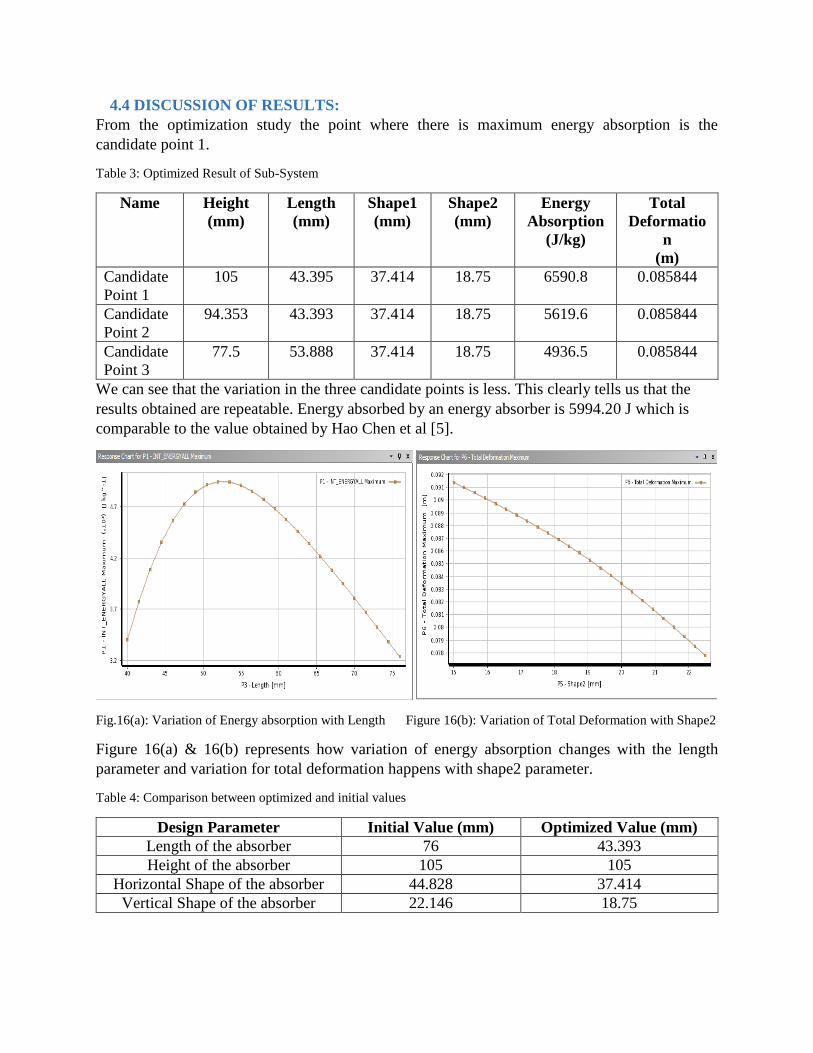
4.4 DISCUSSION OF RESULTS: From the optimization study the point where there is maximum energy absorption is the
candidate point 1.
Table 3: Optimized Result of Sub-System
Name Height
(mm) Length (mm)
Shape1
(mm) Shape2 (mm)
Energy
Absorption
(J/kg)
Total
Deformatio
n
(m)
Candidate
Point 1 105 43.395 37.414 18.75 6590.8 0.085844
Candidate
Point 2
94.353 43.393 37.414 18.75 5619.6 0.085844
Candidate
Point 3
77.5 53.888 37.414 18.75 4936.5 0.085844
We can see that the variation in the three candidate points is less. This clearly tells us that the
results obtained are repeatable. Energy absorbed by an energy absorber is 5994.20 J which is
comparable to the value obtained by Hao Chen et al [5].
Fig.16(a): Variation of Energy absorption with Length Figure 16(b): Variation of Total Deformation with Shape2
Figure 16(a) & 16(b) represents how variation of energy absorption changes with the length
parameter and variation for total deformation happens with shape2 parameter.
Table 4: Comparison between optimized and initial values
Design Parameter Initial Value (mm) Optimized Value (mm)
Length of the absorber 76 43.393
Height of the absorber 105 105
Horizontal Shape of the absorber 44.828 37.414
Vertical Shape of the absorber 22.146 18.75

5.BUMPER CROSS BEAM:
Bumper Cross-beam (or simply referred as bumper beam) is third major component from front in
longitudinal direction for frontal crash protection. It plays role in both low and high speed crash
by absorbing impact energy by bending and crushing of beads. In the current work, we have
modelled bumper beam with bead with same outer box dimensions as on Volvo V40.
5.1 MATHEMATICAL MODEL:
5.1.1 OBJECTIVE FUNCTION: The objective of this sub-problem is to maximize energy absorption (internal/strain energy) and
minimize maximum Von-Mises stress to increase the longevity of the beam under high velocity
impact (worst case criteria). Internal energy and Von-Mises stress considered is nodal averaged
values.
5.1.2 DESIGN PARAMETERS:
Fig. 17: Isometric view of bumper beam with bead
Fig. 18: Top view of bumper beam with outer box dimensions

Fig. 19: Cross-sections of bumper beam (a) without bead structure (135mmX55mm, thickness=2mm) (b) with bead
structure (V28=67.5mm, A21=85deg, H20=55mm, V22=38.59mm, H27=20mm)
Fig. 17, 18 and 19 shows the geometry of bumper beam with initial values of dimensions. The
material considered is structural steel and the mass is 4.0186 kg compared to 4.124 kg on actual
vehicle. Mass, stiffness and damping of structure and material are going to be vital properties to
correlate the CAE results with the actual component.
For the current analysis, Table 5 describes the parameters considered for optimization with
reason for selection.
Table 5: Design parameters* and initial values for optimization for bumper beam
S/N Parameter Initial value Comment
1 A21 85 deg Affects the crushing of bead structure
2 V22 38.59 mm Affects the front surface area and hence transmission
of load
3 H27 20 mm Affects the integrity of base plate for intrusion of bead
5.1.3 CONSTRAINTS: The upper bounds and lower bounds for each design parameter that has been taken to optimize
has been constrained within the range given in Table 6.
Table 6: Upper and lower bounds considered during optimization study
S/N Parameter Lower Bound Upper Bound
1 A21 85 deg 110 deg
2 V22 30 mm 45 mm
3 H27 16 mm 24 mm
(b) (a)

*Due to computation capability constraint, three most important parameters are considered. In case of no such
constraints all the mentioned geometric dimensions shown in fig. 19 and thickness have to be considered.
5.2 MODEL ANALYSIS:
5.2.1 ANALYSIS METHODOLOGY AND BOUNDARY CONDITIONS: The analysis is conducted in Explicit Dynamics module of ANSYS Workbench 16.2. The impact
was achieved with a rigid wall (mass = 760 kg) moving with a velocity of 15 m/s (run time =0.04
s). The boundary condition for bumper beam was finalized iteratively to avoid stress
concentration, refer Appendix 1 for details of iterations and results achieved. Further
convergence of the analysis was achieved by refining the mesh from coarse and medium in
sizing option. No significant change was observed between the two mesh sizes considered. So all
the further analysis will be conducted with coarse mesh to save on computations.
From the iterations conducted for boundary conditions (refer Appendix 1) it was concluded that
chassis long member have to be used with the bumper beam to give realistic results. Fig. 4 shows
the analysis setup and results obtained for initial values of parameters.
Fig. 20: Results of explicit dynamic analysis with chassis as high stiffness support for beam. Max Internal energy =
1267.5 J/kg and Max. Von-Mises Stress = 1674.5 MPa.
The simulation with chassis as support gives uniform spread of stress (no stress concentration)
which was expected considering the symmetry of structure and loading. Also both the
mechanisms of bending and crushing were simulated during impact. The obvious disadvantage

with the setup being that the analysis time increased 4 folds (about 4 hours per simulation).
Energy absorbed for bumper beam is 5179.6 J, which is comparable to value obtained by Hao
Chen et al [4].
5.3 OPTIMIZATION STUDY:
5.3.1 DESIGN OF EXPERIMENTS: In order to perform the design of experiments on ANSYS Workbench Latin- hypercube
algorithm has been used. The reason to use this algorithm is because as there are more number of
inputs the number of simulation runs increases due to the increase in number of permutations.
Latin hypercube sampling algorithm developed by McKay et al., offers a proven mechanism to
reduce the number of simulation runs needed to complete the sensitivity analysis.
The upper and lower bounds already mentioned are used to generate data points and
corresponding results.
5.3.2 OPTIMIZATION METHOD: The optimization method used in this subsystem is MOGA (Multiple objective genetic
algorithm). The reason to choose this algorithm is because there are two conflicting objective
functions. They are:
5. Maximizing the energy absorption.
6. Minimizing the equivalent Von-Misses stress.
These parameters are conflicting since the energy absorption calculation in ANSYS is done by
taking the maximum strain energy and the stress is calculated by taking the maximum equivalent
Von-misses stress. The two parameters taken are interdependent and there is system level trade-
off in order to get the optimal design.
5.4 DISCUSSION OF RESULTS: There are two results concluded for the analysis. First optimization is conducted with objective
function as given above and second optimization is conducted with objective function for
minimizing Von-Mises stress only. Fig. 5-8 are for first optimization. Fig. 5 and Fig. 6 shows the
variation of Energy absorption and Max. Von-Mises stress with A21. H27 and V22 doesn’t
affect energy absorption but only the Von-Mises stress as given in Fig. 7 and Fig. 8.
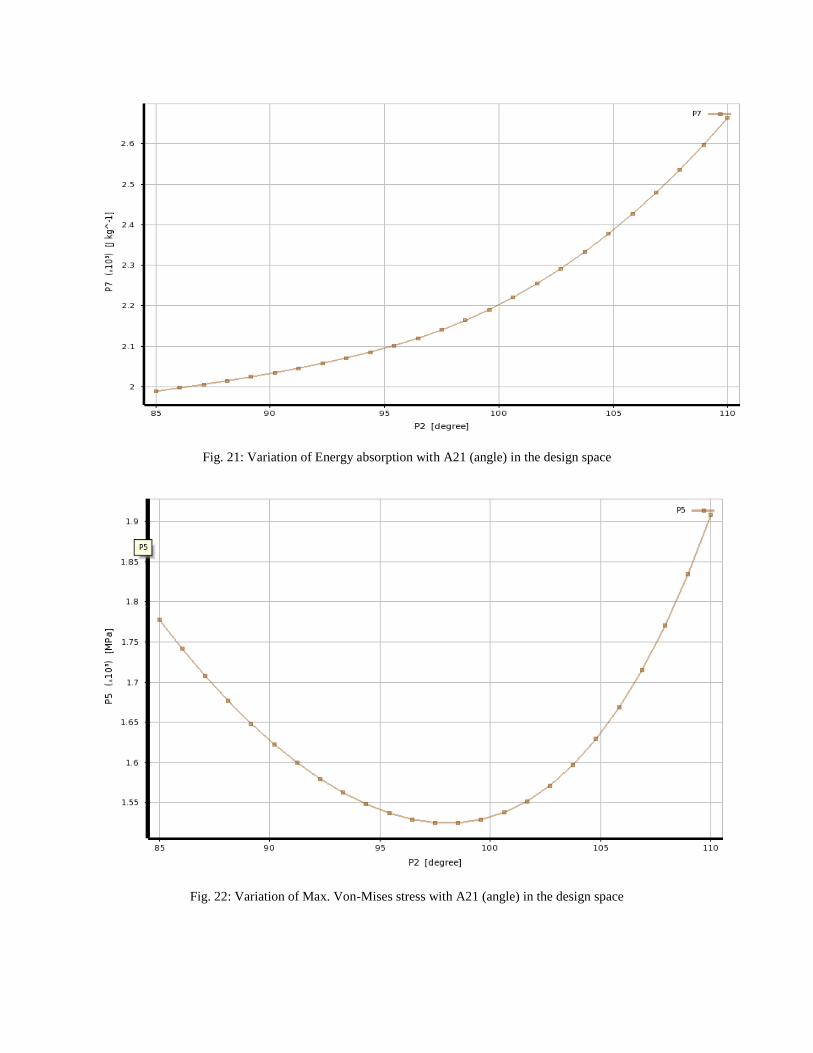
Fig. 21: Variation of Energy absorption with A21 (angle) in the design space
Fig. 22: Variation of Max. Von-Mises stress with A21 (angle) in the design space

Fig. 23: Variation of Max. Von-Mises stress with H27 in design space
Fig. 24: Variation of Max. Von-Mises stress with V22 in design space

Table 7: Summary of results from both optimization and comparison with initial values
Objective A21 H27 V22 Energy
absorption (J/kg) Stress
(MPa) Comment
Initial Values 85 20 38.59
Energy +
Stress 109.98 19.813 42.403 2662 1600.7 Design1
(D1)
Stress 98.54 20 34.73 2001 1542.9 Design2
(D2)
Considering fracture mechanical aspect to compare the two design obtained, we observe that
ultimate tensile strength of the beam is reached at 0.00175s and 0.00205s in D1 and D2
respectively. Furthermore, Energy absorbed for two cases are comparable at critical point of
fracture. Hence both the design gives equivalent performance till first fracture. A more detailed
fracture mechanic study is required to choose the best design out of two.
(a) (b) (c)
Fig. 25: Comparison of beam cross-section (a) Start value (b) Design1 (c) Design2

6. CHASSIS LONGITUDINAL BEAM 6.1 MATHEMATICAL MODEL:
6.1.1 OBJECTIVE FUNCTION: The objective of the problem is maximizing the energy absorbed during the crash resulting in
less damage to engine and passenger compartment. It is the most critical part as it absorbs
maximum energy during high velocity crash. This is attached just behind the bumper cross
beam. Total deformation is taken as the constraint which is given in detail under constraint
section.
Now much simplified model of chassis longitudinal member is incorporated as it provides
rapid estimate of crash behavior. [6]
The optimization results are given in the later section.
6.1.2 DESIGN PARAMETERS: The design parameters that are taken for the optimization study are as follows:
1. Thickness of longitudinal beam (t)
2. Length of first sub member (L1)
3. Length of second sub member (L2)
4. Length of third sub member (L3)
5. Angle between first and second sub member (θ1)
6. Angle between second and third sub member (θ2)
7. Height of the cross section (a)
8. Width of the cross section (b)
Fig.26: Side view and cross section of chassis longitudinal member
6.1.3 CONSTRAINTS: ● Total deformation ≤ 0.752 mm
● Upper bound and lower bound of each design parameters are as given in the following
table

Table 8: Upper bound and lower bounds of corresponding parameter
DESIGN PARAMETER UPPER BOUND LOWER BOUND
L1 360 300
L2 540 460
L3 360 300
θ1 180 90
θ2 180 90
T 2 1.2
A 90 72
B 90 72
Lengths are in (mm) and angles in degrees.
6.2 MODEL ANALYSIS:
The following assumptions are taken to make the problem easy to solve.
6.2.1 ASSUMPTIONS: ● Designed simplified model instead of detailed model of chassis longitudinal member as
simplified model provides rapid estimate of crash behavior. [6] ● Assumed the car’s body as block of mass. ● Assumed mass of car as 1500 Kgs.
● The upper limit and lower limit of some parameters are taken intuitively. ● Assigned structural steel as the material for longitudinal member and the block of mass
which is acting as car body.
6.2.2 ANALYSIS METHOD AND BOUNDARY CONDITIONS:
Explicit dynamics analysis has been performed on the chassis longitudinal member by giving
initial velocity to the chassis longitudinal member and crashing into the wall. The reason to
choose explicit dynamics analysis in ANSYS is because in the absence of LS-DYNA if a crash
simulation has to be performed then explicit dynamics module will provide the best possible
results. Also a block a mass has been attached to the end of the member to replicate the more
realistic conditions. The mass of the block is taken as 750 Kgs which is half the mass of the car
as the explicit dynamics analysis is performed on single longitudinal member.
The boundary conditions that have been taken during explicit dynamics are as follows
The wall has been taken as fixed rigid body and the chassis longitudinal member along with the
mass of the block have been given an initial velocity.
Also the degree of freedom is fixed for the front end of longitudinal member such that only the
direction of crash (Z axis) is free.

Fig.27: Fixing the degrees of freedom of front end
The initial velocity is taken as 15 m/s.
6.3 OPTIMIZATION STUDY:
6.3.1 DESIGN OF EXPERIMENTS: LATIN- HYPERCUBE SAMPLING ALGORITHM:
Latin Hypercube sampling design algorithm is used for Design of experiments (DOE). The
reason to use this algorithm is because as there are more number of inputs the number of
simulation runs increases due to the increase in number of permutations and it is a proven
mechanism to reduce the number of simulation runs needed to complete the sensitivity analysis.
It was infeasible to run DOE analysis for 100 points due to time constraint so analysis was done
for 50 Design points.
Fig.28: DOE Results

6.3.2 SENSITIVITY ANALYSIS:
Fig.29: Sensitivity analysis of design parameters with output data
The above sensitivity analysis shows that angle between first and second sub member (θ1), angle
between second and third sub member (θ2), length of second sub member (L2) are very sensitive
to the energy absorption and whereas no design parameter is sensitive to total deformation.
6.3.3 OPTIMISATION METHOD:
The optimization method used for this subsystem is NLPQL (Nonlinear programming by
quadratic lagrangian). This algorithm is used because it has single output parameter objective i.e.
maximizing the energy absorption and one constraint on total deformation.
Fig.30: Candidate points that are obtained after running NLPQL for optimization
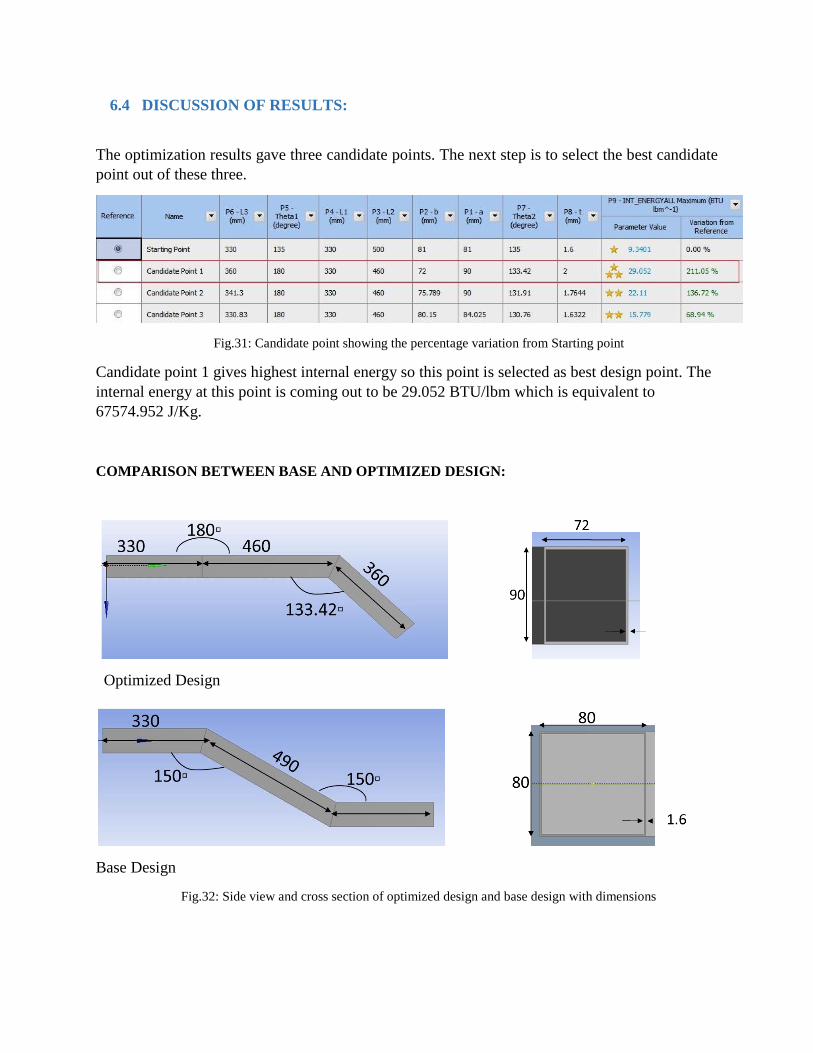
6.4 DISCUSSION OF RESULTS:
The optimization results gave three candidate points. The next step is to select the best candidate
point out of these three.
Fig.31: Candidate point showing the percentage variation from Starting point
Candidate point 1 gives highest internal energy so this point is selected as best design point. The
internal energy at this point is coming out to be 29.052 BTU/lbm which is equivalent to
67574.952 J/Kg.
COMPARISON BETWEEN BASE AND OPTIMIZED DESIGN:
Optimized Design
Base Design
Fig.32: Side view and cross section of optimized design and base design with dimensions
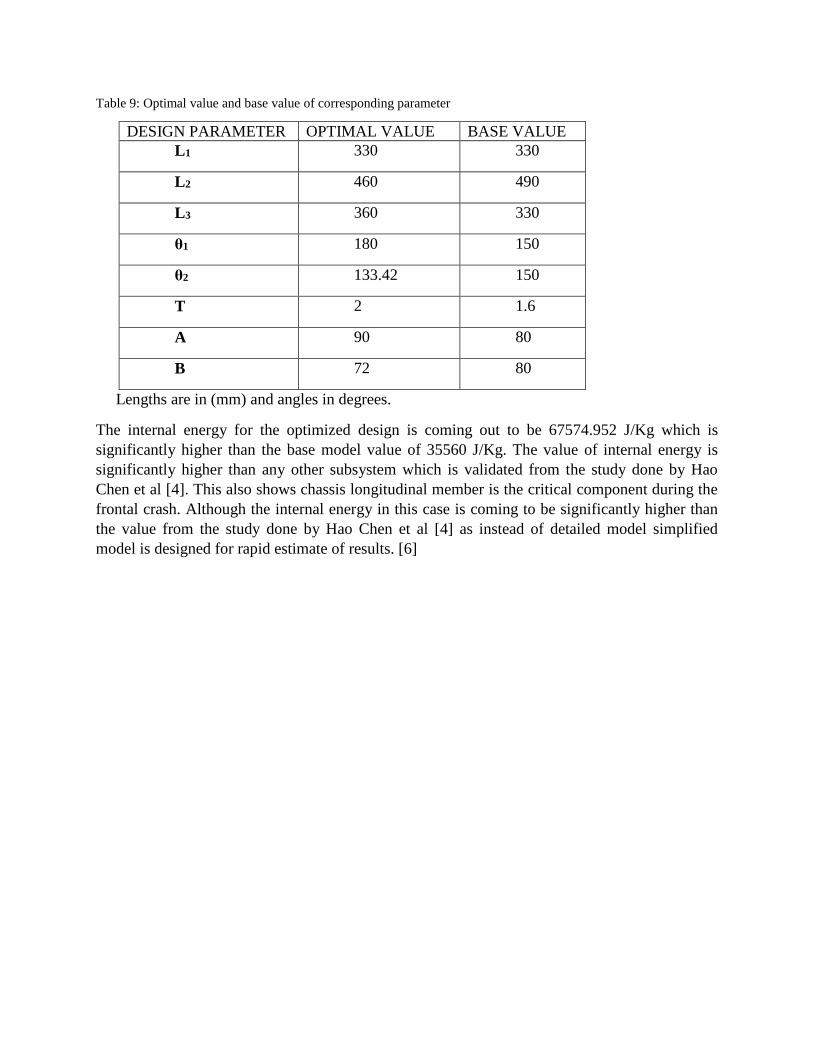
Table 9: Optimal value and base value of corresponding parameter
DESIGN PARAMETER OPTIMAL VALUE BASE VALUE
L1 330 330
L2 460 490
L3 360 330
θ1 180 150
θ2 133.42 150
T 2 1.6
A 90 80
B 72 80
Lengths are in (mm) and angles in degrees.
The internal energy for the optimized design is coming out to be 67574.952 J/Kg which is
significantly higher than the base model value of 35560 J/Kg. The value of internal energy is
significantly higher than any other subsystem which is validated from the study done by Hao
Chen et al [4]. This also shows chassis longitudinal member is the critical component during the
frontal crash. Although the internal energy in this case is coming to be significantly higher than
the value from the study done by Hao Chen et al [4] as instead of detailed model simplified
model is designed for rapid estimate of results. [6]

7. INTEGRATION STUDY:
Fig.33: Internal energy analysis of assembly in ANSYS Workbench
Fig.34: Von Mises stress analysis of assembly in ANSYS Workbench
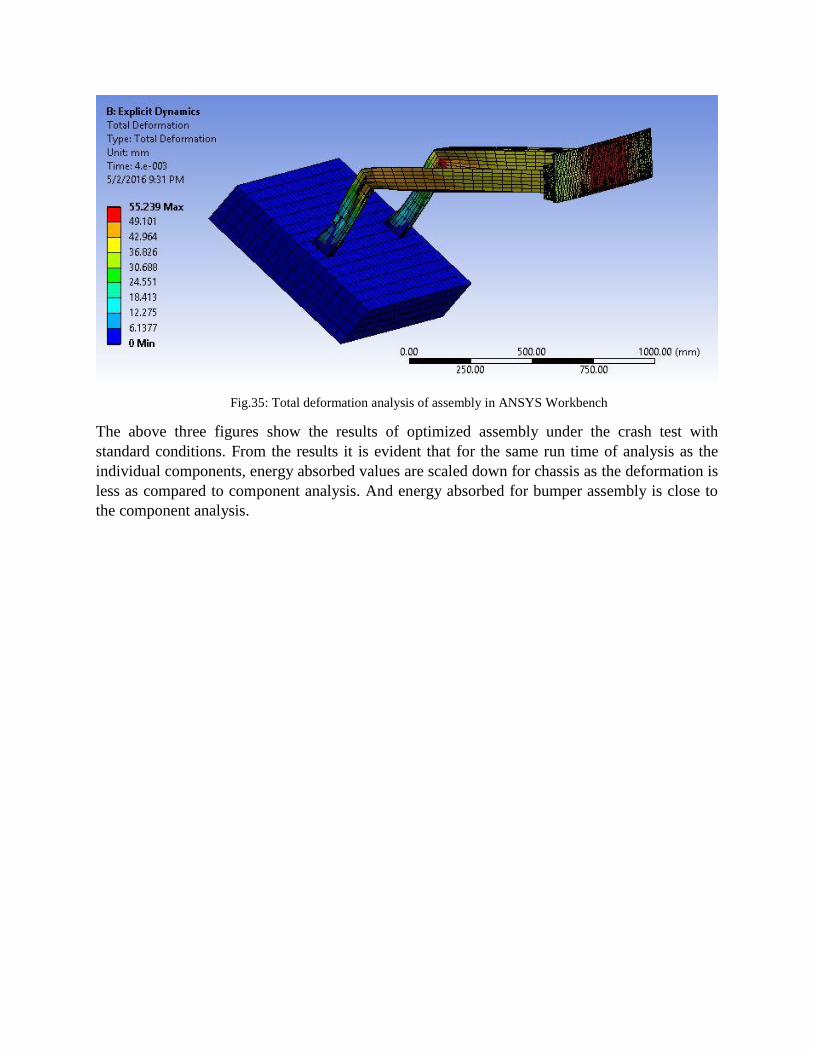
Fig.35: Total deformation analysis of assembly in ANSYS Workbench
The above three figures show the results of optimized assembly under the crash test with
standard conditions. From the results it is evident that for the same run time of analysis as the
individual components, energy absorbed values are scaled down for chassis as the deformation is
less as compared to component analysis. And energy absorbed for bumper assembly is close to
the component analysis.
Appendix 1
Iterative selection of boundary condition for Bumper beam
In order to effectively use the computation resource and reduce nodes in FEM calculation rigid
constraint were considered for bumper beam simulation. Following is the summary of iterations
conducted with results –
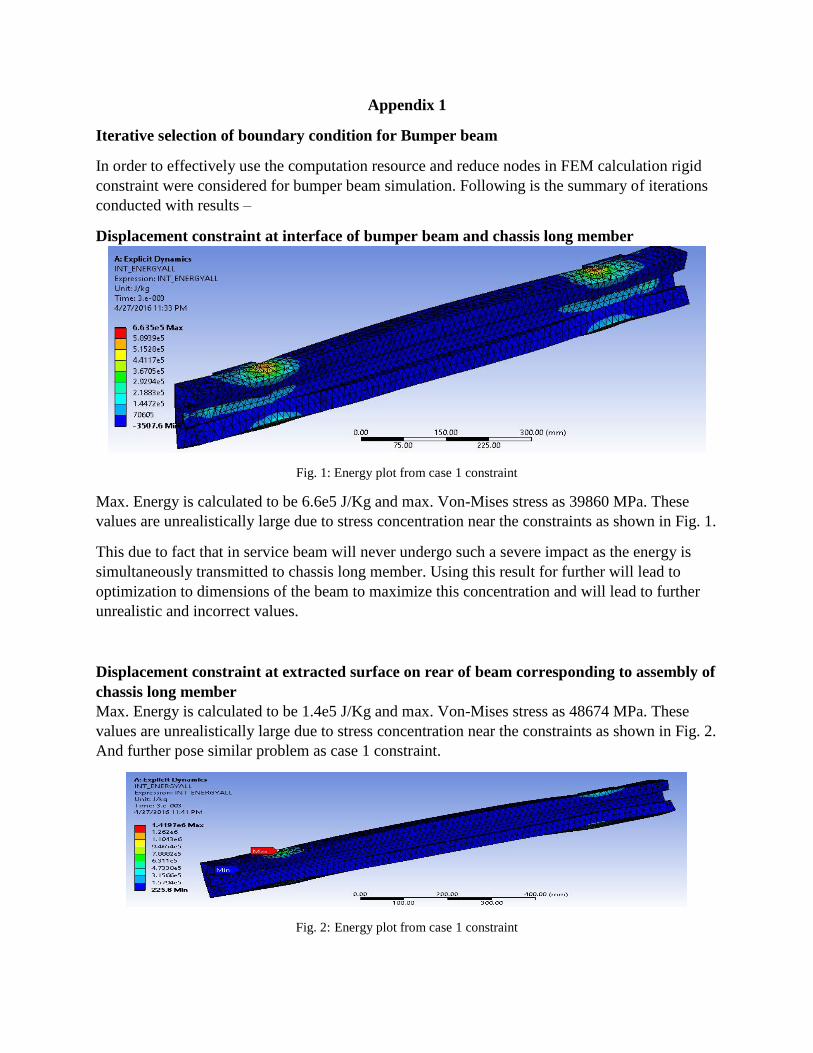
Displacement constraint at interface of bumper beam and chassis long member
Fig. 1: Energy plot from case 1 constraint
Max. Energy is calculated to be 6.6e5 J/Kg and max. Von-Mises stress as 39860 MPa. These
values are unrealistically large due to stress concentration near the constraints as shown in Fig. 1.
This due to fact that in service beam will never undergo such a severe impact as the energy is
simultaneously transmitted to chassis long member. Using this result for further will lead to
optimization to dimensions of the beam to maximize this concentration and will lead to further
unrealistic and incorrect values.
Displacement constraint at extracted surface on rear of beam corresponding to assembly of
chassis long member
Max. Energy is calculated to be 1.4e5 J/Kg and max. Von-Mises stress as 48674 MPa. These
values are unrealistically large due to stress concentration near the constraints as shown in Fig. 2.
And further pose similar problem as case 1 constraint.
Fig. 2: Energy plot from case 1 constraint

Displacement constraint at extracted surface (1mmX1mm square) on rear of beam at
connection with chassis long member
Max. Energy is calculated to be 7.61e5 J/Kg and max. Von-Mises stress as 629 MPa. Energy
value is unrealistically large due to stress concentration near the constraints. And further pose
similar problem as case 1 constraint.
Displacement constraint at edges (similar to bumper stiffener)
Max. Energy is calculated to be 1.6e5 J/Kg and max. Von-Mises stress as 700 MPa. Energy
value is unrealistically large due to stress concentration near the constraints. This case doesn’t
simulate crushing but only bending and further pose similar problem as case 1 constraint.

Reference
[1] NHTSA. “Federal Motor Vehicle Safety Standards: Occupant Protection in Interior Impact”.
49 C.F.R., Part 571.201.
[2] Ross, Hayes E., Sicking, D.L., Zimmer,R.A., and J.D. Michie. “Recommended Procedures
for the Safety Performance Evaluation of Highway Features”. NCHRP Gabauer 9 Report 350,
TRB, National Research Council, Washington, D.C., 1993.
[3] Douglas Gabauer, Robert Thomson “CORRELATION OF VEHICLE AND ROADSIDE
CRASH TEST INJURY CRITERIA” 05-0283
[4] Zhida Shen, Xin Qiao and Haishu Chen “BIW Safety Performance Research Based on
Vehicle Frontal Crash”
[5] Hao Chen*, Yali Yang and Liangjie Wang “Vehicle Front Structure Energy Absorbing
Optimization in Frontal Impact”
[6] Yucheng Liu “Development of simplified models for crashworthiness analysis.” University
of Louisville