Embed Size (px)
Citation preview
Institute of Transportation Studies ◦ University of California, Davis
1605 Tilia Street ◦ Davis, California 95616
PHONE (530) 752-6548 ◦ FAX (530) 752-6572
its.ucdavis.edu
Research Report – UCD-ITS-RR-17-45
An Overview of Costs for Vehicle Components, Fuels, Greenhouse Gas Emissions and Total
Cost of Ownership Update 2017
December 2017
Michael Fries Mathias Kerler Stephan Rohr
Stephan Schickram Michael Sinning
Markus Lienkamp
1
An Overview of Costs for Vehicle Components, Fuels,
Greenhouse Gas Emissions and Total Cost of Ownership
Update 2017
Update: Michael Friesa, Mathias Kerlera, Stephan Rohra, Stephan Schickrama,b, Michael Sinninga, Markus
Lienkampa,b
Robert Kochhan a,b,*, Stephan Fuchs a, Benjamin Reuter a, Peter Burda a, Stephan Matz a, Markus Lienkamp a,b
a Institute of Automotive Technology, Technische Universität München, Boltzmannstr. 15, 85748 Garching, Germany b TUM CREATE Limited, 1 CREATE Way, #10-02 CREATE Tower, Singapore 138602 * Corresponding author. Contact: [email protected]
Abstract
This paper gives an overview of prices for components of both conventional and electric vehicles, including
energy storage, drivetrain as well as interior and exterior vehicle body components. In particular, prices for
electric vehicle traction battery packs are analysed, which are estimated to drop remarkably until 2030. In
addition, fuel and electricity prices with projections until 2030 are given for important automotive markets.
Furthermore passenger cars and commercial vehicles are taken into account. The calculation assumptions for a
TCO calculation in the long haul sector are displayed in a showcase for a diesel semi-trailer tractor unit.
All costs are based on data found in various literature sources, including experts’ opinions. The purpose is to
provide a common data basis as a reference point of discussion which is subject to continuous adjustments and
improvement. The data itself can be used in order to perform calculations for passenger vehicles and to produce
comparable cost estimations.
1. Introduction
Cost data for vehicles and vehicle components is essential for various research activities in the field of
automotive technology. For example, in order to roughly calculate the manufacturing costs of an electric vehicle
– which is the basis for an estimation of the purchase price and Total Cost of Ownership (TCO) of a vehicle –
cost data in terms of costs for the car manufacturer (Original Equipment Manufacturer, OEM) has to be
available at least for the main components like the vehicle body, the powertrain and the energy storage system.
However, costs are usually part of the business secret of any company, so that cost data is not widely available.
Hence, the results presented in this paper are mainly based on data from scientific publications, reports, experts’
opinions and on own research results.
The conditions under which the given values are true are a major challenge. For example, costs of vehicle
components highly depend on costs of manpower in the manufacturing countries, on margins of the OEM and
its suppliers, on the production volume and on sales policies. Moreover, varying exchange and inflation rates
make cost values less transparent and comparable.
Considering these challenges, this paper focuses on giving general approximate values for costs of vehicle
components. In addition, results of estimations about costs for fuels and electricity are given for important car
markets. Finally, price ranges for greenhouse gas (GHG) emissions (CO2 costs) are given. The purpose is to
provide a basis for estimating the vehicle costs on a rough estimation level, without having to go into more
detail. This paper also provides a basis for comparing the costs of vehicles in the future. Projections are given
for the costs of major vehicle components and for fuel and electricity prices.
2
2. Overview and Background
Cost-Influencing Factors
Costs of vehicle components depend on a wide range of factors, which include for example the region where
components are manufactured, the volume of production or the markets the components are sold in. Mostly,
these factors are not clearly stated together with the cost values found in literature, which make a comparison
between cost values from different sources difficult. Table 1 contains a list of some important factors.
Table 1: Ranking of some factors affecting the comparability of cost values [FTM14a]
Influence of manufacturing costs Influence of retail prices
1 Material costs 1 Margins of the retailer and OEM
2 Energy costs 2 Regional / local taxes
3 Labour costs 3 Sales policies / managerial decisions
4 Production volume …
5 Margins of the suppliers
6 Shipping costs
7 Learning curves
8 Matureness of technology
9 Productivity / efficiency
…
Comparability of Cost Data
In addition to the above-mentioned cost-influencing factors, the cost values found in different sources are often
not directly comparable due to the assumptions made.
First, costs are found in different currencies in the literature, mostly in Euros (EUR) or US dollars (USD). As
exchange rates are not always stated within the sources, average 2009 to 2012 have been used to compare the
cost values (most sources are from this range of dates). All values have been converted into EUR (Table 2). We
assume purchase power parity and Europe as reference region.
Table 2: Approximate exchange rate used for sources since 1/1/2015 [OAN15]
1 EUR USD 1 EUR GBP 1 EUR SGD 1 EUR CNY
1.11 0.73 1.53 6.93
Average annual midpoint rates 2015. (sources are mainly from this range of dates)
EUR: Euro, USD: US Dollar, GBP: British Pound, SGD: Singapore Dollar, CNY: Chinese Yuan Renminbi
Second, the devaluation of money over time (inflation) has to be taken into account. For example, cost values
stated for 2010 cannot be directly compared to cost values stated for 2030, as nominal prices in 2030 may have
changed in comparison to 2010, depending on the inflation in the respective region or country. As only some
sources [e.g. CON12] indicate the time reference of the prices, it is assumed that the prices indicated in a source
are at the price level of the time of publication of this source (real prices).
Third, some sources do not indicate their cost estimations as costs for the OEM who does the final assembly of a
car. However, considering the type of sources, it can be assumed that the prices found for battery packs, vehicle
components and materials are OEM purchase prices, whereas the prices for fuel and electricity are retail prices
for the final consumer.
3
Structure of Sources
Considering the variety of cost information existing for vehicle components etc., the sources can be structured
into three categories. The categories roughly represent different scientific levels, ranging from reports and
scientific publications to press releases and expert’s opinions (Table 3).
Table 3: Classification of sources
Category 1 2 3
Description report / book / scientific
publication press release expert’s opinion
Scientific level very high low medium
Reliability medium low high
Most sources for this paper are reports or scientific publications. They generally give an overall cost estimation,
which often includes the costs at a point of time and one or more cost projections (scenarios). They can be
regarded as a good option to get an overall idea of component costs. Press releases and expert’s opinions have to
be considered as less scientific as they may have a particular mind-set (press release) or only reflect a single
person’s point of view (expert’s opinion). These types of sources were mainly used to get a first idea about the
price levels, or when reference values from scientific publications were not available.
Definitions
In order to provide consistent cost estimations, the results presented in this paper are purchase costs for the
OEM, which are equal to supplier retail prices. Approximate values for distribution costs, margins etc. are given
in order to derive consumers’ prices from the costs for the OEM. The only exception are the energy costs for
fossil fuels, hydrogen and electricity which are retail prices and include all taxes in the respective countries.
Moreover, as costs change over time, the cost values are given as estimations for “today” and for selected future
points of time until 2030. “Today” is defined to be year 2017. The cost values have to be considered as
estimations for large volume production, except for some new technologies today, which include battery pack
and battery pack component costs, electric drivetrain component cost, fuel cell, hydrogen tank and CFRP costs.
Finally, prices are considered as real (inflation-adjusted) prices on today’s price level. In order to convert the
different currencies of the sources into Euros, we used the exchange rates according to [OAN13] (Table 2).
3. Vehicle Costs
In this chapter, cost estimations are given for the most important components of passenger cars of different
powertrains. This includes costs for vehicle body materials and components, conventional and electric
powertrain components as well as fuel and energy storage components. In addition, typical values for manpower
costs and margins are given. Table 4 contains a structured list of these components. The estimated cost values
are summarised in Tables A1 to A4 in the appendix.
4
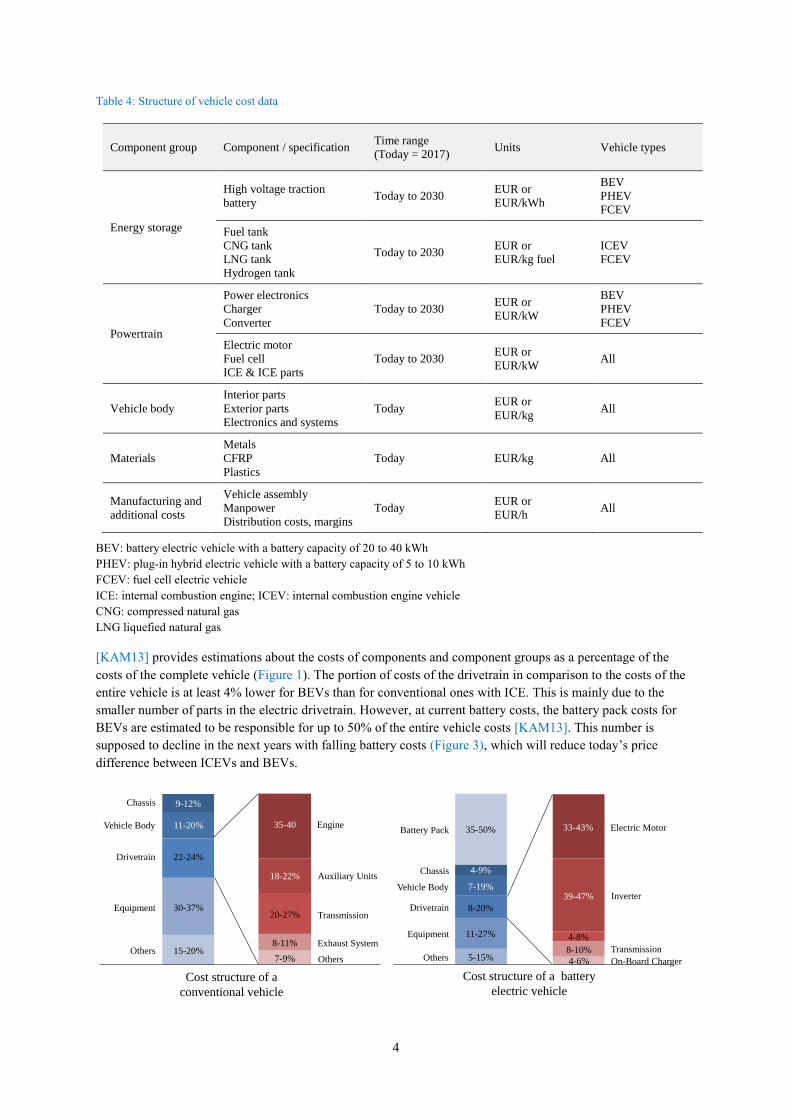
Table 4: Structure of vehicle cost data
Component group Component / specification Time range
(Today = 2017) Units Vehicle types
Energy storage
High voltage traction
battery Today to 2030
EUR or
EUR/kWh
BEV
PHEV
FCEV
Fuel tank
CNG tank
LNG tank
Hydrogen tank
Today to 2030 EUR or
EUR/kg fuel
ICEV
FCEV
Powertrain
Power electronics
Charger
Converter
Today to 2030 EUR or
EUR/kW
BEV
PHEV
FCEV
Electric motor
Fuel cell
ICE & ICE parts
Today to 2030 EUR or
EUR/kW All
Vehicle body
Interior parts
Exterior parts
Electronics and systems
Today EUR or
EUR/kg All
Materials
Metals
CFRP
Plastics
Today EUR/kg All
Manufacturing and
additional costs
Vehicle assembly
Manpower
Distribution costs, margins
Today EUR or
EUR/h All
BEV: battery electric vehicle with a battery capacity of 20 to 40 kWh
PHEV: plug-in hybrid electric vehicle with a battery capacity of 5 to 10 kWh
FCEV: fuel cell electric vehicle
ICE: internal combustion engine; ICEV: internal combustion engine vehicle
CNG: compressed natural gas
LNG liquefied natural gas
[KAM13] provides estimations about the costs of components and component groups as a percentage of the
costs of the complete vehicle (Figure 1). The portion of costs of the drivetrain in comparison to the costs of the
entire vehicle is at least 4% lower for BEVs than for conventional ones with ICE. This is mainly due to the
smaller number of parts in the electric drivetrain. However, at current battery costs, the battery pack costs for
BEVs are estimated to be responsible for up to 50% of the entire vehicle costs [KAM13]. This number is
supposed to decline in the next years with falling battery costs (Figure 3), which will reduce today’s price
difference between ICEVs and BEVs.
Chassis
Vehicle Body
Drivetrain
Equipment
Others
Engine
Auxiliary Units
Exhaust System
Transmission
Others
Chassis
Vehicle Body
Drivetrain
Equipment
Others
Electric Motor
Inverter
Transmission
On-Board Charger
Battery Pack
Cost structure of a
conventional vehicle
Cost structure of a battery
electric vehicle
9-12%
15-20%
30-37%
22-24%
11-20%
4-6%
20-27%
18-22%
35-4035-50%
7-9%
8-11%11-27%
8-20%
7-19%
4-9%
33-43%
5-15%8-10%
4-8%
39-47%
5
Figure 1: Cost structure of an ICEV and a BEV [KAM13]
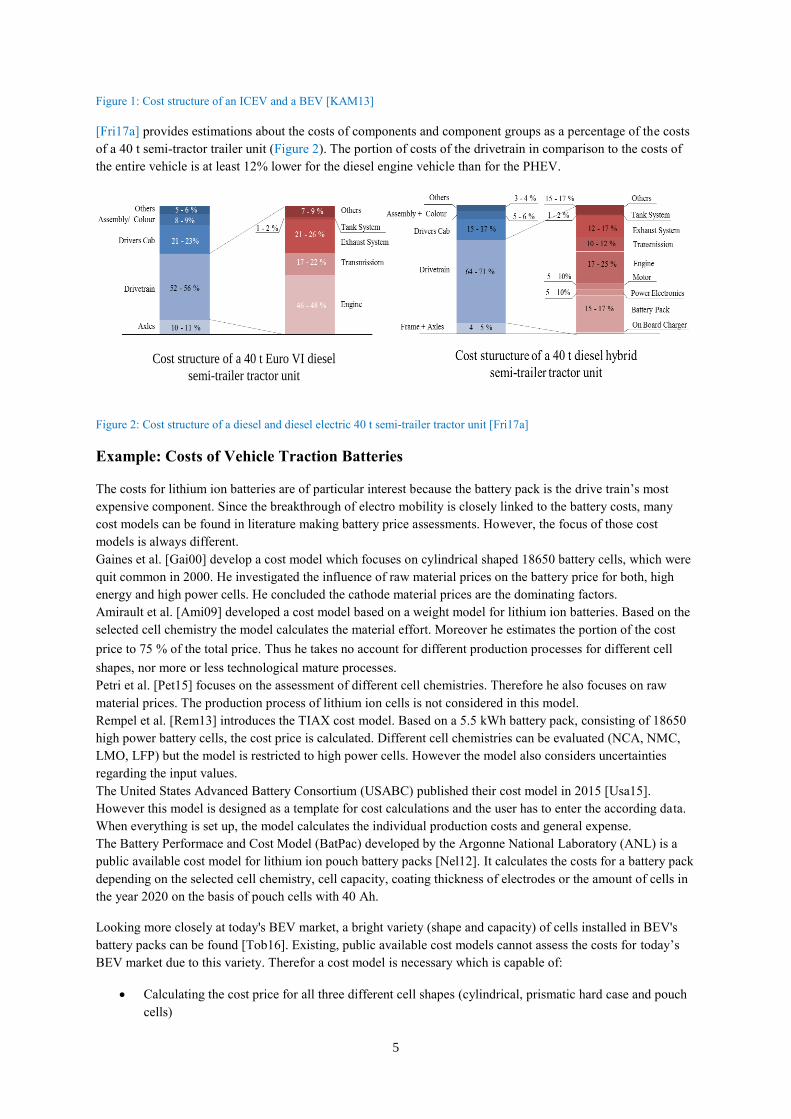
[Fri17a] provides estimations about the costs of components and component groups as a percentage of the costs
of a 40 t semi-tractor trailer unit (Figure 2). The portion of costs of the drivetrain in comparison to the costs of
the entire vehicle is at least 12% lower for the diesel engine vehicle than for the PHEV.
Figure 2: Cost structure of a diesel and diesel electric 40 t semi-trailer tractor unit [Fri17a]
Example: Costs of Vehicle Traction Batteries
The costs for lithium ion batteries are of particular interest because the battery pack is the drive train’s most
expensive component. Since the breakthrough of electro mobility is closely linked to the battery costs, many
cost models can be found in literature making battery price assessments. However, the focus of those cost
models is always different.
Gaines et al. [Gai00] develop a cost model which focuses on cylindrical shaped 18650 battery cells, which were
quit common in 2000. He investigated the influence of raw material prices on the battery price for both, high
energy and high power cells. He concluded the cathode material prices are the dominating factors.
Amirault et al. [Ami09] developed a cost model based on a weight model for lithium ion batteries. Based on the
selected cell chemistry the model calculates the material effort. Moreover he estimates the portion of the cost
price to 75 % of the total price. Thus he takes no account for different production processes for different cell
shapes, nor more or less technological mature processes.
Petri et al. [Pet15] focuses on the assessment of different cell chemistries. Therefore he also focuses on raw
material prices. The production process of lithium ion cells is not considered in this model.
Rempel et al. [Rem13] introduces the TIAX cost model. Based on a 5.5 kWh battery pack, consisting of 18650
high power battery cells, the cost price is calculated. Different cell chemistries can be evaluated (NCA, NMC,
LMO, LFP) but the model is restricted to high power cells. However the model also considers uncertainties
regarding the input values.
The United States Advanced Battery Consortium (USABC) published their cost model in 2015 [Usa15].
However this model is designed as a template for cost calculations and the user has to enter the according data.
When everything is set up, the model calculates the individual production costs and general expense.
The Battery Performace and Cost Model (BatPac) developed by the Argonne National Laboratory (ANL) is a
public available cost model for lithium ion pouch battery packs [Nel12]. It calculates the costs for a battery pack
depending on the selected cell chemistry, cell capacity, coating thickness of electrodes or the amount of cells in
the year 2020 on the basis of pouch cells with 40 Ah.
Looking more closely at today's BEV market, a bright variety (shape and capacity) of cells installed in BEV's
battery packs can be found [Tob16]. Existing, public available cost models cannot assess the costs for today’s
BEV market due to this variety. Therefor a cost model is necessary which is capable of:
Calculating the cost price for all three different cell shapes (cylindrical, prismatic hard case and pouch
cells)
Cost structure of a 40 t Euro VI diesel
semi-trailer tractor unit
6
Consideration of different production processes depending on the cell shape
Consideration of the maturity level of production processes
Consideration of the error rate of a production process depending on the maturity level
Consideration of common cell chemistries, and future technological improvement of materials
Cost prognosis prediction for future prices
Based on the cost model BatPac we modified the model to fulfill the above mentioned requirements.
Parametric capacity cell models were added to the model to calculate the cell properties depending on
the cell shape and geometry. The models are based on [Ker15].
The production process for cylindrical and prismatic cells were analyzed and added to the model.
Based on Heimes, Korthauer, Kampker and Tagawa [Hei14, Kam14, Kor13, Tag09] necessary data
was generated and correlated to data from Batpac.
The maturity level of the production processes were taken from Heimes [Hei14] and were correlated to
existing data from BatPac
Error rates from BatPac’s pouch cell were correlated with the technological maturity level of the
production processes
Few additional cell chemistries were added to the model with all necessary data
Raw material cost model were added, which predicts raw material prices until 2030
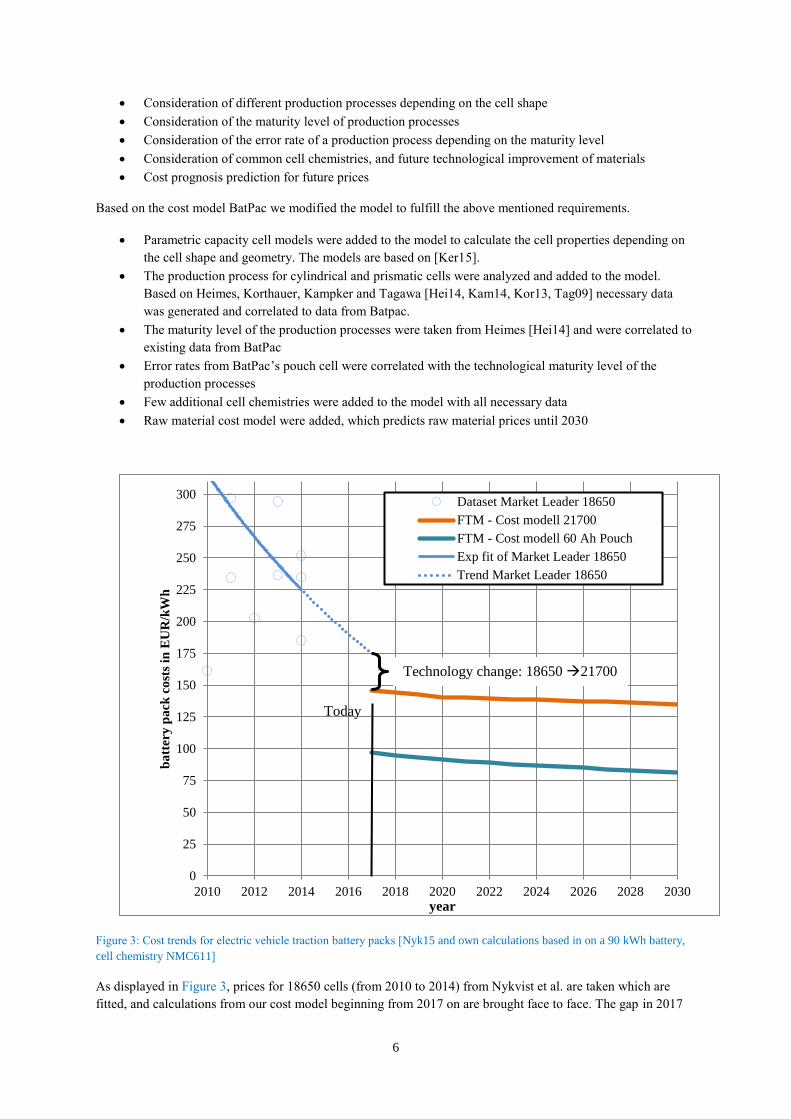
Figure 3: Cost trends for electric vehicle traction battery packs [Nyk15 and own calculations based in on a 90 kWh battery,
cell chemistry NMC611]
As displayed in Figure 3, prices for 18650 cells (from 2010 to 2014) from Nykvist et al. are taken which are
fitted, and calculations from our cost model beginning from 2017 on are brought face to face. The gap in 2017
0
25
50
75
100
125
150
175
200
225
250
275
300
2010 2012 2014 2016 2018 2020 2022 2024 2026 2028 2030
ba
tter
y p
ack
co
sts
in E
UR
/kW
h
year
Dataset Market Leader 18650
FTM - Cost modell 21700
FTM - Cost modell 60 Ah Pouch
Exp fit of Market Leader 18650
Trend Market Leader 18650
Technology change: 18650 21700
Today
7
between the Trend Market Leader 18650 and the 21700 price prognosis is due to the technology change from
the 18650 cylindrical cell to 21700, with the delivery of first Tesla Model 3 BEVs. Cost calculations are based
on a 90 kWh battery pack. Estimated production volume in 2015 is 30.000 battery packs with an annual growth
rate of 10%.
Own cost calculations consider raw material cost (constant price scenario with raw material prices from 2016),
purchase items costs and direct labor costs for electrode processing, cell assembly and for formation, cycling,
testing and sealing. Despite being calculated by the cost model, costs for capital equipment, buildings, land and
utilities, Sales, General and Administration (SG&A), Research and Development (R&D), as well as taxes and
warranty costs are disregarded. Reasons are uncertainties due to privileges granted by the countries of
production, regarding taxes, subsidies etc.
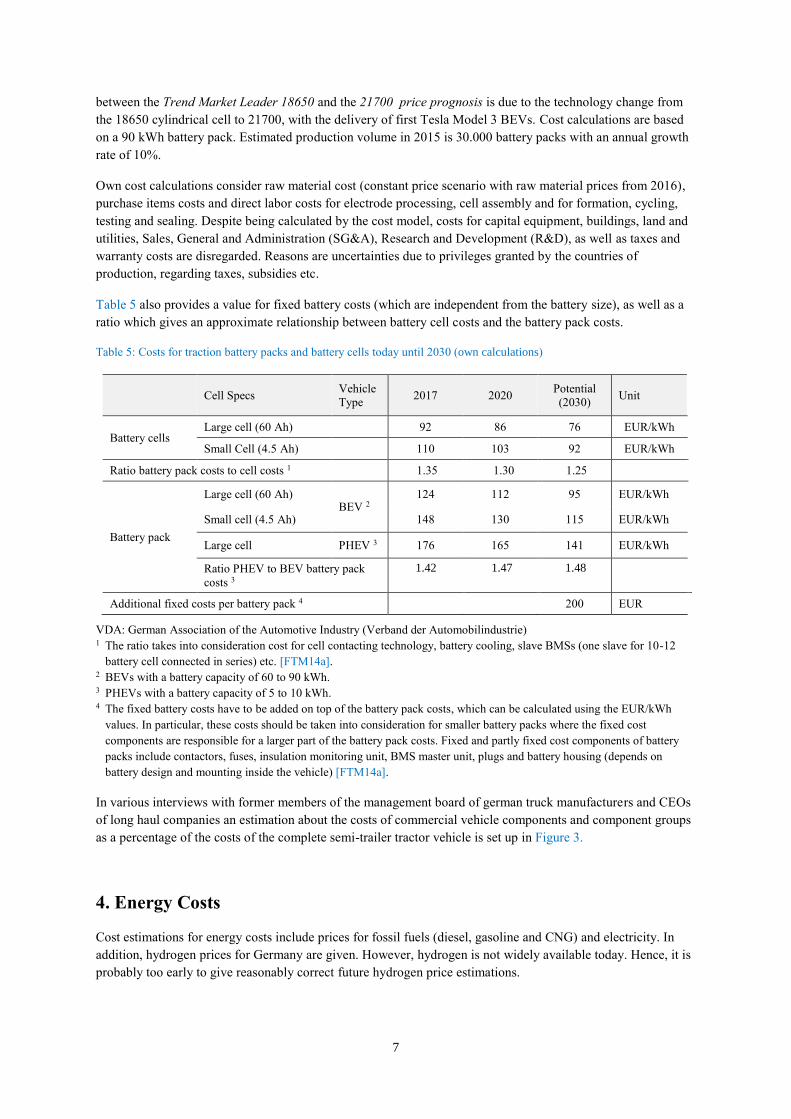
Table 5 also provides a value for fixed battery costs (which are independent from the battery size), as well as a
ratio which gives an approximate relationship between battery cell costs and the battery pack costs.
Table 5: Costs for traction battery packs and battery cells today until 2030 (own calculations)
Cell Specs Vehicle
Type 2017 2020
Potential
(2030) Unit
Battery cells Large cell (60 Ah) 92 86 76 EUR/kWh
Small Cell (4.5 Ah) 110 103 92 EUR/kWh
Ratio battery pack costs to cell costs 1 1.35 1.30 1.25
Battery pack
Large cell (60 Ah) BEV 2
124 112 95 EUR/kWh
Small cell (4.5 Ah) 148 130 115 EUR/kWh
Large cell PHEV 3 176 165 141 EUR/kWh
Ratio PHEV to BEV battery pack
costs 3
1.42 1.47 1.48
Additional fixed costs per battery pack 4 200 EUR
VDA: German Association of the Automotive Industry (Verband der Automobilindustrie) 1 The ratio takes into consideration cost for cell contacting technology, battery cooling, slave BMSs (one slave for 10-12
battery cell connected in series) etc. [FTM14a]. 2 BEVs with a battery capacity of 60 to 90 kWh. 3 PHEVs with a battery capacity of 5 to 10 kWh. 4 The fixed battery costs have to be added on top of the battery pack costs, which can be calculated using the EUR/kWh
values. In particular, these costs should be taken into consideration for smaller battery packs where the fixed cost
components are responsible for a larger part of the battery pack costs. Fixed and partly fixed cost components of battery
packs include contactors, fuses, insulation monitoring unit, BMS master unit, plugs and battery housing (depends on
battery design and mounting inside the vehicle) [FTM14a].
In various interviews with former members of the management board of german truck manufacturers and CEOs
of long haul companies an estimation about the costs of commercial vehicle components and component groups
as a percentage of the costs of the complete semi-trailer tractor vehicle is set up in Figure 3.
4. Energy Costs
Cost estimations for energy costs include prices for fossil fuels (diesel, gasoline and CNG) and electricity. In
addition, hydrogen prices for Germany are given. However, hydrogen is not widely available today. Hence, it is
probably too early to give reasonably correct future hydrogen price estimations.
8
All energy prices are retail prices (electricity: household tariffs), including the taxes in the respective regions.
Price projections for diesel, gasoline and CNG are based on oil and CNG price projections respectively
according to [CON12]. For the electricity price projections, the country-specific energy mixes were taken into
consideration by using plausible values for the future electricity price developments based on different sources.
It is worth noting that the electricity price data in different sources allows to make a range of plausible future
price projections (depending on the scenarios, assumptions or time range), which makes it difficult to provide
general estimation values. Political and regulatory decisions have a strong influence on the electricity tariffs.
Hence, more detailed projections which, for example, analyse different scenarios should be used for more in-
depth analyses.
The energy prices are summarised in Table A5 in the appendix.
5. Costs for Greenhouse Gas Emissions
Various regional systems exist in which allowances for GHG emissions can be traded between the participants
such as electricity producers or industries [ECC13c]. The biggest of these is the European Union Emission
Trading Scheme (EU ETS), which consists of several phases. The first phase started operation in 2005 and
served as a learning period for phase two (from 2008 to 2012) which coincided with the start of the commitment
period of the Kyoto Protocol. The penalty for non-compliance rose from 40 EUR/t CO2 in the first phase to 100
EUR/t CO2 in the second phase [ECC13a]. In 2013, the third phase of the emission trading scheme has started
taking into consideration further GHGs and industrial sectors [ECC13b].
As the amount of allowances often exceeded the demand in the past, the price for GHG emissions rather
declined than increased as one might have expected. For example, the International Energy Agency (IEA)
predicted prices of 18 to 20 EUR/ton CO2 for today, and 30 to 70 EUR/ton CO2 in 2030 for different policy
scenarios and regions [IEA10]. In contrast, prices for CO2 emission allowances at the European Energy
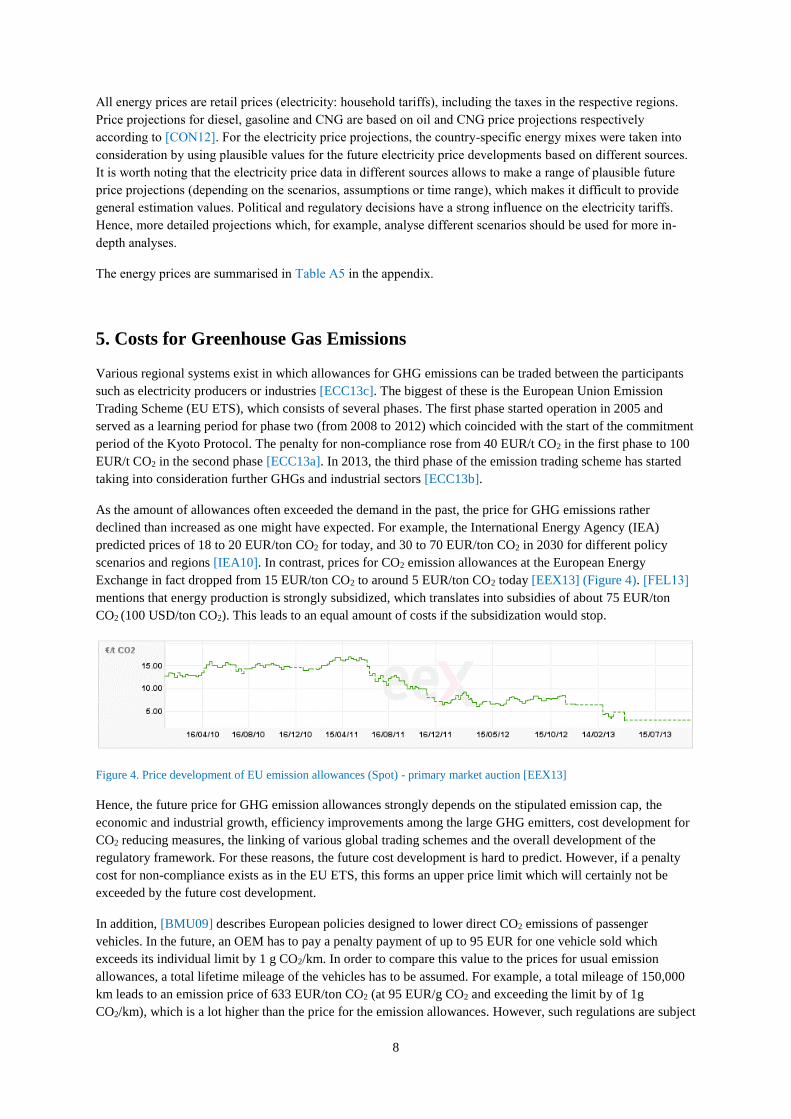
Exchange in fact dropped from 15 EUR/ton CO2 to around 5 EUR/ton CO2 today [EEX13] (Figure 4). [FEL13]
mentions that energy production is strongly subsidized, which translates into subsidies of about 75 EUR/ton
CO2 (100 USD/ton CO2). This leads to an equal amount of costs if the subsidization would stop.
Figure 4. Price development of EU emission allowances (Spot) - primary market auction [EEX13]
Hence, the future price for GHG emission allowances strongly depends on the stipulated emission cap, the
economic and industrial growth, efficiency improvements among the large GHG emitters, cost development for
CO2 reducing measures, the linking of various global trading schemes and the overall development of the
regulatory framework. For these reasons, the future cost development is hard to predict. However, if a penalty
cost for non-compliance exists as in the EU ETS, this forms an upper price limit which will certainly not be
exceeded by the future cost development.
In addition, [BMU09] describes European policies designed to lower direct CO2 emissions of passenger
vehicles. In the future, an OEM has to pay a penalty payment of up to 95 EUR for one vehicle sold which
exceeds its individual limit by 1 g CO2/km. In order to compare this value to the prices for usual emission
allowances, a total lifetime mileage of the vehicles has to be assumed. For example, a total mileage of 150,000
km leads to an emission price of 633 EUR/ton CO2 (at 95 EUR/g CO2 and exceeding the limit by of 1g
CO2/km), which is a lot higher than the price for the emission allowances. However, such regulations are subject
9
to frequent changes. The start of this regulation, which was initially scheduled for 2020, has recently been
postponed to 2024 [SPI13].
In summary, we do not give a specific estimation for GHG emissions in this paper. GHG emission costs should
be taken into consideration by analyzing scenarios with different cost assumptions, which are in the range of the
values mentioned above. However, the assumption is that the cost per ton CO2 for fossil fuels in the transport
sector will be higher than 100 EUR/ton CO2 at long term.
6. TCO Calculation in the commercial vehicle operation
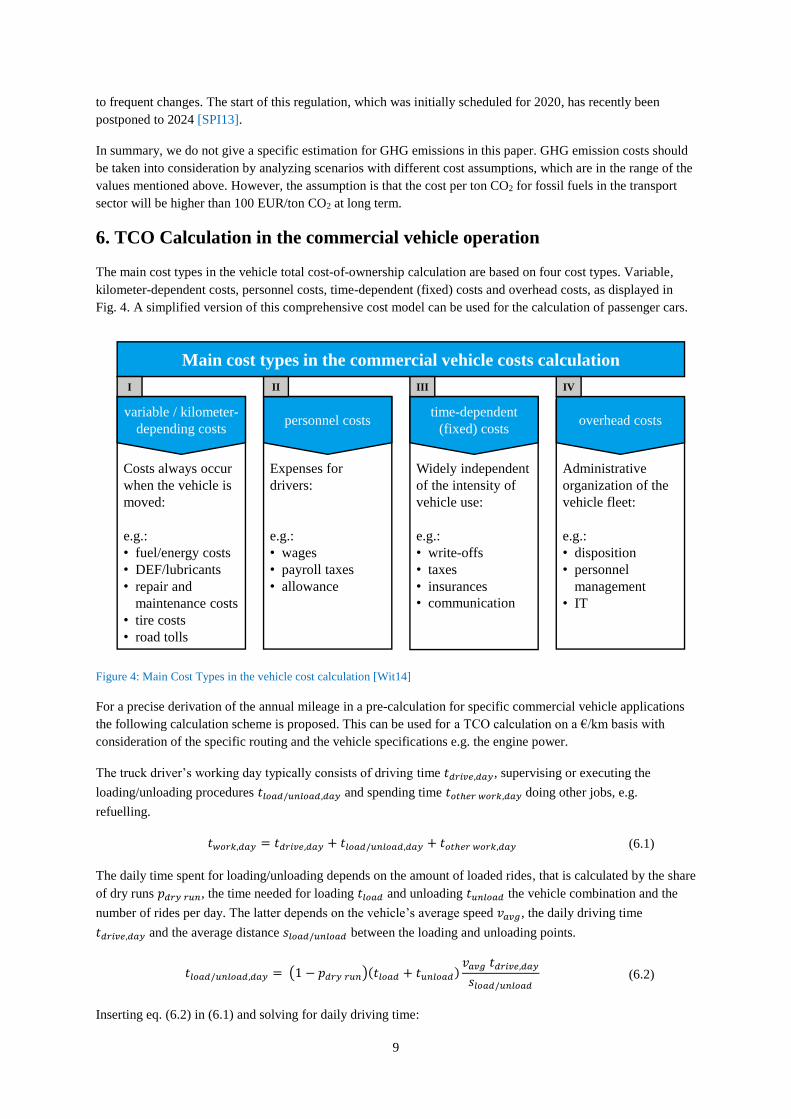
The main cost types in the vehicle total cost-of-ownership calculation are based on four cost types. Variable,
kilometer-dependent costs, personnel costs, time-dependent (fixed) costs and overhead costs, as displayed in
Fig. 4. A simplified version of this comprehensive cost model can be used for the calculation of passenger cars.
Figure 4: Main Cost Types in the vehicle cost calculation [Wit14]
For a precise derivation of the annual mileage in a pre-calculation for specific commercial vehicle applications
the following calculation scheme is proposed. This can be used for a TCO calculation on a €/km basis with
consideration of the specific routing and the vehicle specifications e.g. the engine power.
The truck driver’s working day typically consists of driving time 𝑡𝑑𝑟𝑖𝑣𝑒,𝑑𝑎𝑦, supervising or executing the
loading/unloading procedures 𝑡𝑙𝑜𝑎𝑑/𝑢𝑛𝑙𝑜𝑎𝑑,𝑑𝑎𝑦 and spending time 𝑡𝑜𝑡ℎ𝑒𝑟 𝑤𝑜𝑟𝑘,𝑑𝑎𝑦 doing other jobs, e.g.
refuelling.
𝑡𝑤𝑜𝑟𝑘,𝑑𝑎𝑦 = 𝑡𝑑𝑟𝑖𝑣𝑒,𝑑𝑎𝑦 + 𝑡𝑙𝑜𝑎𝑑/𝑢𝑛𝑙𝑜𝑎𝑑,𝑑𝑎𝑦 + 𝑡𝑜𝑡ℎ𝑒𝑟 𝑤𝑜𝑟𝑘,𝑑𝑎𝑦 (6.1)
The daily time spent for loading/unloading depends on the amount of loaded rides, that is calculated by the share
of dry runs 𝑝𝑑𝑟𝑦 𝑟𝑢𝑛, the time needed for loading 𝑡𝑙𝑜𝑎𝑑 and unloading 𝑡𝑢𝑛𝑙𝑜𝑎𝑑 the vehicle combination and the
number of rides per day. The latter depends on the vehicle’s average speed 𝑣𝑎𝑣𝑔, the daily driving time
𝑡𝑑𝑟𝑖𝑣𝑒,𝑑𝑎𝑦 and the average distance 𝑠𝑙𝑜𝑎𝑑/𝑢𝑛𝑙𝑜𝑎𝑑 between the loading and unloading points.
𝑡𝑙𝑜𝑎𝑑/𝑢𝑛𝑙𝑜𝑎𝑑,𝑑𝑎𝑦 = (1 − 𝑝𝑑𝑟𝑦 𝑟𝑢𝑛)(𝑡𝑙𝑜𝑎𝑑 + 𝑡𝑢𝑛𝑙𝑜𝑎𝑑)𝑣𝑎𝑣𝑔 𝑡𝑑𝑟𝑖𝑣𝑒,𝑑𝑎𝑦
𝑠𝑙𝑜𝑎𝑑/𝑢𝑛𝑙𝑜𝑎𝑑
(6.2)
Inserting eq. (6.2) in (6.1) and solving for daily driving time:
variable / kilometer-
depending costspersonnel costs
time-dependent
(fixed) costsoverhead costs
Main cost types in the commercial vehicle costs calculation
Costs always occur
when the vehicle is
moved:
e.g.:
• fuel/energy costs
• DEF/lubricants
• repair and
maintenance costs
• tire costs
• road tolls
Expenses for
drivers:
e.g.:
• wages
• payroll taxes
• allowance
Widely independent
of the intensity of
vehicle use:
e.g.:
• write-offs
• taxes
• insurances
• communication
Administrative
organization of the
vehicle fleet:
e.g.:
• disposition
• personnel
management
• IT
III IVI II
10
𝑡𝑑𝑟𝑖𝑣𝑒,𝑑𝑎𝑦 = 𝑡𝑤𝑜𝑟𝑘,𝑑𝑎𝑦 − 𝑡𝑜𝑡ℎ𝑒𝑟 𝑤𝑜𝑟𝑘,𝑑𝑎𝑦
1 + (1 − 𝑝𝑑𝑟𝑦 𝑟𝑢𝑛)(𝑡𝑙𝑜𝑎𝑑 + 𝑡𝑢𝑛𝑙𝑜𝑎𝑑)𝑣𝑎𝑣𝑔
𝑠𝑙𝑜𝑎𝑑/𝑢𝑛𝑙𝑜𝑎𝑑
(6.3)
The annual mileage 𝑠𝑦𝑒𝑎𝑟 calculates from the average speed, the daily driving time and the number of workdays
𝑑𝑤𝑜𝑟𝑘 per year.
𝑠𝑦𝑒𝑎𝑟 = 𝑣𝑎𝑣𝑔 𝑡𝑑𝑟𝑖𝑣𝑒,𝑑𝑎𝑦 𝑑𝑤𝑜𝑟𝑘 (6.4)
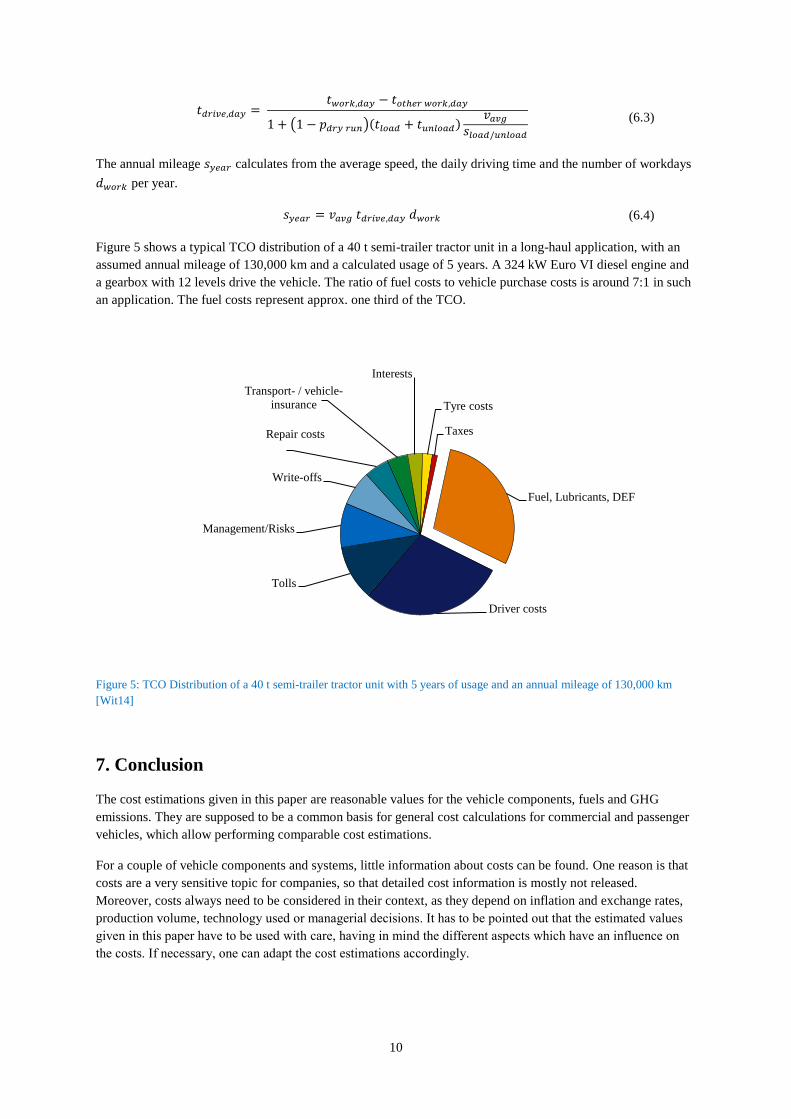
Figure 5 shows a typical TCO distribution of a 40 t semi-trailer tractor unit in a long-haul application, with an
assumed annual mileage of 130,000 km and a calculated usage of 5 years. A 324 kW Euro VI diesel engine and
a gearbox with 12 levels drive the vehicle. The ratio of fuel costs to vehicle purchase costs is around 7:1 in such
an application. The fuel costs represent approx. one third of the TCO.
Figure 5: TCO Distribution of a 40 t semi-trailer tractor unit with 5 years of usage and an annual mileage of 130,000 km
[Wit14]
7. Conclusion
The cost estimations given in this paper are reasonable values for the vehicle components, fuels and GHG
emissions. They are supposed to be a common basis for general cost calculations for commercial and passenger
vehicles, which allow performing comparable cost estimations.
For a couple of vehicle components and systems, little information about costs can be found. One reason is that
costs are a very sensitive topic for companies, so that detailed cost information is mostly not released.
Moreover, costs always need to be considered in their context, as they depend on inflation and exchange rates,
production volume, technology used or managerial decisions. It has to be pointed out that the estimated values
given in this paper have to be used with care, having in mind the different aspects which have an influence on
the costs. If necessary, one can adapt the cost estimations accordingly.
Fuel, Lubricants, DEF
Driver costs
Tolls
Management/Risks
Write-offs
Repair costs
Transport- / vehicle-
insurance
Interests
Tyre costs
Taxes

11
Acknowledgement
The work presented was financially supported by the Technische Universität München (free research funds from the state of
Bavaria, Germany).
12
Appendix
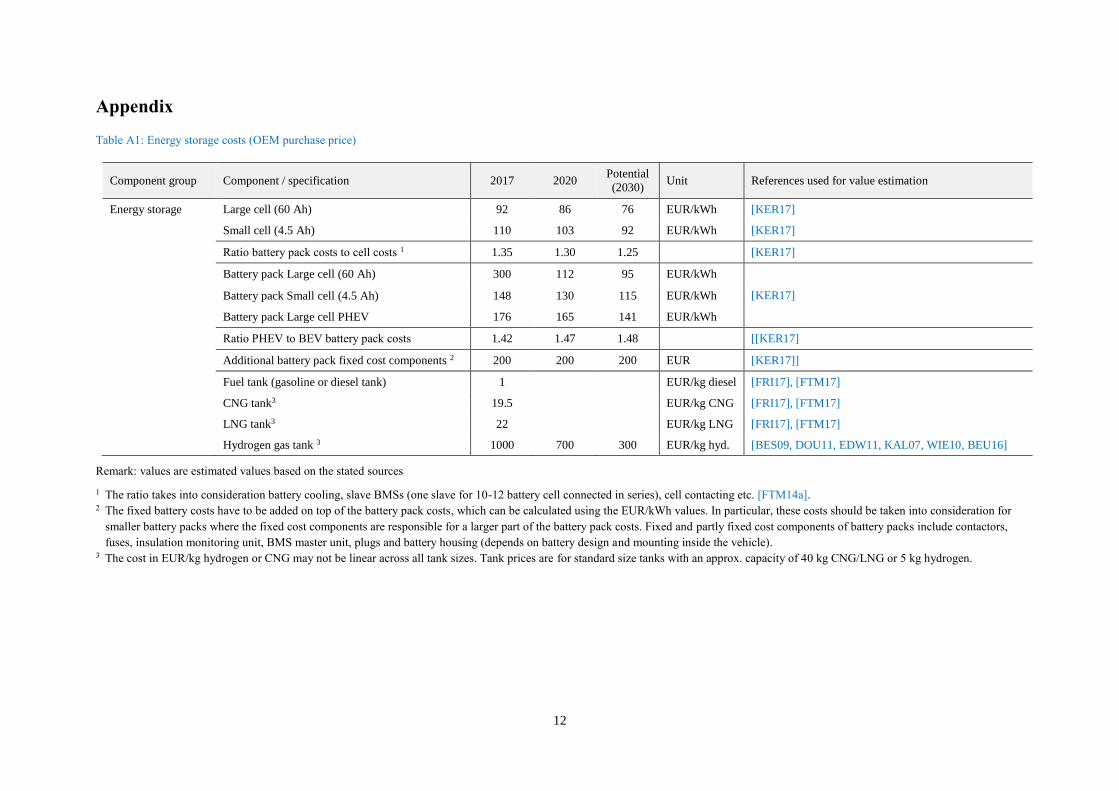
Table A1: Energy storage costs (OEM purchase price)
Component group Component / specification 2017 2020 Potential
(2030) Unit References used for value estimation
Energy storage Large cell (60 Ah) 92 86 76 EUR/kWh [KER17]
Small cell (4.5 Ah) 110 103 92 EUR/kWh [KER17]
Ratio battery pack costs to cell costs 1 1.35 1.30 1.25 [KER17]
Battery pack Large cell (60 Ah) 300 112 95 EUR/kWh
[KER17] Battery pack Small cell (4.5 Ah) 148 130 115 EUR/kWh
Battery pack Large cell PHEV 176 165 141 EUR/kWh
Ratio PHEV to BEV battery pack costs 1.42 1.47 1.48 [[KER17]
Additional battery pack fixed cost components 2 200 200 200 EUR [KER17]]
Fuel tank (gasoline or diesel tank) 1 EUR/kg diesel [FRI17], [FTM17]
CNG tank3 19.5 EUR/kg CNG [FRI17], [FTM17]
LNG tank3 22 EUR/kg LNG [FRI17], [FTM17]
Hydrogen gas tank 3 1000 700 300 EUR/kg hyd. [BES09, DOU11, EDW11, KAL07, WIE10, BEU16]
Remark: values are estimated values based on the stated sources
1 The ratio takes into consideration battery cooling, slave BMSs (one slave for 10-12 battery cell connected in series), cell contacting etc. [FTM14a]. 2 The fixed battery costs have to be added on top of the battery pack costs, which can be calculated using the EUR/kWh values. In particular, these costs should be taken into consideration for
smaller battery packs where the fixed cost components are responsible for a larger part of the battery pack costs. Fixed and partly fixed cost components of battery packs include contactors,
fuses, insulation monitoring unit, BMS master unit, plugs and battery housing (depends on battery design and mounting inside the vehicle). 3 The cost in EUR/kg hydrogen or CNG may not be linear across all tank sizes. Tank prices are for standard size tanks with an approx. capacity of 40 kg CNG/LNG or 5 kg hydrogen.
13
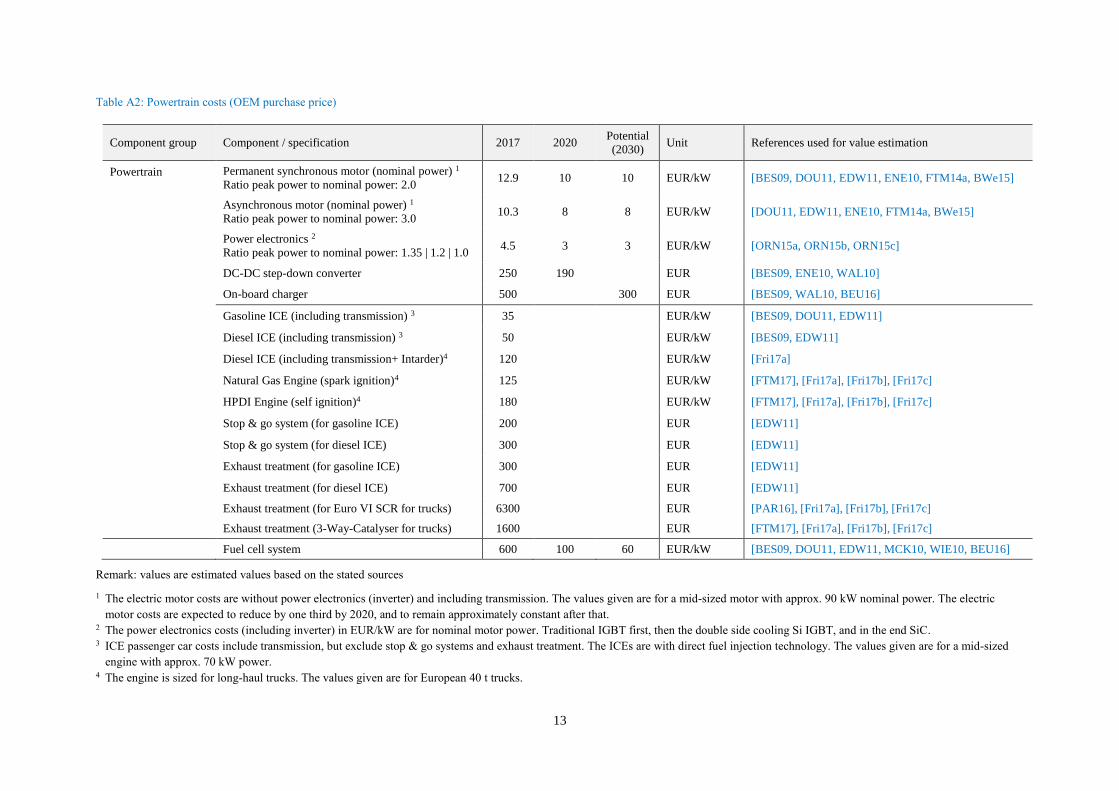
Table A2: Powertrain costs (OEM purchase price)
Component group Component / specification 2017 2020 Potential
(2030) Unit References used for value estimation
Powertrain Permanent synchronous motor (nominal power) 1
Ratio peak power to nominal power: 2.0 12.9 10 10 EUR/kW [BES09, DOU11, EDW11, ENE10, FTM14a, BWe15]
Asynchronous motor (nominal power) 1
Ratio peak power to nominal power: 3.0 10.3 8 8 EUR/kW [DOU11, EDW11, ENE10, FTM14a, BWe15]
Power electronics 2
Ratio peak power to nominal power: 1.35 | 1.2 | 1.0 4.5 3 3 EUR/kW [ORN15a, ORN15b, ORN15c]
DC-DC step-down converter 250 190 EUR [BES09, ENE10, WAL10]
On-board charger 500 300 EUR [BES09, WAL10, BEU16]
Gasoline ICE (including transmission) 3 35 EUR/kW [BES09, DOU11, EDW11]
Diesel ICE (including transmission) 3 50 EUR/kW [BES09, EDW11]
Diesel ICE (including transmission+ Intarder)4 120 EUR/kW [Fri17a]
Natural Gas Engine (spark ignition)4 125 EUR/kW [FTM17], [Fri17a], [Fri17b], [Fri17c]
HPDI Engine (self ignition)4 180 EUR/kW [FTM17], [Fri17a], [Fri17b], [Fri17c]
Stop & go system (for gasoline ICE) 200 EUR [EDW11]
Stop & go system (for diesel ICE) 300 EUR [EDW11]
Exhaust treatment (for gasoline ICE) 300 EUR [EDW11]
Exhaust treatment (for diesel ICE) 700 EUR [EDW11]
Exhaust treatment (for Euro VI SCR for trucks) 6300 EUR [PAR16], [Fri17a], [Fri17b], [Fri17c]
Exhaust treatment (3-Way-Catalyser for trucks) 1600 EUR [FTM17], [Fri17a], [Fri17b], [Fri17c]
Fuel cell system 600 100 60 EUR/kW [BES09, DOU11, EDW11, MCK10, WIE10, BEU16]
Remark: values are estimated values based on the stated sources
1 The electric motor costs are without power electronics (inverter) and including transmission. The values given are for a mid-sized motor with approx. 90 kW nominal power. The electric
motor costs are expected to reduce by one third by 2020, and to remain approximately constant after that. 2 The power electronics costs (including inverter) in EUR/kW are for nominal motor power. Traditional IGBT first, then the double side cooling Si IGBT, and in the end SiC. 3 ICE passenger car costs include transmission, but exclude stop & go systems and exhaust treatment. The ICEs are with direct fuel injection technology. The values given are for a mid-sized
engine with approx. 70 kW power. 4 The engine is sized for long-haul trucks. The values given are for European 40 t trucks.
14
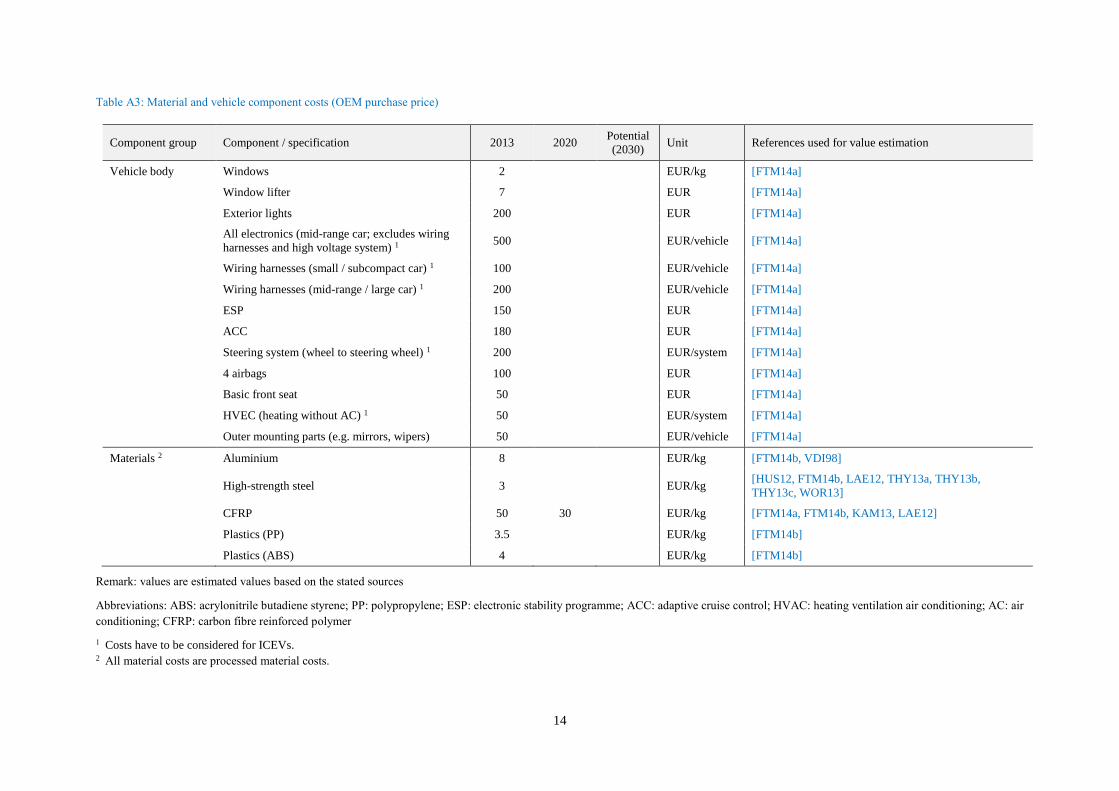
Table A3: Material and vehicle component costs (OEM purchase price)
Component group Component / specification 2013 2020 Potential
(2030) Unit References used for value estimation
Vehicle body Windows 2 EUR/kg [FTM14a]
Window lifter 7 EUR [FTM14a]
Exterior lights 200 EUR [FTM14a]
All electronics (mid-range car; excludes wiring
harnesses and high voltage system) 1 500 EUR/vehicle [FTM14a]
Wiring harnesses (small / subcompact car) 1 100 EUR/vehicle [FTM14a]
Wiring harnesses (mid-range / large car) 1 200 EUR/vehicle [FTM14a]
ESP 150 EUR [FTM14a]
ACC 180 EUR [FTM14a]
Steering system (wheel to steering wheel) 1 200 EUR/system [FTM14a]
4 airbags 100 EUR [FTM14a]
Basic front seat 50 EUR [FTM14a]
HVEC (heating without AC) 1 50 EUR/system [FTM14a]
Outer mounting parts (e.g. mirrors, wipers) 50 EUR/vehicle [FTM14a]
Materials 2 Aluminium 8 EUR/kg [FTM14b, VDI98]
High-strength steel 3 EUR/kg [HUS12, FTM14b, LAE12, THY13a, THY13b,
THY13c, WOR13]
CFRP 50 30 EUR/kg [FTM14a, FTM14b, KAM13, LAE12]
Plastics (PP) 3.5 EUR/kg [FTM14b]
Plastics (ABS) 4 EUR/kg [FTM14b]
Remark: values are estimated values based on the stated sources
Abbreviations: ABS: acrylonitrile butadiene styrene; PP: polypropylene; ESP: electronic stability programme; ACC: adaptive cruise control; HVAC: heating ventilation air conditioning; AC: air
conditioning; CFRP: carbon fibre reinforced polymer
1 Costs have to be considered for ICEVs. 2 All material costs are processed material costs.
15
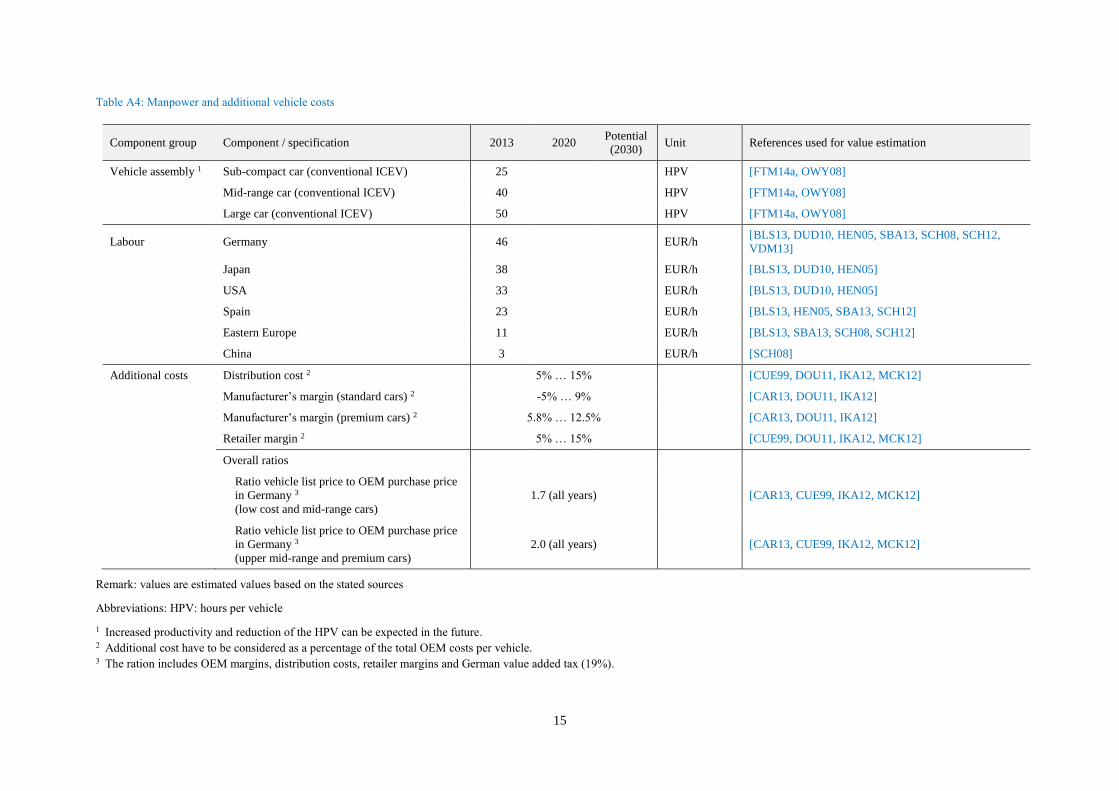
Table A4: Manpower and additional vehicle costs
Component group Component / specification 2013 2020 Potential
(2030) Unit References used for value estimation
Vehicle assembly 1 Sub-compact car (conventional ICEV) 25 HPV [FTM14a, OWY08]
Mid-range car (conventional ICEV) 40 HPV [FTM14a, OWY08]
Large car (conventional ICEV) 50 HPV [FTM14a, OWY08]
Labour Germany 46 EUR/h [BLS13, DUD10, HEN05, SBA13, SCH08, SCH12,
VDM13]
Japan 38 EUR/h [BLS13, DUD10, HEN05]
USA 33 EUR/h [BLS13, DUD10, HEN05]
Spain 23 EUR/h [BLS13, HEN05, SBA13, SCH12]
Eastern Europe 11 EUR/h [BLS13, SBA13, SCH08, SCH12]
China 3 EUR/h [SCH08]
Additional costs Distribution cost 2 5% … 15% [CUE99, DOU11, IKA12, MCK12]
Manufacturer’s margin (standard cars) 2 -5% … 9% [CAR13, DOU11, IKA12]
Manufacturer’s margin (premium cars) 2 5.8% … 12.5% [CAR13, DOU11, IKA12]
Retailer margin 2 5% … 15% [CUE99, DOU11, IKA12, MCK12]
Overall ratios
Ratio vehicle list price to OEM purchase price
in Germany 3
(low cost and mid-range cars)
1.7 (all years) [CAR13, CUE99, IKA12, MCK12]
Ratio vehicle list price to OEM purchase price
in Germany 3
(upper mid-range and premium cars)
2.0 (all years) [CAR13, CUE99, IKA12, MCK12]
Remark: values are estimated values based on the stated sources
Abbreviations: HPV: hours per vehicle
1 Increased productivity and reduction of the HPV can be expected in the future. 2 Additional cost have to be considered as a percentage of the total OEM costs per vehicle. 3 The ration includes OEM margins, distribution costs, retailer margins and German value added tax (19%).
16
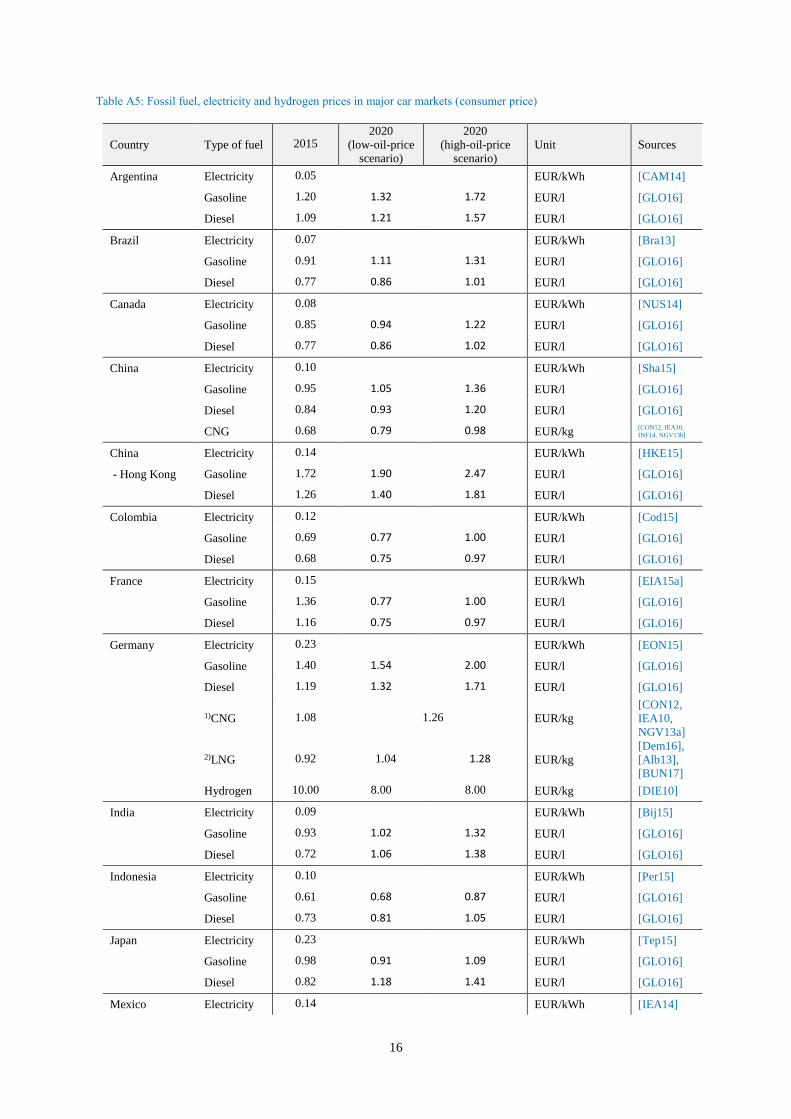
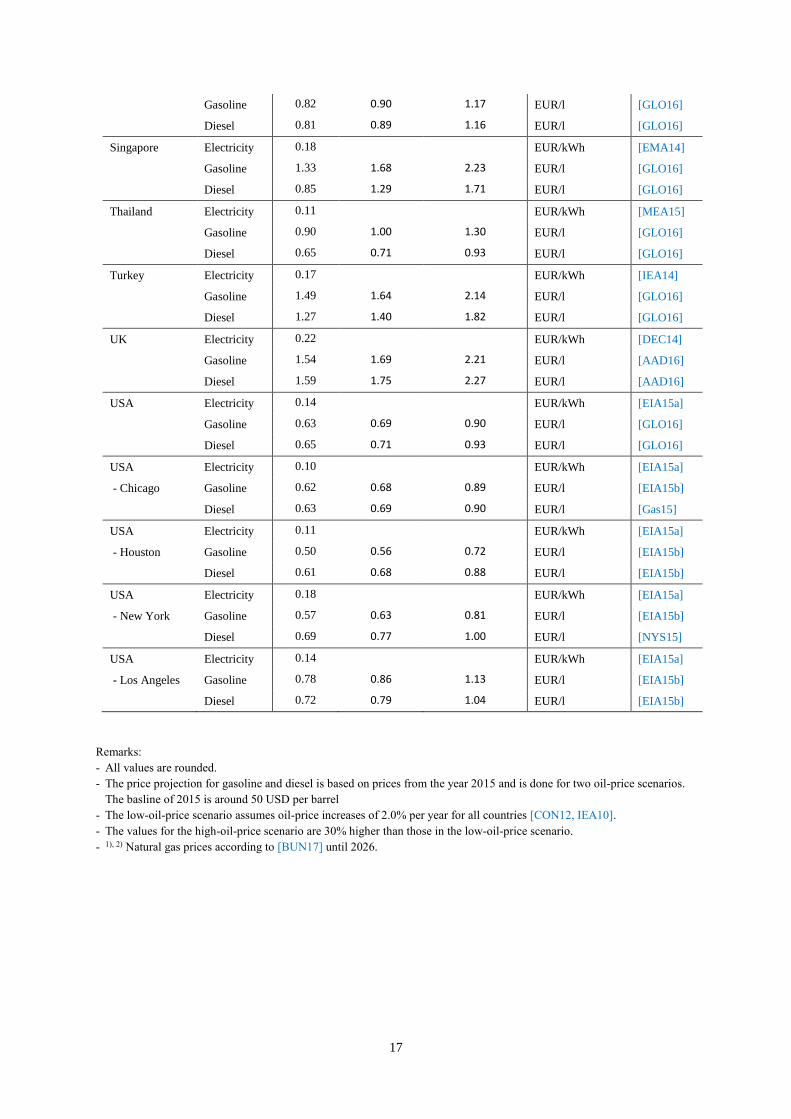
Table A5: Fossil fuel, electricity and hydrogen prices in major car markets (consumer price)
Country Type of fuel 2015 2020
(low-oil-price
scenario)
2020
(high-oil-price
scenario)
Unit Sources
Argentina Electricity 0.05 EUR/kWh [CAM14]
Gasoline 1.20 1.32 1.72 EUR/l [GLO16]
Diesel 1.09 1.21 1.57 EUR/l [GLO16]
Brazil Electricity 0.07 EUR/kWh [Bra13]
Gasoline 0.91 1.11 1.31 EUR/l [GLO16]
Diesel 0.77 0.86 1.01 EUR/l [GLO16]
Canada Electricity 0.08 EUR/kWh [NUS14]
Gasoline 0.85 0.94 1.22 EUR/l [GLO16]
Diesel 0.77 0.86 1.02 EUR/l [GLO16]
China Electricity 0.10 EUR/kWh [Sha15]
Gasoline 0.95 1.05 1.36 EUR/l [GLO16]
Diesel 0.84 0.93 1.20 EUR/l [GLO16]
CNG 0.68 0.79 0.98 EUR/kg [CON12, IEA10,
INF14, NGV13b]
China Electricity 0.14 EUR/kWh [HKE15]
- Hong Kong Gasoline 1.72 1.90 2.47 EUR/l [GLO16]
Diesel 1.26 1.40 1.81 EUR/l [GLO16]
Colombia Electricity 0.12 EUR/kWh [Cod15]
Gasoline 0.69 0.77 1.00 EUR/l [GLO16]
Diesel 0.68 0.75 0.97 EUR/l [GLO16]
France Electricity 0.15 EUR/kWh [EIA15a]
Gasoline 1.36 0.77 1.00 EUR/l [GLO16]
Diesel 1.16 0.75 0.97 EUR/l [GLO16]
Germany Electricity 0.23 EUR/kWh [EON15]
Gasoline 1.40 1.54 2.00 EUR/l [GLO16]
Diesel 1.19 1.32 1.71 EUR/l [GLO16]
1)CNG 1.08 1.26 EUR/kg
[CON12,
IEA10,
NGV13a]
2)LNG 0.92 1.04 1.28 EUR/kg
[Dem16],
[Alb13],
[BUN17]
Hydrogen 10.00 8.00 8.00 EUR/kg [DIE10]
India Electricity 0.09 EUR/kWh [Bij15]
Gasoline 0.93 1.02 1.32 EUR/l [GLO16]
Diesel 0.72 1.06 1.38 EUR/l [GLO16]
Indonesia Electricity 0.10 EUR/kWh [Per15]
Gasoline 0.61 0.68 0.87 EUR/l [GLO16]
Diesel 0.73 0.81 1.05 EUR/l [GLO16]
Japan Electricity 0.23 EUR/kWh [Tep15]
Gasoline 0.98 0.91 1.09 EUR/l [GLO16]
Diesel 0.82 1.18 1.41 EUR/l [GLO16]
Mexico Electricity 0.14 EUR/kWh [IEA14]
17
Gasoline 0.82 0.90 1.17 EUR/l [GLO16]
Diesel 0.81 0.89 1.16 EUR/l [GLO16]
Singapore Electricity 0.18 EUR/kWh [EMA14]
Gasoline 1.33 1.68 2.23 EUR/l [GLO16]
Diesel 0.85 1.29 1.71 EUR/l [GLO16]
Thailand Electricity 0.11 EUR/kWh [MEA15]
Gasoline 0.90 1.00 1.30 EUR/l [GLO16]
Diesel 0.65 0.71 0.93 EUR/l [GLO16]
Turkey Electricity 0.17 EUR/kWh [IEA14]
Gasoline 1.49 1.64 2.14 EUR/l [GLO16]
Diesel 1.27 1.40 1.82 EUR/l [GLO16]
UK Electricity 0.22 EUR/kWh [DEC14]
Gasoline 1.54 1.69 2.21 EUR/l [AAD16]
Diesel 1.59 1.75 2.27 EUR/l [AAD16]
USA Electricity 0.14 EUR/kWh [EIA15a]
Gasoline 0.63 0.69 0.90 EUR/l [GLO16]
Diesel 0.65 0.71 0.93 EUR/l [GLO16]
USA Electricity 0.10 EUR/kWh [EIA15a]
- Chicago Gasoline 0.62 0.68 0.89 EUR/l [EIA15b]
Diesel 0.63 0.69 0.90 EUR/l [Gas15]
USA Electricity 0.11 EUR/kWh [EIA15a]
- Houston Gasoline 0.50 0.56 0.72 EUR/l [EIA15b]
Diesel 0.61 0.68 0.88 EUR/l [EIA15b]
USA Electricity 0.18 EUR/kWh [EIA15a]
- New York Gasoline 0.57 0.63 0.81 EUR/l [EIA15b]
Diesel 0.69 0.77 1.00 EUR/l [NYS15]
USA Electricity 0.14 EUR/kWh [EIA15a]
- Los Angeles Gasoline 0.78 0.86 1.13 EUR/l [EIA15b]
Diesel 0.72 0.79 1.04 EUR/l [EIA15b]
Remarks:
- All values are rounded.
- The price projection for gasoline and diesel is based on prices from the year 2015 and is done for two oil-price scenarios.
The basline of 2015 is around 50 USD per barrel
- The low-oil-price scenario assumes oil-price increases of 2.0% per year for all countries [CON12, IEA10].
- The values for the high-oil-price scenario are 30% higher than those in the low-oil-price scenario.
- 1), 2) Natural gas prices according to [BUN17] until 2026.
18
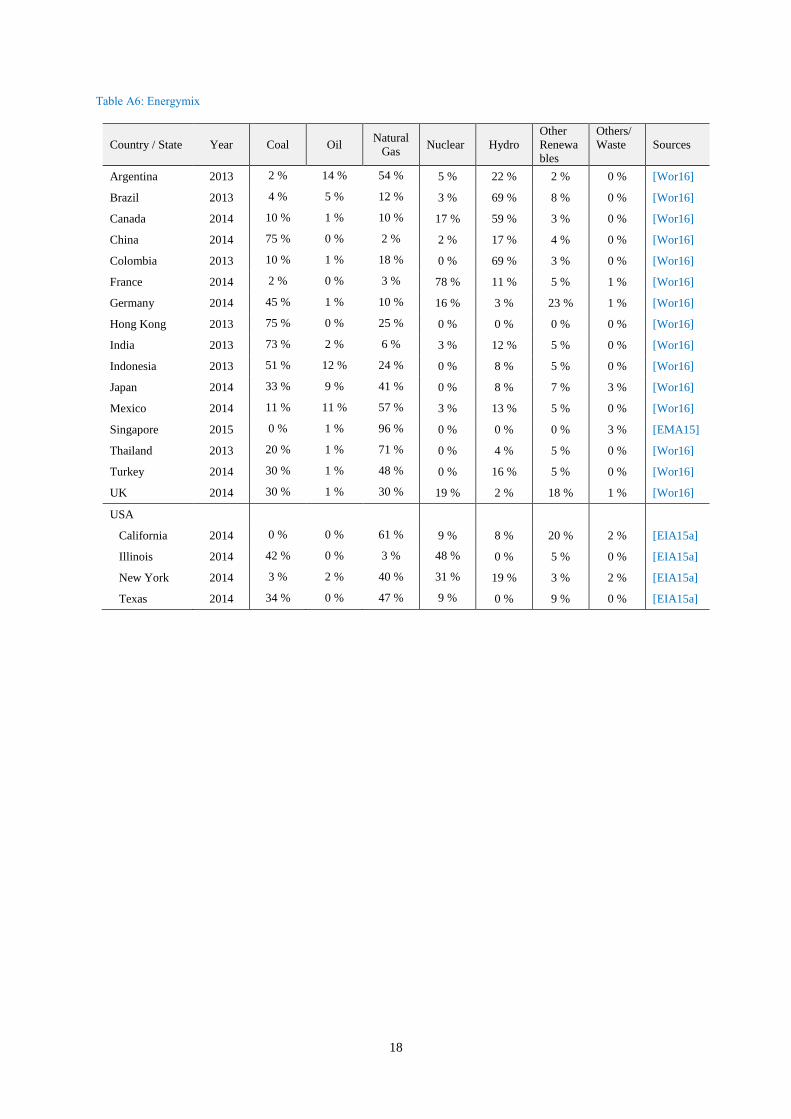
Table A6: Energymix
Country / State Year Coal Oil Natural
Gas Nuclear Hydro
Other
Renewa
bles
Others/
Waste Sources
Argentina 2013 2 % 14 % 54 % 5 % 22 % 2 % 0 % [Wor16]
Brazil 2013 4 % 5 % 12 % 3 % 69 % 8 % 0 % [Wor16]
Canada 2014 10 % 1 % 10 % 17 % 59 % 3 % 0 % [Wor16]
China 2014 75 % 0 % 2 % 2 % 17 % 4 % 0 % [Wor16]
Colombia 2013 10 % 1 % 18 % 0 % 69 % 3 % 0 % [Wor16]
France 2014 2 % 0 % 3 % 78 % 11 % 5 % 1 % [Wor16]
Germany 2014 45 % 1 % 10 % 16 % 3 % 23 % 1 % [Wor16]
Hong Kong 2013 75 % 0 % 25 % 0 % 0 % 0 % 0 % [Wor16]
India 2013 73 % 2 % 6 % 3 % 12 % 5 % 0 % [Wor16]
Indonesia 2013 51 % 12 % 24 % 0 % 8 % 5 % 0 % [Wor16]
Japan 2014 33 % 9 % 41 % 0 % 8 % 7 % 3 % [Wor16]
Mexico 2014 11 % 11 % 57 % 3 % 13 % 5 % 0 % [Wor16]
Singapore 2015 0 % 1 % 96 % 0 % 0 % 0 % 3 % [EMA15]
Thailand 2013 20 % 1 % 71 % 0 % 4 % 5 % 0 % [Wor16]
Turkey 2014 30 % 1 % 48 % 0 % 16 % 5 % 0 % [Wor16]
UK 2014 30 % 1 % 30 % 19 % 2 % 18 % 1 % [Wor16]
USA
California 2014 0 % 0 % 61 % 9 % 8 % 20 % 2 % [EIA15a]
Illinois 2014 42 % 0 % 3 % 48 % 0 % 5 % 0 % [EIA15a]
New York 2014 3 % 2 % 40 % 31 % 19 % 3 % 2 % [EIA15a]
Texas 2014 34 % 0 % 47 % 9 % 0 % 9 % 0 % [EIA15a]
19
References
[AAD16] Automobile Association Developments Ltd: Fuel Price Report UK & overseas petrol and
diesel prices. www.theaa.com/motoring_advice/fuel/index.html, accessed on 2/6/16.
[Alb13] Albrecht, Uwe ; Schmidt, Patrick; Weindorf, Werner; Wurster, Reinhold; Zittel, Werner:
Kraftstoffstudie : Zukünftige Kraftstoffe für Verbrennungsmotoren und Gasturbinen. Frankfurt
am Main, 2013
[Ami09] Justin Amirault, Joshua Chien, Saurabh Garg, Drew Gibbons, Ben Ross, Maureen Tang, Jia
Xing Ikhlaq Sidhu (PI), Phil Kaminsky, Burghardt Tenderich, “The Electric Vehicle Battery
Landscape: Opportunities and Challenges,” University of California, Berkeley,
cet.berkeley.edu, 2009.
[Bij15] Bijli Bachao: Domestic Electricity LT Tariff Slabs and Rates for all states in India in 2015.
https://www.bijlibachao.com/news/domestic-electricity-lt-tariffslabs-and-rates-for-all-states-
in-india-in-2015.html, accessed on 28/2/2015.
[Bra13] The Brazil Business: Electricity Prices in Brazil. http://thebrazilbusiness.com/
article/electricity-prices-in-brazil, accessed on 1/3/2015.
[BUN17] Bundeskabinett, Sitzung 15.02.2017: „Entwurf eines Zweiten Gesetzes zur Änderung des
Energiesteuer- und des Stromsteuergesetzes“, Regierungspressekonferenz vom 15 Februar,
2017.
[CAM14] CAMMESA – Compania Administradora del Mercado Mayorista Electrico: Informe Annual
2014. Buenos Aires, 2014.
[Cod15] Codensa: Tarifas de energiá eléctrica ($/kWh) reguladas por la comisión de regulación de
energíay gas (creg) enero de 2015. 2015.
[Dem16] Demirel, Yaşar: Energy – Production, Conversion, Storage, Conservation, and Coupling,
Springer Vieweg Verlag, Lincoln, NE, 2016.
[DEC14] Department of Energy & Climate Change: Average annual domestic standard electricity bills
in 2014 for UK regions with average unit costs. 2014.
[EIA15a] U.S. Energy Information Administration: Electric Power Monthly with Data for November
2014. U.S. Department of Energy, Washington, 2015.
[EIA15b]: U.S. Energy Information Administration: Weekly Retail Gasoline and Diesel Prices. Average
prices taken for September-November 2015,
http://www.eia.gov/dnav/pet/pet_pri_gnd_dcus_sny_m.htm, accessed on 28/2/2015.
[EMA14] Energy Market Authority: Electricity Tariffs - Low Tension Tariffs, 2005 - 2014, price in
SGD excl GST. Government of Singapore, 2015.
[EMA15]: Energy Market Authority: Singapore Energy Statistics 2015 – 02 Energy Transformation.
Government of Singapore, 2015.
[EON15] E.ON: BerlinStrom. https://www.eon.de/pk/de/strom/optimalstrom/berlinstrom.
html?productType=Strom&tariffType=et, accessed on 20/10/2015.
[Fri17a] Fries, Michael; Lehmeyer, Maximilian; Lienkamp, Markus: Multi-Criterion Optimization of
Heavy-Duty Powertrain Design for the Evaluation of Transport Efficiency and Costs, IEEE
20th International Conference on Intelligent Transportation Systems, Yokohama, Japan, 2017.
[Fri17b] Fries, Michael; Lienkamp, Markus: Predictive Technology Management for the Identification
of Future Development Trends and the Maximum Achievable Potential Based on a
20
Quantitative Analysis, Advances in Science, Technology and Engineering Systems Journal,
Vol. 2, No. 3, pp. 1042-1049, 2017. https://doi.org/10.25046/aj0203132
[Fri17c] M. Fries, M. Lienkamp: “Technology Assessment Based on Growth Functions for Prediction
of Future Development Trends and the Maximum Achievable Potential”, in IEEE
Procceedings of 2016 International Conference on Industrial Engineering and Engineering
Management, Indonesia, 2016. https://doi.org/10.1109/IEEM.2016.7798140.
[FTM17] Numbers based on expert discussions with the former board of management MAN
Truck&Bus 2009 - 2017 and on internal developmental work, Institute of Automotive
Technology (FTM), Technische Universität München, 2017.
[Gai00] L. Gaines and R. Cuenca, Costs of lithium-ion batteries for vehicles, 2000. DOI: 10.2172/761281.
[Glo16] GlobalPetrolPrices: Global Petrol Monthly Prices. Average annual prices for
the year 2015 derived from monthly prices and monthly currency exchange
rates taken from [OAN16], http://www.globalpetrolprices.com, personally
received on 30/5/2016.
[HKE15] Hong Kong Electric: Domestic Tariff, Block Rate Tariff. www.hkelectric.com/
en/customer-services/billing-payment-electricity-tariffs/residential-tariff,
accessed on 15/10/2015.
[IEA14b] International Energy Agency: Electricity Information 2014. IEA Statitistics,
Insights Series 2014, Paris, 2014.
[Kam14] A. Kampker, Elektromobilproduktion. Berlin: Springer Vieweg, 2014.
[Kor13] R. Korthauer, Ed., Handbuch Lithium-Ionen-Batterien. Berlin, Heidelberg, s.l.: Springer
Berlin Heidelberg, 2013.
[Ker15] Matthias Kerler and Markus Lienkamp, “COFAT 2015 - A method to find a thermal optimum
cell size,” Conference on Future Automotive Technology, 2015.
[MEA15] Metropolitan Electricity Authority: About Electricity bills: Normal tariff with consumption
exceeding 150 kWh per month. http://www.mea.or.th/profile/
index.php?l=en&tid=3&mid=111&pid=109, accessed on 15/10/2015.
[Nel12] P.A. Nelson, K.G. Gallagher, I. Bloom, and D.W. Dees, Modeling the Performance and Cost
of Lithium-Ion Batteries for Electric-Drive Vehicles: SECOND EDITION. [Online]
Available: http://www.cse.anl.gov/batpac/files/BatPaC%20ANL-12_55.pdf. Accessed on:
Apr. 25 2017.
[NUS14] NUS Consulting Group: 2013-2014 International Electricity & Natural Gas
Report & Price Survey. 2014.
[Nyk15] B. Nykvist and M. Nilsson, “Rapidly falling costs of battery packs for electric vehicles,”
Nature Climate change, vol. 5, no. 4, pp. 329–332, 2015.
[ORN15a] T. Burres, Oak Ridge National Laboratory, “Benchmarking EV and HEV
Technologies “, 2015
[ORN15b] L. Marelino, Oak Ridge National Laboratory, “FreedomCAR and DOE Roadmap for
Automotive Power Electronics “, 2011
21
[ORN15c] B. Ozpineci, Oak Ridge National Laboratory, “Annual Progress Report for the Electric
Drive Technologies Program “, 2015
[Per15] PT PLN (Persero): Penyusuaian Tarif Tenaga Listrik (Tariff Adjustment) Bulan Maret 2015.
http://www.pln.co.id/blog/tarif-tenaga-listrik/, accessed on 4/3/2015.
[Pet15] R. Petri, T. Giebel, B. Zhang, J.-H. Schünemann, and C. Herrmann, “Material cost model for
innovative li-ion battery cells in electric vehicle applications,” Int. J. of Precis. Eng. and
Manuf.-Green Tech., vol. 2, no. 3, pp. 263–268, 2015. DOI: 10.1007/s40684-015-0031-x
[Rem13] J. Rempel, B. Barnett, and Y.-E. Hyung, “PHEV Battery Cost Assessment,” May. 14 2013.
[Sha15]: Shanghai Municipal Commission of Economy and Informatization: Shanghai
Region Tariff Table. http://www.sheitc.gov.cn/dfjf/637315.htm#, accessed on
15/12/2015.
[Tag09] K. Tagawa and R. J. Brodd, “Production Processes for Fabrication of Lithium-Ion Batteries,”
in Lithium-ion batteries: Science and technologies, M. Yoshio, R. J. Brodd, and A. Kozawa,
Eds., New York, London: Springer, op. 2009, pp. 1–14.
[Tep15] Tokyo Electro Power Company (Tepco): The Calculation of the Electricity Rates for January
2015 for Each Contract Ampere (for 330 kWh).
http://www.tepco.co.jp/en/press/corpcom/release/betu14_e/images/141127e0202.pdf,
accessed on 28/2/2015.
[Tob16] Tober, W., “Praxisbericht Elektromobilität und Verbrennungsmotor: Analyse elektrifizierter
Pkw-Antriebskonzepte,” Praxisberichte ÖVK, Springer Vieweg, Fachmedien, ISBN
9783658136017, 2016.
[Usa15] Technology Transition Case Study: United States Advanced Battery Consortium. [Online]
Available: http://www.uscar.org/guest/article_view.php?articles_id=143. Accessed on: Apr.
25 2017.
[Wit14] Wittenbrink, Werner: Transportmanagement: Kostenoptimierung, Green Logistics und
Herausforderungen an der Schnittstelle Rampe. Gabler Verlag, 2014.
[Wor16] World Bank: World DataBank, World Development Indicators.
http://databank.worldbank.org/data/views/variableselection/selectvariables.aspx?source=world
-development-indicators, accessed on 2/6/16
[AND09] Anderson, D., “An Evaluation of Current and Future Costs for Lithium-Ion Batteries for Use in
Electrified Vehicle Powertrains”, Nicholas School of the Environment, Duke University, Durham
NC, May 2009.
[BAR12] Baranowski, D., “Analyse der Herstellkosten für die Lithium-Ionen-Batterie des MUTE”,
unpublished, Institute for Machine Tools and Industrial Management, Technische Universität
München, Jun. 2012.
[BAU11] Baum, H., Dobberstein, J., Schuler, B., “Nutzen-Kosten-Analyse der Elektromobilität“, Institute
of Transportation Sciences, University of Cologne, Feb. 2011.
[BDE12] BDEW, “BDEW-Strompreisanalyse Mai 2012 – Haushalte und Industrie”, German Association of
Energy and Water Industries., May 2012.
[BES09] Besl, M., Bruchof, D., Hartmann, D., Özdemir, U. et al., “Entwicklungsstand und Perspektiven
der Elektromobilität”, Institute for Energy Economics and the Rational Use of Energy, University
Stuttgart, Dec. 2009.
22
[BLS13] Bureau of Labor Statistics, “International Comparisons of Hourly Compensation Costs in
Manufacturing, 1996-2012”, Time Series Tables, United States Department of Labor, Aug. 2013.
[BMU09] Bundesministerium für Umwelt, Naturschutz und Reaktorsicherheit, “Die EU-Verordnung zur
Verminderung der CO2-Emissionen von Personenkraftwagen“, 2009.
[BOO09] Book, M., Groll, M., Mosquet, X., Rizoulis, D. et al., “The Comeback of the Electric Car? How
Real, How Soon, and What Must Happen Next”, The Boston Consulting Group, 2009.
[BOS09] Bosch, “Internationals Motorpressekolloiqum 2009, Bosch-Technik für Mobilität von morgen,
Umwelt- und Unfallschutz als Leitmotive“, Robert Bosch GmbH, Jun. 2009.
[BWe15] BWe Mobil, “Strukturstudie BWe Mobil_Wertschöpfung: Elektromobilität in Baden-
Württemberg,” 2015. http://www.e-mobilbw.de/de/service/publikationen.html, accessed on
20/04/2017
[BEU16] BEUC, “Low carbon cars in the 2020s: Consumer impacts and EU policy implications”, Final
Report, 2016, http://www.beuc.eu/publications/beuc-x-2016-21_low_carbon_cars_in_the_2020s-
report.pdf, accessed on 20/04/2017
[CAN13] Canis, B., “Battery Manufacturing for Hybrid and Electric Vehicles: Policy Issues”,
Congressional Research Service, Apr. 2013.
[CAP09] Capros, P., Mantzos, L., Tasios, N., De Vita, A. et al., “EU energy trends to 2030 – update 2009”,
European Commission, 2010.
[CAR13] CAR-Center Automotive Research: Was die Autobauer pro Fahrzeug verdienen. In:
Absatzwirtschaft.de, Nov. 2013. http://www.uni-
due.de/~hk0378/publikationen/2013/Absatzwirtschaft-21%2011%202013.pdf, accessed on
29/11/2013.
[CON12] Conti, J., Holtberg, P., Beamon, J., Napolitano, S. et al., “Annual Energy Outlook 2012 with
Projections to 2035”, US Energy Information Administration, Washington DC, 2012.
[CSY11] Directorate-General of Budget, Accounting and Statistics, “Statistical Yearbook of the Republic
of China 2011”, Executive Yuan, Republic of China, ISSN 0256-7857, Oct. 2012.
[CUE99] Cuenca, R. M., Gaines, L. L., Vyas, A. D., “Evaluation of Electric Vehicle Production and
Operating Costs”, Center for Transportation Research, Energy Systems Division, Argonne
National Laboratory, Argonne, IL, Nov. 1999.
[DIE10] Diez, W., Kohler, M., “Otto-, Diesel, Elektromotor – wer macht das Rennen?: Handlungsfelder
zur Sicherung des Automobilstandorts”, Chamber of Industry and Commerce Stuttgart Region,
Steinkopf, Stuttgart, Oct. 2010.
[DIN10] Dinger, A., Ripley, M., Mosquet, X., Rabl, M. et al., “Batteries for Electric Cars – Challenges,
Opportunities, and the Outlook to 2020”, The Boston Consulting Group, 2010.
[DOU11] Douglas, C., Stuart, A., Dolman, M., “Influences on the Low Carbon Car Market from 2020-
2030”, Final Report for Low Carbon Vehicle Partnership, Element Energy Ltd., Cambridge, Jul.
2011.
[DUD10] Dudenhöffer, F., “Eurokurs und starre Listenpreise: Gewinnschub für deutsche Autobauer”, in:
Wirtschaftsdienst, 90(9), p. 624-628, DOI: 10.1007/s10273-010-1126-1, Sep. 2010.
23
[DUL11] Duleep, G., van Essen, H., Kampman, B., Grünig, M., “Impacts of Electric Vehicles - Deliverable
2: Assessment of electric vehicle and battery technology”, Delft, CE Delft, Apr. 2011.
[ECC13a] European Commission Climate Action, „EU ETS 2005-2012”, Oct. 2013.
http://ec.europa.eu/clima/policies/ets/pre2013/index_en.htm, accessed on 26/10/2013.
[ECC13b] European Commission Climate Action, „the EU Emissions trading System (EU ETS)”, Oct. 2013.
http://ec.europa.eu/clima/policies/ets, accessed on 26/10/2013.
[ECC13c] European Commission Climate Action, „International carbon market”, Oct. 2013.
http://ec.europa.eu/clima/policies/ets/linking, accessed on 26/10/2013.
[EDW11] Edwards, R., Larivé, J-F., Bezirat, J-C., “Well-to-wheels Analysis of Future Automotive Fuels
and Power trains in the European Context”, European Commission, JRC Scientific and Technical
Reports, Report Version 3c, Appendix 1, Jul. 2011.
[EEP13] Europe’s Energy Portal, “Electricity Households”, Oct. 2013. http://www.energy.eu/#domestic,
accessed on 12/1/1014.
[EEX13] European Energy Exchange, “EU Emission Allowances – Primary Market Auction”, Oct. 2013.
https://www.eex.com/en/Market%20Data/Trading%20Data/Emission%20Rights/EU%20Emission
%20Allowances%20|%20Spot/EU%20Emission%20Allowances%20Chart%20|%20Spot/spot-
eua-chart/2013-10-08/1/0/a/p2, accessed on 12/1/2014.
[EIA13a] US Energy Information Administration, “Gasoline and Diesel Fuel Update”, Oct. 2013.
http://www.eia.gov/petroleum/gasdiesel, accessed on 17/1/2014.
[EIA13b] US Energy Information Administration, “Electric Power Monthly”, Table 5.6A., Average Retail
Price of Electricity to Ultimate Customers by End-Use Sector, Jul. 2013.
http://www.eia.gov/electricity/monthly/epm_table_grapher.cfm?t=epmt_5_6_a, accessed on
17/1/2014.
[ENE10] Energy.gov, “Electrical and Electronics Technical Team Roadmap”, Office of Energy Efficiency
& Renewable Energy, Dec. 2010.
[EUR12] European Commission, “Energy, transport and environment indicators”, Environment and
Energy, Pocketbooks, Luxembourg, ISBN 978-92-79-26596-9, 2012.
[FAH10] Fahl, U., Blesl, M., Voß, A., Achten, P. et al., „Die Entwicklung der Energiemärkte bis 2030 –
Energieprognose 2009“, Hauptbericht, Federal Ministry for Economy and Technology, Berlin,
2010.
[FEL13] Fell, H.-J., “Globale Abkühlung: Strategien gegen die Klimaschutzblokade – ökologisch,
wirtschaftlich, erfolgreich”, German Institute for Normation e.V., Beuth, Berlin, ISBN: 978-3-
410-23948-2, 2013.
[FTM14a] Figures based on expert discussions between 2011 and 2014 and on internal developmental work,
Institute of Automotive Technology (FTM), Technische Universität München, 2014.
[FTM14b] Institute of Automotive Technology (FTM), “Results of an internal vehicle weight, emission and
cost model”, Institute of Automotive Technology, Technische Universität München, 2014.
[FTM14c] Lienkamp, M., “Auslegung von Elektrofahrzeugen”, lecture notes, Institute of Automotive
Technology, Technische Universität München, Feb. 2014.
24
[HEN05] Heneric, O., Licht, G., Sofka, W., “Europe's Automotive Industry on the Move - Competitiveness
in a Changing World”, ZEW Economic Studies, Vol. 32, Physika, Heidelberg, ISBN: 3-7908-
1590-X, 2005.
[HEN12a] Hensley, R., Newman, J., Rogers, M., “Battery technology charges ahead”, McKinsey Quarterly,
McKinsey & Company, 2012.
[HEN12b] Hensley, R., Newman, J., Rogers, M., Shahinian, M., “Future EV Battery Costs: Building the
Bottom-Up Model”, Mc Kinsey & Company, 2012.
[HUS12] Huse & Philipp GmbH & Co. KG, “Lagerpreise für den Verkauf von Stahl”, Nov. 2012.
http://www.hp-stahl.de/down/lagerpreisliste_stahl-profile.pdf, accessed on 3/1/2014.
[HYU13] Hyundai Motor, “ix35 FCEV – Wasserstoffbetriebenes Bennstoffzellenfahrzeug”, Hyundai Motor
Deutschland GmbH, Neckarsulm, 2013.
[IEA10] International Energy Agency, “World Energy Outlook 2010”, IEA Publications, Paris, 2010.
[IEA11] International Energy Agency, “Technology Roadmap – Electric and plug-in hybrid electric
vehicles”, IEA Publications, Paris, 2011.
[IKA12] Institut für Kraftfahrzeuge (ika), “CO2-Reduzierungspotenziale bei Pkw bis 2020”,
Abschlussbericht 113510, Institut für Kraftfahrzeuge, RWTH Aachen, Contracting Entity: Federal
Ministry for Economy and Technology (BMWi), Bonn, Dec. 2012.
[INF14] inflation.eu, “Worldwide Inflation Data”, Historic inflation – CPI inflation, Average inflation by
year, Jan. 2014; http://www.inflation.eu/inflation-rates/united-states/historic-inflation/cpi-
inflation-united-states.aspx, accessed on 17/1/2014.
[KAL07] Kalhammer, F., Kopf, M., Swan, D., Roan, V. et al., “Status and Prospects for Zero Emissions
Vehicle Technology”, Report of the ARB Independent Expert Panel 2007, prepared for: State of
California Air Resources Board, Sacramento, Apr. 2007.
[KAM13] Kampker, A., Deutskens, C., Nee, C., “Produktion von Elektrofahrzeugen”, in: Kampker, A.,
Vallée, D., Schnettler, A., “Elektromobilität – Grundlagen einer Zukunftstechnologie”, Springer,
Berlin Heidelberg, ISBN: 978-3-642-31985-3, 2013.
[KET09] Ketterer, B., Karl, U., Möst, D., Ulrich, S., “Lithium-Ionen Batterien: Stand der Technik und
Anwendungspotenzial in Hybrid-, Plug-In Hybrid- und Elektrofahrzeugen“, Institut für
Materialforshcung I, Forschungszentrum Karlsruhe GmbH, Karlsruhe, 2009.
[LAE12] Lässig, R., Eisenhut, M., Mathias, A., Schulte, R. et al., “Series production of high-strength
composites, Perspectives for the German engineering industry”, Roland Berger Strategy
Consultants, Sept. 2012.
[LIM12] Limin, Z., “China launches new electricity pricing tariff”, CCTV News, Jan. 2012.
http://english.cntv.cn/program/china24/20120701/107372.shtml, accessed on 12/1/2014.
[MAU10] Mauch, W., Bernhard, D., Habermann, J., Hener, H. et al, “Modellregion Elektromobilität
München – Szenarian für das Potential an Elektrofahrzeugen im Münchner Individualverkehr bis
2030”, Forschungsstelle für Energiewirtschaft e.V., München, Nov. 2010.
[MCK10] McKinsey & Company, “A portfolio of power-trains for Europe: a fact-based analysis”,
McKinsey & Company Inc., 2010.
25
[MCK12] Bärlund A., Cornet A., Annwall B., Sprengel D. et al., McKinsey & Company, “Advanced
Marketing & Sales for Advanced Industries”, McKinsey & Company Inc., 2012.
[MOS11] Mosquet, X., Devineni, M., Mezger, T., Zablit, H. et al., “Powering Autos to 2020 – The Era of
the Electric Car?”, The Boston Consulting Group, 2011.
[NEM09] Nemry, F., Leduc, G., Muños, A., “Plug-in Hybrid and Battery-Electric Vehicles: State of the
research and development and comparative analysis of energy and cost efficiency”, European
Commission, JRC Technical Notes, 2009.
[NGV13a] Natural & bio Gas Vehicle Association, “European NGV Statistics – Comparison of fuel prices in
Europe”, Oct. 2013. http://www.ngvaeurope.eu/european-ngv-statistics, accessed on 22/10/2013.
[NGV13b] Natural & bio Gas Vehicle Association, “Worldwide NGV Statistics – Comparison of fuel prices
Worldwide”, Oct. 2013. http://www.ngvaeurope.eu/worldwide-ngv-statistics, accessed on
22/10/2013.
[OAN13] OANDA, “Historical Exchange Rates”, 2013. www.oanda.com/currency/historical-rates, accessed
on 7/4/2013.
[OAN15] OANDA, “Historical Exchange Rates”, 2015. www.oanda.com/currency/historical-rates, accessed
on 6/14/2017.
[OPE13] Opel, “Open Kombo Kastenwagen – Preise, Ausstattungen und technische Daten”, Opel Adam
AG, Rüsselsheim, Nov. 2013.
[OWY08] Oliver Wyman, “Automotive Manager – Trends, Chancen und Lösungen für die Entscheider in
der Automobilindustrie”, II 2008, Oliver Wyman Consulting GmbH, Munich, 2008.
[RIC10] Richter, J., Lindenberger, D., “Potenziale der Elektromobilität bis 2050 – Eine szenarienbasierte
Analyse der Wirtschaftlichkeit, Umweltauswirkungen und Systemintegration“, Institute of Energy
Economics, University of Cologne, Jun. 2010.
[ROB11] Roland Berger Strategy Consultants, “Powertrain 2020: The Li-Ion Battery Value Chain – Trends
and implications”, Aug. 2011.
[ROS13] Rosenkranz, G., Quentin, J., “Die Energiewende und die Strompreise in Deutschland - Dichtung
und Wahrheit”, German Environmental Aid, Berlin, Aug. 2013.
[SBA13] Federal Statistical Office of Germany, “Arbeitskosten in Deutschland 2012 um 32 % höher als im
EU-Durchschnitt”, press release, Mar. 2013.
[SCH08] Schonert, T., “Interorganisationale Wertschöpfungsnetzwerke in der deutschen
Automobilindustrie - Die Ausgestaltung von Geschäftsbeziehungen am Beispiel internationaler
Standortentscheidungen”, Wiesbaden, ISBN 978-3-8349-0960-2, 2008.
[SCH12] Schröder, C., “Industrielle Arbeitskosten im internationalen Vergleich”, in: IW-Trends, 39(3),
DOI: 10.2373/1864-810X.12-03-05, Sep. 2012.
[SES13] Nee, B., “Energising our Nation – Singapore Energy Statistics 2013”, Energy Market Authority,
Oct. 2013.
[SHZ12] Shenzhen Government Online, “Tiered power bill debated”, May 2012.
http://english.sz.gov.cn/ln/201205/t20120517_1914423.htm, accessed on 22/10/2013.
[SPG14] Singapore Power, “Historical Electricity Tariff, 2009-2013”, Jan. 2014.
26
[SPI13] Spiegel Online, “Sieg der Autolobby: Bundesregierung verhindert strengere Abgasnormen“, Oct.
2013. http://www.spiegel.de/auto/aktuell/eu-umweltminister-vertagen-streit-um-co2-grenzwerte-
a-927663.html, 22/10/2013.
[SST14] Department of Statistics Singapore, “Time Series on CPI (2009=100) and Inflation Rate”, 2014.
http://www.singstat.gov.sg/statistics/browse_by_theme/economy/time_series/cpi_1980.xls,
accessed on 31/01/2014.
[SYS13] Wong, W.K., “Yearbook of Statistics Singapore 2013”, Department of Statistics Singapore, Aug
2013.
[TES12] Blankenship, G., “New Pricing for Model S”, Tesla Motors, Nov 2012.
http://www.teslamotors.com/blog/2013-model-s-price-increase, accessed on 8/2/2014.
[THY13a] ThyssenKrupp, “Preisliste Bandstahl/Warmbreitband”, ThyssenKrupp Steel Europe, Jan. 2013.
[THY13b] ThyssenKrupp, “Preisliste für Feuerverzinktes Feinblech”, ThyssenKrupp Steel Europe, Jan.
2013.
[THY13c] ThyssenKrupp, “Preisliste für Elektrolytisch verzinktes Feinblech”, ThyssenKrupp Steel Europe,
Jan. 2013.
[VDI98] Verein Deutscher Ingenieure, “Konstruktionsmethodik. Technisch-wirtschaftliches Konstruieren”,
Tabellenwerk, VDI-Norm 2225, Blatt 2, Jul. 1998.
[VDM13] VDMA, “Kennzahlenkompass – Informationenn für Unternehmen und Führungskräfte”, Verband
Deutscher Maschinen- und Anlagenbau - German Engineering Federation, Frankfurt, 2013.
[WAL10] Wallentowitz, H., Freialdenhoven, A., Olschwski, I., “Strategien zur Elektrifizierung des
Antriebsstranges”, 1st edition, Wiesbaden, Vieweg+Teubner, 2010.
[WIE10] Wietschel, M., Bünger, U., Weindorf, W., “Vergleich von Strom und Wasserstoff als CO2-freie
Energieträger”, Fraunhofer ISI, Karlsruhe, May 2010.
[WIN12] Wind, J., “Antriebssysteme für elektrisch angetriebene Fahrzeuge”, Daimler AG,
Energiespeichersymposium Stuttgart 2012, Stuttgart, 2012.
[WOB13a] The World Bank, “Pump price for gasoline (US$ per liter)”, 2013.
http://data.worldbank.org/indicator/EP.PMP.SGAS.CD, accessed on 22/10/2013.
[WOB13b] The World Bank, “Pump price for diesel fuel (US$ per liter)”, 2013.
http://data.worldbank.org/indicator/EP.PMP.DESL.CD, accessed on 22/10/2013.
[WOL16] Wolfram, P, Lutsey. N, “Electric vehicles: Literature review of technology costs and carbon
emissions”, 2016. http://www.theicct.org/lit-review-ev-tech-costs-co2-emissions-2016, accessed
on 20/04/2017.
[WOR13] World Auto Steel, “Ultralight Steel Auto Body (ULSAB)”, Cost Models in Microsoft Excel,
without version number or date, World Auto Steel, 2013.
http://www.worldautosteel.org/projects/ulsab/, accessed on 06/11/2013.