Embed Size (px)
Citation preview
Design of Experiment – Part II
High-throughput Sequencing Workshop
Department of Biostatistics & BioinformaticsDuke University Medical Center
July 17, 2017
Study designs in clinical research Genetics Association Studies Gene expression studies Designs for RNA-Seq
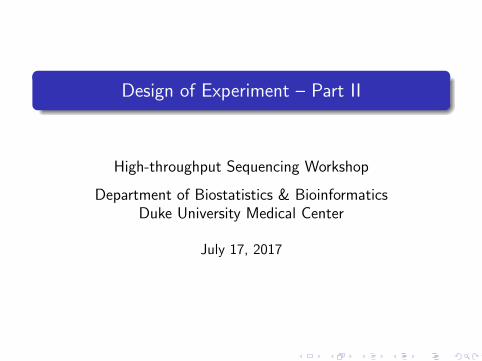
Outline
Study design for clinical research
Study design for genetic association studies.
Study design related to gene expression studies – RNA-SeqI Technical variability in RNA-SeqI Experimental Designs in RNA-Seq
Main References:
1. Marioni et al. Genome Research 2008, 18:1509-17
2. McIntyre et al. BMC Genomics 2011, 12:293
3. Auer et al. Genetics 2010, 185:405-416

Study designs in clinical research Genetics Association Studies Gene expression studies Designs for RNA-Seq
Study designs in clinical research
Study designs in clinical research Genetics Association Studies Gene expression studies Designs for RNA-Seq
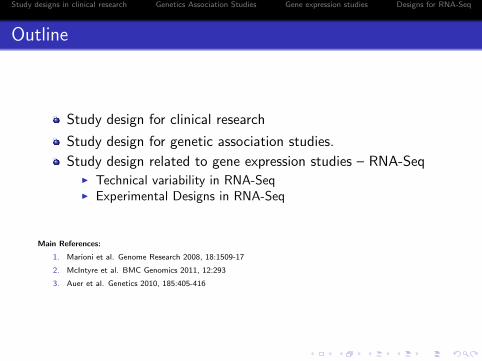
Epidemiology and observational study
case-control study: Casesand controls are identified first.
cohort study: Prospectiveobservational study – Identifyexposures (treatments) ofinterest first. Then, follow upsubjects over time to assesstheir effects.
cross-sectional study: Focuson a single time point or timeinterval. Exposures andoutcomes are determined atthe same time.
No randomization
Study designs in clinical research Genetics Association Studies Gene expression studies Designs for RNA-Seq
Clinical trial
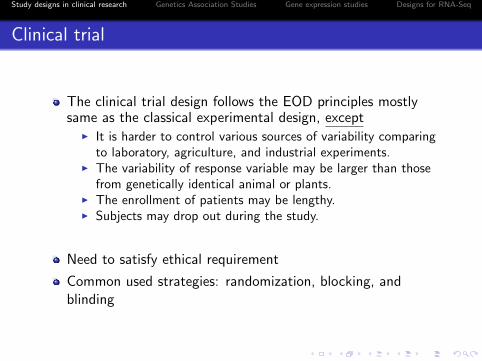
The clinical trial design follows the EOD principles mostlysame as the classical experimental design, except
I It is harder to control various sources of variability comparingto laboratory, agriculture, and industrial experiments.
I The variability of response variable may be larger than thosefrom genetically identical animal or plants.
I The enrollment of patients may be lengthy.I Subjects may drop out during the study.
Need to satisfy ethical requirement
Common used strategies: randomization, blocking, andblinding
Study designs in clinical research Genetics Association Studies Gene expression studies Designs for RNA-Seq
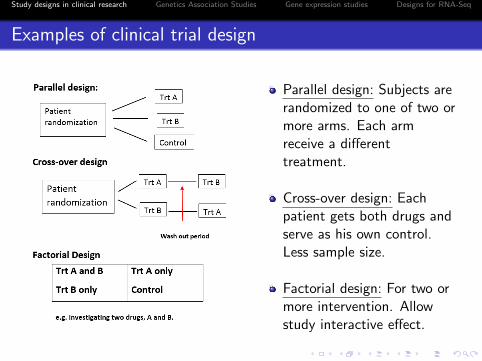
Examples of clinical trial design
Parallel design: Subjects arerandomized to one of two ormore arms. Each armreceive a differenttreatment.
Cross-over design: Eachpatient gets both drugs andserve as his own control.Less sample size.
Factorial design: For two ormore intervention. Allowstudy interactive effect.

Study designs in clinical research Genetics Association Studies Gene expression studies Designs for RNA-Seq
Genetics Association Studies
Study designs in clinical research Genetics Association Studies Gene expression studies Designs for RNA-Seq
Genetics association studies
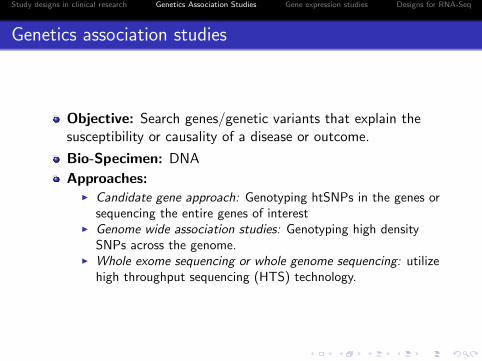
Objective: Search genes/genetic variants that explain thesusceptibility or causality of a disease or outcome.
Bio-Specimen: DNA
Approaches:I Candidate gene approach: Genotyping htSNPs in the genes or
sequencing the entire genes of interestI Genome wide association studies: Genotyping high density
SNPs across the genome.I Whole exome sequencing or whole genome sequencing: utilize
high throughput sequencing (HTS) technology.
Study designs in clinical research Genetics Association Studies Gene expression studies Designs for RNA-Seq
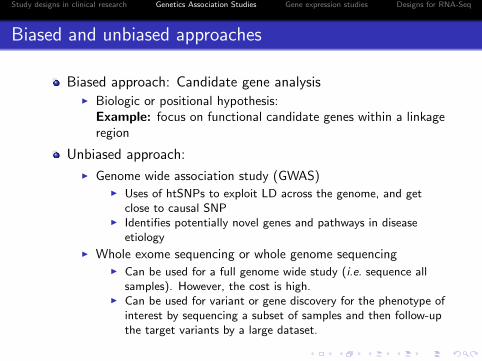
Biased and unbiased approaches
Biased approach: Candidate gene analysisI Biologic or positional hypothesis:
Example: focus on functional candidate genes within a linkageregion
Unbiased approach:
I Genome wide association study (GWAS)I Uses of htSNPs to exploit LD across the genome, and get
close to causal SNPI Identifies potentially novel genes and pathways in disease
etiology
I Whole exome sequencing or whole genome sequencingI Can be used for a full genome wide study (i.e. sequence all
samples). However, the cost is high.I Can be used for variant or gene discovery for the phenotype of
interest by sequencing a subset of samples and then follow-upthe target variants by a large dataset.
Study designs in clinical research Genetics Association Studies Gene expression studies Designs for RNA-Seq
Background of disease genetics association
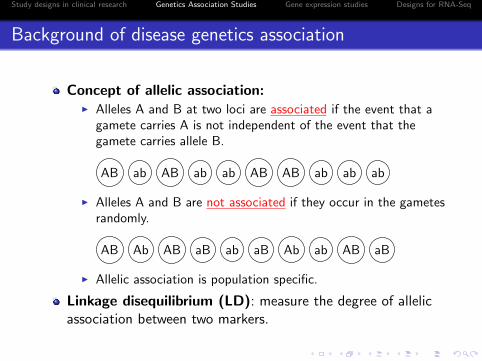
Concept of allelic association:I Alleles A and B at two loci are associated if the event that a
gamete carries A is not independent of the event that thegamete carries allele B.
AB ab AB ab ab AB AB ab ab ab
I Alleles A and B are not associated if they occur in the gametesrandomly.
AB Ab AB aB ab aB Ab ab AB aB
I Allelic association is population specific.
Linkage disequilibrium (LD): measure the degree of allelicassociation between two markers.
Study designs in clinical research Genetics Association Studies Gene expression studies Designs for RNA-Seq
Background of disease genetic association
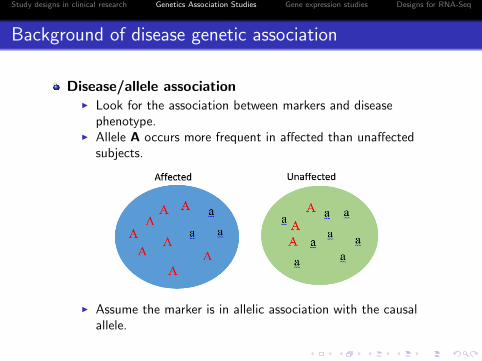
Disease/allele associationI Look for the association between markers and disease
phenotype.I Allele A occurs more frequent in affected than unaffected
subjects.
I Assume the marker is in allelic association with the causalallele.
Study designs in clinical research Genetics Association Studies Gene expression studies Designs for RNA-Seq
Background of disease genetics association
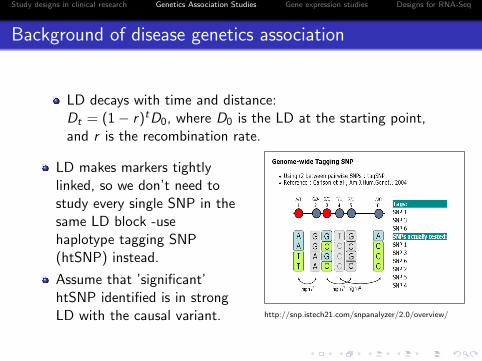
LD decays with time and distance:Dt = (1 − r)tD0, where D0 is the LD at the starting point,and r is the recombination rate.
LD makes markers tightlylinked, so we don’t need tostudy every single SNP in thesame LD block -usehaplotype tagging SNP(htSNP) instead.
Assume that ’significant’htSNP identified is in strongLD with the causal variant. http://snp.istech21.com/snpanalyzer/2.0/overview/
Study designs in clinical research Genetics Association Studies Gene expression studies Designs for RNA-Seq
Commonly used study designs
Family-based approachI Recruit proband and his/her family members.I The unaffected family members or parents can serve as
controls to evaluate variant association to the phenotype ofinterest.
I Types of family structure: parents-offspring trio, discordantsibpair with or without parents, extended family
I Apply to linkage studies: To identify chromosomal regions thatharbor genes linked to the phenotype of interest.
I Apply to association studies.I Often limited by the number of families one can recruit.
case-control approachI Use unrelated population samples, easier to recruit, but
selection of controls is important.I prone to spurious results by population admixture
Study designs in clinical research Genetics Association Studies Gene expression studies Designs for RNA-Seq
Effect of Population admixture
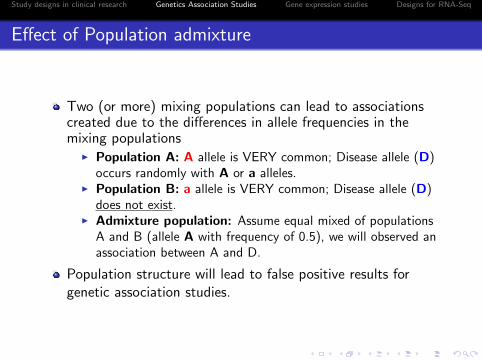
Two (or more) mixing populations can lead to associationscreated due to the differences in allele frequencies in themixing populations
I Population A: A allele is VERY common; Disease allele (D)occurs randomly with A or a alleles.
I Population B: a allele is VERY common; Disease allele (D)does not exist.
I Admixture population: Assume equal mixed of populationsA and B (allele A with frequency of 0.5), we will observed anassociation between A and D.
Population structure will lead to false positive results forgenetic association studies.
Study designs in clinical research Genetics Association Studies Gene expression studies Designs for RNA-Seq
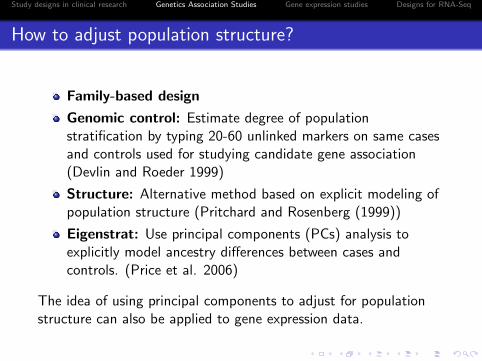
How to adjust population structure?
Family-based design
Genomic control: Estimate degree of populationstratification by typing 20-60 unlinked markers on same casesand controls used for studying candidate gene association(Devlin and Roeder 1999)
Structure: Alternative method based on explicit modeling ofpopulation structure (Pritchard and Rosenberg (1999))
Eigenstrat: Use principal components (PCs) analysis toexplicitly model ancestry differences between cases andcontrols. (Price et al. 2006)
The idea of using principal components to adjust for populationstructure can also be applied to gene expression data.
Study designs in clinical research Genetics Association Studies Gene expression studies Designs for RNA-Seq
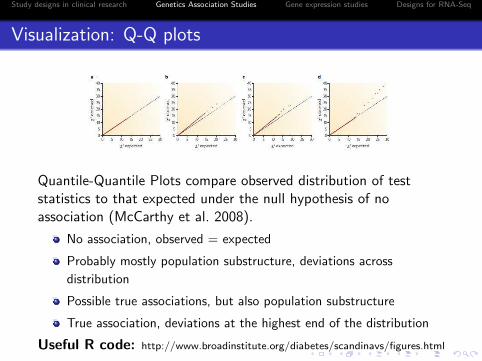
Visualization: Q-Q plots
Quantile-Quantile Plots compare observed distribution of teststatistics to that expected under the null hypothesis of noassociation (McCarthy et al. 2008).
No association, observed = expected
Probably mostly population substructure, deviations across
distribution
Possible true associations, but also population substructure
True association, deviations at the highest end of the distribution
Useful R code: http://www.broadinstitute.org/diabetes/scandinavs/figures.html
Study designs in clinical research Genetics Association Studies Gene expression studies Designs for RNA-Seq
Gene expression studies
Study designs in clinical research Genetics Association Studies Gene expression studies Designs for RNA-Seq
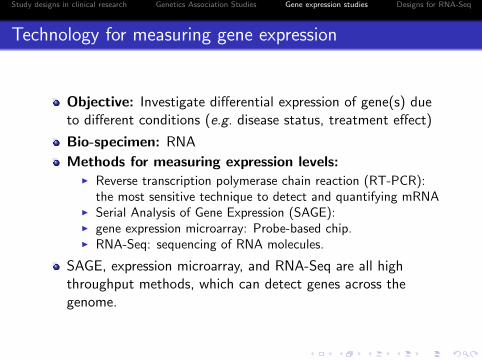
Technology for measuring gene expression
Objective: Investigate differential expression of gene(s) dueto different conditions (e.g. disease status, treatment effect)
Bio-specimen: RNA
Methods for measuring expression levels:I Reverse transcription polymerase chain reaction (RT-PCR):
the most sensitive technique to detect and quantifying mRNAI Serial Analysis of Gene Expression (SAGE):I gene expression microarray: Probe-based chip.I RNA-Seq: sequencing of RNA molecules.
SAGE, expression microarray, and RNA-Seq are all highthroughput methods, which can detect genes across thegenome.
Study designs in clinical research Genetics Association Studies Gene expression studies Designs for RNA-Seq
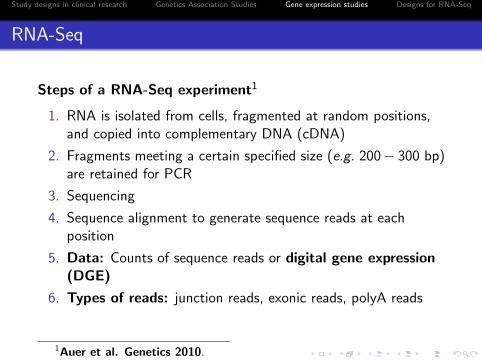
RNA-Seq
Steps of a RNA-Seq experiment1
1. RNA is isolated from cells, fragmented at random positions,and copied into complementary DNA (cDNA)
2. Fragments meeting a certain specified size (e.g. 200 − 300 bp)are retained for PCR
3. Sequencing
4. Sequence alignment to generate sequence reads at eachposition
5. Data: Counts of sequence reads or digital gene expression(DGE)
6. Types of reads: junction reads, exonic reads, polyA reads
1Auer et al. Genetics 2010.
Study designs in clinical research Genetics Association Studies Gene expression studies Designs for RNA-Seq
Sources of variability
Types of variability applying to any experiments
Technical variability
Biological variability
I Variability between experimental units (samples)I Variability between factors of interest (treatment groups)I Biological variability is not affected by technical variability.
These sources of variability need to be considered in theexperimental design.
Study designs in clinical research Genetics Association Studies Gene expression studies Designs for RNA-Seq
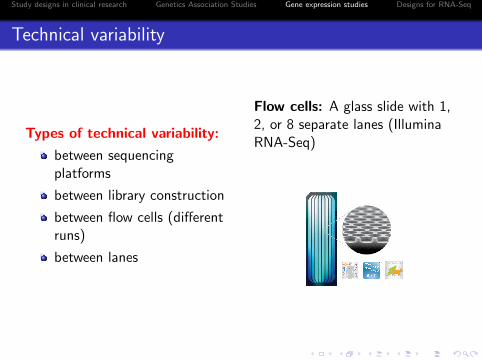
Technical variability
Types of technical variability:
between sequencingplatforms
between library construction
between flow cells (differentruns)
between lanes
Flow cells: A glass slide with 1,2, or 8 separate lanes (IlluminaRNA-Seq)
Study designs in clinical research Genetics Association Studies Gene expression studies Designs for RNA-Seq
Designs of evaluating technical variability
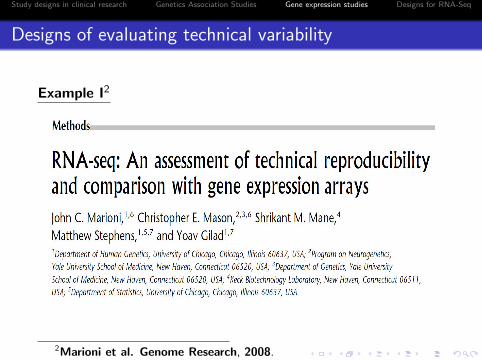
Example I2
2Marioni et al. Genome Research, 2008.
Study designs in clinical research Genetics Association Studies Gene expression studies Designs for RNA-Seq
Designs of evaluating technical variability
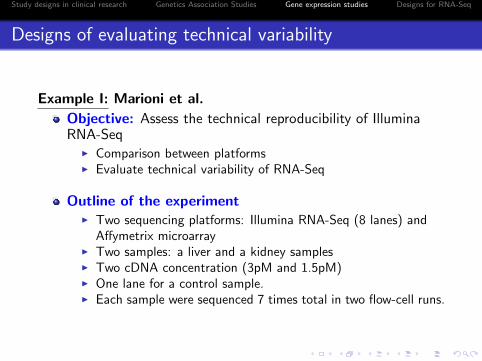
Example I: Marioni et al.
Objective: Assess the technical reproducibility of IlluminaRNA-Seq
I Comparison between platformsI Evaluate technical variability of RNA-Seq
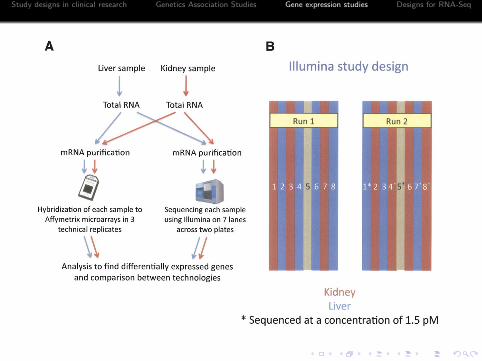
Outline of the experimentI Two sequencing platforms: Illumina RNA-Seq (8 lanes) and
Affymetrix microarrayI Two samples: a liver and a kidney samplesI Two cDNA concentration (3pM and 1.5pM)I One lane for a control sample.I Each sample were sequenced 7 times total in two flow-cell runs.
Study designs in clinical research Genetics Association Studies Gene expression studies Designs for RNA-Seq
Study designs in clinical research Genetics Association Studies Gene expression studies Designs for RNA-Seq
Design of evaluating technical variability
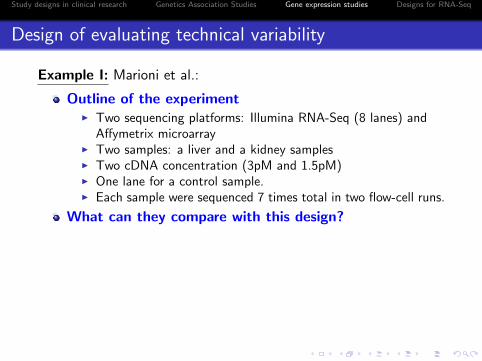
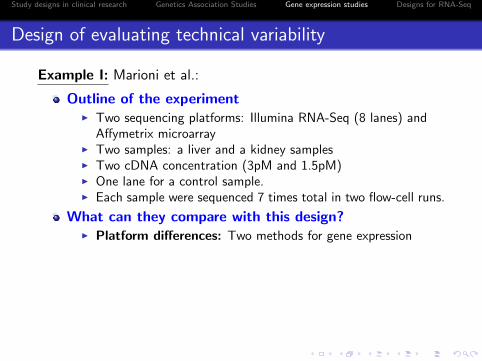
Example I: Marioni et al.:
Outline of the experimentI Two sequencing platforms: Illumina RNA-Seq (8 lanes) and
Affymetrix microarrayI Two samples: a liver and a kidney samplesI Two cDNA concentration (3pM and 1.5pM)I One lane for a control sample.I Each sample were sequenced 7 times total in two flow-cell runs.
What can they compare with this design?
I Platform differences: Two methods for gene expressionI Technical variability: Same sample sequenced in different
lanes, two separate runsI Effect of cDNA concentration: two concentrations (3 and
1.5pM)I Differential expression between liver and kidney tissues:
Two tissue samples
Study designs in clinical research Genetics Association Studies Gene expression studies Designs for RNA-Seq
Design of evaluating technical variability
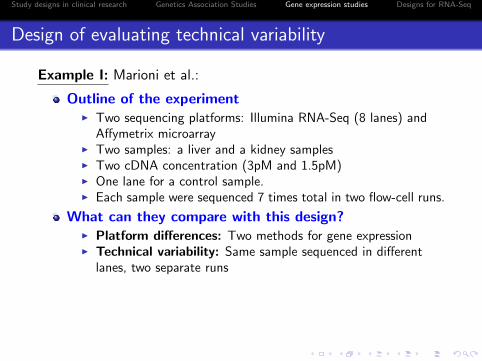
Example I: Marioni et al.:
Outline of the experimentI Two sequencing platforms: Illumina RNA-Seq (8 lanes) and
Affymetrix microarrayI Two samples: a liver and a kidney samplesI Two cDNA concentration (3pM and 1.5pM)I One lane for a control sample.I Each sample were sequenced 7 times total in two flow-cell runs.
What can they compare with this design?I Platform differences: Two methods for gene expression
I Technical variability: Same sample sequenced in differentlanes, two separate runs
I Effect of cDNA concentration: two concentrations (3 and1.5pM)
I Differential expression between liver and kidney tissues:Two tissue samples
Study designs in clinical research Genetics Association Studies Gene expression studies Designs for RNA-Seq
Design of evaluating technical variability
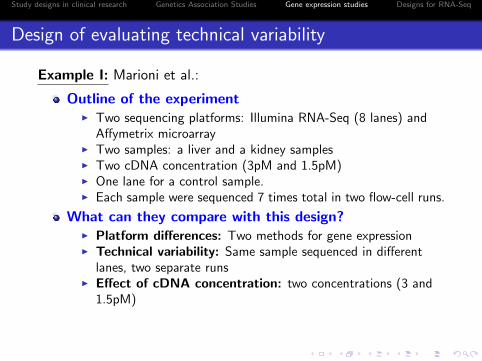
Example I: Marioni et al.:
Outline of the experimentI Two sequencing platforms: Illumina RNA-Seq (8 lanes) and
Affymetrix microarrayI Two samples: a liver and a kidney samplesI Two cDNA concentration (3pM and 1.5pM)I One lane for a control sample.I Each sample were sequenced 7 times total in two flow-cell runs.
What can they compare with this design?I Platform differences: Two methods for gene expressionI Technical variability: Same sample sequenced in different
lanes, two separate runs
I Effect of cDNA concentration: two concentrations (3 and1.5pM)
I Differential expression between liver and kidney tissues:Two tissue samples
Study designs in clinical research Genetics Association Studies Gene expression studies Designs for RNA-Seq
Design of evaluating technical variability
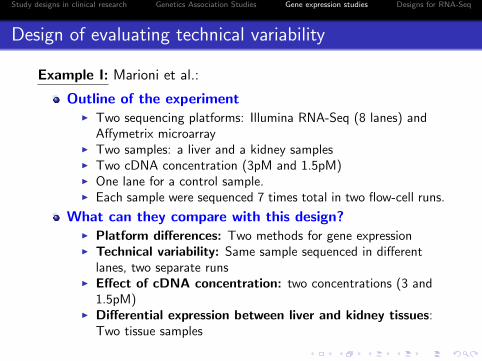
Example I: Marioni et al.:
Outline of the experimentI Two sequencing platforms: Illumina RNA-Seq (8 lanes) and
Affymetrix microarrayI Two samples: a liver and a kidney samplesI Two cDNA concentration (3pM and 1.5pM)I One lane for a control sample.I Each sample were sequenced 7 times total in two flow-cell runs.
What can they compare with this design?I Platform differences: Two methods for gene expressionI Technical variability: Same sample sequenced in different
lanes, two separate runsI Effect of cDNA concentration: two concentrations (3 and
1.5pM)
I Differential expression between liver and kidney tissues:Two tissue samples
Study designs in clinical research Genetics Association Studies Gene expression studies Designs for RNA-Seq
Design of evaluating technical variability
Example I: Marioni et al.:
Outline of the experimentI Two sequencing platforms: Illumina RNA-Seq (8 lanes) and
Affymetrix microarrayI Two samples: a liver and a kidney samplesI Two cDNA concentration (3pM and 1.5pM)I One lane for a control sample.I Each sample were sequenced 7 times total in two flow-cell runs.
What can they compare with this design?I Platform differences: Two methods for gene expressionI Technical variability: Same sample sequenced in different
lanes, two separate runsI Effect of cDNA concentration: two concentrations (3 and
1.5pM)I Differential expression between liver and kidney tissues:
Two tissue samples
Study designs in clinical research Genetics Association Studies Gene expression studies Designs for RNA-Seq
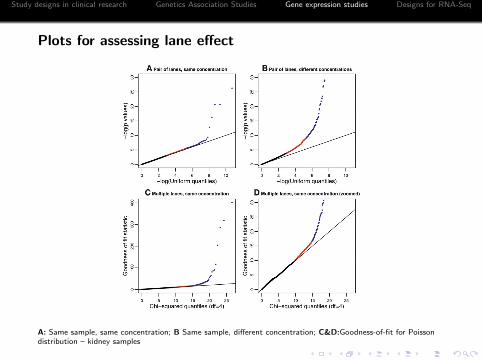
Plots for assessing lane effect
A: Same sample, same concentration; B Same sample, different concentration; C&D:Goodness-of-fit for Poissondistribution – kidney samples
Study designs in clinical research Genetics Association Studies Gene expression studies Designs for RNA-Seq
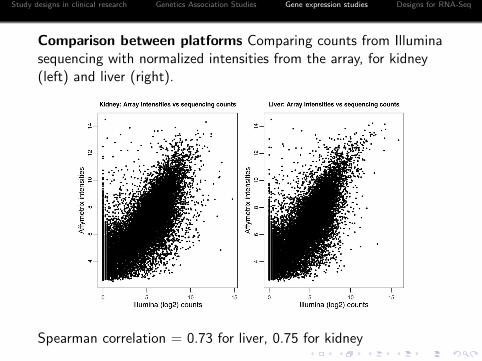
Comparison between platforms Comparing counts from Illuminasequencing with normalized intensities from the array, for kidney(left) and liver (right).
Spearman correlation = 0.73 for liver, 0.75 for kidney
Study designs in clinical research Genetics Association Studies Gene expression studies Designs for RNA-Seq
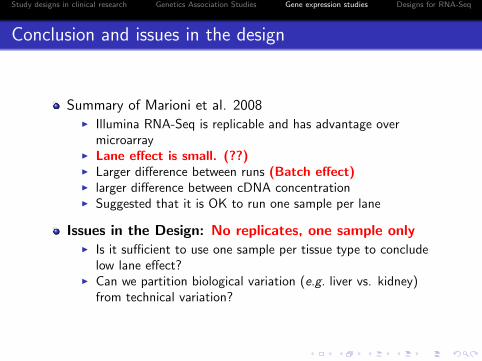
Conclusion and issues in the design
Summary of Marioni et al. 2008I Illumina RNA-Seq is replicable and has advantage over
microarrayI Lane effect is small. (??)I Larger difference between runs (Batch effect)I larger difference between cDNA concentrationI Suggested that it is OK to run one sample per lane
Issues in the Design: No replicates, one sample onlyI Is it sufficient to use one sample per tissue type to conclude
low lane effect?I Can we partition biological variation (e.g. liver vs. kidney)
from technical variation?
Study designs in clinical research Genetics Association Studies Gene expression studies Designs for RNA-Seq
Example II: McIntyre et al.3
3McIntyre et al. BMC Genomics 2011.
Study designs in clinical research Genetics Association Studies Gene expression studies Designs for RNA-Seq
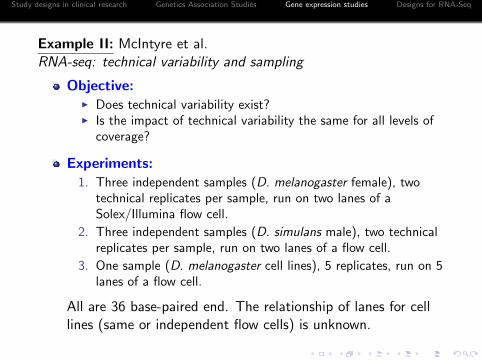
Example II: McIntyre et al.RNA-seq: technical variability and sampling
Objective:I Does technical variability exist?I Is the impact of technical variability the same for all levels of
coverage?
Experiments:1. Three independent samples (D. melanogaster female), two
technical replicates per sample, run on two lanes of aSolex/Illumina flow cell.
2. Three independent samples (D. simulans male), two technicalreplicates per sample, run on two lanes of a flow cell.
3. One sample (D. melanogaster cell lines), 5 replicates, run on 5lanes of a flow cell.
All are 36 base-paired end. The relationship of lanes for celllines (same or independent flow cells) is unknown.
Study designs in clinical research Genetics Association Studies Gene expression studies Designs for RNA-Seq
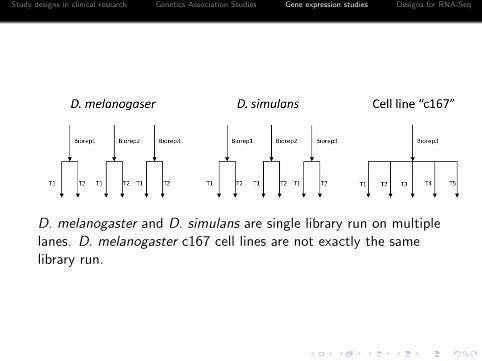
D. melanogaster and D. simulans are single library run on multiplelanes. D. melanogaster c167 cell lines are not exactly the samelibrary run.
Study designs in clinical research Genetics Association Studies Gene expression studies Designs for RNA-Seq
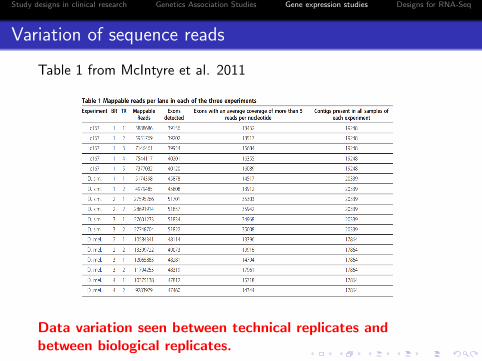
Variation of sequence reads
Table 1 from McIntyre et al. 2011
Data variation seen between technical replicates andbetween biological replicates.
Study designs in clinical research Genetics Association Studies Gene expression studies Designs for RNA-Seq
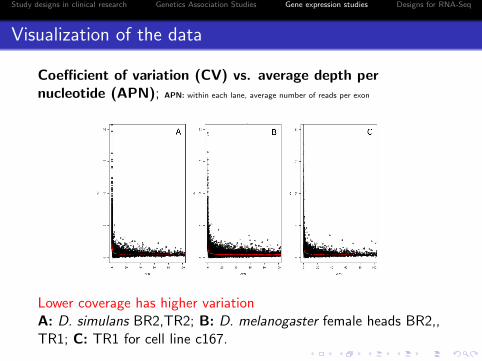
Visualization of the data
Coefficient of variation (CV) vs. average depth pernucleotide (APN); APN: within each lane, average number of reads per exon
Lower coverage has higher variationA: D. simulans BR2,TR2; B: D. melanogaster female heads BR2,,TR1; C: TR1 for cell line c167.
Study designs in clinical research Genetics Association Studies Gene expression studies Designs for RNA-Seq
Visualization of the data
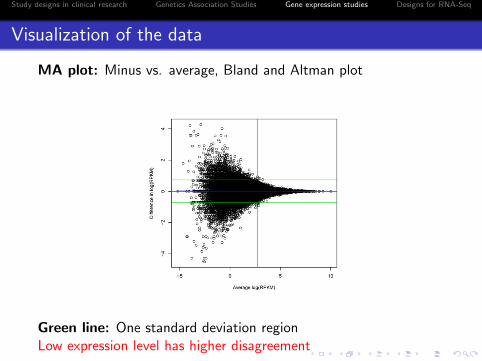
MA plot: Minus vs. average, Bland and Altman plot
Green line: One standard deviation regionLow expression level has higher disagreement
Study designs in clinical research Genetics Association Studies Gene expression studies Designs for RNA-Seq
Summary of McIntyre et al. 2011
Technical variation exits:I Mappable reads per lane various among the technical replicatesI Inconsistent detection of exons between technical replicates:
The number of exons detected increases with the number ofmappable reads.
I Agreement between technical replicates varies: kappa rangesfrom 0.63-0.81
I Higher variability for those with low coverage (< 5 reads pernucleotide) or low expression level
I Random sampling of total RNA reads (e.g. 0.0013% of 30millions reads) may contribute to the variability.
Biological variation is larger than technical variation.
Suggestion: Inclusion of technical replicates is as importantas biological replicates. Multiplexing design can eliminate thelane effect for a small experiment.
Study designs in clinical research Genetics Association Studies Gene expression studies Designs for RNA-Seq
Designs for RNA-Seq

Study designs in clinical research Genetics Association Studies Gene expression studies Designs for RNA-Seq
Designs for RNA-Seq
Reference paper:4
4Auer and Doerge, Genetics, 2010.
Study designs in clinical research Genetics Association Studies Gene expression studies Designs for RNA-Seq
Unreplicated data
Three levels of sampling in RNA-Seq:I Subject samplingI RNA samplingI Fragments sampling
Unreplicated data:I Mostly from observational studiesI In the case of RNA-Seq
I No biological replicatesI One sample per treatment group
Problem: This design can investigate only the differencesderived from RNA and fragment-level sampling, but notsubject sampling.
Study designs in clinical research Genetics Association Studies Gene expression studies Designs for RNA-Seq
More on sampling in RNA-Seq
Subject sampling: Subjects (e.g. organisms or individuals)are ideally drawn from a large population to which the resultscan be generalized.
RNA sampling: occurs during the experimental procedurewhen RNA is isolated from the cell(s).
Fragment sampling: Only certain fragmented RNAs areretained for amplification. The sequencing reads do notrepresent 100% of the fragements loaded into a flow cellresulted in fragment sampling.
Study designs in clinical research Genetics Association Studies Gene expression studies Designs for RNA-Seq
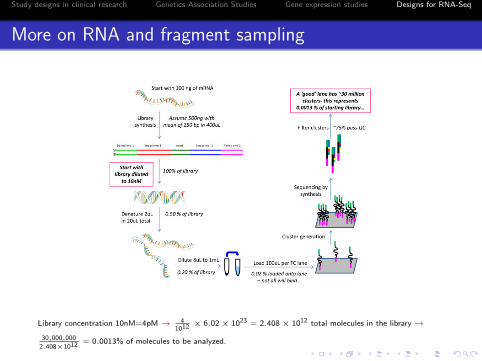
More on RNA and fragment sampling
Library concentration 10nM=4pM→ 41012 × 6.02× 1023 = 2.408× 10¹² total molecules in the library→
30,000,000
2.408×1012 = 0.0013% of molecules to be analyzed.
Study designs in clinical research Genetics Association Studies Gene expression studies Designs for RNA-Seq
Unreplicated data
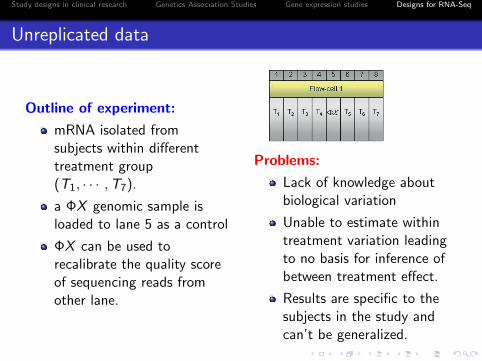
Outline of experiment:
mRNA isolated fromsubjects within differenttreatment group(T1, · · · ,T7).
a ΦX genomic sample isloaded to lane 5 as a control
ΦX can be used torecalibrate the quality scoreof sequencing reads fromother lane.
Problems:
Lack of knowledge aboutbiological variation
Unable to estimate withintreatment variation leadingto no basis for inference ofbetween treatment effect.
Results are specific to thesubjects in the study andcan’t be generalized.
Study designs in clinical research Genetics Association Studies Gene expression studies Designs for RNA-Seq
Replicated data: Multiple flow-cell design
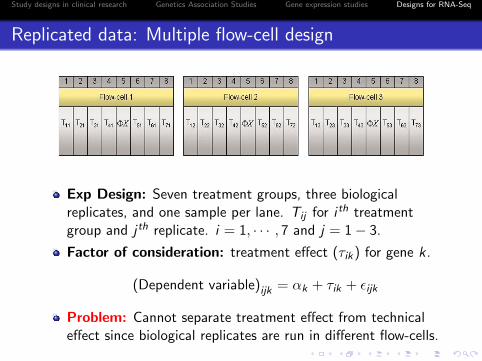
Exp Design: Seven treatment groups, three biologicalreplicates, and one sample per lane. Tij for i th treatmentgroup and j th replicate. i = 1, · · · , 7 and j = 1 − 3.
Factor of consideration: treatment effect (τik) for gene k .
(Dependent variable)ijk = αk + τik + εijk
Problem: Cannot separate treatment effect from technicaleffect since biological replicates are run in different flow-cells.
Study designs in clinical research Genetics Association Studies Gene expression studies Designs for RNA-Seq
Balanced block design
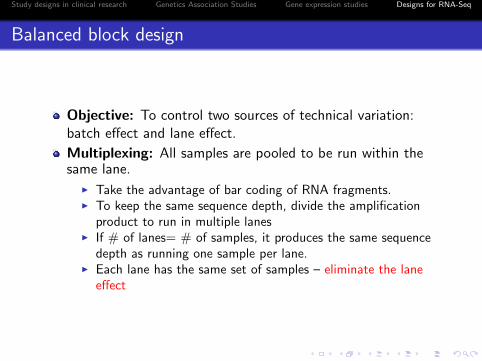
Objective: To control two sources of technical variation:batch effect and lane effect.
Multiplexing: All samples are pooled to be run within thesame lane.
I Take the advantage of bar coding of RNA fragments.I To keep the same sequence depth, divide the amplification
product to run in multiple lanesI If # of lanes= # of samples, it produces the same sequence
depth as running one sample per lane.I Each lane has the same set of samples – eliminate the lane
effect
Study designs in clinical research Genetics Association Studies Gene expression studies Designs for RNA-Seq
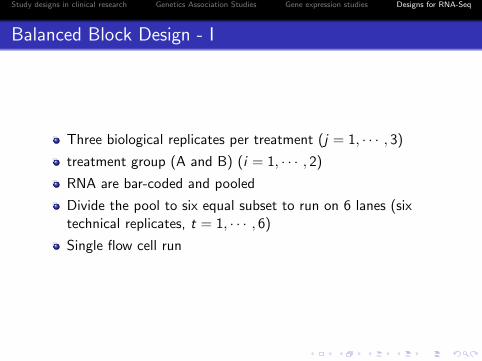
Balanced Block Design - I
Three biological replicates per treatment (j = 1, · · · , 3)
treatment group (A and B) (i = 1, · · · , 2)
RNA are bar-coded and pooled
Divide the pool to six equal subset to run on 6 lanes (sixtechnical replicates, t = 1, · · · , 6)
Single flow cell run
Study designs in clinical research Genetics Association Studies Gene expression studies Designs for RNA-Seq
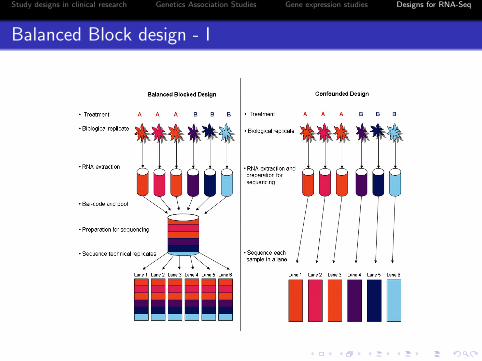
Balanced Block design - I
Study designs in clinical research Genetics Association Studies Gene expression studies Designs for RNA-Seq
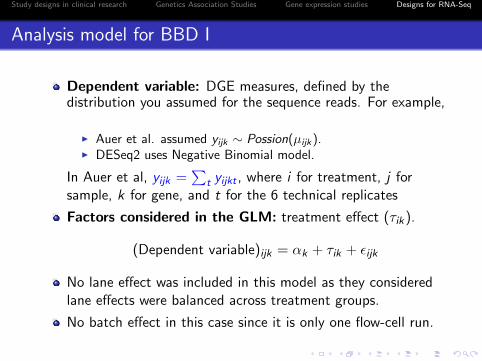
Analysis model for BBD I
Dependent variable: DGE measures, defined by thedistribution you assumed for the sequence reads. For example,
I Auer et al. assumed yijk ∼ Possion(µijk ).I DESeq2 uses Negative Binomial model.
In Auer et al, yijk =∑
t yijkt , where i for treatment, j forsample, k for gene, and t for the 6 technical replicates
Factors considered in the GLM: treatment effect (τik).
(Dependent variable)ijk = αk + τik + εijk
No lane effect was included in this model as they consideredlane effects were balanced across treatment groups.
No batch effect in this case since it is only one flow-cell run.
Study designs in clinical research Genetics Association Studies Gene expression studies Designs for RNA-Seq
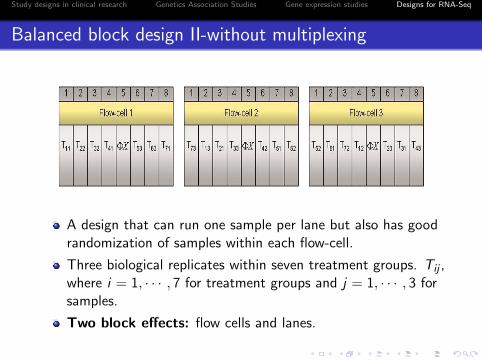
Balanced block design II-without multiplexing
A design that can run one sample per lane but also has goodrandomization of samples within each flow-cell.
Three biological replicates within seven treatment groups. Tij ,where i = 1, · · · , 7 for treatment groups and j = 1, · · · , 3 forsamples.
Two block effects: flow cells and lanes.
Study designs in clinical research Genetics Association Studies Gene expression studies Designs for RNA-Seq
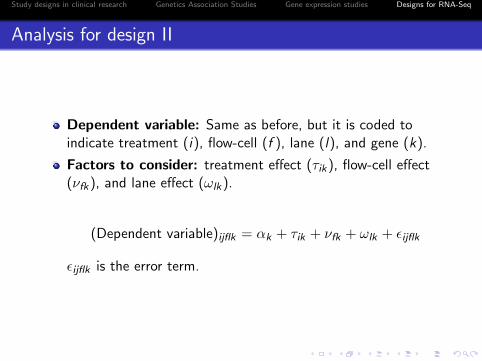
Analysis for design II
Dependent variable: Same as before, but it is coded toindicate treatment (i), flow-cell (f ), lane (l), and gene (k).
Factors to consider: treatment effect (τik), flow-cell effect(νfk ), and lane effect (ωlk).
(Dependent variable)ijflk = αk + τik + νfk + ωlk + εijflk
εijflk is the error term.
Study designs in clinical research Genetics Association Studies Gene expression studies Designs for RNA-Seq
Summary for Balanced block design
The feature of unique bar-code for RNA fragments inRNA-Seq makes blocking design possible.
Can control batch and lane effects
Multiplex design illustrated here requires the number of uniquebar-codes equal or greater than the samples in each lane.
Study designs in clinical research Genetics Association Studies Gene expression studies Designs for RNA-Seq
Balanced incomplete block design (BIBD)
Assume:
number of treatment (I )
number of biological replicates per treatment (J)
number of unique barcodes (s) that can be included in onelane
number of lanes available for sequencing (L)
If the number of unique bar codes (s) in one lane is less than thenumber of treatments (s < I ), balanced block design is impossible.
Study designs in clinical research Genetics Association Studies Gene expression studies Designs for RNA-Seq
BIBD
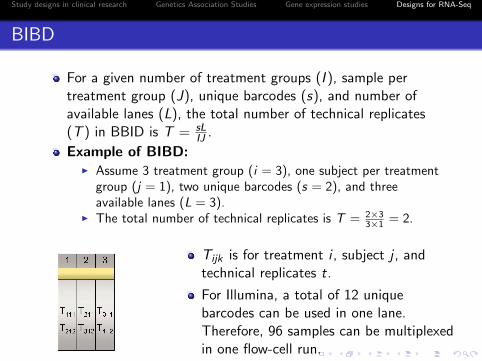
For a given number of treatment groups (I ), sample pertreatment group (J), unique barcodes (s), and number ofavailable lanes (L), the total number of technical replicates(T ) in BBID is T = sL
IJ .
Example of BIBD:I Assume 3 treatment group (i = 3), one subject per treatment
group (j = 1), two unique barcodes (s = 2), and threeavailable lanes (L = 3).
I The total number of technical replicates is T = 2×33×1 = 2.
Tijk is for treatment i , subject j , andtechnical replicates t.
For Illumina, a total of 12 uniquebarcodes can be used in one lane.Therefore, 96 samples can be multiplexedin one flow-cell run.
Study designs in clinical research Genetics Association Studies Gene expression studies Designs for RNA-Seq
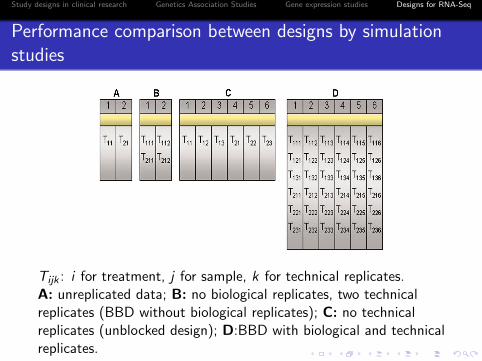
Performance comparison between designs by simulationstudies
Tijk : i for treatment, j for sample, k for technical replicates.A: unreplicated data; B: no biological replicates, two technicalreplicates (BBD without biological replicates); C: no technicalreplicates (unblocked design); D:BBD with biological and technicalreplicates.
Study designs in clinical research Genetics Association Studies Gene expression studies Designs for RNA-Seq
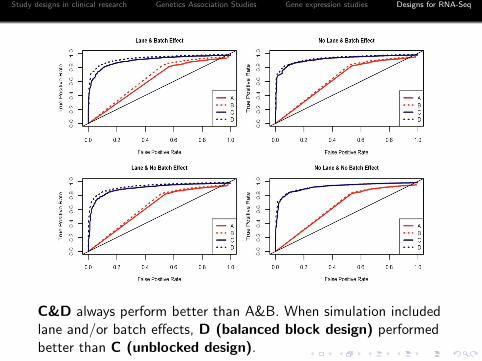
C&D always perform better than A&B. When simulation includedlane and/or batch effects, D (balanced block design) performedbetter than C (unblocked design).
Study designs in clinical research Genetics Association Studies Gene expression studies Designs for RNA-Seq
Summary
The classical principals of experimental design still apply toRNA-Seq
Technical variation exists and should be taken into account.I Lane effect, batch effect
RNA-Seq data consist of variation from subject sampling,RNA sampling, RNA fragment sampling
Multiplexing in NGS allow us to implement randomization andblocking.
Take advantages of visualization tools (e.g. scatter plots, MAplots, QQ plots) to learn your data.
When you deal with human data for genetic study, make sureexamining the effect of population structure.