Embed Size (px)
Citation preview

Brown, Callahan 1
Design of a Truss Structure for a Pedestrian Bridge
ENGR 0135 Design Project 2
April 15, 2016
Professor Patrick Smolinski
Hannah Brown
Ian Callahan
Brown, Callahan 2
Design of a Truss Structure for a Pedestrian Bridge Hannah Brown ( [email protected] ), Ian Callahan ( [email protected] )
Abstract
In this design project, two different designs were analyzed to create a 30 ft.long pedestrian bridge; the Howe Truss and the Pratt Truss were chosen for this design. The constraints for the design were as follows: the structure must be able to hold a maximum weight of 20,000 lb, the structure must be able to fit 10 ft.wide pallets, the design must hold a certain factor of safety (4 for compressive forces, 2 for tensional forces), and a less than 1% deformation of the members.
The same general method was used for both design structures. It was determined that the maximum compressive and tensile forces on each pin occur when the weight of one whole pallet was placed on a single pin. Thus, putting all the forces in terms of the applied loads, the maximum compressive and tensile forces could be calculated from different loading cases on each pin. From determining the compressive and tensile forces for each member given the different cases of applied forces, a maximum compressive and maximum tensile force can be determined for each member.
After the maximum compressive and tensile forces are determined for each member, the area of each member can be calculated from the given elastic strength and factors of safety. Between the area for the compressive force and the area for the tensile force for each member, the maximum area will be chosen as the minimum area for each individual member.
From determining the minimum area for each member, a type of beam can be chosen from tables A1 to A14, depending on which beams have the most similar areas to the maximum areas previously calculated. These tables provide the type, size, area, length, and weight of each beam. After choosing the beam, the weight and length of each member can be determined. From these calculations, the total deformation of each member can be determined, being sure to keep the percent deformation within 1%. From the weight, we can find the total cost of the truss structures.
Introduction
The purpose of this design project was to design a truss system that can be used for a 30 ft.long pedestrian bridge. The design of the structure is required to hold a maximum weight of 20,000 lb of building supplies; these supplies will be loaded onto the bridge via 10 ft.wide pallets. In order to take into account multiple different loading cases, the pins on the bridge must be able to support a certain maximum weight based on the force applied by the pallets. The weight of the bridge is assumed to be negligible. The main goal is to minimize material cost while also keeping a high factor of safety (4 and 2 for compressive and tensional forces
Brown, Callahan 3
respectively), as well as less than 1% member deformation. We were given the following information about the members:
Material Elastic Modulus (1000 ksi)
Elastic Strength (ksi)
Specific Weight (lb/in^3)
Cost ($/lb)
1018 Steel 29.0 36 0.284 1.05
The two designs analyzed in this report are the Pratt Truss and the Howe Truss.
Methods Pratt Truss
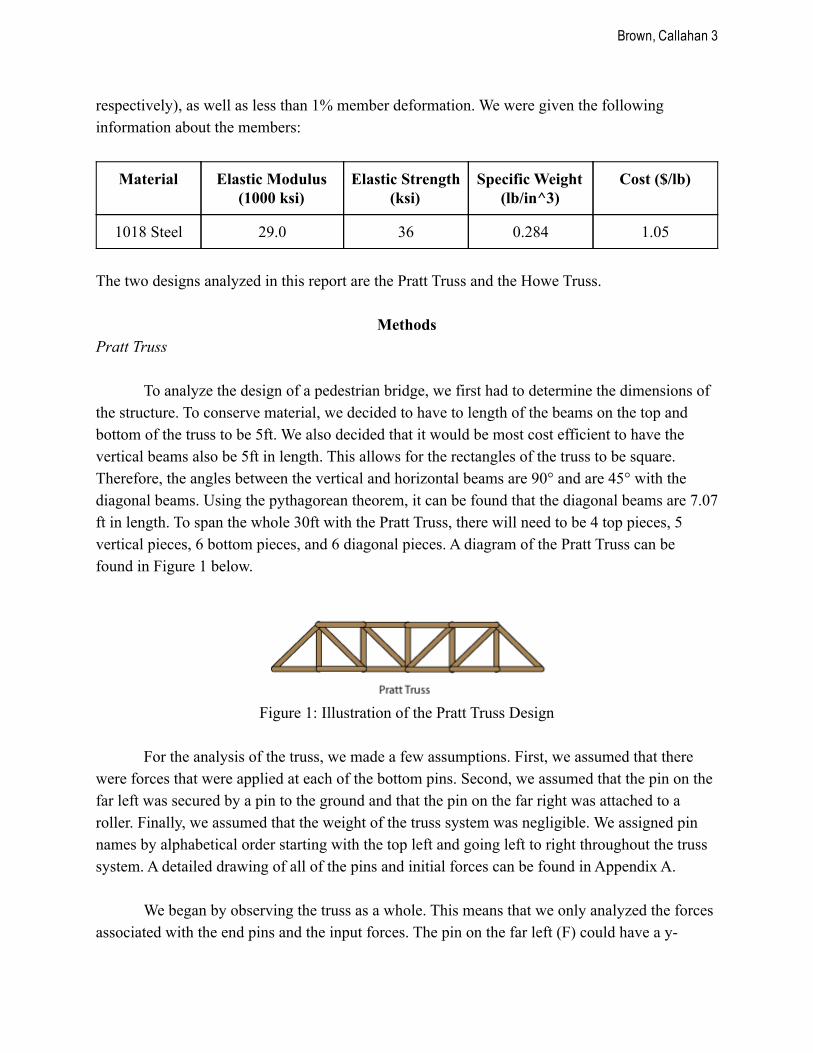
To analyze the design of a pedestrian bridge, we first had to determine the dimensions of the structure. To conserve material, we decided to have to length of the beams on the top and bottom of the truss to be 5ft. We also decided that it would be most cost efficient to have the vertical beams also be 5ft in length. This allows for the rectangles of the truss to be square. Therefore, the angles between the vertical and horizontal beams are 90° and are 45° with the diagonal beams. Using the pythagorean theorem, it can be found that the diagonal beams are 7.07 ft in length. To span the whole 30ft with the Pratt Truss, there will need to be 4 top pieces, 5 vertical pieces, 6 bottom pieces, and 6 diagonal pieces. A diagram of the Pratt Truss can be found in Figure 1 below.
Figure 1: Illustration of the Pratt Truss Design
For the analysis of the truss, we made a few assumptions. First, we assumed that there
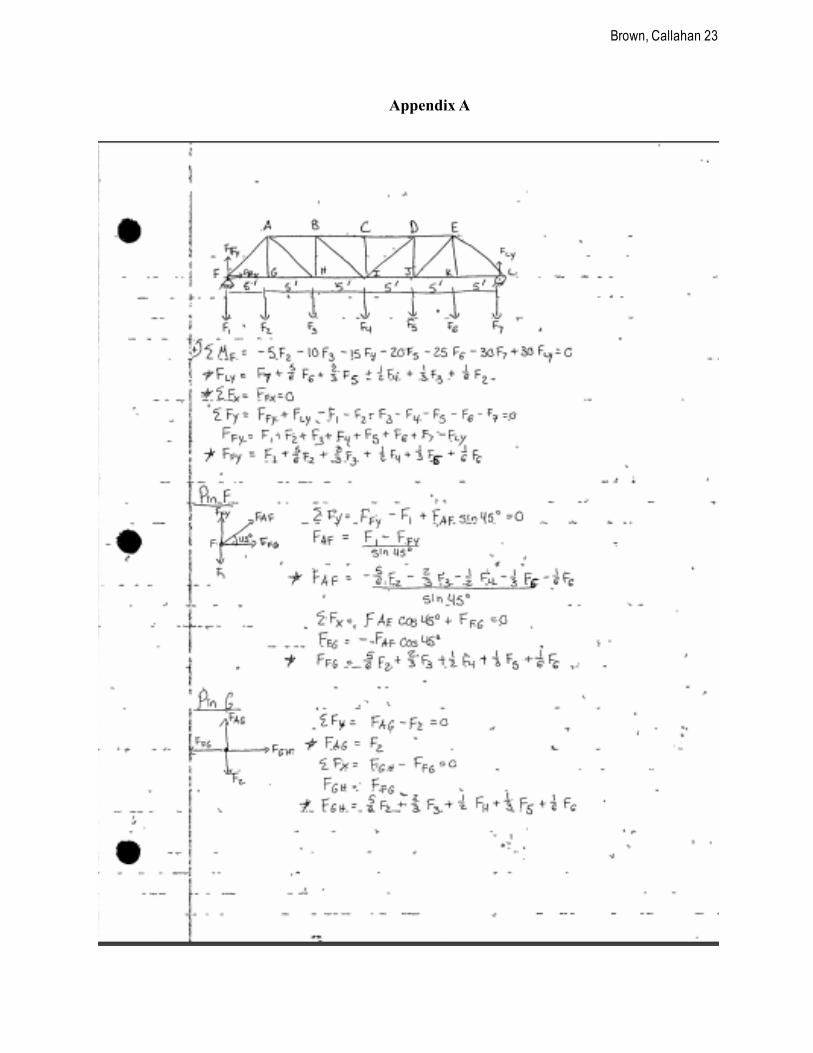
were forces that were applied at each of the bottom pins. Second, we assumed that the pin on the far left was secured by a pin to the ground and that the pin on the far right was attached to a roller. Finally, we assumed that the weight of the truss system was negligible. We assigned pin names by alphabetical order starting with the top left and going left to right throughout the truss system. A detailed drawing of all of the pins and initial forces can be found in Appendix A.
We began by observing the truss as a whole. This means that we only analyzed the forces associated with the end pins and the input forces. The pin on the far left (F) could have a y
Brown, Callahan 4
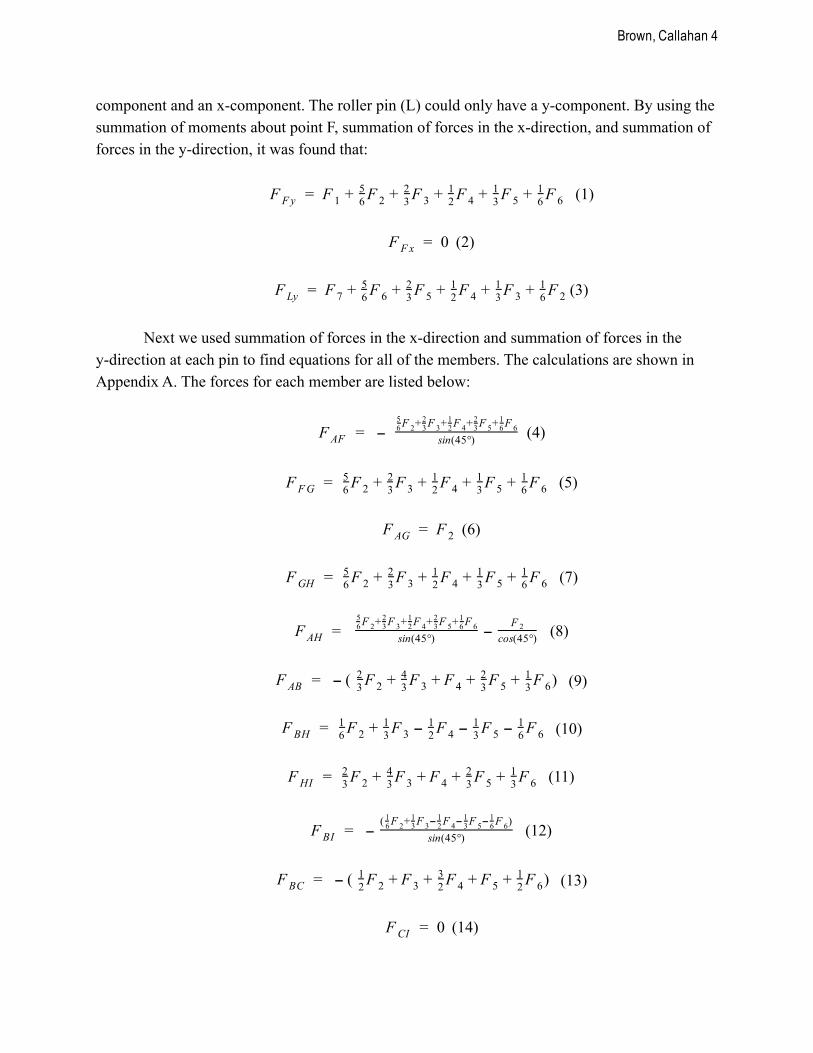
component and an xcomponent. The roller pin (L) could only have a ycomponent. By using the summation of moments about point F, summation of forces in the xdirection, and summation of forces in the ydirection, it was found that:
(1) F F F F F FF Fy = 1 + 6
52 + 3
23 + 2
14 + 3
15 + 6
16
(2) 0 F Fx =
(3) F F F F F FF Ly = 7 + 6
56 + 3
25 + 2
14 + 3
13 + 6
12
Next we used summation of forces in the xdirection and summation of forces in the
ydirection at each pin to find equations for all of the members. The calculations are shown in Appendix A. The forces for each member are listed below:
(4) F AF = − sin(45°)F + F + F + F + F6
52 3
23 2
14 3
25 6
16
(5) F F F F FF FG = 6
52 + 3
23 + 2
14 + 3
15 + 6
16
(6) F F AG = 2
(7) F F F F FFGH = 6
52 + 3
23 + 2
14 + 3
15 + 6
16
(8) F AH = sin(45°)F + F + F + F + F6
52 3
23 2
14 3
25 6
16 −
F 2cos(45°)
(9) F F F F ) F AB = − ( 3
22 + 3
43 + F 4 + 3
25 + 3
16
(10) F F F F F F BH = 6
12 + 3
13 − 2
14 − 3
15 − 6
16
(11) F F F FFHI = 3
22 + 3
43 + F 4 + 3
25 + 3
16
(12) F BI = − sin(45°)( F + F F F F )61
2 31
3− 21
4− 31
5− 61
6
(13) F F F ) F BC = − ( 2
12 + F 3 + 2
34 + F 5 + 2
16
(14) 0 FCI =
Brown, Callahan 5
(15) F F F ) FCD = − ( 2
12 + F 3 + 2
34 + F 5 + 2
16
(16) F BI = sin(45°)F + F + F F F6
12 3
13 2
14− 3
15− 6
16
(17) F F F FF IJ = 3
12 + 3
23 + F 4 + 3
45 + 3
26
(18) F F F F F FDJ = − 6
12 − 3
13 − 2
14 + 3
15 + 6
16
(19) F F F F ) FDE = − ( 3
12 + 3
23 + F 4 + 3
45 + 3
26
(20) F EJ = sin(45°)F + F + F + F F6
12 3
13 2
14 3
25− 6
16
(21) F F F F FF JK = 6
12 + 3
13 + 2
14 + 3
25 + 6
56
(22) F F EK = 6
(23) F F F F FFKL = 6
12 + 3
13 + 2
14 + 3
25 + 6
56
(24) F EL = − cos(45°)( F + F + F + F + F )61
2 31
3 21
4 32
5 65
6
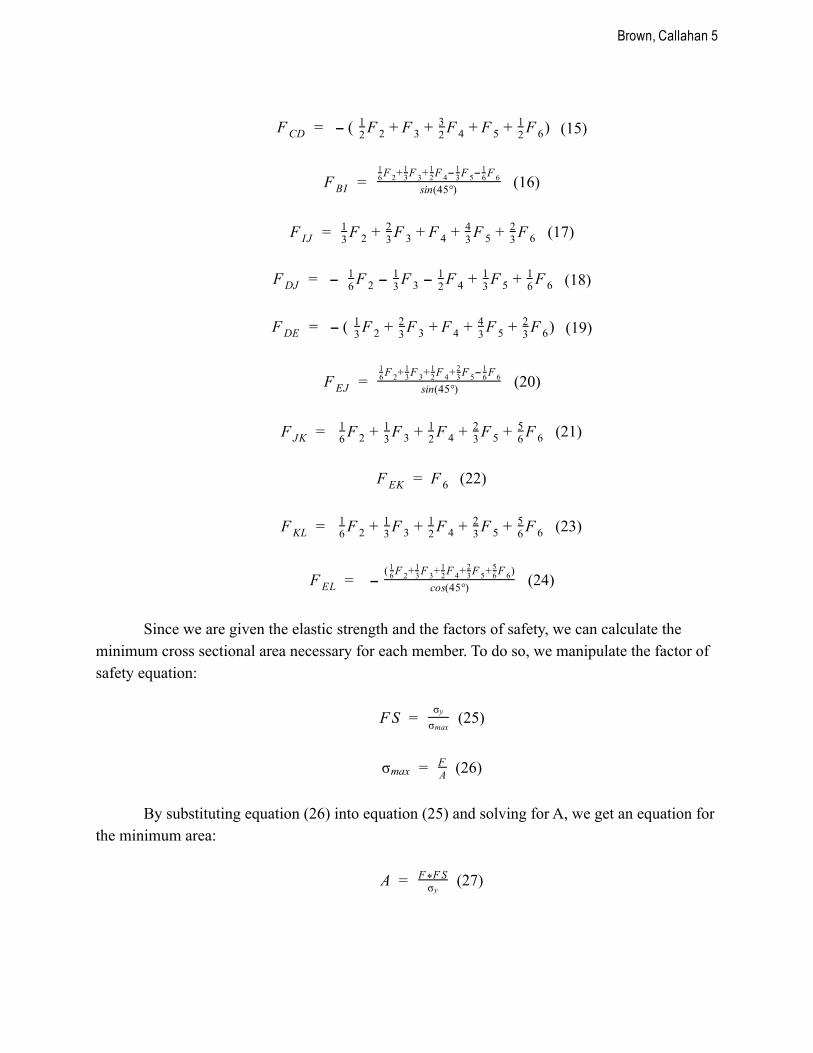
Since we are given the elastic strength and the factors of safety, we can calculate the
minimum cross sectional area necessary for each member. To do so, we manipulate the factor of safety equation:
(25)S F = σy
σmax
(26) σmax = AF
By substituting equation (26) into equation (25) and solving for A, we get an equation for the minimum area:
(27) A = σy
F FS*
Brown, Callahan 6
To solve for the area, we found the highest compressive force and highest tensional force and compared the area they produced. Whichever produced the highest cross sectional area determines the minimum area that was used for that member. We compared this area value with the types, sizes, areas, weights and lengths section in Tables A1 through A14 in the back of the textbook. We selected a type of beam that meets the design requirements and calculate the weight of the beam by multiplying the cross sectional area, length and specific weight:
(28) A W = * L *W s
With the weight of each member, we can calculate the total cost. We can find the cost by
adding all of the weights together and multiplying it by the cost per pound:
(29)ost W C = Total * Costpound
To verify that the design would meet the design specifications, we calculated the
deformation of each member by using the maximum compressive and tensional forces calculated and the cross sectional area previously determined. We then found the percentage of the deformation by dividing the deformation by the length, and multiplying by 100%:
(30) δ stress = AE
FL
(31)ercentage 00%P = δL * 1
Howe Truss
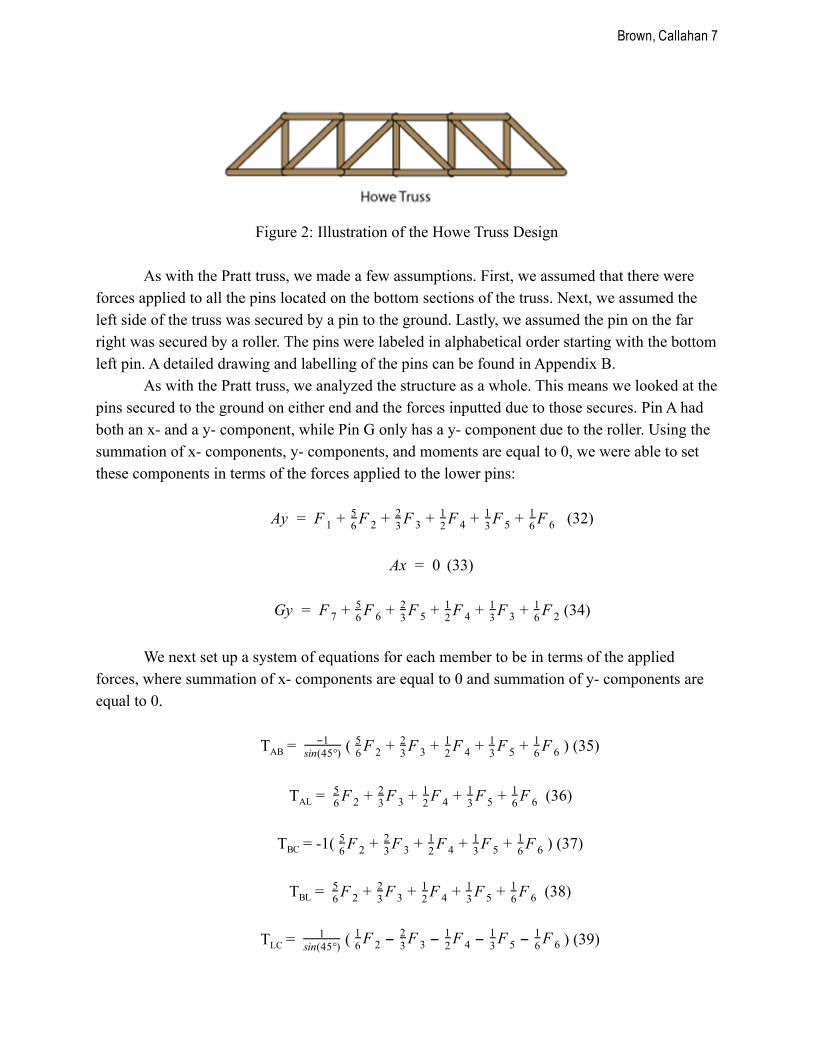
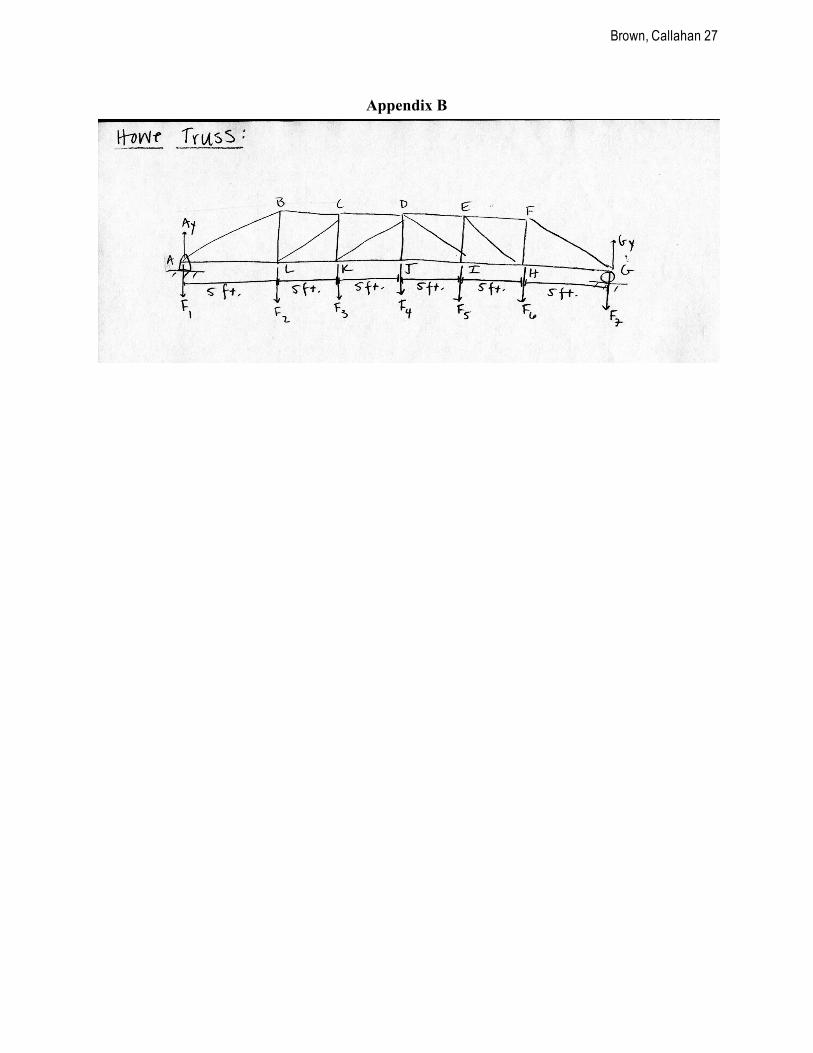
We began analyzing the design of the pedestrian bridge by determining the dimensions of the truss structure. Since the length of the bridge was previously determined to be 30 feet, the bridge was split into 6 different 5feet long sections. The height of each section was also determined to be 5 feet. The sections were split up into 4 5 ft. x 5 ft. squares and two triangles surrounding the outer squares, again 5 feet long and 5 feet tall. In a typical Howe truss design, there is one diagonal in each square. This creates triangles within the squares as well as the surrounding edge triangles that have 45°, 45°, 90° angles. Using the pythagorean theorem, the diagonal of each triangle can be determined to be 7.07 feet. This creates a total of 4 top pieces, 6 bottom pieces, and 6 diagonals.
Brown, Callahan 7
Figure 2: Illustration of the Howe Truss Design
As with the Pratt truss, we made a few assumptions. First, we assumed that there were
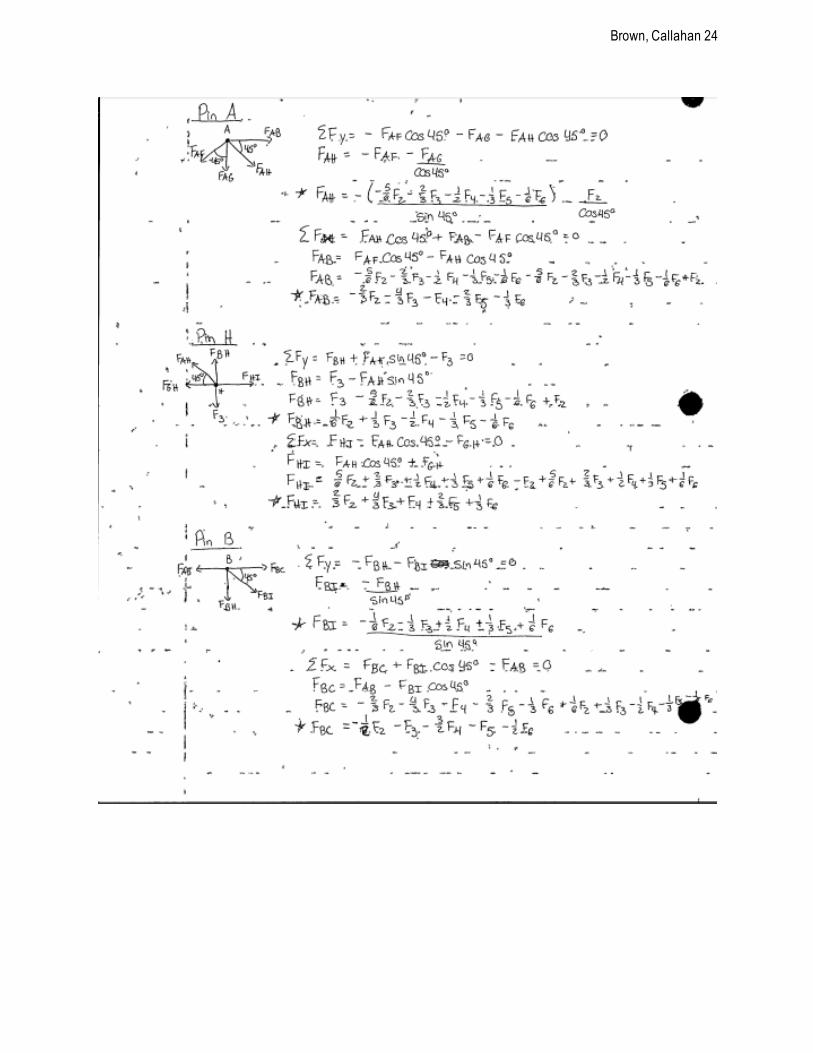
forces applied to all the pins located on the bottom sections of the truss. Next, we assumed the left side of the truss was secured by a pin to the ground. Lastly, we assumed the pin on the far right was secured by a roller. The pins were labeled in alphabetical order starting with the bottom left pin. A detailed drawing and labelling of the pins can be found in Appendix B.
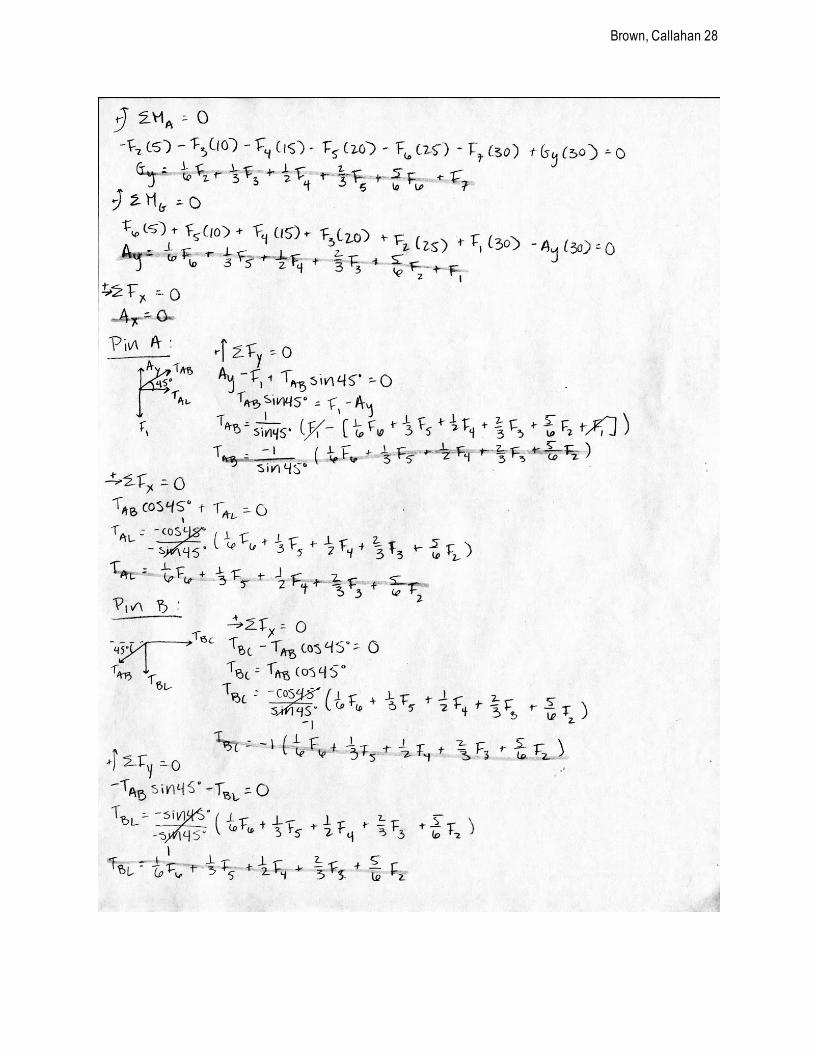
As with the Pratt truss, we analyzed the structure as a whole. This means we looked at the pins secured to the ground on either end and the forces inputted due to those secures. Pin A had both an x and a y component, while Pin G only has a y component due to the roller. Using the summation of x components, y components, and moments are equal to 0, we were able to set these components in terms of the forces applied to the lower pins:
(32)y F F F F F FA = 1 + 6
52 + 3
23 + 2
14 + 3
15 + 6
16
(33)x 0 A =
(34)y F F F F F FG = 7 + 6
56 + 3
25 + 2
14 + 3
13 + 6
12
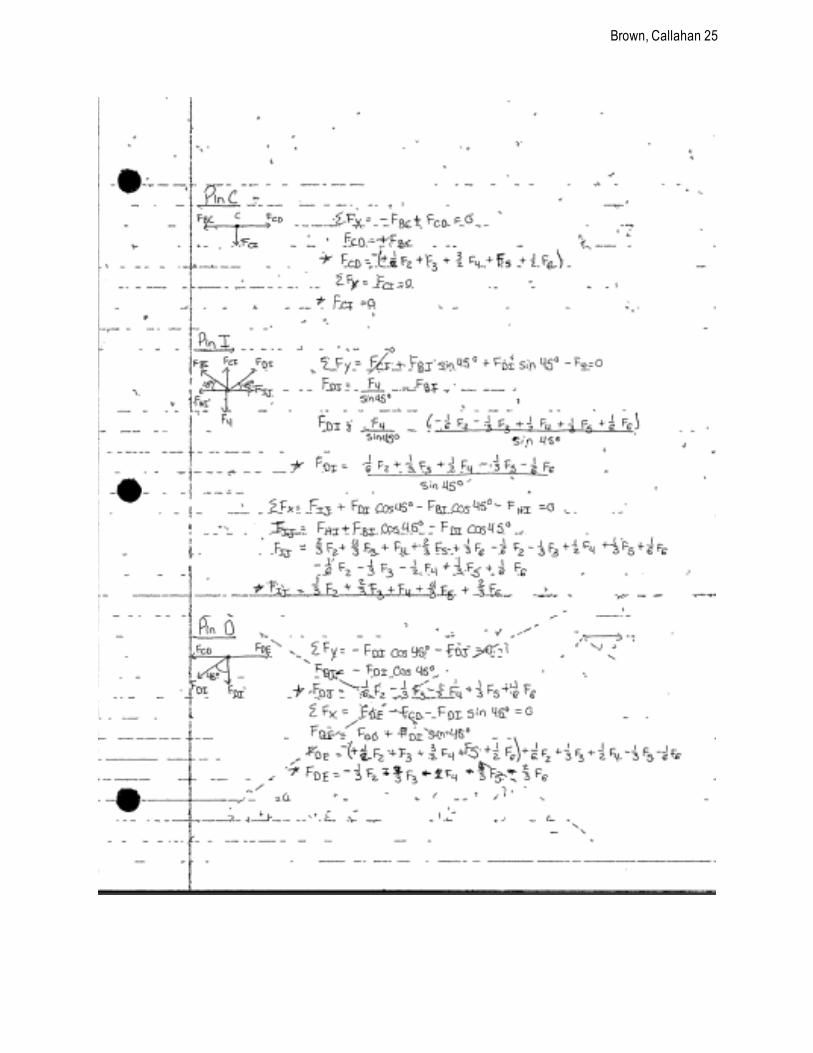
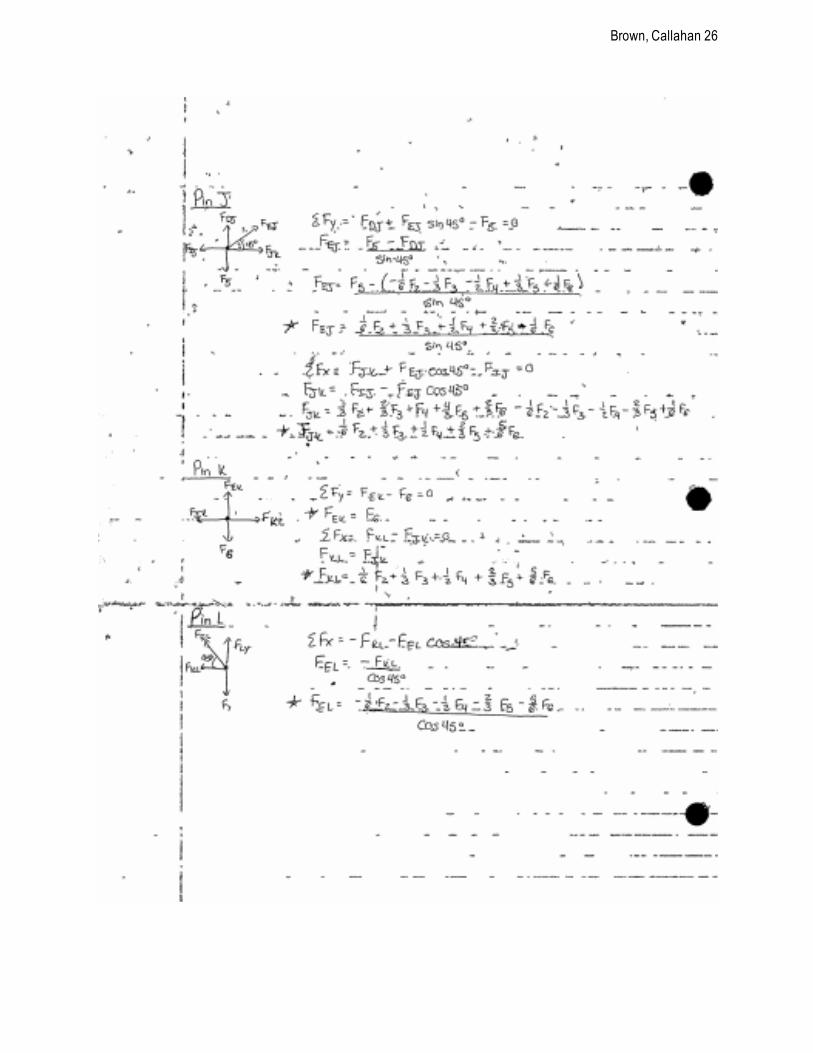
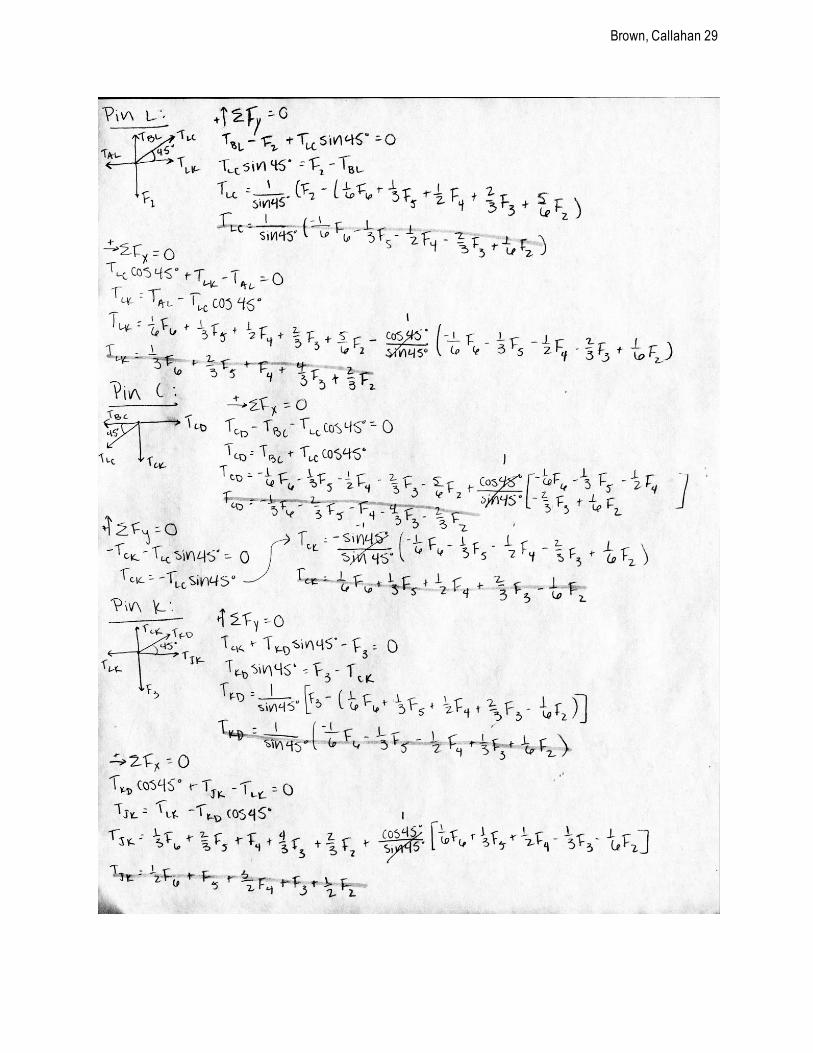
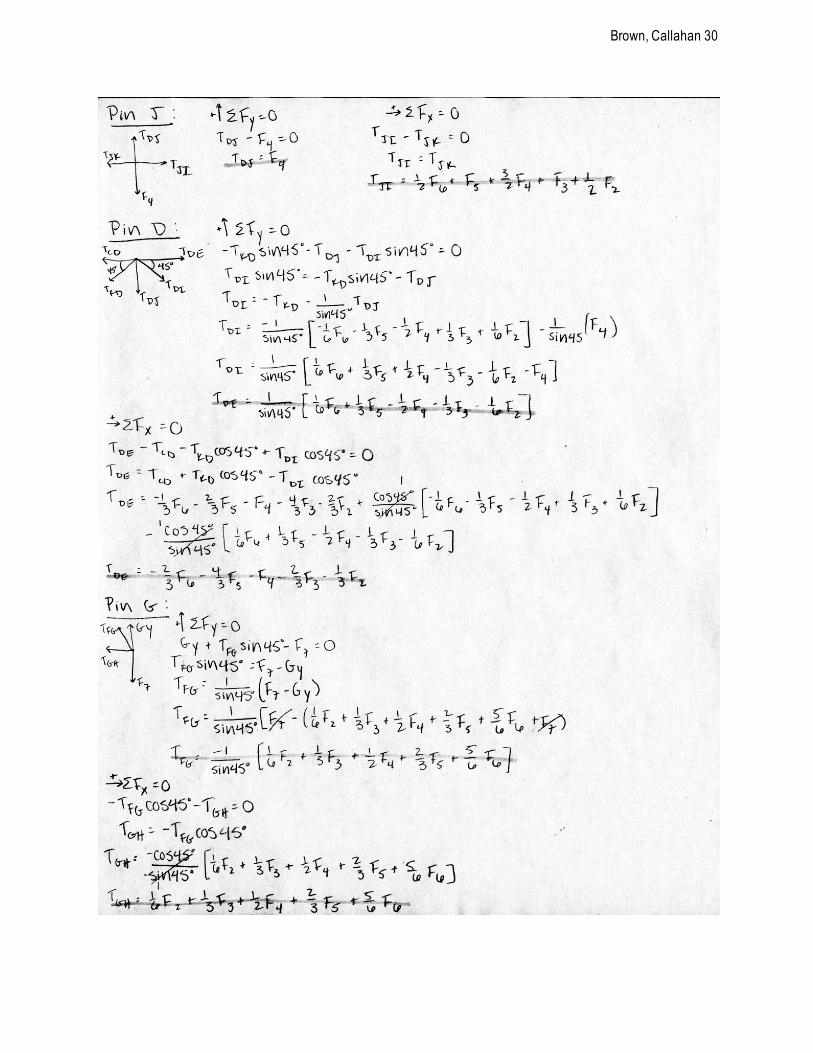
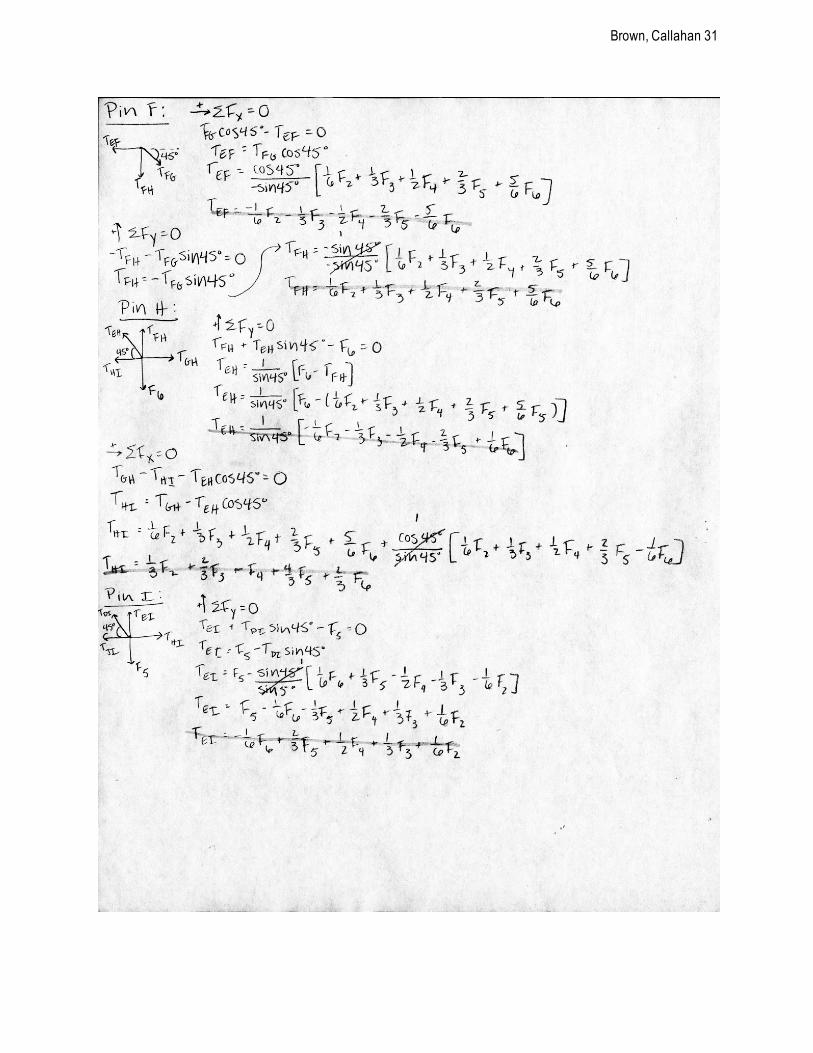
We next set up a system of equations for each member to be in terms of the applied
forces, where summation of x components are equal to 0 and summation of y components are equal to 0.
T AB = ( ) (35)1−
sin(45°) F F F F F65
2 + 32
3 + 21
4 + 31
5 + 61
6
T AL = (36)F F F F F6
52 + 3
23 + 2
14 + 3
15 + 6
16
T BC = 1( ) (37)F F F F F6
52 + 3
23 + 2
14 + 3
15 + 6
16
T BL = (38)F F F F F6
52 + 3
23 + 2
14 + 3
15 + 6
16
T LC = ( ) (39)1
sin(45°) F F F F F 61
2 − 32
3 − 21
4 − 31
5 − 61
6
Brown, Callahan 8
T LK = (40)F F F F3
22 + 3
43 + F 4 + 3
25 + 3
16
T CD = (41)F F F F 3
22 − 3
43 − F 4 − 3
25 − 3
16
T CK = (42)F F F F F6
1−2 + 3
23 + 2
14 + 3
15 + 6
16
T KD = ( ) (43)1
sin(45°) F F F F F 61
2 + 31
3 − 21
4 − 31
5 − 61
6
T JK = (44)F F F2
12 + F 3 + 2
34 + F 5 + 2
16
T DJ = (45)F 4
T JI = (46)F F F2
12 + F 3 + 2
34 + F 5 + 2
16
T DI = ( ) (47)1
sin(45°) F F F F F 61−
2 − 31
3 − 21
4 + 31
5 + 61
6
T DE = (48)F F F F 3
1−2 − 3
23 − F 4 − 3
45 − 3
26
T FG = ( ) (49)1−
sin(45°) F F F F F61
2 + 31
3 + 21
4 + 32
5 + 65
6
T GH = (50)F F F F F6
12 + 3
13 + 2
14 + 3
25 + 6
56
T EF = (51)F F F F F 6
1−2 − 3
13 − 2
14 − 3
25 − 6
56
T FH = (52)F F F F F6
12 + 3
13 + 2
14 + 3
25 + 6
56
T EH = ( ) (53)1
sin(45°) F F F F F 61−
2 − 31
3 − 21
4 − 32
5 + 61
6
T HI = (54)F F F F3
12 + 3
23 + F 4 + 3
45 + 3
26
T EI = (55)F F F F F 6
12 + 3
13 + 2
14 + 3
25 − 6
16
Given the elastic strength and factors of safety, we determined the minimum cross
sectional area from manipulating the equation for factor of safety:
Brown, Callahan 9
(56)S F = σyσmax
(57). σmax = AF
Using substitution of (57) into (56), we can solve for the area:
(58). A = σyF FS*
To determine the area for each member, the highest compressive and highest tensile
forces for each member was plugged into Equation (58), and the larger area between the two was chosen as the minimum area for that specific member. Areas equal to or larger than these values were chosen from the Tables A1 through A14 in the back of the textbook. The type, size, length, weight, and area were all found through these tables. Based on the weight of the beam chosen, the weight of each member could then be determined using:
(59). A W = * L *W s
Once the weight of each member was determined, the total weight of the truss can be
determined from the summation of all the members’ weights. The total cost of the truss structure can then be determined using:
(60).ost W C = Total * Costpound
To be certain that the structure is within the deformation limit of 1% its original length,
the maximum compressive and tensile forces of each member can be plugged into Equation (61). The percent deformation can then be found using Equation (62):
(61) δ stress = AE
FL
(62).ercentage 00%P = δL * 1
Calculations
Pratt Truss
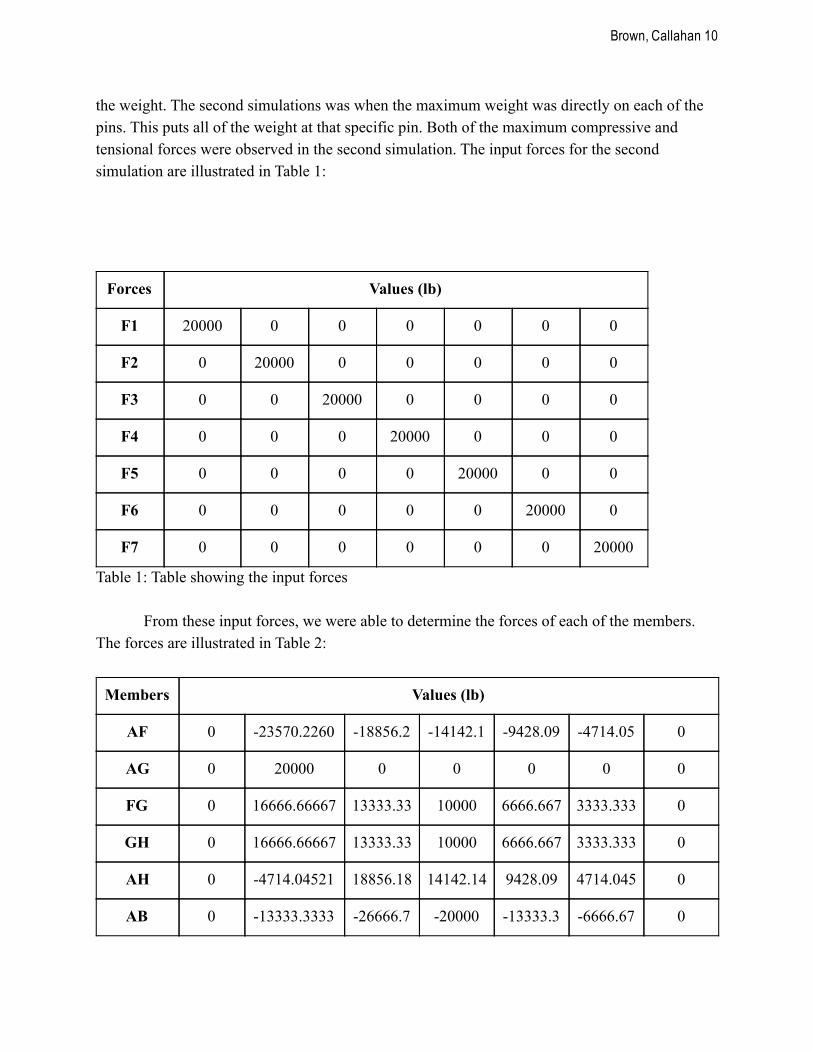
With all of the equations generated, we began to run calculations by inputting data into the input forces. We ran two different simulations. The first was when the maximum weight is placed in between two pins. Since the pins are 5ft apart, the neighboring pins will equally split
Brown, Callahan 10
the weight. The second simulations was when the maximum weight was directly on each of the pins. This puts all of the weight at that specific pin. Both of the maximum compressive and tensional forces were observed in the second simulation. The input forces for the second simulation are illustrated in Table 1:
Forces Values (lb)
F1 20000 0 0 0 0 0 0
F2 0 20000 0 0 0 0 0
F3 0 0 20000 0 0 0 0
F4 0 0 0 20000 0 0 0
F5 0 0 0 0 20000 0 0
F6 0 0 0 0 0 20000 0
F7 0 0 0 0 0 0 20000
Table 1: Table showing the input forces
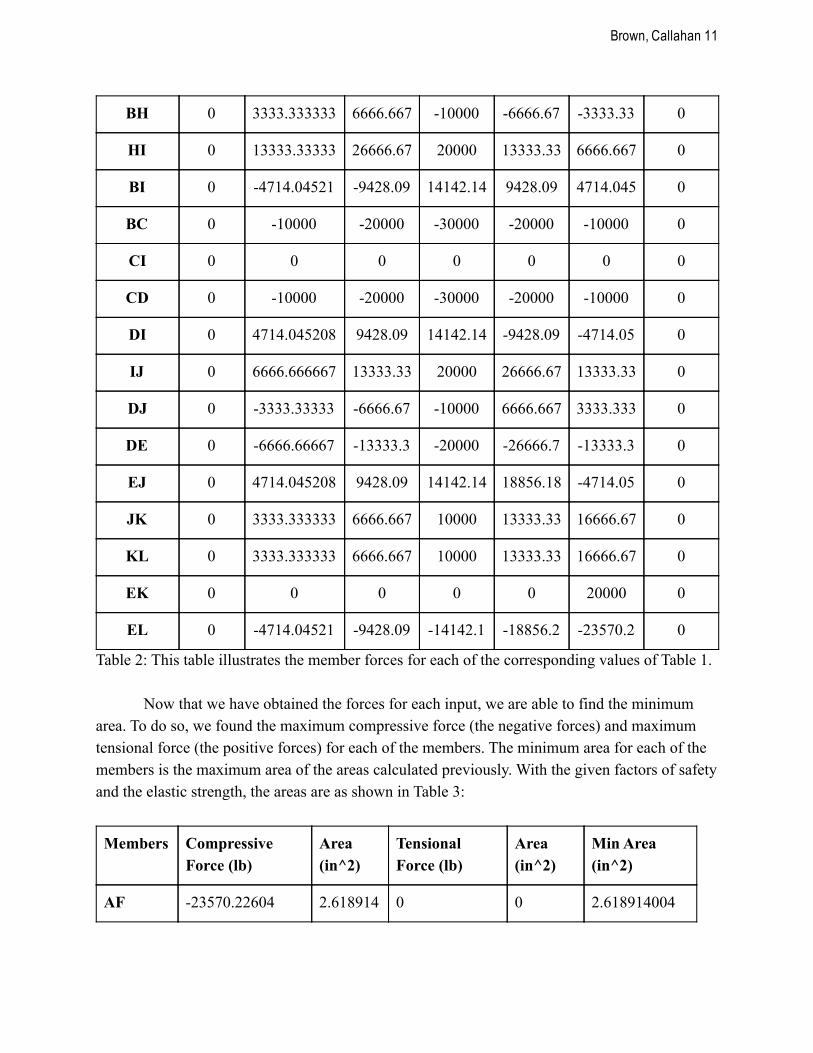
From these input forces, we were able to determine the forces of each of the members. The forces are illustrated in Table 2:
Members Values (lb)
AF 0 23570.2260 18856.2 14142.1 9428.09 4714.05 0
AG 0 20000 0 0 0 0 0
FG 0 16666.66667 13333.33 10000 6666.667 3333.333 0
GH 0 16666.66667 13333.33 10000 6666.667 3333.333 0
AH 0 4714.04521 18856.18 14142.14 9428.09 4714.045 0
AB 0 13333.3333 26666.7 20000 13333.3 6666.67 0
Brown, Callahan 11
BH 0 3333.333333 6666.667 10000 6666.67 3333.33 0
HI 0 13333.33333 26666.67 20000 13333.33 6666.667 0
BI 0 4714.04521 9428.09 14142.14 9428.09 4714.045 0
BC 0 10000 20000 30000 20000 10000 0
CI 0 0 0 0 0 0 0
CD 0 10000 20000 30000 20000 10000 0
DI 0 4714.045208 9428.09 14142.14 9428.09 4714.05 0
IJ 0 6666.666667 13333.33 20000 26666.67 13333.33 0
DJ 0 3333.33333 6666.67 10000 6666.667 3333.333 0
DE 0 6666.66667 13333.3 20000 26666.7 13333.3 0
EJ 0 4714.045208 9428.09 14142.14 18856.18 4714.05 0
JK 0 3333.333333 6666.667 10000 13333.33 16666.67 0
KL 0 3333.333333 6666.667 10000 13333.33 16666.67 0
EK 0 0 0 0 0 20000 0
EL 0 4714.04521 9428.09 14142.1 18856.2 23570.2 0
Table 2: This table illustrates the member forces for each of the corresponding values of Table 1.
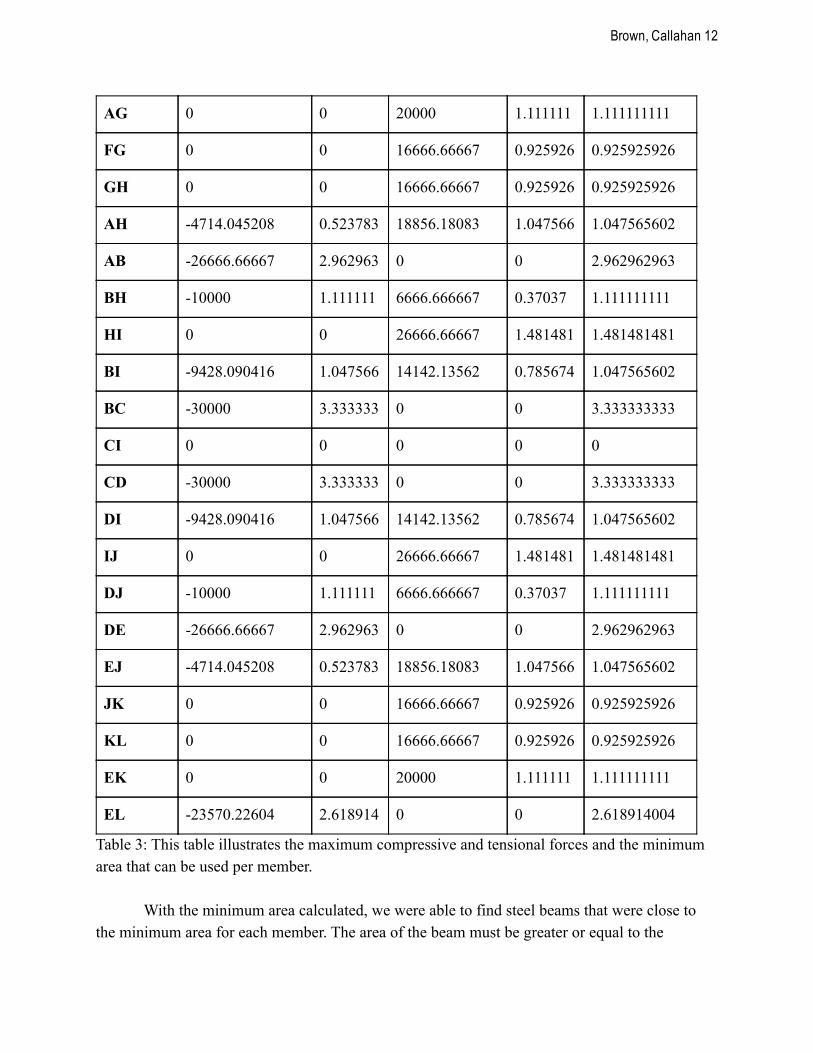
Now that we have obtained the forces for each input, we are able to find the minimum area. To do so, we found the maximum compressive force (the negative forces) and maximum tensional force (the positive forces) for each of the members. The minimum area for each of the members is the maximum area of the areas calculated previously. With the given factors of safety and the elastic strength, the areas are as shown in Table 3:
Members Compressive Force (lb)
Area (in^2)
Tensional Force (lb)
Area (in^2)
Min Area (in^2)
AF 23570.22604 2.618914 0 0 2.618914004
Brown, Callahan 12
AG 0 0 20000 1.111111 1.111111111
FG 0 0 16666.66667 0.925926 0.925925926
GH 0 0 16666.66667 0.925926 0.925925926
AH 4714.045208 0.523783 18856.18083 1.047566 1.047565602
AB 26666.66667 2.962963 0 0 2.962962963
BH 10000 1.111111 6666.666667 0.37037 1.111111111
HI 0 0 26666.66667 1.481481 1.481481481
BI 9428.090416 1.047566 14142.13562 0.785674 1.047565602
BC 30000 3.333333 0 0 3.333333333
CI 0 0 0 0 0
CD 30000 3.333333 0 0 3.333333333
DI 9428.090416 1.047566 14142.13562 0.785674 1.047565602
IJ 0 0 26666.66667 1.481481 1.481481481
DJ 10000 1.111111 6666.666667 0.37037 1.111111111
DE 26666.66667 2.962963 0 0 2.962962963
EJ 4714.045208 0.523783 18856.18083 1.047566 1.047565602
JK 0 0 16666.66667 0.925926 0.925925926
KL 0 0 16666.66667 0.925926 0.925925926
EK 0 0 20000 1.111111 1.111111111
EL 23570.22604 2.618914 0 0 2.618914004
Table 3: This table illustrates the maximum compressive and tensional forces and the minimum area that can be used per member.
With the minimum area calculated, we were able to find steel beams that were close to the minimum area for each member. The area of the beam must be greater or equal to the

Brown, Callahan 13
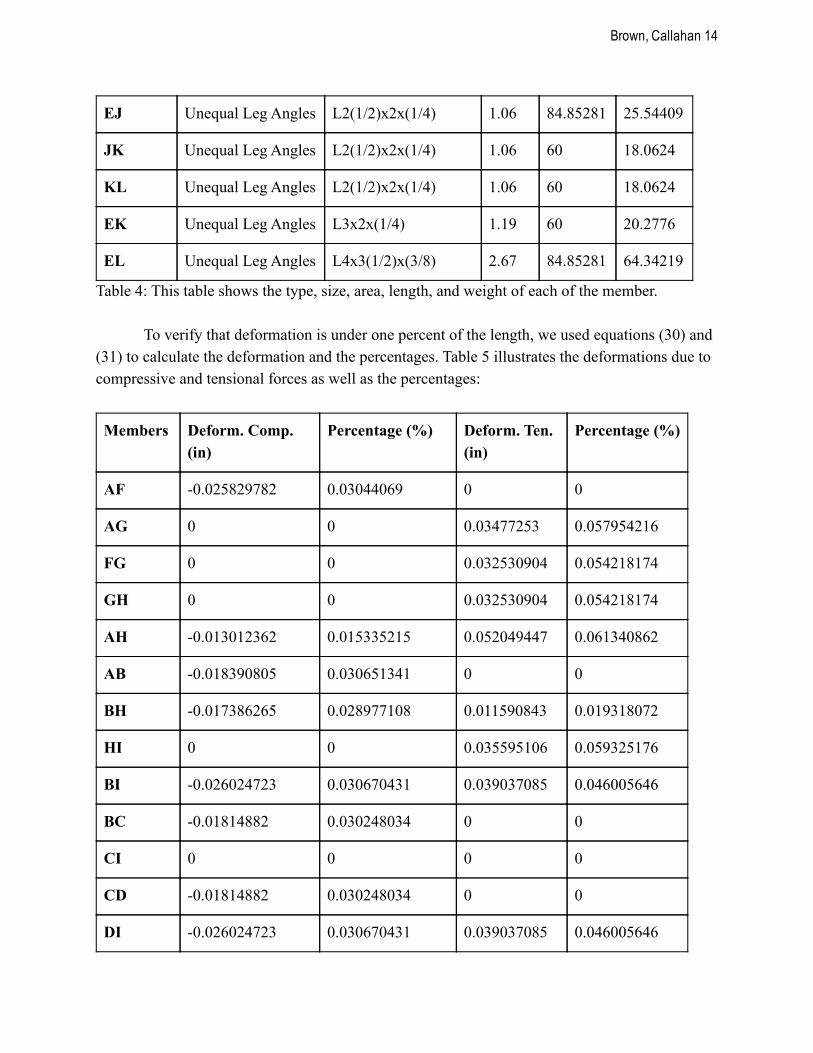
minimum area for each member in order to follow the factor of safety. The type, size, area, length, and weight of each of the member are listed in Table 4:
Members Type Size Area (in^2)
Length (in)
Weight (lb)
AF Unequal Leg Angles L4x3(1/2)x(3/8) 2.67 84.85281 64.34219
AG Unequal Leg Angles L3x2x(1/4) 1.19 60 20.2776
FG Unequal Leg Angles L2(1/2)x2x(1/4) 1.06 60 18.0624
GH Unequal Leg Angles L2(1/2)x2x(1/4) 1.06 60 18.0624
AH Unequal Leg Angles L2(1/2)x2x(1/4) 1.06 84.85281 25.54409
AB Unequal Leg Angles L3(1/2)x3x(1/2) 3 60 51.12
BH Unequal Leg Angles L3x2x(1/4) 1.19 60 20.2776
HI Unequal Leg Angles L2(1/2)x2x(3/8) 1.55 60 26.412
BI Unequal Leg Angles L2(1/2)x2x(1/4) 1.06 84.85281 25.54409
BC Unequal Leg Angles L6x3(1/2)x(3/8) 3.42 60 58.2768
CI Unequal Leg Angles L2(1/2)x2x(1/4) 1.06 60 18.0624
CD Unequal Leg Angles L6x3(1/2)x(3/8) 3.42 60 58.2768
DI Unequal Leg Angles L2(1/2)x2x(1/4) 1.06 84.85281 25.54409
IJ Unequal Leg Angles L2(1/2)x2x(3/8) 1.55 60 26.412
DJ Unequal Leg Angles L3x2x(1/4) 1.19 60 20.2776
DE Unequal Leg Angles L3(1/2)x3x(1/2) 3 60 51.12
Brown, Callahan 14
EJ Unequal Leg Angles L2(1/2)x2x(1/4) 1.06 84.85281 25.54409
JK Unequal Leg Angles L2(1/2)x2x(1/4) 1.06 60 18.0624
KL Unequal Leg Angles L2(1/2)x2x(1/4) 1.06 60 18.0624
EK Unequal Leg Angles L3x2x(1/4) 1.19 60 20.2776
EL Unequal Leg Angles L4x3(1/2)x(3/8) 2.67 84.85281 64.34219
Table 4: This table shows the type, size, area, length, and weight of each of the member.
To verify that deformation is under one percent of the length, we used equations (30) and (31) to calculate the deformation and the percentages. Table 5 illustrates the deformations due to compressive and tensional forces as well as the percentages:
Members Deform. Comp. (in)
Percentage (%) Deform. Ten. (in)
Percentage (%)
AF 0.025829782 0.03044069 0 0
AG 0 0 0.03477253 0.057954216
FG 0 0 0.032530904 0.054218174
GH 0 0 0.032530904 0.054218174
AH 0.013012362 0.015335215 0.052049447 0.061340862
AB 0.018390805 0.030651341 0 0
BH 0.017386265 0.028977108 0.011590843 0.019318072
HI 0 0 0.035595106 0.059325176
BI 0.026024723 0.030670431 0.039037085 0.046005646
BC 0.01814882 0.030248034 0 0
CI 0 0 0 0
CD 0.01814882 0.030248034 0 0
DI 0.026024723 0.030670431 0.039037085 0.046005646
Brown, Callahan 15
IJ 0 0 0.035595106 0.059325176
DJ 0.017386265 0.028977108 0.011590843 0.019318072
DE 0.018390805 0.030651341 0 0
EJ 0.013012362 0.015335215 0.052049447 0.061340862
JK 0 0 0.032530904 0.054218174
KL 0 0 0.032530904 0.054218174
EK 0 0 0.03477253 0.057954216
EL 0.025829782 0.03044069 0 0
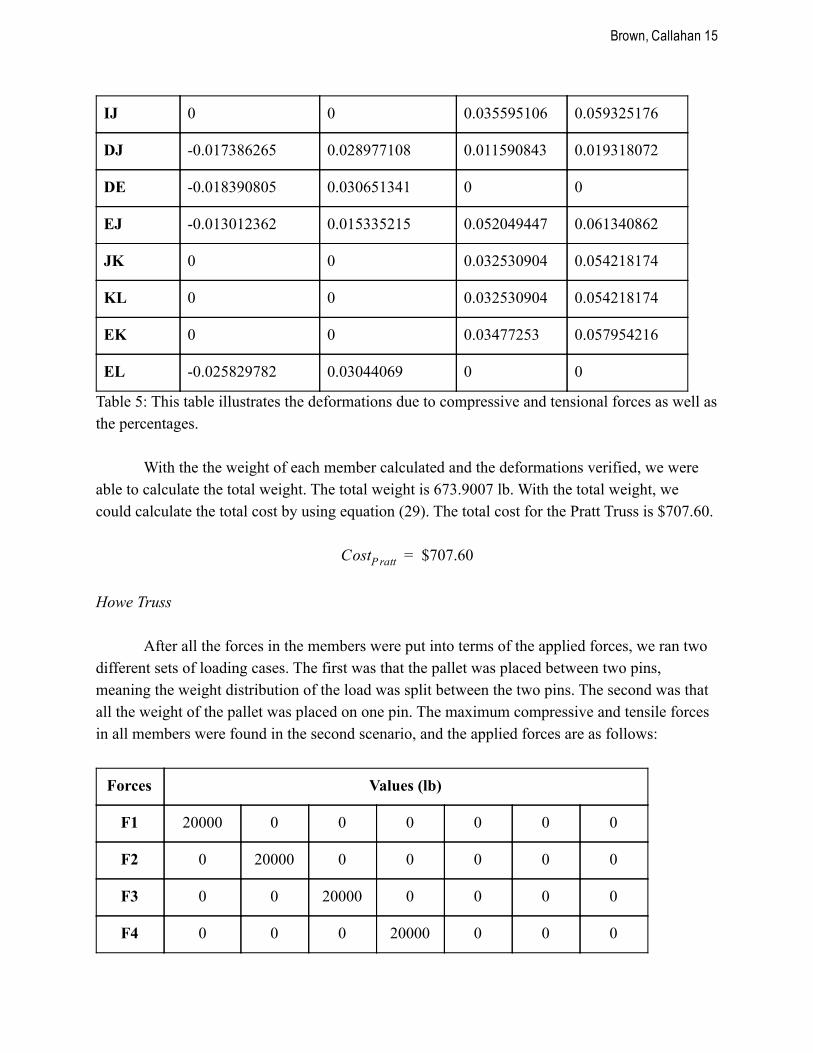
Table 5: This table illustrates the deformations due to compressive and tensional forces as well as the percentages.
With the the weight of each member calculated and the deformations verified, we were able to calculate the total weight. The total weight is 673.9007 lb. With the total weight, we could calculate the total cost by using equation (29). The total cost for the Pratt Truss is $707.60.
$707.60 CostP ratt =
Howe Truss
After all the forces in the members were put into terms of the applied forces, we ran two different sets of loading cases. The first was that the pallet was placed between two pins, meaning the weight distribution of the load was split between the two pins. The second was that all the weight of the pallet was placed on one pin. The maximum compressive and tensile forces in all members were found in the second scenario, and the applied forces are as follows:
Forces Values (lb)
F1 20000 0 0 0 0 0 0
F2 0 20000 0 0 0 0 0
F3 0 0 20000 0 0 0 0
F4 0 0 0 20000 0 0 0
Brown, Callahan 16
F5 0 0 0 0 20000 0 0
F6 0 0 0 0 0 20000 0
F7 0 0 0 0 0 0 20000
Table 6: Different case loadings scenarios for applied forces on the Howe truss structure.
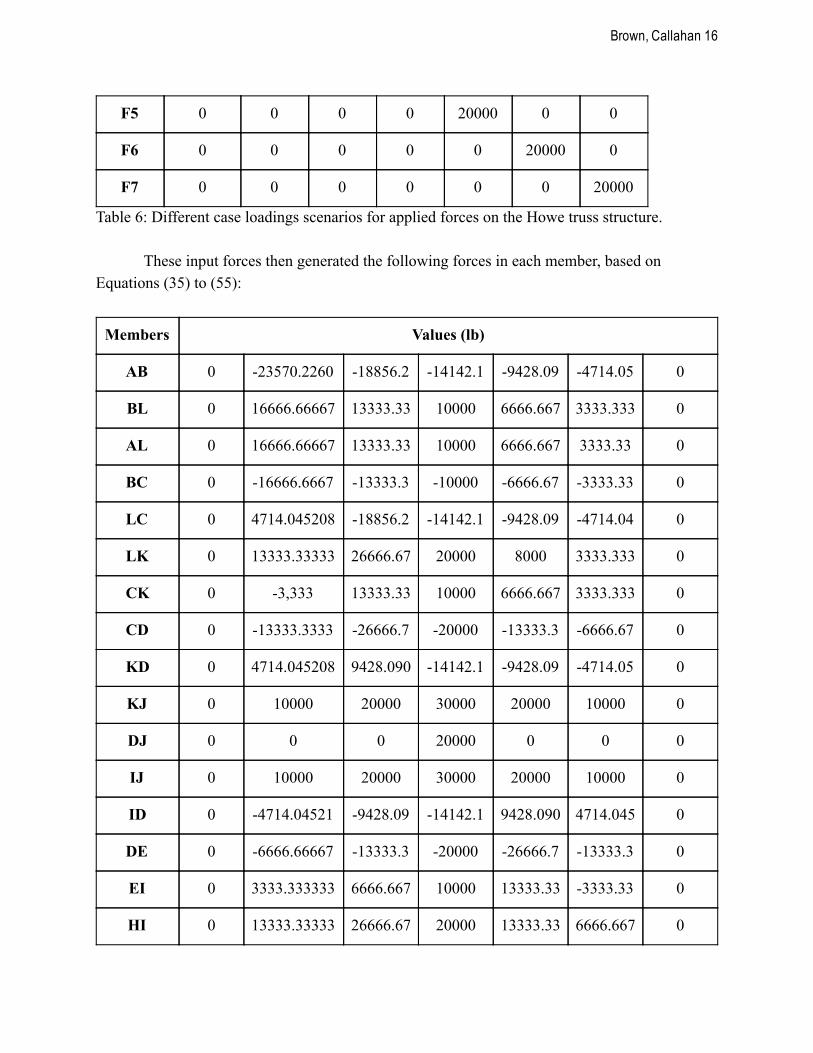
These input forces then generated the following forces in each member, based on Equations (35) to (55):
Members Values (lb)
AB 0 23570.2260 18856.2 14142.1 9428.09 4714.05 0
BL 0 16666.66667 13333.33 10000 6666.667 3333.333 0
AL 0 16666.66667 13333.33 10000 6666.667 3333.33 0
BC 0 16666.6667 13333.3 10000 6666.67 3333.33 0
LC 0 4714.045208 18856.2 14142.1 9428.09 4714.04 0
LK 0 13333.33333 26666.67 20000 8000 3333.333 0
CK 0 3,333 13333.33 10000 6666.667 3333.333 0
CD 0 13333.3333 26666.7 20000 13333.3 6666.67 0
KD 0 4714.045208 9428.090 14142.1 9428.09 4714.05 0
KJ 0 10000 20000 30000 20000 10000 0
DJ 0 0 0 20000 0 0 0
IJ 0 10000 20000 30000 20000 10000 0
ID 0 4714.04521 9428.09 14142.1 9428.090 4714.045 0
DE 0 6666.66667 13333.3 20000 26666.7 13333.3 0
EI 0 3333.333333 6666.667 10000 13333.33 3333.33 0
HI 0 13333.33333 26666.67 20000 13333.33 6666.667 0
Brown, Callahan 17
EH 0 4714.04521 9428.09 14142.1 18856.2 4714.045 0
EF 0 3333.33333 6666.67 10000 13333.3 16666.7 0
FG 0 4714.04521 9428.09 14142.1 18856.2 23570.2 0
GH 0 3333.333333 6666.667 10000 13333.33 16666.67 0
FH 0 3333.333333 6666.667 10000 13333.33 16666.67 0
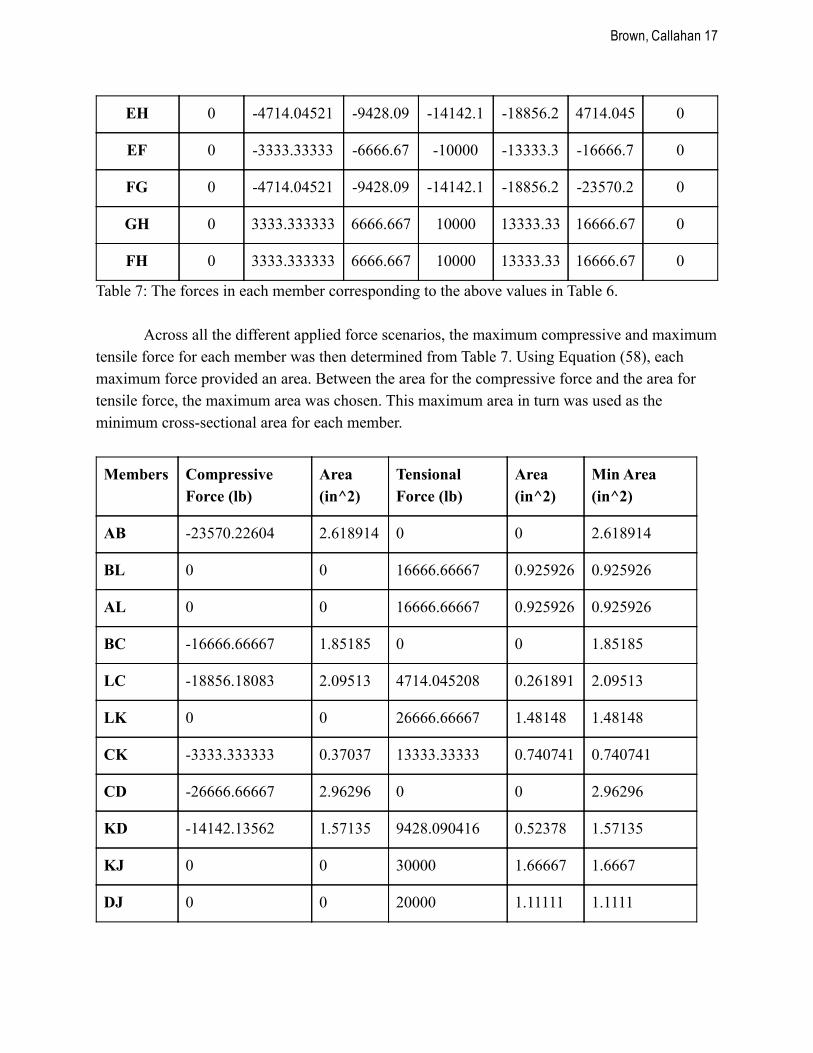
Table 7: The forces in each member corresponding to the above values in Table 6.
Across all the different applied force scenarios, the maximum compressive and maximum tensile force for each member was then determined from Table 7. Using Equation (58), each maximum force provided an area. Between the area for the compressive force and the area for tensile force, the maximum area was chosen. This maximum area in turn was used as the minimum crosssectional area for each member.
Members Compressive Force (lb)
Area (in^2)
Tensional Force (lb)
Area (in^2)
Min Area (in^2)
AB 23570.22604 2.618914 0 0 2.618914
BL 0 0 16666.66667 0.925926 0.925926
AL 0 0 16666.66667 0.925926 0.925926
BC 16666.66667 1.85185 0 0 1.85185
LC 18856.18083 2.09513 4714.045208 0.261891 2.09513
LK 0 0 26666.66667 1.48148 1.48148
CK 3333.333333 0.37037 13333.33333 0.740741 0.740741
CD 26666.66667 2.96296 0 0 2.96296
KD 14142.13562 1.57135 9428.090416 0.52378 1.57135
KJ 0 0 30000 1.66667 1.6667
DJ 0 0 20000 1.11111 1.1111
Brown, Callahan 18
IJ 0 0 30000 1.66667 1.6667
ID 14142.13562 1.57135 9428.090416 0.52378 1.57135
DE 26666.66667 2.96296 0 0 2.96296
EI 3333.333333 0.37037 13333.33333 0.740741 0.740741
HI 0 0 26666.66667 1.48148 1.48148
EH 18856.18083 2.09513 4714.045208 0.261891 2.09513
EF 16666.66667 1.85185 0 0 1.85185
FG 23570.22604 2.618914 0 0 2.618914
GH 0 0 16666.66667 0.925926 0.925926
FH 0 0 16666.66667 0.925926 0.925926
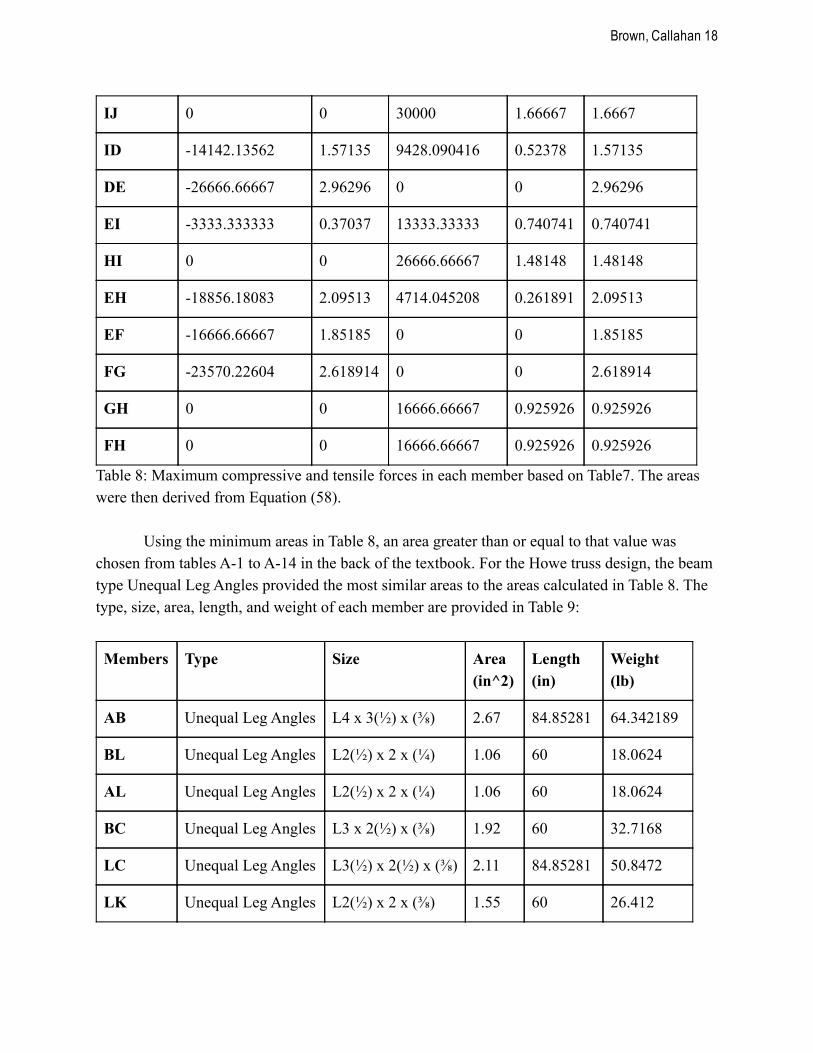
Table 8: Maximum compressive and tensile forces in each member based on Table7. The areas were then derived from Equation (58).
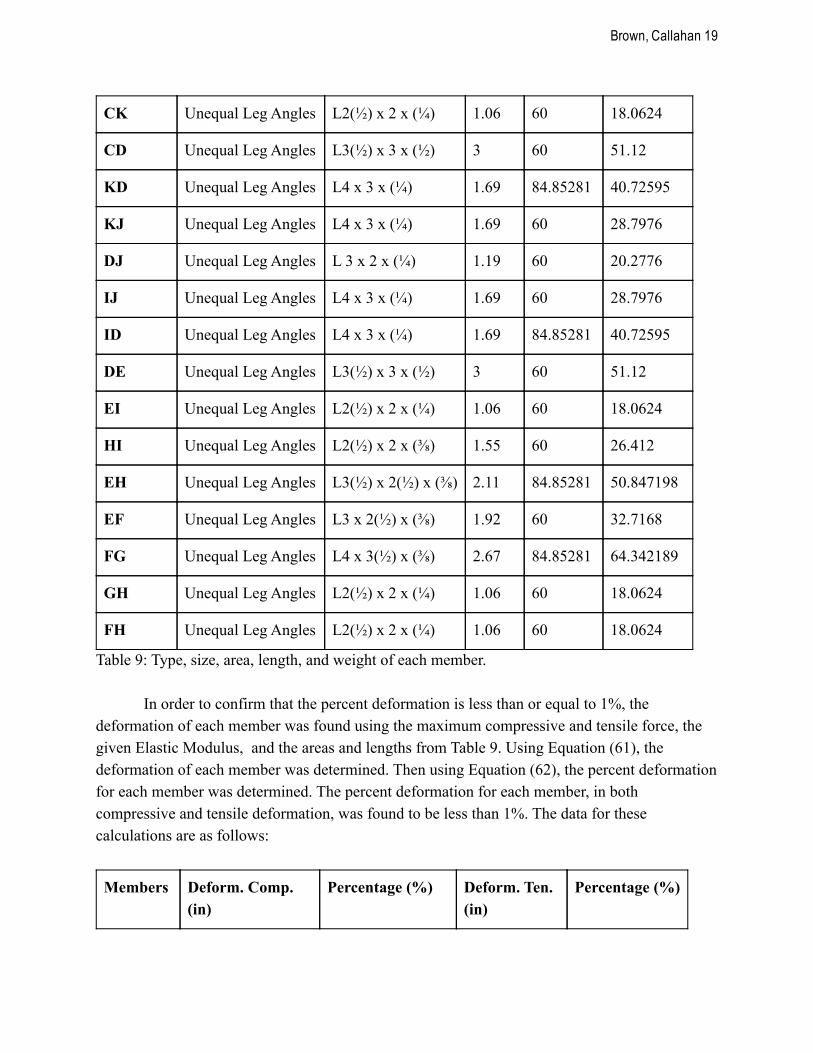
Using the minimum areas in Table 8, an area greater than or equal to that value was chosen from tables A1 to A14 in the back of the textbook. For the Howe truss design, the beam type Unequal Leg Angles provided the most similar areas to the areas calculated in Table 8. The type, size, area, length, and weight of each member are provided in Table 9:
Members Type Size Area (in^2)
Length (in)
Weight (lb)
AB Unequal Leg Angles L4 x 3(½) x (⅜) 2.67 84.85281 64.342189
BL Unequal Leg Angles L2(½) x 2 x (¼) 1.06 60 18.0624
AL Unequal Leg Angles L2(½) x 2 x (¼) 1.06 60 18.0624
BC Unequal Leg Angles L3 x 2(½) x (⅜) 1.92 60 32.7168
LC Unequal Leg Angles L3(½) x 2(½) x (⅜) 2.11 84.85281 50.8472
LK Unequal Leg Angles L2(½) x 2 x (⅜) 1.55 60 26.412
Brown, Callahan 19
CK Unequal Leg Angles L2(½) x 2 x (¼) 1.06 60 18.0624
CD Unequal Leg Angles L3(½) x 3 x (½) 3 60 51.12
KD Unequal Leg Angles L4 x 3 x (¼) 1.69 84.85281 40.72595
KJ Unequal Leg Angles L4 x 3 x (¼) 1.69 60 28.7976
DJ Unequal Leg Angles L 3 x 2 x (¼) 1.19 60 20.2776
IJ Unequal Leg Angles L4 x 3 x (¼) 1.69 60 28.7976
ID Unequal Leg Angles L4 x 3 x (¼) 1.69 84.85281 40.72595
DE Unequal Leg Angles L3(½) x 3 x (½) 3 60 51.12
EI Unequal Leg Angles L2(½) x 2 x (¼) 1.06 60 18.0624
HI Unequal Leg Angles L2(½) x 2 x (⅜) 1.55 60 26.412
EH Unequal Leg Angles L3(½) x 2(½) x (⅜) 2.11 84.85281 50.847198
EF Unequal Leg Angles L3 x 2(½) x (⅜) 1.92 60 32.7168
FG Unequal Leg Angles L4 x 3(½) x (⅜) 2.67 84.85281 64.342189
GH Unequal Leg Angles L2(½) x 2 x (¼) 1.06 60 18.0624
FH Unequal Leg Angles L2(½) x 2 x (¼) 1.06 60 18.0624
Table 9: Type, size, area, length, and weight of each member.
In order to confirm that the percent deformation is less than or equal to 1%, the deformation of each member was found using the maximum compressive and tensile force, the given Elastic Modulus, and the areas and lengths from Table 9. Using Equation (61), the deformation of each member was determined. Then using Equation (62), the percent deformation for each member was determined. The percent deformation for each member, in both compressive and tensile deformation, was found to be less than 1%. The data for these calculations are as follows:
Members Deform. Comp. (in)
Percentage (%) Deform. Ten. (in)
Percentage (%)

Brown, Callahan 20
AB 0.026333631 0.031034483 0 0
BL 0 0 0.032530904 0.054218174
AL 0 0 0.032530904 0.054218174
BC 0.01795977 0.02993295 0 0
LC 0.026148062 0.030815788 0.006537016 0.007703947
LK 0 0 0.035595106 0.059325176
CK 0.006506181 0.010843635 0.026024723 0.043374539
CD 0.018390805 0.030651341 0 0
KD 0.024484798 0.028855612 0.016323199 0.019237075
KJ 0 0 0.036727199 0.061211998
DJ 0 0 0.03477253 0.057954216
IJ 0 0 0.036727199 0.061211998
ID 0.024484798 0.028855612 0.016323199 0.019237075
DE 0.018390805 0.030651341 0 0
EI 0.006506181 0.010843635 0.026024723 0.043374539
HI 0 0 0.035595106 0.059325176
EH 0.026148062 0.030815788 0.006537016 0.007703947
EF 0.01795977 0.02993295 0 0
FG 0.025829781 0.03044069 0 0
GH 0 0 0.032530904 0.054218174
FH 0 0 0.032530904 0.054218174
Table 10: Deformation in both tension and compression, as well as percent deformation.
Brown, Callahan 21
Since the weight of each member was found in Table 9, the total weight of the design can be determined by summing the weights of all the members. The total weight was determined to be 718.575 lb. In order to determine the cost for all the members, Equation (60) was used, as well as the total weight. The total cost for the Howe Truss was found to $754.50
$754.50 CostHowe =
Discussion
The aim of this design project was to design a truss system for a 30 ft pedestrian bridge. The main requirement for the bridge was that it had to be able to support 20,000 lb of building supplies. The overall goal of the project was to minimize the raw material used for the construction of the bridge and have the lowest cost possible. However, the systems still had to adhere to factors of safety for both compressive and tensional loads. It also had to have less than a 1.0% deformation change of the length.
We set up a series of variables that signified where forces would be applied on the structure. By balancing the forces of the overall structure and of each of the pins, we were able to write equations relating all of the members to each of the forces. We then found the maximum compressive and tensional forces in each of the members. These forces, combined with the elastic strength and factors of safety, allowed us to calculate the cross sectional areas. The maximum of these two areas had to be the minimum value of the area. Otherwise, the member would not meet the factor of safety specification. Next, we viewed the tables A1 through A14 in the back of the book to determine which type of beam to use. For the Pratt Truss, it was found that it would be most cost efficient to use the Unequal Leg Angle beams for construction. For the Howe Truss, it was found that it would be most cost efficient to use the Unequal Leg Angle beams for construction.
With all of the given information, we were able to calculate the deformation percentage. Seeing that all of the percentages were below one percent, we were able to find the total weight. For the Pratt Truss, the total weight equaled 673.9007 lb. For the Howe Truss, the total weight equaled 718.575 lb. Given equation (29), we were able to calculate the total cost for all of the material. For the Pratt Truss, the total cost equaled $707.60. For the Howe Truss, the total cost equaled $754.50. Since the goal was to use the least amount of material, the truss system with the lowest cost would be the final design. With our given costs, it was found that the pedestrian bridge should be built by using the Pratt Truss system.
Conclusion
Brown, Callahan 22
The aim of this design project was to create a design for a 30 ft pedestrian bridge with the
least amount of material, lowest cost, and still meet all of the safety regulations. The goal was achieved by finding the maximum forces that can be exerted on the system and selecting members that can withstand those maximum forces with the smallest cross sectional areas. Having a cross sectional area as close, but greater than or equal, to the area calculated allows for the least amount of material. Though both truss systems satisfy the design requirements, only one uses less material and has a lower cost associated with. We conclude that the best design for the pedestrian bridge is the Pratt Truss with a weight of 673.9007 lb and a cost of $707.60.
Brown, Callahan 23
Appendix A
Brown, Callahan 24
Brown, Callahan 25
Brown, Callahan 26
Brown, Callahan 27
Appendix B
Brown, Callahan 28
Brown, Callahan 29
Brown, Callahan 30
Brown, Callahan 31