Embed Size (px)
Citation preview

SYST/OR 699 Master’s Project - Report
Design of a Budget Exhibit Analysis Tool for Analysis of the Department of Defense Research, Development, Test and Evaluation Budget Prepared for Systems Planning and Analysis, Inc.
Chris Anderson, Kris Cruz, Jhonnattan Diaz, Said Masoud 12-9-2016
i
TABLE OF CONTENTS
PROBLEM DEFINITION ........................................................................................ 1
SPONSORSHIP ..................................................................................................... 1
BACKGROUND .................................................................................................... 1
PROBLEM STATEMENT ........................................................................................ 3
PROBLEM AND NEEDS STATEMENT .................................................................... 3
OBJECTIVES AND PURPOSE ................................................................................. 4
STAKEHOLDERS ................................................................................................... 4
SCOPE ................................................................................................................. 6
ANALYSIS ............................................................................................................ 8
REQUIREMENTS ................................................................................................ 10
MISSION REQUIREMENTS ................................................................................. 10
SYSTEM REQUIREMENTS .................................................................................. 10
FUNCTIONAL REQUIREMENTS .......................................................................... 10
DATA EXTRACTION AND ANALYSIS ................................................................... 11
DELIVERABLES ................................................................................................... 13
BUDGET EXHIBIT ANALYSIS TOOL (BEAT) .......................................................... 13
R-1 BUDGET DATA EXPLORATION (PAST YEARS) ............................................... 14
R-2 BUDGET DATA EXPLORATION (FUTURE YEARS) .......................................... 16
FUTURE OPPORTUNITIES .................................................................................. 20
ACCOMPLISHMENTS ......................................................................................... 22
DECISION POINTS .............................................................................................. 23
PROGRAM MANAGEMENT................................................................................ 23
EARNED VALUE MANAGEMENT SYSTEMS ......................................................... 25
REFERENCES ...................................................................................................... 26
APPENDIX A – BUDGET ACTIVITY DEFINITIONS ............................................... A-1
ii
APPENDIX B - LIST OF ACRONYMS ................................................................... B-1
APPENDIX C – USE CASES ................................................................................ C-1
USE CASE 1: RUN R-1/R-2 LOAD BATCH JOB .................................................... C-1
USE CASE 2: RUN EXCEL GENERATOR JOB ........................................................ C-4
USE CASE 3: PERFORM R-1/R-2 DATA VISUALIZATION ..................................... C-7
APPENDIX D – SYSTEM ARCHITECTURE ........................................................... D-1

iii
Table of Figures
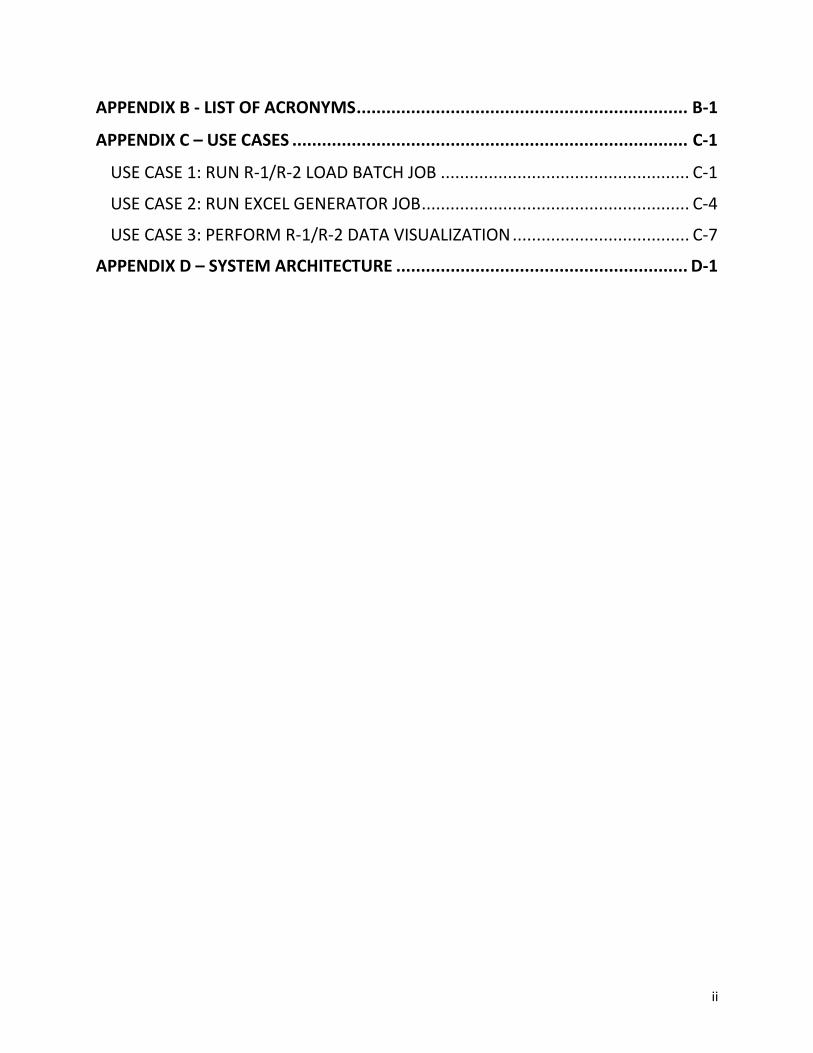
Figure 1. DoD Budget from 1950 – 2025 in FY16 dollar (future years estimated) ....................................... 1
Figure 2. Average annual growth of select countries’ R&D budget.............................................................. 2
Figure 3: Federal Spending on R&D .............................................................................................................. 3
Figure 4. Stakeholder Diagram...................................................................................................................... 6
Figure 5. Scope .............................................................................................................................................. 8
Figure 6. Use Case: Perform R-1/R-2 Data Visualization .............................................................................. 9
Figure 7. Sequence Diagram: OV-6C Data Visualization ............................................................................... 9
Figure 8. Requirements Diagram ................................................................................................................ 11
Figure 9. R-1 Budget Data for a specified President's Budget year ............................................................ 12
Figure 10. R-2 XML document example ...................................................................................................... 12
Figure 11. BEAT system R-1 graphing options ............................................................................................ 15
Figure 12. Spark Charts within BEAT (Smart Charts) .................................................................................. 15
Figure 13. DARPA drill-down to show PE's within ...................................................................................... 16
Figure 14. R-2 excerpts from PB13-PB17, identifying FY17 ........................................................................ 17
Figure 15. R-2 Graph of Electronic Warfare Technology ............................................................................ 17
Figure 16. BEAT (R-2) system user-interface .............................................................................................. 18
Figure 17. Advanced Aerospace Systems data for FY17 by PB submission year ($ Millions) ..................... 19
Figure 18. Multiple program elements graphed ......................................................................................... 20
Figure 19. Analysis ACROSS BAs, Services, Agencies .................................................................................. 21
Figure 20. Excerpt from PB17, showing FYDP+ ........................................................................................... 22
Figure 21. Excerpt from R-2, showing Accomplishment description .......................................................... 22
Figure 22. BEAT Work Breakdown Structure .............................................................................................. 24
Figure 23. Earned Value Management ....................................................................................................... 25
Figure 24. Use Case 1 - Run R-1/R-2 Load Batch Job ................................................................................. C-2
Figure 25. Sequence Diagram: OV-6c Run Data Load Batch Job................................................................ C-3
Figure 26. Use Case 2 - Run Excel Generator Job ...................................................................................... C-5
Figure 27. Sequence Diagram: OV-6c Run Excel Generator Job ................................................................ C-6
Figure 28. DIV-1 Conceptual Data Model ................................................................................................. D-1
Figure 29. OV-5b: Operational Activity Model .......................................................................................... D-2
Table of Tables
Table 1. Categories of Appropriation ............................................................................................................ 7
Table 2. Budget Activity Numbers and Names ............................................................................................. 7
Table 3. Use Case 1 - Success Criteria ........................................................................................................ C-1
Table 4. Use Case 1 - Scenario Extensions ................................................................................................. C-2
Table 5. Use Case 2 - Success Criteria ........................................................................................................ C-4
Table 6. Use Case 2 - Scenario Extensions ................................................................................................. C-4
Table 7. Use Case 3 - Success Criteria ........................................................................................................ C-7
Table 8. Use Case 3 - Scenario Extensions ................................................................................................. C-8
1
Problem Definition
Sponsorship
Systems Planning and Analysis, Inc. (SPA) is a professional services contractor located in Alexandria, VA.
SPA has permitted the Joint Air Force & Analysis Division (JTAAD), and specifically the Operational Support
Analysis Group (OSAG) to become the first sponsor of an educational capstone project. The problem
statement outlined below has been derived from conversations with OSAG, the official client of this
project. OSAG is trying to search out new analytical methods and approaches to categorizing and
analyzing past, present, and future budget submissions. The proposal offered by OSAG was selected as a
capstone project for our team
Background
Since 2000, the budget of the Department of Defense (DoD) has ebbed and flowed (See Error! Reference
source not found.) in line with national security concerns and overseas military activities. For example,
after 9/11, the DoD R&D budget increased by approximately 60% through FY2007, but declined 25%
between FY2010-FY2014, coinciding with the drawdown of American forces and presence in Iraq and
Afghanistan. (American Association for the Advancement of Science 2016)
Figure 1. DoD Budget from 1950 – 2025 in FY16 dollar (future years estimated)
Formally announced in 2014 by then Secretary of Defense Chuck Hagel, one major focus of the DoD has
been the third offset strategy. Third offset is an effort to maintain technological superiority; focusing on
such activities as but not limited to; Human-machine learning, Robotics, Undersea warfare, Hypersonics,
semi-autonomous weapons, resilient and/or alternative methods of communication, and cyber
Supplemental Funding Base Funding

2
capabilities (both defensive and offensive). There is also an emphasis on agility and sustainability in
manufacturing new systems, decreasing the logistical load of deployment by utilizing techniques such as
modular manufacturing and 3D printing.
In December of 2015, Deputy Secretary of Defense (DEPSECDEF) Bob Work stated that 2017 will be an
important year to lay the groundwork for this strategy. (American Association for the Advancement of
Science 2016)
Third offset strategy represents more than $18 billion of budget requests across the Future Years Defense
Program (FYDP), constituting an overhaul in US military operating concepts and technological
investments. The concepts and investments are intended to address emerging capability gaps as well as
deter potential near-peer adversaries, such as China and Russia. (.govini Accessed 2016).
These strategic goals, however, are being pursued in an increasingly constrained fiscal environment. The
Budget Control Act of 2011 created several mechanisms for enforcing stricter control of spending,
including sequestration, and its effects can be seen in the flat future budget projections of the final years
depicted in Figure 1. DoD Budget from 1950 – 2025 in FY16 dollar (future years estimated).
The US no longer has a monopoly on power projection, precision guidance, or the enabling infrastructure that made it the dominant military power since the end of the Cold War. China and Russia have observed the US’s capabilities and have been making strategic investments that counter US advantages. These efforts are evidenced by the average annual R&D growth of these two countries, which is significantly greater than that of the US (See Figure 2. Average annual growth of select countries’ R&D budget). (.govini Accessed 2016)
Figure 2. Average annual growth of select countries’ R&D budget
3
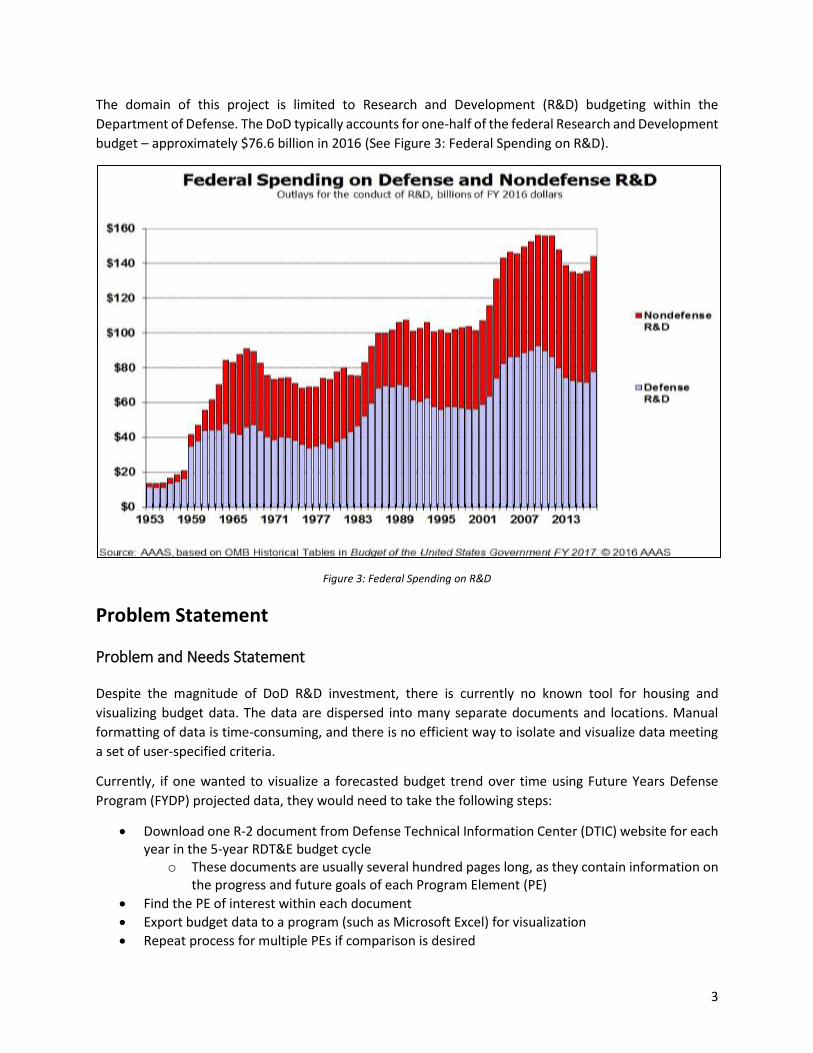
The domain of this project is limited to Research and Development (R&D) budgeting within the
Department of Defense. The DoD typically accounts for one-half of the federal Research and Development
budget – approximately $76.6 billion in 2016 (See Figure 3: Federal Spending on R&D).
Figure 3: Federal Spending on R&D
Problem Statement
Problem and Needs Statement
Despite the magnitude of DoD R&D investment, there is currently no known tool for housing and
visualizing budget data. The data are dispersed into many separate documents and locations. Manual
formatting of data is time-consuming, and there is no efficient way to isolate and visualize data meeting
a set of user-specified criteria.
Currently, if one wanted to visualize a forecasted budget trend over time using Future Years Defense
Program (FYDP) projected data, they would need to take the following steps:
Download one R-2 document from Defense Technical Information Center (DTIC) website for each year in the 5-year RDT&E budget cycle
o These documents are usually several hundred pages long, as they contain information on the progress and future goals of each Program Element (PE)
Find the PE of interest within each document
Export budget data to a program (such as Microsoft Excel) for visualization
Repeat process for multiple PEs if comparison is desired

4
This is a time-consuming process. So, while it is possible to track a PE budget over time by accessing budget
documents for each year, there is no known way to access that information rapidly or isolate PEs which
meet a set of user-specified criteria without searching for them manually.
The purpose of the Budget Exhibit Analysis Tool (BEAT) is to meet this need by allowing users to quickly
identify PEs of interest using historic data and visualize their individual budget trends over time using
Future Years Defense Program (FYDP) projected data.
Objectives and Purpose
The objective of this project is to develop a methodology to analyze past, present, and future budget
trends within the DoD S&T community. Different stakeholders will approach the DoD RDT&E budget with
different questions depending on their role and areas of interest. It is of paramount importance to the
team to develop a decision support system with parameters that can be set by the user to provide a
tailored analysis. This tool must also be able to be updated with new data as it becomes available. The
requirements of this tool as defined by the team, and agreed upon by the sponsor, are defined in the
Requirements section of this document.
Stakeholders
There are many stakeholders in the DoD budgeting process. Some of these stakeholders are decision
makers who are responsible for determining the budget, others are responsible for allocating it, and most
are the recipients of those allocated funds.
It should be noted that, with the diversity of interests at work within the budgeting process, not all of
them are of a nature such that they would consider this project of value. For example, someone who is
responsible for only one project and whose primary responsibilities are to document that project’s
progress and justify future funding may not be interested in trend analysis.
The primary stakeholders – those who would consider this project of value to them – are those who are
interested in budget trend analysis. This might include, for example, a company which is considering how
to best allocate its resources to projects which are likely to receive increased attention and funding in the
future.
The following is an overview of the stakeholders and their roles in the DoD budgeting process:
The President and Congress
The DoD submits an annual budget request to the President for review. The President then submits a
budget request to Congress. This request is reviewed and subjected to an iterative process of revisions
before it is returned to the President, at which point it is either signed into law or vetoed.
Understanding trends within R&D is vital for decision makers to be able to rally support for the
expenditures they support or against the expenditures they oppose.

5
Services (Department of the Navy, US Air Force, US Army)
The primary organizations through which military policy is carried out, the services each have research
laboratories which are organized under them. They are the principal end users of the technologies
developed, and are therefore essential for determining the usefulness of any technology.
Communities of Interest (COIs)
A network of technical groups that serve as a lasting structure to integrate the diverse technological
efforts throughout the DoD. COIs were established in 2009 as a mechanism to encourage multi-agency
coordination and collaboration in cross-cutting technology focus areas with broad multiple-component
investment (Research & Engineering Enterprise: EXCOM 2016).
Having a powerful analytical tool at their disposal will enable COIs to better facilitate the coordination of
R&D efforts across the DoD and monitor the general state of development for specific areas of technology.
Industry
A diverse collection of private entities whose interests and level of involvement with the DoD vary
significantly. Some are recipients of contracts for specific research projects, while others are contracted
to provide an array of consulting services.
Naturally, industry players are in competition with one another for the limited resources apportioned to
the services they provide. Being able to identify and predict future budgeting developments is invaluable
as companies seek to determine how to best allocate their resources and direct their future endeavors.
Federally Funded Research & Development Centers (FFRDCs), and University-Affiliated Research Centers
(UARCs)
Research partnerships in which the DoD is the sponsor of a research facility which is under the
administration of either a corporate entity (FFRDCs) or a university (UARCs).
Office of the Secretary of Defense (OSD)
The Secretary of Defense is the primary defense policy advisor to the President and is responsible for
formulating and executing policy through the DoD. The OSD, as the staff of the Secretary, shares in those
responsibilities by providing management and oversight for the numerous components of the DoD.
Leadership and decision making effectiveness can be improved with the development of decision support
tools.
The Assistant Secretary of Defense (Research & Engineering) – ASD(R&E) is one component of the OSD. It provides S&T leadership and strengthens coordination efforts
Science and Technology (S&T) Laboratories
In addition to the laboratories organized under the Army, Navy, and Air Force, the DoD allocates funding
to other laboratories, some of which are independent (directly under the DoD), and some of which are
within other DoD agencies such as DARPA.

6
Figure 4. Stakeholder Diagram
Lastly, it is important to grasp the profound impact that even slight improvements to information
accessibility and visibility of trends can have. It is easy, but incorrect, to look at each year’s budget as the
product of a brief decision process with a definite beginning and end. In actuality, determining the
future budgets for the many components of the DoD is an ongoing undertaking that many of the
different stakeholders participate in. Also, the description of stakeholders in this report is greatly
simplified, and there is a multidimensionality to the organizations represented, with organizations each
having several levels of decision makers interested in identifying budget trends. Given the interminable
nature of the budgeting process, and the sheer number of people involved in it, the benefit of increased
access to information and greater visibility of trends cannot be understated.
Scope
There are natural scoping mechanisms built into the budget nomenclature and taxonomy used to build
the budget documents. The first scoping mechanism is the separation of Research, Development, Test,
and Evaluation (RDT&E) funding (See Table 1. Categories of Appropriation) from the other types of
funding. There are five major categories of appropriation:

7
Table 1. Categories of Appropriation
Appropriation Category Scope Funding Policy
Research Development, Test, and Evaluation (RDT&E)
Activities and expenses related to research, development, test, and evaluation
Incremental
Procurement (PROC) End items >= $100K system unit cost, All centrally managed items, Initial spares, Labor for certain production-related functions (e.g., item assembly, quality assurance)
Full
Operations and Maintenance (O&M)
Replenishment spares, Fuel, Civilian salaries, Construction projects < $750K, Travel, Non-centrally managed end items < $100K system unit cost
Annual
Military Personnel Expenses (MILPER)
Military Personnel Expenses Annual
Military Construction (MILCON) Construction Projects >= $750K Full
S&T funding is primarily within the RDT&E funding component. We therefore chose to examine only that
component of the budget.
Furthermore, by examining the categories under RDT&E, we can further determine the budget categories
that are likely to determine the most important trends in DoD research funding. There are seven BA’s
that define the total of the RDT&E budget. (See Table 2. Budget Activity Numbers and Names)
Table 2. Budget Activity Numbers and Names
Budget Activity Number Budget Activity Name
1 Basic Research
2 Applied Research
3 Advanced Technology Development
4 Advanced Concept Development & Prototypes
5 System Development and Demonstration
6 RDT&E Management and Support
7 Operational System Development
The scope of this project will reduce the research and analysis of all seven budget activities to just three
of them; BA-2: Applied Research, BA-3: Advanced Technology Development, BA-4: Advanced Concept
Development and Prototypes.
The following BAs will be out of scope for this project:
BA-1: Basic Research does not immediately yield a technology that could be produced to assist the warfighter
BA-5: System Development and Demonstration include programs having passed Milestone B within the acquisition process leading to full rate production
BA-6: RDT&E Management and Support includes funds to sustain and/or modernize installations
8
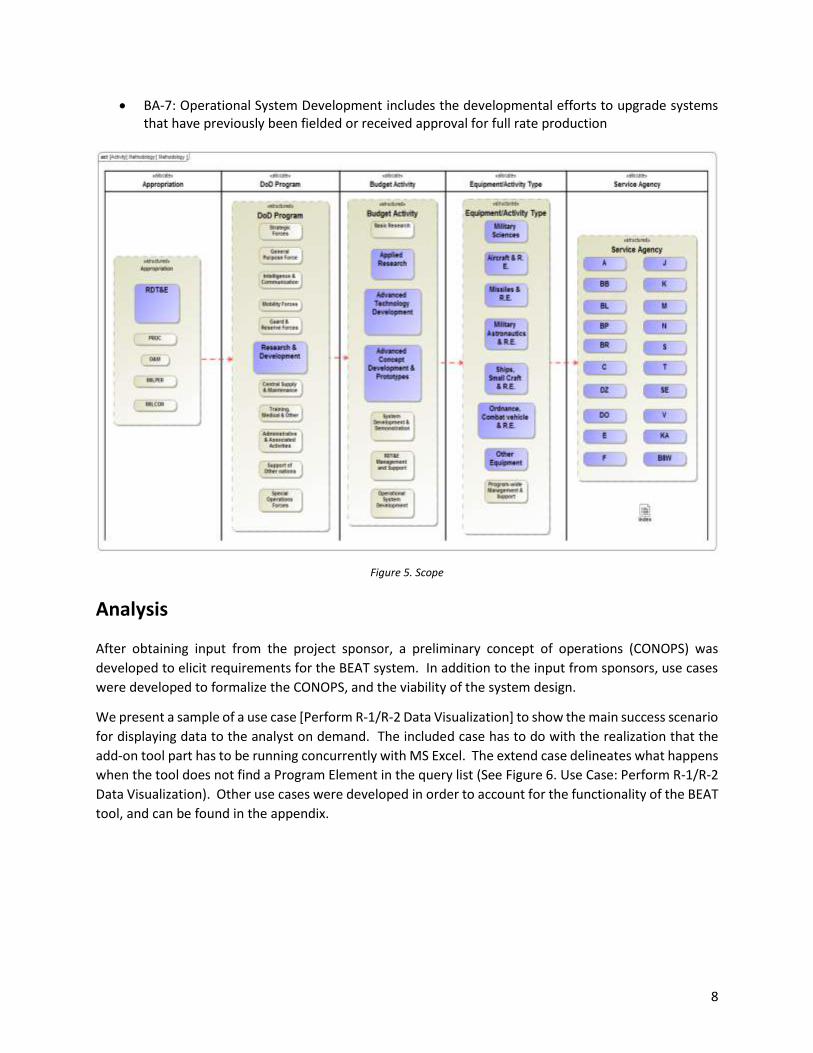
BA-7: Operational System Development includes the developmental efforts to upgrade systems that have previously been fielded or received approval for full rate production
Figure 5. Scope
Analysis
After obtaining input from the project sponsor, a preliminary concept of operations (CONOPS) was
developed to elicit requirements for the BEAT system. In addition to the input from sponsors, use cases
were developed to formalize the CONOPS, and the viability of the system design.
We present a sample of a use case [Perform R-1/R-2 Data Visualization] to show the main success scenario
for displaying data to the analyst on demand. The included case has to do with the realization that the
add-on tool part has to be running concurrently with MS Excel. The extend case delineates what happens
when the tool does not find a Program Element in the query list (See Figure 6. Use Case: Perform R-1/R-2
Data Visualization). Other use cases were developed in order to account for the functionality of the BEAT
tool, and can be found in the appendix.

9
Figure 6. Use Case: Perform R-1/R-2 Data Visualization
In addition to the use cases, sequence diagrams were developed from the use cases to make sure that the
order of operations made sense with the dynamics of the tool (See Figure 7. Sequence Diagram: OV-6C
Data Visualization). The user launches the Smart Chart Tool, so the ExcelGeneratorJob can populate the
R-1, and R-2 data that the ExcelVisualizationTool can graph and display the data to the analyst depending
on the his/her input criteria for the query. Additional sequence diagrams for specific use cases can be
found in the appendix.
Figure 7. Sequence Diagram: OV-6C Data Visualization

10
Requirements
Mission Requirements
MR1: The BEAT system shall be able to ingest RDT&E budget information from R-1 and R-2 documents.
MR2: The BEAT system shall have the ability to ingest a minimum of five years of RDT&E budget exhibit documents, when data is available
MR3: The BEAT system shall visualize RDT&E budget data over a pre-determined time period
System Requirements
SR1: The BEAT system shall generate R-1 budget trend data by Program Element for budget activities 2, 3, and 4
SR2: The BEAT system shall generate R-2 budget trend data by Program Element for budget activities 2, 3, and 4
SR3: The BEAT system shall Aggregate budget data by Program Element for budget activities 2, 3, and 4
Functional Requirements
FR1: The BEAT system shall create a plot that visualizes “outliers” of R-1 budget data
FR2: The BEAT system shall identify “outliers” that exist within currently loaded data and newly loaded data
FR3: The BEAT system shall identify new Program Elements by first fiscal year reported
FR4: The BEAT system shall identify discontinued Program Elements by last fiscal year reported
FR5: The BEAT system shall Monitor a minimum of five RDT&E budget cycles, when data is available
FR6: The BEAT system shall aggregate Program Elements in order to conduct tailored analysis

11
Figure 8. Requirements Diagram
Data Extraction and Analysis
The data used for the purposes of this project is available to the public, and is obtainable at the website
of the Defense Technical Information Center (Defense Technical Information Center 2016). Two types of
documents were used to extract and analyze data. For the purposes of this project, only unclassified data
was retrieved.
R-1: The R-1 document contains budget information for all RDT&E programs undertaken by the branches of the DoD. For each fiscal year, the document lists the budget for the previous two fiscal years, as well as the budget for the current fiscal year. See Figure 9. R-1 Budget Data for a specified President's Budget year for an example of an R-1 document.

12
Figure 9. R-1 Budget Data for a specified President's Budget year
R-2: The R-2 document is specific to each program, identified by a “program element” (PE) number in the R-1. The R-2 serves as the item justification for each program, as the proposed budget for the next four fiscal years is listed. In addition, a detailed description of each sub-program covered by the PE is included. See Figure 10. R-2 XML document example for an example of an R-2 document.
Figure 10. R-2 XML document example
The R-1 and R-2 documents are available in Excel format and XML format, respectively, among others. The
data was extracted from the two file types via a Java batch application, and loaded into a MySQL database.
The R-2 documents all have the same schema; however, the format of the columns are slightly different
in the R-1 documents for each fiscal year, therefore some manual manipulation was required before the
documents were loaded via the batch application.

13
In the database, the data from the R-1 documents was loaded into a single table, using the PE number
and the fiscal year reported as the unique identifier for each row. The schema for the R-2 documents is
similar to the R-1 schema where the fiscal year reported and PE number are the unique identifiers for the
R-2 table.
Once the data was loaded into the database, the raw data was extracted and loaded into an Excel template
by the Java batch application. In order to visualize the respective trends, Excel graphs and other visuals
were developed and generated automatically using pre-defined Visual Basic for Applications (VBA) scripts
that were automatically executed after the raw data was loaded into the template. Within the Java
application, templates containing pre-formatted Excel sheets and VBA scripts were packaged together,
and, in the future, when new R-1 or R-2 documents are loaded into the database, the results can be loaded
into new files via the templates for analysis and visualization. The VBA scripts will automatically be
executed by the Java application, such that when the application has completed running, an end user can
simply open the Excel file created and instantly see the results.
In order to allow the sponsor to have the option to continue to use the application, a separate user
manual, which explains how to set up the database and Java batch application, was developed. This
manual contains a description of the Java batch application, as well as instructions to set up a MySQL
database, if desired.
Deliverables
The following items will be delivered to the stakeholder at the conclusion of this project:
Java Executable (.jar): The Java batch application will be compiled into an executable JAR file that can be readily executed, with the modification of the application properties
Java source code: The Java source code will be saved as an Eclipse project and compressed for more efficient delivery. In the event that the sponsor would like to modify or build on the code, the sponsor can download and set up Eclipse, then import the project directory.
MySQL database export: A MySQL database export will be provided so that the sponsor does not have to worry about setting up the database manually and trying to load the data that was already loaded during the course of this project. The export will be formatted such that if the sponsor chooses to use another type of database, the data can still be imported without much effort.
Excel templates and completed data sheets: The compiled data sheets used to develop the results of the analysis will be provided to the sponsor so that they may continue to perform analysis on the data. In addition, Excel templates will be provided in the Java JAR file and Eclipse project package so that when new data is available, they may create new Excel sheets for analysis.
User Manual: A user manual that will provide instructions on how to set up a MySQL database and implement the Java batch application.
Budget Exhibit Analysis Tool (BEAT)
BEAT was developed to aid in the identification of budget request trends within the RDT&E budget. The
BEAT system has the ability to upload new President’s Budget documents when they are released
(annually). The file formats capable of being uploaded are MS Excel (R-1) and XML (R-2). Previously
analysts would have to search on disparate sites for the specific documents in question, download them,
14
unpack (WinZip) then, and manually combine them into usable formats for their research. While the
downloading takes a long time, and will still be necessary with the BEAT system, the most time-consuming
event is in the compilation of the data.
The BEAT system is comprised of over 1,000 lines of code. It is this code that BEAT will use to extract,
transform, and load the documents in a user-friendly format into the BEAT system (MS Excel Application).
The system then runs “super-macros” (leading code that will run the pertinent routines in the proper
order) in order to finalize the transformation of the data using MS Excel VBA. This process happens for
both the R-1 and R-2 data.
BEAT is a tool that is used in two stages. The first stage utilizes the R-1 data from the President’s Budget
files. The R-1’s were collected from the Defense Technical Information Center (DTIC). Data collection
resulted in files from the year 1998 until 2017. As stated in the previous section, the R-1 data contains
budget information for the requested year, and the two previous years; hence will be used to identify
historic trends in budget requests.
The second stage utilizes the R-2 data from the President’s Budget. The R-2’s provide greater detail than
the R-1’s. The R-2’s provide the current year request, the two previous years of spending data, and four
years worth of projections for a specific program element. BEAT uses the future data to show users how
projections and requests change from fiscal year to fiscal year, over sequential President Budget
submissions.
In order to identify historic trends the BEAT system uses an Excel Add-in called Smart Charts. Smart Charts
was developed by a company called DevScope and downloaded from the Windows App Store. The cost
for Smart Charts was $5.00. Smart Charts allows for time-series data to be graphed in multiple manners
and includes a dynamic aspect. The charts selected can be filtered dynamically and a time-series video
can be played to show how the data changes over time; in this case the time factor is the President’s
Budget submission years.
R-1 Budget Data Exploration (Past Years)
The BEAT system can show data in multiple ways: Tree Maps, Pie Charts, Bar Graphs, and Bubble Charts
(See Figure 11. BEAT system R-1 graphing options). At a macro level, this tool is meant to show you how
the service’s or agency’s share of the budget changes over time. We also used this to show the annual
change of appropriated funds from year to year.

15
Figure 11. BEAT system R-1 graphing options
Identifying services or agencies of interest is based on the user’s research. Hovering over a service or
agency will show the user a spark chart of the data over time. Based on the filters set in Figure 12. Spark
Charts within BEAT (Smart Charts), the user is able to identify the absolute change in budget requests
from the President’s Budget submissions from 1998-2017. This hovering spark chart allows the user to
quickly scroll through the chart to identify the service or agency of interest.
Figure 12. Spark Charts within BEAT (Smart Charts)

16
By selecting DARPA, you will be able to see the program elements DARPA is funding. The filters were
changed in “Figure 13. DARPA drill-down to show PE's within” to show the absolute change in budget
requests, and includes each program element title. Again, you may hover over the program element
names in order to show a spark chart of the funding requests within that specific program element.
Selecting a program element will show that specific program element only, which may not be useful as it
will be the only item on the chart.
Figure 13. DARPA drill-down to show PE's within
R-2 Budget Data Exploration (Future Years)
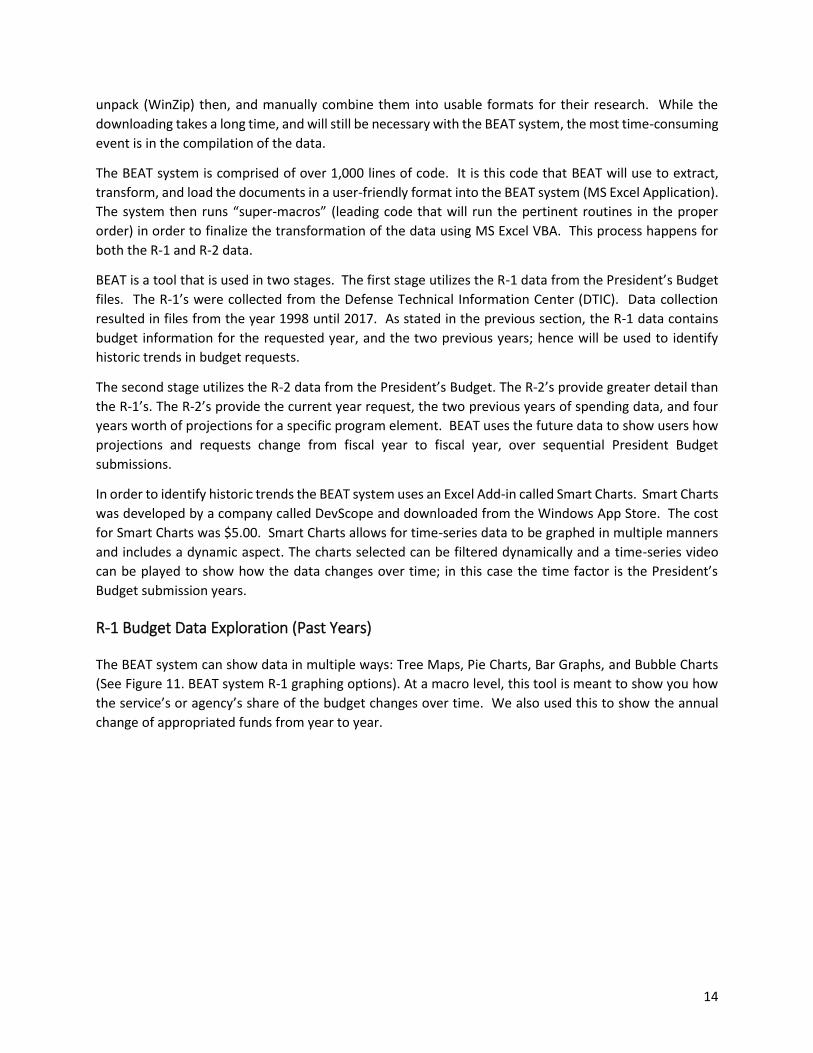
After identifying a program element of interest, the user can begin stage two of the BEAT system by
delving into the projections of the R-2 budget documents. The R-2 portion of the BEAT system was
developed using MS Excel and VBA and provides visual charts to show the user how the projections for a
specified fiscal year change as the fiscal year approaches. As shown in “Figure 14. R-2 excerpts from PB13-
PB17, identifying FY17” the projections for fiscal year 2017 increased approximately 60% over 5 years;
from $15.839 Million in 2013 to $25.466 Million in 2017. These are the trends shown in stage 2 of the
BEAT system in “Figure 15. R-2 Graph of Electronic Warfare Technology”.
17
Figure 14. R-2 excerpts from PB13-PB17, identifying FY17
Figure 15. R-2 Graph of Electronic Warfare Technology

18
Identifying changes in projected funding can assist stakeholders in identifying the key technologies that
are gaining funding. This will assist companies trying to gain a foothold in federal contracting by giving
them the insights needed to identify key opportunities for their business units.
There are over 500 program elements to choose from, so it is important to make the tool user-friendly.
The R-2 section of the BEAT system allows the user to search and filter to see only the data requested.
“Figure 16. BEAT (R-2) system user-interface” shows the filtering options available to the user. The user
can filter the program elements based on the fiscal year of interest (default is 2017) which is the year
whose value will be shown as requested across President’s Budget submissions. The user can also filter
by Service or Agency (e.g. Army, DARPA, etc.), by budget activity (i.e. BA2 – BA4), and/or use the text
search capability. The listing of program elements will dynamically filter itself upon each selection
showing the user the program elements based on the filters selected.
Figure 16. BEAT (R-2) system user-interface
Once the user has selected the program element(s) to research further, the user presses the “OK” button.
That will populate the graph with the selected program elements using the data requested. As shown in
“Figure 17. Advanced Aerospace Systems data for FY17 by PB submission year ($ Millions)”, the user will
be presented with the graph, displaying a legend of the selected program elements, data markers to alert
the user to the amount depicted, and specific markers. The markers alert the user to the specific budget
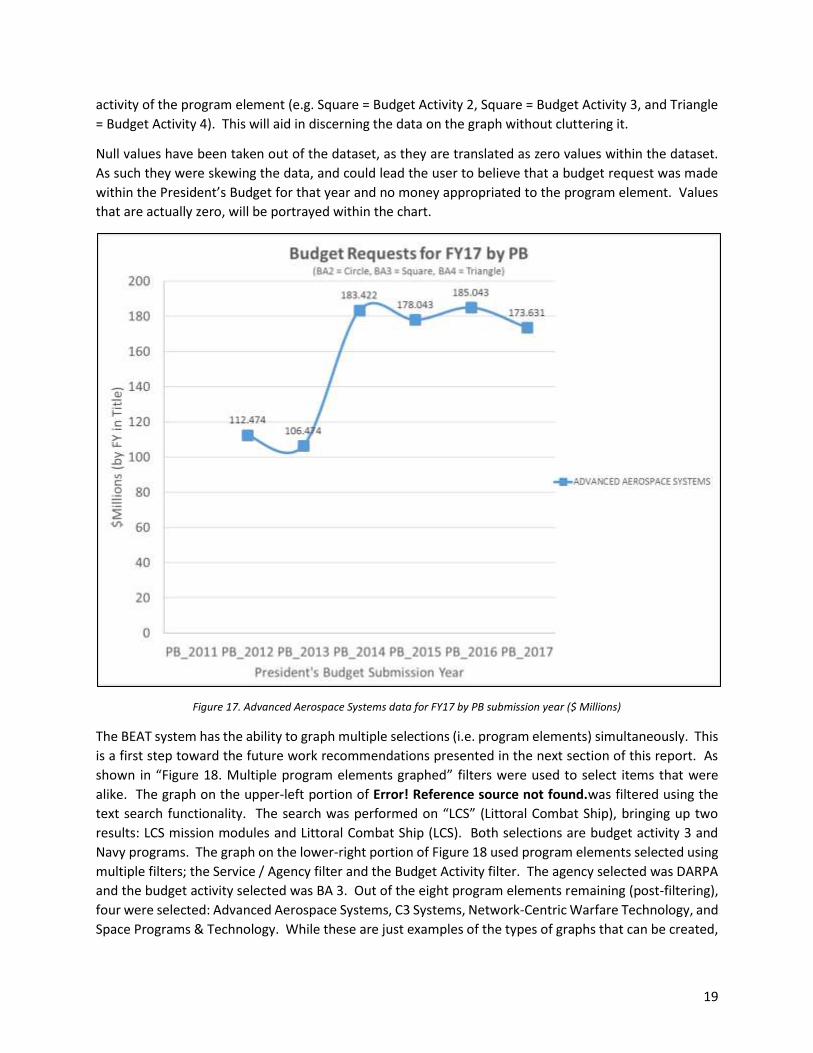
19
activity of the program element (e.g. Square = Budget Activity 2, Square = Budget Activity 3, and Triangle
= Budget Activity 4). This will aid in discerning the data on the graph without cluttering it.
Null values have been taken out of the dataset, as they are translated as zero values within the dataset.
As such they were skewing the data, and could lead the user to believe that a budget request was made
within the President’s Budget for that year and no money appropriated to the program element. Values
that are actually zero, will be portrayed within the chart.
Figure 17. Advanced Aerospace Systems data for FY17 by PB submission year ($ Millions)
The BEAT system has the ability to graph multiple selections (i.e. program elements) simultaneously. This
is a first step toward the future work recommendations presented in the next section of this report. As
shown in “Figure 18. Multiple program elements graphed” filters were used to select items that were
alike. The graph on the upper-left portion of Error! Reference source not found.was filtered using the
text search functionality. The search was performed on “LCS” (Littoral Combat Ship), bringing up two
results: LCS mission modules and Littoral Combat Ship (LCS). Both selections are budget activity 3 and
Navy programs. The graph on the lower-right portion of Figure 18 used program elements selected using
multiple filters; the Service / Agency filter and the Budget Activity filter. The agency selected was DARPA
and the budget activity selected was BA 3. Out of the eight program elements remaining (post-filtering),
four were selected: Advanced Aerospace Systems, C3 Systems, Network-Centric Warfare Technology, and
Space Programs & Technology. While these are just examples of the types of graphs that can be created,

20
based on the user’s filtering preferences, more in-depth case studies were performed in order to provide
a proof of concept for the BEAT system.
Figure 18. Multiple program elements graphed
Future Opportunities
While we are able to graph the program elements from different services and budget activities on the
same chart, there are much more in depth and cross-program analyses that are possible. Building the
macros to allow such analysis would be a good future project for this class or could be done by the
sponsor. It allowed us to show a proof of principle (Figure 19. Analysis ACROSS BAs, Services, Agencies).
The future of this tool will be to take the analysis ACROSS budget activities and services / agencies.

21
Figure 19. Analysis ACROSS BAs, Services, Agencies
Program Elements are the top layer of the “analytical onion”. Underneath program elements, there are
projects listed within (one or more). Each project, in turn, has multiple accomplishments (one or more)
that comprise the project. This layering effect provides more detail and different information the further
you drill down. For an example, see below:
PE: 0603286E / Advanced Aerospace Systems (DARPA)
Project: AIR-01 / Advanced Aerospace Systems o Accomplishments:
Tactically Exploited Reconnaissance Node (TERN) Collaborative Operations in Denied Environments (CODE) Hypersonic Air-breathing Weapon Concept (HAWC) Tactical Boost Glide Advanced Aerospace System Concepts Technology for Enriching and Augmenting Manned-Unmanned Systems Vertical Take-off and Landing (VTOL) Technology Demonstrator Distributed Fires Advanced Full Range Engine (AFRE)
The data currently displayed within the BEAT system lends itself well to data analytics. Future work
involves the projection beyond the FYDP (four years in the future), (Figure 20. Excerpt from PB17, showing

22
FYDP+). There is an abundance of data that can be used as the training data to test the model or models
developed. Projections could be used to alert users to trends of interest (i.e. increase, decrease, or steady
funding profiles). The trends identified will be useful to government contractors looking to identify the
lines of business that represent opportunities to remain in, research the feasibility of getting in, and
research the feasibility of divesting. The opportunities identified relate directly to the trends of the
Science & Technology fields and whether they are increasing, decreasing, or remaining steady.
Figure 20. Excerpt from PB17, showing FYDP+
Another opportunity for future work would be delving deeper into the data within the R-2 budget exhibits
using machine learning techniques. The data within the R-2 budget documents below the program
element level contains more diverse data than at the program element level. The projects and
accomplishments have much more verbiage defining them. This verbiage lends itself to natural language
processing, support vector machine (SVM), and K-Nearest Neighbors (KNN) models (See Figure 21. Excerpt
from R-2, showing Accomplishment description). The output analysis of these types of models could alert
the user to specific projects and/or accomplishments relating to their areas of expertise, for further
research by the user.
Figure 21. Excerpt from R-2, showing Accomplishment description
Accomplishments
As the BEAT System team, we have been successful in many ways. We have been able to provide a proof
of concept tool for our sponsor that drastically reduces the amount of time spent parsing and compiling
the disparate files related to the R-1 and R-2 budget exhibits. The bulk of the “set-up” time will still be
the downloading of the documents. The R-1 documents are readily available in MS Excel format on
Comptroller’s website (http://comptroller.defense.gov/Budget-Materials/#detailed), but the time-
consuming portion will be the download of the R-2 budget documents. The R-2 budget documents are
housed in many locations. Services (i.e. Navy, Air Force, Army) are posted on the service specific
comptroller website grouped by budget activity, while the agencies (i.e. DARPA, MDA, etc.) are posted in
multiple documents indexed by their respective budget activity levels (Defense Technical Information
Center 2016). The documents to download are in .PDF format, with the appropriate .XML files attached
to the parent document as a .ZIP file.

23
Once the files are unzipped, and located on the computer of the analyst, they can easily be run through
the extract, transform, and load (ETL) phases. This portion of the BEAT system does the parsing and
compilation work of the analyst. This process is the MASSIVE time-saver that will allow the analyst to
concentrate his/her time on the analysis and research portion of their work.
Trends are easily identified within the BEAT system using the graphing capabilities and custom user-
interfaces within the tool. The analyst has many options, in terms of filters, to gain valuable information
quickly of the processed data. This allows the analyst to customize the work being completed, and back
up the analysis with graphs, solidifying their position within the analysis.
Decision Points
The BEAT system team has validated the intent of this project and is able to offer decision points for the
sponsor. The sponsor will need to identify the next analytic opportunity based on the decision points
chosen or creating their own vision of where to take this tool. Options for the continuation of this project
include:
Deep dive into the R-2 budget exhibits o Projects o Accomplishments o Plans
Data Models o Natural Language Processing (descriptions) o Forecasting (FYDP+)
Program Management
After requirements elicitation was completed with the customer, and agreed upon, a Work Breakdown
Structure (WBS) was developed to gauge the price of the contract. The Statement of Work (SOW) will
serve as a delimiter for the work to be performed.
The cost for the entirety of the project was estimated to be $66,446.81 and designated as a non-fixed cost
contract. Any changes by the customer after the SOW has been signed, such as additional work, change
of requirements, change in the schedule; will change the cost of the project, and a new SOW shall be
drafted, and signed. There are 30 hours allocated in the contract to meet with knowledge experts, and
consultants at a rate of $300.00 per hour. If extra consultant hours are needed, the developer will need
authority to proceed from the customer.
This is the Work Breakdown Structure developed to plan, control, and integrate the BEAT concept. There
are four major areas for the successful completion of the project as follows:
Analysis
Design
Implementation
Verification & Validation (V&V)

24
In the Analysis phase, special attention was devoted to the project overview in order to get a better idea
of what needed to be developed. Early collaboration with the sponsor was a major aid in the notion of
what the customer expects from the project team. Also, in this phase, being able to define the problem
with those who would eventually use the tool was beneficial in eliciting requirements.
There were three Customer meetings scheduled to review the progress being made by the developer of
the project. Customers are expected to interact with the developers for purposes of achieving the
requirements of the project.
Figure 22. BEAT Work Breakdown Structure
In the design phase, a CONOPS was developed and later on formalized with the aid of Use Cases derived
from the customer. Once the use cases were developed, formal Mission requirements emerged, and later
on systems requirements flowed naturally to the lower levels. Once a firm base of requirements was
established, the data model was developed to form the structure of the BEAT tool.
In the Implementation phase, a database was designed to hold the information researched from the
different Program Elements (PE) that will reside in the R-1 & R-2 data tables. The database was tested to
make sure its components worked correctly, and that CRUD operations could be performed. Also, the
visualization capabilities were developed, thereby satisfying one of the main components of the
requirements.
In the V&V phase, the operations of the database were tested with the data integrity and validation of
the visualization. After correct operation of the database was assessed as working as expected, the data
25
analysis tools were designed to make the reports and visualization user-friendly. Each of these
components was tested by the use cases.
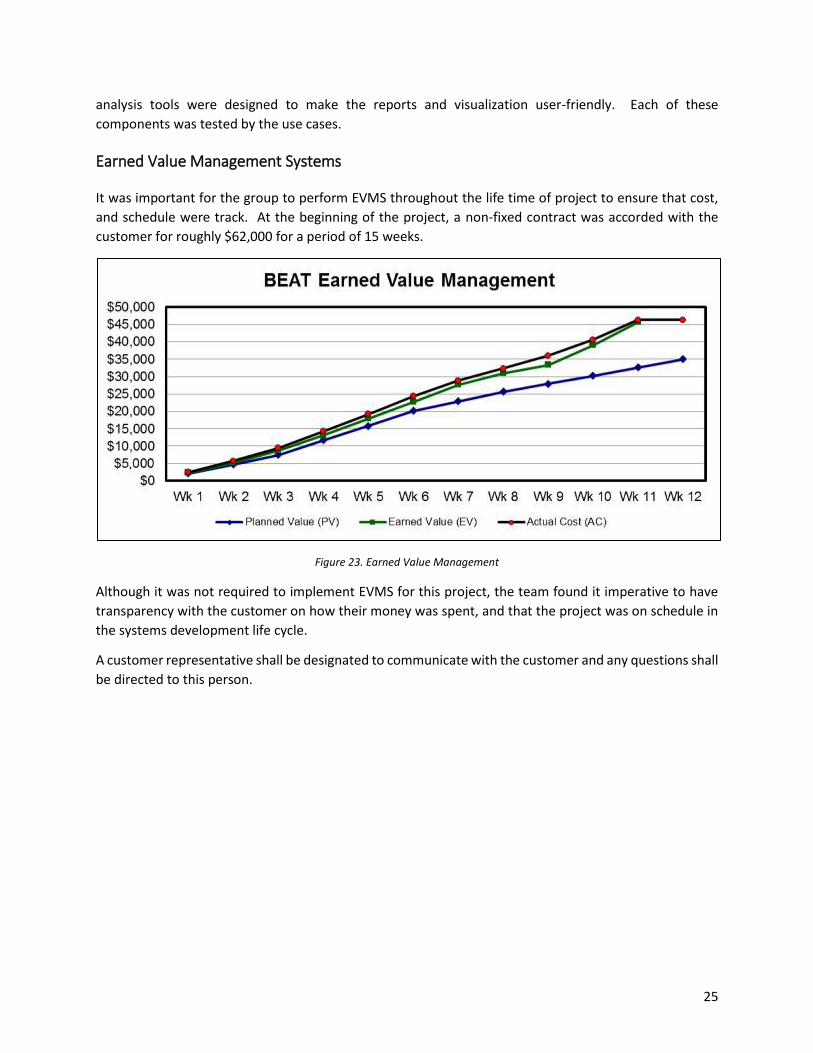
Earned Value Management Systems
It was important for the group to perform EVMS throughout the life time of project to ensure that cost,
and schedule were track. At the beginning of the project, a non-fixed contract was accorded with the
customer for roughly $62,000 for a period of 15 weeks.
Figure 23. Earned Value Management
Although it was not required to implement EVMS for this project, the team found it imperative to have
transparency with the customer on how their money was spent, and that the project was on schedule in
the systems development life cycle.
A customer representative shall be designated to communicate with the customer and any questions shall
be directed to this person.

26
References
.govini. Accessed 2016. "US Department of Defense Third Offset Standard Market Taxonomy." Analyst
Report, Washington, D.C.
American Association for the Advancement of Science. 2016. Guide to the President's Budget Research &
Development FY2017. Washington, D.C.: AAAS.
Belasco, Amy. 2015. Defense Spending and the Budget Control Act Limits. US Defense Policy and Budget,
Washington, D.C.: Congressional Research Service.
Defense Technical Information Center. 2016. August 30. Accessed August 30, 2016.
http://www.dtic.mil/dodinvestment/#/home.
—. 2016. September 17. Accessed September 17, 2016.
http://www.dtic.mil/dodinvestment/html/Budget_Activity_RDDS.pdf.
2016. Research & Engineering Enterprise: EXCOM. Accessed October 3, 2016.
http://www.acq.osd.mil/chieftechnologist/COIs.html.
Rugy, Veronique de. 2013. High Levels of Government Spending Become Status Quo. Fairfax: Mercatus
Center. http://mercatus.org/sites/default/files/update-federal-spending-per-capita-analysis.pdf.
Systems Planning and Analysis, Inc. 2016. Systems Planning and Analysis, Inc. September 17. Accessed
September 17, 2016. www.spa.com.

A-1
Appendix A – Budget Activity Definitions
(Defense Technical Information Center 2016)
Budget Activity 1, Basic Research
Basic research is systematic study directed toward greater knowledge or understanding of the
fundamental aspects of phenomena and of observable facts without specific applications towards
processes or products in mind. It includes all scientific study and experimentation directed toward
increasing fundamental knowledge and understanding in those fields of the physical, engineering,
environmental, and life sciences related to long-term national security needs. It is farsighted high payoff
research that provides the basis for technological progress. Basic research may lead to: (a) subsequent
applied research and advanced technology developments in Defense-related technologies, and (b) new
and improved military functional capabilities in areas such as communications, detection, tracking,
surveillance, propulsion, mobility, guidance and control, navigation, energy conversion, materials and
structures, and personnel support. Program elements in this category involve pre-Milestone A efforts.
Budget Activity 2, Applied Research
Applied research is systematic study to understand the means to meet a recognized and specific need. It
is a systematic expansion and application of knowledge to develop useful materials, devices, and systems
or methods. It may be oriented, ultimately, toward the design, development, and improvement of
prototypes and new processes to meet general mission area requirements. Applied research may
translate promising basic research into solutions for broadly defined military needs, short of system
development. This type of effort may vary from systematic mission-directed research beyond that in
Budget Activity 1 to sophisticated breadboard hardware, study, programming and planning efforts that
establish the initial feasibility and practicality of proposed solutions to technological challenges. It includes
studies, investigations, and non-system specific technology efforts. The dominant characteristic is that
applied research is directed toward general military needs with a view toward developing and evaluating
the feasibility and practicality of proposed solutions and determining their parameters. Applied Research
precedes system specific technology investigations or development. Program control of the Applied
Research program element is normally exercised by general level of effort. Program elements in this
category involve pre-Milestone B efforts, also known as Concept and Technology Development phase
tasks, such as concept exploration efforts and paper studies of alternative concepts for meeting a mission
need.
Budget Activity 3, Advanced Technology Development (ATD)
This budget activity includes development of subsystems and components and efforts to integrate
subsystems and components into system prototypes for field experiments and/or tests in a simulated
environment. ATD includes concept and technology demonstrations of components and
subsystems or system models. The models may be form, fit and function prototypes or scaled models that
serve the same demonstration purpose. The results of this type of effort are proof of technological
feasibility and assessment of subsystem and component operability and producibility rather than the
development of hardware for service use. Projects in this category have a direct relevance to identified
military needs. Advanced Technology Development demonstrates the general military utility or cost

A-2
reduction potential of technology when applied to different types of military equipment or techniques.
Program elements in this category involve pre-Milestone B efforts, such as system concept
demonstration, joint and Service-specific experiments or Technology Demonstrations and generally have
Technology Readiness Levels of 4, 5, or 6. Projects in this category do not necessarily lead to subsequent
development or procurement phases, but should have the goal of moving out of Science and Technology
(S&T) and into the acquisition process within the future years defense program (FYDP). Upon successful
completion of projects that have military utility, the technology should be available for transition.
Budget Activity 4, Advanced Component Development and Prototypes (ACD&P)
Efforts necessary to evaluate integrated technologies, representative modes or prototype systems in a
high fidelity and realistic operating environment are funded in this budget activity. The ACD&P phase
includes system specific efforts that help expedite technology transition from the laboratory to
operational use. Emphasis is on proving component and subsystem maturity prior to integration in major
and complex systems and may involve risk reduction initiatives. Program elements in this category involve
efforts prior to Milestone B and are referred to as advanced component development activities and
include technology demonstrations. Completion of Technology Readiness Levels 6 and 7 should be
achieved for major programs. Program control is exercised at the program and project level. A logical
progression of program phases and development and/or production funding must be evident in the FYDP.
Budget Activity 5, System Development and Demonstration (SDD)
SDD programs have passed Milestone B approval and are conducting engineering and manufacturing
development tasks aimed at meeting validated requirements prior to full-rate production. This budget
activity is characterized by major line item projects and program control is exercised by review of
individual programs and projects. Prototype performance is near or at planned operational system levels.
Characteristics of this budget activity involve mature system development, integration and demonstration
to support Milestone C decisions, and conducting live fire test and evaluation and initial operational test
and evaluation of production representative articles. A logical progression of program phases and
development and production funding must be evident in the FYDP consistent with the Department’s full
funding policy.
Budget Activity 6, RDT&E Management Support
This budget activity includes research, development, test and evaluation efforts and funds to sustain
and/or modernize the installations or operations required for general research, development, test and
evaluation. Test ranges, military construction, maintenance support of laboratories, operation and
maintenance of test aircraft and ships, and studies and analyses in support of the RDT&E program are
funded in this budget activity. Costs of laboratory personnel, either in-house or contractor operated,
would be assigned to appropriate projects or as a line item in the Basic Research, Applied Research, or
ATD program areas, as appropriate. Military construction costs directly related to major development
programs are included.
Budget Activity 7, Operational System Development
This budget activity includes development efforts to upgrade systems that have been fielded or have
received approval for full rate production and anticipate production funding in the current or subsequent
fiscal year. All items are major line item projects that appear as RDT&E Costs of Weapon System Elements

A-3
in other programs. Program control is exercised by review of individual projects. Programs in this category
involve systems that have received Milestone C approval. A logical progression of program phases and
development and production funding must be evident in the FYDP, consistent with the Department’s full
funding policy.

B-1
Appendix B - List of Acronyms
ACD&P Advanced Component Development & Prototypes
ASD(R&E) Assistant Secretary of Defense (Research & Engineering)
ATD Advanced Technology Demonstration
BCA Budget Control Act
BEAT Budget Exhibit Analysis Tool
BLI Budget Line Item
COI Communities of Interest
CSV Comma Separated Values
DEPSECDEF Deputy Secretary of Defense
DoD Department of Defense
DoN Department of the Navy
DTIC Defense Technical Information Center
EVMS Earned Value Management System
FFRDC Federally Funded Research & Development Center
FYDP Future Years Defense Program
JTAAD Joint Air Force & Analysis Division of SPA
LCS Littoral Combat Ship
MILCON Military Construction
MILPER Military Personnel
O&M Operations and Maintenance
OCO Overseas Contingency Operations
OSAG Operations Support Analysis Group of SPA
OSD Office of the Secretary of Defense
PB President's Budget
PE Program Element
PROC Procurement
R&D Research & Development
RDT&E Research, Development, Test & Engineering
S&T Science & Technology
SDD Systems Development & Demonstration
SECDEF Secretary of Defense
SOW Statement of Work
SPA Systems Planning and Analysis, Inc.
SQL Structured Query Language
UARC University-Affiliated Research Center
USA United States Army
USAF United States Air Force
VBA Visual Basic for Applications
WBS Work Breakdown Structure
XML Extensible Markup Language

C-1
Appendix C – Use Cases
Use Case 1: Run R-1/R-2 Load Batch Job
Characteristic Information
Goal In Context: Load downloaded R-1/R-2 file into database via batch job
Scope: Java Batch Application, Database
Level: Sub-Functionality
Pre-Condition: R-1/R-2 file downloaded from DTIC website
Success End Condition: Batch job successfully, data loaded into database
Minimal Guarantees: Database is set up
Primary Actor: User: analyst interested in performing analysis on budget data
Trigger Event: R-1/R-2 file downloaded from DTIC website and moved to
staging directory
Main Success Scenario
Table 3. Use Case 1 - Success Criteria
Step Actor Action Description
1 User Execute command to R-1 batch job
2 R-1BatchJob Read R-1 batch job
3 R-1BatchJob Write R-1 job to Database
4 Database Send R-1 Job completion Receipt
5 User Execute command to R-2 batch job
6 R-2BatchJob Read R-2 batch job
7 R-2BatchJob Write R-2 job to Database
8 Database Send R-2 Job completion Receipt
C-2
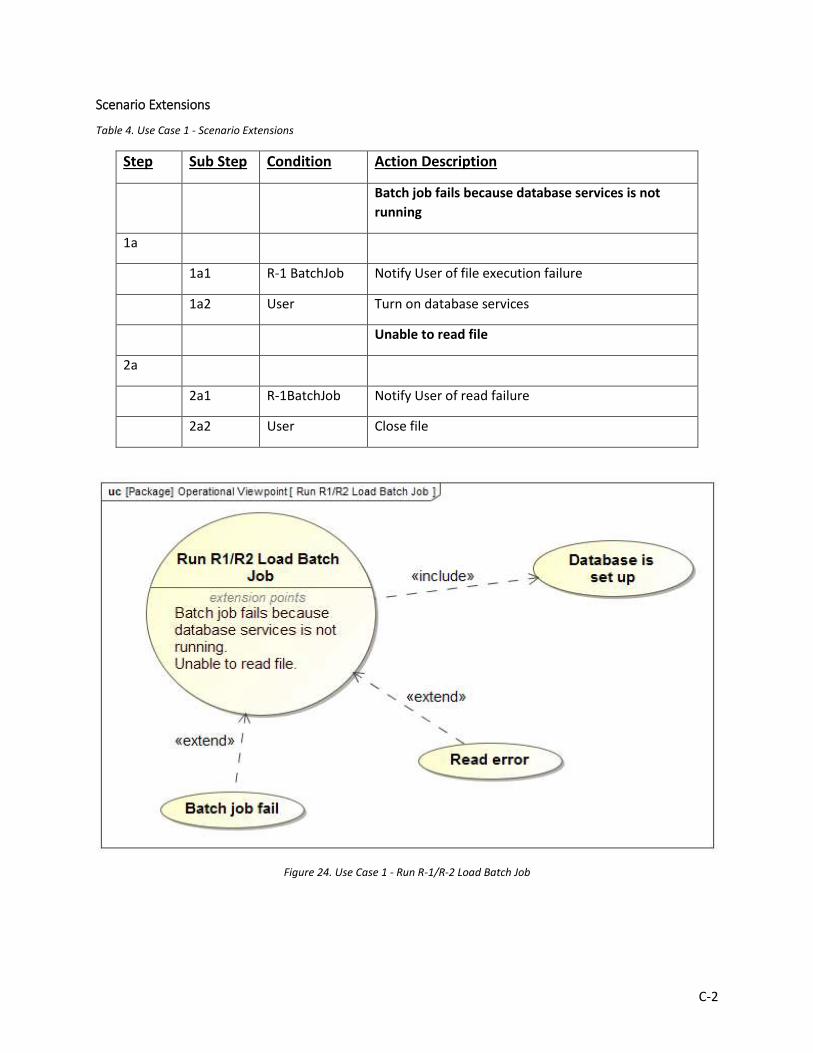
Scenario Extensions
Table 4. Use Case 1 - Scenario Extensions
Step Sub Step Condition Action Description
Batch job fails because database services is not
running
1a
1a1 R-1 BatchJob Notify User of file execution failure
1a2 User Turn on database services
Unable to read file
2a
2a1 R-1BatchJob Notify User of read failure
2a2 User Close file
Figure 24. Use Case 1 - Run R-1/R-2 Load Batch Job
C-3
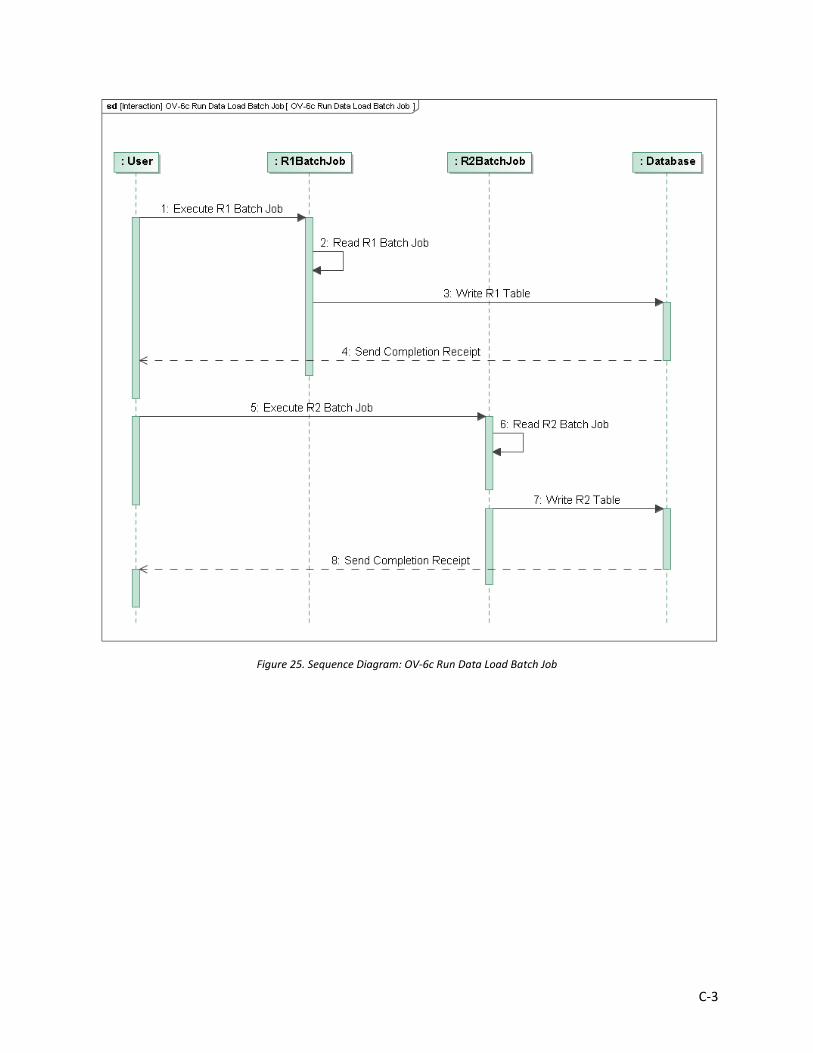
Figure 25. Sequence Diagram: OV-6c Run Data Load Batch Job

C-4
Use Case 2: Run Excel Generator Job
Characteristic Information
Goal In Context: User runs Excel Generator batch job to create data to be
exported to Excel
Scope: Database, Java batch application, Excel visualization tool
Level: Sub-Functionality
Pre-Condition: MS Excel must be loaded into machine. BVA tool kit must be
enabled
Success End Condition: Batch application successful, Excel file created, VBS script
executed
Minimal Guarantees:
Primary Actor: User: analyst who wants to extract data from database and
visualize the data
Trigger Event: User starts batch job
Main Success Scenario
Table 5. Use Case 2 - Success Criteria
Step Actor Action Description
1 User Start R-1 batch job
2 R-1BatchJob Retrieve R-1 data
3 Database Send R-1 File
4 R-1BatchJob Read R-1 Excel file
5 R-1BatchJob Send command to execute R-1 VBA Macro
6 ExcelGeneratorJob Execute R-1 VBA Macro
7 ExcelGeneratorJob Send R-1 File job completion
8 User Receive R-1 completion receipt
Scenario Extensions
Table 6. Use Case 2 - Scenario Extensions

C-5
Step Sub
Step
Condition Action Description
VBA Macro fails to execute
6a
6a1 ExcelGeneratorJob Notify User of VBA execution failure
6a2 User Reset Excel Macro capabilities
Figure 26. Use Case 2 - Run Excel Generator Job

C-6
Figure 27. Sequence Diagram: OV-6c Run Excel Generator Job

C-7
Use Case 3: Perform R-1/R-2 Data Visualization
Characteristic Information
Goal In Context: User wants to graph and visualize R-1/R-2 data
Scope: ExcelGeneratorJob has the capability to graph and display R-1/R-
2 data
Level: Sub-Functionality
Pre-Condition: MS Excel add-in “SmartCharts” (by DevScope) must be installed
Success End Condition: Visualization successfully loads data and filters
Minimal Guarantees:
Primary Actor: User: interested in visualizing R-1 data and filters
Trigger Event: Visualization requests user to load data
Main Success Scenario
Table 7. Use Case 3 - Success Criteria
Step Actor Action Description
1 User Launch Smart Chart Tool
2 ExcelGeneratorJob Populate R-1 Data
3 ExcelGeneratorJob Populate R-2 Data
4 ExcelVisualizationTool Send data receipt to user
5 User Select data to be graphed
6 User Filter PE list
7 User Search for specific PE
8 ExcelVisualizationTool Graph R-1 data
9 ExcelVisualizationTool Graph R-2 data
10 ExcelVisualizationTool Display R-1 data in smart chart add-on to user
11 ExcelVisualizationTool Display R-2 data in smart chart add-on to user

C-8
Scenario Extensions
Table 8. Use Case 3 - Scenario Extensions
Step Sub Step Condition Action Description
PE is not in the query list
6a
6a1 R-1 Batch Job Notify User PE cannot be found
6a2 User Search for another PE

D-1
Appendix D – System Architecture
Figure 28. DIV-1 Conceptual Data Model

D-2
Figure 29. OV-5b: Operational Activity Model


![UNCLASSIFIED AD NUMBER - DTIC › dtic › tr › fulltext › u2 › 818959.pdf · I AFFD, z-TR-W 3197PAR] I FATIGUE STRENGTH DESIGN AND ANALYSIS "OF AIRCRAFT STRUCTURESPA-AT I](https://img.pdfslide.us/doc/110x75/5f27580ee5951c5c18742170/unclassified-ad-number-dtic-a-dtic-a-tr-a-fulltext-a-u2-a-i-affd.jpg)