Embed Size (px)
Citation preview

7th ECCOMAS Thematic Conference on Smart Structures and Materials
SMART 2015
A.L. Araújo, C.A. Mota Soares, et al. (Editors)
© IDMEC 2015
DESIGN, MANUFACTURE, AND TESTING OF A SEAMLESS MORPHING CONCEPT FOR A SMART AIRCRAFT WINGTIP
Christof Nagel*, Arne Fiedler†, Oliver Schorsch†, Andreas Lühring†
*Fraunhofer Institute for Manufacturing Technology and Advanced Materials (IFAM) Wiener Straße 12, 28359 Bremen, Germany
[email protected] †[email protected]
†[email protected] †Andreas.Lü[email protected]
Key words: Adaptive Wing, Modeling, Experimental validation, Elastomer
Summary: This study is focused on the mechanical properties of an adaptive elastomeric part, developed for potential application in smart wings. Elastomer precursor was used to manufacture a bonded, deformable part, which is used to close the variable gap between a moving part and a non-moving part of a wing section. The basic functionality of the part is to take up the geometric gap change and to turn it into strain. In this way, a smooth transition between the connected surfaces can be obtained. An elastomeric material, which was optimized for the specific application, was investigated. The tests involve static loads, fatigue loads, and physical aging in the temperature range from –55°C to +80°C. A constitutive material model was developed and subsequently used in order to predict the properties of the adaptive part. Finally, a prototype of the part was manufactured and tested.
1 INTRODUCTION
Adaptive wings are considered as a potential means to reduce fuel consumption of civil aircrafts. Common solutions to adaptive wings typically involve rigid body movements (‘swing-wing’) or camber variations (‘mission adaptive wing’) of the whole wing or large parts of it, but these are only used in military aircraft due to high cost [1, 2]. In civil aircraft applications, research is currently focused on local solutions, which mediate small move-ments sufficient to reduce fuel consumption [3]. One potential solution is a ‘Wingtip with Active Trailing Edge’ (WATE) which was designed as a part of an adaptive wing, Figure 1. The WATE is equipped with a tab, and therefore a variable gap exists between the tab and the structure. If the gap would be closed, the efficiency of the system could be improved. A possible approach is to close the gap by an adaptive part, and the basic idea followed here is to keep continuity between aerodynamic surfaces by the elastic deformation of solid material. Major challenges are then to obtain a highly deformable, but stable structure, which can be operated between –55°C and +80°C, and which is stable against fatigue and environmental impact. In addition, it is important that the actuator capacity needed to deform the gap filling element remains sufficiently low for the whole system to be economic. Further important issues are maintenance and repair. Simple geometric considerations for the current applica-tion show that the strains generated in the material will be in the order of 10%, which means

C. Nagel, A. Fiedler, O. Schorsch, A. Lühring
2
that potential solutions are restricted to soft elastomers. Commercial elastomers were tested as candidate materials for morphing wings by Kikuta [4]. Murray et al. [5] were able to produce and test a flexible matrix composite (FMP) with glass fibers and silicone. Bubert et al. [6] used flexible honeycomb, FMP, and additional reinforce-ment to make a morphing structure. The main issue is that most of the commercial elastomers do not provide sufficiently low stiffness in the operational temperature range since a transition exists if temperature approaches –55°C, which may be due to glass transition or cold crystallization, see, e.g. [7]. It seems that the temperature issue has been noticed, but no low-temperature test results were found for adaptive parts using silicone material. Due to multi-material design, adaptive structures contain interfaces between dissimilar materials. Therefore, the long-term properties of adhesion are crucial for the stability. Changing environmental conditions and hydraulic fluid may have a negative impact on adhesion. No results were found on the impact of exterior, land and air climatic conditions or hydraulic fluid on this type of structures. Also, manufacturing issues involved in multi-material, modular design and assembly concepts were not addressed. Major issues here are the stiffness jump at the polymer-structure interface, and the design of a non-permanent joint, which is necessary for reasons of maintenance and repair.
Figure 1: Wingtip with Active Trailing Edge (WATE).
2 DESIGN
A simple geometric consideration of the problem shown in Figure 1 indicates that the strain in the material due to tab movement is controlled by the chord length of the tab, the rotation angle of the tab, and the width of the gap in span-wise direction. For 250mm chord length and 15 degrees rotation, estimated strains are 5% at 200mm gap width and 10% at 140mm gap width. Enlargement of the gap width big enough to reduce strains below the limit of linear elastic materials, like aluminum, was not possible due to limited space at the wingtip. The tab has to have a minimum size in order to be effective at all. Chord length

C. Nagel, A. Fiedler, O. Schorsch, A. Lühring
3
reduction of the gap or reductions in the tab rotation angle were not feasible for the same reason. Additional strain is generated by the air pressure acting on the upper and lower side of the wingtip. This means that possible solutions are restricted to soft elastomers if surface continuity should be obtained by material deformation instead of sliding surfaces.
Although different kinds of reinforcement were considered in the intermediate design phase, they were not used in a prototype for reasons of simplicity. It was found that reinforcement reduced pressure induced deformations, but increased actuation forces and local strains in the elastomer. Increased actuation forces were disadvantageous since space limitations at the wingtip also imposed a size limit on the actuator. Strain increase in the elastomer was not tolerated since the material was not available at that time and the material behavior was therefore not known.
The approach to assemble the soft part to the comparatively stiff aircraft structure was to use aluminum frames, which could be bolt-mounted to the wingtip structure. A dismountable joint between the morphing part and the structure was thus obtained which is advantageous for manufacture, final assembly, maintenance, and repair.
An attempt was made to keep the manufacturing procedure as simple as possible in order to produce robust parts for demonstrators, ground tests, and wind tunnel tests. Published methods involve differential architecture, where sub-structures and skins are joined by secondary bonding. This may entail risks in the adhesion on silicone and may suffer from low bonding area on corrugated sub-structures. Here, a casting method was chosen which allowed to process elastomeric pre-cursor and ribs at once. The one-shot manufacture was seen to significantly reduce the risks involved in differential architecture. Of course, this method leads to a comparatively heavy part, but this was considered uncritical because of the low size ratio between adaptive part and wingtip.
Reductions in the material stiffness, strength, strain at fracture, or fatigue were not considered in the design phase since such data, like the material itself, were not available at that time. Rough estimates were made instead. Material selection, development, and testing were performed in parallel to the design. Details of the material selection and development can be found in [8]. Mechanical testing results are reported in sections 3 and 4.
3 MECHANICAL PROPERTIES OF HYPERFLEX-03
A flexible Hyperflex-03 elastomer was formulated specifically for application in morphing devices. Quasi-static tensile and compression tests were performed at –55°C, 23°C, and +80°C at a nominal strain rate of approximately 0.1/s (ISO 527-2 and ISO 604). A total of six specimens were tested under each condition. Stress-strain data were used to calibrate a constitutive material model and will be shown in section 5.
The material parameters derived from the tests are summarized in Table 1. It can be seen that the material behaves like a soft elastomer over the whole temperature range. The observed increase in strain at fracture with decreasing temperature is useful because most of the operation cycles will occur at low temperature. Poisson’s ratio ν as determined by video analysis is close to 0.5 indicating that the material is incompressible. The value at 80°C is given in parantheses since it is larger than 0.5, which is impossible for homogeneous materials. This effect is due to the relatively high value of ν for this material and the sensitivity of the test method. The result is plausible if one standard deviation is subtracted from the mean value. If it is assumed that ν is independent of temperature, the measured values of ν can be averaged, using the inverse squared standard deviation as weight. This leads to a physically reasonable interval of ν = 0.47±0.02.

C. Nagel, A. Fiedler, O. Schorsch, A. Lühring
4
In the compressive mode, samples were tested until 70% nominal compression. Upon unloading, the initial sample shape restored immediately. This means that the material does not fail if the nominal compression is kept below 70%. The tear strength was measured in accordance with DIN 53515 using Graves shaped samples at a test speed of 500mm/min. Results given in Table 1 show that there is significant tear strength but in comparison to typical sealing elastomers, the measured values tend to be low.
Temperature Initial elastic
modulus Strain at fracture Tensile strength Tear strength Poisson's ratio
[°C] [MPa] [%] [MPa] [N/mm] [--]
–55 2.33 ± 0.09 309 ± 66 10.08 ± 1.78 28.94 ± 4.71 0.46 ± 0.0323 1.96 ± 0.05 173 ± 11 5.49 ± 0.38 12.90 ± 2.70 0.47 ± 0.0380 1.90 ± 0.06 140 ± 10 4.88 ± 0.39 4.93 ± 2.00 (0.59 ± 0.08)
Table 1: Mechanical properties of Hyperflex-03 at a strain rate of ~0.1/s and indicated temperatures.
4 PROPERTIES OF HYPERFLEX-03 JOINTS
4.1 Quasi static loading
Lap shear joints consisting of aluminum parts bonded to each other by Hyperflex-03 were prepared and tested under quasi-static and fatigue loading conditions at –55°C, 23°C, and +80°C. The purpose of these tests was to confirm stability of adhesion between the elastomer and the aluminum parts and the generation of reference data for finite element calculations and sizing.
The aluminum parts had a length of 100mm, a thickness of 1.6mm, and a width of 25mm. The overlap length was 12mm and the bond line thickness was 2.8mm. A crosshead speed of 10mm/min was chosen for static tests, which corresponds to a nominal shear rate of 0.06/s. All samples were tested until visual damage which was coincident with a sudden load drop. From the recorded load-displacement data, the nominal shear strength, the displacement at maximum load, and the initial stiffness were calculated. The nominal shear strength was calculated as the maximum load divided by the bonding area. The initial stiffness was defined as the slope of the load-displacement curve in the range from zero to 10% nominal shear strain. Typical values shown in Table 2 will be used as reference to evaluate the environmental impact in sub-section 4.3. Load-displacement data used for constitutive model verification will be shown in section 5.
Temperature fracture
load nominal strength
displacement at max. load
slope at 10% nom. shear
[°C] [N] [MPa] [mm] [N/mm] –55 1714±371 5.28±0.94 7.18±0.75 139.05±24.52 23 1043±126 3.31±0.40 6.04±0.64 99.87±7.02
+80 774±190 2.61±0.65 4.25±0.82 100.20±10.31
Table 2: Results of quasi-static tests on single lap joints consisting of aluminum parts and HYPERFLEX-03, tested under quasi-static loading at a nominal strain rate of 0.06/s and indicated
temperatures.

C. Nagel, A. Fiedler, O. Schorsch, A. Lühring
5
4.2 Fatigue loading
Single lap shear joints were tested under cyclic loading at 23°C using harmonic load-time functions and displacement control. A displacement ratio of R = –1 was chosen in order to simulate upwards and downwards tab movements. Samples were clamped such that the asymmetric mismatch was balanced by spacers. A value of 50% stiffness change was used as failure condition because displacement control hardly produces total fracture.
Results are shown in Figure 3 using nominal strain amplitudes, which were calculated based on the assumption of a simple shear deformation mode. The nominal strain is related to the stretch ratio by ε = λ–1 and the maximum principal stretch in simple shear is defined as
41
21
22 (1)
where γ denotes the ratio between the measured displacement u and the measured adhesive layer thickness d. Statistical data analysis was applied to the 23°C test data using a power law
kfN /1
0 (2)
considering ε as controlled variable. In eq. (2), ε denotes the strain amplitude, Nf denotes the number of cycles to failure, and ε0 and k are material-dependent parameters. The fit curve is shown in Figure 3 as a dashed line. The values of the corresponding fit parameters are ε0 = 102.18±0.09% and k = (7.29±0.39). The full line represents the lower limit of the strain-life curve for 90% probability of survival, following the procedure outlined in ISO 12107:2003E, assuming a t-distribution of log(Nf) with n–2 degrees of freedom and a one-sided tolerance limit.
Figure 2: Fracture surfaces of single lap joints consisting of aluminum parts and Hyperflex-03, tested at a
nominal strain rate of 0.06/s.

C. Nagel, A. Fiedler, O. Schorsch, A. Lühring
6
cycles to failure, Nf
100 101 102 103 104 105 106 107
max
. pri
nc
ipa
l str
ain
,
[%]
20
30
40506070
200
10
100lap shear test dataE-N curveprediction limit
Figure 3: Strain-life data from displacement-controlled, fully reversed fatigue test of Hyperflex-03 single lap
joints with aluminum adherends, at room temperature and a test frequency of 5Hz.
4.3 Environmental impact
Lap shear joints as described in the preceding section were exposed to cyclic laboratory aging conditions followed by quasi-static testing. One set of samples was exposed according to simulated ‘exterior, land and air’ environment (method C in ASTM D 1183-03), one cycle consisting of 48 hours at (71±3)°C and < 10% relative humidity (r.h.), 48 hours at (23±1)°C immersed in water, 8 hours at (–57±3)°C and 100% r.h., 64 hours at (38.5±2)°C and 100% r.h. A furnace and climate chambers equipped with calibrated temperature and humidity sensors were used. A second set of samples was prepared by immersion in SKYDROL 500-B-4 at room temperature for a certain number of cycles, one cycle equal to 168 hours. After completion of one cycle, two samples were taken and tested immediately while the other samples were exposed to the next cycle. This was repeated until the last two samples had passed the last cycle. Test specifications and data evaluation were exactly as described in the section on quasi-static testing.
An overview on the joint properties after exposure to laboratory aging conditions according to method C (‘exterior, land and air’) in ASTM D 1183-03 is given in Figure 4. Error bars refer to one standard deviation and full lines represent the mean value over all cycles. Neither strength, nor displacement at maximum load, nor the initial stiffness show systematic variation with the exposure time, indicating that the material was not affected by the environmental attack.
Test results after immersion in SKYDROL 500-B-4 at room temperature are shown in Figure 5, error bars referring to the standard deviation. It can be seen that most of the joint properties are initially changed by immersion in SKYDROL, but remain stable after a couple of cycles. Strength and stiffness degrade to about 50% of their initial value, whereas the displacement at maximum load degrades to about 70%. No degradation was found in the initial stiffness at +80°C.
Visual inspection of the fracture surfaces indicated that the joints failed predominantly by cohesive fracture within the elastomer material. This means that the adhesion between

C. Nagel, A. Fiedler, O. Schorsch, A. Lühring
7
elastomer and aluminum surface is stable against static and fatigue loads at –55°C, 23°C, and +80°C.
Figure 4: Mechanical properties of Hyperflex-03 single lap joints with aluminum adherends, exposed to ASTM
D 1183-03 C ‘exterior, land and air’ conditions for a given number of cycles, and subsequently tested under quasi-static loading at given temperatures.
Figure 5: Mechanical properties of Hyperflex-03 single lap joints with aluminum adherends, immersed for a
given number of cycles in hydraulic fluid (one cycle equal to 168 hours), and subsequently tested under quasi-static loading at given temperatures.
5 CONSTITUTIVE MODEL
A model which describes the material stiffness of Hyperflex-03 is needed in order to predict the material stiffness in finite element simulations. A hyperelastic Ogden [9] material model was calibrated based on measured tension and compression test data from section 3. On the tension branch, data were cut off at 150% nominal strain since relevant strains are far below this limit. For incompressible materials, the Ogden potential has the form
n
i i
i iiiU1
3212)3(
2
(3)
Herein, λi refer to the principal stretches, n is a material parameter, and αi, μi are temperature-dependent material parameters. The initial shear modulus is given by µ0 = Σµi. A relation between nominal stress σn and stretch λ was derived from (3) for uniaxial loading,
C. Nagel, A. Fiedler, O. Schorsch, A. Lühring
8
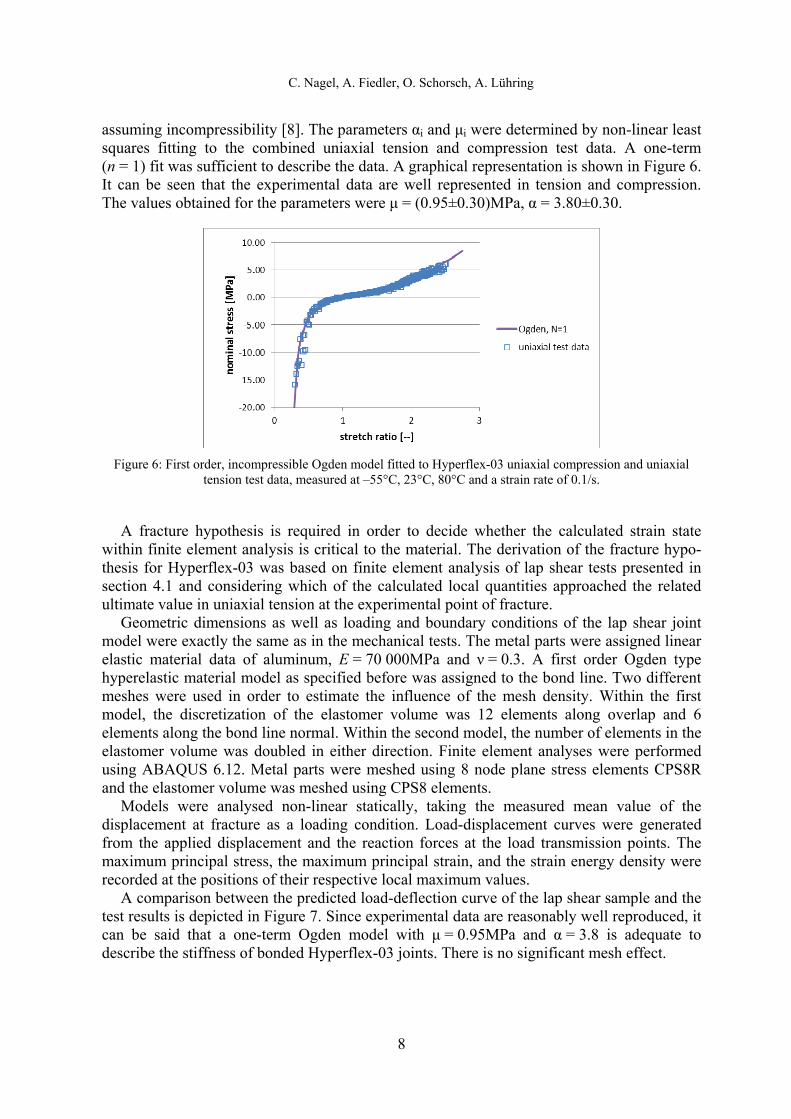
assuming incompressibility [8]. The parameters αi and μi were determined by non-linear least squares fitting to the combined uniaxial tension and compression test data. A one-term (n = 1) fit was sufficient to describe the data. A graphical representation is shown in Figure 6. It can be seen that the experimental data are well represented in tension and compression. The values obtained for the parameters were μ = (0.95±0.30)MPa, α = 3.80±0.30.
Figure 6: First order, incompressible Ogden model fitted to Hyperflex-03 uniaxial compression and uniaxial tension test data, measured at –55°C, 23°C, 80°C and a strain rate of 0.1/s.
A fracture hypothesis is required in order to decide whether the calculated strain state
within finite element analysis is critical to the material. The derivation of the fracture hypo-thesis for Hyperflex-03 was based on finite element analysis of lap shear tests presented in section 4.1 and considering which of the calculated local quantities approached the related ultimate value in uniaxial tension at the experimental point of fracture.
Geometric dimensions as well as loading and boundary conditions of the lap shear joint model were exactly the same as in the mechanical tests. The metal parts were assigned linear elastic material data of aluminum, E = 70 000MPa and ν = 0.3. A first order Ogden type hyperelastic material model as specified before was assigned to the bond line. Two different meshes were used in order to estimate the influence of the mesh density. Within the first model, the discretization of the elastomer volume was 12 elements along overlap and 6 elements along the bond line normal. Within the second model, the number of elements in the elastomer volume was doubled in either direction. Finite element analyses were performed using ABAQUS 6.12. Metal parts were meshed using 8 node plane stress elements CPS8R and the elastomer volume was meshed using CPS8 elements.
Models were analysed non-linear statically, taking the measured mean value of the displacement at fracture as a loading condition. Load-displacement curves were generated from the applied displacement and the reaction forces at the load transmission points. The maximum principal stress, the maximum principal strain, and the strain energy density were recorded at the positions of their respective local maximum values.
A comparison between the predicted load-deflection curve of the lap shear sample and the test results is depicted in Figure 7. Since experimental data are reasonably well reproduced, it can be said that a one-term Ogden model with μ = 0.95MPa and α = 3.8 is adequate to describe the stiffness of bonded Hyperflex-03 joints. There is no significant mesh effect.

C. Nagel, A. Fiedler, O. Schorsch, A. Lühring
9
displacement u [mm]
0 2 4 6 8
load
F [
N]
0
500
1000
1500
2000
2500
test dataFEM1FEM2
Figure 7: Stiffness of Hyperflex-03 lap shear joints with aluminum adherends, as predicted by finite element analyis using hyperelastic Ogden model for the elastomer and linear elastic model for aluminum. Test data
include –55°C, 23°C, and 80°C tests.
The computed local maximum values of the maximum principal strain, the maximum
principal stress, and the strain energy density were compared to their respective ultimate values given in Table 1. It was found that the computed maximum principal strain was close to the measured strain at fracture value, whereas maximum principal stress and strain energy density obeyed large deviations from the measured ultimate values. It was further found that the maximum principal strain was most insensitive to the mesh size while the maximum principal stress and strain energy density were highly sensitive. Relative errors of the computed strain with respect to the measured ultimate value were 15% at –55°C, 9% at 23°C, and 4% at 80°C.
6 PROPERTIES OF AN ADAPTIVE PART
Finite element analyses of the adaptive part (Figure 8) were performed using ABAQUS 6.12. Linear hybrid hexahedral elements with reduced integration C3D8RH were used for the elastomer. Frames were meshed with linear hexahedral elements with reduced integration C3D8R. Aluminum parts were given linear elasticity, using an elastic modulus of 70 000MPa and Poisson’s ratio of 0.3. The elastomer was assigned hyperelasticity according to eq. (3), using n = 1, μ = 0.95MPa and α = 3.8, as obtained by fitting experimental Hyperflex-03 test data. The model was loaded with different amounts of air pressure, one-sided rotation about the hinge line, and temperature, corresponding to specific load cases which represented certain flight situations.
The calculated torsional stiffness was about 2.75Nm/degree and the torque values at minimum (–15 degrees) and maximum (5 degrees) rotation were 43Nm and –14Nm, respectively; the sign of the torque value indicating the direction of rotation. The calculated figures will be compared to experimental results in the following section.
Typical strain energy density distributions are shown in Figure 8, indicating highly loaded regions. It can be seen that, at the chosen loading conditions, highly strained regions are close to the assembly frames, which is due to the constraint effect the stiff frame superimposes on the soft material.

C. Nagel, A. Fiedler, O. Schorsch, A. Lühring
10
Figure 8: Typical strain energy density distributions in an adaptive part.
Typical principal strains are shown in Table 3, given as true (logarithmic) strain.
Maximum principal strains are in the tensile range and have values between 15% and 22%, given as nominal tensile strain as computed from the true values in Table 3. The higher value appears in the climb phase and the lower values appear in the cruise load cases. If the highest calculated nominal tensile strain of 22% is compared to the related ultimate tensile strain at fracture at –55°C (Table 1), it turns out that the load on the part could be more than 10 times higher before quasi-static fracture would occur. This relates to a failure probability of 50%, if a normal distribution is assumed. If three standard deviations are subtracted from the mean value of the ultimate tensile strain at fracture at –55°C (Table 1), a failure probability of 0.001% is addressed. Also in this case, the load on the part could be increased until fracture would be expected.
Principal strains
Condition Tab angle Temperature Pressure ε1 ε2 ε3 Elm. No. [degrees] [°C] [kPa] [--] [--] [--]
climb +10 –55 10 0.197 0.046 –0.314 31668 cruise +5 –55 10 0.183 0.046 –0.300 31668 cruise –15 –55 10 0.139 0.053 –0.263 31668
Table 3: Calculated principal strains in the elastomer section of the adaptive part for different load cases (logarithmic strain).
The minimum principal strains in Table 3 have higher absolute values, but are generally compressive. If the nominal compressive strain is calculated from ε3 = –0.314, one finds a value of 27%, which is much less than the value of 70%, below which there was no failure observed in uniaxial compression tests. It can hence be concluded that the design of the part is ‘robust’ under quasi-static loading at –55°C.
If a similar consideration is done for 23°C, using ultimate tensile and compressive strains from Table 1, it can also be seen that the strains in the part are not critical. This means that in a quasi-static test at room temperature, where a tab movement of +10 degrees or –15 degrees is applied, the probability of the part to fail is very low. If a temperature of 80°C is considered, the ratio between calculated strain and ultimate strain is higher but still not critical.

C. Nagel, A. Fiedler, O. Schorsch, A. Lühring
11
Considering the strain-life curve shown in Figure 3, it can be stated that at 10% failure probability, the part could withstand between 1E5 and 1E6 full tab deflections at about 20% strain. This is a conservative estimate, since the strain-life curve was set up based on nominal strains. Local strains in the tested samples were higher due to adherend rotation. The number of fatigue cycles at 22% strain acting on the part in service is not known. It can therefore not be said whether the design is appropriate with respect to real fatigue loads. It can however be said that a fatigue test of the part at full tab deflection should not lead to failure until 1E6 cycles, which opens the perspective to verify fatigue life predictions.
7 PROTOTYPE TESTING
A prototype of a bonded elastomer part was tested at room temperature in a servo-hydraulic testing system allowing for simultaneous tension and torsion loading, as shown in Figure 9. In the specified test, the part was loaded in torsion about the rotation axis using a constant rotation velocity while the axial deformation was restricted. A tensile load is generated under this condition, acting along the rotational axis and causing additional tensile stresses in the part. This is close to the situation in service, where the part is mounted to the comparatively stiff structure of the wingtip, which does not permit deformation along the rotation axis.
test time in seconds
0 50 100 150 200 250 300
torq
ue
in N
m
-20
-10
0
10
20
30
40
50
an
gle
in
deg
rees
-20
-10
0
10
20
time vs torque time vs angle
Figure 9: Hyperflex-03 adaptive part tested at room temperature and quasi-static loading (left); typical test sequence (right).
Test speeds were between 0.25 and 0.5 degrees per second and deflections between 5 and
–15 degrees were chosen. A total of five full cycles were applied to the part. A typical loading sequence is shown in Figure 9.
Torque vs. rotation angle diagrams are depicted in Figure 10. The plots indicate that there is no change in stiffness upon repeated loading, so it can be concluded that there are no setting effects present. It can be further seen that there is no significant hysteresis. This indicates that the part behaves predominantly large-strain elastic, showing only very small viscoelastic effects, which is advantageous for feedback control in application. The measured signals were not dependent on the rotational speed applied, indicating the absence of strain rate effects in the investigated range.
The blue line in Figure 10 represents the stiffness prediction by the finite element model

C. Nagel, A. Fiedler, O. Schorsch, A. Lühring
12
as described in section 6. It can be seen that the model reasonably describes the measured stiffness of the part, indicating that calibrating the hyperelastic material model with uniaxial test data is adequate for Hyperflex-03 material. It can further be seen that the calculated torque values at minimum and maximum rotation are very close to experimental results. This means that actuator capacity for parts made of Hyperflex-03 can be chosen based on finite element analysis, if the model geometry is correct.
As predicted by finite element analysis in section 6, there was no visible damage after completion of all tests in the elastomer. The part was not tested until static failure because it should later be used for fatigue tests. Further visual inspection indicated that there was no disbonding at the interfaces, indicating good adhesion of the elastomer on the aluminum.
angle in degrees
-20 -15 -10 -5 0 5 10
torq
ue
in N
m
-20
-10
0
10
20
30
40
50
0.25 deg/sec0.50 deg/sec
angle in degrees
-20 -15 -10 -5 0 5 10
torq
ue
in N
m
-20
-10
0
10
20
30
40
50
all test dataFEM
Figure 10: Hyperflex-03 adaptive part - quasi-static test results at room temperature; absence of loading rate effect (left); finite element prediction of stiffness (right).
8 CONCLUSIONS
A concept of an adaptive part for an active wingtip was investigated. The main functionality of the part is to turn the gap change generated by tab movements into strain, while the surface continuity is conserved. Results indicate that deformable parts containing tailored elastomer Hyperflex-03 show high flexibility within the operational temperature range of aircrafts. No stiffening effect was observed as temperature approximated –55°C. It was found that Hyperflex-03 joints can substantially withstand fatigue loads at 23°C and are stable against simulated laboratory aging and immersion in hydraulic fluid. A hyperelastic material model was calibrated based on Hyperflex-03 tests and it was shown that stiffness as well as maximum forces and deformations of the adaptive part were reasonably predicted by this model. It was further shown that the maximum principal strain at the point of fracture, as calculated by finite element analysis of Hyperflex-03 joints, approached the ultimate value obtained in uniaxial tension. This was used in the consideration if cohesive failure could be avoided in quasi-static tests on Hyperflex-03 adaptive parts. Test results did not contradict the expectation that no failure would occur under the applied loads. It can hence be supposed
C. Nagel, A. Fiedler, O. Schorsch, A. Lühring
13
that the maximum principal strain can act as a comparative variable in a failure condition for Hyperflex-03 bonded parts. This should be investigated in further experiments. Future research will be focused on fatigue and the improvement of tear resistance.
ACKNOWLEDGEMENT
The research leading to these results has gratefully received funding from the European Union's Seventh Framework Program for research, technological development and demonstration under grant agreement no 284562.
REFERENCES
[1] C. Thill, J. Etches, I. Bond, K. Potter and P. Weaver, Morphing skins. The Aeronautical Journal, 3, 117-139, 2008.
[2] J. W. Smith, W. P. Lock, G. A. Payne, Variable-camber systems integration and
operational performance of the AFTI/F-111 mission adaptive wing. NASA Technical Memorandum 4370, 1992.
[3] EU Seventh Framework Program for research, technological development and
demonstration, http://www.saristu.eu/ [4] M. T. Kikuta, Mechanical properties of candidate materials for morphing wings. Thesis,
2003. [5] G. Murray, F. Gandhi, C. Bakis, Flexible matrix composite skins for one-dimensional
wing morphing. Journal of Intelligent Material Systems and Structures, 21, 1771-1781, 2010.
[6] E. A. Bubert, B. K. S. Woods, K. Lee, C. S. Kothera, N. M. Wereley, Design and
fabrication of a passive 1D morphing aircraft skin. Journal of Intelligent Material Systems and Structures, 21, 1699-1717, 2010.
[7] A. Chien, R. S. Maxwell, S. DeTeresa, L. Thompson, R. Cohenour, B. Balazs, Effects of
filler-polymer interactions on cold-crystallization kinetics in crosslinked, silica-filled polydimethylsiloxane/polydiphenylsiloxane copolymer melts. Journal of Polymer Science: Part B: Polymer Physics, 44, 1898-1906, 2006.
[8] O. Schorsch, A. Lühring, C. Nagel, R. Pecora, I. Dimino, Polymer based morphing skin
for adaptive wings. 7th ECCOMAS Thematic Conference on Smart Structures and Materials, 2015, to be published
[9] R. W. Ogden, Recent advances in the phenomenological theory of rubber elasticity.
Rubber Chemistry and Technology, 59, 361-383, 1986.