Embed Size (px)
Citation preview

Design, Implementation and Assessment of a Novel
Bioreactor for Dark Fermentative Biohydrogen Production
by
Mariam Bibi Hassan Khan
(211553330)
Submitted in fulfilment of the academic requirements of
Master of Science
Discipline of Microbiology
School of Life Sciences
College of Agriculture, Engineering and Science
University of KwaZulu-Natal
Pietermaritzburg
South Africa
25 November 2020

ii
PREFACE
The research contained in this dissertation/thesis was completed by the candidate
while based in the Discipline of Microbiology, School Life Sciences of the College of
Agriculture, Engineering and Science, University of KwaZulu-Natal, Pietermaritzburg,
South Africa. The research was financially supported by National Research
Foundation.
The contents of this work have not been submitted in any form to another university
and, except where the work of others is acknowledged in the text, the results reported
are due to investigations by the candidate.
______
Signed: Professor E.B. Gueguim Kana (Supervisor)
Date: 25 November 2020

iii
DECLARATION 1: PLAGIARISM
I, Mariam Bibi Hassan Khan, declare that:
(i.) The research reported in this dissertation, except where otherwise indicated or
acknowledged, is my original work;
(ii.) This dissertation has not been submitted in full or in part for any degree or
examination to any other university;
(iii.) This dissertation does not contain other persons’ data, pictures, graphs or other
information, unless specifically acknowledged as being sourced from other
persons;
(iv.) This dissertation does not contain other persons’ writing, unless specifically
acknowledged as being sourced from other researchers. Where other written
sources have been quoted, then:
a) Their words have been re-written but the general information attributed to them
has been referenced;
b) Where their exact words have been used, their writing has been placed inside
quotation marks, and referenced;
(v.) Where I have used material for which publications followed, I have indicated in
detail my role in the work;
(vi.) This dissertation is primarily a collection of material, prepared by myself,
published as journal articles or presented as a poster and oral presentations at
conferences. In some cases, additional material has been included;
(vii.) This dissertation does not contain text, graphics or tables copied and pasted
from the Internet, unless specifically acknowledged, and the source being
detailed in the dissertation and in the References sections.
_____ ___________
Signed: Mariam Bibi Hassan Khan
Date: 25 November 2020

iv
DECLARATION 2: PUBLICATIONS
This thesis represents a compilation of published work and manuscripts where each
chapter is an individual entity prepared as per the journals’ specifications thus some
repetition between chapters has been unavoidable. The first author (student)
conducted all experimental work, data collection and manuscript preparation, under
the guidance of the second author (supervisor).
1. Khan MBH, Gueguim Kana EB. Design, implementation and assessment of a novel
bioreactor for fermentative biohydrogen process development. International
Journal of Hydrogen Energy 2016;41:10136-10144. (Chapter 3)
2. Khan MBH, Gueguim Kana EB. Adaptation of cell Immobilization Cartridge unit to
Continuous Stirred Tank Reactor Improves dark fermentative hydrogen production.
Submitted to Renewable Energy. Under review. (Chapter 4)
______ ___________
Signed: Mariam Bibi Hassan Khan
Date: 25 November 2020
v
CONFERENCE CONTRIBUTIONS
1. Khan MBH, Gueguim Kana EB. Design, Implementation and Assessment of a
Novel Bioreactor for Fermentative Hydrogen Process Development. School of Life
Sciences Research Day. 20 May 2016. University of KwaZulu-Natal,
Pietermaritzburg, South Africa. Poster presentation.
____ ___________
Signed: Mariam Bibi Hassan Khan
Date: 25 November 2020
vi
Abstract
The majority of the world’s energy consumption and electricity generation is derived
from fossil fuel sources. Their consumption has a negative environmental impact, thus
the need for renewable energies. Hydrogen being a high energy zero carbon fuel
source presents a profound appeal. Hydrogen may be produced biologically via
various methods, this work involves dark fermentative hydrogen production (DFHP).
A review of literature on the physicochemical parameters affecting fermentative
hydrogen bioprocess was conducted. Bioreactor design was identified as a
fundamental component that regulates the overall process outcome and was therefore
analysed at length. The review highlighted that existing reactor configurations are
unable to sustain a comprehensive criteria of efficient DFHP. A consolidation of
biomass retention and non-invasive agitation were distinguished as crucial. The need
for a novel reactor configuration possessing these attributes was consequently
accentuated.
This study focuses on the design, implementation and assessment of novel bioreactor
configuration for DFHP. The vessel was formed from a 2L glass and fitted with ports.
Three 3D-printed permeable cartridges enclosed immobilized microbial cells and
functioned as baffles. The localization and motion of the cartridges promoted improved
exposure between microbial cells and substrate. Agitation was accomplished by
rocking the vessel at 180°. All the control set points were adjustable, presenting the
option of evaluating diverse control regimes. The implemented reactor showed a 35%
increase in the peak hydrogen fraction and a 58% reduction in lag time compared to
the control shake flask reactor. These findings showed that the novel reactor
configuration, by means of the cartridge structure supporting the immobilized cells,
enhanced the biohydrogen production process.
Subsequently, a preliminary scale up of the cartridge concept was implemented and
incorporated into a continuous stirred tank reactor (CSTR). The cartridge
(46x40x300mm) consisted of perforated hollow rectangular tubes, joined to form a
vii
single amalgamation. This unit was used as substitute for the standard impellers of
the CSTR and aligned at 120° laterally to the agitating shaft. The modified reactor
prepared with Immobilized cells in cartridge (ICC) was comparatively assessed with
the standard CSTR operated with suspended cells in reactor (SCR) and immobilized
cells in reactor (ICR). ICC reduced fermentation time by 52 and 65% compared to
SCR and ICR respectively. Gompertz model coefficients indicated a 98 and 37%
increase in the maximum hydrogen production rate (Rm) using the ICC compared to
the SCR and ICR fermentations respectively. ICC also showed better pH buffering
capacity and complete glucose degradation. These findings further demonstrated that
the scale up reactor configuration with the cartridge structure improved biohydrogen
productivity, yield and process economics.
The novel configuration reduced process time, improved Hydrogen yield and ensured
complete substrate degradation. Furthermore, the structural integrity of immobilized
cells was maintained. These findings demonstrated that the novel bioreactor design
improved biohydrogen production and showed potential for further DFHP research and
development.
Keywords: Novel biogas bioreactor, Dark fermentation, Biohydrogen, 3D Printing,
Cell immobilization, CSTR.

viii
Acknowledgements
﷽
I would like to thank:
My Mother for her patience and understanding, my brothers for accompanying me on
midnight sampling runs and my sister for earnestly listening to all my ramblings.
Professor Kana for giving me the opportunity to do this MSc, entrusting this project
with me and providing the tools and equipment that was necessary.
The National Research Foundation for funding this research.
Professor Theresa HT Coetzer, Dr Robert D Stone, Dr Charles Hunter,
Dr Sumaiya Jamal-Ally and Professor Carola Niesler for the opportunities that they
have provided.
My lab and department mates Selisha, Yeshona, Preshanthan, Isaac, Dr Faloye,
Kimberley, Gabriel, Riesha, and Daneal for making lab 117 the place it is.
Ashrenee, Lorika, and Cynthia for their encouragement, assistance and advice.
The technical and admin staff of the Microbiology Department, Miss Diane Fowlds,
Wilsonn Sikhakhane, Natalie Jones and Sibongile Ntuli for their dedication and
assistance.
I would also like to acknowledge the advice, patience and dedication displayed by
the UKZN glass blowing team, the mechanical workshop management and technical
staff as well George Carelse.
An extra special Thank You to Dr Charles Hunter and Celeste Clarke, who were
there for me when I needed it the most, whose assistance and advice I will never
forget.
I would like to dedicate this work to the people of Palestine, my inspiration.
.our Prophet, our Honour صلى الله عليه وسلم محمد

ix
Table of Contents
PREFACE ................................................................................................................... ii
DECLARATION 1: PLAGIARISM ............................................................................... iii
DECLARATION 2: PUBLICATIONS........................................................................... iv
CONFERENCE CONTRIBUTIONS............................................................................ v
Abstract ...................................................................................................................... vi
Acknowledgements .................................................................................................. viii
Table of Contents ....................................................................................................... ix
List of Figures ............................................................................................................. xi
List of Tables ............................................................................................................ xiv
List of Abbreviations .................................................................................................. xv
CHAPTER 1: General Introduction ............................................................................. 1
The need for renewable energy sources ....................................................... 1
Hydrogen as an alternative energy source .................................................... 3
Research motivation/Problem statement ...................................................... 4
Aims and objectives ...................................................................................... 5
Outline of dissertation/Thesis structure ......................................................... 6
References .................................................................................................... 7
CHAPTER 2: Review of physicochemical parameters and bioreactor configurations
Influencing dark fermentative biohydrogen production ............................................. 11
Abstract ....................................................................................................... 11
Introduction ................................................................................................. 11
Impact of physico-chemical factors on biohydrogen production .................. 13
Biohydrogen yield ........................................................................................ 18
Bioreactor configurations used for biohydrogen production ........................ 19
Process mode ............................................................................................. 27
Some considerations for an effective bioreactor for biogas production ....... 28
Conclusion .................................................................................................. 29
References .................................................................................................. 30

x
CHAPTER 3: Design, implementation and assessment of a novel bioreactor for
fermentative biohydrogen process development ...................................................... 39
Abstract ................................................................................................................ 40
3.1. Introduction .................................................................................................... 40
3.2. Materials and methods .................................................................................. 41
3.3. Results and discussion .................................................................................. 44
3.4. Conclusion ..................................................................................................... 47
3.5. References .................................................................................................... 47
CHAPTER 4: Adaptation of cell immobilization cartridge unit to continuous stirred
tank reactor improves dark fermentative hydrogen production ................................. 49
Abstract ................................................................................................................ 50
4.1. Introduction .................................................................................................... 51
4.2. Materials and methods .................................................................................. 54
4.3. Results and discussion .................................................................................. 59
4.4. Conclusion ..................................................................................................... 69
4.5. References .................................................................................................... 69
CHAPTER 5: Conclusions and recommendations for further research .................... 73
Conclusions and implications ...................................................................... 73
Recommendations for future studies ........................................................... 74
xi
List of Figures
Page No.
CHAPTER 1:
Figure 1: Share of global electricity generation by fuel (BP, 2020) ............................. 1
Figure 2: Regional electricity generation by oil, natural gas, coal, nuclear energy,
renewables, hydroelectricity and other (adapted from BP, 2020) ............................... 2
CHAPTER 2:
Figure 1: Schematic diagram of a continuous stirred tank reactor (Zhu et al., 2013) 20
Figure 2: Schematic diagram of a flat sheet membrane bioreactor (Fazeli et al.,
2012) ........................................................................................................................ 21
Figure 3: Schematic diagram of a packed bed reactor (Fernandes, 2010) ............... 22
Figure 4: Schematic diagram of a fluidized bed reactor (Fernandes, 2010). ............ 23
Figure 5: Up-flow anaerobic sludge blanket (UASB) reactor (Tilley et al., 2014). ..... 25
Figure 6: Twin-flask temporary immersion system (Georgiev et al., 2014)............... 27
CHAPTER 3:
Figure 1: Bioreactor designed structures: (A) external vessel (B) lid internal surfaces;
(C) cartridge support; (D) lid clamps; (E) bioreactor supporting stand; (F) assembled
cartridges with supporting material; (G) single hollow perforated cartridge. ............. 42
Figure 2: Implemented structures of the bioreactor: (A) reactor glass vessel; (B) lid
internal surface; (C) vesconite clamps; (D) 3D-printed cartridge support structure; (E)
3D-printed cartridges; (F) stainless steel support stand; (G) assembled bioreactor. 43

xii
Page No.
CHAPTER 3: (CONTINUED)
Figure 3: Comparative assessment of implemented bioreactor and control flask using
immobilized microbial cells: (A) hydrogen and carbon dioxide profile for a 48 h
fermentation period; (B) Glucose consumption profile; (C) cartridge before
fermentation; (D) biofilm that formed on the surface of cartridge after fermentation. 45
Figure 4: Hydrogen and carbon dioxide evolution from implemented reactor in real-
time using immobilized cells. .................................................................................... 46
Figure 5: Comparative assessment of implemented bioreactor and control flask using
suspended cells: (A) hydrogen and carbon dioxide profile for a 48 h fermentation
period; (B) glucose consumption profile ................................................................... 46
Figure 6: Scanning electron micrograph of a cross section from a sludge alginate
beads (A) before fermentation at 5000x, (B) after fermentation from the shake flask
control at 5000x, and (C) after fermentation from the implemented bioreactor
cartridge at 8000x..................................................................................................... 47
CHAPTER 4:
Figure 1: Cartridge turbine for housing of immobilized microorganisms: (A) design
and dimensions; (B) Placement of three ducts that from the cartridge; (C) Fabricated
cartridge using stainless steel. ................................................................................. 55
Figure 2: Continuous stirred tank reactor: (A) before modification, Rushton turbine
impellers present; (B) after modification with removable cartridge turbine ............... 57
Figure 3: Comparative assessment of standard CSTR operated with SCR and ICR
and the ICC design. Duration of fermentation varied. (A) Hydrogen fraction profiles;
(B) Cumulative hydrogen volume profiles; (C) Glucose degradation profiles; (D) pH
evolution profiles. (●: SCR; ▼: ICR; ■: ICC) ............................................................ 64
Figure 4: Anaerobic sludge prior to fermentation with rod shaped microorganisms
present at 10 000x.................................................................................................... 66
xiii
Page No.
CHAPTER 4: (CONTINUED)
Figure 5: Sludge-alginate beads after ICR fermentation with microorganisms present
in fragmented beads at 5 000x ................................................................................. 67
Figure 6: Sludge-alginate beads from within ICC fermentation: (A) film between
fused beads at 5 000x; (B) exterior surface at 5 000x; (C) natural chasm on surface
at 8 000x; (D) cross section of interior surface of beads fractured during SEM
preparation at 5 000x ............................................................................................... 68
xiv
List of Tables
Page No.
CHAPTER 2:
Table 1: Inoculum involved in hydrogen production via dark fermentation ............... 15
CHAPTER 3:
Table 1: COD for substrate and effluent from implemented reactor and control flask.
................................................................................................................................. 46
CHAPTER 4:
Table 1: Percentage change and fold improvements of the immobilized cells in
cartridge (ICC) processes compared to the suspended cells in reactor (SCR) and
immobilized cells in reactor (ICR) processes ........................................................... 63
Table 2: Chemical oxygen demand of the substrate and effluent of the SCR, ICR and
ICC processes, wastewater substrate and sludge and the COD reduction of the
respective fermentation runs. ................................................................................... 65

xv
List of Abbreviations
(NH4)2SO4 Ammonium sulfate
3D Three-dimensional
3-D Three-dimensional
BBC British Broadcasting Corporation
BP Beyond Petroleum
C6 H12 O6 Glucose
CaCl2·2H2O Calcium chloride dihydrate
CFD Computational fluid dynamics
CH,i Fraction of hydrogen gas in the headspace of the bioreactor
current interval
CH,i–1 Fraction of hydrogen gas in the headspace of the bioreactor
previous interval
CH3COOH Acetate
CO2 Carbon Dioxide
COD Chemical oxygen demand
CP Control parameters (chapter 3)
CP ICC parameters (chapter 4)
CSTR Continuous Stirred Tank Reactor
DFHP Dark Fermentative Hydrogen Production
e 2.718
EPS Extra polymeric substances
exp Exponential
FBR Fluidized bed reactors
FeCl2·4H2O Iron dichloride tetrahydrate
g Gram
GAC Granular activated carbon
h Hour
H(t) Cumulative volume of hydrogen production (ml)
xvi
H2 Hydrogen
H2O Water
HPP Hydrogen Partial Pressure
HRT Hydraulic retention time
HY Hydrogen yield
ICC Immobilized Cells in Cartridge
ICR Immobilized Cells in Reactor
IPCC Intergovernmental Panel on Climate Change
KH2PO4 Potassium dihydrogen phosphate
kJ kilojoule
L Litre
M Molarity (moles of solute per litre of solution)
MBR Membrane bioreactor
min Minutes
ml Millilitre
mm millimetre
MnCl2·4H2O Manganese(II) chloride tetrahydrate
Na2MoO4·2H2O Sodium molybdate dihydrate
NASA National Aeronautics and Space Administration
Ng,f Final glucose concentration
Ng,i Initial glucose concentration
NH,F Cumulative hydrogen volume
NRF National Research Foundation
P Hydrogen production potential (ml)
PBR Packed bed reactors
PLA Polylactic acid
PLC Programmable Logic Controller
psa Pressure swing adsorption
PVDF polyvinylidene fluoride
r2 Coefficient of determination
RITA Recipient for automated temporary immersion
Rm Maximum hydrogen production rate (ml h-1)
RP Reactor parameters (chapter 3)
xvii
RP SCR or ICR parameters (chapter 4)
rpm Revolutions per minute
s Seconds
SCR Suspended Cells in Reactor
SEM Scanning electron microscopy
spp. Species pluralis (Latin for multiple species)
SRT Solids retention time
t Incubation time (h)
TIS Temporary immersion systems
UASB Up-flow anaerobic sludge blanket
VFA Volatile fatty acid
VG,i Total biogas volumes current time interval
VG,i–1 Total biogas volumes previous time interval
VH Total volume of the headspace in the bioreactor
VH,i Cumulative hydrogen gas volume current time interval
VH,i–1 Cumulative hydrogen gas volume previous time interval
ZnSO4·7H2O Zinc sulfate heptahydrate
λ Lag-phase time (h)
1
Chapter 1
General Introduction
The need for renewable energy sources
Majority of the world’s fuel originates from fossil sources, whether natural gas, oil or
coal. According to the annual BP statistical review (2020) the global proved reserves
of oil is sufficient to meet 50 years of global production. The global power generation
also relies mainly on fossil fuels, most of the world primarily uses coal and natural gas
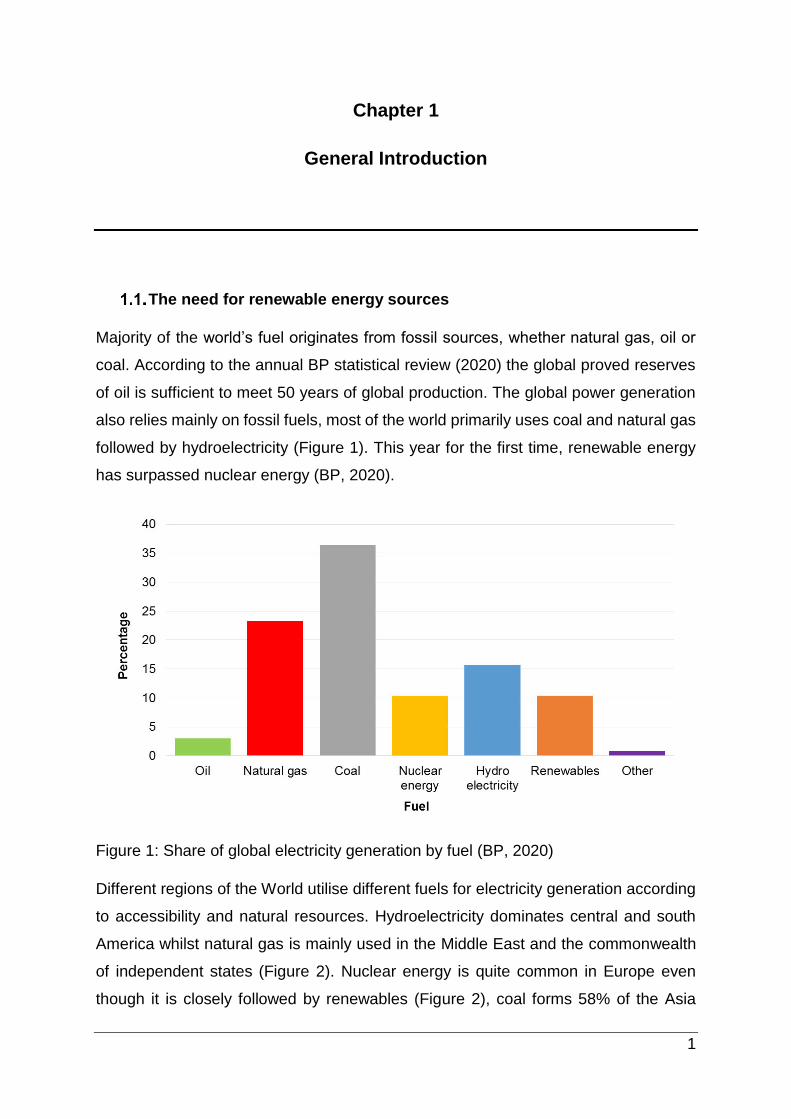
followed by hydroelectricity (Figure 1). This year for the first time, renewable energy
has surpassed nuclear energy (BP, 2020).
Figure 1: Share of global electricity generation by fuel (BP, 2020)
Different regions of the World utilise different fuels for electricity generation according
to accessibility and natural resources. Hydroelectricity dominates central and south
America whilst natural gas is mainly used in the Middle East and the commonwealth
of independent states (Figure 2). Nuclear energy is quite common in Europe even
though it is closely followed by renewables (Figure 2), coal forms 58% of the Asia

2
Pacific’s electricity generation (Figure 2). Even though natural gas is cited as Africa’s
largest source of electricity, South Africa mainly uses coal for this purpose (BP, 2020).
North, South and Central America dominate the World’s biofuel production, grossing
more than 67% (BP, 2020).
Figure 2: Regional electricity generation by oil, natural gas, coal, nuclear energy,
renewables, hydroelectricity and other (adapted from BP, 2020)
According to the Intergovernmental Panel on Climate Change (IPCC), (Hoegh-
Guldberg et al., 2018) human induced global warming has intensified temperatures in
land and ocean regions. A 1.5°C increase in global temperature was reported
compared to the pre-industrial period (Hoegh-Guldberg et al., 2018). Marine
environments have shown an increased frequency and duration of marine heat waves
causing changes in environmental habitats as well as other natural and human
systems (Hoegh-Guldberg et al., 2018). Fossil fuel derived energy sources are the key
reason for environmental decline and a salient form in global warming, greenhouse
gas emissions and depletion of the ozone layer (Baldwin and Lenton, 2020; Last,
1993). Repercussions of global warming include an increase in the number of heat
wave days, high fire danger days and reduced soil moisture availability (Engelbrecht
et al., 2015). Monitored temperatures within the sub tropics and central tropics of Africa

3
over a period of 5 decades show a rise in temperature of greater than two times the
global rate (Engelbrecht et al., 2015). Cumulative effects of environmental change
could destabilize the economy of Africa as there are millions of farmers that rely on
natural rainfall for production of crops used locally and imported to increase revenue.
South Africa has suffered its driest years in recorded history during 2015 and 2016,
the average rainfall in 2015 was 403mm compared to the years between 1904 and
2015 which was 608mm (Stoddard, 2016). The South African citrus export industry,
second largest in the world, was impeded as a result of water restrictions, thus,
jeopardising a multi-billion-rand trade (Stoddard, 2016). The meteorological office of
the United Kingdom has predicted that the year 2020 will witness one of the greatest
surges in atmospheric carbon dioxide since the start of record keeping (Baynes, 2020).
The drastic increase was attributed to the ongoing devastating wildfires in Australia,
which has burned over sixteen million acres during its three month reign until the end
of January 2020 (Tarabay, 2020). These fires not only increase atmospheric CO2, but
burns through vegetation which would customarily soak up CO2 (Baynes, 2020).
Inception of this devastating cycle of destruction lays at the door of human induced
global warming, and was supplemented by the El Niño events, which caused drastic
temperature fluctuations globally (Baynes, 2020). It was inferred that the El Niño
events contributed to the drought in South Africa, flooding in South America and
intensive hurricanes in the eastern tropical pacific (Buis, 2015). In addition to the
considerable negative effects that fossil fuels have on the environment, the source of
majority of the world’s oil reserves is beset by war and instability. Fluctuations in cost
are prevalent as a result of attacks on tankers transporting oil as well as the recent
drone attacks on various production facilities (Marcus and Prescott, 2019). This further
reinforces the need for alternative energy sources.
Hydrogen as an alternative energy source
Hydrogen presents immense potential as a clean and renewable energy source, as it
has the highest gravimetric energy of any known fuel (Levin et al., 2004). Researching
techniques to enhance the production, distribution and storage of hydrogen is required
to improve economic feasibility (Dunn, 2002). Furthermore hydrogen is congruent with
electrochemical and combustion processes to convert energy in a manner that does
participate in environmental pollution and climate change via carbon based emissions
(Levin et al., 2004). Ausubel (2000) stated that “The trend toward “decarbonization” is

4
the heart of understanding the evolution of the energy system”. Biological hydrogen
production can be carried out via three primary methods; photodecomposition of
organic composites, biophotolysis of water, and fermentation of organic wastes
(Hallenbeck and Ghosh, 2009). Fermentation of organic wastes occurs at a higher
rate, utilizes waste materials and possesses the potential to be integrated with other
processes (Chandrasekhar et al., 2015; Guo et al., 2010; Kumar et al., 2017). The
highest theoretical yield of hydrogen is 4 mol H2 mol-1 glucose with 2 mol acetate as a
by-product (O-Thong et al., 2019), as shown below.
C6H12O6 + 2H2O → 2CH3COOH + 2CO2 + 4H2
Furthermore dark fermentative hydrogen production (DFHP) can serve the dual
purpose of producing clean energy and treating organic waste (Lalit Babu et al., 2009),
and this may be achieved at a cheaper cost than other methods (Waligórska, 2012).
The process is however governed by various physicochemical factors and may be
restricted by decreased hydrogen yields (Nath and Das, 2004; Waligórska, 2012).
These factors include temperature, pH, hydraulic retention time (HRT), hydrogen
partial pressure, inoculum type, preparation and state, substrate type amongst other
physicochemical influences (Jung et al., 2011). Bioreactor configuration and operation
directly impacts the microenvironment of the reactor, such as hydrodynamic
performance, microbial population and the mass transfer between substrate and
inoculum (Cresson et al., 2008; Jung et al., 2011; Venkata Mohan et al., 2007).
Research motivation/Problem statement
Bioreactors are central to fermentation processes and they provide a regulated
microclimate enabling peak cellular growth and/or product formation (Najafpour,
2007). Batch mode of operation was recommended as it retains higher suitability for
initial optimization studies (Balachandar et al., 2013; Davila-Vazquez et al., 2008;
Hallenbeck and Ghosh, 2009; Kapdan and Kargi, 2006; Saratale et al., 2019). At a
laboratory scale, shake flask reactors in shaking waterbaths or rotary shakers are
commonly used for DFHP (Chen et al., 2015; Mandal et al., 2006; Lo et al., 2008).
During process scale up, continuous stirred tank reactors (CSTR) are employed (Chu
et al., 2016, Zhang et al., 2006, Salem et al., 2017). These standard configurations
are plagued with various challenges for biohydrogen research and production. The
5
shake flask reactor is of a simple design and widely available, however it has poor gas
and mass transfer resulting from inefficient agitation (Kennedy and Krouse, 1999).
Considering the importance of laboratory scale studies, it is vital to generate accurate
and reliable process data from the earliest possible stage. The CSTR has various
advantages including highly effective mixing, thus advanced mass transfer (Chu et al.,
2016; Balachandar et al., 2013; Saratale et al., 2019), however, this comes at a cost
of excessive sheer stress and biomass washout. The CSTR is incapable of
maintaining immobilized microbial cells (Balachandar et al., 2013; Saratale et al.,
2019). Bioreactor configurations capable of handling immobilized cells have shown a
low efficiency for heat and mass transfer, reduced substrate conversion and
decreased hydrogen production (Show et al., 2011; Balachandar et al., 2013; Saratale
et al., 2019). Standard reactor configurations that are available are inadequate for
DFHP as they are unable to meet the complete criteria of efficient DFHP. A specialized
reactor design could improve hydrogen yield and process stability (Hallenbeck and
Ghosh, 2009). It would benefit the design to incorporate biomass retention capabilities
with high mass transfer in order to optimise product formation (Najafpour, 2007).
Aims and objectives
The aim of this study was to design a novel bioreactor configuration for fermentative
biohydrogen production, implement the design into effect and assess its potential
compared to existing bioreactor configurations.
The following detailed objectives were undertaken:
i. A laboratory scale 2 L bioreactor optimized for heat and mass transfer, and
biomass retention was designed using OpenSCAD software.
ii. Internal structures of the 2L reactor were 3D-printed in the laboratory using
Polylactic acid (PLA) filament in a REPRAP 3D printing machine.
iii. The 2L laboratory reactor was comparatively assessed with a shake flask
reactor of same volume at standard operational process conditions.

6
iv. Based on the initial configuration above, a 13L semi pilot scale prototype was
designed and implemented using a modified CSTR.
v. The semi pilot prototype was comparatively assessed with a standard CSTR
under uniform conditions of temperature, inoculum concentration and process
pH.
Outline of dissertation/Thesis structure
This dissertation contains five chapters presented in research paper format, each
chapter is self-contained, comprising an introduction, materials and methods, results
and discussion, conclusion and references. Bioreactor design and assessment are
pivotal to all chapters.
Chapter 2 discusses a literature review of physicochemical parameters affecting dark
fermentative biohydrogen production. Bioreactor configurations used in biohydrogen
production are described. Their advantages and limitations are detailed.
Chapter 3 focuses on the design, fabrication and assessment of a novel laboratory
scale bioreactor. The novel configuration was compared experimentally to a shake
flask reactor for dark fermentative hydrogen production.
In Chapter 4 a semi pilot scale prototype was developed based on the results achieved
at a laboratory scale (Chapter 3). The design of the cartridge concept was modified
and incorporated into a continuous stirred tank reactor (CSTR), the resulting hybrid
was assessed in comparison to a standard CSTR.
The final chapter, Chapter 5 integrates aspects of the study and provides concluding
remarks and future suggestions pertaining to the novel bioreactor designs formulated
herein.

7
References
Ausubel JH. Where is energy going? The Industrial Physicist 2000;6:16–19.
Balachandar G, Khanna N, Das D. Biohydrogen production from organic wastes by
dark fermentation. In: Pandey A, Chang JS, Hallenbeck PC, Larroche C, editors.
Biohydrogen, Elsevier; 2013, p. 103-144.
Baldwin MP, Lenton TM. Solving the climate crisis: lessons from ozone depletion and
COVID-19. Global Sustainability. 2020;3:1-6.
Baynes C. 2020. Australia wildfires: Devastating blazes pushing global CO2 levels to
record high. Independent. Article can be found online:
https://www.independent.co.uk/environment/australia-wildfires-latest-climate-change-
carbon-emissions-deforestation-a9300401.html Article accessed on: 30/01/2020.
BP (2020). BP Statistical Review of World Energy 2020. [online] London: BP Statistical
Review of World Energy. Available at: http://www.bp.com/statisticalreview [Accessed
1 September 2020].
Buis A. 2015. A Still-Growing El Niño Set to Bear Down on U.S. NASA jet propulsion
laboratory California institute of technology. Article can be found online:
https://www.jpl.nasa.gov/news/news.php?feature=4808 Article accessed on:
22/05/2019.
Chandrasekhar K, Le YJ, Lee DW. Biohydrogen production: strategies to improve
process efficiency through microbial routes. Int. J. Mol. Sci. 2015;16(4):8266-8293.
Chen P, Wang Y, Yan L, Wang Y, Li S, Yan X, Wang N, Liang N, Li H. Feasibility of
biohydrogen production from industrial wastes using defined microbial co-culture. Biol
Res. 2015;48(1):24-31.
Chu CY, Hastuti ZD, Dewi EL, Purwanto WW, Priyanto U. Enhancing strategy on
renewable hydrogen production in a continuous bioreactor with packed biofilter from
sugery wastewater. Int. J. Hydrog. Energy. 2016;41(7):4404-4412.
Cresson R, Escudie´ R, Steyer JP, Delgene`s JP, Bernet N. Competition between
planktonic and fixed microorganisms during the start-up of methanogenic biofilm
reactors. Water Res. 2008;42:792–800.

8
Davila-Vazquez G, Arriaga S, Alatriste-Mondragón F, de León-Rodríguez A, Rosales-
Colunga L M, Razo-Flores E. Fermentative biohydrogen production: trends and
perspectives. Rev. Environ. Sci. Biotechnol. 2008;7(1): 27-45.
Dunn S. Hydrogen futures: toward a sustainable energy system. Int. J. Hydrog.
Energy. 2002;27:235–264.
Engelbrecht F, Adegoke J, Bopape M J, Naidoo M, Garland R, Thatcher M, McGregor
J, Katzfey J, Werner M, Ichoku C, Gatebe C. Projections of rapidly rising surface
temperatures over Africa under low mitigation. Environ. Res. Lett. 2015;10(8):085004.
Guo XM, Trably E, Latrille E, Carrère H, Steyer JP. Hydrogen production from
agricultural waste by dark fermentation: a review. Int. J. Hydrog. Energy.
2010;35:10660-10673.
Hallenbeck PC, Ghosh D. Advances in fermentative biohydrogen production: the way
forward. Trends Biotechnol. 2009;27(5):287-297.
Hoegh-Guldberg O, Jacob D, Taylor M, Bindi M, Brown S, Camilloni I, Diedhiou A,
Djalante R, Ebi KL, Engelbrecht F, Guiot J, Hijioka Y, Mehrotra S, Payne A,
Seneviratne SI, Thomas A, Warren R, Zhou G. Impacts of 1.5ºC Global Warming on
Natural and Human Systems. In: Masson-Delmotte V, Zhai P, Pörtner HO, Roberts D,
Skea J, Shukla PR, Pirani A, Moufouma-Okia W, Péan C, Pidcock R, Connors S,
Matthews JBR, Chen Y, Zhou X, Gomis MI, Lonnoy E, Maycock T, Tignor M,
Waterfield T, editors. Global Warming of 1.5°C. An IPCC Special Report on the
impacts of global warming of 1.5°C above pre-industrial levels and related global
greenhouse gas emission pathways, in the context of strengthening the global
response to the threat of climate change, sustainable development, and efforts to
eradicate poverty, IPCC, 2018, p. 175-311.
Jung KW, Kim DH, Kim SH, Shin HS. Bioreactor design for continuous dark
fermentative hydrogen production. Bioresour. Technol. 2011;102(18):8612-8620.
Kapdan IK, Kargi F. Bio-hydrogen production from waste materials: a review. Enzyme
Microb. Technol. 2006;38:569-582.
Kennedy M, Krouse D. Strategies for improving fermentation medium performance: a
review. J. Ind. Microbiol. Biotechnol. 1999;23:456-475.

9
Kumar G, Sivagurunathan P, Pugazhendhi A, Thi NBD, Zhen G, Chandrasekhar K,
Kadier A. A comprehensive overview on light independent fermentative hydrogen
production from wastewater feedstock and possible integrative options. Energy
Convers. Manag. 2017;141:390-402.
Lalit Babu V, Venkata Mohan S, Sarma PN. Influence of reactor configuration on
fermentative hydrogen production during wastewater treatment. Int. J. Hydrog.
Energy. 2009;34:3305-3312.
Last JM. Global change: ozone depletion, greenhouse warming, and public health.
Annu. Rev. Public Health. 1993;14(1):115-36.
Levin DB, Pitt L, Love M. Biohydrogen production: prospects and limitations to
practical application. Int. J. Hydrog. Energy. 2004;29:173-185.
Lo YC, Chen WM, Hung CH, Chen SD, Chang JS. Dark H2 fermentation from sucrose
and xylose using H2-producing indigenous bacteria: feasibility and kinetic studies.
Water Res. 2008;42(4):827-842.
Mandal B, Nath K, Das D. Improvement of biohydrogen production under decreased
partial pressure of H2 by Enterobacter cloacae. Biotechnol Lett. 2006;28(11):831-835.
Marcus J, Prescott K. 2019. Saudi Arabia oil facilities ablaze after drone strikes. BBC
News. Article can be found online: https://www.bbc.com/news/world-middle-east-
49699429 Article accessed on: 02/10/2019
Najafpour DG. Bioreactor design. In: Najafpour DG, editor. Biochemical engineering
and biotechnology, Amsterdam: Elsevier; 2007, p. 142-169.
Nath K, Das D. Improvement of fermentative hydrogen production: various
approaches. Appl. Microbiol. Biotechnol. 2004;65:520-529.
O-Thong S, Mamimin C, Kongjan P, Reungsang A. Thermophilic Fermentation for
Enhanced Biohydrogen Production. In: Pandey A, Venkata Mohan S, Chang JS,
Hallenbeck PC, editors. Biohydrogen (Second Edition) Biomass, Biofuels,
Biochemicals, Elsevier; 2019, p. 123-139.
Salem AH, Mietzel T, Brunstermann R, Widmann R. Effect of cell immobilization,
hematitie nanaoparticles and formation of hydrogen producing granules on
10
biohydrogen production from sucrose wastewater. Int. J. Hydrog. Energy.
2017;42(40):25225-25233.
Saratale GD, Saratale RG, Banu JR, Chang JS. Biohydrogen production from
renewable biomass resources. In: Pandey A, Venkata Mohan S, Chang JS,
Hallenbeck PC, Larroche C, editors. Biohydrogen (Second Edition) Biomass, Biofuels,
Biochemicals, Elsevier; 2019, p. 247-277
Show KY, Lee DJ, Chang JS. Bioreactor and process design for biohydrogen
production. Bioresour. Technol. 2011;102:8524-8533.
Stoddard E. 2016. South Africa suffers driest year on record in 2015. Ed. Andrew
Heavens. Reuters. Article can be found online: https://www.reuters.com/article/us-
safrica-drought/south-africa-suffers-driest-year-on-record-in-2015-
idUSKCN0US14T20160114 Article accessed on: 22/05/2019
Tarabay J. 2020. Why These Australia Fires Are Like Nothing We’ve Seen Before.
The New York Times. Article can be found online:
https://www.nytimes.com/2020/01/21/world/australia/fires-size-climate.html Article
accessed on: 30/01/2020.
Venkata Mohan S, Lalit Babu V, Vijaya Bhaskar Y, Sarma PN. Influence of
recirculation on the performance of anaerobic sequencing batch biofilm reactor
(AnSBBR) treating hypersaline composite chemical wastewater. Bioresour. Technol.
2007;98(7):1373–1379.
Waligórska M. Fermentative hydrogen production – process design and bioreactors.
Chem. Process. Eng. 2012;33(4):585-594.
Zhang ZP, Show KY, Tay JH, Liang DT, Lee DJ, Jiang WJ. Effect of hydraulic retention
time on biohydrogen production and microbial community. Process biochem.
2006;41:2118-2123.

11
Chapter 2
Review of physicochemical parameters and bioreactor
configurations influencing dark fermentative biohydrogen
production
Abstract
This review provides a synopsis of the physicochemical parameters effecting dark
fermentative hydrogen production. Microbial inoculum, substrate type, hydrogen
partial pressure, temperature, pH, hydraulic retention time and volatile fatty acids
production were identified as being key to the chemical processes. Various bioreactor
configurations commonly used for dark fermentative hydrogen (such as the continuous
stirred tank reactor, membrane reactor, packed and fluidized bed reactors, and the up-
flow anaerobic sludge blanket reactor) are examined and the pros and cons of each
highlighted. In addition, the prospect of configurations not commonly used for
hydrogen production is discussed. The potential of enhancing biogas production by
developing a novel bioreactor design is examined
Introduction
The rapid depletion of fossil fuel reserves and the adverse environmental impact
associated with their use necessitate renewable and non-toxic fuel sources (Chopra
et al., 2020). Hydrogen has a comparatively high energy yield, amounting to 122kJg-1
which is 2.75 times more than hydrocarbon fuels (Kapdan and Kargi, 2006). There
are no adverse side effects or harmful by-products formed upon hydrogen combustion,
as only water is produced (Nath and Das, 2004). Three approaches for biological
hydrogen production have been reported. Photodecomposition of organic composites,
biophotolysis of water and fermentation of organic wastes (Hallenbeck and Ghosh,
2009). Photodecomposition and biophotolysis depend primarily on solar energy and
require expensive photobioreactors (Hallenbeck and Ghosh, 2009). Hydrogen

12
production via fermentation of organic materials is independent of light and utilizes
waste materials (Nath and Das, 2004; Lalit Babu et al., 2009), thus serving a dual
purpose. This approach has the potential to reduce the cost of waste disposal and
convert the waste material to a high value product. Sustainability and self-sufficiency
in dark fermentative hydrogen production (DFHP) may be enhanced by means of
merging the optimum parameters of various experimental studies to streamline the
overall process. Physicochemical conditions that need to be optimised include
inoculum type, preparation and state; temperature; hydraulic retention time (HRT);
hydrogen partial pressure; pH; substrate type and bioreactor configuration (Jung et
al., 2011). Continuing research of these factors contributes to our knowledge of DFHP
and helps to optimize the process (Fang and Liu 2002; Venkata Mohan et al., 2007a;
Guo et al., 2010; Chong et al., 2009; O-Thong et al., 2009; Lee et al., 2006; Fan et al.,
2006; Zhang et al., 2006; Mandal et al., 2006; Mizuno et al., 2000).
Fermentation substrates and microbial inocula are selected based on availability and
cost. Mesophillic temperatures are generally preferred to reduce the energy input and
pH is determined by the choice of inoculum. Hydraulic retention time, mass transfer
and hydrogen partial pressure are factors that affect all biohydrogen processes. Short
hydraulic retention times promote increased hydrogen production (Jung et al., 2011).
HRTs of between 8-12 hours was suggested for liquid substrates (Hawkes et al., 2002)
although times as short as 6 hours were previously used with added benefits (Zhang
et al., 2006). Microbial cell immobilization allows microbial growth independence over
hydraulic retention time (Wu et al., 2006; Hallenbeck, 2009; Hallenbeck and Ghosh,
2009). This allows for biomass retention in dynamic systems running continuous
processes. The effects of mass transfer and hydrogen partial pressure are similar to
those of agitation. Bioreactor configurations impacts on cell growth and product
formation. Various features of a bioreactor impact the chemical processes that occur
within, for example, the agitation of a reactor directly influence the state of
homogeneity and mass transfer the reactor is able to maintain. Agitation indirectly
affects the hydrogen partial pressure (Kraemer and Bagley, 2007), as the rate of
agitation plays a structural part in the transfer of metabolic gasses across the liquid to
gas phase (Hawkes et al., 2007). Continued expulsion of Hydrogen enables this gas
to exit the reactor and reduce the Hydrogen partial pressure, which when accumulated
inhibits further hydrogen production. The bioreactor design is fundamental, as it

13
impacts on cell physiology and product formation. This chapter aims to give a basic
overview of the factors that affect biohydrogen production with special emphasis on
existing bioreactor configurations and their favourable attributes.
Impact of physico-chemical factors on biohydrogen production
2.3.1. Type of microbial inoculum
The type of microorganisms used impacts the hydrogen yield, its purity and the cost
of the operation (Ntaikou et al., 2010). Aseptic conditions are necessary when pure
cultures are used, complicating the design of the system. A higher hydrogen
production efficiency and reduced by-product formation are benefits of pure cultures
(Waligórska, 2012). Such systems have higher cost indications and are highly
susceptible to contamination over long-term operation. The use of mixed cultures is
more practical due to their flexibility as far as growth conditions and operational
parameters are concerned. Non-sterile conditions would also be acceptable, thus
decreasing the cost and complexity of the operation (Waligórska, 2012). Mixed
cultures also use a greater variety of substrate types as the microbial community within
might assist in the degradation of complex organic molecules even if they are
incapable of producing hydrogen themselves (Hung et al., 2011). They could also use
up any existing oxygen in the reactor and enhance the formation of biomass granules
essentially leading to superior productivity of hydrogen (Hung et al., 2011).
Nevertheless, if the mixed culture contains microorganisms that compete for the
carbon source or consume hydrogen, such inoculum would have to undergo various
physical or chemical pre-treatments like heat, acidification, alkylation, chloroform or
acetylene treatment prior to hydrogen production (Akutsu et al., 2009; Kang et al.,
2012; Hu and Chen, 2007; Ren et al., 2008; Zhu and Beland, 2006). Pure cultures of
Clostridium spp. and Enterobacter spp. are commonly used in biohydrogen
production; several other genus have also been used (Table 1). Mixed cultures used
for biohydrogen production are commonly sourced from sewage sludge, either human
or animal (Table1).

14
2.3.2. Substrate
First generation biofuels are made from crops associated to food supply which makes
them an undesirable choice for hydrogen production (Waligórska, 2012). Second
generation biofuel production can be made from plants such as sweet sorghum
(Sorghum bicolor (L.) Moench), switch grass (Panicum virgatum L.) and miscanthus
(Miscanthus×giganteus Greef et Deuter) which are known to grow in less demanding
soil conditions (Alexopoulou et al., 2015; Reddy et al., 2005; Waligórska, 2012).
Lignocellulose substrates of woody origin may also be sometimes used. Their high
cellulose, lignin and hemicellulose content make them somewhat more difficult to
break down, and it is during such fermentations that mixed cultures of inoculum
become especially useful (Waligórska, 2012). Substrates are chosen based on their
price and availability. Pure substrates such as glucose, sucrose, lactose, xylose and
starch (Table 1) are commonly used in experimental studies for the purposes of
experimental reproducibility. Wastes, such as cellulosic biomass, sewage sludge,
chitinous waste and molasses (Table 1) are more likely to be used in industry, as they
would be more cost effective.

15
Table 1: Inoculum involved in Hydrogen Production via Dark Fermentation
Inoculum Type Substrate Type Hydrogen Yield Reference
Clostridium acetobutylicum Glucose 2.0 mol mol-1 glucose Chin et al.,2003
Clostridium butyricum CGS5 Xylose 0.73 mol mol-1 xylose Lo et al., 2008
Clostridium butyricum Glucose 1.4- 2.3 mol mol-1 glucose Kataoka et al., 1997
Clostridium pasteurianum CH4 Sucrose 2.07 mol mol-1 hexose Lo et al., 2008
Clostridium paraputrificum M-21 Chitinous wastes 2.2 mol mol-1 substrate Evvyernie et al., 2001
Clostridium thermocellum 27405 Cellulosic biomass 2.3 mol mol-1 glucose Levin et al., 2006
Clostridium thermolacticum Lactose 3.0 mol mol-1 lactose Collet et al., 2004
Enterobacter aerogenes Starch 1.09 mol mol-1 starch Fabiano and Perego, 2002
Enterobacter aerogenes E 82005 Molasses 3.5 mol mol-1 sugar Tanisho and Ishiwata, 1995
Enterobacter cloacae IIT-BT 08 Sucrose 6 mol mol-1 sucrose Kumar and Das, 2000
Enterobacter cloacae IIT-BT 08 Cellobiose 5.4 mol mol-1 cellobiose Kumar and Das, 2000
Thermoanaerobacterium
thermosaccharolyticum KU001 Glucose 2.4 mol mol-1 glucose Ueno et al., 2001
Thermotoga elfii Glucose 84.9 mmol L-1 medium van Niel et al., 2002
Ruminococcus albus Glucose 2.52 mol mol-1 glucose Ntaikou et al., 2008
Citrobacter amalonaticus Y19 Glucose 8.7 mol mol-1 glucose Oh et al., 2008
Ethanoligenens harbinense YUAN-3 Glucose 1.93 mol mol-1 glucose Xing et al., 2008
Digested sludge Glucose 1.8 mol mol-1 glucose Wang and Wan, 2008
Enterobacter aerogenes HU-101 Glucose 1.17 mol mol-1 glucose Mahyudin et al., 1997
Digested wastewater sludge Sucrose 6.12 mol mol-1 sucrose Zhu and Béland, 2006
Rhodopseudomonas Glucose 2.76 mol mol-1 glucose Oh et al., 2002
Cattle manure sludge Glucose 1.0 mol mol-1 glucose Cheong and Hansen, 2006
Enterobacter aerogenes Molasses 1.58 mol mol-1 molasses Tanisho et al., 1998
Mixed mesophillic microflora Sewage sludge 1.7 mol mol-1 substrate Lin and Chang, 1999
Methanogenic granules Glucose 1.2 mol mol-1 glucose Hu and Chen, 2007
Anaerobic sludge Dairy waste 0.0317 mmol g-1 COD Mohan et al., 2008

16
2.3.3. Hydrogen Partial Pressure (HPP)
A high hydrogen partial pressure within the reactor negatively impacts hydrogen
production by influencing the metabolisms of the microorganisms toward the synthesis
of reduced compounds rather than hydrogen (Waligórska, 2012). As the concentration
of hydrogen increases in the liquid phase fermentation broth the hydrogenase enzyme
tasked with producing hydrogen is inhibited and the thermodynamics become
unfavourable (Jung et al., 2011; Show et al., 2011; Tiwari et al., 2006). Various
strategies have been employed to control the hydrogen partial pressure in
fermentations ranging from gas sparging, the use of a submerged membrane, use of
a vacuum, to thermodynamic regulation (Hussy et al., 2003; Hussy et al., 2005;
Kataoka et al., 1997; Kim et al., 2006; Kraemer and Bagley, 2006; Kraemer and
Bagley, 2007; Kyazze et al., 2006; Liu et al., 2006; Mandal et al., 2006; Mizuno et al.,
2000). The presence of nitrogen gas in the bioreactor has many benefits on the
hydrogen producing reactions, as it displaces the carbon dioxide within the void
spaces of the reactor, thereby inhibiting any potential acetogenic hydrogen consuming
reactions (Mizuno et al., 2000). Unfortunately, continuous sparging also results in
incomplete glucose consumption (Kim et al., 2006). Agitation facilitates the transfer of
metabolic gases from the fermentation broth to the reactor headspace (Hawkes et al.,
2007; Hawkes et al., 2002). Since this occurs repeatedly, especially during the
exponential hydrogen production phase, the gas produced is swiftly transferred from
the fermentation broth to the headspace and subsequently out the reactor into the
analysis equipment (Hawkes et al., 2002). This succession of events promotes the
expulsion of hydrogen gas from the reactor, thus continually reducing the hydrogen
partial pressure (Hawkes et al., 2002).
2.3.4. Temperature
The temperatures of the reactions for hydrogen production depend on the type of
microorganisms used in the inoculum. Thermophillic organisms are less susceptible
to the effect of hydrogen partial pressure and contamination (Waligórska, 2012).
Additionally, inoculum pre-treatment may be omitted as it has been reported that
methanogens were inactive at thermophillic temperatures (Shin et al., 2004; Valdez-
Vazquez et al., 2005). Temperature ranges of between 50-60°C have been used to
optimise biohydrogen using thermophillic microorganisms (Jung et al., 2011).

17
Generally, thermophillic organisms have been found to yield a smaller hydrogen
volume as compared to mesophillic organisms; this would make it necessary to scale
up the size of the reactors, thus increasing the overall cost (Hallenbeck, 2009).
Coupling thermophillic process in tandem with an exothermic process via a heat
exchanger would be economically viable, since running such a process independently
would be very demanding practically and economically (Hawkes et al., 2007).
Temperatures between 33°C and 41°C have been shown to improve energetic
efficiency within mesophillic organisms (Mu et al., 2006a,b).Varying heat treatments
are also used to treat inoculum to harvest the hydrogen producing population from a
mixed culture (Logan et al., 2002).
2.3.5. pH
The pH of the system affects the enzymes employed by the inoculum, thus in a domino
effect affects the organism’s metabolism, community structure and product formation
(Ye et al., 2007). The origin of the inoculum used as well as the substrate used also
plays a role in the optimum pH chosen. The suggested pH for substrates such as food
waste falls between 5 and 6 (Guo et al., 2010). Optimal pH for animal manure and
agricultural waste substrates falls within the neutral region (Guo et al., 2010). It may
be advised that experimentation be done to determine the optimal pH of the process
being studied as the composition of waste substrates as well as inoculum varies
considerably. Running processes at lower pH values could also assist in decreasing
the growth of methanogens, known for consuming hydrogen (Hawkes et al., 2002).
2.3.6. Hydraulic retention time (HRT)
During continuous process the hydraulic retention time affects the yield of
biohydrogen. Short HRT promotes hydrogen producing microorganisms (Jung et al.,
2011), times between 8-12 hours was found to be optimum for liquid media. The time
increases depending on the structural complexity and viscosity of the substrate used
(Hawkes et al., 2002). Short HRT also inhibits the growth of methanogenic
microorganisms as they require longer times to grow which is an added advantage for
optimizing biohydrogen production (Jung et al., 2011).

18
2.3.7. Volatile fatty acids
The presence of various compounds within the effluent of a fermentation process
provides useful indicators of the various metabolic pathways that occurred within.
Metabolic pathways favouring the production of acetic acid are most favourable for the
production of hydrogen gas (Hawkes et al., 2002; Hawkes et al., 2007; Kraemer and
Bagley, 2007). This pathway has the highest molar hydrogen yield (Kraemer and
Bagley, 2007; Hawkes et al., 2007). The production of butyrate is less preferred
(Kraemer and Bagley, 2007), as more hydrogen atoms are used in the molecule and
therefore less hydrogen gas is produced. However, the production of butyrate or
butyric acid is still preferred over propionate and lactate as these by-products indicate
that no hydrogen gas was produced (Hawkes et al., 2002). The production of alcohols
are least preferred as these molecules also contain more hydrogen and would
therefore be present in pathways yielding less hydrogen gas (Hawkes et al., 2002).
Additionally, alcohols such as ethanol inhibit growth and hydrogen gas production
rates (Hawkes et al., 2002). Reduced fermentation products, such as ethanol, butanol,
and lactate are a representation of hydrogen that has not been liberated as a gas but
has been bound in the molecule, these products should be avoided (Hawkes et al.,
2002). It has been suggested that volatile fatty acids are the preferred by-product as
metabolic pathways that yield them concurrently yield hydrogen gas (Hawkes et al.,
2002; Lay, 2000). Lamed et al. (1988) determined that mixing decreases the ethanol
to acetate ratio that occurs during a fermentation process, this is an indication that
agitation would therefore improve hydrogen production as acetate and hydrogen are
produced simultaneously and ethanol is an inhibitor of this process. The production of
alcohols occurs immediately after the peak phase of hydrogen production and volatile
fatty acids (Lay, 2000; Lay et al., 1999; Lay, 2001), in the late growth phase (Lay,
2000). This was unanimous for a pure Clostridia culture and mixed cultures obtained
from municipal solid waste and heat-treated sludge (Lay, 2000; Lay et al., 1999; Lay,
2001).
Biohydrogen yield
A theoretical hydrogen yield of 4 mol H2 mol-1 hexose is possible, if acetic acid is the
only by product (Hawkes et al., 2007; Kraemer and Bagley, 2007). In laboratory
experiments carbohydrate substrates are also utilized for cellular proliferation and

19
formation of alternative by-products (Hawkes et al., 2007), consequently decreasing
product formation. Additionally, mixed cultures contain an assortment of
microorganisms and their respective metabolic pathways may sometimes vary. This
would cause the molar hydrogen yield to differ depending on which microorganisms
are selected via varying pre-treatment techniques (Yang et al., 2019). Molar yield may
be improved by channelling the effluent (containing by-products) of stage one
fermentation into stage two fermentation, as the substrate (Hawkes et al., 2007).
Agitation of the reaction medium within the bioreactor improves hydrogen yield
(Hawkes et al., 2002; Kraemer and Bagley, 2007; Lamed et al., 1988; Lay, 2000).
Photo-fermentation or utilization of efficient microbial fuel cells was proposed to
improve overall hydrogen yield mol-1 hexose in a secondary fermentation (Hawkes et
al., 2007; Hawkes et al., 2002). A second stage of fermentation yielding other useful
and high energy end products, like fertilizer rich in nitrogen/phosphorus and methane,
may be considered to improve the overall economics and practicality of the process
(Hawkes et al., 2002).
Bioreactor configurations used for biohydrogen production
The bioreactor type used impacts the growth of the microorganism and in essence the
yield and quality of the product formed. Therefore, the selected reactor configuration
needs to meet the requirements of the microorganism and yet show maximum product
yield as well. Among the various parameters that determine the hydrogen production
efficiency, the reactor design plays a key role in optimizing hydrogen production yield
(Venkata mohan et al., 2007b; Cresson et al., 2008). Bioreactor design also has a
major influence on the interaction between microorganism and substrate, the amounts
of microorganisms present and the hydrodynamic behaviour of the solutions within the
reactor (Venkata mohan et al., 2007b; Cresson et al., 2008). Essential requirements
such as temperature, gas exposure and pH play a role in ensuring harmonious internal
environment within the reactor.
2.5.1. Continuous stirred tank reactor (CSTR)
The continuous stirred tank reactor (Figure 1) vessels are designed to ensure efficient
mixing of the substrate within the reactor; preventing settling of nutrients and
promoting efficient mass transfer (Ntaikou et al., 2010). This reactor type is commonly
employed in conjunction with a continuous flow mode (Yu et al., 2003). Challenges
20
encountered herein depend on the hydraulic retention time (HRT), if it is too short wash
out of biomass may occur, if it is too long promotion of methanogenic hydrogen
consuming bacteria may be promoted (Waligórska, 2012). Even though this reactor
type has the most efficient mixing capabilities, the impeller system used can result in
cell shearing and lysis, therefore leading to a lower biomass concentration (Zhong et
al., 1994), and by extension a decreased hydrogen yield. Studies using CSTR with
10g L-1 glucose at a pH of 5.5 and temperature of 37°C had a biohydrogen yield of
1.81ml H2 mol-1 (Show et al., 2011) at a production rate of 3.20 L h-1 L -1 (Show et al.,
2007; Zang et al., 2007). Other studies using sucrose had a hydrogen production rate
of up to 15 L h-1 L-1 (Wu et al., 2006).
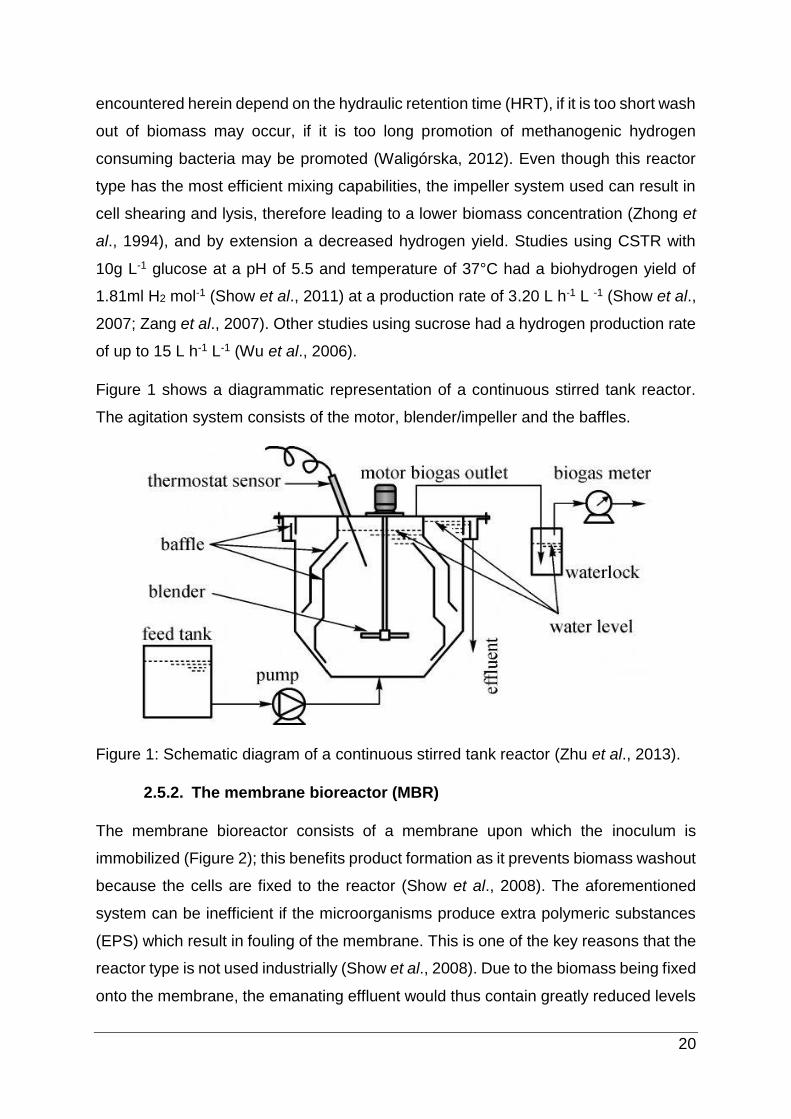
Figure 1 shows a diagrammatic representation of a continuous stirred tank reactor.
The agitation system consists of the motor, blender/impeller and the baffles.
Figure 1: Schematic diagram of a continuous stirred tank reactor (Zhu et al., 2013).
2.5.2. The membrane bioreactor (MBR)
The membrane bioreactor consists of a membrane upon which the inoculum is
immobilized (Figure 2); this benefits product formation as it prevents biomass washout
because the cells are fixed to the reactor (Show et al., 2008). The aforementioned
system can be inefficient if the microorganisms produce extra polymeric substances
(EPS) which result in fouling of the membrane. This is one of the key reasons that the
reactor type is not used industrially (Show et al., 2008). Due to the biomass being fixed
onto the membrane, the emanating effluent would thus contain greatly reduced levels

21
of the microbial population. Additionally, the reactors can be smaller in size since this
reactor type is more efficient at consuming organic substrates and is able to produce
hydrogen at a faster rate (Oh et al., 2004). A disadvantage of this system is that a long
solids retention time (SRT) can result in a swift increase in biomass and a decrease in
the rate and efficiency of the hydrogen production (Lee et al., 2011). Studies using a
membrane bioreactor have yielded a hydrogen production rate of between 0.50 to 0.64
L h-1 L-1 using a HRT of 3.3 hours (Oh et al., 2004).
Figure 2: Schematic diagram of a flat sheet membrane bioreactor (Fazeli et al.,
2012)
Figure 2 shows a diagrammatic representation of a membrane bioreactor. Note
should be taken of component 6, the membrane of the module, which was the
unique feature of this bioreactor configuration.1- Reservoir, 2- baffle plate, 3- PLC, 4-
sensor, 5- bioreactor, 6- membrane module, 7- vacuum gauge, 8- suction pump, 9-
flow meter, 10- permeate, 11- blower and 12- waste sludge.
2.5.3. Packed bed reactors (PBR)
Packed bed reactors are configured to allow entry of substrate from the bottom and
exit from the top (Figure 3), the cellular biomass is generally immobilized either on
biofilms or granules captured on packed media (Kothari et al., 2012). The support
media generally consist of either granular activated carbon (GAC), sponge,
22
polyethylene-octane elastomer, ceramic ball, alginate gel or expanded clay (Show et
al., 2011). The key downfall of this reactor type is that the substrate supply is less
efficient compared to the other reactor types previously described. The lack of efficient
substrate results in a reduced substrate usage leading to a decreased hydrogen yield
(Show et al., 2011); which may be attributed to the system lacking proficient mixing,
so as to unify the substrate concentration throughout the reactor equally. The supply
of substrate to the reaction vessel could be enhanced by recycling the substrate back
into the reactor. Studies have shown that this technique has further enhanced the
hydrogen production yield and efficiency (Kumar and Das, 2001). Show et al. (2011)
indicated that using this reactor configuration at an HRT of 1.08 hours a hydrogen
production rate of 1.60L h-1 L-1 was achieved. Furthermore, it was also established
that the hydrogen production efficiency improved when the substrate was recycled
through the reactor repeatedly.
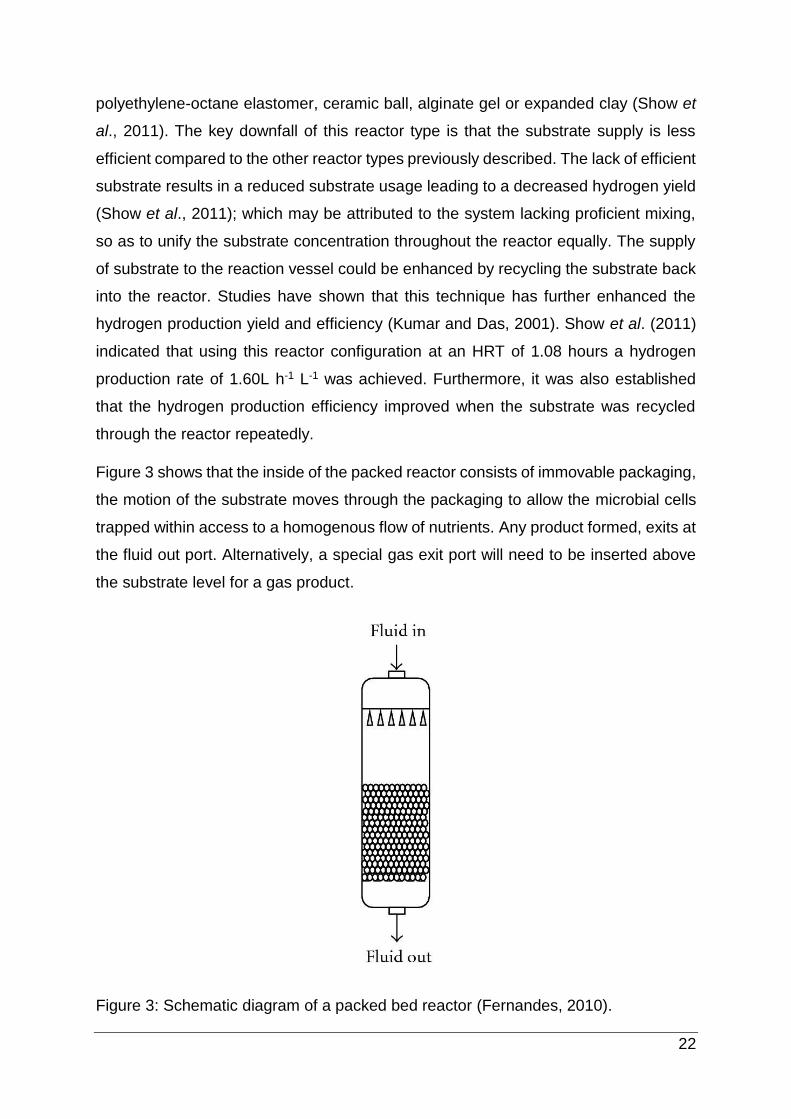
Figure 3 shows that the inside of the packed reactor consists of immovable packaging,
the motion of the substrate moves through the packaging to allow the microbial cells
trapped within access to a homogenous flow of nutrients. Any product formed, exits at
the fluid out port. Alternatively, a special gas exit port will need to be inserted above
the substrate level for a gas product.
Figure 3: Schematic diagram of a packed bed reactor (Fernandes, 2010).

23
2.5.4. Fluidized bed reactors (FBR)
Fluidized bed reactor systems (Figure 4) require large amounts of gas or liquid to be
pumped into the reactor to facilitate the mixing of the contents (Waligórska, 2012). The
biomass generally gets immobilized onto materials similar to those used in the packed
bed reactor configuration (Waligórska, 2012). However, these materials are smaller in
size so as to allow ready fluidization and to increase the surface area of the
immobilization particles so that the microorganisms entrapped therein would be
exposed to a greater degree, thus promoting a better mass transfer and higher
hydrogen yield (Barros et al., 2010). This reactor configuration is also well known for
its highly proficient mixing abilities. Especially high hydrogen yields have been noted
from cells immobilized on granular activated carbon (GAC) (Zang et al., 2007)
compared to other materials used for immobilization. Lin et al. (2009) found that a rate
of 1.821 L h-1 L-1 hydrogen was produced from a sucrose substrate with a yield of 4.26
mol H2 mol-1 sucrose with a HRT of 2 to 6 hours at steady state.
Figure 4 indicates that the immobilization matrix within the bioreactor moves with the
momentum of the surrounding media thus the agitation affects both the immobilized
cells and the media within the bioreactor.
Figure 4: Schematic diagram of a fluidized bed reactor (Fernandes, 2010).

24
2.5.5. Up-flow anaerobic sludge blanket (UASB) reactor
The up-flow anaerobic sludge blanket reactor (Figure 5) employs a system that allows
the entry of the effluent in the form of substrate to enter the reactor from the bottom
and the exit of the treated materials form the top (Seghezzo et al., 1998) .This reactor
type had most commonly been used in conjugation with methane production
(Waligórska, 2012). The most pronounced disadvantage of this system is the time
factor involved prior to the start of the reaction processes (Wang et al., 2007). Some
studies indicate that the reactor needs up to 5 months to form the blanket of
immobilized cells in order for the reactor to function optimally (Wang et al., 2007). This
process can however be sped up by encouraging granulation within a CSTR and
thereafter transferring the materials to a USAB for the actual digestion (Waligórska,
2012). In industrial processes, time is essential and more often than not waiting 5
months for a reactor to stabilise is far too long especially if there are more timeous and
less tedious means of achieving the same objective (Wang et al., 2007). A hydrogen
production rate of 0.25 L h-1 L-1 was reported whilst using a UASB reactor fed with a
sucrose substrate at a HRT of between 8 to 20 hours the hydrogen yield was 1.5 mol
H2 mol-1 sucrose (Chang and Lin, 2004).
Figure 5 shows effluent entering form the bottom of the reactor, being treated by the
sludge granules formed over time naturally, treated water exists from the top of the
reactor.

25
Figure 5: Up-flow anaerobic sludge blanket (UASB) reactor (Tilley et al., 2014).
2.5.6. Temporary immersion reactor
Temporary immersion bioreactors, commonly referred to as temporary immersion
systems (TIS), are reactors that allow the inoculating organisms’ exposure to air and
a liquid substrate at sequential intervals (Georgiev et al., 2014). Various similar
designs exist to achieve this objective (Watt, 2012). The earliest design consisted of
using two separate vessels connected via tubing (Figure 6). One vessel contained the
immobilized growth organism and the other a liquid substrate (Figure 6). The operation
system in this early twin-flask design (Figure 6) was pneumatic and individually
controlled by clocks that initiated the transfer of the substrate from the holding flask to
immerse the growing cells and back to the holding flask again. Some other TIS
designs include the Ebb-and-flow, RITA (recipient for automated temporary
immersion), rotating drum and wave bioreactor, these configurations utilize an array
of agitation techniques ranging between pneumatic, gravity, hydraulic and mechanical
(Georgiev et al., 2014).TISs are commonly used for tissue culture work, particularly
plant culturing (Etienne and Berthouly, 2002; Robert et al., 2006). Their purpose was
to assist in reducing the plant exposure to toxic quantities of water and increase the
oxygen availability, to prevent hyperhydricity and asphyxia (Debnath, 2011).

26
Unimpeded contact between the air and plant material reduces the resistance between
interface boundary layers (gas-liquid and liquid-solid interfaces) (Curtis and Tuerk,
2008). Therefore atmospheric oxygen is able to enter the culture cells with greater
ease than if the culture cells were within a submersion fluid (Georgiev et al., 2014).
The inversion of this characteristic is what holds hypothetical prospect for hydrogen
production. If the direct contact of air to inoculating cells allows them unhindered
access to gaseous nutrients present in the air, relatively they would be able to release
gaseous product into the air with the same ease, as opposed to being exclusively
submerged. Furthermore, the motion of the submersion and drainage causes
enhanced turbulence, increased exposure between inoculum and substrate and
thorough homogenisation of the bioreactors macro and micro environments. The
agitation system also utilizes gravity to aid its function in some designs (Robert et al.,
2006), thereby reducing energy input requirements. The reactors dynamics, internal
constituents, preparatory procedures and frequency of submersion would have to be
modified to cater to the specific requirements of biogas/hydrogen production.
Figure 6 shows the a stepwise process of the operation of the twin-flask system, A-
growth organisms experiencing exposure to air, B- liquid substrate being transferred
to immobilized growth organism, C- growth organism experiencing an immersion
period, D- liquid substrate being transferred back to holding flask.

27
Figure 6: Twin-flask temporary immersion system (Georgiev et al., 2014)
Process mode
There are various opinions expressed in literature as to which mode of fermentation
would be most beneficial for optimal hydrogen production. Some researchers are of
the opinion that a batch mode is appropriate for research purposes and give a
satisfactory indication of the growth capabilities of the inoculum in question
(Waligórska, 2012). Continuous flow reactors are appropriate for industrial purposes
due to the large volumes of waste that require treatment and the large volume of
product that are necessary (Ntaikou et al., 2010). In contrast to this view some
researches are of the opinion that the batch mode produces inefficient and stunted
data (Show et al., 2008). They suggest that it is incapable of providing a good
indication of the best hydrogen production rates, and that a semi-continuous mode
would be a better comparison to an industrial production (Show et al., 2008).
Processes involving a form of semi-continuous mode with a mixed population of

28
microorganisms from activated sludge were undertaken by Cohen et al. (1985). A
series of timeous feed interruptions were enacted on the process to investigate its
effect on the metabolic products formed in the reactor. The team theorised, based on
the results of their investigation that the metabolisms of these anaerobic organisms
shifted from spore forming butyrate/H2 producers to non-spore forming propionate
producers. This change occurred despite the range of interruption patterns utilized in
the investigation. This is an indication that the semi-continuous mode of operation
might be problematic when a mixed consortia of microorganisms is employed as the
inoculum source. Batch mode process are considered more suitable for initial
optimization studies (Hallenbeck and Ghosh, 2009) as it is easier to determine the
degree of optimization and whether said optimisation is as a result of the novel reactor
configuration rather than a variation in the operating conditions of a bioreactor vessel.
As the scale of the operation increases the mode of the process would have to be run
as a continuous feed (Hallenbeck and Ghosh, 2009) to cater to the large volumes of
wastewater. Additionally, production of a reasonable quantity of hydrogen gas is
required to allow the production plant independent operation and contribute to the local
power grid.
Some considerations for an effective bioreactor for biogas production
The process employed to produce hydrogen is influenced by various chemical and
physical parameters. Suitable mixing determines the level of exposure the inoculating
organisms has to the heterogeneous substrate, the state of the hydrogen partial
pressure, the volatile fatty acids produced, hydraulic retention time and the level of
homogeneity in the pH and temperature. Immobilization of microorganisms liberates
growth rate from hydraulic retention time, which prevents inoculum washout. Reactors
that are designed to immobilization often lack suitable agitation for DFHP and rely on
air or natural substrate flow to expose the inoculum to the substrate. Ineffective
agitation with heterogeneous substrates may also lead to elevated hydrogen
concentrations in the liquid phase. The HRT of the process would also have to be
increased to allow adequate substrate degradation. Immobilized microorganisms
require more agitation than suspended organisms to be suitably exposed to the
substrate. The degree of agitation cannot however be so vigorous so as to disintegrate

29
the immobilised structures or to dislodge the microbial cells from the immobilization
matrix. Various bioreactor designs commonly used in experiments for fermentative
hydrogen production can either allow suitable agitation at the cost of compromised
immobilization. Alternatively they immobilize cells with insufficient agitation, ineffective
mass transfer and an accumulation of hydrogen gas in the liquid phase. Based on
these observations, a novel bioreactor configuration to encapsulate immobilization
and effective non-invasive agitation is necessary. A novel bioreactor design has the
potential to enhance biogas production. The combination of immobilization, efficient
agitation, reduced hydrogen partial pressure, superior exposure of inoculum to
substrate and continued thorough homogenisation of the fermentation broth may
improve the yield and rate of hydrogen production substantially.
Conclusion
A variety of chemical parameters and bioreactor configurations were reviewed. In
conclusion immobilization of inoculum has many benefits to improve biohydrogen
production and short hydraulic retention times have a positive impact on overall yield.
The continuous stirred tank reactor maintains highly efficient agitation but may require
modifications to conduct processes with effective immobilization. Other reactor
configurations with the capability to maintain immobilized cells efficiently, like the
packed bed reactor and anaerobic sludge blanket reactor may lack an adequate
mixing ability for high throughput dark fermentative hydrogen production. A reactor
configuration that aims to merge effective immobilization and efficient agitation is
necessary. Such a design would be a highly commendable dynamic immobilized
system. Furthermore, this reactor would be suitable for other industrial processes that
would benefit from immobilization with substantial and effective agitation.

30
References
Akutsu Y, Lee DY, Li YY, Noike T. Hydrogen production potentials and fermentative
characteristics of various substrates with different heat-pretreated natural microflora.
Int. J. Hydrog. Energy. 2009;34:5365-5372.
Alexopoulou E, Zanetti F, Scordia D, Zegada-Lizarazu W, Christou M, Testa G,
Cosentino SL, Monti A. Long-term Yields of Switchgrass, Giant Reed, and Miscanthus
in the Mediterranean Basin. Bioenerg. Res.. 2015;8:1492-1499.
Barros AR, Amorim EMC, Reis CM, Shida GM, Silva EL. Biohydrogen production in
anaerobic fluidized bed reactors: Effect of support material and hydraulic retention
time. Int. J. Hydrog. Energy. 2010;35:3379-3388.
Chang FY, Lin CY. Biohydrogen production using an up-flow anaerobic sludge blanket
reactor. Int. J. Hydrog. Energy. 2004;29(1):33-39.
Cheong DY, Hansen CL. Bacterial stress enrichment enhances anaerobic hydrogen
production in cattle manure sludge. Appl. Microbiol. Biotechnol. 2006;72:635-643.
Chin HL, Chen ZS, Chou CP. Fedbatch operation using Clostridium acetobutylicum
suspension culture as biocatalyst for enhancing hydrogen production. Biotechnol.
Prog. 2003;19:383-388.
Chong ML, Sabaratnam V, Shirai Y, Hassan MA. Biohydrogen production from
biomass and industrial wastes by dark fermentation. Int. J. Hydrog. Energy 2009;
34:3277-3287.
Chopra J, Tiwari BR, Dubey BK, Sen R. Environmental impact analysis of oleaginous
yeast based biodiesel and bio-crude production by life cycle assessment. J. Clean.
Prod. 2020;271:122349.
Cohen A, Distel B, van Deursen A, van Andel JG. Role of anaerobic spore-forming
bacteria in the acidogenesis of glucose—changes induced by discontinuous or low-
rate feed supply. Antonie van Leeuwenhoek 1985;51(2):179–92.
Collet C, Adler N, Schwitzguebel JP, Peringer P. Hydrogen production by Clostridium
thermolacticum during continuous fermentation of lactose. Int. J. Hydrog. Energy.
2004;29:1479-1485.

31
Cresson R, Escudié R, Steyer JP, Delgenès JP, Bernet N. Competition between
planktonic and fixed microorganisms during the start-up of methanogenic biofilm
reactors. Water Res. 2008;42:792-800.
Curtis WR, Tuerk AL. Oxygen Transport in Plant Tissue Culture Systems. In: Gupta
SD, Ibaraki Y, editors. Plant Tissue Culture Engineering: Focus on Biotechnology
(volume 6), Dordrecht: Springer; 2008, p. 173-186.
Debnath SC. Bioreactors and molecular analysis in berry crop micropropagation – A
review. Can. J. Plant Sci. 2011;91:147-157.
Etienne H, Berthouly M. Temporary immersion systems in plant micropropagation.
Plant Cell, Tissue and Organ Culture. 2002;69:215-231.
Evvyernie D, Morimoto K, Karita S, Kimura T, Sakka K, Ohmiya K. Conversion of
chitinous wastes to hydrogen gas by Clostridium paraputrificum M-21. J. Biosci.
Bioeng. 2001;91: 339-343.
Fabiano B, Perego P. Thermodynamic study and optimization of hydrogen production
by Enterobacter aerogenes. Int. J. Hydrog. Energy. 2002;27:149-156.
Fan KS, Kan N, Lay J. Effect of hydraulic retention time on anaerobic hydrogenisis in
CSTR. Bioresour. Technol. 2006; 97:84-89.
Fang HHP, Liu H. Effect of pH on hydrogen production from glucose by a mixed
culture. Bioresour Technol 2002; 82:87-93.
Fazeli S, Fatehizadeh A, Hassani AH, Torabian A, Amin MM. Evaluation of flat sheet
membrane bioreactor efficiency for municipal wastewater treatment. Int J Env Health
Eng, 2012;1:19-23.
Fernandes P. Enzymes in food processing: a condensed overview on strategies for
better biocatalysts. Enzyme Res. 2010;2010: 1-19.
Georgiev V, Schumann A, Pavlov A, Bley T. Temporary immersion systems in plant
biotechnology. Eng. Life Sci. 2014;14:607-621.
Guo XM, Trably E, Latrille E, Carrère H, Steyer JP. Hydrogen production from
agricultural waste by dark fermentation: A review. Int. J. Hydrog. Energy.
2010;35:10660-10673.

32
Hallenbeck PC, Ghosh D. Advances in fermentative biohydrogen production: the way
forward. Trends in Biotechnology. 2009;27(5):287-297.
Hallenbeck PC. Fermentative hydrogen production: Principles, progress, and
prognosis. Int. J. Hydrog. Energy. 2009;34:7379-7389.
Hawkes FR, Dinsdale R, Hawkes DL, Hussy I. Sustainable fermentative hydrogen
production: challenges for process optimization. Int. J. Hydrog. Energy 2002;27:1339–
1347.
Hawkes FR, Hussy I, Kyazze G, Dinsdale R Hawkes DL. Continuous dark fermentative
hydrogen production by mesophilic microflora: Principles and progress. Int. J. Hydrog.
Energy. 2007;32:172-184.
Hu B, Chen S. Pre-treatment of methanogenic granules for immobilized hydrogen
fermentation. Int. J. Hydrog. Energy. 2007;32: 3266-3273.
Hung CH, Chang YT, Chang YJ. Role of microorganisms other than Clostridium and
Enterobacter in anaerobic fermentative biohydrogen production systems - Bioresour.
Technol. 2011;102(18):8437-8444.
Hussy I, Hawkes FR, Dinsdale R, Hawkes DL. Continuous fermentative hydrogen
production from a wheat starch co-product by mixed microflora. Biotechnol Bioeng
2003;84(6):619–626.
Hussy I, Hawkes FR, Dinsdale R, Hawkes DL. Continuous fermentative hydrogen
production from sucrose and sugarbeet. Int. J. Hydrog. Energy 2005;30(5):471-483.
Jung KW, Kim DH, Kim SH, Shin HS. Bioreactor design for continuous dark
fermentative hydrogen production. Bioresour. Technol. 2011;102(18): 8612-8620.
Kang JH, Kim D, Lee TJ. Hydrogen production and microbial diversity in sewage
sludge fermentation preceded by heat and alkaline treatment. Bioresour. Technol.
2012;109:239-243.
Kapdan IK, Kargi F. Bio-hydrogen production from waste materials: a review. Enzyme
Microb. Technol. 2006;38:569-582.

33
Kataoka N, Miya A, Kiriyama K. Studies on hydrogen production by continuous culture
system of hydrogen producing anaerobic bacteria. Water Sci. Technol. 1997;36:41-
47.
Kim DH, Han SK, Kim SH, Shin HS. Effect of gas sparging on continuous fermentative
hydrogen production. Int. J. Hydrog. Energy 2006;31(15):2158-2169.
Kothari R, Singh DP, Tyagi VV, Tyagi SK. Fermentative hydrogen production -An
alternative clean energy source. Renew. Sust. Energ. Rev. 2012;16:2337-2346.
Kraemer JT, Bagley DM. Improving the yield from fermentative hydrogen production.
Biotechnol. Lett. 2007;29:685-695.
Kraemer JT, Bagley DM. Supersaturation of dissolved H2 and CO2 during fermentative
hydrogen production with N2 sparging. Biotechnol. Lett. 2006; 28(18):1485-1491.
Kumar N, Das D. Continuous hydrogen production by immobilized Enterobacter
cloacae IIT-BT 08 using lignocellulosic materials and solid matrices. Enzyme Microb.
Technol. 2001;29:280- 287.
Kumar N, Das D. Enhancement of hydrogen production by Enterobacter cloacae IIT-
BT 08. Process Biochem. 2000;35:589-593.
Kyazze G, Martinez-Perez N, Dinsdale R, Premier GC, Hawkes FR, Guwy AJ, Hawkes
DL. Influence of substrate concentration on the stability and yield of continuous
biohydrogen production. Biotechnol Bioeng 2006;93(5):971-979.
Lalit Babu V, Venkata Mohan S, Sarma PN. Influence of reactor configuration on
fermentative hydrogen production during wastewater treatment. Int. J. Hydrog.
Energy. 2009;34: 3305-3312.
Lamed RJ, Lobos JH, Su TM. Effects of stirring and hydrogen on fermentation
products of Clostridium thermocellum. Appl Environ Microbiol 1988;54(5):1216-1221.
Lay JJ, Lee YJ, Noike T. Feasibility of biological hydrogen production from organic
fraction of municipal solid waste. Water Res 1999; 33(11):2579-2586.
Lay JJ. Biohydrogen generation by mesophilic anaerobic fermentation of
microcrystalline cellulose. Biotechnol Bioeng 2001;74:280-287.

34
Lay JJ. Modeling and optimization of anaerobic digested sludge converting starch to
hydrogen. Biotechnol Bioeng 2000;68(3):269-278.
Lee DJ, Show KY, Su A. Dark fermentation on biohydrogen production: Pure culture.
Bioresour. Technol. 2011;102:8393-8402.
Lee KS, Lin PJ. Chang JS. Temperature effects on biohydrogen production in a
granular sludge bed induced by activated carbon carriers. Int. J. Hydrog. Energy 2006;
31:465-472.
Levin DB, Islam R, Cicek N, Sparling R. Hydrogen production by Clostridium
thermocellum 27405 from cellulosic biomass substrates. Process Biochem.
2006;31:1496-1503.
Lin CN, Wu SY, Chang JS, Chang JS. Biohydrogen production in a three-phase
fluidized bed bioreactor using sewage sludge immobilized by ethylene-vinyl acetate
copolymer. Bioresour. Technol. 2009;100(13):3298- 3301.
Lin CY, Chang RC. Hydrogen production during anaerobic acidogenic conversion of
glucose. J. Chem. Technol. Biotechnol. 1999;74(6):496-500.
Liu DW, Liu DP, Zeng RJ, Angelidaki I. Hydrogen and methane production from
household solid waste in the two-stage fermentation process. Water Res
2006;40(11):2230-2236.
Lo YC, Chen WM, Hung CH, Chen SD, Chang JS. Dark H2 fermentation from sucrose
and xylose using H2-producing indigenous bacteria: feasibility and kinetic studies.
Water Res. 2008;42: 827-842.
Logan BE, Oh SE, Kim IS, Van Ginkel S. Biological hydrogen production measured in
batch anaerobic respirometers. Environ. Sci. Technol. 2002;36(11):2530-2535.
Mahyudin AR, Furutani Y, Nakashimada Y, Kakizono T, Nishio N. Enhanced hydrogen
production in altered mixed acid fermentation of glucose by Enterobacter aerogenes.
Journal of Fermentation Bioengineering. 1997;83(4): 358-363.
Mandal B, Nath K, Das D. Improvement of biohydrogen production under decreased
partial pressure of H2 by Enterobacter cloacae. Biotechnol Lett 2006;28(11):831-835.

35
Mizuno O, Dinsdale R, Hawkes FR, Hawkes DL, Noike T. Enhancement of hydrogen
production from glucose by nitrogen gas sparging. Bioresour. Technol. 2000;73:59-
65.
Mohan SV, Babu VL, Sarma PN. Effect of various pre-treatment methods on anaerobic
mixed microflora to enhance biohydrogen production utilizing dairy wastewater as
substrate. Bioresour. Technol. 2008;99:59-67.
Mu Y, Yu HQ, Wang Y. The role of pH in the fermentative H2 production from an
acidogenic granule-based reactor. Chemosphere. 2006a;64:350-358.
Mu Y, Zheng XJ, Yu HQ, Zhu RF. Biological hydrogen production by anaerobic sludge
at various temperatures. Int. J. Hydrog. Energy 2006b;31:780-785.
Nath K, Das D. Improvement of fermentative hydrogen production: various
approaches. Appl Microbiol Biotechnol 2004; 65:520-529.
Ntaikou I, Antonopoulou G, Lyberatos G. Biohydrogen production from biomass and
wastes via dark fermentation: A review. Waste Biomass Valor 2010;1: 21-39.
Ntaikou I, Gavala HN, Kornaros M, Lyberatos G. Hydrogen production from sugars
and sweet sorghum biomass using Ruminococcus albus. Int. J. Hydrog. Energy
2008;33:1153-1163.
Oh SE, Iyer P, Bruns MA, Logan BE. Biological hydrogen production using a
membrane bioreactor. Biotechnol. Bioeng. 2004;87:119-127.
Oh YK, Kim HJ, Park S, Kim MS, Ryu DDY. Metabolic-flux analysis of hydrogen
production pathway in Citrobacter amalonaticus Y19. Int. J. Hydrog. Energy.
2008;33:1471-1482.
Oh YK, Seol EH, Yeol Lee E, Park S. Fermentative hydrogen production by a new
chemolithotrophic bacterium Rhodopseudomonas palustris P4. Int. J. Hydrog. Energy.
2002;27:1373-1379.
O-Thong S, Prasertsan P, Birkeland NK. Evaluation of methods for preparing
hydrogen-producing seed inocula under thermophilic condition by process
performance and microbial community analysis. Bioresour. Technol. 2009;100:909-
918.
36
Reddy BVS, Ramesh S, Reddy PS, Ramaiah B, Salimath M, Kachapur R. Sweet
Sorghum – A Potential Alternate Raw Material for Bio-ethanol and Bio-energy.
International Sorghum and Millets Newsletter. 2005;46:79-86.
Ren NQ, Guo WQ, Wang XJ, Xiang WS, Liu BF, Wang XZ, Ding J, Chen ZB. Effect of
different pretreatment methods on fermentation types and dominant bacteria for
hydrogen production. Int. J. Hydrog. Energy. 2008;33:4318-4324.
Robert ML, Herrera-Herrera JL, Herrera-Herrera G, Herrera-Alamillo MÁ, Fuentes-
Carrillo P. A New Temporary Immersion Bioreactor System for Micropropagation. In:
Loyola-Vargas VM, Vázquez-Flota F, editors. Plant Cell Culture Protocols. Methods in
Molecular Biology™ (volume 318), Totowa: Humana Press, 2006, p. 121-129.
Seghezzo L, Zeeman G, Van Lier JB, Hamelers HVM, Lettinga G. A Review: The
Anaerobic Treatment of Sewage in UASB and EGSB Reactors. Bioresour. Technol.
1998;65:175-190.
Shin HS, Youn JH, Kim SH. Hydrogen production from food waste in anaerobic
mesophilic and thermophilic acidogenesis. Int. J. Hydrog. Energy. 2004;29:1355-
1363.
Show KY, Lee DJ, Chang JS. Bioreactor and process design for biohydrogen
production. Bioresour. Technol. 2011;102:8524-8533.
Show KY, Zhang ZP, Lee DJ. Design of bioreactors for biohydrogen production. J. Sci.
Ind. Res. 2008;67: 941-949.
Show KY, Zhang ZP, Tay JH, Liang TD, Lee DJ, Jiang WJ. Production of hydrogen in
a granular sludge-based anaerobic continuous stirred tank reactor. Int. J. Hydrog.
Energy. 2007;32(18):4744- 4753.
Tanisho S, Ishiwata Y. Continuous hydrogen production from molasses by
fermentation using urethane foam as a support of flocks. Int. J. Hydrog. Energy.
1995;20:541-545.
Tanisho S, Kuromoto M, Kadokura N. Effect of CO2 removal on hydrogen production
by fermentation. Int. J. Hydrog. Energy. 1998;23:559-563.

37
Tilley E, Ulrich L, Lüthi C, Reymond PH, Zurbrügg C. Compendium of Sanitation
Systems and Technologies. 2nd Revised Edition. Dübendorf, Switzerland: Swiss
Federal Institute of Aquatic Science and Technology (Eawag); 2014. pg. 122.
Tiwari MK., Guha S, Harendranath CS, Tripathi S. Influence of extrinsic factors on
granulation in UASB reactor. Appl. Microbiol. Biotechnol. 2006; 71(2):145-154.
Ueno Y, Haruta S, Ishii M, Igarashi Y. Characterization of a microorganism isolated
from the effluent of hydrogen fermentation by microflora. J. Biosci. Bioeng.
2001;92:397-400.
Valdez-Vazquez I, Rios-Leal E, Esparza-Garcia F, Cecchi F, Poggi-Varaldo HM.
Semi-continuous solid substrate anaerobic reactors for H2 production from organic
waste: Mesophilic versus thermophilic regime. Int. J. Hydrog. Energy. 2005;30:1383-
1391.
van Niel EWJ, Budde MAW, de Haas GG, van der Wal FJ, Claassen PAM, Stams
AJM. Distinctive properties of high hydrogen producing extreme thermophiles,
Caldicellulosiruptor saccharolyticus and Thermotoga elfii. Int. J. Hydrog. Energy.
2002;27:1391-1398.
Venkata Mohan S, Lalit Babu V, Vijaya Bhaskar Y, Sarma PN. Influence of
recirculation on the performance of anaerobic sequencing batch biofilm reactor
(AnSBBR) treating hypersaline composite chemical wastewater. Bioresour. Technol.
2007b;98(7):1373-1379.
Venkata Mohan S, Vijaya Bhaskar Y, Murali Krishna P, Chandrasekhara Rao N, Lalit
Babu V, Sarma PN. Biohydrogen production from chemical wastewater as substrate
by selectively enriched anaerobic mixed consortia: Influence of fermentation pH and
substrate composition. Int. J. Hydrog. Energy 2007a; 32:2286-2295
Waligórska M. Fermentative Hydrogen Production - Process Design and Bioreactors.
Chem Process Eng. 2012;33(4): 585-594.
Wang JL, Wan W. Comparison of different pretreatment methods for enriching
hydrogen-producing cultures from digested sludge. Int. J. Hydrog. Energy.
2008;33:2934-2941.

38
Wang Y, Mu Y, Yu HQ. Comparative performance of two upflow anaerobic
biohydrogen-producing reactors seeded with different sludges. Int. J. Hydrog. Energy.
2007;32:1086-1094.
Watt MP. The status of temporary immersion system (TIS) technology for plant
micropropagation. Afr. J. Biotechnol. 2012;11(76):14025-14035.
Wu SY, Hung CH, Lin CN, Chen HW, Lee AS, Chang JS. Fermentative hydrogen
production and bacterial community structure in high-rate anaerobic bioreactors
containing silicone-immobilized and self-flocculated sludge. Biotechnol. Bioeng.
2006;93 (5):934-946.
Xing DF, Ren NQ, Wang AJ, Li QB, Feng YJ, Ma F. Continuous hydrogen production
of auto-aggregative Ethanoligenens harbinense YUAN-3 under non-sterile condition.
Int. J. Hydrog. Energy. 2008;33:1489-1495.
Yang G, Yin Y, Wang J. Microbial community diversity during fermentative hydrogen
production inoculating various pretreated cultures. Int. J. Hydrog. Energy.
2019;44(26):13147-13156.
Ye NF, Lü F, Shao LM, Godon JJ, He PJ. Bacterial community dynamics and product
distribution during pH-adjusted fermentation of vegetable wastes. J. Appl. Microbiol.
2007;103:1055-1065.
Yu HQ, Hu ZH, Hong TQ. Hydrogen production from rice winery wastewater by using
a continuously-stirred tank reactor. J. Chem. Eng. Japan. 2003;36: 1147-1151.
Zang ZP, Tay JH, Show YK, Yan R, Liang DT, Lee DJ, Jiang WJ. Biohydrogen
production in granular activated carbon anaerobic fluidized bed reactor. Int. J. Hydrog.
Energy. 2007;32:185-191.
Zhang ZP, Show KY, Tay JH, Liang DT, Lee DJ, Jiang WJ. Effect of hydraulic retention
time on biohydrogen production and microbial community. Process Biochem.
2006;41:2118-2123.
Zhong JJ, Fujiyama K, Seki T, Yoshida T. A Quantitative Analysis of Shear Effects on
Cell Suspension and Cell Culture of Perilla frutescens in Bioreactors. Biotechnol.
Bioeng. 1994;44: 649-654.
Zhu G, Liu C, Li J, Ren N, Liu L, Huang X. Fermentative hydrogen production from
beet sugar factory wastewater treatment in a continuous stirred tank reactor using
anaerobic mixed consortia. Front. Environ. Sci. Eng. 2013;7(1):143-150.
Zhu H, Béland M. Evaluation of alternative methods of preparing hydrogen producing
seeds from digested wastewater sludge. Int. J. Hydrog. Energy. 2006;31:1980-1988.

39
Chapter 3
Design, implementation and assessment of a novel bioreactor for
fermentative biohydrogen process development
This chapter has been published with the title: Design, implementation and
assessment of a novel bioreactor for fermentative biohydrogen process development
in the International Journal of Hydrogen Energy (2016; 41: 10136-10144)
The article is presented in the following pages.

40
Abstract
1. Introduction

41
2. Materials and methods
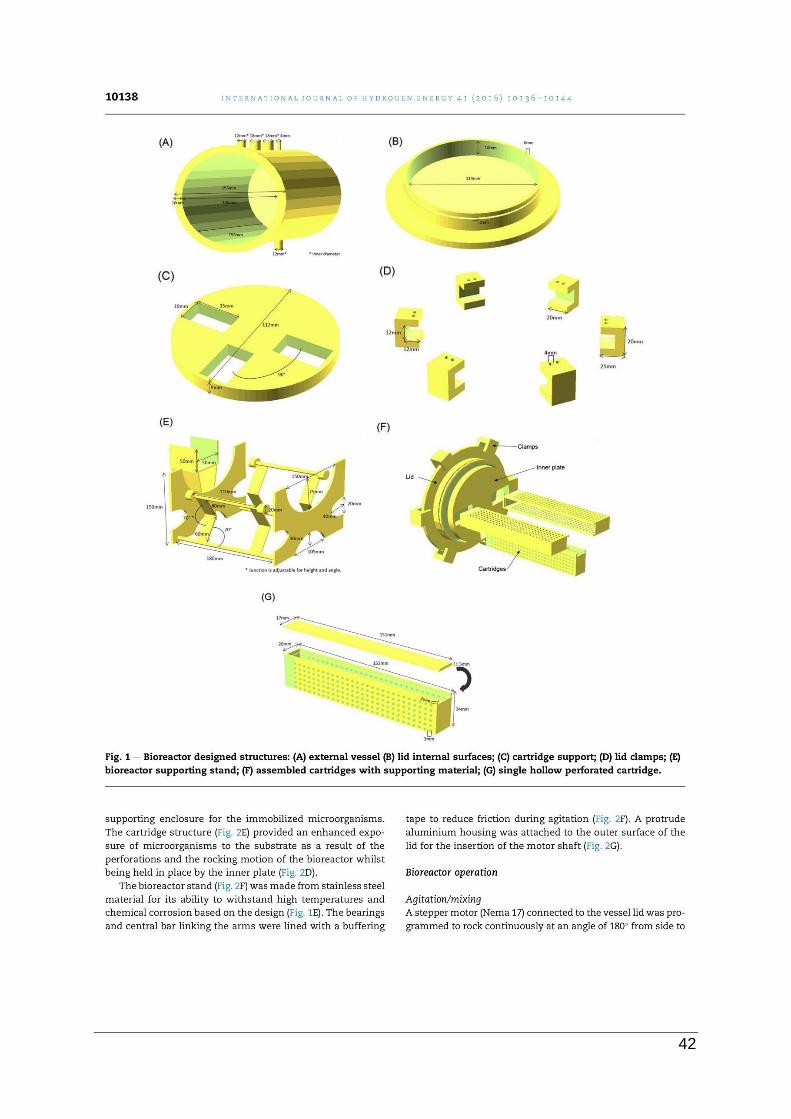
42
Figure 3: Bioreactor designed structures: (A) external vessel (B) lid internal surfaces;
(C) cartridge support; (D) lid clamps; (E) bioreactor supporting stand; (F) assembled
cartridges with supporting material; (G) single hollow perforated cartridge.
Figure 1

43
Figure 4: Implemented structures of the bioreactor: (A) reactor glass vessel; (B) lid
internal surface; (C) vesconite clamps; (D) 3D-printed cartridge support structure; (E)
3D-printed cartridges; (F) stainless steel support stand; (G) assembled bioreactor.
Figure 2

44
3. Results and discussion
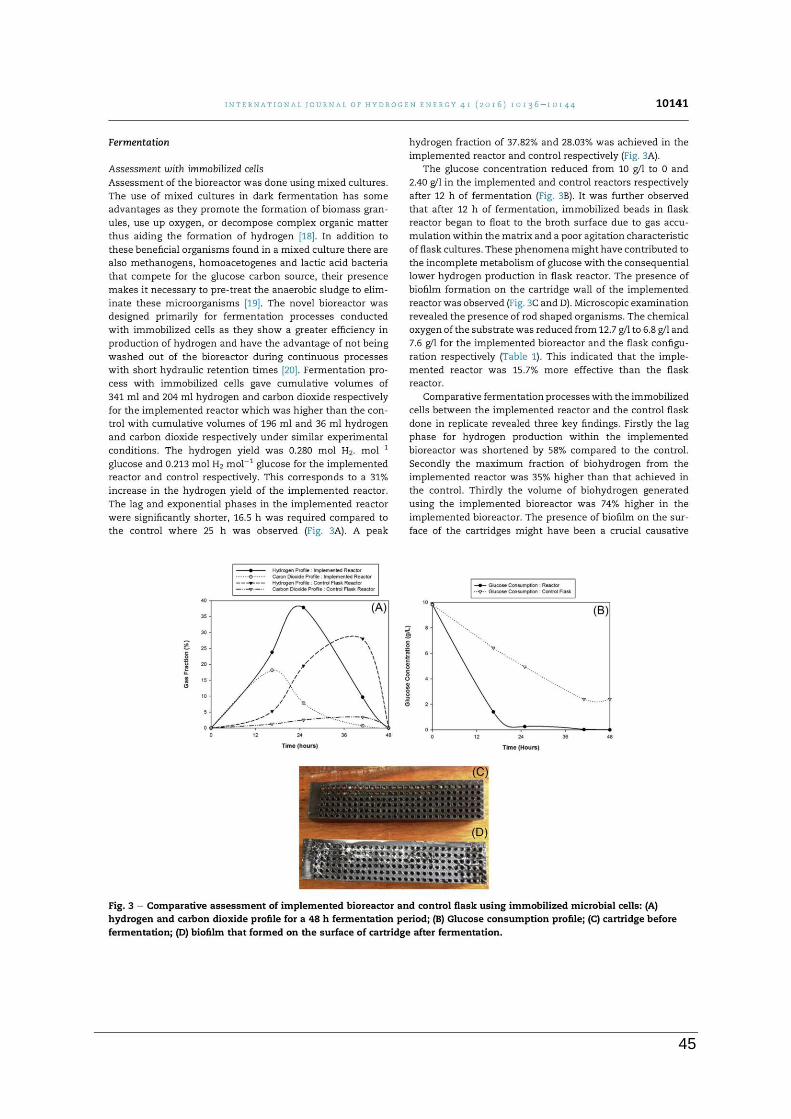
45
Figure 5: Comparative assessment of implemented bioreactor and control flask using
immobilized microbial cells: (A) hydrogen and carbon dioxide profile for a 48 h
fermentation period; (B) Glucose consumption profile; (C) cartridge before
fermentation; (D) biofilm that formed on the surface of cartridge after fermentation.
Figure 3

46
Table 2: COD for substrate and effluent from implemented reactor and control flask.
Table 1
Figure 6: Hydrogen and Carbon Dioxide evolution from implemented reactor in real-
time using immobilized cells.
Figure 4
Figure 7: Comparative assessment of implemented bioreactor and control flask using
suspended cells: (A) hydrogen and carbon dioxide profile for a 48 h fermentation
period; (B) glucose consumption profile
Figure 5

47
Figure 8: Scanning electron micrograph of a cross section from a sludge alginate
beads (A) before fermentation at 5000x, (B) after fermentation from the shake flask
control at 5000x, and (C) after fermentation from the implemented bioreactor
cartridge at 8000x.
Figure 6
4. Conclusion
5. References

48

49
Chapter 4
Adaptation of cell immobilization cartridge unit to continuous
stirred tank reactor improves dark fermentative hydrogen
production
This chapter has been submitted to Renewable Energy with the title: Adaptation of cell
Immobilization Cartridge unit to Continuous Stirred Tank Reactor Improves dark
fermentative hydrogen production.
The manuscript is presented in the following pages:

50
Adaptation of cell Immobilization Cartridge unit to Continuous Stirred Tank Reactor
Improves dark fermentative hydrogen production
M.B. Hassan Khan, E.B. Gueguim Kana*1
Discipline of Microbiology, School of Life Sciences, University of KwaZulu-Natal,
Private Bag XO1, Scottsville, 3209 Pietermaritzburg, South Africa
Abstract
Challenges associated with biohydrogen production in a continuous stirred tank
reactor (CSTR) using immobilized cells include bead floatation due to gas
accumulation, excessive sheer stress and biomass washout in continuous processes.
Thus, the need for a novel reactor configuration. In this study, a three-part cartridge
structure was incorporated into a standard CSTR. The cartridge (46x40x300 mm) was
made up of perforated hollow rectangular tubes aligned at 120° along the agitating
shaft. The designed structure houses the immobilized inoculum and also served as
impellers. This structure was fabricated using laboratory grade stainless steel. A
comparative assessment of the cartridge and standard CSTR with suspended and
immobilized mixed microbial culture was carried out. Fermentation process using the
Immobilized Cells in Cartridge (ICC) showed an improved hydrogen yield of 3.9 fold
and 2.8 fold compared to the Suspended Cells in Reactor (SCR) and Immobilized
Cells in Reactor (ICR) processes. ICC decreased fermentation time by 52 and 65%
compared to SCR and ICR respectively. Gompertz model coefficients showed a 98
and 37% improvement in the maximum hydrogen production rate (Rm) using the ICC
compared to the SCR and ICR fermentations. Additionally, the ICC showed improved
pH buffering capacity and complete glucose degradation. These findings demonstrate
that the developed ICC concept holds innovative proficiencies to improve fermentative
biohydrogen productivity, yield and process economics.
Keywords: Hybrid biogas bioreactor, Dark fermentation, Biohydrogen, CSTR, cell
immobilization
1 Corresponding author. Tel.: +27 332605527.
E-mail address: [email protected] (E.B. Gueguim Kana).

51
Highlights:
The use of immobilized cells with the cartridge unit improved hydrogen yield
The developed system prevented damage or destruction of the immobilized
matrix
Challenge of bead floatation associated with gas production was eliminated.
Improved pH buffering capacity and complete glucose degradation was
achieved.
1. Introduction
The environmental impact of fossil fuel usage ensues in increased greenhouse gas
emissions and depletion of the ozone layer. Mitigation of these impacts can be
achieved by harnessing an inexhaustible environmentally friendly low-cost energy
source such as biohydrogen. Hydrogen is also the only known fuel that is free from
carbon, and will therefore not contribute to acid rain, the greenhouse effect and ozone
depletion upon combustion [1]. Combustion of hydrogen results in water vapour and
energy making it the ideal innocuous fuel [1]. Hydrogen has a chemical energy of
142 MJ kg-1 per mass, this is a minimum of three times the equivalent of other chemical
fuels [2]. The three core methods of biological hydrogen production include
biophotolysis of water, photodecomposition of organic composites and fermentation
of organic wastes [3]. Fermentation of organic wastes transpires at a higher rate and
has extensive applicability and integration prospects [4, 5]. The dark fermentative
hydrogen production bioprocess is sensitive to various physicochemical process
parameters. These include inoculum type, preparation and state, temperature,
hydraulic retention time (HRT), hydrogen partial pressure, pH, substrate type and
bioreactor configuration and operation amongst other physicochemical influences [6].
Biomass retention, heat and mass transfer have significant impact of biohydrogen
yield [3, 7, 8], both of which depend predominantly on bioreactor design [9]. The
primary objective of a bioreactor is to provide a controlled microclimate optimal to
cellular growth and/or product formation [10]. A suitable bioreactor for dark
fermentation should maintain an adequate biomass concentration, efficient mixing with
reduced shear stress, facilitate homogenous nutrient supply and be proficient at
product formation and extraction, amongst other standard functions [10]. Biohydrogen
production using a continuous stirred tank reactor (CSTR) was previously reported
[11, 12, 13]. This configuration possesses an outstanding mixing ability, which plays a

52
significant role in maintaining homeostasis in the physicochemical parameters of a
fermentation process. The mixing mechanism of the CSTR accommodates a
conglomeration of substrates, particularly waste materials, ranging from highly viscous
mixtures to heterogeneous composites with insoluble factions. The hydrodynamics
and superior mass transfer of the CSTR are exceedingly commendable attributes of
this configuration [11]. The intrinsic design of the CSTR is not compatible with
protecting biomass washout during short HRT, which is essential for optimum
hydrogen production, due to excessive sheer stress and biomass washout [3, 11, 14].
Less turbulent mixing systems with a greater potential to maintain immobilized
biomass, viz. fixed bed reactors, up flow reactors, anaerobic granular sludge bed
bioreactors and membrane reactors are alternative configurations commonly used in
dark fermentative biohydrogen production [11]. However, impaired mass transfer,
reduced substrate conversion rates and decreased hydrogen production have been
identified as major limitations in these immobilized reactors [15], thus accentuating the
need for a novel bioreactor configuration for biohydrogen production [16].
Cell immobilization is the physical restriction or isolation of whole cells to a distinct
area to carry out a chosen purpose [17]. Enhanced hydrogen production was reported
using immobilized cell systems [18]. Immobilization influences the microbial
inoculum’s tolerance to metabolic strain in terms of temperature, pH, organic loading
rate and hydraulic retention time [3, 18]. The major methods for microbial cells
immobilization include encapsulation, adsorption and polymer-based entrapment [18].
Adsorption involves the physical attachment of bacterial cells to a support matrix via
bonding of positive and negative charges [18], an example is the use of coir in a
packed bed reactor [19]. The ionic charge of the reaction mixture impacts the integrity
of the attachment, therefore a change in the pH may affect the immobilization process.
Encapsulation is a process wherein bacterial cells are enclosed within a semi-
permeable membrane [18], e.g. the use of polyvinylidene fluoride (PVDF) in a serum
glass bottle [20]. This technique minimises the escape of bacterial cells into the
reaction mixture, reducing downstream processing of effluent [18]. The entrapment of
bacterial cells, the most common and preferred technique, entails the incorporation of
bacterial cells into a porous matrix [18]. The matrix may be biodegradable, e.g.
alginate or agar, or non-biodegradable, e.g. acrylic, latex or silicone [18]. The most
suitable choice depends on various factors, namely, the nature of the fermentation,

53
the physicochemical characteristics of the substrate, metabolism of inoculum and the
bioreactor chosen to orchestrate the fermentation process. Zhao et al. [21] reported
a 41% increase in the hydrogen production rate compared to the control using
mycelium pellets to immobilize Clostridium species in a CSTR. Adsorption and
entrapment on substances such as polyurethane and silicone are commonly used in
fluidized bed reactors [22, 23]. Granular activated carbon may be used independently
or as an auxiliary ingredient in immobilization matrices [24, 25]. Immobilized cell
technology was reported in dark fermentative hydrogen generation as a means of
increasing productivity via cell retention. For example, an improvement of 71% on the
rate of hydrogen production was reported using immobilized pure cultures [26].
Similarly, immobilized mixed microbial cultures have shown an improvement in the
rate of hydrogen production within the range of 52 - 213% [13, 27]. Enhanced
substrate conversion and pH buffering are benefits of immobilization that aid in
hydrogen productivity [26, 28]. The mechanical strength of alginate matrices is
susceptible to collapse, and gas producing immobilized beads are prone to float as
gas production progresses [27], which ultimately impedes mass transfer. Salem et al.
[13] suggested that the method of immobilization must harmonise with the bioreactor
design to improve fermentation dynamics. Inappropriate matrices could impede mass
transfer and have an adverse effect on product formation. Moreover the collusion of
the carrier against the walls or the reactor may cause the microorganisms to become
dislodged and lost into the fermentation broth [13]. These observations suggest the
need to investigate for more appropriate bioreactor configuration for biohydrogen
production using immobilized cells.
In this study a novel cartridge structure for cell immobilization is designed and adapted
to the CSTR, Immobilized Cells in Cartridge (ICC). The developed reactor is
comparatively assessed against the standard CSTR on dark fermentations using
Suspended Cells in Reactor (SCR) and Immobilized Cells in Reactor (ICR).

54
2. Materials and methods
2.1. Bioreactor modification and design of the cartridge unit
The standard CSTR reactor used in this study was a 13 L INFORS HT Labfors 3 (Infors
AG, Switzerland). The CSTR was modified by the addition of a cell immobilization
cartridge (Figure 1). The cartridge was designed using the CAD modelling software
OpenSCAD version 2015.03 (http://www.openscad.org). It constituted of three
rectangular perforated ducts of 46 mm x 40 mm x 300 mm size (Figure 1A). The pore
size was 3 mm in diameter (Figure 1A). The total volume of the cartridge was 1656
ml. The three ducts were aligned at 120° around a central pipe with an external
diameter of 15 mm, followed by a shift of +7,5 mm on the x-plane and -15 mm on the
y-plane (Figure 1B). This was necessary in order to minimise the outer rotation
diameter of the cartridge, whilst ensuring the placement of the reactor shaft (Figure
1B). The top and bottom cover plates enclosed the structure at both ends (Figure 1C).
These cover plates have a central opening of 15.5 mm to enable the passage of an
agitation shaft. Grub screws held the complex together and attached it to the agitating
shaft simultaneously (Figure 2B). Dynamic stability was achieved by ensuring that the
cartridge fitted precisely around the reactor shaft. Other designed considerations were:
maximising the cartridge size to allow a variety of inoculum concentrations, promoting
enhanced exposure between inoculum and substrate and ensuring that the cartridge
was able to integrate within the standard reactor unobtrusively during agitation. The
cartridge structure was removable and could be interchanged with other standard
impellers. The material used to fabricate the cartridge unit was a 1.2 mm thick stainless
steel sheet (316-2B) (Figure 1C).
The developed reactor was comparatively assessed against the standard CSTR on
dark fermentations using suspended and immobilized mixed microbial cells.
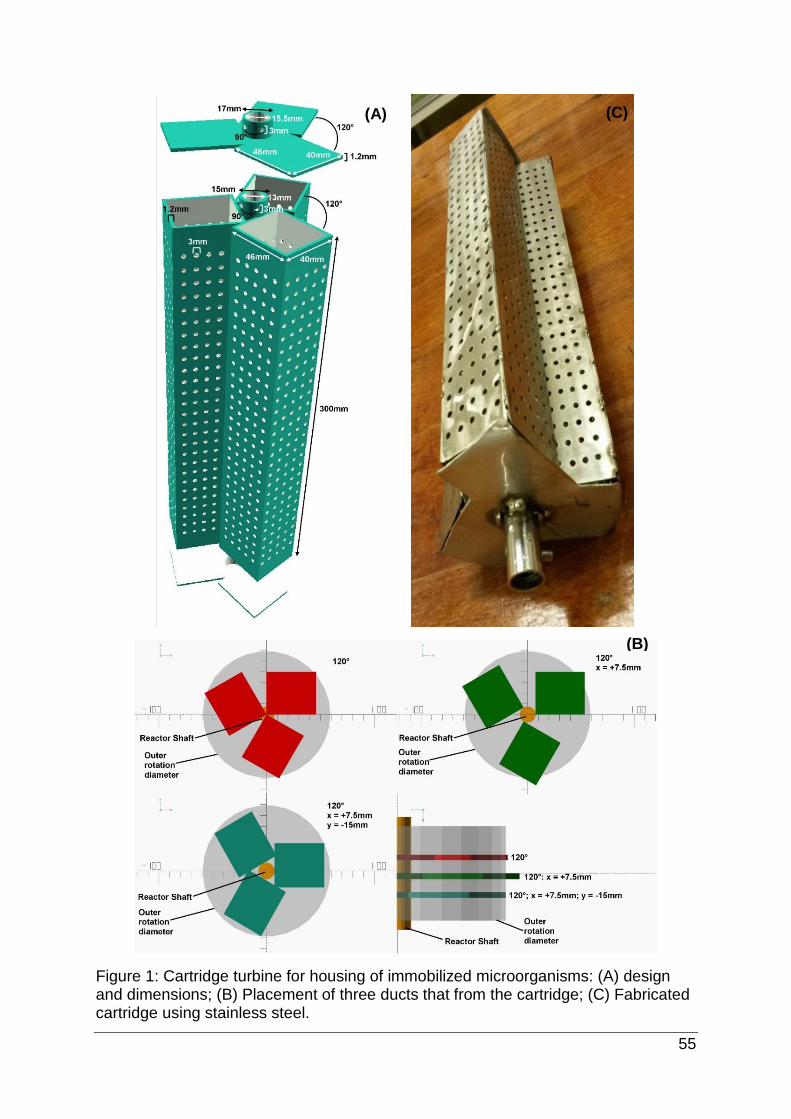
55
Figure 1: Cartridge turbine for housing of immobilized microorganisms: (A) design and dimensions; (B) Placement of three ducts that from the cartridge; (C) Fabricated cartridge using stainless steel.
(A)
(B)
(C)

56
2.2. Assessment of the developed bioreactors for fermentative
biohydrogen production
2.2.1. Inoculum and culture medium preparation
The inoculum consisted of anaerobic sludge acquired from Darville wastewater
treatment facility in Pietermaritzburg, South Africa. A heat pre-treatment was carried
out at 121°C for 10 min following a 24 hour incubation at pH 8 at 25°C [29] to deactivate
hydrogen consumers. Sodium alginate (Sigma) was mixed with the pre-treated
anaerobic sludge to make a final 3% alginate solution, containing a 20:80 alginate to
sludge ratio. 0.2% granular activated carbon was added to increase bead porosity [25].
The alginate sludge mixture was then trickled through a peristaltic pump (Watson-
marlow 503U) into a 0.2 M CaCl2•2H2O solution which enabled the alginate to cross-
link into small beads 3 mm in diameter. The fermentation medium consisted of 1.5 g
L-1 KH2PO4, 2 g L-1 (NH4)2SO4, 0.157 g L-1 FeCl2•4H2O, 0.1 g L-1 CaCl2•2H2O, 0.085
g L-1 MnCl2•4H2O, 0.178 g L-1 ZnSO4•7H2O, 0.072 g L-1 Na2MoO4•2H2O and 10 g L-1
C6H12O6 [29].
2.2.2. Bioreactor operation
Hydrogen was produced with an 8 litre working volume utilising a 10% inoculum size
(800 ml). Operational conditions of 37°C and 180 rpm were used for temperature and
agitation respectively with an initial pH of 6.8.
Three fermentation setups were carried out in batch mode. These encompassed, (1)
Suspended Cells in Reactor (SCR), wherein suspended cells was placed directly into
the substrate. (2) Immobilized Cells in Reactor (ICR), wherein immobilized cells were
placed directly into the substrate. (3) Immobilized Cells in Cartridge (ICC), wherein
immobilized cells was placed equally into the three rectangular perforated ducts of the
cartridge structure. The setup 1 and 2 were carried out in 13 L Infors bioreactor
equipped with two Rushton turbine impellers (Figure 2A). The setup 3 used a similar
bioreactor vessel, but without impellers as the cartridge system ensured the mixing
process (Figure 2B).
The reactor was sparged with nitrogen gas for 6 min directly prior to each start-up.
Fermentations were run for the duration of hydrogen production.

57
Figure 2: Continuous stirred tank reactor: (A) before modification, Rushton turbine impellers present; (B) after modification with removable cartridge turbine
2.3. Analytical methods
2.3.1. Gas and liquid phase
The total biogas produced was monitored in real time using f-lab software [30] via
Bluesens sensors for Hydrogen, Methane and Carbon Dioxide (Bluesens, Germany)
and a MILLIGASCOUNTER® (Ritter, Germany) under standard temperature and
pressure. The molar hydrogen yield was calculated according to equation (1).
HY = N H,F / (N g, i – N g,f) (1)
Where HY is the molar hydrogen yield, NH,F is the cumulative hydrogen volume in
moles, Ng,i and Ng,f represents the initial and final glucose concentration in moles, for
each run respectively.
(A) (B)
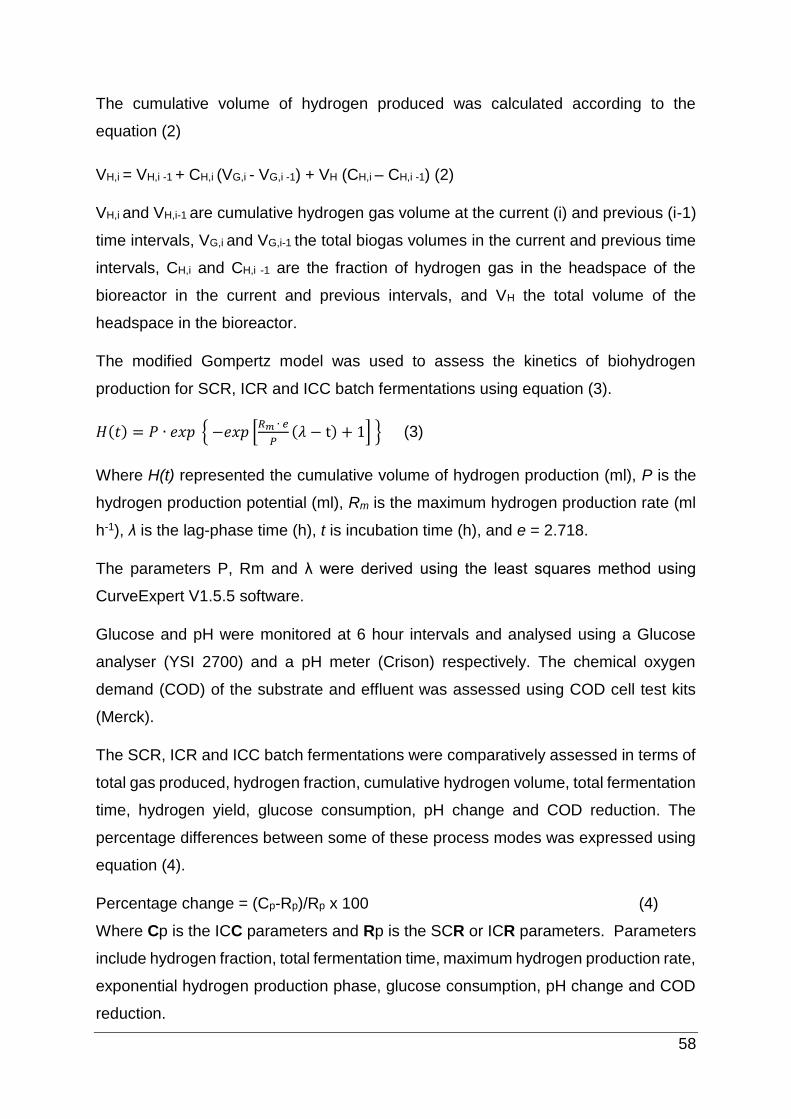
58
The cumulative volume of hydrogen produced was calculated according to the
equation (2)
VH,i = VH,i -1 + CH,i (VG,i - VG,i -1) + VH (CH,i – CH,i -1) (2)
VH,i and VH,i-1 are cumulative hydrogen gas volume at the current (i) and previous (i-1)
time intervals, VG,i and VG,i-1 the total biogas volumes in the current and previous time
intervals, CH,i and CH,i -1 are the fraction of hydrogen gas in the headspace of the
bioreactor in the current and previous intervals, and VH the total volume of the
headspace in the bioreactor.
The modified Gompertz model was used to assess the kinetics of biohydrogen
production for SCR, ICR and ICC batch fermentations using equation (3).
𝐻(𝑡) = 𝑃 ∙ 𝑒𝑥𝑝 { −𝑒𝑥𝑝 [𝑅𝑚 ∙ 𝑒
𝑃(𝜆 − t) + 1] } (3)
Where H(t) represented the cumulative volume of hydrogen production (ml), P is the
hydrogen production potential (ml), Rm is the maximum hydrogen production rate (ml
h-1), λ is the lag-phase time (h), t is incubation time (h), and e = 2.718.
The parameters P, Rm and λ were derived using the least squares method using
CurveExpert V1.5.5 software.
Glucose and pH were monitored at 6 hour intervals and analysed using a Glucose
analyser (YSI 2700) and a pH meter (Crison) respectively. The chemical oxygen
demand (COD) of the substrate and effluent was assessed using COD cell test kits
(Merck).
The SCR, ICR and ICC batch fermentations were comparatively assessed in terms of
total gas produced, hydrogen fraction, cumulative hydrogen volume, total fermentation
time, hydrogen yield, glucose consumption, pH change and COD reduction. The
percentage differences between some of these process modes was expressed using
equation (4).
Percentage change = (Cp-Rp)/Rp x 100 (4)
Where Cp is the ICC parameters and Rp is the SCR or ICR parameters. Parameters
include hydrogen fraction, total fermentation time, maximum hydrogen production rate,
exponential hydrogen production phase, glucose consumption, pH change and COD
reduction.

59
2.3.2. Microscopic inoculum analysis
The pre-treated inoculum anaerobic sludge, sludge-beads and the effluent beads from
the SCR and ICC fermentations were observed under scanning electron microscopy.
The pre-treated anaerobic sludge was homogenised and a single drop placed onto a
filter and air dried within a fume hood (ESCO Frontier). The filter disk was then affixed
to a copper stub via carbon tape and coated with gold in an Eiko IB-3 ion coater. The
beads were placed in 3% buffered Gluteraldehyde for 2 hours and washed in 0.05 M
Sodium Cocodylate buffer twice for 5 min each. Sequential dehydration was performed
with 10, 30, 50, 70, 90 and 100% ethanol for 10 min each. The beads were then dried
in a Quorum K850 critical point dryer, mounted on carbon tape, attached to copper
stubs and coated with gold in an Eiko IB-3 ion coater and viewed under a Zeiss EVO
LS15 scanning electron microscope [29].
3. Results and discussion
3.1. Bioreactor design and implementation
Stainless steel 316-2B, was used for cartridge fabrication. It has a high resistance to
corrosion in chloride environments [31] and can withstand repeated cycles of heat
sterilization at 121°C for 20 min, required for bioreactor components. The perforations
and the orientation of the cartridges maximise the exposure of the cells to the liquid
substrate. The structure and alignment of the cartridges, together with the baffles
promoted turbulence and prevented a vortex formation. The cartridges were attached
to each other at 120° to maximise the volume of the cartridges whilst ensuring stable
agitation without damaging the various probes. The rotation movement of the cartridge
enhanced mass and heat transfer with reduced shear damage on the immobilizing
matrix. This improved the reusability of immobilized cells. This configuration could also
be advantageous for processes with short hydraulic retention times, and would
therefore benefit hydrogen fermentations [32]. Additionally, stabilizing the inoculum
beads in the cartridge structure also prevented them from clogging the sensors or
blocking the sampling ports in the bioreactor, thus enhancing process monitoring.

60
3.2. Comparative assessment of SCR, ICR and ICC for hydrogen
production, glucose consumption and pH change
The SCR, ICR and ICC fermentation process modes were comparatively assessed.
The total biogas volume from SCR, ICR and ICC were 1209, 1359 and 8210ml
respectively with maximum biohydrogen fractions of 42.93, 46.92 and 30.30% (Figure
3A) corresponding to hydrogen volumes of 275.56, 383.16 and 1402.21ml (Figure 3B)
respectively. The ICC system showed an improvement of 6.8 fold and 6 fold for the
accumulated total biogas compared to SCR and ICR, indicating a greater degree of
biological activity. Furthermore the ICC showed an increase in the cumulative
biohydrogen volume of 5.1 fold compared to the SCR and 3.7 fold compared to the
ICR. Despite the lower hydrogen fraction observed in ICC, the fermentation process
in this system lasted for 25 hours against 52 hours in SCR and 71 hours in the ICR
and resulted in an overall higher yield in ICC compared to both SCR and ICR
processes (Figure 3A). The ICC reduced fermentation time by 52% and 65%
compared to the SCR and ICR processes respectively (Table 1). Hydrogen yields were
0.288, 0.400 and 1.13 mol H2 mol-1 glucose for the SCR, ICR and ICC processes
respectively. This amounts to a 3.9 fold and 2.8 fold increase in the ICC compared to
the SCR and ICR processes respectively.
A combination of a high hydrogen fraction with the low cumulative hydrogen volumes
observed in the SCR and ICR processes could be indicative of hydrogen production
inhibition by high hydrogen partial pressure [6, 15]. A high hydrogen concentration
inhibits acetogenic bacteria that produce hydrogen [33]. The use of the cartridges
created a greater degree of turbulence, thus preventing supersaturation of hydrogen
gas in the liquid phase, therefore maintaining a low hydrogen partial pressure and
preventing its negative effect on hydrogen production [6]. Although all processes were
operated at the same mixing rate (180 rpm) the ICC process retained a greater mixing
efficiency. Doran [34] states that replacing Rushton turbines with larger diameter
turbines substantially reduces fluid compartmentalization and improves bulk mixing.

61
The modified Gompertz model kinetic coefficients are shown in Equations 5, 6 and 7
for SCR, ICR and ICC respectively
𝐻(𝑡) = 276 ∙ 𝑒𝑥𝑝 { −𝑒𝑥𝑝 [125∙ 𝑒
276(9,8 − t) + 1] } (5)
𝐻(𝑡) = 384 ∙ 𝑒𝑥𝑝 { −𝑒𝑥𝑝 [181∙ 𝑒
384(13,8 − t) + 1] } (6)
𝐻(𝑡) = 1532 ∙ 𝑒𝑥𝑝 { −𝑒𝑥𝑝 [248∙ 𝑒
1532(12,8 − t) + 1] } (7)
The regression curves gave coefficients of determination (r2) values of 0.99, hence the
models satisfactorily illustrated biohydrogen production for SCR, ICR and ICC
fermentations. Table 1 shows the P, Rm and λ values for the SCR, ICR and ICC
processes. The maximum hydrogen production rate (Rm) was 125, 181 and 248ml h-1
for the SCR, ICR and ICC processes respectively. This indicates that the ICC made a
98% improvement on the SCR process and a 37% improvement on the ICR process.
The lag time (λ) of the SCR processes was the shortest (9.8 h), as was expected, due
to the ease of availability of substrate to the cells. The ICC design was able to reduce
the lag time (λ) by one hour compared to the ICR process (12.8h and 13.8h
respectively), resulting from an improved mass transfer within the ICC. The hydrogen
production potential (P) of the SCR, ICR and ICC processes were 276, 384 and 1532
ml respectively, thus 5.6 and 4 folds improvements by the ICC batch fermentation
compared to SCR and ICR respectively. The lag time duration in dark fermentation
under mesophilic conditions using anaerobic sludge are reported in the range of
4.29 h and 69.3 h [35, 36]. Lag times may fluctuate depending on pre-fermentation
inoculum concentration, type and complexity of the substrate used. Short lag times do
not necessarily result in a high Rm and P values. Kargi et al. [35] observed an Rm
value of 1.53 ml h-1 and a P value of 98.1ml compared to Cakır et al. [36] with Rm and
P values of 1.38ml h-1 and 125ml. Nath et al. [37] used a pure culture of Enterobacter
cloacae DM11 and showed a P value of 927.64ml with a lag time of 2.05h and an Rm
value of 17.65 ml h-1. The maximum hydrogen production rate (Rm) and hydrogen
production potential (P) are influenced by the substrate concentration, inoculum type
and could vary depending on the favourability of the conditions within the reactor, i.e.
reactor pH, VFA accumulation and hydrogen partial pressure. Agitation and mass
transfer influence hydrogen production potential (P), maximum hydrogen production
rate (Rm) and lag time (λ). The physicochemical conditions of fermentation like, the

62
inoculum/substrate type, methods of pre-treatment, concentration and physical state
alongside constant pH and temperature conditions contribute to fluctuations in the P,
Rm and λ.
The exponential time of hydrogen production lasted 6 hours for the SCR and ICR
processes and 11 hours for the ICC process (Figure 3B). The rate of glucose
degradation was proportional to hydrogen production in all three fermentation process.
High glucose consumption rates were observed during the first 12 hours of
fermentation in SCR and ICR, and 18 hours for ICC. This corresponded to high and
stable production of hydrogen in these processes. Incomplete glucose degradation
was observed in the SCR and ICR processes as the hydrogen production ceased after
52 and 71 hours respectively and these processes were terminated (Figure 3C). ICC
process had a uniform rate of glucose consumption for the duration of fermentation,
reducing the glucose concentration to a residual value of 0.049 g L-1. A residual
glucose concentration of 2.3g L-1 was obtained for SCR and ICR processes at the end
of fermentation process unlike the ICC process mode. ICC process mode improved
the glucose consumption by 29% compared to SCR and ICR processes.
Fermentations were initiated at pH of 6.8, and a steeper decline of this value was
observed in SCR and ICR compared to ICC over time. The final pH of the effluents
were 4.35, 4.68 and 4.8 for the SCR, ICR and ICC processes respectively (Figure 3D).
Thus, pH change was 19 and 10% lower in ICC compared to SCR and ICR
respectively. This indicates that the ICC concept has buffering potential, which may
have contributed to the enhanced hydrogen production. Hu et al. [38] indicated that
the incomplete substrate degradation and consequent lower hydrogen yields may be
attributed to a decrease in pH from acids production.

63
Table 1: Percentage change and fold improvements of the immobilized cells in cartridge (ICC) processes compared to the
suspended cells in reactor (SCR) and immobilized cells in reactor (ICR) processes
Parameters Suspended
cells in
reactor
(SCR)
Immobilized
cells in
reactor
(ICR)
Immobilized
cells in
cartridge
(ICC)
% Change
of ICC to
Fold improvement
of ICC to
SCR ICR SCR ICR
Total Gas volume (ml) 1209 1359 8209,5 6,8 6,0
Max. H2 fraction (%) 42,93 46,92 30,30 -29 -35
H2 Volume (ml) 275,56 383,16 1402,21 5,1 3,7
Time (h) 52 71 25 -52 -65
HY (mol H2 mol-1 glucose) 0,288 0,4 1,13 3,9 2,8
Exponential H2 production phase (h) 6 6 11 83 83
Glucose degradation (g) 7,7 7,7 9,951 29 29
pH change 2,46 2,21 1,997 -19 -10
COD reduced (g L-1) 5,361 5,329 5,914 10 11
P (ml) _ H2 production potential 276 384 1532 5,6 4,0
Rm (ml h-1) _ max. H2 production rate 125 181 248 98 37
λ (h) _ lag phase time 9,8 13,8 12,8 31 -7
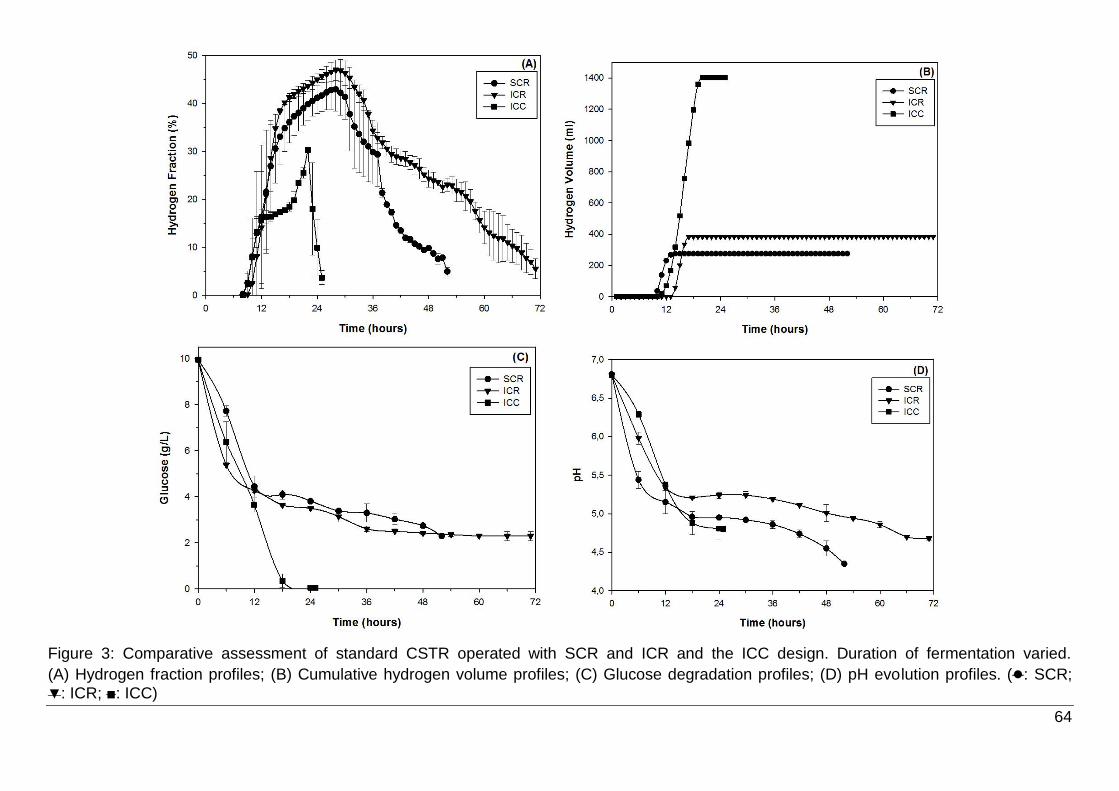
64
Figure 3: Comparative assessment of standard CSTR operated with SCR and ICR and the ICC design. Duration of fermentation varied.
(A) Hydrogen fraction profiles; (B) Cumulative hydrogen volume profiles; (C) Glucose degradation profiles; (D) pH evolution profiles. (●: SCR;
▼: ICR; ■: ICC)

65
3.3. Chemical oxygen demand (COD)
The chemical oxygen demand of the substrate was reduced in all the three
fermentations (Table 2). SCR, ICR and ICC fermentations reduced the COD of the
substrate by 5,36; 5,33 and 5,91 g L-1 respectively. The ICC process had reduced the
COD of the effluent by 10,3% and 11% more than the fermentation with SCR and ICR
respectively. COD reduction and hydrogen production have a proportional relationship
[38]. Bioreactor pH has an impact on COD reduction [38]. The wastewater and sludge
had a COD of 12,73 and 15,3 g L-1 respectively (Table 2).
Table 2: Chemical oxygen demand of the substrate and effluent of the SCR, ICR and
ICC processes, wastewater substrate and sludge and the COD reduction of the
respective fermentation runs.
Sample Chemical oxygen demand (COD) (g L-1)
Substrate Effluent Reduction
SCR 12,991 7,63 5,361
ICR 12,734 7,405 5,329
ICC 12,734 6,82 5,914
Wastewater substrate 12,734 12,734 -
Sludge 15,3 15,3 -
3.4. Electron microscopy (SEM) of sludge-alginate beads
The anaerobic sludge used in the fermentations showed the presence of various cocci
and rod shaped microorganisms (Figure 4), as well as non-microbial components.
Alginate beads from ICR and ICC process modes were observed. Beads from ICC
mode retained better structural integrity compared to ICR beads, which were
fractionated into various sizes. For the ICR processes, clusters of microbial cells were
present in the ruptured beads (Figure 5), though majority of the surface area revealed
the porous nature of the sodium alginate matrix. The beads from the ICC processes
had fused via a cream coloured film, acquiring the shape of the cartridge. The cream
coloured film showed a very dense population of rod shaped microorganisms
approximately 2 μm in length (Figure 6A). The surface of the ICC beads had a uniform
spread of varying microorganisms, ranging from small cocci, 1-2 μm in diameter, to
rod microorganisms, 2-3 μm in diameter, vibrio microorganisms, 3 μm in length can

66
also be seen (Figure 6B). Micro cracks found sporadically on the surface of some ICC
beads show the alginate cross links abundant in a rod shaped organisms, some of
them appear to be joined and may represent Diplobacillus or Streptobacillus
conformations (Figure 6C). A cross section of an ICC bead is shown in Figure 7D. In
this micrograph some rod shaped microorganisms appear to be amidst various steps
that occur in mitosis (Figure 6D). In light of this being an area that was completely
enclosed during fermentation, it may indicate improved mass transfer in the ICC
process to have cells appear to be in active stages of growth.
Figure 4: Anaerobic sludge prior to fermentation with rod shaped microorganisms
present at 10 000x

67
Figure 5: Sludge-alginate beads after ICR fermentation with microorganisms present
in fragmented beads at 5 000x
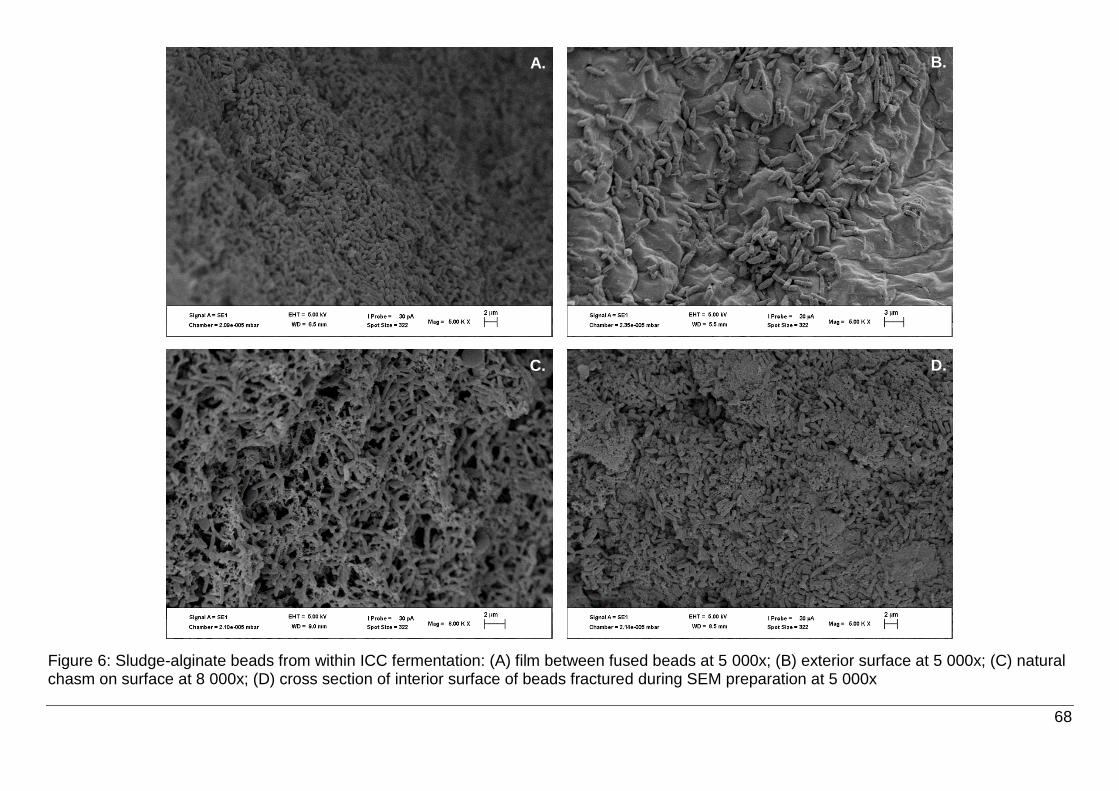
68
Figure 6: Sludge-alginate beads from within ICC fermentation: (A) film between fused beads at 5 000x; (B) exterior surface at 5 000x; (C) natural chasm on surface at 8 000x; (D) cross section of interior surface of beads fractured during SEM preparation at 5 000x
B.
C.
A. B.
C. D.

69
4. Conclusion
To address the challenges associated with the use of immobilized cells for
biohydrogen production in a CSTR, a novel reactor configuration was developed using
a cartridge system and comparatively assessed with the standard CSTR. The ICC
process improved hydrogen yield by 3.9 and 2.8 folds and reduced fermentation time
by 52 and 65% compared to the SCR and ICR process respectively. Kinetics studies
using the modified Gompertz model revealed that the ICC process had a 4 fold
increase in hydrogen production potential (P) compared to the ICR process. Complete
glucose degradation was observed in the ICC process, which showed a 29%
improvement compared to SRC and ICR processes. These findings indicate that the
developed ICC concept holds innovative proficiencies to improve fermentative
biohydrogen productivity, yield and process economics.
Acknowledgements
The financial assistance of the National Research Foundation (NRF)
(CPRR13091742710 and RSE14080184761) towards this research is hereby
acknowledged. Opinions expressed and conclusions arrived at are those of the
authors and are not necessarily to be attributed to the NRF.
5. References
[1] K. Nath, D. Das, Improvement of fermentative hydrogen production: various
approaches, Appl Microbiol Biotechnol. 65 (2004) 520-529.
[2] L. Schlapbach, A. Zuttle, Hydrogen – storage materials for mobile applications,
Nature, 414 (2001) 353-358.
[3] P.C. Hallenbeck, D. Ghosh, Advances in fermentative biohydrogen production: the
way forward, Trends Biotechnol 27 (5) (2009) 287-297.
[4] K. Chandrasekhar, Y.J. Le, D.W. Lee, Biohydrogen production: strategies to
improve process efficiency through microbial routes, Int. J. Mol. Sci. 16 (4) (2015)
8266-8293.
[5] G. Kumar, P. Sivagurunathan, A. Pugazhendhi, N.B.D. Thi, G. Zhen, K.
Chandrasekhar, A. Kadier, A comprehensive overview on light independent
fermentative hydrogen production from wastewater feedstock and possible
integrative options, Energy Convers. Manag. 141 (2017) 390-402.
70
[6] K.W. Jung, D.H. Kim, S.H. Kim, H.S. Shin, Bioreactor design for continuous dark
fermentative hydrogen production, Bioresour. Technol. 102(18) (2011) 8612-8620.
[7] S.C.S. Martins, C.M. Martins, L.M.C.G. Fiúza, S.T. Santaella, Immobilization of
microbial cells: A promising tool for treatment of toxic pollutants in industrial
wastewater, Afr. J. Biotecnol. 12 (2013) 4412-4418.
[8] J. Ding, X. Wang, X.F. Zhou, N.Q. Ren, W.Q. Guo, CFD optimization of continuous
stirred-tank (CSTR) reactor for biohydrogen production. Bioresour. Technol. 101
(2010) 7005-7013.
[9] V.M.C. Blanco, L.T. Fuess, M. Zaiat, Calcium dosing for the simultaneous control
of biomass retention and the enhancement of fermentative biohydrogen production
in an innovative fixed film bioreactor, Int. J. Hydrog. Energy. 42 (17) (2017) 12181-
12196.
[10] D.G. Najafpour, Bioreactor design, in: D.G. Najafpour (Eds.), Biochemical
engineering and biotechnology, Elsevier, Amsterdam, 2007, pp. 142-169.
[11] C.Y. Chu, Z.D. Hastuti, E.L. Dewi, W.W. Purwanto, U. Priyanto, Enhancing
strategy on renewable hydrogen production in a continuous bioreactor with packed
biofilter from sugery wastewater, Int. J. Hydrog. Energy. 41(7) (2016) 4404-4412.
[12] Z.P. Zhang, K.Y. Show, J.H. Tay, D.T. Liang, D.J. Lee, W.J. Jiang, Effect of
hydraulic retention time on biohydrogen production and microbial community,
Process biochem. 41 (2006) 2118-2123.
[13] A.H. Salem, T. Mietzel, R. Brunstermann, R. Widmann, Effect of cell
immobilization, hematitie nanaoparticles and formation of hydrogen producing
granules on biohydrogen production from sucrose wastewater, Int. J. Hydrog.
Energy. 42(40) (2017) 25225-25233.
[14] P.C. Hallenbeck, Fermentative hydrogen production: Principles, progress and
prognosis, Int. J. Hydrog. Energy. 34 (2009) 7379-7389.
[15] K.Y. Show, D.J. Lee, J.S. Chang, Bioreactor and process design for biohydrogen
production, Bioresour. Technol. 102 (2011) 8524-8533.
[16] X.M. Guo, E. Trably, E. Latrille, H. Carrère, J.P. Steyer, Hydrogen production from
agricultural waste by dark fermentation: a review. Int. J. Hydrog. Energy. 35 (2010)
10660-10673.
[17] Y. Zhu, Immobilized cell fermentation for production of chemicals and fuels, in:
S.T. Yang (Ed.), Bioprocessing for value-added products from renewable sources,
Elsevier, 2007, pp. 373-396.

71
[18] G. Kumar, A. Mudhoo, P. Sivagurunathan, D. Nagarajan, A. Ghimire, C.H. Lay,
C.Y. Lin, D.J. Lee, J.S. Chang, Recent insights into the cell immobilization
technology applied for dark fermentative hydrogen production, Bioresour. Technol.
219 (2016) 725-737.
[19] N. Kumar, D. Das, Electron microscopy of hydrogen producing immobilized E.
cloacae IIT-BT 08 on natural polymers, Int. J. Hydrog. Energy. 26 (11) (2001)
1155– 1163.
[20] J. Akinbomi, R. Wikandari, M. Taherzadeh, Enhanced fermentative hydrogen and
methane production from an inhibitory fruit-flavored medium with membrane-
encapsulated cells, Membranes 5 (4) (2015) 616-631.
[21] L. Zhao, G.L. Cao, A.J. Wang, W.Q. Guo, B.F. Liu, H.Y. Ren, N.Q. Ren, F. Ma,
Enhanced bio-hydrogen production by immobilized Clostridium sp. T2 on a new
biological carrier, Int. J. Hydrog. Energy, 37(1) (2012) 162-166.
[22] J.H. Jo, D.S. Lee, D. Park, J.M. Park, Biological hydrogen production by
immobilized cells of Clostridium tyrobutyricum JM1 isolated from a food waste
treatment process, Bioresour. Technol. 99 (14) (2008) 6666–6672.
[23] S.Y. Wu, C.N. Lin, J.S. Chang, Hydrogen production with immobilized sewage
sludge in three-phase fluidized-bed bioreactors. Biotechnol. Prog. 19 (3) (2003)
828–832.
[24] K.S. Lee, J.F. Wu, Y.S. Lo, Y.C. Lo, P.J. Lin, J.S. Chang, Anaerobic hydrogen
production with an efficient carrier-induced granular sludge bed bioreactor,
Biotechnol. Bioeng. 87(5) (2004) 648-657.
[25] V. Thakur, S.K. Jadhav, K.L. Tiwari, Optimization of different parameters for
biohydrogen production by Klebsiella oxytoca ATCC 13182, Trends Appl. Sci. Res.
9(5) (2014) 229-237.
[26] T.A. Ngo, H.T.V. Bui, Biohydrogen production using immobilized cells of
hyperthermophillic Eubacterium Thermotoga neapolitana on porous glass beads,
J. Technol. Innov. Renew. Energy. 2 (2013) 231-238.
[27] K.J. Wu, J.S. Chang, F.C. Chang, Biohydrogen production using suspended and
immobilized mixed microflora, J Chin. Inst. Chem. Engrs. 37(6) (2006) 545-550.
[28] M. A. Basile, C. Carfagna, P. Cerruti, G. G. d`Ayala, A. Fontana, A. Gambacorta,
M. Malinconico, L. Dipasquale, Continuous hydrogen production by immobilized
cultures of Thermotoga neapolitana on an acrylic hydrogel with pH-buffering
properties, RSC Adv. 2 (2012) 3611-3614.

72
[29] M.B.H. Khan, E.B. Gueguim Kana, Design, implementation and assessment of a
novel bioreactor for fermentative biohydrogen process development, Int. J. Hydrog.
Energy. 41 (2016) 10136-10144.
[30] E.B. Gueguim Kana, S. Schmidt, R.H. Azanfack Kenfack, A web-enabled software
for real-time biogas fermentation monitoring–Assessment of dark fermentations for
correlations between medium conductivity and biohydrogen evolution, Int. J.
Hydrog. Energy. 38(25) (2013) 10235-10244.
[31] Atlas Steels, Stainless Steel Grade Data sheets, Atlas Steels Technical
Department, Melbourne, Australia. (2013). Article can be found online:
http://www.atlassteels.com.au/documents/Atlas%20Grade%20datasheet%20-
%20all%20datasheets%20rev%20Aug%202013.pdf Article accessed on:
03/02/2019
[32] M. Waligórska, Fermentative hydrogen production - process design and
bioreactors, Chem. Process Eng. 33 (4) (2012) 585-594.
[33] K.L. Kovács, N. Ács, E. Kovács, R. Wirth, G. Rákhely, O. Strang, Z. Herbel, Z.
Bagi, Improvement of biogas production by bioaugmentation, BioMed Res. Int.
2013 (2013) 7 pages, Article ID 482653, http://dx.doi.org/10.1155/2013/482653.
[34] P.M. Doran, Chapter 8 – mixing, in: P.M. Doran (Ed), Bioprocess Engineering
Principles 2nd edition, Academic Press, 2013, pp. 255-332.
[35] F. Kargi, N.S. Eren, S. Ozmihci, Bio-hydrogen production from cheese whey
powder (CWP) solution: Comparison of thermophilic and mesophilic dark
fermentations, Int. J. Hydrog. Energy. 37 (2012) 8338-8342.
[36] A. Cakir, S. Ozmihci, F. Kargi, Comparison of bio-hydrogen production from
hydrolysed wheat starch by mesophilic and thermophilic dark fermentation, Int. J.
Hydrog. Energy. 35 (2010) 13214-13218.
[37] K. Nath, M. Muthukumar, A. Kumar, D. Das, Kinetics of two-stage fermentation
process for the production of hydrogen, Int. J. Hydrog. Energy. 33 (2008) 1195-
1203.
[38] Hu J, Yang H, Wang X, Cao W, Guo L. Strong pH dependence of hydrogen
production from glucose by Rhodobacter sphaeroides. Int. J. Hydrog. Energy.
2020;45(16):9451-9458.

73
Chapter 5
Conclusions and recommendations for further research
Conclusions and implications
This study designed, implemented a novel bioreactor configuration. This novel reactor
was assessed on various fermentative biohydrogen production processes. Based on
the findings, the following conclusions were drawn:
5.1.1. The novel 2L lab scale bioreactor was comparatively assessed with an
equal volume shake flask reactor. Dark fermentation process with
immobilized cells using the novel 2L lab scale bioreactor showed a
reduced lag time of 58%, and an increased biohydrogen volume of 74%
compared to the shake flask reactor. The novel reactor configuration
showed a substantial improvement in hydrogen production.
5.1.2. The 13L novel bioreactor was compared with the standard CSTR under
different fermentation modes. The standard CTSR was operated with
suspended cells (SCR) and immobilized cells (ICR) and the novel reactor
used immobilized cells (ICC). ICC showed a 5,1 fold improvement in the
hydrogen volume, a 52% reduction in the total process time and a 3,9 fold
increase in the hydrogen yield compared to SCR. In comparison with ICR,
ICC showed a 3,7 fold increase in the hydrogen volume, a 65% reduction
in the total process time and a 2.8 fold increase in the hydrogen yield.
5.1.3. ICC showed marked improvements in biohydrogen production
compared to SCR and ICR. The study demonstrated that the cartridge
concept was capable of improving hydrogen production with immobilized
cells.
74
Recommendations for future studies
5.2.1. Further comparisons with the newly designed reactor and other
configurations will provide insights into optimal bioreactor configuration to
maximize hydrogen production.
5.2.2. Operating the novel reactor configuration using fed-batch or continuous
modes would provide insights about the effect of hydraulic retention time
on biomass retention and hydrogen yield. Additionally, the data achieved
can be compared to existing configurations.
5.2.3. Computational fluid dynamics (CFD) analysis on the novel bioreactor
configurations would enhance the understanding of these reactor
configurations in regards to mass transfer, gas-liquid transfer, sheer stress
and heat transfer as well the impact on cell physiology. Additionally CFD
is typically done to study the dynamic behaviour of stirred systems with
diverse impeller conformations.
5.2.4. Applying the novel reactor configuration in other areas of biotechnology
to investigate the efficiency of the designed reactor on other fermentation
processes that require biomass retention.
5.2.5. Advanced studies on this novel bioreactor configuration can be
undertaken to enhance biomethane and other biofuels production on a
large range of organic waste substrates.