Embed Size (px)
Citation preview

TECHNICAL NOTE
ANTHROPOLOGY
Marta R. P. Flores,1 M.Sc.; Carlos E. P. Machado,2 Ph.D.; Matteo D. Gallidabino ,3 Ph.D.;Gustavo H. M. de Arruda,4 Ph.D.; Ricardo H. A. da Silva,5 Ph.D.; Fl�avio B. de Vidal,6 Ph.D.; andRodolfo F. H. Melani,1 Ph.D.
Comparative Assessment of a NovelPhoto-Anthropometric Landmark-PositioningApproach for the Analysis of Facial Structureson Two-Dimensional Images*
ABSTRACT: Positioning landmarks in facial photo-anthropometry (FPA) applications remains today a highly variable procedure, as tradi-tional cephalometric definitions are used as guidelines. Herein, a novel landmark-positioning approach, specifically adapted for FPA applica-tions, is introduced and, in particular, assessed against the conventional cephalometric definitions for the analysis of 16 landmarks on tenfrontal images by two groups of examiners (with and without professional knowledge of anatomy). Results showed that positioning repro-ducibility was significantly better using the novel method. Indeed, in contrast to the classic approach, very low landmark dispersions wereobserved for both groups of examiners, which were usually below the strictest clinical standards (i.e., 0.575 mm). Furthermore, the comparisonbetween the two groups of examiners highlighted higher dispersion consistencies, which supported a higher robustness. Thus, the use of anadapted landmark-positioning approach proved to be highly advantageous in FPA analysis and future work in this field should consideradopting similar methodologies.
KEYWORDS: forensic science, facial analysis, anthropometry, cephalometry, facial identification, facial image
Facial photo-anthropometry (FPA) is the sub-field of physicalanthropology that deals with the systematic study and measure-ment of human facial traits from two-dimensional images (1–3).
Since facial measurements have been correlated with severalindividual characteristics, FPA has found large applications in anumber of scientific fields in which the analysis of faces ontwo-dimensional images is of interest (1,3,4). In legal medicineand forensic science, in particular, different studies reported thepossibility of using FPA to estimate the age of individuals (5–7),to predict their sex or ancestry (8,9), to simulate facial growth orage progression (7,10), as well as to support human identifica-tion by comparing captured facial images to reference ones, thatis, forensic facial identification (FFI) (1,11,12).The first step in every FPA application involves the placement
of a number of reference points (i.e., landmarks) on the facialimages of the analyzed individuals, which is a process convention-ally performed by following definitions used in classic facialanthropometry (or, as it is also called, cephalometry) (1,3,13). Tra-ditional cephalometric definitions, however, merely describe a ser-ies of purely anatomical structures lying on the skin surface and/orthe underlying bones and were primarily established for the pur-pose of directly mapping actual living subjects or their lateral-viewX-ray image for medical purposes (14–16). Consequently, theiradoption in FPA applications usually leads to a high positioningvariability within and between examiners (17–22). The main rea-son for this arises from the fact that different examiners may havedifferent interpretations of where a specific cephalometric land-mark should be placed on a two-dimensional, frontal view, facialimage, without any three-dimensional reference and/or the possi-bility to touch the subject’s actual facial surface. As a result of this,the general reliability of FPA has been recently challenged by the
1Social Department of the Dentistry College, University of Sao Paulo,Avenida Professor Lineu Prestes 2227, Sao Paulo 05508-000, Brazil.
2Brazilian Federal Police, National Institute of Criminalistics, INCBuilding, Bras�ılia 70610-200, Brazil.
3Centre for Forensic Science, Department of Applied Sciences, Faculty ofHealth and Life Sciences, Northumbria University, Ellison Building,Newcastle Upon Tyne, NE1 8ST, U.K..
4Brazilian Federal Police, Technical and Scientific Sector, Rua AnnitaLuiza Mello Di Lascio, Cabedelo 58101-770, Brazil.
5Department of Stomatology, Public Health and Forensic Odontology,Dentistry College of Ribeirao Preto, University of Sao Paulo, Avenida doCaf�e, Ribeirao Preto 14040-904, Brazil.
6Department of Computer Science, University of Brasilia, Darcy RibeiroCampus, Asa Norte, Brasilia 70910-900, Brazil.
Corresponding author: Marta R. P. Flores, M.Sc. E-mail: [email protected]
*Presented at the 21st Triennial Meeting of the International Associationof Forensic Sciences (IAFS), August 21 - 25, 2017, in Toronto, Ontario,Canada; and at the 8th European Academy of Forensic Science (EAFS),August 27–31, 2018 in Lyon, France.
Funded and supported by the Ministry of Education, Higher EducationPersonnel Improvement Coordination (CAPES), Brazil (grant number: 25/2014 – Pro-Forenses).
This research was approved by the Research Ethics Committee of theMedical School of Ribeir~ao Preto, University of S~ao Paulo (protocol number17902713.7.0000.5419).
Received 6 Aug. 2018; and in revised form 12 Sept. 2018, 2 Oct. 2018;accepted 3 Oct. 2018.
828 © 2018 American Academy of Forensic Sciences
J Forensic Sci, May 2019, Vol. 64, No. 3doi: 10.1111/1556-4029.13935
Available online at: onlinelibrary.wiley.com
scientific community (17–19,23). One significant aftermath, inparticular, has been the recommendation from the Facial Identifi-cation Scientific Working Group (FISWG) to avoid using FPA-based methodologies as proof of evidence in FFI (21).Even if it is acknowledged that the application of FPA-based
methodologies may be difficult and inadequate in a number ofsituations, such as those involving low resolution and/or non-frontal facial images, in several others it is not and may actuallybe beneficial. This is the case, for example, in those situationswhere images are acquired under sufficiently standardized condi-tions, such as in the detection of identity document fraud or ageestimation from portrait images (17,20,23,24). To guaranteehighly reliable results, however, a high reproducibility in land-mark location is still essential and improvements would thereforebe necessary (22,23,25). In particular, it is advised that the afore-mentioned reproducibility issues may be reduced through the useof proper landmark descriptions and/or locating procedures opti-mized for FPA applications, which thus take into account thespecific problems encountered when positioning landmarks ontwo-dimensional facial images.Despite the numerous works in FPA, however, none have previ-
ously proposed this kind of adapted protocol, leaving a gap in thespecialized literature. Recently, a novel FPA-specific landmarkapproach was suggested by Flores et al. (28). In addition to a com-plete series of descriptions for landmarks based on visual refer-ences, the work also included optimized operational procedures andillustrations to locate each landmark of interest on two-dimensionalimages. These are intended to better assist examiners in FPA analy-sis and thus improve both the reproducibility and robustness of thelandmark placement procedure. The approach has nonetheless neverbeen assessed. Consequently, the current work aimed to undertakethis and, in particular, to evaluate the improvement in reliabilityfrom using this adapted approach (hereafter, AdMet) over the clas-sic, cephalometry-based one (hereafter, ClMet).In order to achieve these aims, the two approaches were
applied to a set of ten frontal view facial images and variabilityof the placement of specific landmarks between different exam-iners (i.e., reproducibility) investigated through their spatial dis-persions around the grand means. Two groups of examiners,composed of individuals with and without specific knowledge ofanatomy, respectively, took part in the experiment. This wasdone in order to assess the robustness of the approaches withrespect to the experience level of the examiner. Observed land-mark dispersions were finally compared to clinical standards cur-rently accepted in cephalometry, by converting pixel-basedvalues to millimeters through iris ratio calibration (7,26,27). Toour knowledge, this is the first time that the adapted, FPA-opti-mized landmark-positioning previously reported by Flores et al.(28) has been evaluated in published literature. It is also the firsttime that a comparative study between different landmark-posi-tioning approaches for FPA analysis has been carried out, aswell as that their relative reliabilities have been investigated andvalidated against previously reported clinical standards.
Materials and Methods
Reference Facial Images
Ten frontal view facial images (from five male and five femalesubjects) were randomly selected from a larger database com-posed of 500 Brazilian frontal view images. For capture, subjectswere asked to adopt a neutral facial expression and their faceswere aligned with the Frankfurt plane. All the two-dimensional
images were acquired using a Geometrix FaceVision� FV802Series Biometric Camera (ALIVE Tech, Cumming, GA), with nointerchangeable lenses, and positioned at 1.2 m from the individ-ual’s face, at a resolution of 1200 9 1600 pixels.
FPA Analysis
Two groups of examiners were selected. The first group,named experts group (EG), was composed of five examinerswith specific knowledge of anatomy (master or doctoral studentsin medical or dental areas), as well as previous experience inanthropometry and/or cephalometry. The second group, namednon-experts group (NG), was composed of five examiners withhigher education in scientific fields out of medical sciences, withneither training or specific knowledge of anatomy nor previousexperience in anthropometry and/or cephalometry.Both groups were asked to map the previously selected facial
images according to two different landmark-positioningapproaches: a classic method (ClMet) and a newly developedadapted method (AdMet). Generally, the mapping involved plac-ing 16 specific landmarks on facial images, 8 odd (medians),and 8 even (laterals), as shown in Fig. 1. For ClMet, examinerswere provided with a list of definitions for the 16 landmarks,previously compiled from a set of particularly influential worksin craniofacial anthropometry (29–31) (Table 1). For AdMet,examiners were provided with the respective definitions andoperational marking procedures obtained from the work ofFlores et al. (28). This approach has been translated into a man-ual that is publicly available at http://facisgroup.org/facial_landmarks and included in Appendix S1.The AdMet approach provides the examiner with clearer refer-
ence points that explicitly mention visible facial features insteadof being solely based on anatomical structures. Furthermore, eachdescribed facial landmark includes a brief operational procedureand graphical illustrations, intended to better support locating iton images. The difference between ClMet and AdMet can easilybe highlighted through an example. The ectocanthion landmark isconventionally defined as: “the lateral corner (angle) of the eye”(29–31). The newly adapted approach (28), on the contrary,reports the following definition: “The most lateral landmark inthe corner of the eye (distant from the midline), where the upperand lower ciliary implantation lines meet” (p. 07). The followingpositioning procedure is also provided: “Move the vertical linefrom lateral to medial side of the face to the landmark where theupper and lower ciliary lines meet in the region of lateral angleof the eye. Then, move the horizontal line until the point of con-vergence of those lines. Mark ectocanthion in the intersectionregion between the two auxiliary lines” (p. 07). See Fig. 2 for anillustration of the corresponding page of the manual (SI). Themanual describes a total of 36 landmarks. For the sake of com-parison, however, only the 16 for which cephalometric definitionscould be applied were selected in this work.The FPA analyses with the two different landmark-positioning
approaches were carried out by the same participants, with amonth interval in between (starting from ClMet), in order to mini-mize memory effects on landmark placement. For each approach,examiners were asked to analyze the same 10 facial images in trip-licate, again with a week interval in between. For mapping, a non-commercial software package for two-dimensional facial analysiswas used, that is, SAFF-2D� (Forensic Facial Analysis System,Department of Federal Police, Brazil). The software allows exam-iners to locate the facial landmarks on images and to automaticallyregister them through Cartesian coordinates (X, Y).
FLORES ET AL. . ASSESSMENT OF PHOTO-ANTHROPOMETRIC APPROACHES 829

Data Treatment
Initially, for each replicate experiment, average coordinates forall 16 landmarks were calculated for the three analyses. Then,differences (in pixels, px) on both the horizontal and verticalaxes were determined between these average coordinates and thegrand between-faces means. Location dispersions were definedas the mean differences on the horizontal axis (DX) and meandifferences on the vertical axis (DY). The arithmetic meanbetween these two values, that is, the mean dispersion (DMXY),was also determined as summary statistics (17).Values for DX, DY, and DMXY were then converted into an
actual physical scale (i.e., from px to mm) by applying a scal-ing factor of 4.35 px/mm, in order to allow comparison ofobserved dispersions with previously published clinical stan-dards. This scaling factor was previously determined by sizecomparison of a reference anatomical structure measured fromimages and real persons. The iris diameter was used for thispurpose, as it has previously been proved to be an adequatereference for facial image calibration (7,26,27). Considering thatthe average iris diameter in images was calculated to be around50 pixels and that the maximum population value of the hori-zontal visible iris diameter (HVID) is described in specific liter-ature as around 11.5 mm (32–34), a ratio of 4.35 px/mm wasdetermined. Converted dispersions were referred to as “esti-mated real dispersions” (ERD), that is, ERDX, ERDY, andERDMXY (17).
Results Assessment
The normality of the data was initially assessed by theShapiro-Wilk test and the intra-examiner marking reliability bythe intra-class correlation coefficient (ICC). Analysis of variancewas applied to assess any significant differences between the dis-persion values resulting from the tested factors (i.e., the expertgroups and FPA protocols). This was performed using marginallinear regressions with a gamma distribution for the errors.Results of all these statistical analyses were assessed against astatistical significance level of 5% (a = 0.05).For clinical validation, ERD values were compared against
reference thresholds previously reported in the literature. In thisrespect, values smaller than 0.575 mm were considered ideal,based on the most strict references in cephalometry (13) (meanbetween 0.59 mm and 0.56 mm), while values between 0.575and 1 mm were considered acceptable (14,25,35–38). ERDvalues >1 mm were considered undesirable.
Results
General Statistical Analysis
Firstly, the normality of the data was assessed. The Sha-piro-Wilk test indicated that the data were not normally dis-tributed and, thus, a non-parametric statistical analysis wassubsequently conducted. The ICC test results showed that the
FIG. 1––Facial diagram representing the 16 landmarks used (left) and their nomenclature (right). Letter R corresponds to the right side and L to the leftside.
830 JOURNAL OF FORENSIC SCIENCES

intra-examiner scores were reliable (ICC > 0.75) for both EGand NG (i.e., the groups of expert and non-expert examiners,respectively) using both tested FPA approaches, that is, ClMetand AdMet.
Application of ClMet
Location dispersions for the 16 landmarks were calculated forboth positioning approaches and were reported in Table 2
TABLE 1––List of the 16 investigated facial landmarks, with the corresponding sets of adopted cephalometric and facial photo-anthropometric (FPA) descrip-tions (used in the ClMet and AdMet landmark-positioning approaches, respectively). Cephalometric descriptions were compiled from those reported by George(29), Kolar and Salter (30), and Zimbler and Ham (31). FPA-specific descriptions were extracted from the FPA manual provided in the Appendix S1 and the
corresponding pages are reported in the table
# Landmark Abbr. Cephalometric Description (ClMet)FPA Description
(AdMet)
1 Ectocanthion Ec The lateral corner (angle) of the eye. Pg. 072 Endocanthion En The medial angle of the eye. Medial corner of the eye where the eyelids meet, not in the
caruncles (reddish eminence in the medial region of the eye).Pg. 10
3 Iridion laterale Il The most lateral point of the iris rim. Pg. 134 Iridion mediale Im The most medial point of the iris rim. Pg. 145 Glabella G The most prominent region in the midsagittal plane between supraorbital arches. Pg. 656 Nasion N Median point at the nasal root (apex of the frontonasal angle). Pg. 667 Subnasal Sn Midpoint of the base of the columella, underneath the nasal spine. Pg. 338 Alare Al The most lateral point of the nose wing. The most lateral point of the curvature of the nasal wing. Pg. 359 Chelion Ch The corner of the mouth. The region of encounter of upper and lower lip vermilion border. Pg. 4210 Labiale superius Ls The midpoint (at the midsagittal plane) of the upper lip vermilion border. Pg. 4011 Stomion Sto The encounter of upper and lower lip at the midsagittal plane when lips are naturally closed. Pg. 4612 Labiale inferius Li The midpoint (at the midsagittal plane) of the lower lip vermilion border. Pg. 4713 Labiomentale Lm Point of greatest depression between the lower lip and the menton (at the mentolabial sulcus). Pg. 4814 Gnathion Gn The lowest point of menton edge, at the midsagittal plane. Pg. 4915 Gonion Go The most lateral point of the mandible angle. The widest point of the mandible. Pg. 5016 Zygion Zy The most lateral point (greater width) of the zygomatic bone (cheek). Pg. 52
FIG. 2––Example description for the Ectocanthion landmark taken from the facial photo-anthropometric (FPA) manual used in this work for the adaptedpositioning approach (AdMet) and provided in the Appendix S1. [Color figure can be viewed at wileyonlinelibrary.com]
FLORES ET AL. . ASSESSMENT OF PHOTO-ANTHROPOMETRIC APPROACHES 831

(values in px, i.e., Dx, Dy, and DMXY), and Table 3 (values con-verted in mm, i.e., ERDx, ERDy, and ERDMXY). A graphicalcomparison of DMXY and the analysis of effects are furthermoredisplayed in Figs 3 and 4, respectively.Using ClMet, the two groups of examiners performed the
landmark-positionings very differently, with EG showing signifi-cantly better results than NG. In fact, the mean DMXY valueswere 3.244 px (0.746 mm) and 9.160 px (2.106 mm) for NGand EG, respectively, which corresponds to a difference >2.8times. The highest DMXY for NG (i.e., 39.221 px or 9.016 mm
for G) was almost 4 times larger than the highest DMXY for EG(i.e., 10.517 px or 2.418 mm for Go). Furthermore, 12 of the 16landmarks (Al, Ch, En, G, Gn, Go, Il, Im, Li, N, Sn, and Zy)were significantly more dispersed for NG than for EG. Conse-quently, positioning performances with ClMet were proved to bestrongly dependent on the previous anatomical knowledge and/orexperience of the examiners, with more experienced examinersproviding significantly more reproducible results.More generally, Go, G, Zy, and N showed the largest disper-
sions in both groups of examiners and were thus the most
TABLE 2––Summary dispersion statistics (in px) for the 16 investigated landmarks according to the group of examiners (EG vs. NG) and the appliedlandmark-positioning approach (ClMet vs. AdMet)
Landmark D
ClMet AdMet
EG NG EG NG
Mean SD Rank Mean SD Rank Mean SD Rank Mean SD Rank
Al DX 0.812 0.731 14 1.057 0.871 16 0.548 0.440 14 0.681 0.602 14DY 2.411 1.859 7 3.502 2.722 8 1.440 1.161 7 1.588 1.530 7DMXY 1.609 1.027 9 2.281 1.534 13 1.031 0.651 12 1.126 0.847 11
Ch DX 1.842 1.455 8 4.590 4.017 5 3.182 2.238 1 2.313 1.946 1DY 0.637 0.536 16 1.056 0.831 15 1.018 0.842 11 0.678 0.588 14DMXY 1.239 0.812 11 2.832 2.113 10 2.102 1.255 3 1.521 1.031 5
Ec DX 3.858 2.433 2 4.166 2.676 6 2.088 1.784 3 2.041 1.587 3DY 1.321 0.938 9 1.678 1.217 13 1.340 1.017 8 1.887 1.611 4DMXY 2.593 1.422 7 2.922 1.503 9 1.721 1.128 6 1.966 1.212 3
En DX 1.304 1.061 12 2.286 1.930 12 1.366 1.304 8 1.790 1.621 4DY 0.860 0.704 14 1.144 0.855 14 1.024 0.773 10 1.069 1.037 9DMXY 1.077 0.688 14 1.723 1.222 15 1.202 0.826 11 1.426 1.207 7
G DX 2.839 2.492 3 2.718 1.856 10 1.267 1.077 9 0.762 0.806 12DY 14.423 8.488 2 75.721 18.755 1 1.921 1.521 4 2.033 1.887 3DMXY 8.632 4.751 2 39.221 9.611 1 1.600 1.028 8 1.385 1.061 8
Gn DX 2.066 1.570 5 3.133 2.202 8 2.214 2.170 2 1.111 1.780 9DY 1.087 0.847 11 2.431 2.911 11 1.477 2.512 6 1.750 2.377 5DMXY 1.579 0.930 10 2.758 1.777 11 1.853 1.611 5 1.453 1.437 6
Go DX 6.403 4.526 1 7.970 5.682 4 1.018 1.030 13 0.721 0.555 13DY 14.650 11.382 1 20.869 14.567 4 0.820 0.693 14 0.856 0.627 13DMXY 10.517 7.804 1 14.417 9.877 4 0.917 0.646 14 0.775 0.479 13
Il DX 0.617 0.543 16 10.543 8.670 2 0.491 0.381 15 0.522 0.441 15DY 1.059 0.782 12 2.674 3.732 10 0.982 0.770 12 1.051 0.943 10DMXY 0.838 0.480 16 6.606 4.579 5 0.727 0.433 15 0.771 0.564 14
Im DX 0.804 1.672 15 8.427 6.073 3 0.449 0.371 16 0.460 0.317 16DY 1.210 1.631 10 1.739 1.363 12 0.946 0.813 13 0.968 0.866 12DMXY 1.032 1.586 15 5.093 3.013 6 0.702 0.458 16 0.703 0.455 15
Li DX 1.722 1.289 9 2.330 1.820 11 1.730 1.366 5 1.040 1.122 10DY 1.527 1.414 8 7.676 6.637 5 1.627 1.624 5 1.342 1.226 8DMXY 1.627 0.991 8 5.011 3.403 7 1.681 1.077 7 1.185 0.789 9
Lm DX 1.952 1.728 6 3.069 2.179 9 1.766 1.232 4 1.155 1.304 7DY 6.465 5.030 5 5.548 4.252 6 3.864 4.845 2 5.568 9.725 2DMXY 4.208 2.692 5 4.313 2.423 8 2.816 2.563 2 3.371 4.828 2
Ls DX 1.579 1.111 11 1.430 1.126 14 1.268 0.923 10 1.221 0.951 6DY 4.111 3.614 6 3.524 3.140 7 2.688 2.414 3 1.047 0.830 11DMXY 2.838 2.017 6 2.478 1.588 12 1.982 1.376 4 1.131 0.673 10
N DX 1.876 1.322 7 3.141 2.363 7 1.220 1.070 11 0.786 0.792 11DY 7.542 6.868 4 58.842 50.286 2 0.709 0.583 16 0.615 0.660 15DMXY 4.706 3.603 4 30.989 25.664 2 0.955 0.555 13 0.729 0.512 16
Sn DX 1.209 0.930 13 1.210 0.851 15 1.611 1.210 7 1.380 1.285 5DY 0.976 0.848 13 2.943 4.945 9 1.245 1.121 9 1.742 1.559 6DMXY 1.101 0.662 13 2.067 2.504 14 1.416 0.857 9 1.555 1.033 4
Sto DX 1.640 1.211 10 1.869 1.548 13 1.727 1.280 6 1.133 1.137 8DY 0.711 0.683 15 0.981 0.931 16 0.710 0.466 15 0.611 0.488 16DMXY 1.185 0.727 12 1.428 0.890 16 1.218 0.702 10 0.866 0.676 12
Zy DX 2.588 2.072 4 23.311 13.214 1 1.061 0.832 12 2.094 2.065 2DY 11.656 8.201 3 21.532 13.007 3 6.833 6.023 1 14.122 12.127 1DMXY 7.117 4.327 3 22.423 10.628 3 3.939 3.051 1 8.104 6.666 1
Global DX 2.069 - - 5.078 - - 1.438 - - 1.201 - -DY 4.415 - - 13.241 - - 1.790 - - 2.308 - -DMXY 3.244 - - 9.160 - - 1.616 - - 1.754 - -
D, dispersion statistics; SD, standard deviation.
832 JOURNAL OF FORENSIC SCIENCES
difficult landmarks to positioning. On the contrary, En, Sn, andSto were generally within the five least dispersed landmarksoverall.
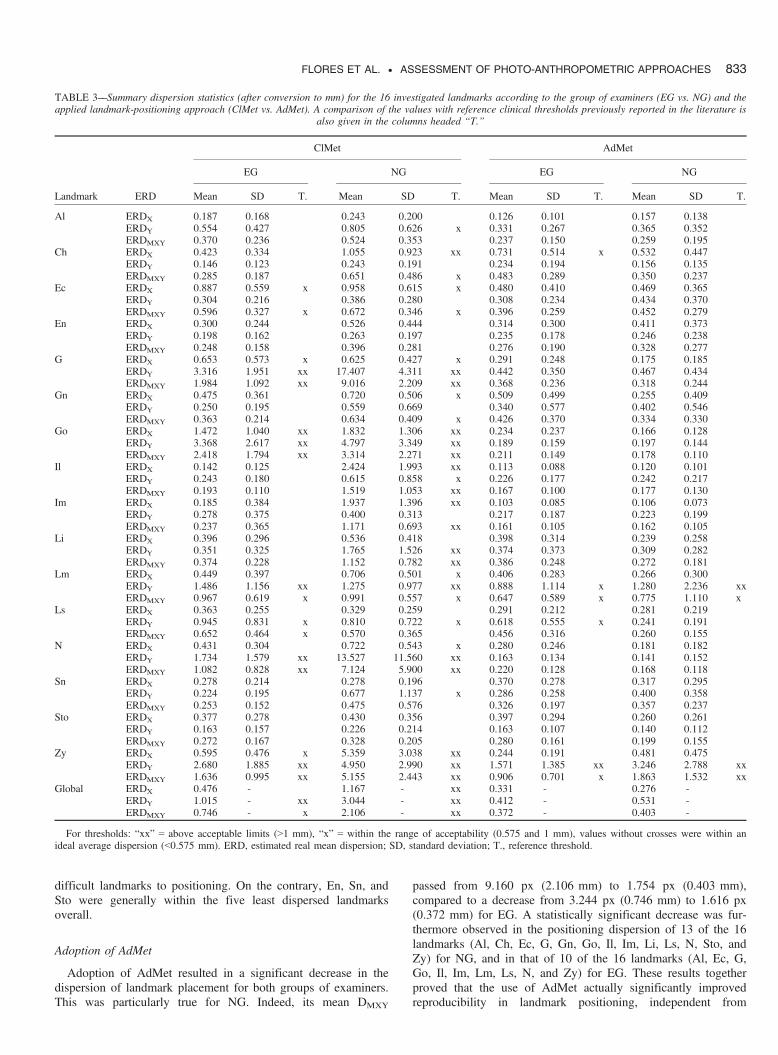
Adoption of AdMet
Adoption of AdMet resulted in a significant decrease in thedispersion of landmark placement for both groups of examiners.This was particularly true for NG. Indeed, its mean DMXY
passed from 9.160 px (2.106 mm) to 1.754 px (0.403 mm),compared to a decrease from 3.244 px (0.746 mm) to 1.616 px(0.372 mm) for EG. A statistically significant decrease was fur-thermore observed in the positioning dispersion of 13 of the 16landmarks (Al, Ch, Ec, G, Gn, Go, Il, Im, Li, Ls, N, Sto, andZy) for NG, and in that of 10 of the 16 landmarks (Al, Ec, G,Go, Il, Im, Lm, Ls, N, and Zy) for EG. These results togetherproved that the use of AdMet actually significantly improvedreproducibility in landmark positioning, independent from
TABLE 3––Summary dispersion statistics (after conversion to mm) for the 16 investigated landmarks according to the group of examiners (EG vs. NG) and theapplied landmark-positioning approach (ClMet vs. AdMet). A comparison of the values with reference clinical thresholds previously reported in the literature is
also given in the columns headed “T.”
Landmark ERD
ClMet AdMet
EG NG EG NG
Mean SD T. Mean SD T. Mean SD T. Mean SD T.
Al ERDX 0.187 0.168 0.243 0.200 0.126 0.101 0.157 0.138ERDY 0.554 0.427 0.805 0.626 x 0.331 0.267 0.365 0.352ERDMXY 0.370 0.236 0.524 0.353 0.237 0.150 0.259 0.195
Ch ERDX 0.423 0.334 1.055 0.923 xx 0.731 0.514 x 0.532 0.447ERDY 0.146 0.123 0.243 0.191 0.234 0.194 0.156 0.135ERDMXY 0.285 0.187 0.651 0.486 x 0.483 0.289 0.350 0.237
Ec ERDX 0.887 0.559 x 0.958 0.615 x 0.480 0.410 0.469 0.365ERDY 0.304 0.216 0.386 0.280 0.308 0.234 0.434 0.370ERDMXY 0.596 0.327 x 0.672 0.346 x 0.396 0.259 0.452 0.279
En ERDX 0.300 0.244 0.526 0.444 0.314 0.300 0.411 0.373ERDY 0.198 0.162 0.263 0.197 0.235 0.178 0.246 0.238ERDMXY 0.248 0.158 0.396 0.281 0.276 0.190 0.328 0.277
G ERDX 0.653 0.573 x 0.625 0.427 x 0.291 0.248 0.175 0.185ERDY 3.316 1.951 xx 17.407 4.311 xx 0.442 0.350 0.467 0.434ERDMXY 1.984 1.092 xx 9.016 2.209 xx 0.368 0.236 0.318 0.244
Gn ERDX 0.475 0.361 0.720 0.506 x 0.509 0.499 0.255 0.409ERDY 0.250 0.195 0.559 0.669 0.340 0.577 0.402 0.546ERDMXY 0.363 0.214 0.634 0.409 x 0.426 0.370 0.334 0.330
Go ERDX 1.472 1.040 xx 1.832 1.306 xx 0.234 0.237 0.166 0.128ERDY 3.368 2.617 xx 4.797 3.349 xx 0.189 0.159 0.197 0.144ERDMXY 2.418 1.794 xx 3.314 2.271 xx 0.211 0.149 0.178 0.110
Il ERDX 0.142 0.125 2.424 1.993 xx 0.113 0.088 0.120 0.101ERDY 0.243 0.180 0.615 0.858 x 0.226 0.177 0.242 0.217ERDMXY 0.193 0.110 1.519 1.053 xx 0.167 0.100 0.177 0.130
Im ERDX 0.185 0.384 1.937 1.396 xx 0.103 0.085 0.106 0.073ERDY 0.278 0.375 0.400 0.313 0.217 0.187 0.223 0.199ERDMXY 0.237 0.365 1.171 0.693 xx 0.161 0.105 0.162 0.105
Li ERDX 0.396 0.296 0.536 0.418 0.398 0.314 0.239 0.258ERDY 0.351 0.325 1.765 1.526 xx 0.374 0.373 0.309 0.282ERDMXY 0.374 0.228 1.152 0.782 xx 0.386 0.248 0.272 0.181
Lm ERDX 0.449 0.397 0.706 0.501 x 0.406 0.283 0.266 0.300ERDY 1.486 1.156 xx 1.275 0.977 xx 0.888 1.114 x 1.280 2.236 xxERDMXY 0.967 0.619 x 0.991 0.557 x 0.647 0.589 x 0.775 1.110 x
Ls ERDX 0.363 0.255 0.329 0.259 0.291 0.212 0.281 0.219ERDY 0.945 0.831 x 0.810 0.722 x 0.618 0.555 x 0.241 0.191ERDMXY 0.652 0.464 x 0.570 0.365 0.456 0.316 0.260 0.155
N ERDX 0.431 0.304 0.722 0.543 x 0.280 0.246 0.181 0.182ERDY 1.734 1.579 xx 13.527 11.560 xx 0.163 0.134 0.141 0.152ERDMXY 1.082 0.828 xx 7.124 5.900 xx 0.220 0.128 0.168 0.118
Sn ERDX 0.278 0.214 0.278 0.196 0.370 0.278 0.317 0.295ERDY 0.224 0.195 0.677 1.137 x 0.286 0.258 0.400 0.358ERDMXY 0.253 0.152 0.475 0.576 0.326 0.197 0.357 0.237
Sto ERDX 0.377 0.278 0.430 0.356 0.397 0.294 0.260 0.261ERDY 0.163 0.157 0.226 0.214 0.163 0.107 0.140 0.112ERDMXY 0.272 0.167 0.328 0.205 0.280 0.161 0.199 0.155
Zy ERDX 0.595 0.476 x 5.359 3.038 xx 0.244 0.191 0.481 0.475ERDY 2.680 1.885 xx 4.950 2.990 xx 1.571 1.385 xx 3.246 2.788 xxERDMXY 1.636 0.995 xx 5.155 2.443 xx 0.906 0.701 x 1.863 1.532 xx
Global ERDX 0.476 - 1.167 - xx 0.331 - 0.276 -ERDY 1.015 - xx 3.044 - xx 0.412 - 0.531 -ERDMXY 0.746 - x 2.106 - xx 0.372 - 0.403 -
For thresholds: “xx” = above acceptable limits (>1 mm), “x” = within the range of acceptability (0.575 and 1 mm), values without crosses were within anideal average dispersion (<0.575 mm). ERD, estimated real mean dispersion; SD, standard deviation; T., reference threshold.
FLORES ET AL. . ASSESSMENT OF PHOTO-ANTHROPOMETRIC APPROACHES 833
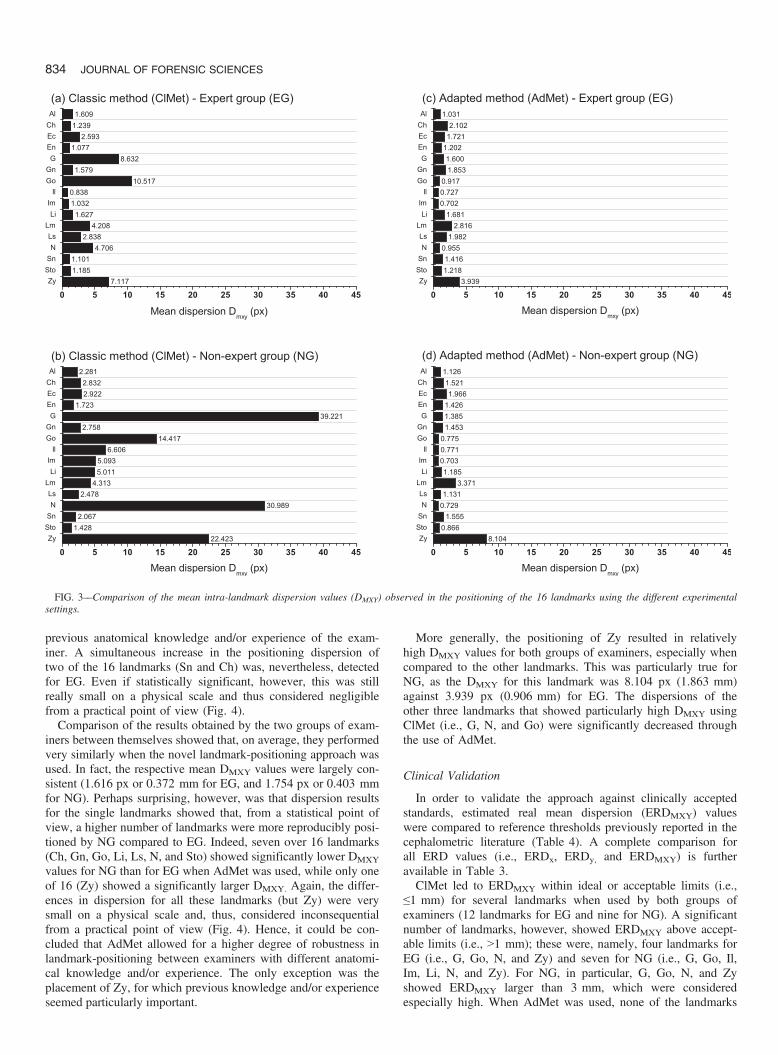
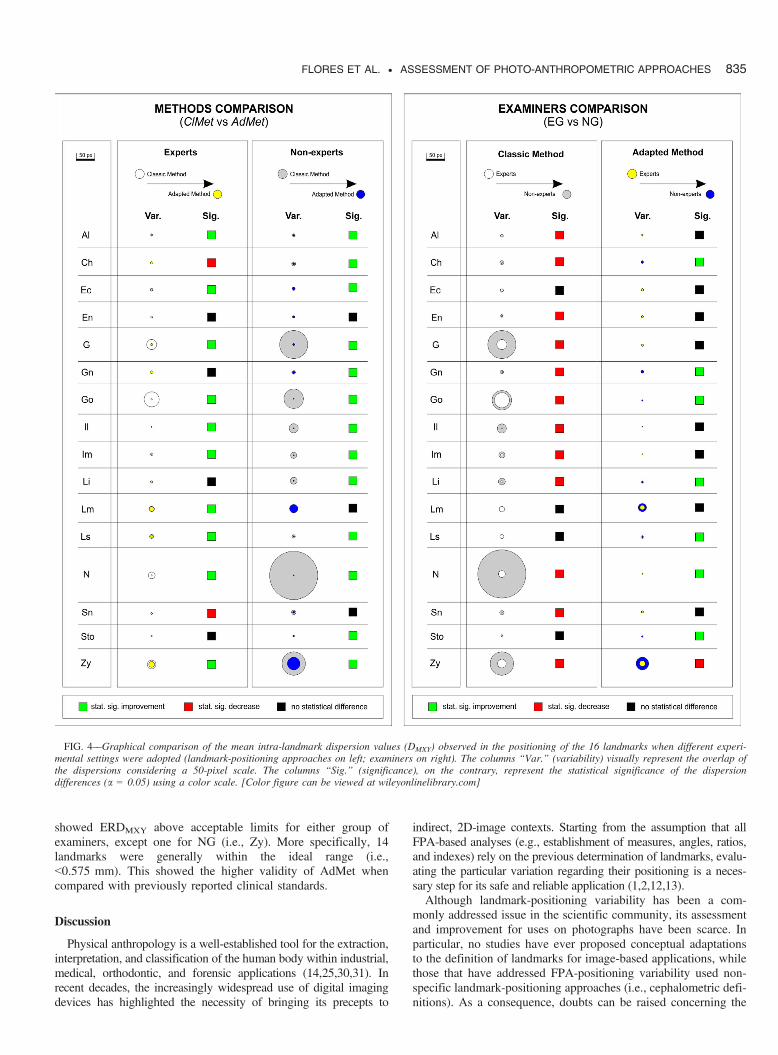
previous anatomical knowledge and/or experience of the exam-iner. A simultaneous increase in the positioning dispersion oftwo of the 16 landmarks (Sn and Ch) was, nevertheless, detectedfor EG. Even if statistically significant, however, this was stillreally small on a physical scale and thus considered negligiblefrom a practical point of view (Fig. 4).Comparison of the results obtained by the two groups of exam-
iners between themselves showed that, on average, they performedvery similarly when the novel landmark-positioning approach wasused. In fact, the respective mean DMXY values were largely con-sistent (1.616 px or 0.372 mm for EG, and 1.754 px or 0.403 mmfor NG). Perhaps surprising, however, was that dispersion resultsfor the single landmarks showed that, from a statistical point ofview, a higher number of landmarks were more reproducibly posi-tioned by NG compared to EG. Indeed, seven over 16 landmarks(Ch, Gn, Go, Li, Ls, N, and Sto) showed significantly lower DMXY
values for NG than for EG when AdMet was used, while only oneof 16 (Zy) showed a significantly larger DMXY. Again, the differ-ences in dispersion for all these landmarks (but Zy) were verysmall on a physical scale and, thus, considered inconsequentialfrom a practical point of view (Fig. 4). Hence, it could be con-cluded that AdMet allowed for a higher degree of robustness inlandmark-positioning between examiners with different anatomi-cal knowledge and/or experience. The only exception was theplacement of Zy, for which previous knowledge and/or experienceseemed particularly important.
More generally, the positioning of Zy resulted in relativelyhigh DMXY values for both groups of examiners, especially whencompared to the other landmarks. This was particularly true forNG, as the DMXY for this landmark was 8.104 px (1.863 mm)against 3.939 px (0.906 mm) for EG. The dispersions of theother three landmarks that showed particularly high DMXY usingClMet (i.e., G, N, and Go) were significantly decreased throughthe use of AdMet.
Clinical Validation
In order to validate the approach against clinically acceptedstandards, estimated real mean dispersion (ERDMXY) valueswere compared to reference thresholds previously reported in thecephalometric literature (Table 4). A complete comparison forall ERD values (i.e., ERDx, ERDy, and ERDMXY) is furtheravailable in Table 3.ClMet led to ERDMXY within ideal or acceptable limits (i.e.,
≤1 mm) for several landmarks when used by both groups ofexaminers (12 landmarks for EG and nine for NG). A significantnumber of landmarks, however, showed ERDMXY above accept-able limits (i.e., >1 mm); these were, namely, four landmarks forEG (i.e., G, Go, N, and Zy) and seven for NG (i.e., G, Go, Il,Im, Li, N, and Zy). For NG, in particular, G, Go, N, and Zyshowed ERDMXY larger than 3 mm, which were consideredespecially high. When AdMet was used, none of the landmarks
FIG. 3––Comparison of the mean intra-landmark dispersion values (DMXY) observed in the positioning of the 16 landmarks using the different experimentalsettings.
834 JOURNAL OF FORENSIC SCIENCES
showed ERDMXY above acceptable limits for either group ofexaminers, except one for NG (i.e., Zy). More specifically, 14landmarks were generally within the ideal range (i.e.,<0.575 mm). This showed the higher validity of AdMet whencompared with previously reported clinical standards.
Discussion
Physical anthropology is a well-established tool for the extraction,interpretation, and classification of the human body within industrial,medical, orthodontic, and forensic applications (14,25,30,31). Inrecent decades, the increasingly widespread use of digital imagingdevices has highlighted the necessity of bringing its precepts to
indirect, 2D-image contexts. Starting from the assumption that allFPA-based analyses (e.g., establishment of measures, angles, ratios,and indexes) rely on the previous determination of landmarks, evalu-ating the particular variation regarding their positioning is a neces-sary step for its safe and reliable application (1,2,12,13).Although landmark-positioning variability has been a com-
monly addressed issue in the scientific community, its assessmentand improvement for uses on photographs have been scarce. Inparticular, no studies have ever proposed conceptual adaptationsto the definition of landmarks for image-based applications, whilethose that have addressed FPA-positioning variability used non-specific landmark-positioning approaches (i.e., cephalometric defi-nitions). As a consequence, doubts can be raised concerning the
FIG. 4––Graphical comparison of the mean intra-landmark dispersion values (DMXY) observed in the positioning of the 16 landmarks when different experi-mental settings were adopted (landmark-positioning approaches on left; examiners on right). The columns “Var.” (variability) visually represent the overlap ofthe dispersions considering a 50-pixel scale. The columns “Sig.” (significance), on the contrary, represent the statistical significance of the dispersiondifferences (a = 0.05) using a color scale. [Color figure can be viewed at wileyonlinelibrary.com]
FLORES ET AL. . ASSESSMENT OF PHOTO-ANTHROPOMETRIC APPROACHES 835

proper and reliable attribution of the investigated landmarks(6,17,19). Recently, an alternative nomenclature (i.e., capulometriclandmarks) has been tentatively proposed for the analysis of 2Dimages (22). Again, nonetheless, no visual references were imple-mented, resulting in a set of definitions very similar to the classiccephalometric ones. The lack of a standardized set of landmarksand protocols specific to FPA analysis should be viewed with con-cern because, depending on the scientific field of interest, errorsmay lead to misunderstandings in diagnosis/treatment or even toimproper characterization and/or classification of a specific popu-lation or individual (3,7).Classifying human features into class or individual characteris-
tic is a constant practice in forensic science. A proper populationsurvey of a specific facial feature, whether morphological orphoto-anthropometrical, is necessary to determine its importancein the human individualization process and to statistically supportthe quantification and decision of an identification match(20,39,40). As a result of its inherent potential to make image-based facial analysis more objective, systematic, and repro-ducible, FPA has promising capabilities for the analytical surveyof facial structures along with the high possibility of automatiza-tion. This is a step forward for the evaluation of large databases,as well for understanding human facial variation. In this sense,generating landmark-specific variability information according tothe adopted methodology is of utmost importance, by determin-ing the extent to which each one can provide reliable facial rela-tionships to support forthcoming statistical associations.In the present study, as expected, the use of classical cephalo-
metric descriptions led to low reproducibilities between theexaminers in positioning the 16 investigated landmarks on facialimages. Indeed, ERDMXY values for most of them were abovean ideal limit threshold, and this was true not only for non-expert examiners, but also for expert ones. More specifically,only nine of the 16 landmarks showed ERDMXY values withinan ideal error range when positioned by expert examiners, andfour of 16 had ERDMXY values above an acceptable threshold.Observed dispersions, furthermore, showed an overall low
consistency between the two groups of examiners, with
non-experts particularly struggling with placing landmarks onfacial images in a reproducible way, as demonstrated by theirsignificantly bigger inter-variability. This suggests a low robust-ness of the classic landmark-positioning method with respect tothe experience level of the examiners and, in particular, that pre-vious anatomical knowledge and/or experience in the procedureare necessary in order to properly understand traditional cephalo-metric descriptions and locate the corresponding structures onfacial images.The positioning of Go, G, Zy, and N on frontal facial
images proved to be particularly challenging following the tra-ditional cephalometric descriptions, as proved by their veryhigh dispersions amongst all the examiners (especially non-experts). This is a serious problem that may affect the useful-ness of the traditional landmark method in many FPA applica-tions. Indeed, these four specific landmarks are involved in theestablishment of some of the most characteristic facial measure-ments (14,29), such as the facial height (N - Gn), facial width(Zy - Zy), mandibular width (Go - Go), facial length index (N- Gn/Zy - Zy), mandibulo-facial index (Go - Go/Zy - Zy), andnaso-chelion angle (Ch - N - Ch). The same observation has,nonetheless, already been reported in a number of previousstudies (6,17,22,35,41,42) and may be explained by the factthat the traditional cephalometric descriptions for these fourlandmarks largely rely on physical and/or bone structures,which are particularly difficult to detect on frontal images. Asa proof, the opposite trend could actually be seen for land-marks such as Ch and Sto, for which traditional cephalometricdefinitions rely more strongly on facial structures visible onimages (6,22).The adoption of adapted and FPA-specific landmark defini-
tions positively enhanced the performance of positioning the 16investigated landmarks on facial images and, thus, of the generalFPA procedure. Undeniably, placement reproducibility betweenexaminers was significantly improved. All the landmarks showedERDMXY within acceptable limit thresholds when placed byexpert examiners, contrary to that observed when classiccephalometric definitions were used. Even more notably, 14 of
TABLE 4––Comparison of the estimated real mean dispersions (ERDMXY) with reference clinical thresholds previously reported in the literature
Landmark
ClMet AdMet
EG NG EG NG
ERDMXY Thres. ERDMXY Thres. ERDMXY Thres. ERDMXY Thres.
Al 0.370 0.524 0.237 0.259Ch 0.285 0.651 x 0.483 0.350Ec 0.595 x 0.672 x 0.396 0.452En 0.248 0.396 0.276 0.328G 1.984 xx 9.016 xx 0.368 0.318Gn 0.363 0.634 x 0.426 0.334Go 2.418 xx 3.314 xx 0.211 0.178Il 0.193 1.519 xx 0.167 0.177Im 0.237 1.171 xx 0.161 0.162Li 0.374 1.152 xx 0.386 0.272Lm 0.967 x 0.991 x 0.647 x 0.775 xLs 0.652 x 0.570 0.456 0.260N 1.082 xx 7.124 xx 0.220 0.168Sn 0.253 0.475 0.326 0.357Sto 0.272 0.328 0.280 0.199Zy 1.636 xx 5.155 xx 0.906 x 1.863 xxGlobal 0.746 x 2.106 xx 0.372 0.403
“xx” : above acceptable limits (>1 mm); “x” : within the range of acceptability (0.575 and 1 mm); values without crosses have an ideal average dispersion(<0.575 mm).
836 JOURNAL OF FORENSIC SCIENCES
16 landmarks showed ERDMXY values within ideal limit thresh-olds. In contrast, landmark dispersions showed a better consis-tency between experts and non-experts. This finding supports thehigher robustness of the adapted landmark approach with respectto the experience level of the examiners. Furthermore, it is alsoconsistent with the conclusion that the most relevant factor inthe correct positioning of landmarks on facial images is not nec-essarily the examiner’s previous knowledge in facial anatomy ortheir experience in the procedure, but rather the accuracy of thelandmark descriptions themselves. In this regard, an FPA-opti-mized approach is more helpful than a cephalometry-based one,as the latter is essentially based on descriptions of underlyinganatomical structures.The use of adapted landmark definitions also solved the high
positioning variability of G, N, and Go that is observed whenusing the classic cephalometric approach; an improvement that, byitself, is prone to significantly enhance the general reliability ofFPA in most applications. Placement of Zy, however, still resultedin high ERDMXY for both groups of examiners, which confirms itsparticular complexity in being positioned on facial images.Nonetheless, after a more detailed inspection, it can be observedthat its dispersion on the vertical axis (ERDY) more significantlycontributes to ERDMXY than its dispersion on the horizontal axis(ERDX), and that the latter is almost negligible and within an idealthreshold after using an adapted landmark-positioning approach.In this regard, it is important to highlight that errors in the verticaland horizontal directions may be of substantial importancedepending on the specific application and/or landmark. Zy, in par-ticular, is most frequently used in horizontal measurements (e.g.,facial width) and related indexes (e.g., facial length index) (14,29),and thus the use of an adapted approach may actually allow a moreefficient use of this landmark. In any case, further improvementsto the landmark descriptions may be implemented in order to alsotake into account the variability on the vertical axis and bringERDY to within an acceptable dispersion range.
Conclusion
In this work, the use of an adapted approach for landmarkfacial images based on descriptions and locating procedures opti-mized for FPA analysis has been assessed and compared againsta traditional approach based on classic cephalometric descrip-tions. Results showed that the use of conventional cephalometricdescriptions led to a low reproducibility between examiners inpositioning landmarks and, more importantly, to a low consis-tency in the positioning dispersions between experts and non-experts. This suggested that previous anatomical knowledge and/or experience is necessary in order to correctly apply traditionalcephalometric descriptions. The use of adapted landmark defini-tions, on the contrary, significantly decreased the landmark dis-persion between examiners, whilst also reducing the differencesarising from experience level. This second observation, in partic-ular, supported the conclusion that the most relevant factor inthe correct positioning of landmarks on facial images is not nec-essarily the examiner’s knowledge about facial anatomy, butinstead the accuracy of landmark descriptions and the applicationof an approach based on clear visual references.Thus, the use of an adapted landmark-positioning approach
proved to be highly advantageous in FPA analysis and futurework in this field should consider adopting similar methodolo-gies. In particular, the adapted approach specifically used in thisresearch performed well and may be implemented in future FPAapplications.
Acknowledgments
The authors express their gratitude to the Technical and ScientificSection of the Brazilian Federal Police, especially the Unit of Foren-sic Electronics and Multimedia of the National Institute of Criminal-istics, as well as to Edmar Antonio da Silva for the development ofSAFF-2D� (Forensic Facial Analysis System—2D, Department ofFederal Police, Brazil). The authors would also like to thank RachelIrlam (King’s College London, U.K.) and David Jedd (Birming-ham, UK) for proofreading the document, as well as the Coordina-tion of Improvement of Higher Level Personnel, Ministry ofEducation (CAPES Foundation-Brazil) and the Forensic Craniofa-cial Identification Scientific Group–Brazil (FACIS Group).
References
1. Davis J, Valentine T, Davis R. Computer assisted photo-anthropometricanalyses of full-face and profile facial images. Forensic Sci Int 2010;200(1–3):165–76.
2. _Is�can M. Introduction to techniques for photographic comparison: poten-tials and problems. In: _Is�can M, Helmer R, editors. Forensic analysis ofthe skull: craniofacial analysis, reconstruction, and identification. NewYork, NY: Wiley-Liss, 1993;57–70.
3. Stavrianos C, Papadopoulos C, Pantelidou O, Emmanouil J, Pentalotis N,Tatsis D. The use of photoanthropometry in facial mapping. Res J MedSci 2012;6(4):166–9.
4. Moreton R, Morley J. Investigation into the use of photoanthropometryin facial image comparison. Forensic Sci Int 2011;212(1–3):231–7.
5. Borges DL, Vidal FB, Flores MRP, Melani RFH, Guimar~aes MA,Machado CEP. Photoanthropometric face iridial proportions for age esti-mation: an investigation using features selected via a joint mutual infor-mation criterion. Forensic Sci Int 2018;284:9–14.
6. Cattaneo C, Obertov�a Z, Ratnayake M, Marasciuolo L, Tutkuviene J,Poppa P, et al. Can facial proportions taken from images be of use forageing in cases of suspected child pornography? A pilot study. Int JLegal Med 2012;126(1):139–44.
7. Machado CEP, Flores MRP, Lima LNC, Tinoco RLR, Franco A, BezerraACB, et al. A new approach for the analysis of facial growth and ageestimation: iris ratio. PLoS ONE 2017;12(7):e0180330.
8. Adamu L, Ojo S, Danborno B, Adebisi S, Taura M. Sex determinationusing facial linear dimensions and angles among Hausa population ofKano State, Nigeria. Egypt J Forensic Sci 2016;6(4):459–67.
9. Packiriswamy V, Bashour M, Nayak S. Anthropometric analysis of theSouth Indian Woman’s nose. Facial Plast Surg 2016;32(3):304–8.
10. Ramanathan N, Chellappa R. Modeling age progression in young faces.IEEE Proceedings of the 2006 Computer Society Conference on Com-puter Vision and Pattern Recognition (CVPR’06); 2006 June 17–22;New York, NY. Piscataway, NJ: Institute of Electrical and ElectronicsEngineers, 2006;387–94.
11. Porter G, Doran G. An anatomical and photographic technique for foren-sic facial identification. Forensic Sci Int 2000;114(2):97–105.
12. Halberstein RA. The application of anthropometric indices in forensicphotography: three case studies. J Forensic Sci 2001;46(6):1438–41.
13. Trpkova B, Major P, Prasad N, Nebbe B. Cephalometric landmarks iden-tification and reproducibility: a meta analysis. Am J Orthod DentofacialOrthop 1997;112(2):165–70.
14. Farkas L. Anthropometry of the head and face, 2nd edn. New York, NY:Raven Press, 1994.
15. Shishkin KM, Arsenina OI, Shishkin MK, Popova NV. Cephalometryefficacy in orthodontic treatment planning: correlations of cephalometricvalues and their changes in the course of treatment. Stomatologia2017;96(4):36–7.
16. Esenlik E, Plana NM, Grayson BH, Flores RL. Cephalometric predictorsof clinical severity in Treacher Collins syndrome. Plast Reconstr Surg2017;140(6):1240–9.
17. Campomanes-�Alvarez B, Ib�a~nez O, Navarro F, Alem�an I, Cord�on O,Damas S. Dispersion assessment in the location of facial landmarks onphotographs. Int J Legal Med 2015;129(1):227–36.
18. Cattaneo C, Ritz-Timme S, Gabriel P, Gibelli D, Giudici E, Poppa P,et al. The difficult issue of age assessment on pedo-pornographic mate-rial. Forensic Sci Int 2009;183(1–3):21–4.
19. Lucas T, Kumaratilake J, Henneber M. Metric identification of the samepeople from images: how reliable is it? J Anthropol 2016;2016(1):1–10.
FLORES ET AL. . ASSESSMENT OF PHOTO-ANTHROPOMETRIC APPROACHES 837

20. Cummaudo M, Guerzoni M, Marasciuolo L, Gibelli D, Cigada A, Ober-tov�a Z, et al. Pitfalls at the root of facial assessment on photographs: aquantitative study of accuracy in positioning facial landmarks. Int J LegalMed 2013;127(3):699–706.
21. FISWG. Guidelines for facial comparison methods; www.fiswg.org (ac-cessed July 22, 2018).
22. Caple J, Stephan CN. A standardized nomenclature for craniofacial andfacial anthropometry. Int J Legal Med 2016;130(3):863–79.
23. Lee WJ, Kim DM, Lee UY, Cho JH, Kim MS, Hong JH, et al. A pre-liminary study of the reliability of anatomical facial landmarks used infacial comparison. J Forensic Sci 2018;1–9. https://doi.org/10.1111/1556-4029.13873. Epub 2018 Aug 14.
24. Wilkinson C, Evans R. Are facial image analysis experts any better thanthe general public at identifying individuals from CCTV images? SciJustice 2009;49(3):191–6.
25. Farkas L. Accuracy of anthropometric measurements: past, present, andfuture. Cleft Palate Craniofac J 1996;33(1):10–8; discussion 19–22.
26. Driessen J, Vuyk H, Borgstein J. New insights into facial anthropometryin digital photographs using iris dependent calibration. Int J PediatrOtorhinolaryngol 2011;75(4):579–84.
27. Miot H, Pivotto D, Jorge E, Mazeto G. Evaluation of oculometric param-eters by facial digital photography: use of iris diameter as a reference.Arq Bras Oftalmol 2008;71(5):679–83.
28. Flores MRP, Machado CEP, Silva RHA. Proposta de an�alise facialfotoantropom�etrica em norma frontal: metodologia descritiva dos pontosanatomicos de referencia [Photo-anthropometric facial analysis in frontalview images: descriptive methodology proposal for anatomical land-marks]. Novas Edic�~oes Academicas, 2017; http://facisgroup.org/facial_landmarks (accessed August 11, 2018).
29. George R. Facial geometry: graphic facial analysis for forensic artists.Springfield, MO: Charles C Thomas Publisher, 2007.
30. Kolar J, Salter E. Craniofacial anthropometry: practical measurement ofthe head and face for clinical, surgical, and research use. Springfield,MO: Charles C Thomas Publisher, 1997.
31. Zimbler M, Ham J. Aesthetic facial analysis. In: Cummings CW, FlintPW, Harker LA, et al., editors. Cummings otolaryngology: head andneck surgery, 4th edn. Philadelphia, PA: Elsevier Mosby, 2005;517–8.
32. Hickson-Curran S, Young G, Brennan N, Hunt C. Chinese and Cau-casian ocular topography and soft contact lens fit. Clin Exp Optom2016;99(2):149–56.
33. Ronneburger A, Basarab J, Howland H. Growth of the cornea frominfancy to adolescence. Ophthalmic Physiol Opt 2006;26(1):80–7.
34. Martin D, Holden B. A new method for measuring the diameter of thein vivo human cornea. Am J Optom Physiol Opt 1982;59(5):436–41.
35. Aksu M, Kaya D, Kocadereli I. Reliability of reference distances used inphotogrammetry. Angle Orthod 2010;80(4):482–9.
36. Forsyth D, Davis D. Assessment of an automated cephalometric analysissystem. Eur J Orthod 1996;18(5):471–8.
37. Richardson A. A comparison of traditional and computerized methods ofcephalometric analysis. Eur J Orthod 1981;3(1):15–20.
38. Strauss R, Weis B, Lindauer S, Rebellato J, Isaacson R. Variability of facialphotographs for use in treatment planning for orthodontics and orthognathicsurgery. Int J Adult Orthodon Orthognath Surg 1997;12(3):197–203.
39. Mallett XD, Dryden I, Bruegge RV, Evison M. An exploration of samplerepresentativeness in anthropometric facial comparison. J Forensic Sci2010;55(4):1025–31.
40. Evison M, Dryden I, Fieller N, Mallett X, Morecroft L, Schofield D,et al. Key parameters of face shape variation in 3D in a large sample. JForensic Sci 2010;55(1):159–62.
41. Bishara S, Cummins D, Jorgensen G, Jakobsen J. A computer assistedphotogrammetric analysis of soft tissue changes after orthodontic treat-ment. Part I: methodology and reliability. Am J Orthod DentofacialOrthop 1995;107(7):633–9.
42. Farkas L, Bryson W, Klotz J. Is photogrammetry of the face reliable?Plast Reconstr Surg 1980;66(3):346–55.
Supporting Information
Additional Supporting Information may be found in the onlineversion of this article:Appendix S1 Manual of facial photo-anthropometry: visual
references for landmark positioning in frontal view images.
838 JOURNAL OF FORENSIC SCIENCES