Embed Size (px)
Citation preview
DESIGN forAFFORDABILITY
Four housing product solutions that
are quickly implemented,
unsubsidized,
utilize existing land and materials,
and affordable for 10% - 120% AMI.
November 2018
2
1 | INTRODUCTION
2 | MARKET
Users and Providers
Historical Precedent
3 | PRODUCTS
Single Family Co-Living
Increasing Density on Single Family Lots
Micro-Units in Multi-family Developments
Multi-family Co-Living
4 | ADVANTAGES & CHALLENGES
TABLE OF CONTENTS
5 | RECOMMENDATIONS
Awareness
Policy
6 | SCALABILITY
7 | APPENDIX
Case Studies
Sample ProFormas
Contributors
Cover images provided by PadSplit and Pexel.com

3
1 | INTRODUCTION
ULI Atlanta’s Technical Assistance Programs (TAPs) Committee members Sarah Butler and Atticus LeBlanc
led a special taskforce called “Design for Affordability” involving over 30 land use professionals to evaluate
innovations in planning and design that can increase housing affordability.
We know the need for housing that is affordable for more Atlantans is significant, and demand will always
outpace supply. Addressing affordability in a holistic way requires looking for innovation in design, finance,
construction, and product types.
The conversation about “affordable housing” is often framed in impersonal terms of AMI levels,
preconceptions about transportation needs, subsidies, and numbers of units required. But housing – a home – is
deeply personal. The mission of this taskforce was to recalibrate the conversation – to start a new conversation
about people and architecture.
The Design for Affordability taskforce was conceived as a way to demonstrate 4 housing solutions that can
be immediately implemented and scaled, to provide homes for a broad range of income levels, for different areas
of the city, densities, and for both renovation and new construction.
This isn’t a “one size fits all” solution, and has to be coupled with a mix of strategies and tactics the City
of Atlanta is employing to mitigate displacement and provide decent, safe, and affordable housing to a broader
range of residents.
The following publication provides resources and talking points for property owners, developers, and
government agencies to engage in this new conversation, by thoughtfully re-considering alternative usage types
to address Atlanta’s affordable housing challenges, all by harnessing the power of the private sector.
Instead of AMI levels,
we have chefs, security guards, and ride
share drivers.
Instead of concerns about increased traffic,
we suggest decoupling parking from
home costs.
Instead of subsidies,
we have homeowners, private developers,
and management companies with aligned
incentives
Instead of units,
we have people who can now afford a
holistic lifestyle, in addition to the
architectural space of their home.

4
2 | MARKET: USERS AND PROVIDERS
Single Parent
Traditional Developer Multi-family Developer Government Agency
Empty Nester
Adaptive Reuse Developer Homeowner
Senior VeteranIndividual Workforce CoupleCollege Student
“Affordable Housing,” if described in terms of AMI Levels, is
not an accurate representation of individual situations, nor should
“Affordable Housing” providers be considered as a specialty
service that only certain entities (i.e. Section 8) are qualified to
provide. This concept considers how to harness the power of the
private sector to scale more affordable housing options, using
more types of providers, for a range of users:
USERS
PROVIDERS

5
2 | MARKET: HISTORICAL PRECEDENT
Our historical neighborhoods typically provided a better range
of housing type and affordability scales. From the 1920s through
the 1960s, single family homes and duplexes were common,
along with rooming houses and small apartment buildings.
As urban neighborhoods were abandoned, allowable zoning
density also decreased, and those zoning policies have not been
updated to reflect a return to urban centers. This results in the
problem of the “Missing Middle,” with more affordable housing
options concentrated in very low density neighborhoods,
or high density apartment towers and nothing in between.
The social stigma associated with affordable housing creates
opposition from these very central neighborhoods that could
provide a more equitable mix of housing.
Additionally, the concept of co-living, which had been
common for centuries and is still common in many international
cities, became less popular as the dream of a single family home
ownership dominated the landscape.
The four solutions proposed here can be adapted to fit a
number of AMI categories, as well as the spectrum of building
types, to provide a large number of units in a relatively short
timeframe. In large, dense American cities, where even market-
rate housing costs are prohibitive, a new generation is choosing
a roommate or co-living option, both to reduce costs and to
experience a more interactive community.
Rooming-houses and duplexes, intown Atlanta neighborhoods
6
2 | MARKET: HISTORICAL PRECEDENT
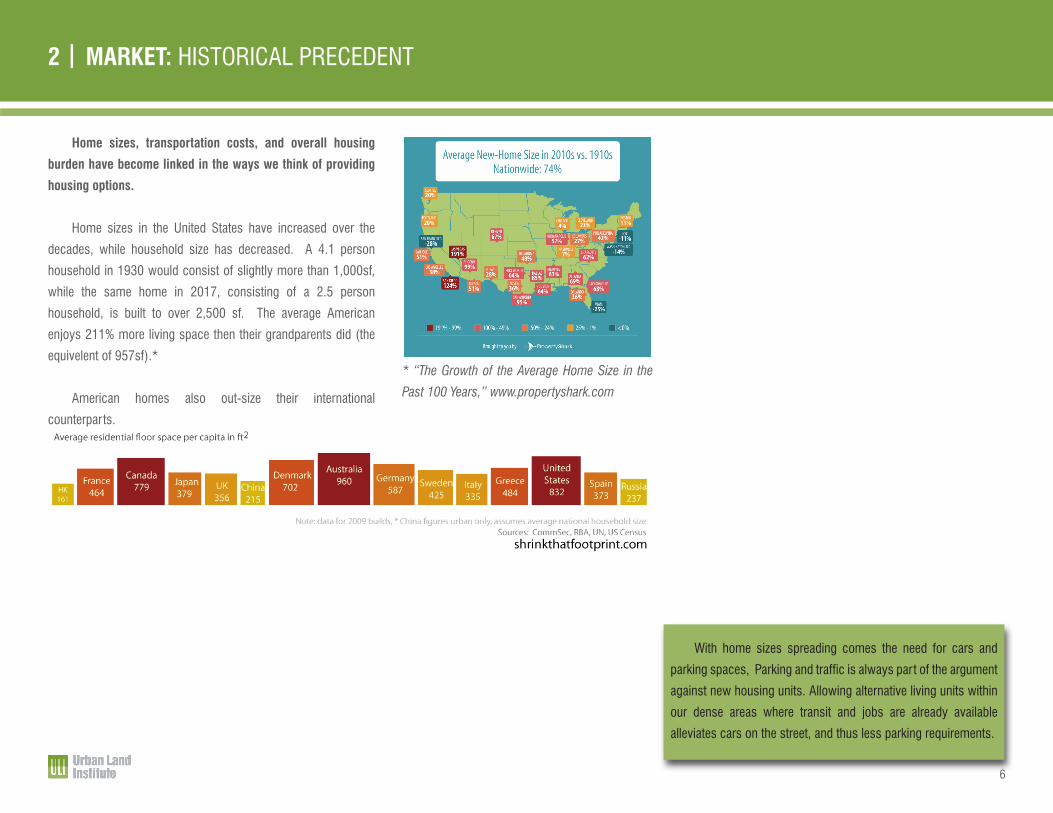
With home sizes spreading comes the need for cars and
parking spaces, Parking and traffic is always part of the argument
against new housing units. Allowing alternative living units within
our dense areas where transit and jobs are already available
alleviates cars on the street, and thus less parking requirements.
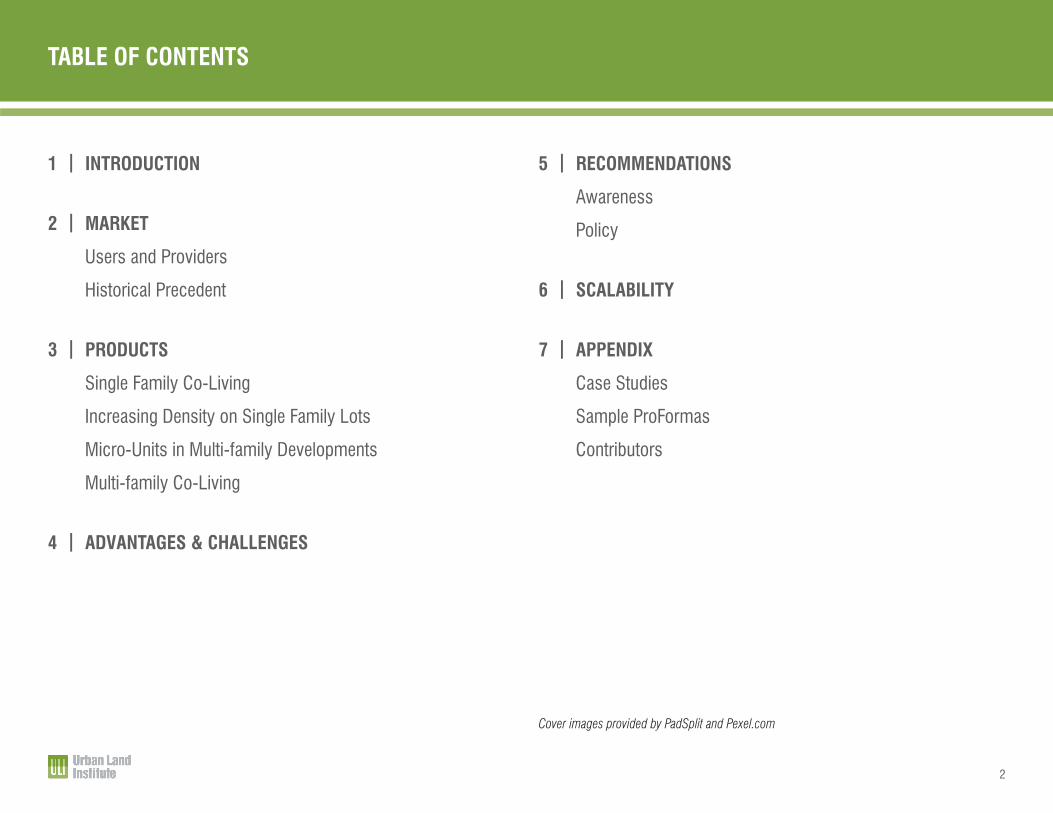
Home sizes, transportation costs, and overall housing
burden have become linked in the ways we think of providing
housing options.
Home sizes in the United States have increased over the
decades, while household size has decreased. A 4.1 person
household in 1930 would consist of slightly more than 1,000sf,
while the same home in 2017, consisting of a 2.5 person
household, is built to over 2,500 sf. The average American
enjoys 211% more living space then their grandparents did (the
equivelent of 957sf).*
American homes also out-size their international
counterparts.
* “The Growth of the Average Home Size in the
Past 100 Years,” www.propertyshark.com

7
2 | MARKET: HISTORICAL PRECEDENT
The true costs of housing on an individual basis can extend
past the portion spent each month on mortgage or rent. If housing
is too far from employment centers, transportation cost must be
included in the housing burden cost. Additionally, a home is not
complete without utilities, and should be included in the full cost of
housing. When housing burden is defined in terms only of the actual
home payment, it masks the true costs of housing as a percentage
of a person’s income.
Typical representation of living costs (30% towards housing)
Stacked representation of housing costsencompassing rent, utilites, and transportation as combined burden (more the 30%). It becomes clearer that the true “housing burden”
limits all other personal responsibilities and goals.
Housing Burden = 55%(housing + transportation + utilies)
Across all building types, allowing the conversation to steer
from “housing costs” being reflective of just rent or mortgage,
but also utilities, transportation, and access to services, will
help re-frame why these housing solutions provide holistic
affordability.
Housing paymentTransportationUtilitiesFoodDebt PaymentPersonal (might include childcare)ClothingMedicalSavings

8
3 | PRODUCTS
Scalability for Income and Dens ity
10% AMI
120% AMI
1
2 2 233
1
444 3
Missing Middle image courtesy of Opticos Design
4$ 2
1 Single Family Co-Living: subdivision of single family homes into rentable bedrooms (PadSplit model)
2 Increasing Density on Single Family Lots
3 Micro-units in Multi-Family Developments
4 Multi-family Co-Living
The four housing types reviewed in this document, which cover the range of AMI levels over the range of architectural types:

9
3 | PRODUCTS: SINGLE FAMILY CO-LIVING
The idea of shared living, or the traditional rooming-house, has been re-imagined by the Atlanta company,
PadSplit, Inc.
An existing single family home, ideally with 5-6 bedrooms, is rented out on a per-bedroom basis.
The kitchen and common areas are shared. The home is managed by the LLC. The per-bedroom rent allows
three main advantages:
• The landlord has an above-market return, compared to renting out the home to a single family,
• The rent can be re-structured to include utilities and cable, and can be billed weekly to match pay
periods.
• Rates for residents are cheaper than apartments and closer to jobs and public transit.
Because utilities are included, the company is incentivized to make the home energy efficient. The level of
finishes is comparable to the rest of the neighborhood, and thus the architecture appears no different than its
neighbors. The prototype is designed so it could be built modular, as well as converted back to a single family
home. This model can be used for new construction as well as rehabilitation/renovation.
Size: 5-6 bedroom homeTarget Income Ranges: 10% to 60% AMI
Senior
Traditional Developer Homeowner
Workforce Individual
Users:
Providers:
TARGET AUDIENCE
PadSplit, Atlanta PadSplit Prototype
10
3 | PRODUCTS: INCREASING DENSITY ON SINGLE FAMILY LOTS
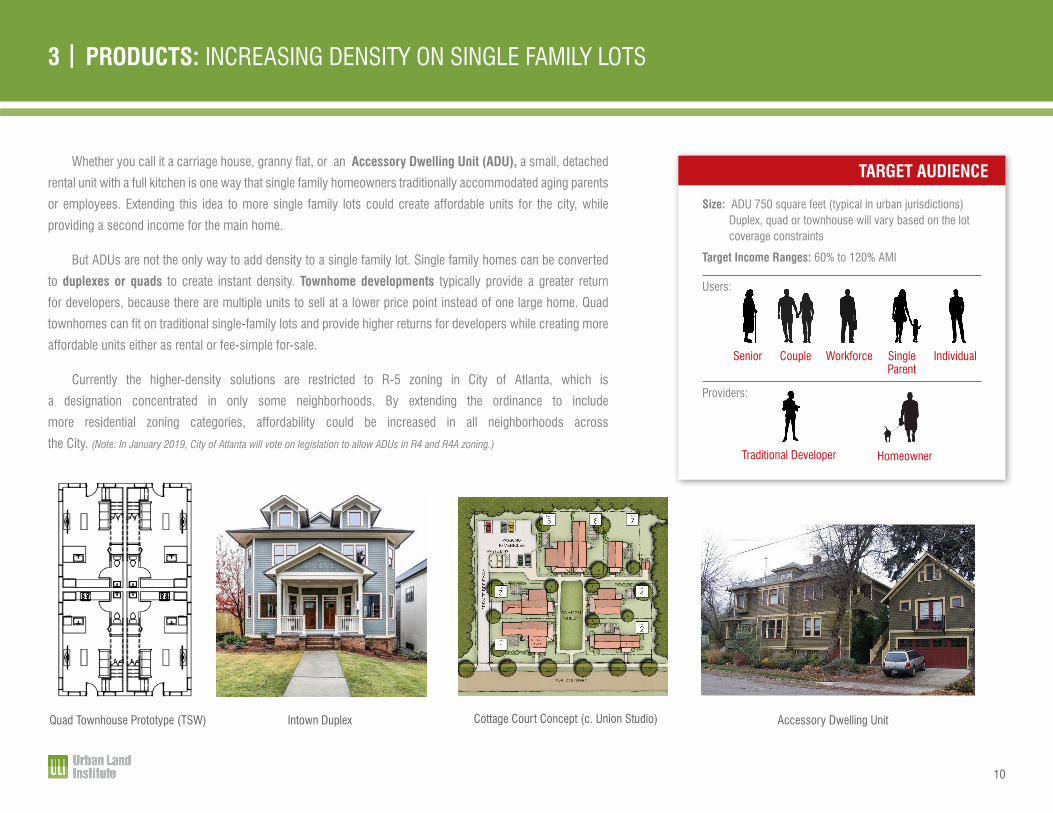
Whether you call it a carriage house, granny flat, or an Accessory Dwelling Unit (ADU), a small, detached
rental unit with a full kitchen is one way that single family homeowners traditionally accommodated aging parents
or employees. Extending this idea to more single family lots could create affordable units for the city, while
providing a second income for the main home.
But ADUs are not the only way to add density to a single family lot. Single family homes can be converted
to duplexes or quads to create instant density. Townhome developments typically provide a greater return
for developers, because there are multiple units to sell at a lower price point instead of one large home. Quad
townhomes can fit on traditional single-family lots and provide higher returns for developers while creating more
affordable units either as rental or fee-simple for-sale.
Currently the higher-density solutions are restricted to R-5 zoning in City of Atlanta, which is
a designation concentrated in only some neighborhoods. By extending the ordinance to include
more residential zoning categories, affordability could be increased in all neighborhoods across
the City. (Note: In January 2019, City of Atlanta will vote on legislation to allow ADUs in R4 and R4A zoning.)
Size: ADU 750 square feet (typical in urban jurisdictions) Duplex, quad or townhouse will vary based on the lot coverage constraints
Target Income Ranges: 60% to 120% AMI
TARGET AUDIENCE
Senior Couple Workforce SingleParent
Individual
Users:
Providers:
Traditional Developer Homeowner
Quad Townhouse Prototype (TSW) Accessory Dwelling UnitIntown Duplex Cottage Court Concept (c. Union Studio)
11
3 | PRODUCTS: MICRO-UNITS IN MULTI-FAMILY DEVELOPMENTS
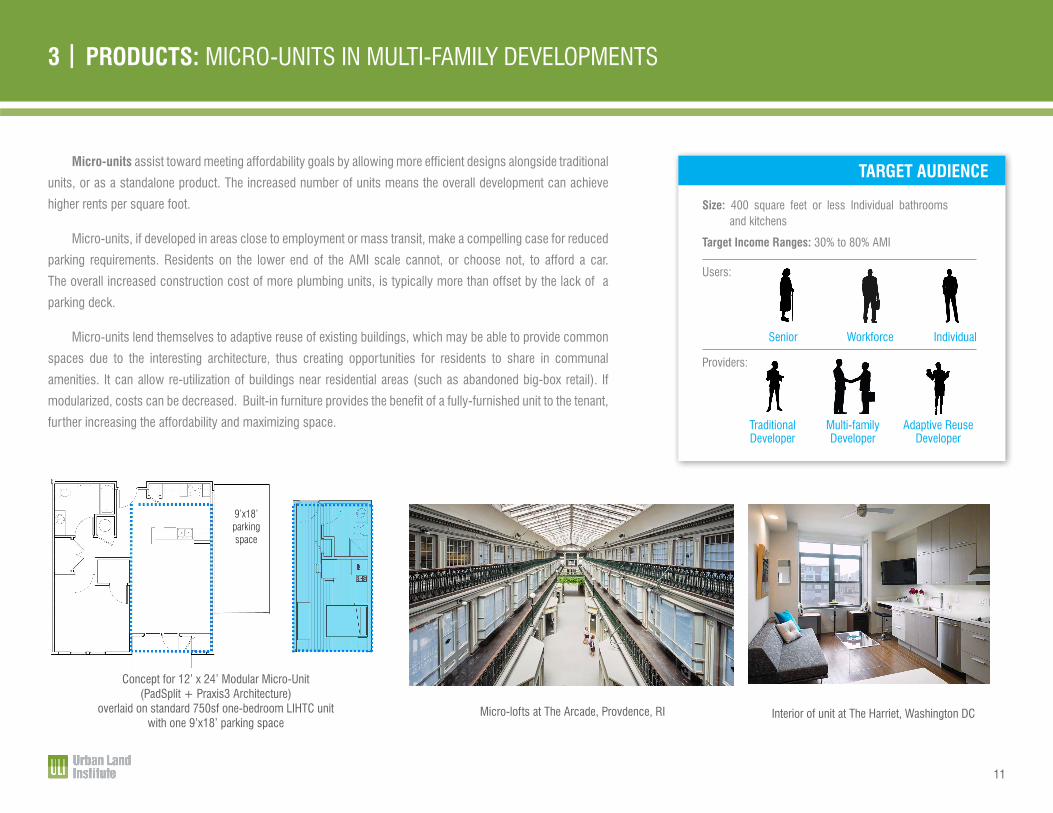
Micro-units assist toward meeting affordability goals by allowing more efficient designs alongside traditional
units, or as a standalone product. The increased number of units means the overall development can achieve
higher rents per square foot.
Micro-units, if developed in areas close to employment or mass transit, make a compelling case for reduced
parking requirements. Residents on the lower end of the AMI scale cannot, or choose not, to afford a car.
The overall increased construction cost of more plumbing units, is typically more than offset by the lack of a
parking deck.
Micro-units lend themselves to adaptive reuse of existing buildings, which may be able to provide common
spaces due to the interesting architecture, thus creating opportunities for residents to share in communal
amenities. It can allow re-utilization of buildings near residential areas (such as abandoned big-box retail). If
modularized, costs can be decreased. Built-in furniture provides the benefit of a fully-furnished unit to the tenant,
further increasing the affordability and maximizing space.
Size: 400 square feet or less Individual bathrooms and kitchens
Target Income Ranges: 30% to 80% AMI
Users:
Providers:
Senior Workforce Individual
Traditional Developer
Multi-family Developer
Adaptive Reuse Developer
TARGET AUDIENCE
Concept for 12’ x 24’ Modular Micro-Unit (PadSplit + Praxis3 Architecture)
overlaid on standard 750sf one-bedroom LIHTC unit with one 9’x18’ parking space
Interior of unit at The Harriet, Washington DC
9’x18’ parking space
Micro-lofts at The Arcade, Provdence, RI

12
3 | PRODUCTS: MULTI-FAMILY CO-LIVING
A sense of community is desired by all generations, from the current cycle of graduates entering a new
city’s employment market in search of new friends, all the way to seniors who may still be able to provide a
watchful eye over neighbor children. A multi-family co-living model provides a way for affordable housing to be
provided at a scale the other three options cannot: for mid-density and high-density neighborhoods where there
is existing multi-family housing stock.
Inclusion of utilities, furnishings, and services for large projects can leverage economies of scale to reduce
living expenses for residents while increasing profitability for owners/developers, particularly when shared
designs also increase density relative to high cost spaces like kitchens.
Size: Individual bedrooms and bathrooms Shared communal kitchen and living room
Target Income Ranges: 10% to 120% AMI
Users:
Providers:
Senior Workforce SingleParent
Traditional Developer
Multi-family Developer
TARGET AUDIENCE
Bridge Meadows intergenerational housingCapital Hill Urban Co-housing, Seattle Co-housing/micro-unit conceptPanoramic, San Francisco

13
4 | ADVANTAGES & CHALLENGES: ADVANTAGES
ADVANTAGESINDIVIDUALSHARED
LIVINGMULTI-FAMILY
SHARED LIVINGNOTESINCREASED
LOT DENSITYMICRO-UNITS
Works for urban and suburbanScalable to different neighborhoods X
X
X
X
X
X
X
X
X
Can create new units without new construction, by adapting existing buildings/homes
Works for new build or renovation or rehabilitation
Incentive for developer to provide efficient systems
Our neighborhoods still have diversity. I can live close to
MARTA, and have one payment for all my
housing costs.
I can increase my income for the same
square footage of housing stock.
I like that a police officer lives next door.
Works with traditional or historical architectural styles
Increases the potential number of providers
Increased profitability (higher rents per sq)
Allows aging in place (mobility, accessibility)
Suits a wide range of existing developer types
Does not require subsidy
Buildings “fit in” with neighbors, thus lessening the stigma of affordable housing
Lowers risk for tenants if utility costs are included
Profitability drives interest from private market,which is critical to scale
14
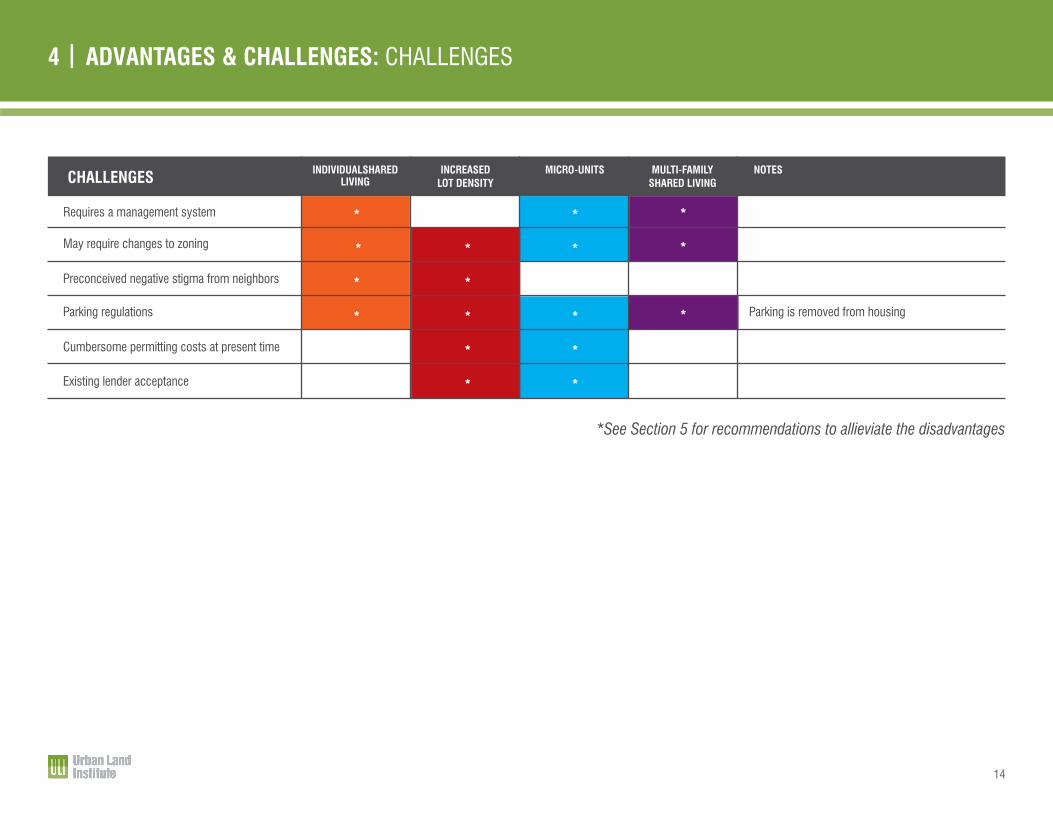
4 | ADVANTAGES & CHALLENGES: CHALLENGES
*See Section 5 for recommendations to allieviate the disadvantages
CHALLENGES INDIVIDUALSHARED LIVING
MULTI-FAMILY SHARED LIVING
NOTESINCREASED LOT DENSITY
MICRO-UNITS
Requires a management system *
*
*
*
*
*
*
X
*
*
*
X
*
*
*
*
*
*
*
*
May require changes to zoning
Preconceived negative stigma from neighbors
Parking regulations Parking is removed from housing
Cumbersome permitting costs at present time
Existing lender acceptance

15
Community support is critical for affordable housing
development, to break down the typical excuses. Preconceptions
and stereotypes are that “affordable housing” will mean an
undesirable effect on property value or quality of life are used to
stop the conversation.
Raising awareness of the proposed product goes hand-in-
hand with challenging the stereotypes of who needs and will use
affordable housing. Just as a photograph and a story allow one
to get to know a real-life individual using “affordable housing,”
putting methods in place to showcase success stories to the
public could be helpful.
5 | RECOMMENDATIONS: AWARENESS
OPPORTUNITY TO EDUCATE
OPPORTUNITY TO EDUCATE
RECOMMENDATION
RECOMMENDATION
Traffic / Parking
Alleviate concerns about Oversight
Many who need affordable housing cannot afford a car, or will not need a car if they live near transit. Transportation can be included in rent (either through bulk ride share value programs or transit passes, both paid for up front by landlord).
Create a two-year long city-wide pilot program for rooming houses and ADU. Program could address management and tenant vetting requirements, ownership requirements, and permitting timelines.
Multiple occupants in one home or facility mean varied work schedules allow someone’s eyes to be on the house and street area at more times of the day.
Provide quarterly tours to highlight success stories and innovations of the pilot program. Seeing a success story makes it tangible.
Homes with more opportunities for income are more valuable for the community. Focus on individual user stories to change perception.
Identify high profile advocates in all neighborhoods, who can answer questions from peers.
Having the option to save money in the short term gives an individual options for different types of housing in the long term.
Identify lenders who are willing to use data from other cities and programs to finance newer product types, and have the list available through housing advocacy groups. Repackage as a wellness, education and income mobility strategy.
Management company/homeowner determines eligibility, not “absentee landlord.”
Over 4 people creates peer pressure to keep all common areas clean and secure, and creates a sense of “onsite” management. Rating systems improves accountability.
Security
Everyone loves a Home Tour!
Perception of Lower Property Values
Socially Active Advocates
Lack of Demand (for alternative product)
Pro-Innovation Lenders
Undesirable Tenants and
Unmanaged/mismanaged Properties

16
Current zoning ordinances generally still reflect a low-density
inner city, and should be updated to progressively plan for the
densification that is already occurring.
Opportunities and Tools which could expand or oversee
private investment, without using regulated or programmized
financial incentives:
5 | RECOMMENDATIONS: POLICY
Decouple Parking From Housing Costs
Make Design Accessible
Incentivize Smaller “Developers”
Redefine Terms
Create a Zoning Overlay District
Jurisdictional Innovations
Increases Types, Sizes, and Locations of Developable Propery
Parking costs eat into the funds available for true housing costs. Suggestions include the following: • Removing on site parking requirement for ADU, • Have a ratio of 1 space per 4 microunits (in lieu of 1 per unit, • Allow management to offer bulk ride share passes as part of parking require-ment.
Escalating property values (without allowing for more creative development) could cause undue burden on a property owner, due to propery taxes. City could consider a property-tax abatement for those who are providing an affordable unit as a rental.
“Roominghouse” and “family” are two common terms that may be associated with specific uses and number of unrelated people. Atlanta’s 1929 definition of “family” was any number of people who cook together as a housekeeping unit (as opposed to limited to 6 unrelated people now), and were only changed as part of previous patterns of racial segregation methods. “Roominghouse” use could be extended to R-4 & R-5 zoning categories.
Overlay would allow for elimination of parking requirement, if the property falls within an area that meets these 3 criteria for distance to and is adequately con-nected to these transportation options: -1 mile of fixed gateway transit, -1/2 of commercial/retail mixed use or other employment center, -1000’ to dedicated bicycle right-of-way,Could also apply new definitions or recommendations for pilot within these over-lay districts to reduce any community opposition.
Regulate the requirements for ownership (i.e. owner must live in one unit, if 2 units on property), terms of leases (i.e. limit the short-term stay in ADU to require minimum 30 day rental). Require property owners to register accessory units with the city and provide lease agreements, so these two items can be monitored.
• Allow ADU in zoning classes below R-5* (or jurisdictional equivalent).• Allow for cottage-court type developments in Residential Zoning categories. • Allow smaller setbacks and adjacencies (requires coordination with building codes for fire safety), which works with quad townhome-style construction as well.
Have pre-approved floor plans available for a low cost through the city, or have fast-track process, which decreases cost associated with time in securing design professional or permitting. Encourages creativity of design professionals.
OPPORTUNITY RECOMMENDATION
* R-5 is City of Atlanta zoning designation for two-family dwellings
17
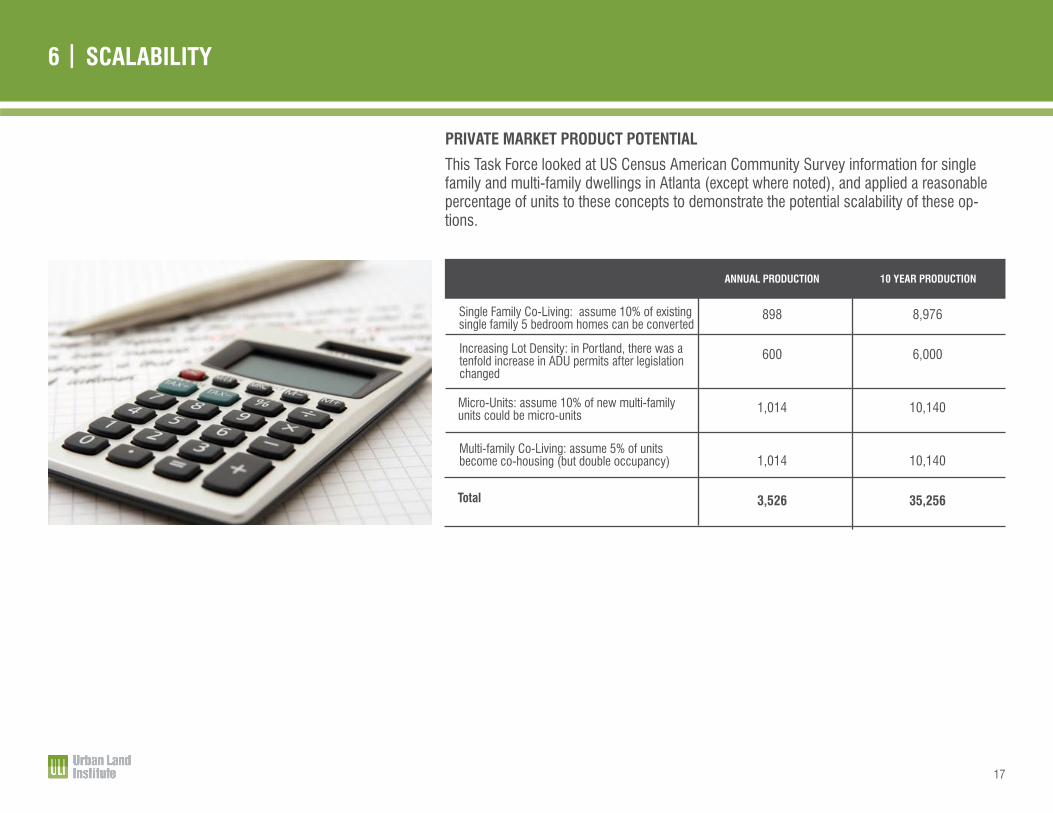
6 | SCALABILITY
ANNUAL PRODUCTION 10 YEAR PRODUCTION
Single Family Co-Living: assume 10% of existing single family 5 bedroom homes can be converted
898
600
1,014
1,014
3,526
8,976
6,000
10,140
10,140
35,256
Increasing Lot Density: in Portland, there was a tenfold increase in ADU permits after legislation changed
Micro-Units: assume 10% of new multi-family units could be micro-units
Multi-family Co-Living: assume 5% of units become co-housing (but double occupancy)
Total
This Task Force looked at US Census American Community Survey information for single family and multi-family dwellings in Atlanta (except where noted), and applied a reasonable percentage of units to these concepts to demonstrate the potential scalability of these op-tions.
PRIVATE MARKET PRODUCT POTENTIAL

18
7 | APPENDIX: CASE STUDIES / RESOURCES
1 | Studies / Resources
• City of Atlanta “Tiny House Feasibility Study,” submitted by Southface, January 6, 2017
• “Affordable Atlanta: Making the Case, Setting a Goal, and Defining Strategies to Meet the Need,” prepared by Bleakly
Advisory Group for ULI Atlanta Liveable Communities Council
• “The Macro View on Micro-Units,” prepared for Urabn Land Institute, May 2015 (contains economic feasibility, sample images and projects)
• www.missingmiddlehousing.org
• www.accessorydwellings.org
• “The Granny Flats are Coming,” CityLab, Mimi Kim. January 16, 2018 2 | Projects
2a | Individual CoLiving • www.padsplit.com 2b | Increasing Density on Single Family Lots • Backdoor Revolution Guide to ADU Development, Kol Peterson 2c | Micro-units • The Harper, Washington, DC: multi-family micro-unit development • Providence Arcade, Providence, RI: conversion of abandoned mall into micro-units • Freedom Center, Portland, OR 2d | Multi-family CoLiving • Lakeclairecohousing.org (Atlanta, GA) • Common (NY, San Fransisco, Chicago) • Ollie (NYC, LA, Jersey City, Boston, Philadelphia)
• Bridge Meadows (not co-housing, but intentional inter-generational community)

19
7 | APPENDIX: SAMPLE PROFORMAS - INDIVIDUAL SHARED LIVING
Operating Budget Comparison of Padsplit versus Traditional Rental Model
Market Rent #1Market Rent #2Market Rent #3Market Rent #4Market Rent #5Market Rent #6Total Monthly Revenue
Acquisition CostEstimated Development & Construction CostHome FurnishingsTotal ImprovementsTotal Capital InvestmentAnnual InsuranceAnnual Property TaxesNet RevenueAnnual Net Yield
PowerWaterCable/InternetMaintenance8% Vacancy AllowanceManagement (if applicable)Total Monthly OperatingExpensesNet Monthly Revenue toOwner% Net Increase in PadSplit Model
$450 Monthly$500 Monthly$550 Monthly$550 Monthly$550 Monthly$600 Monthly
$3,200.00
$300$172$100$225$256$384
$1,437.00
$1,763.00
59%
$120,000
$34,000
$3,600$3,600
$157,600$1,200$2,900
$17,056.1610.82%
$120,000
$34,000
--
$154,000$1,200$2,900
$9,244.166.0%
---
$200$128$160
$488.00
$1,112.00
-
$1,600 Monthly
$1,600.00
PADSPLIT COMPARISON
AVERAGE MONTHLY OPERATING EXPENSES
PADSPLIT MODEL
PADSPLIT MODEL
TRADITIONAL RENTAL PROPERTY
TRADITIONAL RENTAL PROPERTY
Note: Although we’ve assumed similar vacancy rates for each model, based on our field research, homes that rent single rooms around common areas also have lower long-term vacancy costs due to the fact that the homes are rarely completely empty, and therefore carry a lower risk of copper/appliance theft and vandalism, which would increase the long-term yield of the PadSplit home relative to the traditional rental property.

20
Comparing Quad Townhome to traditional intown rebuild 50’ lots
Comparing 4 small duplex condos to traditional intown rebuild
Estimated Development & Construction Cost Per Sqft.Square FootageTotal ImprovementsTotal Capital InvestmentUnit 1 SaleUnit 2 SaleUnit 3 SaleUnit 4 SaleTotal Sale PriceProceeds Less Closing Costs & CommissionsNet RevenueNet Yield
Estimated Development & Construction Cost Per Sqft. Detached GaragesSquare FootageDetached Garages SqftTotal ImprovementsTotal Capital InvestmentTown 1 SaleTown 2 SaleTown 3 SaleUnit 1 SaleUnit 2 SaleUnit 3 SaleTotal Sale PriceProceeds Less Closing Costs & CommissionsNet RevenueNet Yield
Estimated Development & Construction Cost Per Sqft. Detached Surface ParkSquare FootageDetached Surface Park SqftTotal ImprovementsTotal Capital InvestmentCondo 1Condo 2Condo 3Condo 4Condo 5Condo 6Condo 7Condo 8Total Sales PriceProceeds Less Closing Costs & CommissionsNet RevenueNet Yield
$135
2,800$378,000$678,135$225,000$225,000$225,000$225,000$900,000
$828,000
$149,865.0022.10%
$135
$952,520800
$416,200$716,335$150,000$150,000$150,000$150,000$150,000$150,000$900,000
$828,000
$111,665.0015.59%
$135
$257,2001,100
$999,500$1,299,635$215,000$215,000$215,000$215,000$215,000$215,000$215,000$215,000
$1,720,000
$1,582,400
$282,765.0021.76%
$112
2,800$313,600$613,712
$750,000
$690,000
$76,288.0012.4%
$112
2,800
$313,600$613,712
$750,000
$690,000
$76,288.0012.4%
$112
2,800
$313,600$613,712
$750,000
$690,000
$76,288.0012.4%
CAPITAL BUDGET COMPARISON FOR TOWNHOME/COTTAGE MIX 60’ LOT
CAPITAL BUDGET COMPARISON FOR 4 DUPLEXES
QUAD TOWNHOME
TOWNHOME/COTTAGE MIX
SMALL DUPLEX CONDOSTRADITIONAL RE-BUILD
TRADITIONAL RE-BUILD
TRADITIONAL RE-BUILD
7 | APPENDIX: SAMPLE PROFORMAS - SINGLE FAMILY LOTS
Comparing Quad Townhome to traditional intown rebuild 50’ lots CAPITAL BUDGET COMPARISON FOR QUAD TOWNHOME
21
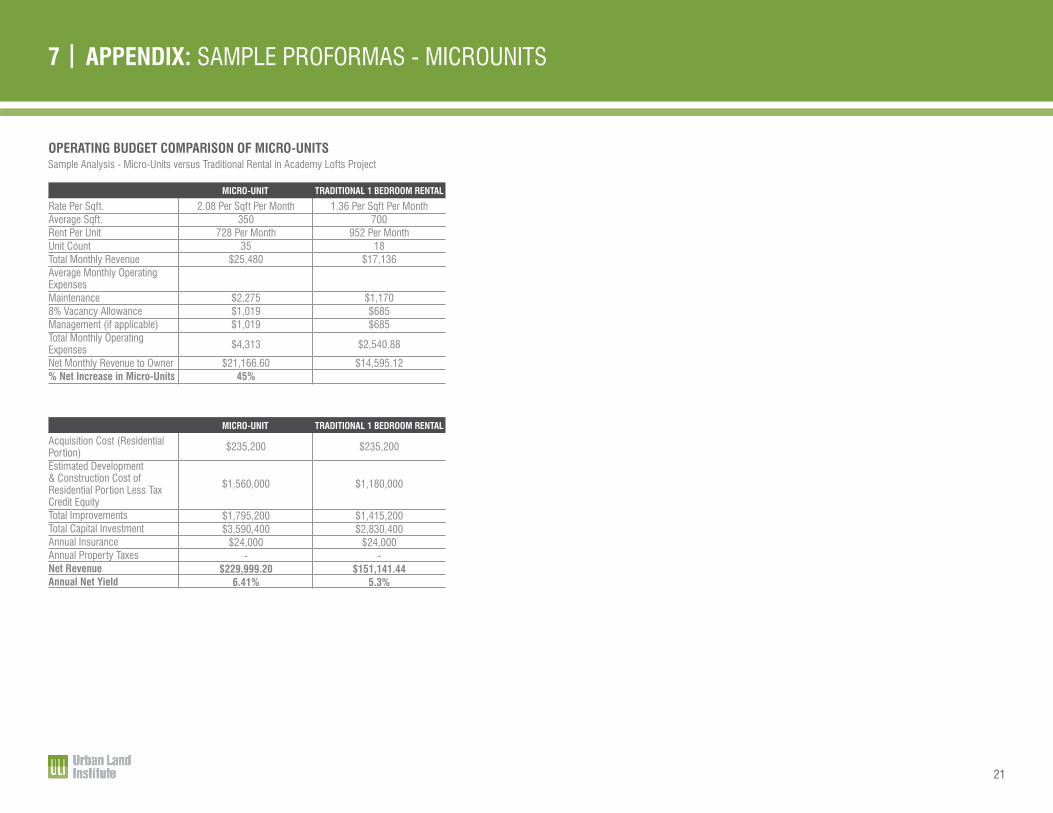
Rate Per Sqft.Average Sqft.Rent Per UnitUnit CountTotal Monthly RevenueAverage Monthly Operating ExpensesMaintenance8% Vacancy AllowanceManagement (if applicable)Total Monthly Operating ExpensesNet Monthly Revenue to Owner% Net Increase in Micro-Units
Acquisition Cost (Residential Portion)Estimated Development & Construction Cost of Residential Portion Less Tax Credit EquityTotal ImprovementsTotal Capital InvestmentAnnual InsuranceAnnual Property TaxesNet RevenueAnnual Net Yield
2.08 Per Sqft Per Month350
728 Per Month35
$25,480
$2,275$1,019$1,019
$4,313
$21,166.6045%
1.36 Per Sqft Per Month700
952 Per Month18
$17,136
$1,170$685$685
$2,540.88
$14,595.12
$235,200
$1,560,000
$1,795,200$3,590,400
$24,000-
$229,999.206.41%
$235,200
$1,180,000
$1,415,200$2,830,400
$24,000-
$151,141.445.3%
MICRO-UNIT
MICRO-UNIT
TRADITIONAL 1 BEDROOM RENTAL
TRADITIONAL 1 BEDROOM RENTAL
7 | APPENDIX: SAMPLE PROFORMAS - MICROUNITS
Sample Analysis - Micro-Units versus Traditional Rental in Academy Lofts ProjectOPERATING BUDGET COMPARISON OF MICRO-UNITS

22
Market Rent #1Market Rent #2Market Rent #3Market Rent #4Total Monthly RevenueAverage Monthly Operating ExpensesPowerWaterCable/InternetMaintenance8% Vacancy AllowanceManagement (if applicable)Total Monthly Operating ExpensesNet Monthly Revenue to Owner% Net Increase in PadSplit/Co-Living Model
Market Rent #1Market Rent #2Market Rent #3Market Rent #4Market Rent #5Total Monthly RevenueAverage Monthly Operating ExpensesPowerWaterCable/InternetMaintenance8% Vacancy AllowanceManagement (if applicable)Total Monthly Operating ExpensesNet Monthly Revenue to Owner% Net Increase in PadSplit/Co-Living Model
Acquisition CostEstimated Development & Construction Cost Home FurnishingsTotal ImprovementsTotal Capital InvestmentAnnual InsuranceAnnual Property TaxesNet RevenueAnnual Net Yield
Acquisition CostEstimated Development & Construction Cost Home FurnishingsTotal ImprovementsTotal Capital InvestmentAnnual InsuranceAnnual Property TaxesNet RevenueAnnual Net Yield
$525 Monthly$525 Monthly$525 Monthly$525 Monthly
$2,100
$165$125$90
$125
$168
$252$925
$1,175
37%
$600 Monthly$600 Monthly$600 Monthly$600 Monthly$600 Monthly
$2,400
$165$125$90
$125$120$288
$913
$1,487
92%
$1,000 Monthly$1,000 Monthly
$2000
$65$80$80
$224.94
$774.94
$1,100 Monthly
$1,100
$65
$88
$88$241$859
$50,000
$2,500
$2,400$2,400
$54,900$1,200$1,010
$11,889.8421.66%
$15,000
$198,450
$3,000$3,000
$216,450$450
$3,983$13,411.32
6.20%
$50,000
$2,500
$52,500$1,200$1,010
$8,097.8415.4%
$15,000
$198,450
$213,450$450
$3,983$4,863.29
2.3%
MULTI-FAMILY CO-LIVING MULTI-FAMILY CO-LIVING
MULTI-FAMILY CO-LIVING MULTI-FAMILY CO-LIVING
TRADITIONAL RENTAL PROPERTY TRADITIONAL RENTAL PROPERTY
TRADITIONAL RENTAL PROPERTY TRADITIONAL RENTAL PROPERTY
7 | APPENDIX: SAMPLE PROFORMAS - MULTI-FAMILY SHARED LIVING
Sample Analysis - Retrofit 4 Bedroom Co-Living versus 3 Bedroom Apartment Sample Analysis - New Construction Using Peachstone Layout versus 2 x 1 Bedroom UnitsOPERATING BUDGET COMPARISON OF MULTI-FAMILY CO-LIVING OPERATING BUDGET COMPARISON OF MULTI-FAMILY CO-LIVING

23
7 | APPENDIX: CONTRIBUTORS
Sarah Kirsch
Daphne Bond Godfrey
Emily Lewis and Sarah Butler
Michael Pfaff and Hayley Gibson
Sarah Butler
Atticus LeBlanc
Malory Atkinson
Hal Bolton
Nathan Brown
Heather Hussey-Coker
John Crane
Dorian DeBarr
Todd Flaman
Steve Foster
Josh Gately
Jonathan Gelber
Inga Harmon
Kenwin Hayes
Jack Hinrichs
Derrick Holland
Executive Director
Director
Praxis3 Architecture
Dwell Design Studios
Praxis3 Architecture
PadSplit, Inc.
Shear Structural
Niles Bolton
Planner
Beltline, Inc.
Building Insights
Decide Dekalb
Patterson Advisory Group
Georgia Power
Portman Holdings
Bleakly Advisory
Harmon & Harmon Realtors
ReUrbanis
Oxford Properties
Trinity Development
3 | URBAN LAND INSTITUTE (ULI Atlanta)
4 | GRAPHICS / EDITING
1 | COMMITTEE CHAIRS
2 | WORKING GROUPS / RESEARCHDan Reuter
Ade Sanusi
Monica Scott
Jay Silverman
Nicole Skeekely
Ben Skidmore
Bill Sweeney
Darrell Thomas
John Tirrill
Reuter Strategy
Integral
Berkshire Hathway
Dwell Design Studios
Smith Dalia Architects
Kimley Horn
Midcity Asset Management, LLC
Atlanta Housing
swh Partners
Will Johnston
Rob Jordan
Brian Keida, CPA
Ben King
Taylor Morrison
Caleb Racicot
MicroLife Institute
Collier International
Crowe Horwath
Columbia Residential
Council for Quality Growth
TSWStock Images, where not cited, from Pexel.com
copyright 2018