1
TO DOWNLOAD A COPY OF THIS POSTER, VISIT WWW.WATERS.COM/POSTERS ©2014 Waters Corporation INTRODUCTION We have developed a highly compact single quadrupole mass spectrometer, the Acquity QDa, which is designed to lower the barrier for adoption of MS technology into a variety of disciplines. Its small physical footprint allows it to be directly incorporated into a UPLC chromatography stack. Significant attention has been paid to reduce the complexity of operating the instrument, particularly the ion source (to ensure that even novice users can obtain good quality data) and the software interface (to be intuitive to users of optical detectors). DESIGN AND PERFORMANCE OF A HIGHLY COMPACT SINGLE QUADRUPOLE MASS SPECTROMETER Daniel Kenny, John Pugh, Dave Gordon, Richard Moulds, Kate Whyatt, Marcus Dawber, Ian Trivett, Howard Read Waters Corporation, Stamford Avenue, Altrincham Road, Wilmslow, Cheshire, SK9 4AX, UK RESULTS Sensitivity To demonstrate the high level of sensitivity available on the EP variant as well as the relative difference to the SP variant, a standard Reserpine sensitivity test was performed on both. An Acquity H-Class was used at 0.4mL/min with a 5μL injection of 200fg/μL Reserpine to give 1pg on column. The QDa was operated in SIR mode with the QMF set to transmit m/z 609.3 at a data rate of 5Hz. Chromatographic peak width was approximately 1.4 sec (FWHM). CONCLUSION A compact single quadrupole mass spectrometer with performance characteristics that rivals that of conventional instruments. Footprint allows the direct integration of the mass spectrometer into a UPLC chromatography stack. Designed with ease-of-use as a primary goal to allow even novice users to acquire good quality data. Figure 1. Comparison of the physical footprint of the new com- pact MS (Acquity QDa—Left) to a traditional single quadrupole MS (Acquity SQD2—right). 8” 1414” Acquity QDa Acquity SQD 2 DESIGN Footprint To reduce size and weight, a small splitflow turbo pump combined with a small backing pump have been used to pump the three vacuum regions. There are two backing pump configurations; the Standard Performance (SP) variant utilizes a diaphragm pump which integrates directly onto the rear of the QDa, whereas the Enhanced Performance (EP) variant uses a very small rotary pump. The low pumping speed of the backing and turbo pumps compared with those normally found on conventional mass spectrometers consequently reduces the size of the orifices that may be used between the vacuum regions, which in turn results in a significant loss of sensitivity. To aid in the recovery of this loss of sensitivity, a StepWave-type ion guide has been included in the first vacuum region - a strategy normally used on very high-end instruments to obtain ultimate sensitivity. The off-axis nature of the first ion guide also helps reduce contamination on the first differential aperture, and so improves instrument robustness. StepWave 1st Ion Guide Quadrupole Mass Filter Quadrupole 2nd Ion Guide HV Dynode/ Photomultiplier Z-Spray ESI Source Figure 2. Cross section of the Acquity QDa Figure 4. Construction of the composite sample cone. Quadrupole Mass Filter To fit into the small instrument footprint, the physical size of the quadrupole mass filter (QMF) has been reduced from that of our standard quadrupole. This reduction has resulted in us- ing the same quantity of Molybdenum for all four rods that was previously required for a single rod. The reduction to an r 0 of approximately 3.5mm has also allowed a reduction in the size of the RF generator. The loss of resolution associated with shortening the QMF to less than 90mm has been balanced by an increase in the RF frequency to approximately 1.2MHz. Be- cause of this, it is still possible to obtain isotopic resolution at scan speeds of 10,000 amu/sec. Figure 5. Comparison of the new small quadrupole compared with the standard quadrupole. Ion Source The electrospray ion source has been optimised for flow rates between 200μL/min to 2 mL/min. By targeting typical UPLC flow rates, it has been possible to develop an ion source with a fixed, optimized geometry, and fixed, optimized gas flows so that there is no tuning required by the user. Figure 3. 3D views of the fixed geometry ESI source. Sample Cone The use of small backing pumps requires a small orifice (approx. 100—200 μm diameter) in the sample cone. To avoid build up of material which could block the cone, the orifice has been moved from the apex of the cone and is now shielded at the end of a short tunnel preventing any direct line-of-sight to the ESI plume. This also makes the cone robust when accidently dropped! It has also allowed a novel construction which allows the small orifice disk to be an inexpensive disposable item. Linearity Where the QDa is used in tandem with an optical/UV detector, UV data are expected to remain the primary focus for quantification. MS data may be used to either confirm the primary UV quantification data (where relative sensitivity is similar) or to supplement the overall dynamic range (where MS is more sensitive and the concentrations are below the LOQ of the UV data). For impurity analysis, MS data may be used to quantify low-level impurity components and the main component in the same chromatographic run. These scenarios require a wide detector dynamic range. To demonstrate the linearity of response that is possible from the QDa, SIR data were acquired over 4 orders of sample concentration for Sulfadimethoxine (SDM). Figure 6. Chromatographic sensitivity for 1pg of Reserpine on column. Top: QDa SP, Bottom: QDa EP. Robustness To highlight the high level of robustness that is possible with the novel sample cone design, a long-term study of repeated injections was performed. A 10% solution of white wine was spiked with Simazine to a level of 100pg/μL. This was subsequently diluted to the equivalent of the maximum residual level (MRL) of 10pg/μl. Wine is a realistic matrix and is particularly challenging due to the high sugar content which can rapidly coat electrode surfaces and lead to charging problems. Despite this the QDa was able to acquire data for >80 hours for 1500 injections. No single acquisition was beyond 15% of the mean value (red lines in figure 8) and the overall RSD was 4.8%. Scanning & Polarity Switching in UPLC Timescales For qualitative analysis it is necessary to acquire data in full scan mode to determine the mass of components eluting from the column. Furthermore, it is desirable to be able to rapidly swap the polarity of the mass spectrometer during an analysis to obtain the broadest compound coverage. To demonstrate how the QDa is able to obtain scanning data across the whole mass range in both polarities (at a polarity switching speed of 25 msec) whilst maintaining sufficient data points across the chromatographic peak, a chromatographic separation of a mix of 11 compounds (Acrylamide, 4-Acetaminophen, Carbofuran, SDM, Val-Tyr-Val, Verapamil, Leu Enk, Reserpine, Erythromycin, Tilmicosin and Cyclosporin A) was performed using a sample concentration of 500pg/μL except for Verapamil (125 pg/μL) and SDM (250pg/μL). Figure 7. Linear dynamic range for SDM. Blue: QDa SP, Red: QDa EP. QDa (EP) QDa (SP) Figure 8. Chromatographic peak area for 1500 injections of Si- mazine spiked into white wine. Red lines: 15%, Green lines: 5% from mean. Figure 8. Top: Combined positive and negative ion mass spec- tra across the whole chromatographic separation. Bottom: Ex- tracted Mass chromatograms. ESI +ve ESI -ve Acetaminophen SDM Verapamil Leu Enk (+ve) Reserpine Leu Enk (-ve) QDa (SP) QDa (EP)

DESIGN AND PERFORMANCE OF A HIGHLY COMPACT …

  • Upload
    others

  • View
    1

  • Download
    0

Embed Size (px)

Citation preview

TO DOWNLOAD A COPY OF THIS POSTER, VISIT WWW.WATERS.COM/POSTERS ©2014 Waters Corporation

INTRODUCTION We have developed a highly compact single quadrupole mass spectrometer, the Acquity QDa, which is designed to lower the barrier for adoption of MS technology into a variety of disciplines. Its small physical footprint allows it to be directly incorporated into a UPLC chromatography stack. Significant attention has been paid to reduce the complexity of operating the instrument, particularly the ion source (to ensure that even novice users can obtain good quality data) and the software interface (to be intuitive to users of optical detectors).

DESIGN AND PERFORMANCE OF A HIGHLY COMPACT SINGLE QUADRUPOLE MASS SPECTROMETER Daniel Kenny, John Pugh, Dave Gordon, Richard Moulds, Kate Whyatt, Marcus Dawber, Ian Trivett, Howard Read Waters Corporation, Stamford Avenue, Altrincham Road, Wilmslow, Cheshire, SK9 4AX, UK

RESULTS Sensitivity To demonstrate the high level of sensitivity available on the EP variant as well as the relative difference to the SP variant, a standard Reserpine sensitivity test was performed on both. An Acquity H-Class was used at 0.4mL/min with a 5µL injection of 200fg/µL Reserpine to give 1pg on column. The QDa was operated in SIR mode with the QMF set to transmit m/z 609.3 at a data rate of 5Hz. Chromatographic peak width was approximately 1.4 sec (FWHM).

CONCLUSION A compact single quadrupole mass spectrometer

with performance characteristics that rivals that of conventional instruments.

Footprint allows the direct integration of the mass spectrometer into a UPLC chromatography stack.

Designed with ease-of-use as a primary goal to allow even novice users to acquire good quality data.

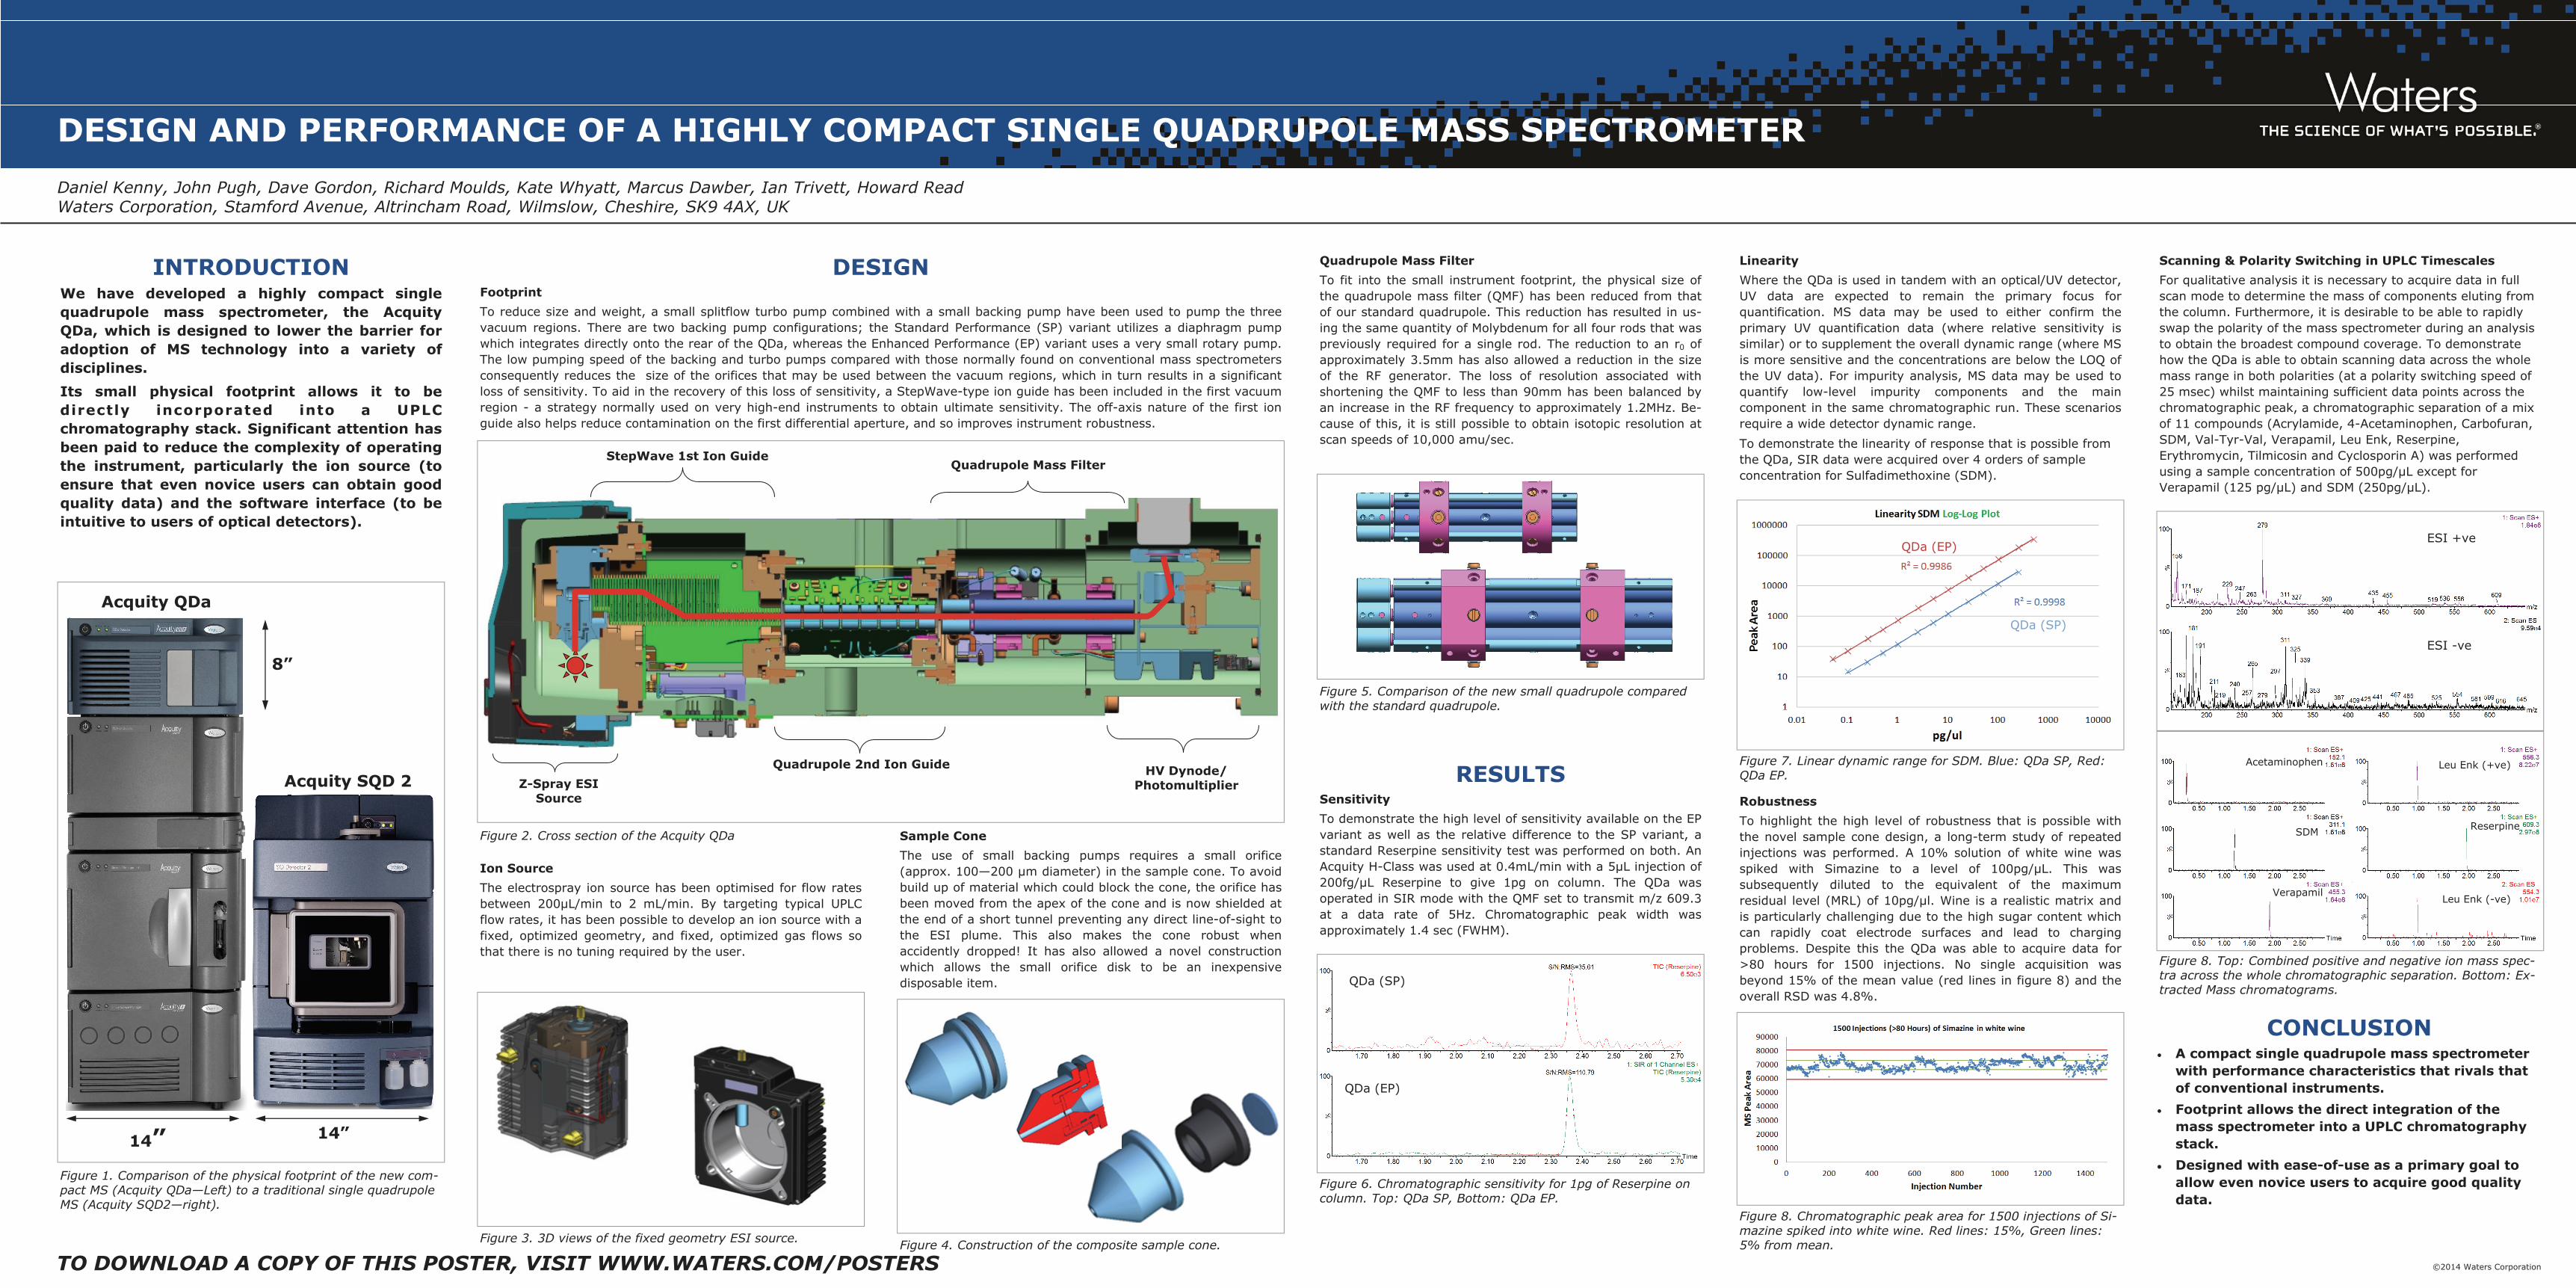
Figure 1. Comparison of the physical footprint of the new com-pact MS (Acquity QDa—Left) to a traditional single quadrupole MS (Acquity SQD2—right).

8”

14” 14”

Acquity QDa

Acquity SQD 2

DESIGN Footprint To reduce size and weight, a small splitflow turbo pump combined with a small backing pump have been used to pump the three vacuum regions. There are two backing pump configurations; the Standard Performance (SP) variant utilizes a diaphragm pump which integrates directly onto the rear of the QDa, whereas the Enhanced Performance (EP) variant uses a very small rotary pump. The low pumping speed of the backing and turbo pumps compared with those normally found on conventional mass spectrometers consequently reduces the size of the orifices that may be used between the vacuum regions, which in turn results in a significant loss of sensitivity. To aid in the recovery of this loss of sensitivity, a StepWave-type ion guide has been included in the first vacuum region - a strategy normally used on very high-end instruments to obtain ultimate sensitivity. The off-axis nature of the first ion guide also helps reduce contamination on the first differential aperture, and so improves instrument robustness.

StepWave 1st Ion Guide Quadrupole Mass Filter

Quadrupole 2nd Ion Guide HV Dynode/Photomultiplier Z-Spray ESI

Source

Figure 2. Cross section of the Acquity QDa

Figure 4. Construction of the composite sample cone.

Quadrupole Mass Filter To fit into the small instrument footprint, the physical size of the quadrupole mass filter (QMF) has been reduced from that of our standard quadrupole. This reduction has resulted in us-ing the same quantity of Molybdenum for all four rods that was previously required for a single rod. The reduction to an r0 of approximately 3.5mm has also allowed a reduction in the size of the RF generator. The loss of resolution associated with shortening the QMF to less than 90mm has been balanced by an increase in the RF frequency to approximately 1.2MHz. Be-cause of this, it is still possible to obtain isotopic resolution at scan speeds of 10,000 amu/sec.

Figure 5. Comparison of the new small quadrupole compared with the standard quadrupole.

Ion Source The electrospray ion source has been optimised for flow rates between 200µL/min to 2 mL/min. By targeting typical UPLC flow rates, it has been possible to develop an ion source with a fixed, optimized geometry, and fixed, optimized gas flows so that there is no tuning required by the user.

Figure 3. 3D views of the fixed geometry ESI source.

Sample Cone The use of small backing pumps requires a small orifice (approx. 100—200 µm diameter) in the sample cone. To avoid build up of material which could block the cone, the orifice has been moved from the apex of the cone and is now shielded at the end of a short tunnel preventing any direct line-of-sight to the ESI plume. This also makes the cone robust when accidently dropped! It has also allowed a novel construction which allows the small orifice disk to be an inexpensive disposable item.

Linearity Where the QDa is used in tandem with an optical/UV detector, UV data are expected to remain the primary focus for quantification. MS data may be used to either confirm the primary UV quantification data (where relative sensitivity is similar) or to supplement the overall dynamic range (where MS is more sensitive and the concentrations are below the LOQ of the UV data). For impurity analysis, MS data may be used to quantify low-level impurity components and the main component in the same chromatographic run. These scenarios require a wide detector dynamic range. To demonstrate the linearity of response that is possible from the QDa, SIR data were acquired over 4 orders of sample concentration for Sulfadimethoxine (SDM).

Figure 6. Chromatographic sensitivity for 1pg of Reserpine on column. Top: QDa SP, Bottom: QDa EP.

Robustness To highlight the high level of robustness that is possible with the novel sample cone design, a long-term study of repeated injections was performed. A 10% solution of white wine was spiked with Simazine to a level of 100pg/µL. This was subsequently diluted to the equivalent of the maximum residual level (MRL) of 10pg/µl. Wine is a realistic matrix and is particularly challenging due to the high sugar content which can rapidly coat electrode surfaces and lead to charging problems. Despite this the QDa was able to acquire data for >80 hours for 1500 injections. No single acquisition was beyond 15% of the mean value (red lines in figure 8) and the overall RSD was 4.8%.

Scanning & Polarity Switching in UPLC Timescales For qualitative analysis it is necessary to acquire data in full scan mode to determine the mass of components eluting from the column. Furthermore, it is desirable to be able to rapidly swap the polarity of the mass spectrometer during an analysis to obtain the broadest compound coverage. To demonstrate how the QDa is able to obtain scanning data across the whole mass range in both polarities (at a polarity switching speed of 25 msec) whilst maintaining sufficient data points across the chromatographic peak, a chromatographic separation of a mix of 11 compounds (Acrylamide, 4-Acetaminophen, Carbofuran, SDM, Val-Tyr-Val, Verapamil, Leu Enk, Reserpine, Erythromycin, Tilmicosin and Cyclosporin A) was performed using a sample concentration of 500pg/µL except for Verapamil (125 pg/µL) and SDM (250pg/µL).

Figure 7. Linear dynamic range for SDM. Blue: QDa SP, Red: QDa EP.

QDa (EP)

QDa (SP)

Figure 8. Chromatographic peak area for 1500 injections of Si-mazine spiked into white wine. Red lines: 15%, Green lines: 5% from mean.

Figure 8. Top: Combined positive and negative ion mass spec-tra across the whole chromatographic separation. Bottom: Ex-tracted Mass chromatograms.

ESI +ve

ESI -ve

Acetaminophen

SDM

Verapamil

Leu Enk (+ve)

Reserpine

Leu Enk (-ve)

QDa (SP)

QDa (EP)