Embed Size (px)
Citation preview

The 6th International Supercritical CO2 Power Cycles Symposium March 27 - 29, 2018, Pittsburgh, Pennsylvania
Design and Performance Characterization of a Micro-pin fin sCO2 Recuperator
C. Naderi Graduate Student Department of Mechanical and Aerospace Engineering University of California, Davis Davis, CA 95616
E. Rasouli Post-doctoral Scholar Department of Mechanical and Aerospace Engineering University of California, Davis Davis, CA 95616
V. Narayanan* Professor Department of Mechanical and Aerospace Engineering University of California, Davis Davis, CA 95616
ABSTRACT Design, fabrication, and thermal-fluidic characterization of a compact three-layered recuperator unit cell (RUC) is presented in this study. The supercritical carbon dioxide (sCO2) streams flow through microscale pin arrays on the hot and cold sides. A detailed design using Computational fluid dynamics (CFD) and structural analysis simulations is then performed to develop a final design of the RUC. An experimental facility is assembled to characterize the thermal-fluidic performance of the RUC. Results indicate that effectiveness of 90 percent or higher can be achieved at low approach temperatures. The correlation-based model predicts the overall heat transfer coefficient to within 20 percent of the experimental data. Based on the performance of the RUC, preliminary scaling estimates for a multiple-unit cell recuperator is also provided. INTRODUCTION The sCO2 cycle is a Brayton cycle that can result in high cycle efficiency for moderate fluid temperatures. Advantages include compactness of turbomachinery, simpler controls and high efficiency at moderate temperatures. Several researchers are investigating use of this power cycle with varied sources such as fossil, solar, nuclear, geothermal, and moderate-to high-quality waste heat streams [1]. Because the temperature drop across the turbine is fairly low in sCO2 cycles, heat recuperation is a key to high cycle efficiency. A very high effectiveness recuperator design is essential to the high cycle efficiency. However, the approach temperatures of the fluid streams are low and hence these recuperators tend to be large for high effectiveness. Moreover, due to the high pressure, differential pressure and temperatures, the recuperators often have to be fabricated of expensive nickel superalloys. The motivation behind this work is to develop a high effectiveness, compact recuperator using microchannel technology. Microchannels are used for process intensification whenever heat and/or mass transport is diffusion limited [2-3]. For laminar flows, the time for heat/species diffusion to occur scales as the square of the channel hydraulic diameter, 2
d h ft D∝ α where αf is the heat/species diffusivity. So long as the residence time of the fluid within the channel, res mt x u∝ ∆ , is on the order of the diffusion time, heat/species can be transferred from the walls to the fluid within the channel. Therefore, the required channel length, ∆x, can be as small as ( )2
h mx D u∆ ∝ α , enabling compact devices. Over the past three decades, a significant body of literature has emerged on fundamental thermal-fluidic aspects of microchannels. Microchannels have been used in several applications such as heat sink thermal management, compact heat and mass exchangers and chemical reactors [2-9].

In the context of recuperators for nuclear reactors and sCO2 power cycles, compact heat exchangers have been designed by companies like Heatric and others [10-14]. These “printed circuit heat exchangers” are fabricated by photochemical machining (etching) and diffusion bonding. The channels are typically 1 mm in width and 0.5 mm in depth. In this paper, a different microscale architecture for the recuperator is presented using the principles of scaling afforded in microscale devices. This approach involves short heat exchange channels or “unit cells” where heat exchange occurs. The unit cells are connected together using distributed headers. The capacity of the recuperator is obtained through “numbering up” of the unit cells. A key advantage of such an architecture lies in reduced pressure drop for the same heat exchange rate as compared to traditional compact heat exchanger designs. Figure 1a shows an example of a multiple unit cell architecture for a recuperator. The blue and red streams are respectively the cold and hot streams through the recuperator. The Figure 1b shows the detail of fluid paths in the recuperator. A unit cell consists of hot and cold heat exchanger paths around pin fins. A pin fin architecture is used for the microscale regions since it lends to higher heat transfer rate and better flow distribution than parallel microchannels [15, 16].
(a)
(b) Figure 1. (a) A 3D model of a multiple unit cell recuperator consisting of multiple parallel counter flow micro-pin-fin passages, (b) detail of a sub-section of the recuperator in (a) showing 5 unit cell heat exchanger layers connected by circular headers
Figure 1b shows an example of a recuperator unit cell (RUC) with five unit cell layers of hot and cold streams. Fluid is brought into each layer via circular headers. The circular headers are connected to larger headers at the top and bottom as shown in Fig. 1a. The sub-section of the recuperator in Figure 1b is scaled laterally as shown in Figure 1a and the top and bottom headers are used to connect the sub-sections together. The thermal rating of the device can be increased by either increasing the number of vertically-stacked layers in each RUC, or by increasing the number of RUCs laterally. In this paper, design and experiments on a small-scale three-layer RUC is presented. RUC DESIGN The pin array on the shims was to be manufactured using chemical etching. Due to the limitations of chemical etching, for a given pin height, the closest edge-to-edge distance of the pins from one another, Dcut, is equal to 2rcut, where rcut is the depth of the cut. Pin height was chosen based on a balance between low pressure drop (with higher aspect ratio pins) and the degradation of pin fin efficiency with fin height. To fabricate the pin array, half of the pin depth was etched onto two opposing shim faces to acquire the desired height. The pitch between the pins was then decided through the structural analysis of different iterations. A staggered pin arrangement was chosen due to its superior heat transfer qualities compared to an in-line pattern. The spacing of the staggered pattern was chosen to be an equilateral arrangement, which would make the stress distribution more uniform. The pin diameter and height were chosen to be 700µm and 500µm, respectively. The transverse pitch, ST, was 1200 µm while the longitudinal pitch, SL, was 1040 µm. The low aspect ratio of the design, caused by the limitation of the chemical etching method, precluded existence of vortex shedding in the pin array [17]. Other fabrication designs, such as wire electric discharge machining, could be used in the future to generate higher aspect ratio designs.

In order to distribute flow uniformly within the pin array, a gradual tapered path from the inlet and to the exit, along with Flow Distribution Structures (FDS) were added. Figure 2 shows the tapered entrance of the pin array and the flow distribution structures. Using ANSYS Static Structural and FLUENT, a process of trial and error was used to find suitable spacing and orientations for the FDSs.
(a) (b)
Figure 2. (a) Non-uniformly spaced Flow Distribution Structures (picture rotated clockwise by 90 degrees to aid visualization of FDS spacing), (b) 3-D view of Flow Distribution Structure and layer inlet
The hot and cold layers were arranged in a counter-flow configuration, similar to that seen in typical plate-type heat exchangers as shown in Figure 3. Structural analysis was accomplished using ANSYS Mechanical APDL on two different domains shown in Figure 3. The computational domain of the shims included only the portion of the shims closest to the headers due to negligible stress concentrations elsewhere along the length of the pin array. The first domain was comprised of shims that formed an inner unit cell of the heat exchanger; such sections were only exposed to atmospheric pressure around their perimeters. The second domain represents a channel at the top and bottom of the heat exchanger that are fully exposed to the atmosphere. It is important to note that the thickness between the outer most microchannels and the atmosphere was 3mm, compared to only 1mm between two sequential microchannels. This increased thickness was to account for the relatively large pressure difference between the outer channels and atmosphere.
Figure 3. Exploded view of RUC details the pressures each channel would be subjected to along with the location of both test sections used for structural analysis Faces on the top, bottom, and side cross-sectional walls, along with the cut face of the pins were all assumed to be symmetrical in the simulations. The inner channels in both test sections were simulated at

a pressure of 200 bar while the outer channels were simulated at 100 bar. Additionally, atmospheric walls were subjected to 1 bar of pressure. The material used in the simulations is Stainless Steel 316 which exhibits a yield strength of ~200MPa at 400˚C [18]. Note that when used in the sCO2 power cycle, the temperatures experienced would be on the order of 550 ˚C, necessitating the use of nickel superalloys for fabrication. SS316 was used instead due to ease of fabrication and pressure and temperature limitations of test facility. Simulation results show a maximum stress of 83 MPa in the inner section of the heat exchanger and 129 MPa in the end section, both of which fall below the yield strength of the material. Upon completion of the structural design, computational fluid dynamics (CFD) simulations were performed to determine the flow distribution within each layer. To accomplish this, a single channel volume was modeled using ANSYS FLUENT. Boundary conditions associated with the simulation included ~0.126 m/s uniform velocity for the inlet (calculated using the area of the opening into the microchannel, mass flow rate, and fluid density) pressure outlet designation at the exit, no-slip conditions at all walls, and fluid properties corresponding to sCO2 at 75 ˚C. A k-epsilon model was used to model turbulence. Results of the simulation are presented as a plot of the velocity magnitude at the center of the pin array, as shown in Figure 4. Average velocity magnitude between the pins was found to be roughly 0.140 m/s with a maximum deviation from this value of about 0.01 m/s. This corresponded to ~7% maximum deviation of velocity magnitude from the average, which was deemed as an acceptable level of uniform flow across the width of the channel.
Figure 4. Flow velocity magnitude where the x-axis from left to right corresponds to location along the raked line from top to bottom. Peaks in the graph represent flow between pins while sections of zero velocity magnitude indicate that the line has raked over a pin.
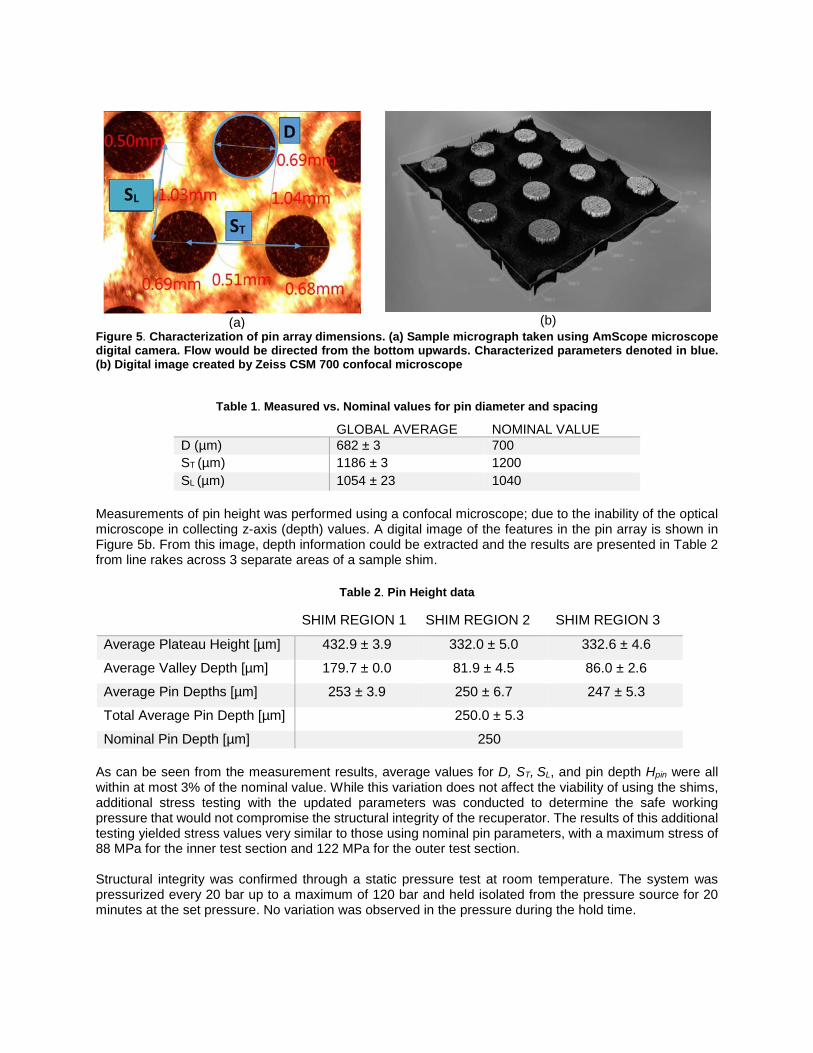
RUC FABRICATION AND CHARACTERIZATION The chemically etched plates were first characterized and then diffusion bonded. Tubes were brazed to the inlet and exits of the two fluid streams. To characterize pin diameter and spacing, images of several locations across different shims were taken using an AmScope digital camera mounted on the Olympus microscope. Parameters of interest were then measured using AmScope software that had been calibrated with an optical calibration grid (Edmund 1951 USAF Glass Slide Resolution Target). An example of the microscopic images can be seen in Figure 5a, with global averaged values shown in Table 1.
(a)
(b)
Figure 5. Characterization of pin array dimensions. (a) Sample micrograph taken using AmScope microscope digital camera. Flow would be directed from the bottom upwards. Characterized parameters denoted in blue. (b) Digital image created by Zeiss CSM 700 confocal microscope
Table 1. Measured vs. Nominal values for pin diameter and spacing
GLOBAL AVERAGE NOMINAL VALUE D (µm) 682 ± 3 700 ST (µm) 1186 ± 3 1200 SL (µm) 1054 ± 23 1040
Measurements of pin height was performed using a confocal microscope; due to the inability of the optical microscope in collecting z-axis (depth) values. A digital image of the features in the pin array is shown in Figure 5b. From this image, depth information could be extracted and the results are presented in Table 2 from line rakes across 3 separate areas of a sample shim.
Table 2. Pin Height data
As can be seen from the measurement results, average values for D, ST, SL, and pin depth Hpin were all within at most 3% of the nominal value. While this variation does not affect the viability of using the shims, additional stress testing with the updated parameters was conducted to determine the safe working pressure that would not compromise the structural integrity of the recuperator. The results of this additional testing yielded stress values very similar to those using nominal pin parameters, with a maximum stress of 88 MPa for the inner test section and 122 MPa for the outer test section. Structural integrity was confirmed through a static pressure test at room temperature. The system was pressurized every 20 bar up to a maximum of 120 bar and held isolated from the pressure source for 20 minutes at the set pressure. No variation was observed in the pressure during the hold time.
SHIM REGION 1 SHIM REGION 2 SHIM REGION 3
Average Plateau Height [µm] 432.9 ± 3.9 332.0 ± 5.0 332.6 ± 4.6
Average Valley Depth [µm] 179.7 ± 0.0 81.9 ± 4.5 86.0 ± 2.6
Average Pin Depths [µm] 253 ± 3.9 250 ± 6.7 247 ± 5.3
Total Average Pin Depth [µm] 250.0 ± 5.3
Nominal Pin Depth [µm] 250

EXPERIMENTAL FACILITY
Figure 6. Simplified schematic of the test loop. Captions indicate state of CO2 at every major point along the loop.
A schematic of the test facility is shown in Figure 6. The CO2 was provided by a source cylinder in a liquid phase at ~64 bar and 23 ˚C. The fluid was filled into a reservoir comprised of a 3785 mL sampling cylinder that was concentrically housed inside a clear PVC pipe that served as a cooling jacket. The jacket provided a constant flow of 5 ˚C chilled water that surrounded the cylinder and cooled the CO2 inside down to near 5 ˚C. From the reservoir, the liquid phase CO2 was sent to the HPLC pump where it was pressurized between 80-90 bar and pumped at the user specified flow rate. The pressure data downstream of the pump was collected via a signal output by the pump, and a thermocouple read the temperature of the CO2 after the pump head. The line between the reservoir and pump also contained a pressure relief valve (PRV1) that was specified to relieve pressure in the line if the pressure in the reservoir exceeded 103 bar. The liquid CO2 was then split into two streams. Needle valves NV1 and NV2 regulated the flow of each stream before they entered the hot oil bath. Coriolis mass flow meters (Micro Motion CMF010H Mass Flow Meter) were used to monitor the mass flow rate of each stream. The streams then entered the hot oil bath, which was set to a user specified temperature. Differences in coil length for the two streams resulted in the temperature difference that defined the hot and cold streams entering the RUC. Temperatures at the outlet of the oil bath of each stream were also monitored. It was at this stage in the process, at the outlet of the hot oil bath, that the liquid CO2 exceeded the 73.8 bar/31 ˚C critical point and entered a supercritical state. Once the CO2 had been heated to a supercritical state, both streams entered the RUC. Temperatures were taken of the inlet and outlet sides of both streams. The differential pressure across the hot and cold channels was also measured using Validyne DP15 differential pressure transducers. Once the two streams exited the RUC, they were combined together and entered a forward pressure regulator. After being regulated down in pressure, the carbon dioxide went through a cooling coil that was submerged in a container of continuously refreshing tap water. The liquid carbon dioxide then exited the condenser and flowed through a check valve used to prevent potential issues with backward flow in the system. All sensors (namely: thermocouples, gauge pressure transducers, differential pressure transducers, and
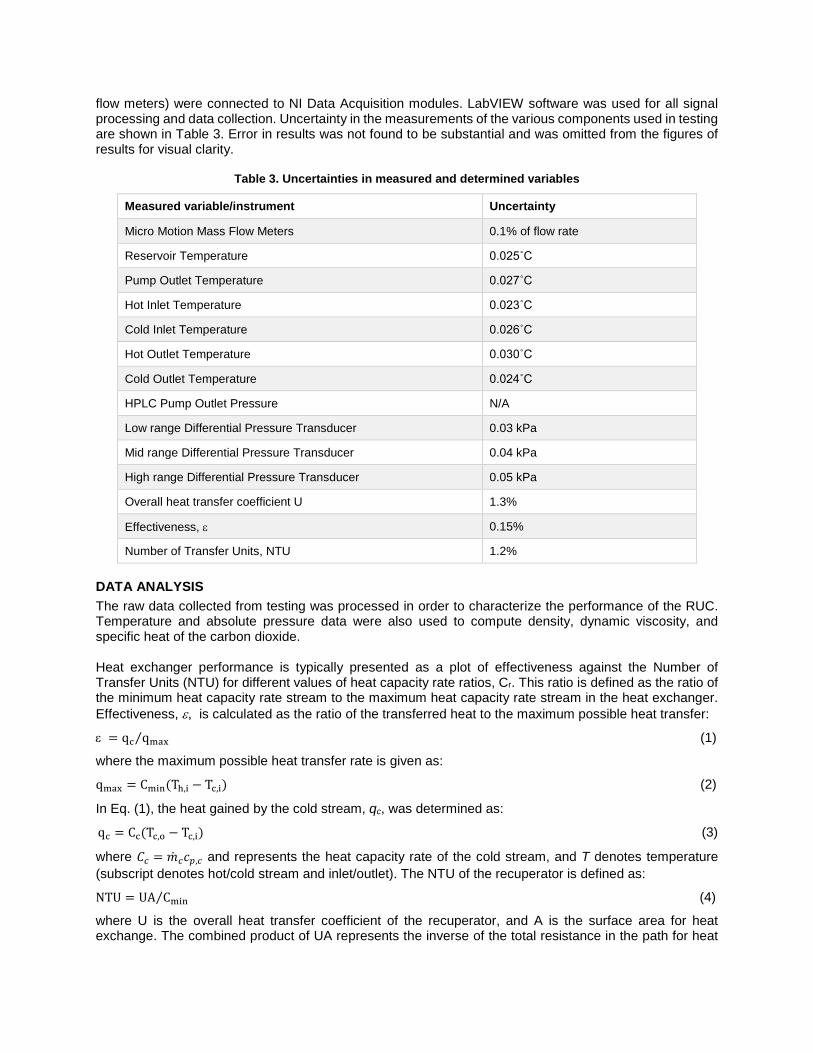
flow meters) were connected to NI Data Acquisition modules. LabVIEW software was used for all signal processing and data collection. Uncertainty in the measurements of the various components used in testing are shown in Table 3. Error in results was not found to be substantial and was omitted from the figures of results for visual clarity.
Table 3. Uncertainties in measured and determined variables
Measured variable/instrument Uncertainty
Micro Motion Mass Flow Meters 0.1% of flow rate
Reservoir Temperature 0.025˚C
Pump Outlet Temperature 0.027˚C
Hot Inlet Temperature 0.023˚C
Cold Inlet Temperature 0.026˚C
Hot Outlet Temperature 0.030˚C
Cold Outlet Temperature 0.024˚C
HPLC Pump Outlet Pressure N/A
Low range Differential Pressure Transducer 0.03 kPa
Mid range Differential Pressure Transducer 0.04 kPa
High range Differential Pressure Transducer 0.05 kPa
Overall heat transfer coefficient U 1.3%
Effectiveness, ε 0.15%
Number of Transfer Units, NTU 1.2%
DATA ANALYSIS The raw data collected from testing was processed in order to characterize the performance of the RUC. Temperature and absolute pressure data were also used to compute density, dynamic viscosity, and specific heat of the carbon dioxide. Heat exchanger performance is typically presented as a plot of effectiveness against the Number of Transfer Units (NTU) for different values of heat capacity rate ratios, Cr. This ratio is defined as the ratio of the minimum heat capacity rate stream to the maximum heat capacity rate stream in the heat exchanger. Effectiveness, ε, is calculated as the ratio of the transferred heat to the maximum possible heat transfer:
ε = qc qmax⁄ (1)
where the maximum possible heat transfer rate is given as:
qmax = Cmin(Th,i − Tc,i) (2)
In Eq. (1), the heat gained by the cold stream, qc, was determined as:
qc = Cc(Tc,o − Tc,i) (3)
where 𝐶𝐶𝑐𝑐 = ��𝑚𝑐𝑐𝑐𝑐𝑝𝑝,𝑐𝑐 and represents the heat capacity rate of the cold stream, and T denotes temperature (subscript denotes hot/cold stream and inlet/outlet). The NTU of the recuperator is defined as:
NTU = UA Cmin⁄ (4)
where U is the overall heat transfer coefficient of the recuperator, and A is the surface area for heat exchange. The combined product of UA represents the inverse of the total resistance in the path for heat

to be transferred from the hot to the cold fluid stream within the heat exchanger. The term Cmin denotes the smaller of the two heat capacity rates of the fluid streams within the device. The NTU can be determined using Eq. (4) if the UA value were known. This value can be obtained using correlations or by computational simulations, by computing the resistances in the path for heat transfer. This UA value can also be determined experimentally by a measure of the heat transfer rate in the device and the inlet and exit temperatures of the fluid streams,
UA = qc Tlm⁄ (5)
where the log mean temperature (Tlm), is defined for a counter flow heat exchanger as:
Tlm = ��Th,i − Tc,o� − �Th,o − Tc,i�� ln �Th,i−Tc,oTh,o−Tc,i
�� (6)
When calculating the effectiveness by this method, it must be noted that due to imperfect insulation of the heat exchanger, there are heat losses to the environment. These heat losses contribute to an effectiveness value that is artificially decreased, since the cold stream is losing a portion of the heat transferred by the hot stream to the environment. An argument can be made to neglect heat loss as an ever-present phenomenon and should be included in the performance characterization of the device. In large-scale recuperators, the ratio of heat transfer area to heat loss area is large and hence the ratio of heat exchange to heat loss is small. However, since the RUC has only three pairs of heat exchange surfaces, the surface area for heat loss was larger than the heat exchange area, and hence a heat loss correction was warranted. Knowing that heat loss propagates out of the heat exchanger control volume from both the hot and cold streams, by an overall energy balance on the RUC,
mhcp,h�Th,i − Th,o� − mc cp,c�Tc,o − Tc,i� = qc,loss + qh,loss (7)
In order to quantify the heat loss from either stream, an assumption was made that the loss fraction is proportional to the stream’s mass flow rate. Thus, the heat loss from the cold stream is given as
qc,loss 𝑚𝑚𝑐𝑐⁄ = �qc,loss + qh,loss� ��𝑚total⁄ (8)
Thus, the heat loss from the cold stream is given as
qc,loss = ��qc,loss + qh,loss� mtotal⁄ �mc (9)
This heat loss term can now be added back into the effectiveness calculation to obtain a corrected value for effectiveness,
εcorr = (qc + qc,loss) qmax⁄ (10)
The modified heat rate on the cold side was used to estimate a revised exit temperature of the cold side using Eq. (3). Furthermore, the modified exit temperature in turn resulted in a revised estimate of the log-mean temperature difference, NTU and UA in Eqns. (4-6). RESULTS AND DISCUSSION Data for corrected effectiveness were plotted against NTU, as shown in Figure 7. The uncorrected effectiveness of the RUC ranges mostly between 80 and 95 percent. Upon correcting for cold side heat loss, the modified effectiveness ranges between 87 and 97 percent. Also plotted in Figure 7 are trends for an ideal counter flow heat exchanger for various Cr values tested experimentally. It is clear that trend of ε-NTU for each tested Cr corresponds with the trend seen in standard counterflow heat exchangers, with higher Cr data points exhibiting lower effectiveness at any given NTU.

Figure 7. Corrected values of effectiveness plotted against corrected NTU. Legend details approximate Cr for each test. Data was plotted against ideal trends seen in standard counterflow heat exchangers at each Cr tested
Another benchmark for judging the performance of the heat exchanger design is the effectiveness performance as a function of minimum approach temperatures, dTapproach. The approach temperature is defined as dTapproach = Th,i − Tc,o or Th,o − Tc,i, depending on which value is smaller. Smaller approach temperatures result in higher effectiveness and cycle efficiency but also leads to a larger size of the heat exchanger. Figure 8 shows high effectiveness over a range of approach temperatures ranging from 6 ˚C down to 1 ˚C. No clear trend of effectiveness with dTapproach is observed in the results. Further experiments over a wider range of approach temperatures are needed to discern such a trend.
Figure 8. Effectiveness as a function of approach temperatures

Figure 9. Pressure drop data from both testing and FLUENT analysis
The pressure drop across the fluid streams in the RUC is shown in Figure 9. To obtain pressure drop data, flow was routed through only one side of the RUC (hot or cold) at a time. This was done to ensure a steady pressure drop measurement by isolating the channels of interest over a larger range of flow rates (Reynolds numbers). The test was then repeated on the other set of channels. For testing, both channels were tested at the same fluid temperature, despite their hot/cold designation. Also shown in Figure 9 are results from CFD analysis at select Reynolds numbers. The CFD model was prescribed fluid properties and inlet mass flow rates consistent with conditions measured in the cold stream pressure drop tests. The comparison between the simulation and experimental pressure drop is close at Reynolds numbers under 3000 but the simulations seem to be over-predicting pressure drop at Re of ~3500. Further analysis of the reason behind the deviation is ongoing. When analyzing the viability of the design to be scaled up to meet future design criteria, an important parameter to consider is the overall heat transfer coefficient, U, of the heat exchanger. In this application, the U value quantifies how well heat is transferred from the hot stream to the cold stream,
𝑈𝑈 = 𝑈𝑈𝑈𝑈 𝑈𝑈𝐻𝐻𝐻𝐻⁄ (11)
where AHX is the area of the heat exchange interface between the two streams, and UA is a combined term computed using Eq. (5). Results of experimentally-obtained U as a function of Re of the cold side can be seen in Figure 10 in the black outline symbols. A near linear increase in U with Re is observed for the range of flow rates. The experimentally determined U was compared against that predicted by a correlation-based model for identical flow conditions. The model was developed using pin fin array correlations by Rasouli et al. [17]. The results of model predictions for different heat capacity rates are shown by the blue outline symbols in Figure 10. It is seen that the prediction of the correlation-based model is better at a Cr = 1 than at lower Cr. For a Cr = 1, the model NTU is within 20 percent of experimentally determined values, and that the model, in most cases, seems to over predict the performance. It should be noted that the correlation developed by Rasouli et al. [17] are for larger aspect ratios than in this design. Furthermore, they were developed using PF-5060 and liquid nitrogen data. Additional experimental data are needed in microscale pin geometries for sCO2 at operating conditions seen in power cycles to increase the predictive capability of the correlation-based model.
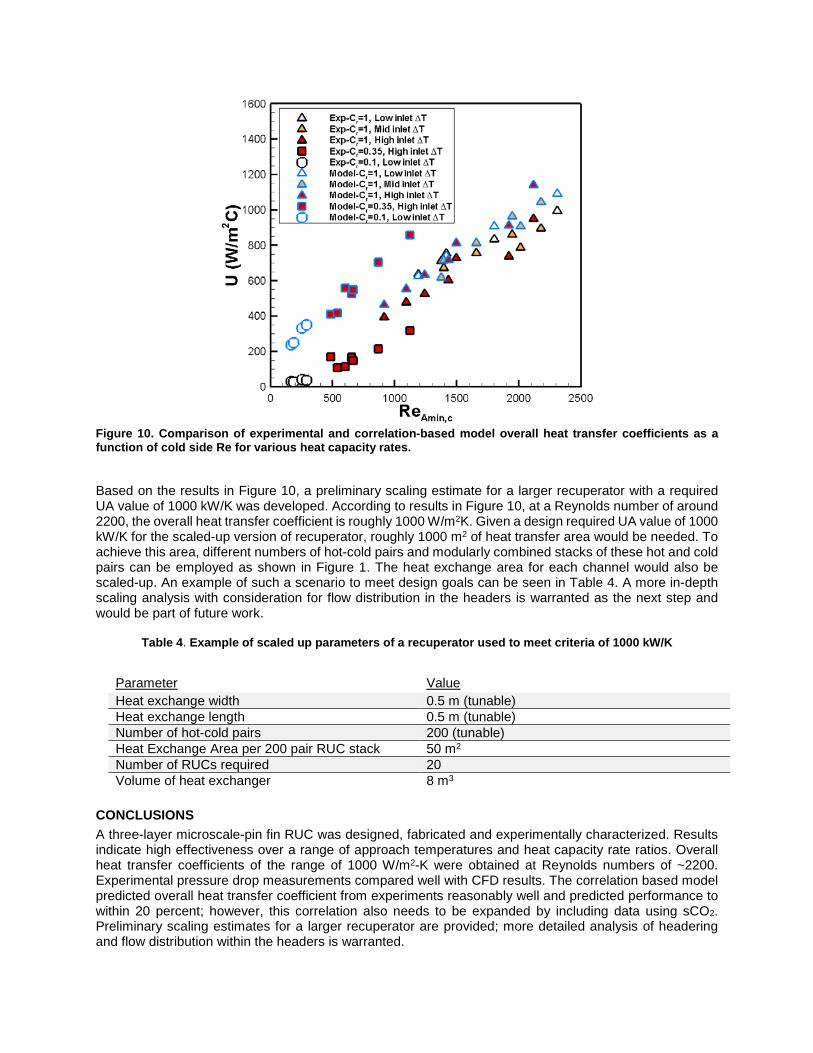
Figure 10. Comparison of experimental and correlation-based model overall heat transfer coefficients as a function of cold side Re for various heat capacity rates.
Based on the results in Figure 10, a preliminary scaling estimate for a larger recuperator with a required UA value of 1000 kW/K was developed. According to results in Figure 10, at a Reynolds number of around 2200, the overall heat transfer coefficient is roughly 1000 W/m2K. Given a design required UA value of 1000 kW/K for the scaled-up version of recuperator, roughly 1000 m2 of heat transfer area would be needed. To achieve this area, different numbers of hot-cold pairs and modularly combined stacks of these hot and cold pairs can be employed as shown in Figure 1. The heat exchange area for each channel would also be scaled-up. An example of such a scenario to meet design goals can be seen in Table 4. A more in-depth scaling analysis with consideration for flow distribution in the headers is warranted as the next step and would be part of future work.
Table 4. Example of scaled up parameters of a recuperator used to meet criteria of 1000 kW/K
CONCLUSIONS A three-layer microscale-pin fin RUC was designed, fabricated and experimentally characterized. Results indicate high effectiveness over a range of approach temperatures and heat capacity rate ratios. Overall heat transfer coefficients of the range of 1000 W/m2-K were obtained at Reynolds numbers of ~2200. Experimental pressure drop measurements compared well with CFD results. The correlation based model predicted overall heat transfer coefficient from experiments reasonably well and predicted performance to within 20 percent; however, this correlation also needs to be expanded by including data using sCO2. Preliminary scaling estimates for a larger recuperator are provided; more detailed analysis of headering and flow distribution within the headers is warranted.
Parameter Value Heat exchange width 0.5 m (tunable) Heat exchange length 0.5 m (tunable) Number of hot-cold pairs 200 (tunable) Heat Exchange Area per 200 pair RUC stack 50 m2 Number of RUCs required 20 Volume of heat exchanger 8 m3

REFERENCES [1] National Energy Technology Laboratory, Supercritical power cycles, http://www.netl.doe.gov/research/
coal/energy-systems/ turbines/ supercritical-co2-power-cycles, accessed: April 2014. [2] Narayanan, V., Liburdy, J. and Pence, D, 2013, "Thermal Applications of Microchannel Flows"
in Encyclopedia of Aerospace Engineering, eds R. Blockley and W. Shyy, John Wiley: Chichester. DOI: 10.1002/9780470686652.eae613, Published 02nd December 2013.
[3] Kockmann, N., 2008, Transport Phenomena in MicroProcess Engineering, Springer publishing group. [4] Tuckerman, D. B., and Pease, R. F. W., 1981, “High-Performance Heat Sinking for VLSI,” IEEE
Electron Devices Letters, Vol. EDL-2 (5), pp. 126-129. [5] Brandner, J., Bohn, L., Henning, T., Schygulla, U., and Schubert, K., 2007, “Microstructure Heat
Exchanger Applications in Laboratory and Industry,” Heat Transfer Engineering, Vol. 28, pp.761-771. [6] Fan, Y., and Luo, L., 2008, “Recent Applications of Advances in Microchannel Heat Exchangers And
Multi-Scale Design Optimization,” Heat Transfer Engineering, Vol. 29(5), pp. 461-474. [7] Ghazvini, M. and Narayanan, V., 2013, “A microscale combustor recuperator and oil heat exchanger –
design and thermofluidic characterization,” Int. J. Heat Mass Transf. 64, pp. 988–1002. [8] Karagiannidis, S. & Mantzaras, J., 2010, “Numerical investigation on the start-up of methane-fueled
catalytic microreactors,” Combust. Flame, Vol. 157, pp. 1400–1413. [9] Tonkovich, A. Y., Perry, S., Wang, Y., Qiu, D., LaPlante, T., Rogers, W. A., 2004, “Microchannel
process technology for compact methane steam reforming,” Chem. Eng. Sci. Vol. 59, pp. 4819–4824. [10] Le Pierres, R., Southall, D., & Osborne, S., 2011, “Impact of Mechanical Design on Printed Circuit Heat
Exchangers,” Proceedings of the 2011 SCO2 Power Cycle Symposium, University of Colorado Boulder, May 24-25, 2011.
[11] Li, X., Kinninmont, D., Le Pierres, R., & Dewson, S. J., 2008, “Alloy 617 for the High Temperature Diffusion-bonded Compact Heat Exchangers,” Paper 8008, Proceedings of ICAPP 2008, Anaheim, CA, USA, June 8th – 12th 2008.
[12] Li, X., Le Pierres, R., and Dewson, S. J., 2006, “Heat Exchangers for the Next Generation of Nuclear Reactors,” Paper 6105, Proceedings of ICAPP 2006, Reno, Nevada, 2006.
[13] Mylavarapu, S. K., Sun, X., Christensen, R. N., Unocic, R. R., Glosup, R. E., and Patterson, M. W., 2012, “Fabrication and Design Aspects of High-temperature Compact Diffusion Bonded Heat Exchangers,” Nuclear Engineering and Design, Vol. 249, pp. 49-56.
[14] Kim, H., and No, C., 2011, “Thermal Hydraulic Performance Analysis of a Printed Circuit Heat Exchanger Using a Helium-Water Test Loop and Numerical Simulations,” Applied Thermal Engineering, Vol. 31, pp. 4064-4073.
[15] Tuckerman, D. B., “Heat-Transfer Microstructures for Integrated Circuits,” Ph.D. Thesis, Stanford, CA.: Stanford University, 1984.
[16] Peles, Y., Koşar, A., Mishra, C., Kuo, C. J., and Schneider, B., "Forced Convective Heat Transfer Across a Pin Fin Micro Heat Sink," I. J. Heat Mass Transfer, vol. 48, no. 17, pp. 3615-3627, 2005.
[17] Rasouli, E., Naderi, C., Narayanan, V., 2017, “Pitch and Aspect Ratios Effects on Single-Phase Heat Transfer through Microscale Pin Fin Heat Sinks”, International Journal of Heat and Mass Transfer, Vol. 118, pp. 416-428, https://doi.org/10.1016/j.ijheatmasstransfer.2017.10.105
[18] 316/316L Stainless Steel. AK Steel, http://www.aksteel.com/pdf/markets_products/stainless/austenitic /316_316l_data_bulletin.pdf.
ACKNOWLEDGEMENTS Financial support for this work was provided by federal grant # DE-FE0024064 from the Fossil Energy Office of the Department of Energy. The views and opinions of authors expressed herein do not necessarily state or reflect those of the United States Government or any agency thereof.

![Design and Performance Characterization of an Additively ......Micro-pin-fin array heat transfer correlations such as that by Rasouli et al. [6] can be used to more accurately quantify](https://img.pdfslide.us/doc/110x75/5e7b3ba71221a8112c387c22/design-and-performance-characterization-of-an-additively-micro-pin-fin-array.jpg)