Embed Size (px)
Citation preview
9
Design and Optimization of HVAC System of Spacecraft
Xiangli Li Dalian University of Technology,
China
1. Introduction
1.1 Background
From Manned spacecraft and space shuttle to the scale of space station, the technology of
manned spacecraft has been developing. The astronauts have to work and live in the cabin
for much longer time. Therefore, the spacecraft environmental control and life support
systems is not only asked to control the cabin environment parameters within a certain
range, but also to ensure the cabin environment with high thermal comfort which can meet
the physical and psychological needs of astronauts, also improve the efficiency of
equipments, structural components in the manned space System. The ventilation, air
conditioning problems and the air flow arrangement of the cabin directly affect the
environmental parameters controlling and the thermal comfort of the cabin environment.
So, it has an important significance to research the ventilation, air quality, thermal
environment and comfort of the astronauts in the cabin under the microgravity condition.
There is 10 -3 ~ 10 -6 -g0 level of micro-gravity (g0=9.8 m2 /s) inside the cabin of spacecraft or the space station. At this point, the phenomena which are common with ground gravity such as natural convection, static pressure differential and sedimentation are greatly reduced. Therefore, forced ventilation is crucially essential to achieve the exchange of matter and energy in cabin under the micro-gravity conditions. With changes of the mission and flight time, improvement of air ventilation system in the manned spacecraft cabin determines the comfort of astronauts. The way of ventilation in such confined spaces like small cabin should give priority to the centralized air supply system.
The environment inside of the space station is similar to a building on the planet. It is quite necessary to solve the design problems of air-conditioning of cabin in order to meet the astronauts’ requirement of comfort when they live and work in the space station or the spacecraft, and moreover variety of spacecraft equipments, structural components and the organisms in spacecraft are unable to withstand large temperature fluctuations. In order to ensure equipments working in the normal environment and improve their performance, it is required that the spacecraft thermal control system not only ensures the maintenance of normal temperature, but also provide a constant temperature environment for some equipments. Therefore, temperature and humidity as well as the conditions of ventilation ensure the operating efficiency of equipment, structural components in the spacecraft.
www.intechopen.com
Advances in Spacecraft Systems and Orbit Determination
204
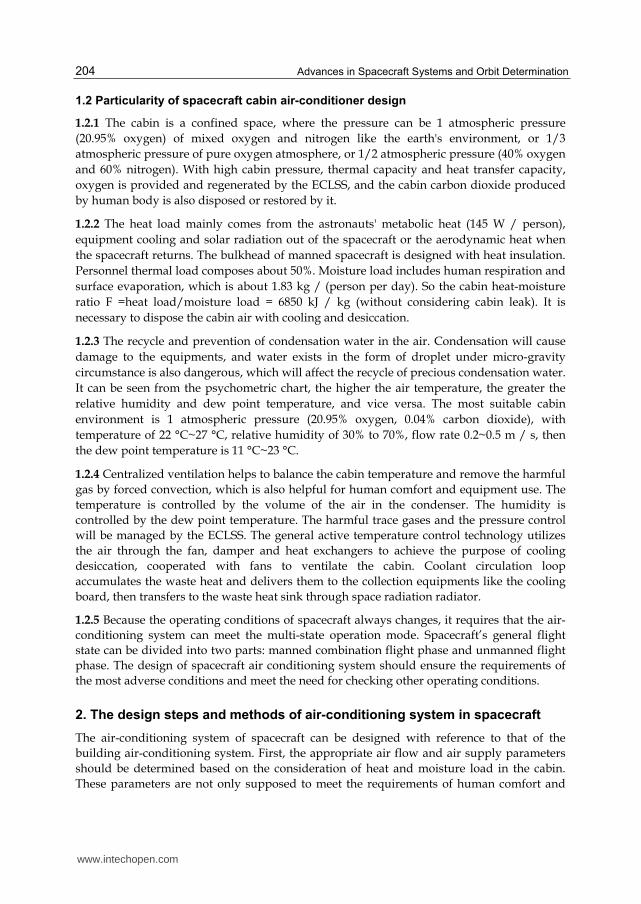
1.2 Particularity of spacecraft cabin air-conditioner design
1.2.1 The cabin is a confined space, where the pressure can be 1 atmospheric pressure
(20.95% oxygen) of mixed oxygen and nitrogen like the earth's environment, or 1/3
atmospheric pressure of pure oxygen atmosphere, or 1/2 atmospheric pressure (40% oxygen
and 60% nitrogen). With high cabin pressure, thermal capacity and heat transfer capacity,
oxygen is provided and regenerated by the ECLSS, and the cabin carbon dioxide produced
by human body is also disposed or restored by it.
1.2.2 The heat load mainly comes from the astronauts' metabolic heat (145 W / person),
equipment cooling and solar radiation out of the spacecraft or the aerodynamic heat when
the spacecraft returns. The bulkhead of manned spacecraft is designed with heat insulation.
Personnel thermal load composes about 50%. Moisture load includes human respiration and
surface evaporation, which is about 1.83 kg / (person per day). So the cabin heat-moisture
ratio F =heat load/moisture load = 6850 kJ / kg (without considering cabin leak). It is
necessary to dispose the cabin air with cooling and desiccation.
1.2.3 The recycle and prevention of condensation water in the air. Condensation will cause
damage to the equipments, and water exists in the form of droplet under micro-gravity
circumstance is also dangerous, which will affect the recycle of precious condensation water.
It can be seen from the psychometric chart, the higher the air temperature, the greater the
relative humidity and dew point temperature, and vice versa. The most suitable cabin
environment is 1 atmospheric pressure (20.95% oxygen, 0.04% carbon dioxide), with
temperature of 22 °C~27 °C, relative humidity of 30% to 70%, flow rate 0.2~0.5 m / s, then
the dew point temperature is 11 °C~23 °C.
1.2.4 Centralized ventilation helps to balance the cabin temperature and remove the harmful
gas by forced convection, which is also helpful for human comfort and equipment use. The
temperature is controlled by the volume of the air in the condenser. The humidity is
controlled by the dew point temperature. The harmful trace gases and the pressure control
will be managed by the ECLSS. The general active temperature control technology utilizes
the air through the fan, damper and heat exchangers to achieve the purpose of cooling
desiccation, cooperated with fans to ventilate the cabin. Coolant circulation loop
accumulates the waste heat and delivers them to the collection equipments like the cooling
board, then transfers to the waste heat sink through space radiation radiator.
1.2.5 Because the operating conditions of spacecraft always changes, it requires that the air-
conditioning system can meet the multi-state operation mode. Spacecraft’s general flight
state can be divided into two parts: manned combination flight phase and unmanned flight
phase. The design of spacecraft air conditioning system should ensure the requirements of
the most adverse conditions and meet the need for checking other operating conditions.
2. The design steps and methods of air-conditioning system in spacecraft
The air-conditioning system of spacecraft can be designed with reference to that of the
building air-conditioning system. First, the appropriate air flow and air supply parameters
should be determined based on the consideration of heat and moisture load in the cabin.
These parameters are not only supposed to meet the requirements of human comfort and
www.intechopen.com
Design and Optimization of HVAC System of Spacecraft
205
ventilation, but also to minimize the amount of air to reduce the size of wind pipe and
equipment, also to save the space and reduce aircraft noise within the spacecraft. Hence the
optimization of ventilation system parameters is needed to be taken. On this basis, the air
flow and piping organization can be designed. Here we use a test chamber to illustrate the
design process.
2.1 Principles and processes
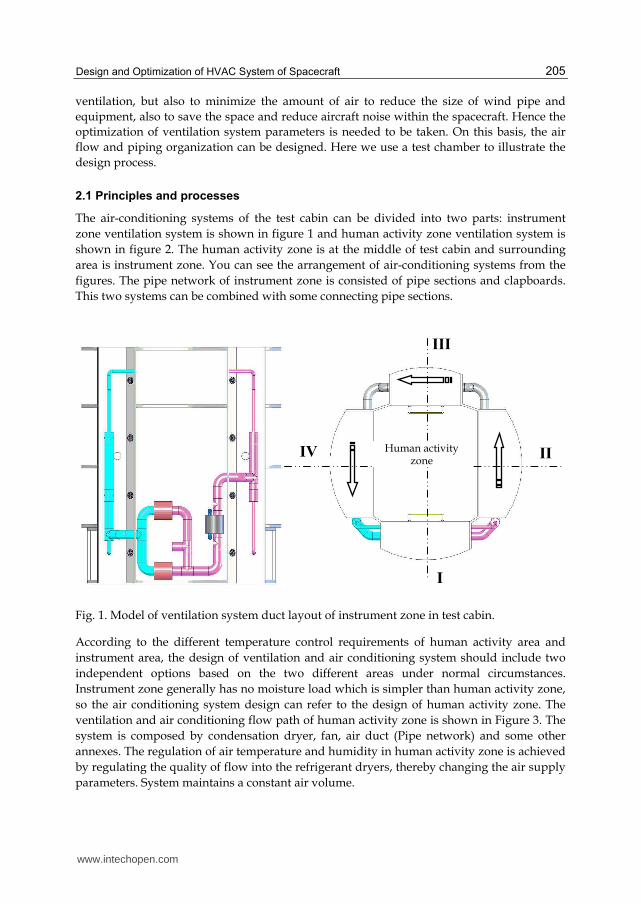
The air-conditioning systems of the test cabin can be divided into two parts: instrument
zone ventilation system is shown in figure 1 and human activity zone ventilation system is
shown in figure 2. The human activity zone is at the middle of test cabin and surrounding
area is instrument zone. You can see the arrangement of air-conditioning systems from the
figures. The pipe network of instrument zone is consisted of pipe sections and clapboards.
This two systems can be combined with some connecting pipe sections.
Fig. 1. Model of ventilation system duct layout of instrument zone in test cabin.
According to the different temperature control requirements of human activity area and
instrument area, the design of ventilation and air conditioning system should include two
independent options based on the two different areas under normal circumstances.
Instrument zone generally has no moisture load which is simpler than human activity zone,
so the air conditioning system design can refer to the design of human activity zone. The
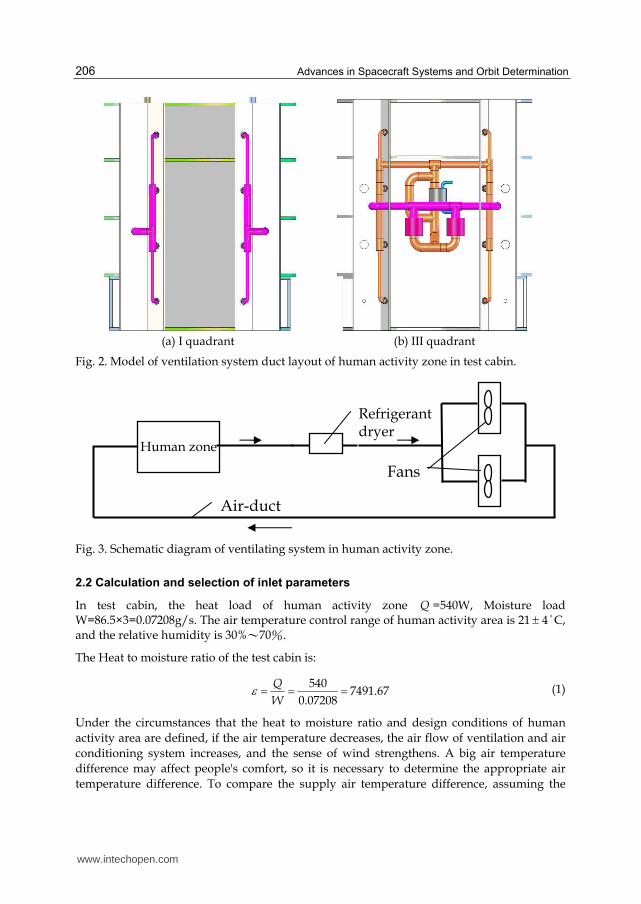
ventilation and air conditioning flow path of human activity zone is shown in Figure 3. The
system is composed by condensation dryer, fan, air duct (Pipe network) and some other
annexes. The regulation of air temperature and humidity in human activity zone is achieved
by regulating the quality of flow into the refrigerant dryers, thereby changing the air supply
parameters. System maintains a constant air volume.
I
III
II IV Human activity zone
www.intechopen.com
Advances in Spacecraft Systems and Orbit Determination
206
(a) I quadrant (b) III quadrant
Fig. 2. Model of ventilation system duct layout of human activity zone in test cabin.
Fig. 3. Schematic diagram of ventilating system in human activity zone.
2.2 Calculation and selection of inlet parameters
In test cabin, the heat load of human activity zone Q =540W, Moisture load W=86.5×3=0.07208g/s. The air temperature control range of human activity area is 21 4°C, and the relative humidity is 30%~70%.
The Heat to moisture ratio of the test cabin is:
5407491.67
0.07208
Q
W (1)
Under the circumstances that the heat to moisture ratio and design conditions of human
activity area are defined, if the air temperature decreases, the air flow of ventilation and air
conditioning system increases, and the sense of wind strengthens. A big air temperature
difference may affect people's comfort, so it is necessary to determine the appropriate air
temperature difference. To compare the supply air temperature difference, assuming the
Human zone
Refrigerant dryer
Fans
Air-duct
www.intechopen.com
Design and Optimization of HVAC System of Spacecraft
207
design temperature and relative humidity are Nt =21°C, N =50%, respectively. If the
supply air temperature difference is st , the supply air temperature is 21 °C- st .
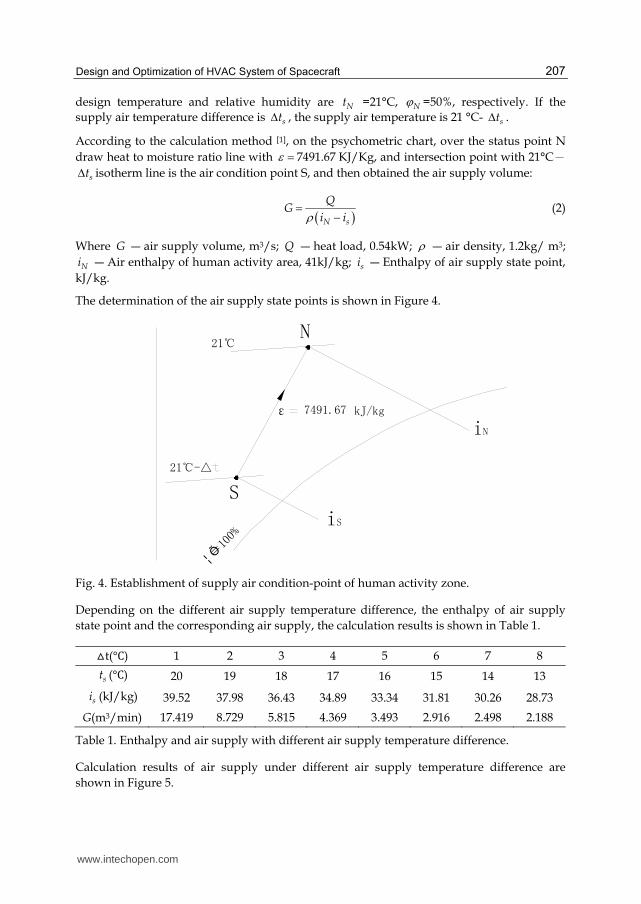
According to the calculation method [1], on the psychometric chart, over the status point N
draw heat to moisture ratio line with 7491.67 KJ/Kg, and intersection point with 21°C-
st isotherm line is the air condition point S, and then obtained the air supply volume:
N s
QG
i i (2)
Where G ― air supply volume, m3/s; Q ― heat load, 0.54kW; ― air density, 1.2kg/ m3;
Ni ― Air enthalpy of human activity area, 41kJ/kg; si ― Enthalpy of air supply state point,
kJ/kg.
The determination of the air supply state points is shown in Figure 4.
N
iS
7491.67 kJ/kgε
S
21℃
¦ Õ=1
0
0
%
iN
21℃-△
Fig. 4. Establishment of supply air condition-point of human activity zone.
Depending on the different air supply temperature difference, the enthalpy of air supply
state point and the corresponding air supply, the calculation results is shown in Table 1.
△t(°C) 1 2 3 4 5 6 7 8
st (°C) 20 19 18 17 16 15 14 13
si (kJ/kg) 39.52 37.98 36.43 34.89 33.34 31.81 30.26 28.73
G(m3/min) 17.419 8.729 5.815 4.369 3.493 2.916 2.498 2.188
Table 1. Enthalpy and air supply with different air supply temperature difference.
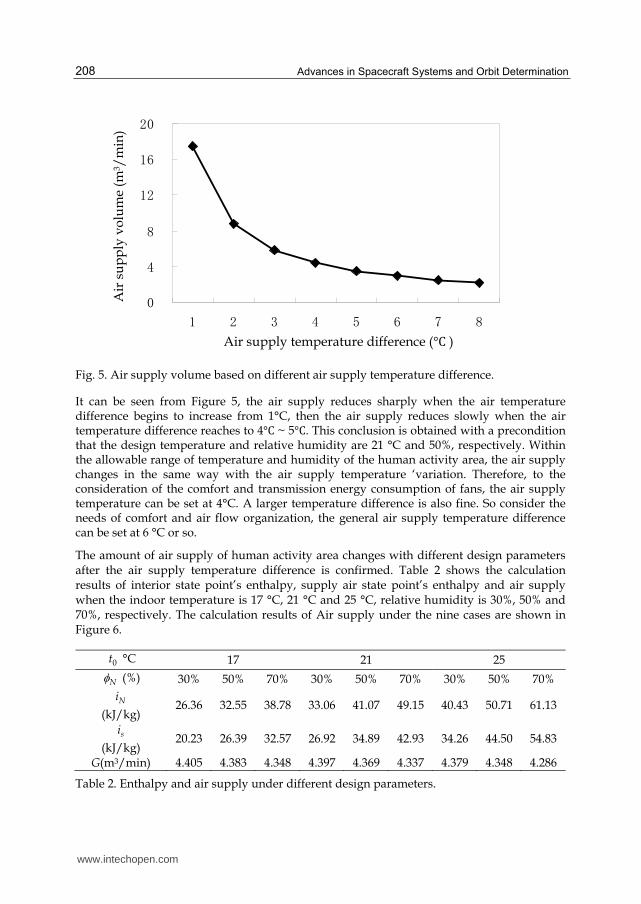
Calculation results of air supply under different air supply temperature difference are
shown in Figure 5.
www.intechopen.com
Advances in Spacecraft Systems and Orbit Determination
208
Fig. 5. Air supply volume based on different air supply temperature difference.
It can be seen from Figure 5, the air supply reduces sharply when the air temperature difference begins to increase from 1°C, then the air supply reduces slowly when the air temperature difference reaches to 4°C ~ 5°C. This conclusion is obtained with a precondition that the design temperature and relative humidity are 21 °C and 50%, respectively. Within the allowable range of temperature and humidity of the human activity area, the air supply changes in the same way with the air supply temperature ‘variation. Therefore, to the consideration of the comfort and transmission energy consumption of fans, the air supply temperature can be set at 4°C. A larger temperature difference is also fine. So consider the needs of comfort and air flow organization, the general air supply temperature difference can be set at 6 °C or so.
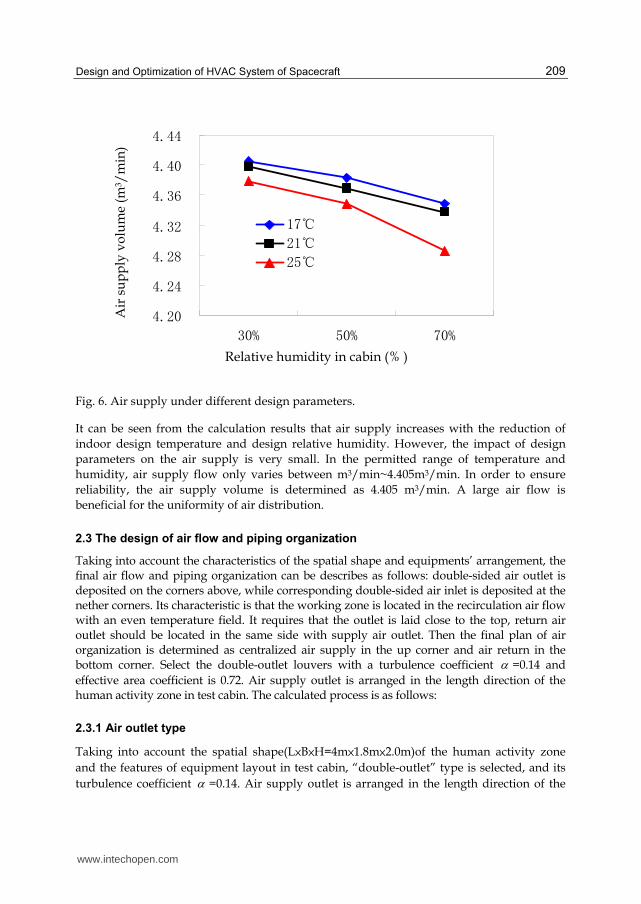
The amount of air supply of human activity area changes with different design parameters after the air supply temperature difference is confirmed. Table 2 shows the calculation results of interior state point’s enthalpy, supply air state point’s enthalpy and air supply when the indoor temperature is 17 °C, 21 °C and 25 °C, relative humidity is 30%, 50% and 70%, respectively. The calculation results of Air supply under the nine cases are shown in Figure 6.
0t °C 17 21 25
N (%) 30% 50% 70% 30% 50% 70% 30% 50% 70%
Ni
(kJ/kg) 26.36 32.55 38.78 33.06 41.07 49.15 40.43 50.71 61.13
si
(kJ/kg) 20.23 26.39 32.57 26.92 34.89 42.93 34.26 44.50 54.83
G(m3/min) 4.405 4.383 4.348 4.397 4.369 4.337 4.379 4.348 4.286
Table 2. Enthalpy and air supply under different design parameters.
Air supply temperature difference (°C )
Air
su
pp
ly v
olu
me
(m3 /
min
)
0
4
8
12
16
20
1 2 3 4 5 6 7 8
www.intechopen.com
Design and Optimization of HVAC System of Spacecraft
209
Fig. 6. Air supply under different design parameters.
It can be seen from the calculation results that air supply increases with the reduction of
indoor design temperature and design relative humidity. However, the impact of design
parameters on the air supply is very small. In the permitted range of temperature and
humidity, air supply flow only varies between m3/min~4.405m3/min. In order to ensure
reliability, the air supply volume is determined as 4.405 m3/min. A large air flow is
beneficial for the uniformity of air distribution.
2.3 The design of air flow and piping organization
Taking into account the characteristics of the spatial shape and equipments’ arrangement, the final air flow and piping organization can be describes as follows: double-sided air outlet is deposited on the corners above, while corresponding double-sided air inlet is deposited at the nether corners. Its characteristic is that the working zone is located in the recirculation air flow with an even temperature field. It requires that the outlet is laid close to the top, return air outlet should be located in the same side with supply air outlet. Then the final plan of air organization is determined as centralized air supply in the up corner and air return in the bottom corner. Select the double-outlet louvers with a turbulence coefficient =0.14 and
effective area coefficient is 0.72. Air supply outlet is arranged in the length direction of the human activity zone in test cabin. The calculated process is as follows:
2.3.1 Air outlet type
Taking into account the spatial shape(L×B×H=4m×1.8m×2.0m)of the human activity zone
and the features of equipment layout in test cabin, “double-outlet” type is selected, and its
turbulence coefficient =0.14. Air supply outlet is arranged in the length direction of the
Relative humidity in cabin (% )
Air
su
pp
ly v
olu
me
(m3 /
min
)
4.20
4.24
4.28
4.32
4.36
4.40
4.44
30% 50% 70%
17℃
21℃
25℃
www.intechopen.com
Advances in Spacecraft Systems and Orbit Determination
210
human activity zone in test cabin, and the range x =B-0.5=1.3m. The minus 0.5m is the no
constant temperature district near the cabin wall.
2.3.2 Air supply temperature difference and air supply volume
From the above calculation, air supply temperature difference and air supply are △ts=4°C,
G=4.75 m3/min, respectively.
2.3.3 Speed of air supply
For the sidewall air supply, the equation (3) gives the calculation method of maximum air
supply speed:
ss
BHkv
G0.103 (3)
Where Gs —the air supply volume ,m/s;
k —coefficient of valid area, k=0.72.
Based on the known parameters and formula (3), B=1.8m, H=2m, the result of sv is
3.64m/s, sv 3.5 m/s can be used for the velocity of air supply (To prevent air noise, air
supply speed should be within 2 ~ 5m / s, this result meet the requirements.)
2.3.4 The number of air supply outlet
The freedom degree of air supply jet can be calculated by equation (4) as follow:
0
0.89n s
s
F HBv k
d L (4)
Where Fn—cross-area of room space afforded by each outlet, m2;
d0—area equivalent diameter of rectangle outlet, m;
—freedom degree of air supply jet
For the human activity zone, the freedom degree of air supply jet is 10
According to the value of 0
nx
s
Ft
t d
, the zero dimension distance x can be obtained by
checking the chart of axis temperature difference die-away curve of no equivalent
temperature jet flow. xt is the temperature difference between indoor air temperature and
axis temperature. In this example, xt = 0.5°C, st =4°C
nx
s
Ft
t d0
1.25 (5)
The x is equal to 0.25 when check the curve chart. Then:
www.intechopen.com
Design and Optimization of HVAC System of Spacecraft
211
H BN
x
x
2 13.77
0.14 1.3
0.25
The two-side air supply is used and there are 4 outlets each side. In this calculation, the width of room B is half of practice broad width. So it is 1.0m.
2.3.5 The size of air supply outlet
The area of each air supply outlet is:
f =4.405
60 3.5 8 0.72s
s
G
v N k =0.00364 m2 (6)
Area equivalent diameter is determined by equation 7:
0 1.128 1.128 0.00364 68d f mm (7)
So the sine of double-outlet louvers air supply outlet can be 80mm×80mm The real speed of
air supply outlet is sv4.405
1.438 60 0.08 0.08
m/s.
2.3.6 Check the adhesion length
The air conditioning space is available if the adhesion length is larger than the length of
cabin. It can be checked by the Archimedes number Ar.
sr
n
gd tA
v T02 20
9.8 0.068 4
3.5 273 21
Where the Tn is the absolute temperature of indoor cabin. From the table research by Ar, the
adhesion length x =3.8,which is more than range 1.3m. It is noteworthy that the acceleration
of gravity is setting for 9.81m/s2. While in the microgravity environment of the aircraft, the
Archimedes number Ar will be greatly reduced. So the adhesion lengths significant increases
in benefit to the supply air to meet the design requirements.
There are many forms of air supply outlet in air-conditioning systems of the civilian. Here
we just calculated the slit-type outlet. Calculate the number of air supply outlet, layout and
area of outlet based on air flow organization [2]. Finally, four outlet louvers for each side on
the top with the size of 80mm×80mm.The actual wind speed is 1.43m/s.
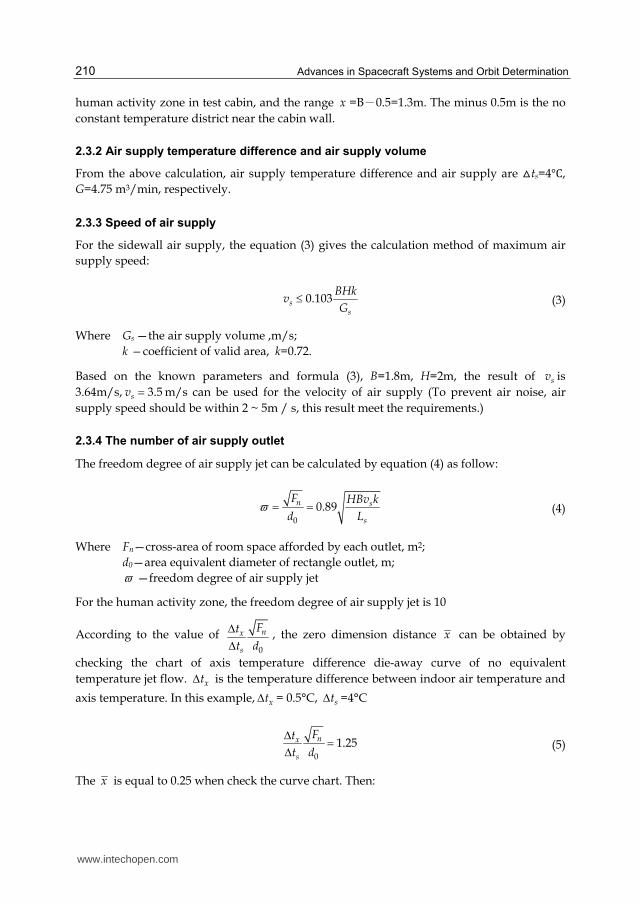
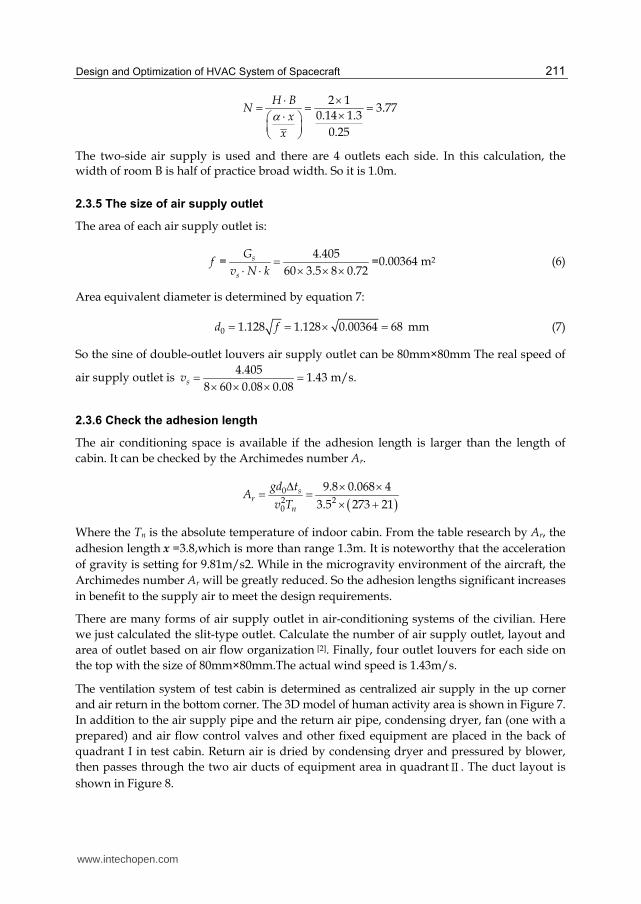
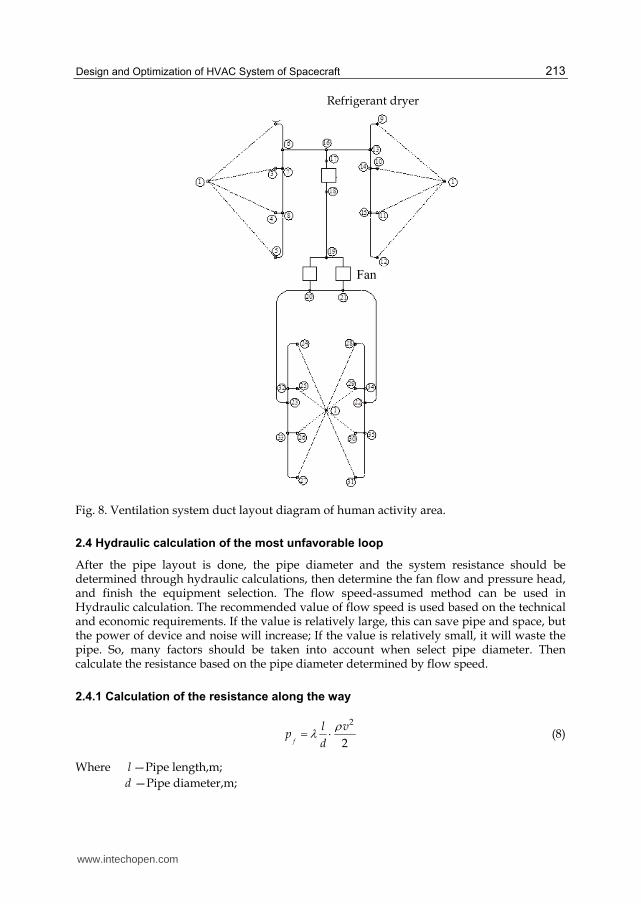
The ventilation system of test cabin is determined as centralized air supply in the up corner
and air return in the bottom corner. The 3D model of human activity area is shown in Figure 7.
In addition to the air supply pipe and the return air pipe, condensing dryer, fan (one with a
prepared) and air flow control valves and other fixed equipment are placed in the back of
quadrant I in test cabin. Return air is dried by condensing dryer and pressured by blower,
then passes through the two air ducts of equipment area in quadrantⅡ. The duct layout is
shown in Figure 8.
www.intechopen.com

Advances in Spacecraft Systems and Orbit Determination
212
Fig. 7. 3D model of ventilation system duct layout of human activity area in test cabin.
Air supply outlet
Air return outlet
Air supply outlet
Air return outlet
www.intechopen.com
Design and Optimization of HVAC System of Spacecraft
213
Fig. 8. Ventilation system duct layout diagram of human activity area.
2.4 Hydraulic calculation of the most unfavorable loop
After the pipe layout is done, the pipe diameter and the system resistance should be determined through hydraulic calculations, then determine the fan flow and pressure head, and finish the equipment selection. The flow speed-assumed method can be used in Hydraulic calculation. The recommended value of flow speed is used based on the technical and economic requirements. If the value is relatively large, this can save pipe and space, but the power of device and noise will increase; If the value is relatively small, it will waste the pipe. So, many factors should be taken into account when select pipe diameter. Then calculate the resistance based on the pipe diameter determined by flow speed.
2.4.1 Calculation of the resistance along the way
2
2f
l vp
d
(8)
Where l —Pipe length,m;
d —Pipe diameter,m;
Fan
Refrigerant dryer
www.intechopen.com

Advances in Spacecraft Systems and Orbit Determination
214
v —Average velocity of cross-section area,m/s;
—Resistance coefficient along the way;
—Air density,1.2 kg/m3
The calculation of is in accordance with the formula (9), and can be used in the three
districts of turbulent.
0.25680.11( )
Re
K
d (9)
Where K—Duct roughness, 0.01-0.02 mm for PVC;
Re—Reynolds number, vd
Re ,where is the Dynamic viscosity coefficient
with a value of 1.884×10⁻⁵ Pa.s.
2.4.2 Calculation of local resistance
2
2m
vp
(10)
Where —Local resistance coefficient
For different structural forms of resistance components, the methods of local resistance coefficient are different. Local resistances of all conditions are listed in paper [2].
The design air flow of human activity area in test cabin is 4.405m3/min, the total resistance loss of the most unfavorable loop is 168.13Pa, the resistance loss of the condensation dryer is 50Pa.The fan type is 5-50No2C,and its rated air flow is 4.575m3/min, rated pressure head is 157.7Pa, axis power is 14W.
3. Verification and optimization of hydraulic condition of air-conditioning system
The previous section introduces the preliminary design of the air conditioning system of aircraft. System will form multiple loops when it runs, as there are several function areas (such as human activity areas and equipment areas, etc.) in the aircraft cabin. The systems are independent on the preliminary design stage. When considering system’s running conditions, some problems such as whether the previously selected devices (such as air ducts and fans) can meet the requirements of different operating conditions, and whether the selected pipe diameter is reasonable have not been resolved, so the verification and optimization work of hydraulic condition should be carried out.
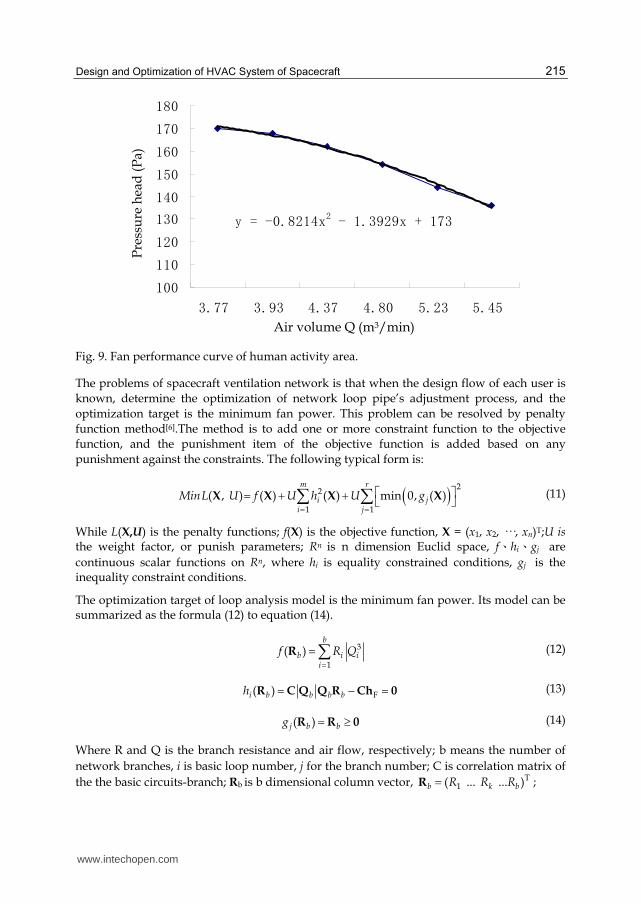
Two factors need to be considered when carry out the verification and optimization work, one is optimization goal, the other one is simulation of the hydraulic condition. The air flow speed of network is low, so it may consider as steady flow. Basic circuit analysis method or node method [5] can be adopted in hydraulic condition simulation. The frictional resistance coefficient of air duct can be calculated in the explicit format, and the local loss coefficient can be obtained from the manufacturer's manual. Pump head can be approximately expressed by 5-order polynomial. As shown in the figure bellow:
www.intechopen.com
Design and Optimization of HVAC System of Spacecraft
215
Fig. 9. Fan performance curve of human activity area.
The problems of spacecraft ventilation network is that when the design flow of each user is
known, determine the optimization of network loop pipe’s adjustment process, and the
optimization target is the minimum fan power. This problem can be resolved by penalty
function method[6].The method is to add one or more constraint function to the objective
function, and the punishment item of the objective function is added based on any
punishment against the constraints. The following typical form is:
m r
i ji j
MinL U f U h U g2
2
1 1
( , ) ( ) ( ) min 0, ( )
X X X X (11)
While L(X,U) is the penalty functions; f(X) is the objective function, X = (x1, x2, ···, xn)T;U is the weight factor, or punish parameters; Rn is n dimension Euclid space, f、hi、gj are
continuous scalar functions on Rn, where hi is equality constrained conditions, gj is the inequality constraint conditions.
The optimization target of loop analysis model is the minimum fan power. Its model can be summarized as the formula (12) to equation (14).
b
b i ii
f R Q3
1
( )
R (12)
i b b b bh F( ) R C Q Q R Ch 0 (13)
j b bg ( ) R R 0 (14)
Where R and Q is the branch resistance and air flow, respectively; b means the number of
network branches, i is basic loop number, j for the branch number; C is correlation matrix of
the the basic circuits-branch; Rb is b dimensional column vector, b k bR R R T1( ... ... )R ;
Pre
ssu
re h
ead
(P
a)
Air volume Q (m3/min)
y = -0.8214x
2
- 1.3929x + 173
100
110
120
130
140
150
160
170
180
3.77 3.93 4.37 4.80 5.23 5.45
www.intechopen.com

Advances in Spacecraft Systems and Orbit Determination
216
Fan pressure head TF kh h hF 1 F Fb( ... ... )h ;
The original impedance matrix: k
b
R
R
R
1 0 0
0 0
0 0
R
;
|Qb| and Qb both are b×b diagonal matrix:
b k
b
Q
Q
Q
1 0 0
0 0
0 0
Q
, b k
b
Q
Q
Q
1 0 0
0 0
0 0
Q
.
The minimized penalty function which is corresponding to equation (11) is:
m r
b b i b j bi j
Min L U f U h U g
22
1 1
( , ) ( ) ( ) min 0, ( )
R R R R (15)
Because the algorithm requires a gradient, so:
m r
b b i b i b j b j bi j
L f U h h U g g1 1
( ) ( ) 2 ( ) ( ) 2min 0, ( ) ( )
R R R R R R (16)
Each constraint item in equation (16) can be removed by the square of the gradient vector and it can be standardized, and then use the gradient’s norm of the objective function multiplying each constraint (plus 1 to avoid the gradients close to zero). So the gradient expression of penalty function is given as follows:
m
bb b i b i b
i i b
rb
j b j bj
j b
fL f U h h
h
fU g g
g
21
21
( ) 1( ) ( ) 2 ( ) ( )
( )
( ) 12 min 0, ( ) ( )
( )
RR R R R
R
RR R
R
(17)
In the adjacent area of the solutions, the objective and constraint functions’ norm of gradient vector can be considered as constant. As a result, the penalty function which is corresponding to equation (17) can be described as follows:
m r
b b i b j bi j
L f U h U g
22
1 1
( ) ( ) ( ) min 0, ( )
R R R R (18)
where:
www.intechopen.com
Design and Optimization of HVAC System of Spacecraft
217
b
i b
fU U
h2
( ) 1
( )
R
R (19)
b
j b
fU U
g2
( ) 1
( )
R
R
(20)
In order to avoid too much gradient of penalty function setting, it is necessary to make further adjustments. If the norm of equation (17) is more than the norm of the objective function plus 1, there:
b b
bb
f LL U
L
( ) 1 ( )( )
( )
R R
RR
(21)
So far, each branch’s resistance characteristic coefficient Ri can be solved by penalty function method. Above model can be realized through FORTRAN language program.
4. Summary
The design of ventilation and air conditioning system is not big but more complex, and the requirements of reliability is much higher than that of civil air-conditioning, noise and fan energy consumption is also should be strictly controlled. So it is necessary to optimize and adjust the pipeline network after the preliminary design and actual working condition simulation are finished. Before simulation optimization, deviation of some pipe flow is large. The deviation of pipe flow and design flow can be greatly reduced through adjustment of the fan model and part of the pipe diameter. A study shows that, the fan pressure head after optimization is nearly 10% less compared to the total head loss of the most unfavorable loop [7].
5. Symbols
Q — heat load W — moisture load
— heat to moisture ratio Nt — design temperature
— density N — relative humidity
t — temperature difference i — enthalpy
G — air supply volume — turbulence coefficient
L — length B — width
H — high F — area
d — diameter 0v — speed of air
x — dimensionless distance N — number of air outlet
rA — the Archimedes number — resistance coefficient along the way
fp — resistance along the way K — duct roughness
Re — Reynolds number — the Dynamic viscosity coefficient
mp
— local resistance — local resistance coefficient
www.intechopen.com

Advances in Spacecraft Systems and Orbit Determination
218
6. References
[1] Lu Yajun, Ma Zuiliang, Zou Pinhua. Heating, ventilating and air conditioning [M] Peking: China Architecture & Building Press, 2002
[2] Lu Yaoqing. Practical design manual for heating and air conditioning[M] Peking: China Architecture & Building Press, 2008
[3] Zhao Rongyi, Fan Cunyang, Xue Dianhua. Air condionding[M] Peking: China Architecture & Building Press, 1994
[4] Zheng Zhonghai, Zhang Jili, Liang Zhen. Numerical simulation of upside air-supply bottom-side air-return symmetric ventilation in space station cabin. Journal of Harbin Institute of Technology, 2007, Vol 39, No. 2, p 270-273
[5] Wang Shugang, Sun Duobin. Theory of steady flow pipe network[M] Peking: China coal industry press. 2007
[6] Wan Yaoqing, Liang Gengrong, Chen Zhiqiang. Common program compilation of optimization calculating method. Peking: Worker press, 1983
[7] Li Xiang-li, Wang Shu-Gang, Jiang Jun et al. Hydraulic simulation and optimization of manned spacecraft ventilating system. Dalian Ligong Daxue Xuebao/Journal of Dalian University of Technology, 2010, Vol 50, No. 3, p 399-403
www.intechopen.com
Advances in Spacecraft Systems and Orbit DeterminationEdited by Dr. Rushi Ghadawala
ISBN 978-953-51-0380-6Hard cover, 264 pagesPublisher InTechPublished online 23, March, 2012Published in print edition March, 2012
InTech EuropeUniversity Campus STeP Ri Slavka Krautzeka 83/A 51000 Rijeka, Croatia Phone: +385 (51) 770 447 Fax: +385 (51) 686 166www.intechopen.com
InTech ChinaUnit 405, Office Block, Hotel Equatorial Shanghai No.65, Yan An Road (West), Shanghai, 200040, China
Phone: +86-21-62489820 Fax: +86-21-62489821
"Advances in Spacecraft Systems and Orbit Determinations", discusses the development of new technologiesand the limitations of the present technology, used for interplanetary missions. Various experts havecontributed to develop the bridge between present limitations and technology growth to overcome thelimitations. Key features of this book inform us about the orbit determination techniques based on a smoothresearch based on astrophysics. The book also provides a detailed overview on Spacecraft Systems includingreliability of low-cost AOCS, sliding mode controlling and a new view on attitude controller design based onsliding mode, with thrusters. It also provides a technological roadmap for HVAC optimization. The book alsogives an excellent overview of resolving the difficulties for interplanetary missions with the comparison ofpresent technologies and new advancements. Overall, this will be very much interesting book to explore theroadmap of technological growth in spacecraft systems.
How to referenceIn order to correctly reference this scholarly work, feel free to copy and paste the following:
Xiangli Li (2012). Design and Optimization of HVAC System of Spacecraft, Advances in Spacecraft Systemsand Orbit Determination, Dr. Rushi Ghadawala (Ed.), ISBN: 978-953-51-0380-6, InTech, Available from:http://www.intechopen.com/books/advances-in-spacecraft-systems-and-orbit-determination/design-and-optimization-of-hvac-system-of-spacecraft