Embed Size (px)
Citation preview

Design and Implementation of an RPM Sensor and Power System for the Study and Optimization of Small Propellers
Research Professor: Dr. Brian German
By Michael Lopez
December 13, 2014

Abstract
This document details and describes the process of designing and implementing a power
supply system and a system for the measurement and analysis of the rotational speed of a
small propeller attached to a fixed mount. These propellers are often used in small aircraft
and are particularly useful today in the expanding applications of drones, both conventional
airplane and rotorcraft configurations. Through the use of RPM sensors, the rotational
speed of the motor and propeller can be measured and then compared with the theoretical
values produced by stress analysis. In order to quickly and accurately certify multiple
propellers, it is important that these systems be designed to be robust and easy to use.
List of Figures
Figure 1: Jameco Sensor Pin Diagram............................................................................................................................4
Figure 2: Control RPM Voltage......................................................................................................................................5
Figure 3: White Ring with Black Band RPM Voltage...................................................................................................5
Figure 4: Black Ring with White Band RPM Voltage...................................................................................................6
Figure 5: Half Black and Half White Colored Ring RPM Voltage
Figure 6: Sensor Mount and Colored Motor Ring
Figure 7: Resistor Circuit Diagram
Figure 8: Resistor Circuit and Jameco Optical RPM Sensor..........................................................................................9
Figure 9: Arduino Uno....................................................................................................................................................9
Figure 10: Brushless RPM Sensor................................................................................................................................10
Figure 11: Linear Power Supply...................................................................................................................................11
Figure 12: E-Flite Electronic Speed Controller
Figure 13: Astro Flight Inc. Servo Tester
Figure 14: E-Flite Brushless Motor
Figure 15: Sensor Output Signal versus Sample Index Example
Figure 16: Propeller Testing
2

I. Introduction
In order to perform analysis and eventual optimization of propellers, a number of subsystems must be designed
and created to accurately measure the performance and structural response of the propeller during testing. One of
these subsystems is for a sensor which measures and analyzes the rotation speed of the propeller in rotations per
minute. This information is critically important during a live test because the propeller must be certified at a rotation
speed based on the previously performed theoretical structural analysis of the propeller. In this process, both a
certification rotation speed and a experimental testing rotation speed are determined. The values of the sensor during
testing are then observed to ensure that the rotation speed of the propeller does not exceed the previously determined
values.
II. RPM Sensor Design
The first step in the process of designing and implementing this subsystem is the choice of sensor to be used for
the measurement and observation of the rotational speed of the motor. There are several different ways to measure
this speed. For this design, one specific sensor will be explained in detail and the others possible alternatives will be
mentioned and briefly discussed.
A. Jameco Optical RPM Sensor
The main sensor used throughout the analysis of the rotational speed of the propeller was the Jameco Optical
RPM Sensor. This sensor uses an infrared emitting diode and an NPN silicon photodarlington to measure the
response of reflecting the infrared beam off of a rotating surface. This sensor was mounted onto the test stand in a
fixed position and pointed directly down at the spinning motor. The sensor was oriented vertically at the motor
rather than horizontally at the propeller because the wooden or plastic material of the propeller is unreliable for
reflecting the infrared beam and in addition, the sensor provides much better data when the reflective surface is a
constant without gaps. The pin layout of the sensor is shown below in Fig. 1. The optical sensor is shown mounted
to the test stand in Fig. 6.
3

Figure 1: Jameco Sensor Pin Diagram
B. Colored Motor Ring
In addition to the mounting of the sensor, it was necessary to enhance and standardize the reflective properties of
the spinning motor. This was done to create a constant, periodic response from the sensor which could easily be
analyzed to produce a rotational speed. To achieve this, a specifically colored ring was attached to the motor. Four
different surfaces were analyzed: the control surface with just the motor, the motor with a black ring with a single
white band, the motor with a white ring with a single black band, and the motor with a half black and half white
colored ring. Each of these was analyzed without a propeller attached to determine which produced the most useful
results for analysis. The plot of the input voltage versus the converted RPM output voltage is shown below in Fig. 2.
4

0.50 1.00 1.50 2.00 2.50 3.003.703.753.803.853.903.954.004.054.104.154.20
Control 3 Volt Input
Potentiometer Voltage (V)
RPM
Vol
tage
(V)
Figure 2: Control RPM Voltage
The data for the control shows that even at a constant 3V input voltage, the output response is very erratic and
irregular. This is due to the fact that the motor surface is not regularly colored and will reflect the infrared beam
irratically and randomly. This is the reason for the use of a colored band.
Due to the reflective behavior of the color white and the absorbing behavior of the color black, the two colors
would produce different results when hit with the infrared beam. The first ring tested was a white ring with a single
black band. The results of this test are shown below in Fig. 3.
0.50 1.00 1.50 2.00 2.50 3.003.303.353.403.453.503.553.603.653.703.753.803.853.903.954.00
White Ring with Black Band 3 Volt Input
Potentiometer Voltage (V)
RPM
Vol
tage
(V)
Figure 3: White Ring with Black Band RPM Voltage
5
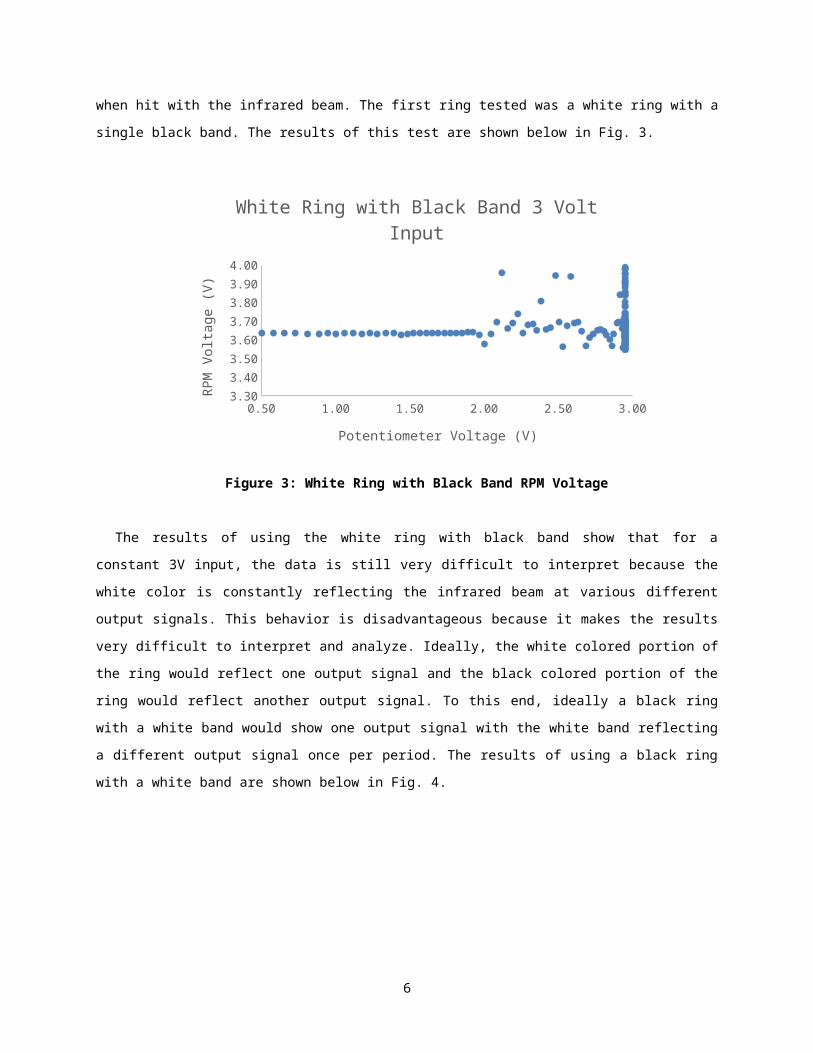
The results of using the white ring with black band show that for a constant 3V input, the data is still very
difficult to interpret because the white color is constantly reflecting the infrared beam at various different output
signals. This behavior is disadvantageous because it makes the results very difficult to interpret and analyze. Ideally,
the white colored portion of the ring would reflect one output signal and the black colored portion of the ring would
reflect another output signal. To this end, ideally a black ring with a white band would show one output signal with
the white band reflecting a different output signal once per period. The results of using a black ring with a white
band are shown below in Fig. 4.
0.00 0.50 1.00 1.50 2.00 2.50 3.00 3.503.80
3.85
3.90
3.95
4.00
4.05
4.10
4.15
4.20
Black Ring with White Band 3 Volt Input
Potentiometer Voltage (V)
RPM
Vol
tage
(V)
Figure 4: Black Ring with White Band RPM Voltage
These results again show that for a constant input voltage of 3V, the results are still very difficult to interpret.
This could be due to the sensitivity of the sensor or the inability of the sensor to distinguish between the black and
white colored sections of the ring. The final ring that was tested was a half black and half white ring. This gave the
best chance of producing two different constant output values. The plot of the output signal versus a sample index is
shown below in Fig. 5.
6

0 20 40 60 80 100 120 140 160 180 200500
550
600
650
700
750
800
850
Optical Sensor on Half Black and Half White Colored Ring
Sample Index
Sign
al O
utpu
t
Figure 5: Half Black and Half White Colored Ring RPM Voltage
The results of testing using the half black and half white colored ring show two different constant values with a
small number of transient values in between. This result can be easily analyzed to determine a period and then a
rotational speed. In order to determine a period, a specific output sensor value was chosen and the time difference
between the first occurrence and the second occurrence of this value were noted. The two closest data points to this
sensor value were used to interpolate the time for the specific value using Eqn. 1 and Eqn. 2.
m=y2− y1
t 2−t 1 (1)
t p=t 1+y p− y1
m (2)
The difference between the two signal times are converted to a rotational speed using Eqn. 3.
RPM= 60t p ,2−t p , 1
(3)
The mounted sensor and the half white and half black ring are shown below in Fig. 6.
7

Figure 6: Sensor Mount and Colored Motor Ring
C. Resistor Circuit
Before the data can be analyzed, the output signal must be amplified to widen the signal range and make the data
easier to interpret. For this optical sensor, the circuit diagram used is shown below in Fig. 7.
Figure 7: Resistor Circuit Diagram
The final soldered circuit with jumper cables to connect to the Arduino as well as the unmounted optical sensor
are shown below in Fig. 8.
8

Figure 8: Resistor Circuit and Jameco Optical RPM Sensor
D. Arduino Connection
The controller used to collect the signal data from the Jameco Optical RPM Sensor was an Arduino Uno
microcontroller. The resistor circuit was connected to the Arduino using jumper cables as shown in Fig. 7 and Fig. 8.
The Arduino was then connected to the computer using a USB B-type connector cable. The Arduino Uno is shown
below in Fig. 9.
Figure 9: Arduino Uno
9

E. Possible Alternatives
In addition to the Jameco Optical RPM Sensor, two additional sensors were examined and compared. These
RPM sensors were the Eagle Tree Optical RPM sensor and the Eagle Tree Brushless RPM Sensor. The Eagle Tree
Optical sensor was an improved optical sensor which would provide more accurate readings than the Jameco sensor
while the brushless RPM sensor measured the rotation speed of the propeller based on the voltage difference being
commanded by the electronic speed controller. However, when these two sensors were examined and used to
analyze the rotational speed of the spinning motor, it was observed that the sensor output data did not provide a wide
enough range of values to analyze for a potential periodic pattern. This is due to the fact that no resistor circuit was
used to amplify the difference in the output signal. In the future, it may be possible to use these two sensors by
designing and implementing a resistor circuit similar to the one used for the Jameco sensor. The Eagle Tree
Brushless RPM Sensor is shown below in Fig. 10.
Figure 10: Brushless RPM Sensor
10

III. Motor Control
The other important subsystem in the analysis of these propellers is the electrical power and motor system. This
system consists of a linear power supply, a servo tester, an ammeter, an electronic speed controller, and a brushless
motor.
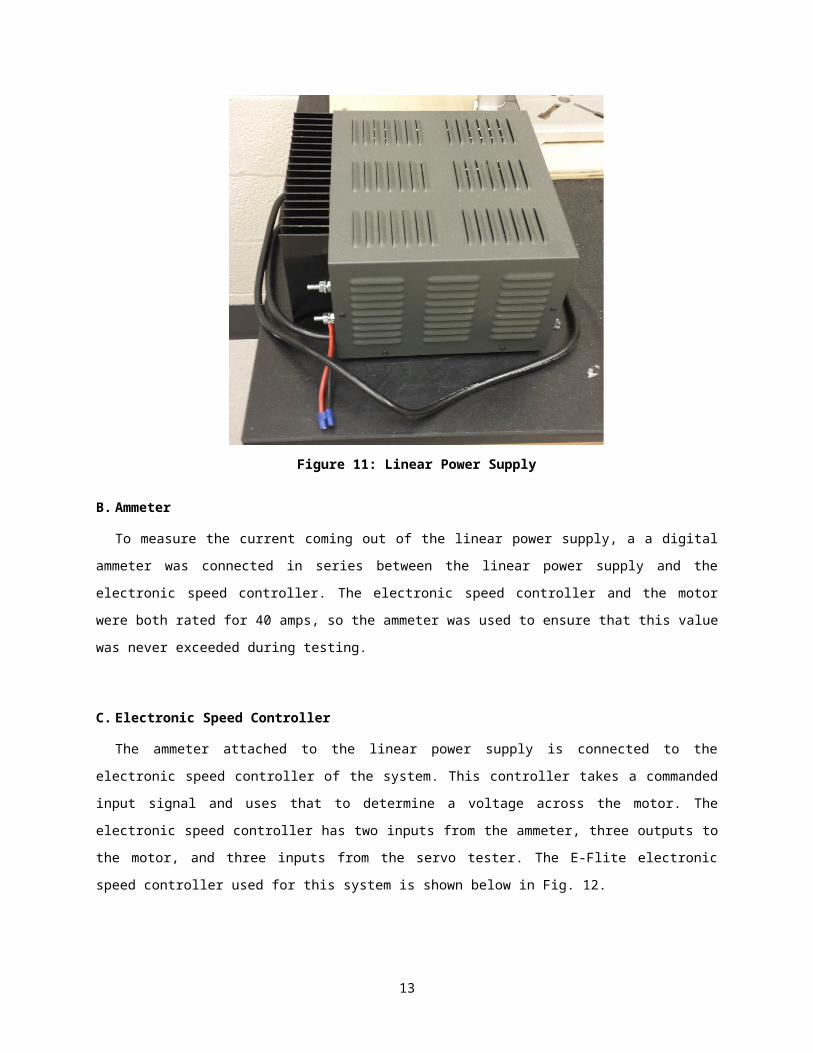
A. Linear Power Supply
The power to the motor is provided by a linear power supply. This power supply converts the AC current coming
out of the wall to a DC current. In addition, it steps down the voltage. It does this using resistors instead of a more
conventional power supply, which would use transistors. The linear power supply used for this setup is shown in
Fig. 11 below.
Figure 11: Linear Power Supply
B. Ammeter
To measure the current coming out of the linear power supply, a a digital ammeter was connected in series
between the linear power supply and the electronic speed controller. The electronic speed controller and the motor
were both rated for 40 amps, so the ammeter was used to ensure that this value was never exceeded during testing.
11

C. Electronic Speed Controller
The ammeter attached to the linear power supply is connected to the electronic speed controller of the system.
This controller takes a commanded input signal and uses that to determine a voltage across the motor. The electronic
speed controller has two inputs from the ammeter, three outputs to the motor, and three inputs from the servo tester.
The E-Flite electronic speed controller used for this system is shown below in Fig. 12.
Figure 12: E-Flite Electronic Speed Controller
D. Servo Tester
The servo tester in this system is used similarly to a potentiometer as a way to command the input signal to the
electronic speed controller. The servo tester is marked in milliseconds which signify the pulse length of the signals.
As the pulse length is increased, the current of the linear power supply is increased and the rotational speed of the
motor is increased as well. The Astro Flight Inc. servo tester used for this setup is shown in Fig. 13 below.
Figure 13: Astro Flight Inc. Servo Tester
12
E. E-Flite Brushless Motor
The final part of the power subsystem is the motor. The brushless motor takes the commanded signal from the
electronic speed controller and converts it into a mechanical, rotational motion. The motor is mounted onto the test
stand in a fixed position. The E-Flite brushless motor used for this setup is shown in Fig. 14 below.
Figure 14: E-Flite Brushless Motor
IV. RPM Sensor Analysis
Once the data has been collected, it must be analyzed to determine the average rotational speed of the motor
during the test. There are multiple ways to do this analysis but for the purposes of this test, one particular method
was used using an Arduino code, an Excel spreadsheet, and a MATLAB code.
F. Arduino Data Gathering Code
The first step in the data analysis is the code which gathers the data from the optical sensor. This is done by the
Arduino microcontroller. The data is gathered and then printed to the serial monitor in a column vector which is
displayed on the computer screen. The code for this process is shown in the appendix labeled as
Servo_RPM_read.ino.
G. Excel Spreadsheet
The next step in the data analysis process is to import the column vector data from the Arduino serial monitor
into an Excel spreadsheet. This data is then plotted versus a sample index. One example is shown below in Fig. 15.
13

0 100 200 300 400 5000
50
100
150
200
250
300
3D Printed 9x6 Propeller at 1.5 ms Throttle Set-ting
Sample Index (~)
Sens
or O
utpu
t Sig
nal (
~)
Figure 15: Sensor Output Signal versus Sample Index Example
This plot is important because by examining the graphical data, a specific point can be chosen as the designated
point for the period analysis. In the plot shown above, the output signal value of 30 was chosen because it occurs on
a positively sloped portion of the graph and it only occurs once per period. This makes it simple to determine the
period between each time when the signal reaches that value.
The other step performed in the Excel spreadsheet is to take the column vector of output signals and transpose it
into a row vector. The row vector is much easier to import into MATLAB.
H. MATLAB Code
The final step in the analysis process is to take the data and the chosen signal value from Excel and use these to
determine the average RPM of the motor. This is done using the RPManalysis.m code shown in the appendix. The
time at which the signal value occurs is calculated using the interpolation previously shown in Eqns. 1 and 2. The
RPM between each of these points is then calculated using Eqn. 3. Finally, these RPM values are averaged to
produce a final average RPM for the duration of the test. One other necessary value for this analysis is the sampling
time commanded by the Arduino. For the duration of this testing, the sampling time was assumed to be the Arduino
Uno’s optimum sampling time of 10,000 samples per second. However, most likely, the actual sampling time is
slightly lower than this optimum value. In order for the data analysis to be accurate, the sampling time of the
Arduino must be exactly determined.
14

I. Arduino Analysis Code
The only drawback to the previously described analysis process is that it requires three steps in three different
programs. One alternative to this lengthy process is to create a more complicated Arduino code which calculates the
RPM of the motor directly. The problem with this approach is that it can be difficult to predict where a suitable
chosen signal output value will occur. For each propeller and throttle setting, the range of suitable values can vary
greatly. The most current version of this code is shown in the appendix labeled as Servo_RPM_analysis.ino.
Currently, this code encounters problems with the Arduino’s tendency to round all numbers to integers.
V. Propeller Testing
Obviously, the purpose of all of this design work is to eventually produce some experimental results. Before any
propeller can be tested in a wind tunnel or other capacity, it must first be certified during a safety test. Using a
theoretical analysis, a maximum RPM value for each propeller based on stress analysis and a safety factor is
computed. The propeller is then placed inside the previously designed safety box environment and spun up to this
RPM value to ensure that the real propeller matches the performance predicted by the theoretical analysis. The setup
used for this testing was applied to a store bought propeller, a 3D printed 9x6 propeller, a wooden 9x6 propeller, and
a symmetrically curved 3D printed propeller. Each of these propellers was analyzed at throttle settings ranging from
minimum to maximum power. The final analyzed RPM versus current is shown below in Figure 16.
0 5 10 15 20 25 300
2000
4000
6000
8000
10000
12000
14000
f(x) = 255.158451981877 x + 5293.16069484715R² = 0.748228990970722
Propeller Test RPM Response
Current (amps)
RPM
Figure 16: Propeller Testing
15

The graph of RPM versus current shows a clear linear relationship. As the average RPM increases, the current
required to maintain this RPM increases as well. There is one outlier at the high current values which could be
attributed to variations in the performance motor, the electronic speed controller, or the power supply.
VI. Conclusion
The goal of these systems is to create a setup which can quickly and easily certify and eventually test the
performance of small, self-manufactured propellers. This certification process requires that the propellers be
mechanically proven to withstand the RPM value calculated using theoretical stress analysis as well as a built in
safety factor. Once these propellers are certified, they will be placed in a wind tunnel for the purposes of analyzing
the performance of the propllers in simulated flight situations.
VII. Appendix
Arduino Code: Servo_RPM_read
// initialize all variables, arrays, and the counterint RPMPin = 0;int RPMvalue;int Nsamples = 512;int RPMArray[512];int count = 0;
// For all tests, to keep the test as constant as possible, // the sensor was placed below .125 in below the bottom of the// motor and the lights in the room were turned off
void setup() { // initialize serial communication at 9600 bits per second:
Serial.begin(9600);}
void loop() {
delay(250); // read the RPM value from the sensor for (int i=1; i<Nsamples; i++) { RPMvalue = analogRead(RPMPin); RPMArray[i-1] = RPMvalue; } for (int i=1; i<Nsamples; i++) {
Serial.println(RPMArray[i-1]);} // use an infinite while loop to stop the void loop while(1<2){}
}
MATLAB Code: RPManalysis.m
16

function avgRPM = RPManalysis%input sample rate (samples per second)SampleRate = 10000;%input the RPM sensor signal data from the arduino. Data is transposed from%a column vector to a row vector in ExcelSignal = [data is placed here];%determine the number of data pointsArraySize = size(Signal);num = ArraySize(2);%create the corresponding array of timeTime = ones(1,num);for n = 1:num Time(n) = (n/SampleRate);end%choose a signal output value between 550 and 800point = 180;PointTimes = [];%Interpolate to find all the time values when the signal crosses your%chosen output valuefor i = 1:num-1 if Signal(i) < point && Signal(i+1) > point slope = (Signal(i+1)-Signal(i))/(Time(i+1)-Time(i)); tvalue = Time(i)+ (point-Signal(i))/slope; PointTimes = [PointTimes, tvalue]; endend%Use these time values to find the period and convert to RPMRPMArray = [];ArraySize2 = size(PointTimes);NumPoints = ArraySize2(2);for j = 1:NumPoints-1 Period = PointTimes(j+1)-PointTimes(j); RPM = (1/Period)*60; RPMArray = [RPMArray RPM]end%Take an average of the calculated RPMsavgRPM = mean(RPMArray)end
Arduino Code: Servo_RPM_analysis.ino
// initialize all variables, arrays, and the counterint SignalPin = 0;int Signalvalue;int Nsamples = 512;int SignalArray[512];int point = 700;int TimeArray[10];int SampleRate = 10000;int count = 0;int RPMArray[10];int RPMsum = 0;int RPMavg;int Period;int RPM;int avgRPM;
17

int slope;int time; void setup() { // initialize serial communication at 9600 bits per second: Serial.begin(9600);} void loop() { delay(250); // read the RPM value from the sensor. place these sensor // values into an array for (int i=1; i<Nsamples; i++) { Signalvalue = analogRead(SignalPin); SignalArray[i-1] = Signalvalue; } // determine when the chosen value is crossed in the data. // choose this crossing to be when the signal is increasing. // interpolate between the two data points on either side of // the chosen value to find the crossing time of that value // place all of these times into an array Serial.println('Chosen Point Crossing Times'); for (int i=1; i<Nsamples; i++) { if(SignalArray[i-1] < point && SignalArray[i] > point) { slope = (SignalArray[i]-SignalArray[i-1])/(1/SampleRate); // multiply by 10000 because Arduino rounds all decimals time = ((i/SampleRate) + (point-SignalArray[i-1])/slope)*10000; TimeArray[count] = time; Serial.println(time); count = count + 1; } } // calculate the RPM between each of the times in the time array // place all of these RPMs into an array Serial.println('RPM values'); for (int i=1; i<11; i++) { Period = TimeArray[i]-TimeArray[i-1]; // when calculating RPM, multiply by 10000 again RPM = 60*10000/Period; Serial.println(RPM); RPMArray[i-1] = RPM; } // take an average of the RPMs in the RPM array to get a final // value for the average RPM of the test Serial.println('Average RPM'); // add up all the RPM terms in the RPM array. then divide by // the number of terms to get an average for (int i=1; i<(count+1); i++) { RPMsum = RPMsum + RPMArray[i-1]; } RPMavg = RPMsum / count; Serial.println(RPMavg); // use an infinite while loop to stop the void loop while(1<2){ }}
18