Embed Size (px)
Citation preview
DESIGN AND DEVELOPMENT OF REAL TIME POWER QUALITY
MONITORING SYSTEM
NOOR ATHIRA BINTI ABIDULLAH
A report submitted in partial fulfillment of the requirements for the degree
of Bachelor in Electrical Engineering ( Industrial Power )
Faculty of Electrical Engineering
UNIVERSITI TEKNIKAL MALAYSIA MELAKA
YEAR 2012/2013
“I hereby declare that I have read through this report entitle “Design and Development of
Real Time Power Quality Monitoring System” and found that it has comply the partial
fulfilment for awarding the degree of Bachelor of Electrical Engineering (Industrial
Power)”.
Signature : ………………………………..
Supervisor’s Name : Dr. Abdul Rahim bin Abdullah
Date : ...................................................
“I declare that this report entitle “Design and Development of Real Time Power Quality
Monitoring System” is the result of my own research except as cited in the references. The
report has not been accepted for any degree and is not concurrently submitted in
candidature of any other degree”.
Signature : ………………………………..
Name : Noor Athira binti Abidullah
Date : ..........................................

i
ACKNOWLEDGEMENT
In the name of Allah, the Most Gracious and the Most Merciful.
Alhamdulillah, all praises to Allah for the strengths and His blessing in completing
this thesis. During the course of my thesis work, there were many people who were
instrumental forwards my accomplishing the task before me. Without their guidance, help
and patience, I would have never been able to accomplish the work of my final year project.
I would like to take this opportunity to acknowledge some of them.
Special appreciation goes to my supervisor, Dr Abdul Rahim bin Abdullah, for his
supervision and constant support. His invaluable help of constructive comments and
suggestions throughout the experimental and thesis works have contributed to the success
of this project.
I would like to express my appreciation to all lecturers at the Faculty of Electrical
Engineering for their guidance to help me to make the project successful. My
acknowledgement also goes to all the technicians and office staffs for their co-operations.
Last but not least, my deepest gratitude goes to my beloved parents; Abidullah bin
Haji Salleh and Rosmala binti Ramli also to my sisters and my brother for their endless
love, prayers and encouragement. To those who indirectly contributed in this research,
your kindness means a lot to me. Thank you very much.
ii
ABSTRACT
The increasing of sensitive electrical equipment in our technologies is the biggest issues
contributor to power line system. The quality of electrical power supplied becomes more
concern to customers or electric users. The power quality events will affect manufacturing
process, failure of equipment and economic losses. The developments that have been used
today are not user friendly and costly. In addition, the equipment that available in the
market cannot monitor and stored the data efficiently. Then, the user cannot check the
performance of the power line system. This project presents a design and development of
real time power quality monitoring system. The system can measure, display and record
parameters as well as classify power quality signals from power line system. The
measured parameters are calculated from voltage and current signal such as root mean
square (RMS) voltage and current, real power, apparent power, reactive power, frequency
and power factor. In addition, by using these parameters, the power quality signals such as
swell, sag, interruption, under voltage and over voltage are classified based IEEE standard
1159-2009. The voltage and current signals are captured by using NI USB 6009 data
acquisition (DAQ) system to convert the analogue signal to digital and then transfer to
computer. The DAQ system is chosen because some of its characteristic available gives
great advantages upon its usage for this project. Small and portable of physical size can
easily bring and move from one place to another place. In addition, the usage of USB as a
communication link between personal computer and NI USB 6009 is convenient for either
use with laptop or desktop, thus no external supply is needed because it is powered by
USB. Besides that, user friendly software is developed on computer by using Visual Basic
2006 to calculate, display, classify and record the power quality signals parameters. This
project also shows high accuracy monitoring system that presents very low absolute
percentage error (APE) measurements and suitable for power quality monitoring purpose.
iii
ABSTRAK
Peningkatan peralatan elektrik yang sensitif dalam teknologi terkini menyumbang
masalah terbesar dalam sistem talian kuasa. Kualiti bekalan kuasa elektrik menjadi
perhatian yang lebih kepada pengguna atau pengguna elektrik. Isyarat kuasa elektrik akan
mempengaruhi proses pengeluaran, kegagalan peralatan dan kehilangan ekonomi.
Pembangunan sistem yang digunakan hari ini tidak mesra pengguna dan mahal. Selain itu,
peralatan yang berada di pasaran tidak dapat memantau dan penyimpan data dengan cekap.
Pengguna juga tidak dapat memeriksa kemajuan sistem talian kuasa. Projek ini
menunjukan sebuah rekabentuk dan pembangunan pemantau kualiti kuasa masa nyata.
Sistem ini dapat mengukur, memapar dan merekod parameter dan juga mengklasifikasi
isyarat kualiti kuasa daripada sistem talian kuasa. Parameter yang diukur dikira daripada
isyarat voltan dan arus seperti voltan dan arus RMS, kuasa sahih, kuasa reaktif, kuasa
ketara, frekuensi dan factor kuasa. Selain itu, dengan menggunakan parameter ini, isyarat
kualiti kuasa seperti membengkak, mengendur, gangguan, voltan tinggi, voltan rendah
diklasifikasikan berdasarkan standard IEEE 1159-2009. Isyarat voltan dan arus diambil
dengan menggunakan NI USB 6009 pengambilan alihan data (DAQ) untuk menukar
isyarat analog kepada diskret dan kemudiannya dihantar ke komputer. DAQ sistem dipilih
kerana kriteria yang ada memberikan kelebihan penggunaan untuk projek ini. Fizikal kecil
dan boleh ubah dengan mudah dibawa dari satu tempat ke tempat yang lain. Selain itu juga,
penggunaan USB sebagai jaringan komunikasi di antara komputer dan DAQ adalah mudah
samada untuk penggunaan komputer. Oleh itu, bekalan luaran tidak diperlukan kerana
ianya dibekalkan oleh kuasa dari USB. Selain itu, Perisian mesra pengguna dibangunkan di
komputer dengan menggunakan Visual Basic 2006 untuk mengira, memapar,
mengklasifikasi dan merekod parameter isyarat kualiti kuasa. Projek ini juga menunjukkan
ketepatan yang tinggi dimana memberikan peratus ralat mutlak yang sangan rendah
perngukuran dan sesuait digunakan untuk tujuan pemantauan kualiti kuasa.
iv
TABLE OF CONTENT
CHAPTER TITLE PAGE
ACKNOWLEDGEMENT i
ABSTRACT ii
ABSTRAK iii
TABLE OF CONTENT iv
LIST OF TABLES viii
LIST OF FIGURES ix
LIST OF APPENDICES xii
1 INTRODUCTION 1
1.1 Project Background 1
1.2 Problem Statement 2
1.3 Project Objectives 3
1.4 Project Scopes 4
2 LITERATURE REVIEW 5
2.1 Introduction 5
2.2 Power Quality 5
2.3 Power Quality Events 7
2.3.1 Transients 8
2.3.1.1 Impulsive Transient 9
2.3.1.2 Oscillatory Transient 9
2.3.2 Waveform Distortion 10
v
2.3.2.1 Harmonics 10
2.3.2.2 Notching 11
2.3.2.3 Noise 12
2.3.3 Short Duration Voltage Variations 13
2.3.3.1 Voltage Sags ( dips ) 13
2.3.3.2 Voltage Swells (surges) 14
2.3.4 Long Duration Voltage Variation 15
2.3.4.1 Over Voltage 15
2.3.4.2 Under Voltage 16
2.3.5 Interruptions 16
2.3.5.1 Momentary Interruption 17
2.3.5.2 Temporary Interruption 17
2.3.5.3 Long Term Interruption 17
2.4 Power Quality Monitoring System 18
2.5 Microsoft Visual Basic 2006 22
2.6 Data Acquisition Card 23
3 METHODOLOGY 25
3.1 Introduction 25
3.2 Project Development 25
3.2.1 Hardware Development 29
3.2.2 Software Development 31
3.3 Power Signal Measurements 35
3.3.1 Voltage Measurement 35
3.3.2 Current Measurement 36
3.3.3 Real Power 37
3.3.4 Reactive Power 38
3.3.5 Apparent Power 38
3.3.6 Power Factor 38
3.3.7 Fourier Transform 39
3.3.8 Frequency Measurement 39
vi
4 RESULT, DISCUSSION AND ANALYSIS 41
4.1 Introduction 41
4.2 Power Quality Signals Classification 45
4.2.1 Normal Signal 45
4.2.2 Voltage Sags (dips) 46
4.2.3 Voltage Swells (surges) 47
4.2.4 Over Voltage 48
4.2.5 Under Voltage 49
4.2.6 Interruptions 50
4.3 Results from System 51
4.3.1 Normal Voltage 51
4.3.2 Voltage Sags 53
4.3.3 Voltage Swells 54
4.3.4 Over Voltage 56
4.3.5 Under Voltage 57
4.3.6 Interruptions 59
4.4 Performance Analysis of the System 60
5 CONCLUSION AND RECOMMENDATION 69
5.1 Introduction 69
5.2 Conclusions 70
5.3 Recommendations 70
REFERENCES 72
APPENDIX 75
vii
LIST OF TABLES
TABLE TITLE PAGE
2.1 Categories and Typical Characteristics of Power System
Electromagnetic Phenomena 6
2.2 Categories and Typical Characteristics of Power Quality Signal 8
4.1 Comparison of voltage between PQMS and PQA 61
4.2 Comparison of current between PQMS and PQA 62
4.3 Comparison of real power between PQMS and PQA 65
4.4 Comparison of reactive power between PQMS and PQA 66
4.5 Comparison of apparent power between PQMS and PQA 67
viii
LIST OF FIGURES
FIGURE TITLE PAGE
1.0 Block diagram of the project 4
2.1 Impulsive Transient 9
2.2 Oscillatory Transient 10
2.3 Harmonics 11
2.4 Root Cause of Harmonics Problem 11
2.5 Notching 12
2.6 Noise 12
2.7 Root Cause of Noise Problem 13
2.8 Voltage Sags (dips) 14
2.9 Root Cause of Voltage Sag 14
2.10 Voltage Swells (surges) 15
2.11 Over voltage 16
2.12 Under voltage 16
ix
2.13 (a) Momentary Interruption, (b) Temporary Interruption,
(c) Long-term Interruption 18
2.14 NI USB-6008/6009 Pinout 24
3.1 Flowchart of Project Methodology 27
3.2 Block Diagram of Real Time Power Quality Monitoring System 28
3.3 Flowchart of Hardware Development 29
3.4 Flowchart of Software Development 31
3.5 Main Form of the Monitoring System Software 32
3.6 Sub Main Form of the Monitoring System Software 33
3.7 Block Diagram of Interface Development 34
3.8 Example of data has been stored in notepad 35
3.9 Voltage Transducer 36
3.10 Current Transducer 37
3.11 Signal in time domain and frequency domain 40
4.1 Real Time Power Quality Monitoring System 42
4.2 Main form display on computer 42
4.3 Signal calculation 43
4.4 Signal Graph form display on computer 43
4.5 Recorded Data 44
4.6 (a) Waveform of Normal Signal (b) Power Spectrum of
x
Normal Signal 45
4.7 (a) Voltage Sags Waveform (b) Power Spectrum of Voltage Sags 46
4.8 (a) Voltage Swells Waveform (b) Power Spectrum of Voltage Swells 47
4.9 (a) Overvoltage Waveform (b) Power Spectrum of Overvoltage 48
4.10 (a) Under voltage Waveform (b) Power Spectrum of Under voltage 49
4.11 (a) Interruption Waveform (b) Power Spectrum of Interruption 50
4.12 Normal Voltage Waveform and Power Spectrum of Normal Voltage 51
4.13 Classification of Normal Voltage 52
4.14 Voltage Sags Waveform and Power Spectrum of Voltage Sags 53
4.15 Classification of Voltage Sags 53
4.16 Voltage Swells Waveform and Power Spectrum of Voltage Swells 54
4.17 Classification of Voltage Swells 55
4.18 Over Voltage Waveform and Power Spectrum of Over Voltage 56
4.19 Classification of Over Voltage 56
4.20 Under Voltage Waveform and Power Spectrum of Under Voltage 57
4.21 Classification of Under Voltage 58
4.22 Interruption Waveform and Power Spectrum of Interruption 59
4.23 Classification of Interruption 59
4.24 Comparison voltage and current between PQMS and PQA 60
4.25 Voltage and Current Verification 63
4.26 Comparison real power, reactive power and apparent power between
xi
PQM and PQA 64
4.27 Power Measurement Verification 68
xii
LIST OF APPENDICES
APPENDIX TITLE PAGE
A Visual Basic Program 74
B Testing 88
C Milestones 90
D Gantt Chart 92
E Turnitin 94
1
CHAPTER 1
INTRODUCTION
1.1 Project Background
The rapidly growing use of electrical equipment in our technologies is the biggest
contributor to power quality problem. The electrical power quality of power system has
become an important issue and heightened of awareness of power quality among the
electricity users [1]. The ability to maintain voltage and current signals with constant
amplitude and constant fundamental frequency presents the quality of electrical power
supplied to the customers [2]. The small interruption of power quality event can cause
equipment failure and economical loss. The power quality events are voltage swell, voltage
sag, under voltage, over voltage, interruption, harmonic, interharmonics, transient and
notching [3].
Monitoring and analysis of power line waveforms are assessment of power quality
events. It’s essential to measure voltage, current, frequency, harmonic distortion and
waveform to monitor the power quality. The use of power quality monitoring is to locate
the source of the events that occurs. Some of monitoring system applied is Data acquisition
board or DSP processor for monitoring power quality in real time [4]. The monitoring and
analysis of power quality process are very important to overcome and provide
improvement in power system infrastructure.
2
The parameters of the power quality are characterized by voltage signal in RMS
value (voltage and current), frequency, real power, reactive power, apparent power and
power factor. The classification analysis is developed using based expert system in Visual
Basic 2006. On the other side, this monitoring system proof that the quality of the offered
power is within the pre-specified standards and analysis and record the data or information
for solving problems. Existing power quality monitoring needs improvement on their
capability, efficiently, reliability and accuracy [2].
This project presents a design and development of real time power quality
monitoring system. The system can monitor record and analyze the data from power line.
All the parameters that can be measured are voltage (rms), current (rms), frequency, real
power, reactive power, apparent power and power factor. The data will be recorded and
stored efficiently. As results, the performances of the power line system can be monitored
and analyzed.
1.1 Problem Statements
With the increase of loads sensitive to power disturbances and the drive to gain
profits, power quality has become a great concern. Sophisticated electronics devices are
being rapidly introduced into the market such as computers, telecommunications and
electronic process controls. All of these modern technologies require stable power supply
in order to achieve optimum reliability, compared to the oldest equipments. Any slight
disruptions in a power line can cause losses up to millions in an operating factory.
For the past 20 years, awareness of the power-quality problem has greatly
improved, with a report from Business Week (1991) stating that spikes, sags and outages
cost the US nation US$26 billion in downtime [14]. Contributing to this cost is lost time,
lost production, lost sales, delivery delays and damaged production equipment. Therefore,
there is a need to understand and improve the power quality problems. The source of the
power quality problem is not given, an unacceptable quality of power may be a utility’s
responsibility of the industrial facility.
3
The power quality events will affect many industries that can interrupt
manufacturing process, failure of equipment and economic losses. Before this, the user
only use the electricity but unknown of voltage and current that insert to the loads. The
measurements are taken by multimeter and the reading is taken manually. This will cause
an error when taking the readings. Other than that, the equipments in market nowadays can
only capture and print the data. In addition, the data cannot be monitor and stored
efficiently. Then, the user can not check the performance of the power line system. The
developments that have been used today are not user friendly and costly.
1.2 Project Objectives
The objectives of the project are:
1. To develop user friendly real time power quality monitoring system that can
measure and display power line parameters such as voltage (V), current (I),
frequency (f), real power (P), apparent power (S) and power factor (pf) on
the computer in real time.
2. To classify power quality signals such as normal, swell, sag, interruption,
under voltage and over voltage. The signals are classified based on IEEE
standard 1159-2009.
3. To analyze and verify the performance of the monitoring system. The
system is tested using real signals and the results are evaluated in terms of
accuracy of the measurements.
4
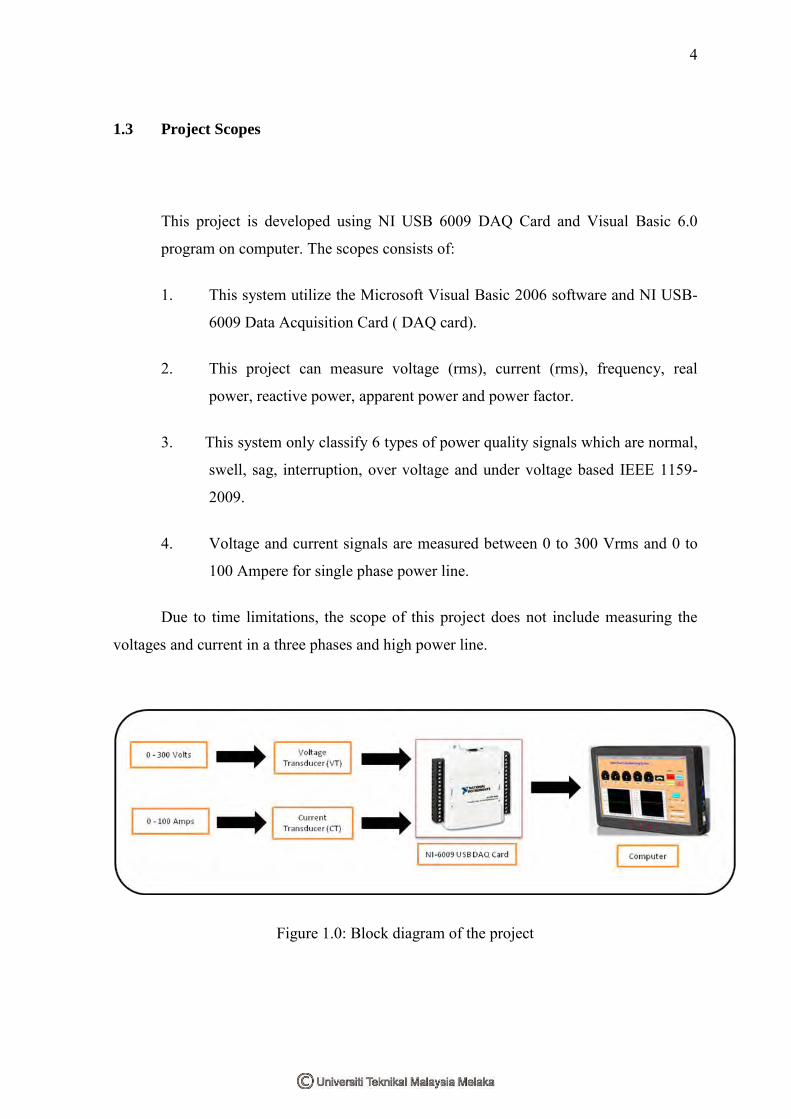
1.3 Project Scopes
This project is developed using NI USB 6009 DAQ Card and Visual Basic 6.0
program on computer. The scopes consists of:
1. This system utilize the Microsoft Visual Basic 2006 software and NI USB-
6009 Data Acquisition Card ( DAQ card).
2. This project can measure voltage (rms), current (rms), frequency, real
power, reactive power, apparent power and power factor.
3. This system only classify 6 types of power quality signals which are normal,
swell, sag, interruption, over voltage and under voltage based IEEE 1159-
2009.
4. Voltage and current signals are measured between 0 to 300 Vrms and 0 to
100 Ampere for single phase power line.
Due to time limitations, the scope of this project does not include measuring the
voltages and current in a three phases and high power line.
Figure 1.0: Block diagram of the project
5
CHAPTER 2
LITERATURE REVIEW
2.1 Introduction
Literature review is a body of text that aims to review the idea and understanding
about real time power quality monitoring system. This chapter describes the power quality
events, power quality measurement and power quality monitoring.
2.2 Power Quality
There is a need to elevate awareness among electricity users regarding power
quality events due to frequent recurrences of the problems [1]. In addition, power quality
measurement system is essential in order to perform quick measurement system and
reliable power quality monitoring. The power quality signals include voltage sags, voltage
swell, undervoltage, overvoltage, interruption, interharmonic, harmonic, notching, and
transient according to IEEE Std. 1159-2009. Based on the International Electrotechnical
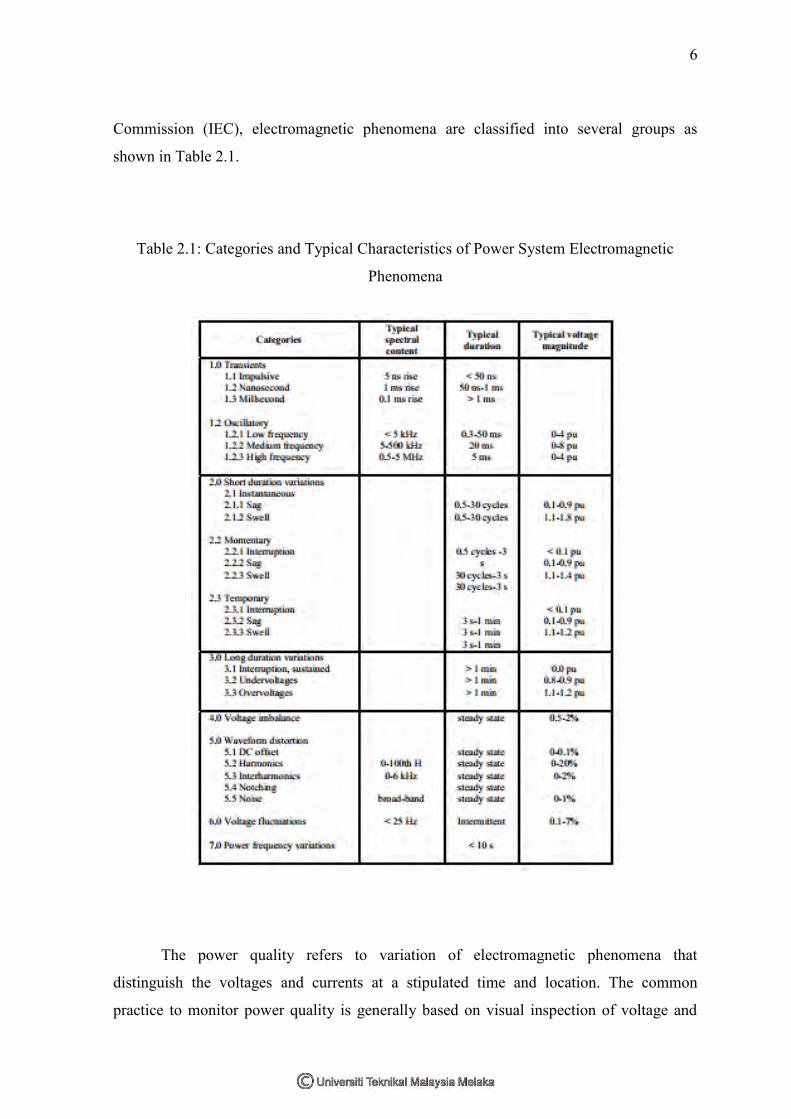
6
Commission (IEC), electromagnetic phenomena are classified into several groups as
shown in Table 2.1.
Table 2.1: Categories and Typical Characteristics of Power System Electromagnetic
Phenomena
The power quality refers to variation of electromagnetic phenomena that
distinguish the voltages and currents at a stipulated time and location. The common
practice to monitor power quality is generally based on visual inspection of voltage and
7
current waveforms identification [5]. Classification of power quality events, existing
problem solving and future problem anticipation can be detected with the monitoring
system. Other than that, conversion of analog voltages and currents in the power system to
sampled digital values can be processed automatically using power quality monitoring.
Once quality events are detected, they are classified into known waveforms for data
recording and analysis. The result of the data recording and analysis can assist in
determining the causes as well as solutions to mitigate these disturbances.
2.3 Power Quality Events
There are several common power quality events in power line system. It is
normally divided into 5 categories. They are [15]:
i. Transients
ii. Waveform Distortions
iii. Short Duration Voltage Variations
iv. Long Duration Voltage Variations
v. Interruptions
8
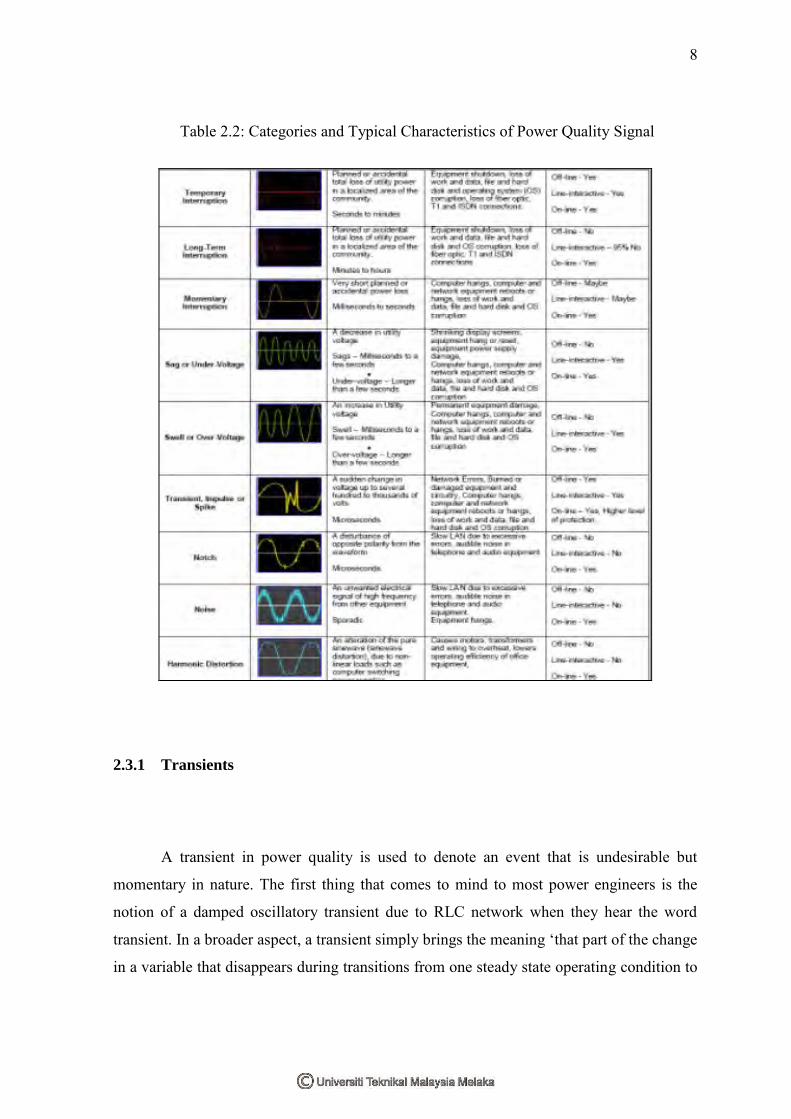
Table 2.2: Categories and Typical Characteristics of Power Quality Signal
2.3.1 Transients
A transient in power quality is used to denote an event that is undesirable but
momentary in nature. The first thing that comes to mind to most power engineers is the
notion of a damped oscillatory transient due to RLC network when they hear the word
transient. In a broader aspect, a transient simply brings the meaning ‘that part of the change
in a variable that disappears during transitions from one steady state operating condition to
9
another. Generally, transients can be classified into two categories, which are impulsive
transient and oscillatory transient.
2.3.1.1 Impulsive Transient
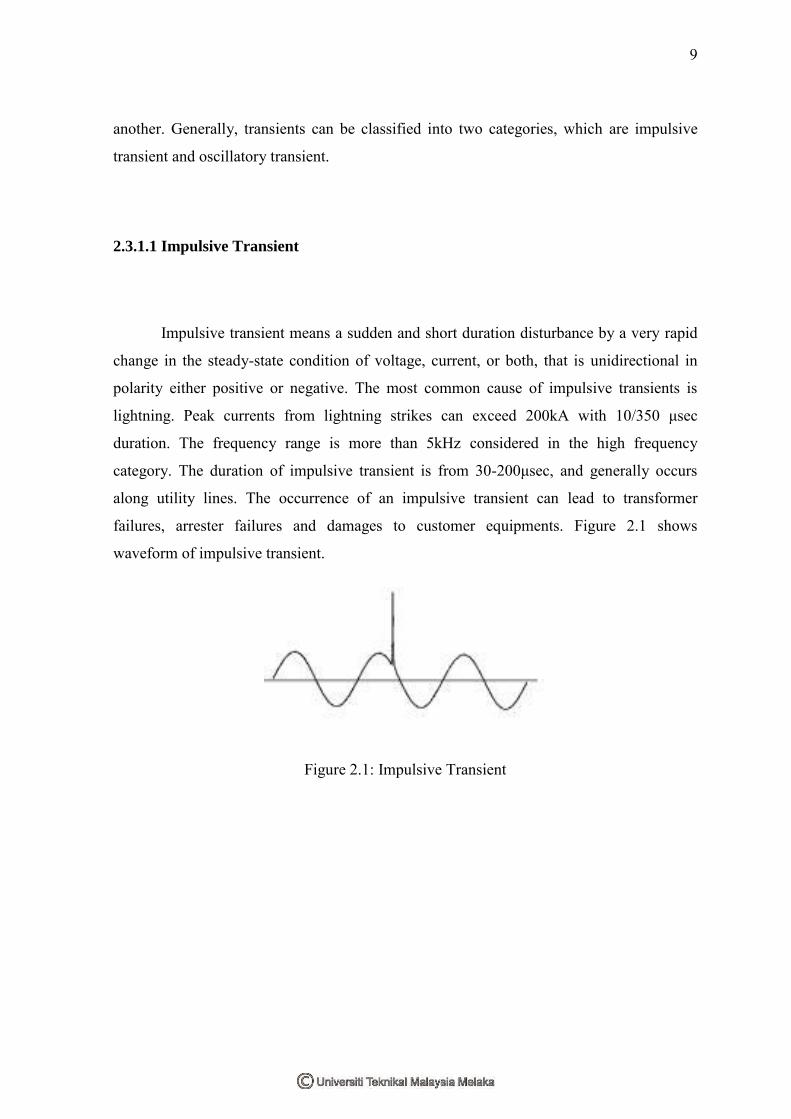
Impulsive transient means a sudden and short duration disturbance by a very rapid
change in the steady-state condition of voltage, current, or both, that is unidirectional in
polarity either positive or negative. The most common cause of impulsive transients is
lightning. Peak currents from lightning strikes can exceed 200kA with 10/350 μsec
duration. The frequency range is more than 5kHz considered in the high frequency
category. The duration of impulsive transient is from 30-200μsec, and generally occurs
along utility lines. The occurrence of an impulsive transient can lead to transformer
failures, arrester failures and damages to customer equipments. Figure 2.1 shows
waveform of impulsive transient.
Figure 2.1: Impulsive Transient


![U1 [] DSP: Motivation analoge ... · 30 Fouriertransformation DigitaleAudioverarbeitung Fouriertransformation, diskret siehe Matlab-Skript Signalverarbeitung [vdHeide] Digitale Audioverarbeitung](https://img.pdfslide.us/doc/110x75/5e55ef571c648333f70e9dc9/u1-dsp-motivation-analoge-30-fouriertransformation-digitaleaudioverarbeitung.jpg)