Embed Size (px)
Citation preview
ADVANCED ELECTROMAGNETICS, VOL. 8, NO. 2, FEBRUARY 2019
Design and Analysis of Nanoantenna Arrays for Imaging and SensingApplications at Optical Frequencies
Goktug Isıklar, Isa Can Cetin, Mustafa Algun, Ozgur Ergul
Department of Electrical and Electronics EngineeringMiddle East Technical University, Ankara, Turkey
*corresponding author, E-mail: [email protected]
AbstractWe present computational analysis of nanoantenna arraysfor imaging and sensing applications at optical frequencies.Arrays of metallic nanoantennas are considered in an accu-rate simulation environment based on surface integral equa-tions and the multilevel fast multipole algorithm developedfor plasmonic structures. Near-zone responses of the de-signed arrays to nearby nanoparticles are investigated indetail to demonstrate the feasibility of detection. We showthat both metallic and dielectric nanoparticles, even withsubwavelength dimensions, can be detected.
1. IntroductionIn recent years, the increasing interest in plasmonics hasbeen supported by rapid developments in fabrication tech-niques, leading to a widespread study of unique charac-teristics of nanostructures [1]. Thanks to their extensiveability of trapping and focusing electromagnetic waves insubwavelength regions, nanoantennas have been among themost attractive of such metallic structures to manipulatelight [2]. Plasmonic nanoantennas can be used in many ap-plications, such as energy harvesting [3, 4], nano-opticalfocusing [5, 6], nano-optical wireless networks [7, 8], aswell as bio-sensing [9, 10, 11, 12]. As shown in this study,nanoantennas can be excellent tools to detect metallic anddielectric nanoparticles for imaging and sensing applica-tions. Specifically, with their strong near-zone couplingproperties, nanoantennas may enable tracking nanoparti-cles, even of subwavelength sizes at optical frequencies.Since optimal arrangements of nanoantennas in terms ofcost, detection reliability, and fabrication feasibility are notwell known, extensive studies are needed to design nanoan-tenna arrays for effective nanoparticle detection.
Optimal arrangements of nanoantennas strongly de-pend on the selected shape, size, and material, as wellas the operating frequency. Due to their easier fabrica-tion, basic bowtie structures are frequently used in the lit-erature. In fact, despite their relatively simple geome-tries, bowtie nanoantennas can create intense hot spots attheir feed gaps [13]. The chosen material and the size ofnanoantennas are responsible for the resonance frequencyrange, where electromagnetic fields are strongly focused.In addition, the periodicity in the arrangements of multi-ple nanoantennas is one of the most important factors when
designing effective arrays for detection. This study is de-voted to the design of such arrays that have distinguishableresponses to nearby particles. Once a nanoantenna designis fixed based on the geometry and material, we investigatedistances between nanoantennas to construct small-scale ar-rays. Then, the electromagnetic responses of the designedarrays to different particles in diverse scenarios are rigor-ously investigated using a very accurate simulation envi-ronment.
Their sensitive responses to electromagnetic wavesmake nanoantennas challenging to analyze via computa-tional methods [14]. In this work, the fast and accu-rate implementation to analyze nanoantenna arrays andnearby particles is based on a modified combined tangen-tial (MCTF) formulation [15, 16] in the frequency domain.The effective complex permittivity values for metals areextracted from Lorentz-Drude models or measurement re-sults [17]. Constructed matrix equations via discretizationare solved by using the multilevel fast multipole algorithm(MLFMA) [18] that is developed for plasmonic media [19].By means of accurate simulations, various imaging andsensing scenarios are investigated in detail to demonstratethe feasibility of particle detection with nanoantenna arrays.
In the next section, we present the details of the numer-ical solver. Then, Section 3 includes the design of nanoan-tenna arrays for particle detection, followed by numericalresults in Section 4 and concluding remarks in Section 5.
2. Accurate Simulation Environment
Electromagnetic problems involving nanoantenna arraysand particles (to be detected) are solved in the frequency do-main. We particularly use MCTF [15] that is suitable to an-alyze metallic objects in wide ranges of optical frequencies.MCTF is discretized with the Rao-Wilton-Glisson (RWG)functions, leading to dense matrix equations. For a com-posite problem involving U + 1 regions labeled as Du foru = 0, 1, · · · , U , including the host medium (vacuum) D0,matrix equations can be written as
[Z11 Z12
Z21 Z22
]·[
xy
]=
[vw
], (1)

100 nm
20 nm
214 nm
14 nm
(a)
475 nm
475 nm
Nanoantennas
Particle
(b)
Nanoantennas Particle
Excitation
(c)
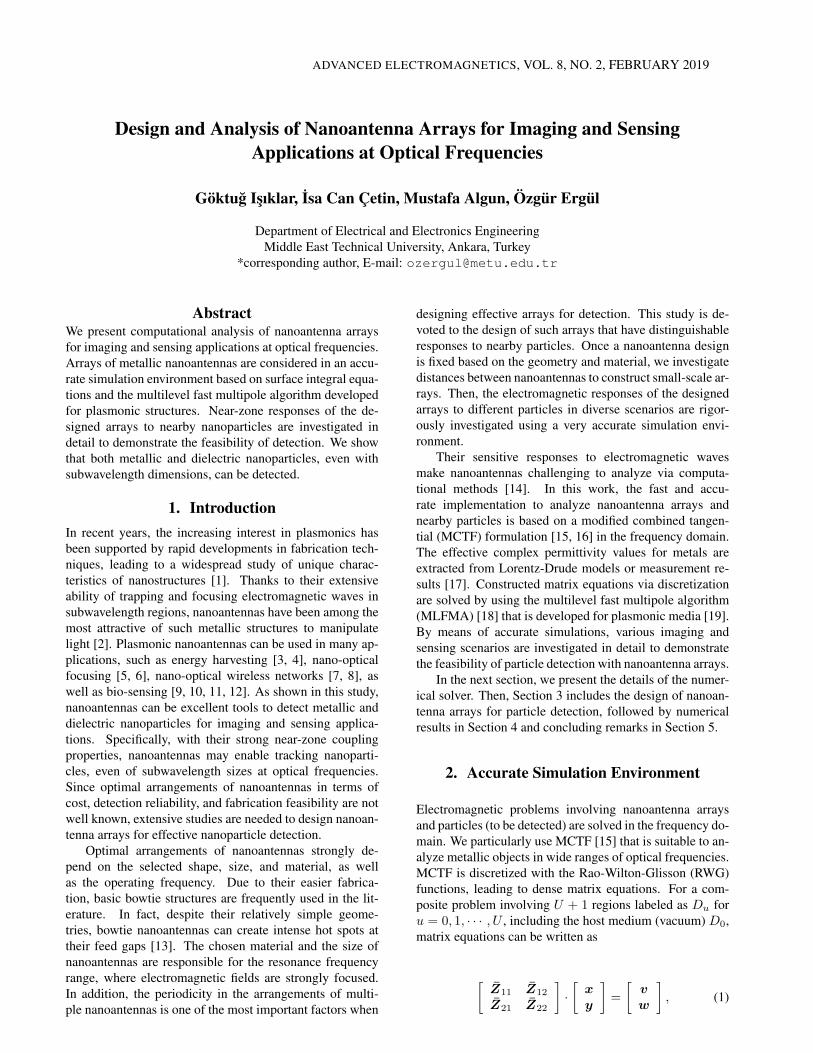
Figure 1: (a) The bowtie geometry for nanoantennas con-sidered in this paper. (b) An arrangement of 5× 5 nanoan-tennas with 475 nm periodicity and a spherical particle lo-cated in the vicinity. (c) Side view of the 5 × 5 array andthe particle located above it.
where
Z11 =
U∑u=0
ηuT u, Z12 = −U∑
u=0
Ku (2)
Z21 =U∑
u=0
ηuηu′Ku, Z22 =U∑
u=0
ηu′ T u (3)
v =U∑
u=0
vu, w =U∑
u=0
wu. (4)
In the above, x and y are arrays of expansion coefficientsfor equivalent electric and magnetic currents, respectively,while ηu =
√µu/√εu is the characteristic impedance of
medium u. In addition, u′ represents the domain that is
200 300 400 500 600 70035
40
45
50
55
60
65
70
Period (nm)
Enha
ncem
ent F
acto
r
dxdy
dx
dy
Figure 2: Power enhancement factor at the gap of an Agbowtie nanoantenna, when another identical nanoantennais placed at different nearby locations.
sharing the interface with domain u, at which the testing op-eration is applied. Electromagnetic interactions (discretizedoperators) are derived as
T u[m,n] = ξm,uξn,u
∫Sm
drtm(r) · T u{bn}(r) (5)
Ku[m,n] = ξm,uξn,u
∫Sm
drtm(r) ·Ku{bn}(r), (6)
where tm and bn represent testing and basis functions,ξn,u, ξm,u = ±1 represent orientations of testing/basisfunctions with respect to domain u, while the integro-differential operators can be written as
T u{X}(r) = iku
∫dr′X(r′)gu(r, r
′)
+i
ku
∫dr′∇′ ·X(r′)∇gu(r, r′) (7)
Ku{X}(r) =∫
PVdr′X(r′)×∇′gu(r, r′). (8)
These operators involve the Green’s function gu(r, r′) =exp(iku|r − r′|)/(4π|r − r′|) and the wavenumber ku =ω√µ√ε with angular frequency ω. Finally, contributions
to excitation vectors for MCTF are derived as
vu = −ξm,u
∫Sm
drtm(r) ·Eincu (r) (9)
wu = −ηuηu′ξm,u
∫Sm
drtm(r) ·H incu (r), (10)
where Eincu (r) and H inc
u (r) represent the incident elec-tric/magnetic field intensity created by external sources lo-cated inside Du.
19

300 350 400 450 500 550 6000
10
20
30
40
50
60
70
Frequency (THz)
Enha
ncem
ent F
acto
r
d = 450 nmd = 475 nmd = 500 nmd = 525 nmd = 550 nm
400 420 440 460 48040
45
50
55
60
65
70
Frequency (THz)
Enha
ncem
ent F
acto
r
d
d
Figure 3: Power enhancement factor at the gap of an Agbowtie nanoantenna in an arrangement of 2× 2 nanoanten-nas with different periodicities.
In the examples of this paper, we consider nanoantennaarrays, typically made of Ag. The complex permittivityof Ag depending on the frequency is extracted from theLorentz-Drude model. In some cases, the particle to be de-tected is also Ag, leading to a problem with U = 1 to beformulated with MCTF as in [15]. In other cases, dielectricparticles are considered with a fixed permittivity, leading tothree-region composite problems (U = 2). The developedformulation allows the use of U > 2, while such cases arebeyond the scope of this paper.
Matrix equations derived from the discretization ofMCTF are solved iteratively by using MLFMA. For inter-actions inside metallic objects that are modeled as pene-
250 300 350 400 450 500 550 6000
10
20
30
40
50
60
Frequency (THz)
Enha
ncem
ent F
acto
r
AgAlAuCuPt
Figure 4: Power enhancement factor at the gap of an bowtienanoantenna when different materials are used.
trable bodies, interaction truncation is applied as describedin [19]. Once the expansion coefficients are found, the elec-tric field intensity and the magnetic field intensity at an ob-servation point r located inside Du are computed as
E(r) = Eincu (r)
+ ikuηu∑n
x[n]ξn,u
∫Sn
dr′bn(r′)gu(r, r
′)
− i ηuku
∑n
x[n]ξn,u
∫Sn
dr′∇′ · bn(r′)∇′gu(r, r′)
−∑n
y[n]ξn,u
∫Sn
dr′bn(r′)×∇′gu(r, r′) (11)
and
H(r) = H incu (r)
+ikuηu
∑n
y[n]ξn,u
∫Sn
dr′bn(r′)gu(r, r
′)
− i
kuηu
∑n
y[n]ξn,u
∫Sn
dr′∇′ · bn(r′)∇′gu(r, r′)
+∑n
x[n]ξn,u
∫Sn
dr′bn(r′)×∇′gu(r, r′), (12)
where summations include all basis functions bn locatedon the surface of the domain. Then, the power density isobtained as
S(r) = E(r)× [H(r)]∗, (13)
where ∗ represents complex conjugate. We also computepointwise enhancement factor (scaled power density) as
e(r) =|S(r)||Sinc
u (r)|=
|S(r)||Einc
u (r)× [H incu (r)]∗|
. (14)
20

20 dBV/m
-10
-5
0
10
15
5
-30 dBA/m
-60
-55
-50
-40
-35
-45
-10 dBW/sm
-40
-35
-30
-20
-15
-25
40
10
15
20
30
35
25
POWER DENSITY
ELECTRIC FIELD INTENSITY MAGNETIC FIELD INTENSITY
ENHANCEMENT
POSI
TION
SIZE
Figure 5: Near-zone characteristics of an array of 3× 3 nanoantennas when Ag particles with different sizes are located in thearray plane. The periodicity of the array is 500 nm, while the particle diameter changes from 50 nm to 300 nm (for the firstthree locations) or from 50 nm to 250 nm (for the last two locations).
As a typical excitation, we use 1 V/m plane wave in the hostmedium (vacuum D0), which corresponds to the incidentpower density value as |Sinc
0 (r)| ≈ 2.65× 10⁻³ W/sm.
3. Nanoantenna Arrays for Particle DetectionIn this paper, we consider arrays of nanoantennas particu-larly with bowtie shapes as the most common types used inthe literature. With the dimensions given in Fig. 1(a), thesestructures exhibit relatively high power enhancement fac-tors (if suitable metals are used) in the 400–500 THz range.We arrange multiple nanoantennas, often periodically witha fixed distance between consecutive elements, leading totwo-dimensional arrays. For example, a 5× 5 arrangementis depicted in Fig. 1(b) when the periodicity is 475 nm. Asalso shown in Figs. 1(b) and (c), a particle to be detected is
located in the vicinity of the array, while the entire structureis excited by a light source (modeled as a plane wave) fromthe top.
3.1. Periodicity of Elements
Since array elements (bowtie nanoantennas) strongly in-teract with each other, distances between them are criti-cal for their performances. Placing nanoantennas far awayfrom each other would reduce the interaction between them,while this decreases the reliability of the particle detection,especially for small-scale objects. In fact, electromagneticinteractions between nanoantennas can be employed in auseful way to improve the performances of individual ele-ments. As an example, Fig. 2 presents the power enhance-ment factor at the gap of an Ag bowtie nanoantenna, when
21

(a)
(b)
Figure 6: Movement of a spherical particle of diameter600 nm above a 5 × 5 array of nanoantennas with 475 nmperiodicity. (a) Moving on a path between two rows. (b)Moving on a path above the first row of nanoantennas.
another identical nanoantenna is placed at different loca-tions. The results show that the enhancement factor is quitesensitive to the distance between the nanoantennas whenthey are vertically aligned. Specifically, the enhancementfactor can exceed 65, which is higher than the enhance-ment by a single nanoantenna (50–55), when the center-to-center distance is 475 nm. It is remarkable that placingnanoantennas horizontally always deteriorates the enhance-ment factor, which must be considered in two-dimensionalarrangements. As shown in Fig. 3 for a 2 × 2 array of Agnanoantennas, the enhancement factor can be kept above60 at around 445 THz, if the periodicity (in horizontal andvertical directions) is fixed to 450–500 nm.
3.2. Material of Nanoantennas
As it is well known, the material type is a crucial factor forthe enhancement ability of a nanoantenna. For the nanoan-tenna geometry depicted in Fig. 1(a), the effect of the mate-rial is briefly considered in Fig. 4. The enhancement factoris found at the gap of a single nanoantenna, when the ma-terial is selected as Ag, Al, Au, Cu, and Pt. Without strongplasmonic responses, Al and Pt are not very suitable to ob-tain high power enhancement factors, while the best per-formance in terms of achievable maximum enhancement isobtained with Ag. We note that, Au may be preferred de-pending on the frequency, e.g., it provides more than 40enhancement factor at 400 THz, while the correspondingvalue is around 30 if Ag is used at the same frequency.
4. Detection of Particles
After numerous numerical analysis, some of which areshown above, the bowtie geometry in Fig. 1(a) is used inarray configurations for the detection of particles. The ma-terial is selected as Ag, while the detection is consideredat 450 THz, i.e., when the wavelength in the host medium(vacuum) is approximately 666.2 nm. The periodicity inarray configurations is selected as 475–500 nm.
4.1. Effect of Nearby Particles
As the first set of results about particle detection, we con-sider spherical Ag particles with different diameters from50 nm to 300 nm. The particles are located in the planeof a 3 × 3 nanoantenna array, as depicted in Fig. 5. Inaddition to different sizes, we consider different locationsfor the particles in order to investigate their effects in thenear-zone characteristics. Fig. 5 presents the electric fieldintensity ([−10, 20] dBV/m range), the magnetic field in-tensity ([−60,−30] dBA/m range), and the power den-sity ([−40,−10] dBW/sm range), as well as the point-wise power enhancement factor distributions for 25 differ-ent cases. The near-zone samples are selected in the arrayplane (z = 0) so that the particles are also seen as dark cir-cles, while this does not directly mean detection since thesampling plane (that cuts the particles) may not be realisticfor a detection application. On the other hand, our aim hereto observe the response of nanoantennas to the existence ofparticles. We note that the smallest particle with 50 nm di-ameter does not lead to any visible response (first columnin each panel), while near-zone field and density distribu-tions significantly change as the particle size grows. Thisis particularly seen in the near-zone electric field intensityplots, where the coupling between the particles and nearbynanoantennas is observed as relatively large fields. In thepower enhancement plots, nanoparticles lead to decreasedenhancement values (faded hot spots), which can be inter-preted as shadowing depending on the particle size.
22

Elec
tric F
ield
Inte
nsity
(dBV
/m)
Mag
netic
Fiel
dIn
tens
ity (d
BA/m
) Po
wer D
ensit
y(d
BW/sm
) En
hanc
emen
t 20
10
0
-10-30
-40
-50
-60-10
-20
-30
-4040
30
20
10
Figure 7: Near-zone characteristics of an array of 5× 5 nanoantennas when an Ag particle of diameter 600 nm moves abovethe array as described in Fig. 6(a). The periodicity of the array is 475 nm. The bottom of the particle is 10 nm away from thetop surface of the nanoantennas.
Elec
tric F
ield
Inte
nsity
(dBV
/m)
Mag
netic
Fiel
dIn
tens
ity (d
BA/m
) Po
wer D
ensit
y(d
BW/sm
) En
hanc
emen
t
20
10
0
-10-30
-40
-50
-60-10
-20
-30
-4040
30
20
10
Figure 8: Near-zone characteristics of an array of 5× 5 nanoantennas when an Ag particle of diameter 600 nm moves abovethe array as described in Fig. 6(b). The periodicity of the array is 475 nm. The bottom of the particle is 10 nm away from thetop surfaces of the nanoantennas.
23

20 dBV/m
-10010
-30 dBA/m
-60-50-40
-10 dBW/sm
-40-30-20
40
102030
Elec
tric
Field
Inte
nsity
Mag
netic
Field
Inte
nsity
Powe
rDe
nsity
Enha
nc.
ε = 2.0r ε = 3.0r ε = 4.0r ε = 5.0r ε = 6.0r ε = 7.0r ε = 8.0r ε = 9.0r ε = 10.0r
20 dBV/m
-10010
-30 dBA/m
-60-50-40
-10 dBW/sm
-40-30-20
40
102030
ε = 12.0r ε = 13.0r ε = 14.0r ε = 15.0r ε = 16.0r ε = 17.0r ε = 18.0r ε = 19.0r ε = 20.0rε = 11.0r
Figure 9: Near-zone characteristics of an array of 3 × 3 nanoantennas when dielectric particles of diameter 300 nm arelocated above the array. The periodicity of the array is 475 nm. The particles are 90 nm away from the top surfaces of thenanoantennas.
4.2. Detection of Moving Particles
Next, we consider more realistic cases, where a sphericalparticle is moving above a 5 × 5 array of nanoantennas.Fig. 6 presents two different scenarios for the movement ofa spherical Ag particle of diameter 600 nm. The bottom ofthe sphere is 10 nm away from nanoantenna surfaces. Fig. 7presents the electric field intensity, the magnetic field inten-sity, the power density, and the pointwise enhancement fac-tor in the array plane, when the particle moves as depictedin Fig. 6(a). The movement of the particle is clearly ob-served as deteriorated near-zone distributions, particularlyas shadowed nanoantennas. This shadowing effect is sig-nificant especially in the enhancement plots, where dark ar-eas occur depending in the location of the particle. Fig. 8presents similar results when the movement of the particleis as described in Fig. 6(b). In addition to the successfultracking of the particle, it is remarkable that the results inFig. 8 differ from those in Fig. 7, i.e., the vertical location
of the particle can also be identified from near-zone distri-butions.
4.3. Detection of Dielectric Particles
The results so far involve metallic particles, specificallymade of Ag, which are generally easier to detect. As thenext set of results, we consider dielectric particles withvarious permittivity values. Fig. 9 presents intensity, den-sity, and enhancement distributions in the array plane whenspherical dielectric particles of diameter 300 nm are locatedabove a 3 × 3 array of nanoantennas. The distance be-tween spheres and nanoantenna surfaces is set to 90 nm.The relative permittivity (εr) is changed from 2.0 to 20.0.We observe that the sphere with 2.0 relative permittivityhas little effect on the near-zone distributions, while thedetection becomes easier as the relative permittivity in-creases towards 9.0. Interestingly, the effect of the parti-cle is not significant for some higher contrasts, particularly
24

20 dBV/m
-10
0
10
100 nm 150 nm 200 nm 250 nm 300 nm
ε =
4.0
rε
= 6.
0r
ε =
8.0
r
-30 dBA/m
-60
-50
-40
100 nm 150 nm 200 nm 250 nm 300 nm
-10 dBW/sm
-40
-30
-20
100 nm 150 nm 200 nm 250 nm 300 nm
40
10
20
30
100 nm 150 nm 200 nm 250 nm 300 nm
ε =
4.0
rε
= 6.
0r
ε =
8.0
rε
= 4.
0r
ε =
6.0
rε
= 8.
0r
ε =
4.0
rε
= 6.
0r
ε =
8.0
r
Figure 10: Near-zone characteristics of an array of 3 × 3nanoantennas when dielectric particles with different sizes(25–300 nm diameter) and permittivity values of 4.0, 6.0,and 8.0 are located above the array. The distance betweenthe particles and surfaces of nanoantennas is 20 nm.
when εr = 11.0–13.0 and εr = 17.0–19.0. Hence, higherpermittivity/contrast values do not necessarily indicate eas-ier detection. Fig. 10 presents another set of results, whereparticles with different sizes and permittivity values of 4.0,
6.0, and 8.0 are considered. Specifically, in these results,the diameter changes from 100 nm to 300 nm, while the dis-tance between spherical particles and nanoantenna surfacesis selected as 20 nm. The results show that the detection iseasier when the particle size 200 nm or larger for all threepermittivity values.
4.4. Visualization at Other Planes
As shown above, some dielectric particles, even with rel-atively high contrasts, may not be easily detected by con-sidering field and density distributions in the array plane.While this is related to particle size and contrast, as wellas particle-to-array distance, numerical investigations showthat the relationship is not trivial. On the other hand, onemay consider other planes, particularly the plane of inci-dence, to increase the reliability of detection. As an ex-ample, Fig. 11 presents field, density, and pointwise en-hancement distributions for spherical particles of diameter300 nm with relative permittivity values of 3.0, 6.0, and10.0. In the plane of array, which is now called Plane 1,the particle with ε = 6.0 is easily detected, while the oth-ers have limited effects on the near-zone characteristics. Inthe plane of incidence (Plane 2), however, particles leadto unique distributions (except for the enhancement plots)such that all of them become detectable. We emphasize thatdistributions outside the particles should be considered fordetection purposes since sampling inside particles may notbe possible depending on the application.
4.5. Geometric Identification
In many applications, not only the existence but also theshape of nanoparticles is critical to be detected. Thiscan be possible if the obtained near-zone distributions arecompared with reference results in a database. In orderto demonstrate the feasibility of geometric identification,Fig. 12 shows near-zone distributions when dielectric par-ticles with different shapes exist above a 3 × 3 array ofnanoantennas. The relative permittivity of the particles isset to 8.0. In each case, the distance between the particleand the array surface is 50 nm. The results in Fig. 12 showthat, despite similarities, particles lead to different field,density, and/or enhancement distributions. This means thatgeometric identification can be possible even with arraysinvolving small numbers of nanoantennas.
5. Concluding Remarks
In this paper, design and computational analysis of nanoan-tenna arrays for particle detection applications are pre-sented. By using a highly accurate simulation environment,alternative nanoantenna arrays and nearby nanoparticles areinvestigated in diverse scenarios. The results demonstratethe feasibility of sensing and imaging of metallic and di-electric particles, even of subwavelength sizes at optical fre-quencies.
25

20 dBV/m
-10010
-30 dBA/m
-60-50-40
-10 dBW/sm
-40-30-20
40
102030
Elec
tric
Field
Inte
nsity
Mag
netic
Field
Inte
nsity
Powe
rDe
nsity
Enha
nc.
ε = 3.0r ε = 6.0r ε = 10.0r ε = 3.0r ε = 6.0r ε = 10.0rPlane 1 Plane 2• Excitation
PW at 450 THz (From Top)
Plane 1
Plane 2
z
x
y
x
Figure 11: Near-zone characteristics of an array of 3 × 3 nanoantennas when dielectric particles (with ε = 3.0, 6.0, 10.0) ofdiameter 300 nm are located above the array. The periodicity of the array is 475 nm. The particles are 90 nm away from thetop surfaces of the nanoantennas.
20 dBV/m
-10010
-30 dBA/m
-60-50-40
-10 dBW/sm
-40-30-20
40
102030
Sphere Cube Cylinder Cone 1 Cone 2
Elec
tric
Field
Inte
nsity
Mag
netic
Field
Inte
nsity
Powe
rDe
nsity
Enha
nc.
Star
Figure 12: Near-zone characteristics of an array of 3 × 3 nanoantennas when dielectric particles with different shapes arelocated above the array. The periodicity of the array is 475 nm. The particles are 50 nm away from the top surfaces of thenanoantennas, while their relative permittivity is 8.0.
AcknowledgementThis work was supported by the Scientific and TechnicalResearch Council of Turkey (TUBITAK) under the Re-search Grant 118E243 and by the Turkish Academy of Sci-ences (TUBA).
References[1] S.A. Maier, Plasmonics: fundamentals and applica-
tions, Springer, 2007.
[2] J. Alda, J.M. Rico-Garcia, J.M. Lopez-Alonso, G.Boreman, Optical antennas for nano-photonic appli-cations, Nanotechnology 16: 230–234, 2005.
[3] Y. Nishijima, L. Rosa, S. Juodkazis, Surface plasmonresonances in periodic and random patterns of goldnano-disks for broadband light harvesting, Opt. Exp.20: 11466–11477, 2012.
[4] Y.M. El-Toukhy, M. Hussein, M.F.O. Hameed, A.M.Heikal, M.M. Abdelrazzak, S.S.A. Obayya, Opti-mized tapered dipole nanoantenna as efficient energyharvester, Opt. Exp. 24: 1107–1122, 2016.
[5] T. Kosako, Y. Kadoya, H.F. Hofmann, Directionalcontrol of light by a nano-optical yagi-uda antenna,Nat. Photonics 4: 312–215, 2010.
26

[6] E.G. Mironov, A. Khaleque, L. Liu, I.S.Maksymov,H.T. Hattori, Enhancing weak optical signals using aplasmonic yagi-uda nanoantenna array, IEEE Photon.Technol. Lett. 26: 2236–2239, 2014.
[7] D.M. Solis, J.M. Taboada, F. Obelleiro, L. Landesa,Optimization of an optical wireless nanolink usingdirective nanoantennas, Opt. Exp. 21: 2369–2377,2013.
[8] Y. Yang, Q. Li, M. Qiu, Broadband nanophotonicwireless links and networks using on-chip integratedplasmonic antennas, Sci. Rep. 6: 19490, 2016.
[9] A. Kinkhabwala, Z. Yu, S. Fan, Y. Avlasevich, K.Mullen, W.E. Moerner, Large single-molecule fluo-rescence enhancements produced by a bowtie nanoan-tenna, Nat. Photonics 3: 654–657, 2009.
[10] T. Lohmuller, L. Iversen, M. Schmidt, C. Rhodes, H.-L. Tu, W.-C. Lin, J.T. Groves, Single molecule track-ing on supported membranes with arrays of opticalnanoantennas, Nano Lett. 12: 1717–1721, 2012.
[11] K.B. Crozier, W. Zhu, D.Wang, S. Lin, M.D. Best,J.P. Camden, Plasmonics for surface enhanced ramanscattering: nanoantennas for single molecules, IEEEJ. Sel. Top. Quantum Electron. 20: 3, 2014.
[12] M. Alavirad, L. Roy, P. Berini, Optimization of plas-monics nanodipole antenna array for sensing appli-cations, IEEE J. Sel. Top. Quantum Electron. 20: 3,2014.
[13] D.P. Fromm, A. Sundaramurthy, P.J. Schuck, G.S.Kino, W.E. Moerner, Gap-dependent optical couplingof single bowtie nanoantennas resonant in the visible,Nano Lett. 4: 957–961, 2004.
[14] E. Ustun, O. Eroglu, U.M. Gur, and O. Ergul,Investigation of nanoantenna geometries for max-imum field enhancements at optical frequencies,Proc. Progress in Electromagnetics Research Symp.(PIERS), pp. 3673–3680, 2017.
[15] B. Karaosmanoglu, A. Yılmaz, O. Ergul, A compar-ative study of surface integral equations for accurateand efficient analysis of plasmonic structures, IEEETrans. Antennas Propag. 65: 3049–3057, 2017.
[16] A. Cekinmez, B. Karaosmanoglu, O. Ergul, Integral-equation formulations of plasmonic problems in thevisible spectrum and beyond,” Dynamical Systems- Analytical and Computational Techniques, InTech,2017.
[17] P.B. Johnson, R.W. Christy, Optical constants of thenoble metals, Phys. Rev. B 6: 4370–4379, 1972.
[18] O. Ergul, L. Gurel, The Multilevel Fast Multi-pole Algorithm (MLFMA) for Solving Large-ScaleComputational Electromagnetics Problems, Wiley-IEEE, 2014.
[19] B. Karaosmanoglu, A. Yılmaz, U.M. Gur, O. Ergul,Solutions of plasmonic nanostructures using the mul-tilevel fast multipole algorithm, Int. J. RF MicrowaveComput.-Aided. Eng. 26: 335–341, 2016.
27