Embed Size (px)
Citation preview
Journal of Shipping and Ocean Engineering 5 (2015) 181-194 doi: 10.17265/2159-5879/2015.04.004
Design, Analysis and Installation of Offshore
Instrumented Moored Data Buoy System
Kaliyaperumal, P., Venkatesan, R., Senthilkumar, P., Kalaivanan, C. K., Gnanadhas, T., and Vedachalam, N.
Ocean Observation Systems, Earth Science Systems Organization-National Institute of Ocean Technology, Chennai, 600100 India
Abstract: This paper discusses the analysis done on the meteorological ocean buoy mooring used for monitoring the Indian seas. Based on the extreme environmental parameters experienced by the buoys, mooring loads are analyzed using offshore dynamic analysis software. The results obtained are validated with the tension recorder installed in one of the moorings, and the results are found to comply with an accuracy of better than 1%. The successful on demand performance of the mooring during major cyclones in the Bay of Bengal and the vital meteorological and oceanographic information provided by the buoy during these disastrous cyclonic events validates the mooring design, and proves the data availability for societal needs. The time critical data assimilated in the cyclone prediction models have given confidence to improve the country’s weather prediction and climate modelling capabilities.
Key words: Mooring, data buoy, tsunami, cyclone.
1. Introduction
Oceans play a vital role in maintaining the Earth’s
climate, and its variability is due to the fluid motions,
high heat capacity, and its ecosystems. The level of
understanding the ocean environment and analysing in
an appropriate spatio-temporal scale including its
variability and to precisely model the weather and
climate is a challenge [1]. Space-based observations of
sea level through altimetry, surface wind stress through
scattering studies and other passive sensing, sub
surface temperature measurements through infrared
and microwave techniques and precipitation through
the Tropical Rainfall Measurement Mission using
passive and active radar systems, are largely confined
to surface variables measurements only [2, 3]. In situ
observations provide an essential complement for
validating the remotely acquired data and to obtain the
subsurface variability. Knowledge of the ocean is
essential for many stakeholders dealing with
climatology, fisheries, ports and harbors, coastal zone
management, navy and coast guard, public health and
Corresponding author: R.Venkatesan, Ph.D., research fields: marine pollution and management, ocean observation, ocean policy andmaterials for marine application. Email: [email protected].
environment agencies, tourism, weather forecast,
offshore mining and oil industry and climate research.
The buoy systems used for ocean monitoring is a
floating structure designed to measure the ocean
meteorological, surface and subsurface parameters.
These buoy systems are categorized into moored and
free drifting types, which in turn classified into surface
and subsurface types. The buoy mooring is a structure
that extends from the surface to the ocean bottom used
for mounting meteorological and oceanographic
instruments. Of late, MSB (Moored Surface Buoys)
with precise data collection and real time transmission
has revolutionized the observation system capabilities
and their societal importance.
The top portion of the mooring is exposed to
demanding environments and therefore its design
should take into consideration the extreme effects of
surface waves, ocean currents and other factors that
vary with time, location, regional climate and weather
patterns. Extensive research has to be done in this
domain to understand the dynamics, load patterns,
material needs and configuration. The study of the
dynamics of anchored steel, polypropylene and nylon
mooring lines disturbed by simple sinusoidal waves to
D DAVID PUBLISHING
Design, Analysis and Installation of Offshore Instrumented Moored Data Buoy System
182
predict the dynamic component of mooring line tension
and it was reported that synthetic fiber ropes develop
much lower dynamic tensions [4, 5]. The S-shaped
inverse catenary mooring with sub-surface floats
referred to as slack mooring is used for most of the
deep sea instrumented mooring applications [1, 6]. The
importance on the need for efficient computational
tools with capabilities to model all significant elements
and physical processes related to the mooring system
and to provide realistic predictions of loads, motions
and displacements was discussed [6]. Extensive
research is initiated for gaining further insight into the
mechanism of the dynamic behaviour of mooring lines
to quantify the effects of important parameters with
special attention to the maximum tension developed
[7].
Depending on the weight of the instruments attached
to the mooring and based on the amplitude and
frequency of the waves, large dynamic tensions are
experienced specifically in the top portion of the
mooring line. The cyclic loads with frequencies of
about ten million times could be experienced in
one-year operational period [8]. An analysis on single
point inverse catenary mooring systems with and
without subsurface floats showed that the most
important design parameter in terms of the maximum
tension is the length of the mooring. The other
important parameter in terms of the bending fatigue
damage is the length of the buoyant section and the
distribution of the floats, which resulted in the design
and development of instrumented moorings with the
combination wire rope and synthetic ropes [9, 10].
Studies on the dynamics of mooring lines were
conducted to provide a broad data base applicable to
model validation and to quantify the horizontal and
vertical components of the dynamic tension generated
by the vertical and sinusoidal motions of the upper
end of the mooring line which helps the designers to
determine the bending stiffness and scope of the
mooring line [11]. A comparison of the mooring line
tension with two types of mooring systems and with
the tension recorder measurements were also
reported [12]. The finite element analysis software
CABLE [13, 14] and OrcaFlex [15] were used for
carrying out the static and dynamic analysis of
oceanographic cable structures and to solve the
surface and subsurface single-point mooring
problems with user specified forces such as waves,
currents, wind and ship speed. In this paper, an
attempt has been made to compare the actual field
recorded load measurements with the predicted
mooring loads, using numerical analysis with CABLE
and OrcaFlex software.
2. Materials and Methods
2.1 Indian Moored Buoy System and Its Importance
Considering the importance of ocean observations in
terms of understanding our ocean environment and
utilizing them for operational oceanography, the
Ministry of Earth Sciences, Government of India, has
installed a moored buoy network currently comprising
of 24 MSBs to acquire different oceanographic
parameters from the Indian Seas. The prime objective
of the moored buoy network is to provide reliable,
accurate and cost-effective atmospheric and oceanic
observations for supporting weather forecasts and data
exchange with international agreements on climate
monitoring under the GOOS (Global Ocean
Observation System) project. The data acquired are
widely used for research, validation and operational
applications in India and abroad. The OOS (Ocean
Observation Systems) program of the ESSO National
Institute of Ocean Technology is involved in the design,
deployment and maintenance of meteorological and
tsunami buoy networks in the Indian seas. The
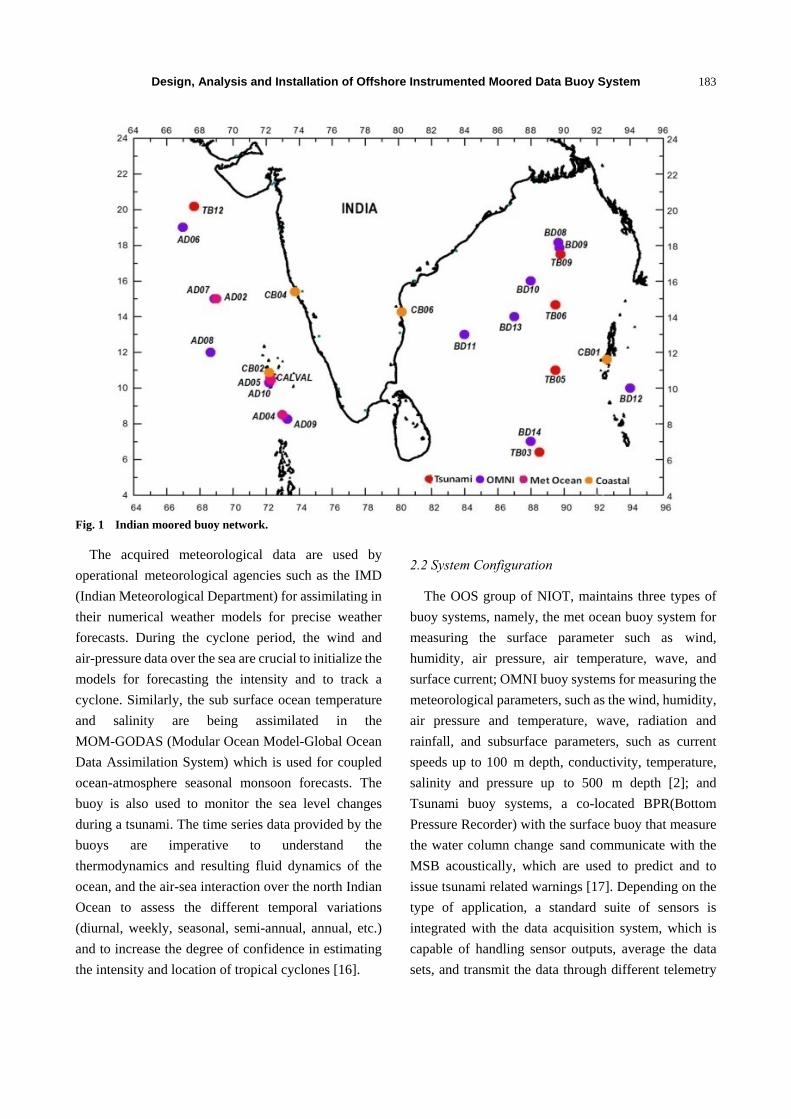
locations of MSBs are shown in Fig. 1. These buoy
systems are deployed at particular locations, and are
equipped with sensor suites to measure meteorological
and oceanographic parameters. The state-of-the-art
OMNI (Ocean Moored buoy network in the Northern
Indian Ocean) buoy collects up to 106 parameters and
transmits to the MCC (Mission Control Centre) in real
time [1] at NIOT Chennai.
Design, Analysis and Installation of Offshore Instrumented Moored Data Buoy System
183
Fig. 1 Indian moored buoy network.
The acquired meteorological data are used by
operational meteorological agencies such as the IMD
(Indian Meteorological Department) for assimilating in
their numerical weather models for precise weather
forecasts. During the cyclone period, the wind and
air-pressure data over the sea are crucial to initialize the
models for forecasting the intensity and to track a
cyclone. Similarly, the sub surface ocean temperature
and salinity are being assimilated in the
MOM-GODAS (Modular Ocean Model-Global Ocean
Data Assimilation System) which is used for coupled
ocean-atmosphere seasonal monsoon forecasts. The
buoy is also used to monitor the sea level changes
during a tsunami. The time series data provided by the
buoys are imperative to understand the
thermodynamics and resulting fluid dynamics of the
ocean, and the air-sea interaction over the north Indian
Ocean to assess the different temporal variations
(diurnal, weekly, seasonal, semi-annual, annual, etc.)
and to increase the degree of confidence in estimating
the intensity and location of tropical cyclones [16].
2.2 System Configuration
The OOS group of NIOT, maintains three types of
buoy systems, namely, the met ocean buoy system for
measuring the surface parameter such as wind,
humidity, air pressure, air temperature, wave, and
surface current; OMNI buoy systems for measuring the
meteorological parameters, such as the wind, humidity,
air pressure and temperature, wave, radiation and
rainfall, and subsurface parameters, such as current
speeds up to 100 m depth, conductivity, temperature,
salinity and pressure up to 500 m depth [2]; and
Tsunami buoy systems, a co-located BPR(Bottom
Pressure Recorder) with the surface buoy that measure
the water column change sand communicate with the
MSB acoustically, which are used to predict and to
issue tsunami related warnings [17]. Depending on the
type of application, a standard suite of sensors is
integrated with the data acquisition system, which is
capable of handling sensor outputs, average the data
sets, and transmit the data through different telemetry
Design, Analysis and Installation of Offshore Instrumented Moored Data Buoy System
184
channels. The entire system is programmed to collect
data at pre-defined time intervals, store it, and transmit
it from the MSB to the MCC. The surface buoy
provides a platform to mount the sensors and their
accessories, including the energy storage batteries and
telemetry systems [1]. A discus shaped hull made of
fiber reinforced plastic filled with polyurethane foam,
offers a net buoyancy of about 2,000 kgf. The shape of
the buoy hull enables it to perfectly follow the wave,
which is of paramount importance for wave
measurements [18].
Mooring is a compliant section between the surface
buoy and the seabed located anchor, which protects the
buoys from the action of the surface created forces.
Moorings typically have three basic components: an
anchor, mooring line with instrumentation and
flotation devices that keep the mooring line and
instrumentation in place. Shackles and links are used to
connect the mooring components, and to secure the
instruments in the mooring line. The choice of the
hardware, mooring line and flotation for a particular
application, as well as the size and design of the anchor,
depends on the type of mooring and the environment in
which it is deployed.
2.3 Challenges in the Design of the Instrumented Buoy
Mooring System
The moorings are designed in such a way that the
rope is not in contact either with the buoy hull or with
the sea bed. For instrumented buoy mooring, the
mooring should not influence the free motion of the
buoy. As surface mooring is subjected to a hostile
marine environment, it needs a form of built-in
“compliance” (ability to stretch), to compensate for
large vertical excursions, that the buoy may experience,
during the course of tidal action and with passing
waves and swell. The compliance should also
compensate for the buoy displacements in lateral
directions on the sea surface due to the drag forces
induced by ocean wave and currents. In deepwater
applications, compliance is provided through the use of
synthetic ropes, nylon. The synthetic line acts like a
rubber band that stretches if necessary, to maintain the
connection between the surface-following buoy and the
anchor at the bottom.
The basic idea of buoy mooring was evolved based
on the concepts of traditional near-shore vessel
mooring. The parameters to be considered in the design
of instrumented buoy mooring systems are operational
parameters including allowable amount of motion, and
environmental parameters such as wind speed, current
speed and wave parameters. In case of instrumented
buoy mooring systems, the horizontal drift from the
anchored position is critical, as the measurements need
to be taken in a particular place and depth. The
allowable buoy drift from its anchored position is
termed as a watch circle.
The challenge in the design is to achieve an
appropriate combination of structurally compliant and
fish bite-resistant materials. The “scope” of the
mooring (the ratio of the total un-stretched length of the
mooring components to the water depth) is one of the
critical design factors. A mooring with scope of less
than one (taut mooring) relies on the stretch of the
nylon for the anchor to reach the bottom. This mooring
remains fairly vertical with a relatively small watch
circle under considerable tension and the currents and
waves impose additional loads [19].
Based on best of mooring practices published by
pioneers such as NOAA NDBC (National Data Buoy
Corporation) [20] and NIOT’s operational experiences
[21], the current operating mooring comprises of a
single point “inverse catenary” link between the buoy
and the anchor, which has a minimal effect on the wave
loading because of its compliant section and higher
scope. This design has specified lengths of wire rope in
the upper part of the mooring and a nylon rope to form
the required compliance section. A polypropylene rope
is used in the remaining ocean depth up to the anchor
along with the chain. The inverse catenary design
offers a larger scope, typically 1.2 to 1.4 for
high-current periods, and still performs well in lesser
Design, Analysis and Installation of Offshore Instrumented Moored Data Buoy System
185
currents. In low currents, the buoyancy provided by the
polypropylene rope and floats keeps the negatively
buoyant nylon from entangling with the rest of the
mooring. An instrumented mooring of inverse catenary
design lowers the static mooring line tension. The
dynamic tension contribution to the total tension,
however, is unchanged, and care must still be taken in
the design process to prevent the mooring from having
a resonant response to forces in the range of surface
wave periods. This type of mooring is less vulnerable
to vandalism as there are no floating lines on the sea
surface, which offers fish bite resistance in the upper
ocean, and is easy for deployment, retrieval and
servicing activities.
These moorings with inverse catenary configuration
have three sections: the upper, the compliant and the
lower sections. The upper section consists of a
combination wire rope of 550 m length to protect the
mooring from vandalism and fish bite. The compliance
section has a nylon rope which gives an S-shape with
the aid of sub-surface floats, and polypropylene rope
provides sufficient stretch to the mooring line under
extreme environmental conditions. The remaining
length of the water depth contains the polypropylene
rope and a 3 m chain, which is known as the lower
section in the mooring. In order to avoid the rubbing of
the chain with the sea bed, subsurface floats are added
in the mooring line, which keep the chain in an upright
position. The mooring scope in this case is about 1.2 to
1.4. Tsunami buoy moorings are also of inverse
catenary design but with a lesser scope of about 1.04 to
ensure reliable acoustic communication between the
MSB and the bottom mounted pressure recorder [17].
In OMNI buoy moorings, induction cables are used
instead of a combination rope, to mount the inductive
sub surface sensors for real time and connector-less sub
surface data transmission.
2.4 Mooring Dynamic Modeling and in-Situ
Measurements
The total dynamic load on the oceanographic surface
mooring is mainly attributed to the gravity forces and
fluid drag on the attached mooring line components
and the line tension [22]. Depending upon the
buoyancy of the mooring hardware, gravity forces act
based on the principles of Archimedes. The tension in
the mooring line will be approximately equal to the
immersed weight of all the mooring components, but in
oceanic applications, due to currents, drag forces need
to be considered in calculating the line tension as given
below: P W B (1)
where, P—resultant force (N/m);
W—Weight of the body (N/m);
B—Buoyancy force (N/m).
In the direction normal to the flow, for a diameter (d)
the hydrodynamic resistance due to drag is given by, 21
2 dR C AV
(2)
Where, R—Drag force (N);
Cd—Coefficient of drag;
A—Frontal area (m^2);
Ρ—Fluid density (kg/m^3);
V—Velocity of fluid (m/s).
The drag coefficient varies depending on the nature
of the fluid flow and type of exposed surface, and can
be obtained by plotting the drag coefficient versus
Reynolds number for flows, normal and tangential to
the smooth and rough circular cylinders [23]. Under
static equilibrium, the vector sum of these forces shall
be zero. Applying these conditions for normal and
tangential components of these forces, yields the
resulting tension in the mooring lines.
In recent years, reliable and sophisticated
computational tools are available for numerically
analysing the mooring line-loads subjected to different
environmental conditions. In the finite element method,
the mooring line is divided into a number of straight
segments, and the changes of tension that take place
over a segment length are calculated. The numerical
modelling of the mooring system and the equations of
motion are solved, by using the time domain numerical
simulation tool OrcaFlex and CABLE software. They
Design, Analysis and Installation of Offshore Instrumented Moored Data Buoy System
186
are fully coupled 3D non-linear time domain finite
element programs, capable of dealing with arbitrarily
large deflections of the flexible line, in static and
dynamic offshore conditions. Orcaflex provides fast
and accurate analysis of catenary systems, such as
flexible risers and umbilical cables under wave and
current loads with externally imposed motions. It also
has the capability to exactly model and analyse the
buoy systems and their behaviour when subjected to
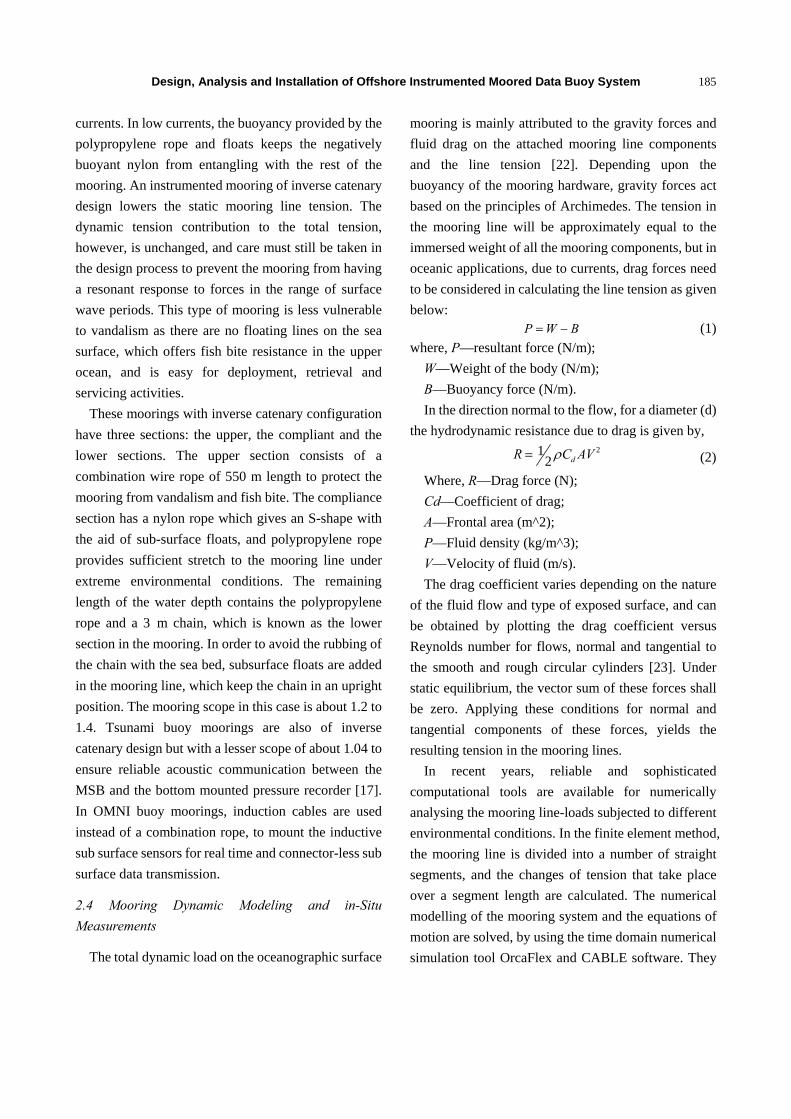
different environmental conditions. In OrcaFlex, the
line is divided into a series of segments, which are then
modeled by straight mass less model segments, with a
node at the end. The model of the line made with
OrcaFlex is shown in Fig. 2 [15].
In order to study the deep sea inverse catenary
mooring load in the in-situ condition and validate the
numerical model results, a tension recorder is
incorporated in a MSB (AD05) deployed in the
Arabian Sea at 72° E/10° N from December 2011 to
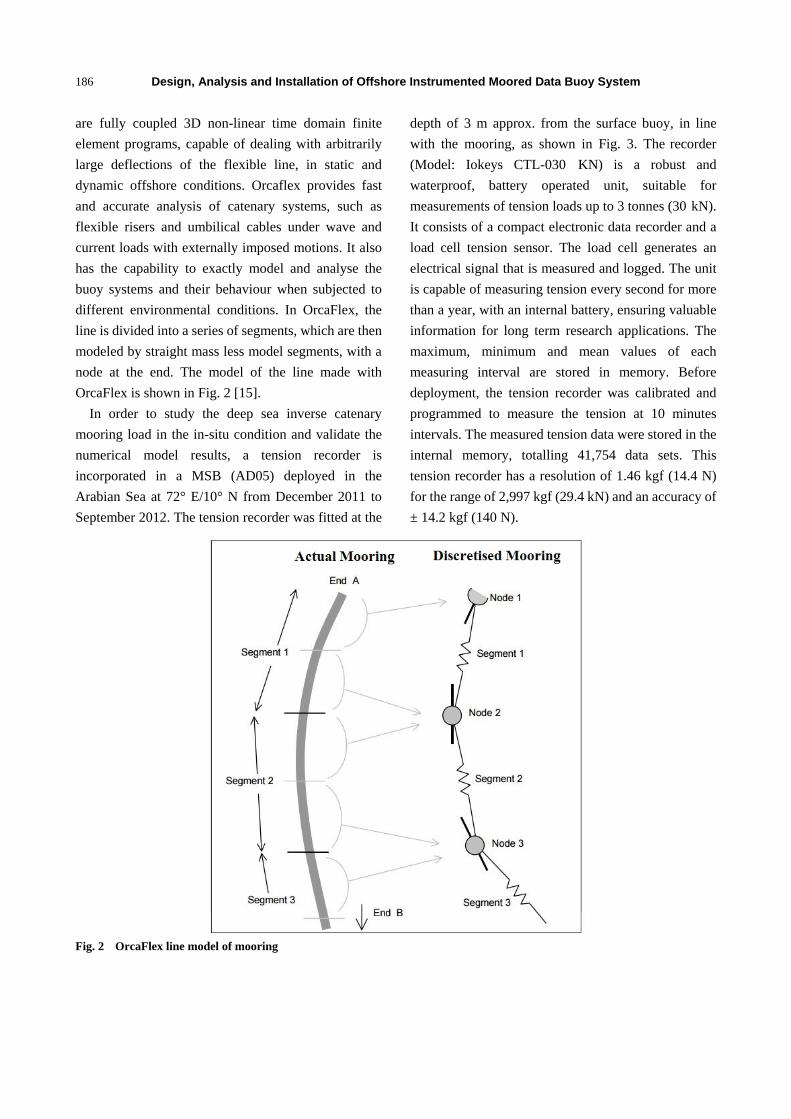
September 2012. The tension recorder was fitted at the
depth of 3 m approx. from the surface buoy, in line
with the mooring, as shown in Fig. 3. The recorder
(Model: Iokeys CTL-030 KN) is a robust and
waterproof, battery operated unit, suitable for
measurements of tension loads up to 3 tonnes (30 kN).
It consists of a compact electronic data recorder and a
load cell tension sensor. The load cell generates an
electrical signal that is measured and logged. The unit
is capable of measuring tension every second for more
than a year, with an internal battery, ensuring valuable
information for long term research applications. The
maximum, minimum and mean values of each
measuring interval are stored in memory. Before
deployment, the tension recorder was calibrated and
programmed to measure the tension at 10 minutes
intervals. The measured tension data were stored in the
internal memory, totalling 41,754 data sets. This
tension recorder has a resolution of 1.46 kgf (14.4 N)
for the range of 2,997 kgf (29.4 kN) and an accuracy of
± 14.2 kgf (140 N).
Fig. 2 OrcaFlex line model of mooring
Design, Analysis and Installation of Offshore Instrumented Moored Data Buoy System
187
Fig. 3 Mooring line with tension recorder.
2.5 Modeling of the Buoy and Mooring System
The surface buoy is modelled as a spar buoy, so as to
capture the interactions with the sea surface. Buoy
geometry is defined in terms of a stack of cylinders, of
appropriate diameters and length. The stack base and
the centre of mass are positioned relative to a
user-defined origin. Subsurface floats at the required
depth are represented by a midline buoy attached to the
line. The mooring line is made up of the required
number of segments, and the respective material
properties were assigned to each segment. The
segment’s length corresponding to the actual mooring
component’s length is given as an input. As the MSB is
already equipped with sensors to measure ocean
parameters, the actual environmental conditions
measured at the location during the logged period were
used for analysis. The environmental condition
selected for modelling is the peak sea condition that
occurred during the studied period.
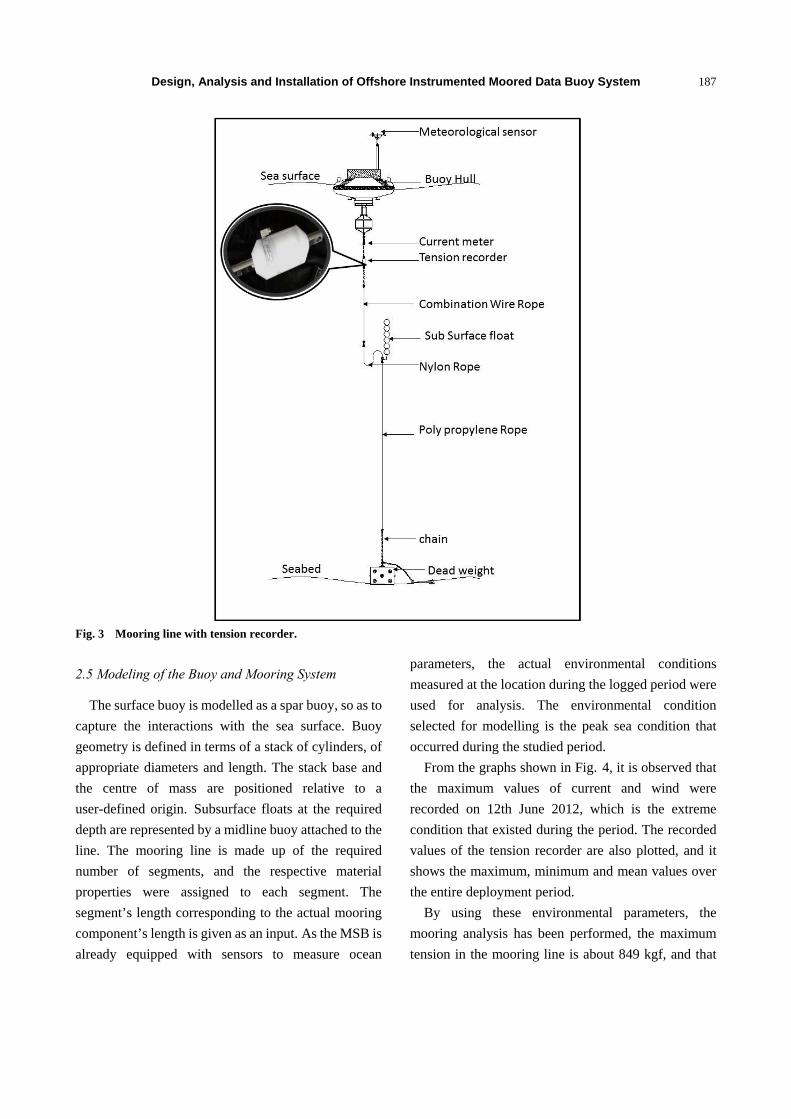
From the graphs shown in Fig. 4, it is observed that
the maximum values of current and wind were
recorded on 12th June 2012, which is the extreme
condition that existed during the period. The recorded
values of the tension recorder are also plotted, and it
shows the maximum, minimum and mean values over
the entire deployment period.
By using these environmental parameters, the
mooring analysis has been performed, the maximum
tension in the mooring line is about 849 kgf, and that
Design, Analysis and Installation of Offshore Instrumented Moored Data Buoy System
188
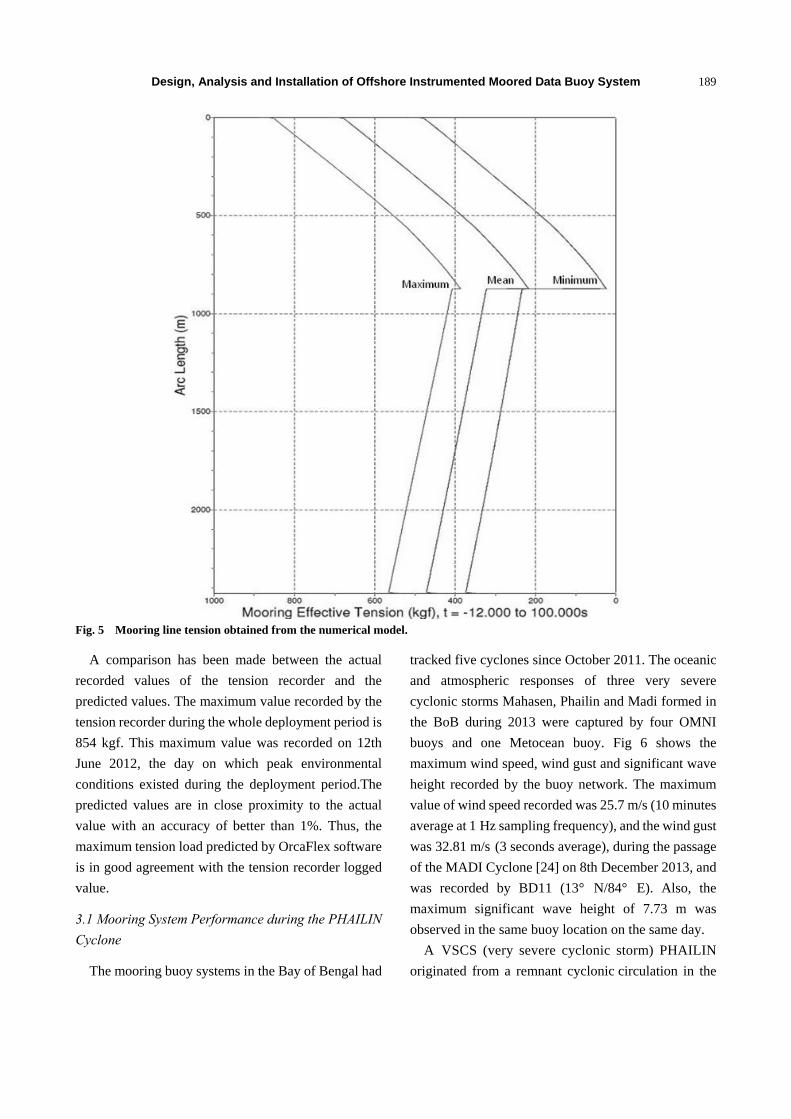
occurs just below the surface buoy. Fig. 5 below
depicts the mooring line tension in the mooring line
over the full simulation time and the results were
compared with the actual measurements of the tension
recorder.
3. Results and Discussion
The mooring line section just below the surface buoy,
and lengths up to 500 m experience more tension
compared with the remaining sections of the mooring.
This is because the surface buoy transforms the full
wave load to the mooring which is located just below it.
Also, the drag force experienced at this section is high,
as the surface current is comparatively high. There is a
sudden decrease of the mooring load in the middle
section as it is slack.
Fig. 4 Wind, surface current and mooring tension data plots from AD05 (72° E/10° N).
Design, Analysis and Installation of Offshore Instrumented Moored Data Buoy System
189
Fig. 5 Mooring line tension obtained from the numerical model.
A comparison has been made between the actual
recorded values of the tension recorder and the
predicted values. The maximum value recorded by the
tension recorder during the whole deployment period is
854 kgf. This maximum value was recorded on 12th
June 2012, the day on which peak environmental
conditions existed during the deployment period.The
predicted values are in close proximity to the actual
value with an accuracy of better than 1%. Thus, the
maximum tension load predicted by OrcaFlex software
is in good agreement with the tension recorder logged
value.
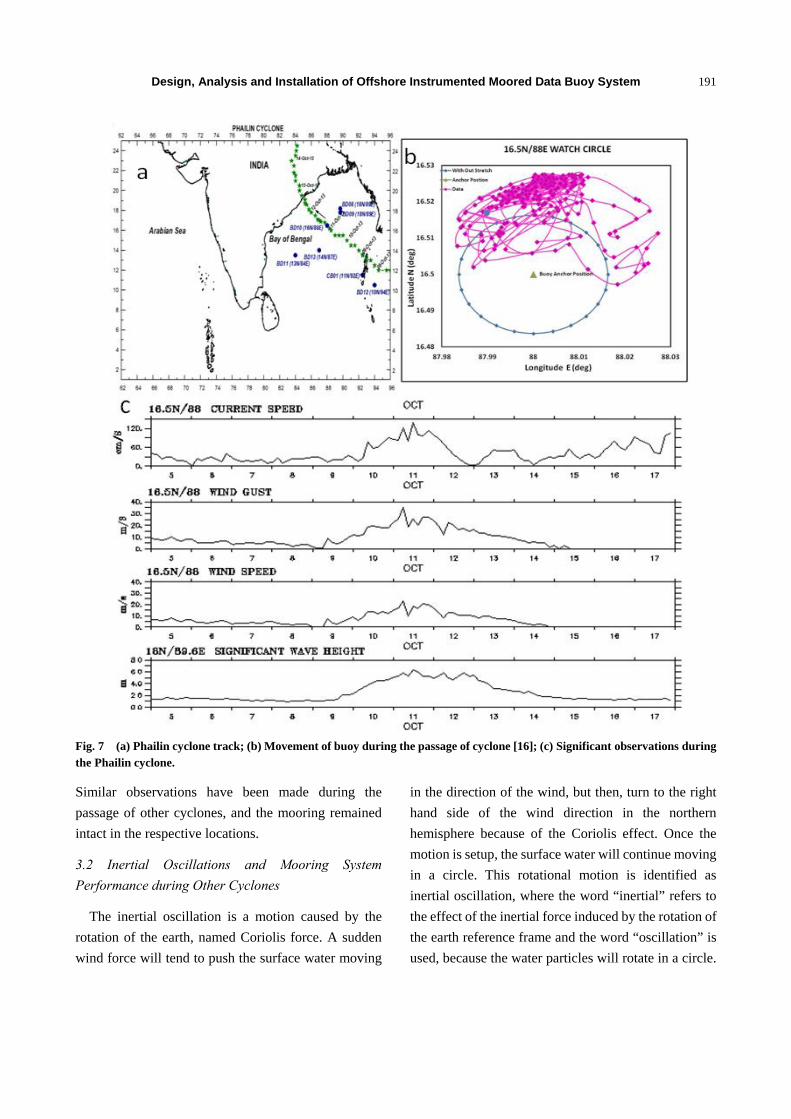
3.1 Mooring System Performance during the PHAILIN
Cyclone
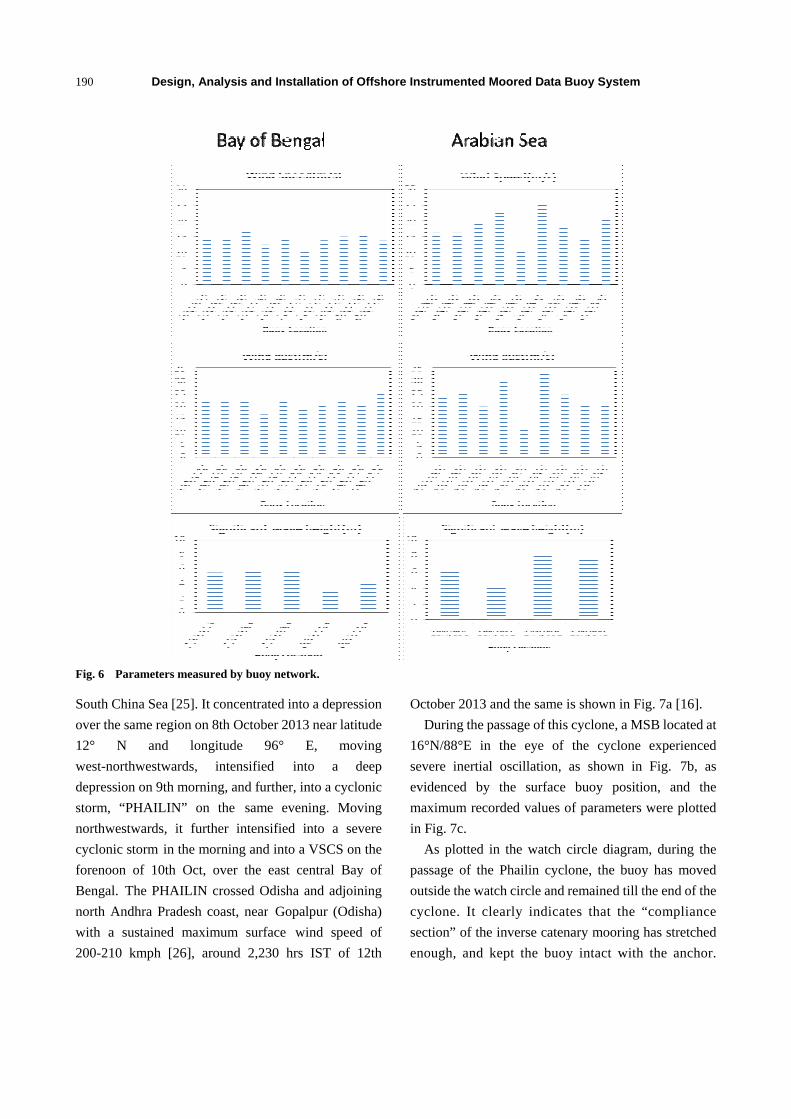
The mooring buoy systems in the Bay of Bengal had
tracked five cyclones since October 2011. The oceanic
and atmospheric responses of three very severe
cyclonic storms Mahasen, Phailin and Madi formed in
the BoB during 2013 were captured by four OMNI
buoys and one Metocean buoy. Fig 6 shows the
maximum wind speed, wind gust and significant wave
height recorded by the buoy network. The maximum
value of wind speed recorded was 25.7 m/s (10 minutes
average at 1 Hz sampling frequency), and the wind gust
was 32.81 m/s (3 seconds average), during the passage
of the MADI Cyclone [24] on 8th December 2013, and
was recorded by BD11 (13° N/84° E). Also, the
maximum significant wave height of 7.73 m was
observed in the same buoy location on the same day.
A VSCS (very severe cyclonic storm) PHAILIN
originated from a remnant cyclonic circulation in the
190
Fig. 6 Param
South China
over the sam
12° N
west-northw
depression o
storm, “PH
northwestwa
cyclonic stor
forenoon of
Bengal. The
north Andhr
with a sust
200-210 km
Design, Ana
meters measur
a Sea [25]. It c
me region on 8
and long
westwards,
on 9th mornin
AILIN” on
ards, it furth
rm in the mo
f 10th Oct, o
e PHAILIN c
ra Pradesh co
tained maxim
mph [26], aro
alysis and In
red by buoy ne
concentrated
8th October 2
gitude 96°
intensified
ng, and furthe
the same e
her intensifie
orning and int
over the east
crossed Odish
oast, near Go
mum surface
ound 2,230
stallation of O
twork.
into a depres
2013 near lati
E, mov
into a d
er, into a cycl
evening. Mov
ed into a se
to a VSCS on
t central Bay
ha and adjoin
opalpur (Odi
wind speed
hrs IST of
Offshore Inst
ssion
tude
ving
deep
lonic
ving
vere
n the
y of
ning
isha)
d of
12th
Oct
D
16°
sev
evid
max
in F
A
pas
outs
cyc
sect
eno
trumented Mo
tober 2013 an
During the pa
N/88°E in t
ere inertial o
denced by t
ximum record
Fig. 7c.
As plotted in
sage of the P
side the watch
clone. It clea
tion” of the in
ough, and ke
oored Data B
nd the same is
ssage of this c
the eye of
oscillation, a
the surface
ded values of
the watch c
Phailin cyclo
h circle and r
arly indicate
nverse catena
ept the buoy
Buoy System
s shown in Fi
cyclone, a M
the cyclone
as shown in
buoy positi
f parameters
circle diagram
one, the buoy
remained till t
es that the “
ary mooring
y intact with
ig. 7a [16].
SB located at
experienced
Fig. 7b, as
on, and the
were plotted
m, during the
y has moved
the end of the
“compliance
has stretched
the anchor.
t
d
s
e
d
e
d
e
e
d
.
Design, Analysis and Installation of Offshore Instrumented Moored Data Buoy System
191
Fig. 7 (a) Phailin cyclone track; (b) Movement of buoy during the passage of cyclone [16]; (c) Significant observations during the Phailin cyclone.
Similar observations have been made during the
passage of other cyclones, and the mooring remained
intact in the respective locations.
3.2 Inertial Oscillations and Mooring System
Performance during Other Cyclones
The inertial oscillation is a motion caused by the
rotation of the earth, named Coriolis force. A sudden
wind force will tend to push the surface water moving
in the direction of the wind, but then, turn to the right
hand side of the wind direction in the northern
hemisphere because of the Coriolis effect. Once the
motion is setup, the surface water will continue moving
in a circle. This rotational motion is identified as
inertial oscillation, where the word “inertial” refers to
the effect of the inertial force induced by the rotation of
the earth reference frame and the word “oscillation” is
used, because the water particles will rotate in a circle.
Design, Analysis and Installation of Offshore Instrumented Moored Data Buoy System
192
An object, free floating or moored at the location near
to this, follows the pattern of this inertial oscillation.
The intensity of the current induced inertial
oscillations has been observed independently, by
lowered and moored current meters, by neutrally
buoyant floats, and by electromagnetic current
measurements. Inertial oscillations occur normally at
the time of cyclones, and the buoy systems moored
close to the travel path of these cyclones may
experience the effect, and those which were reported
on real time basis, and discussed. The OMNI buoy
deployed in BoB at location 10° N/88° E had captured
the tropical cyclone JAL in November 2010 [27].
The OMNI buoy subsurface measurement system
consists of nine numbers of water CT (conductivity and
temperature) sensors mounted on the connector-less
induction cable at pre determined depths, which
measure and transmit the measured data to the buoy
CPU inductively. In addition to that, an acoustic release
is attached just above the dead weight to enable the
retrieval of the induction mooring. The OMNI buoy
deployed in the Northern BoB has recorded the time
series observations of the surface meteorological and
oceanographic parameters, during the passage of the
tropical cyclone in November 2010, which attained
cyclonic strength by 7th November 2010, moved
west-north westwards, and crossed north Tamil Nadu.
The moored data buoy deployed in the Northern
BoB provided significant information about the
cyclone. The effect of the cyclone as well as the inertial
oscillation on the buoy is clearly seen, in the time series
plot (from 5th to 7th November 2010) of the buoy
location shown in Fig. 8. Due to the passage of the
cyclone, the buoy started moving in a circular path and
remained in location.
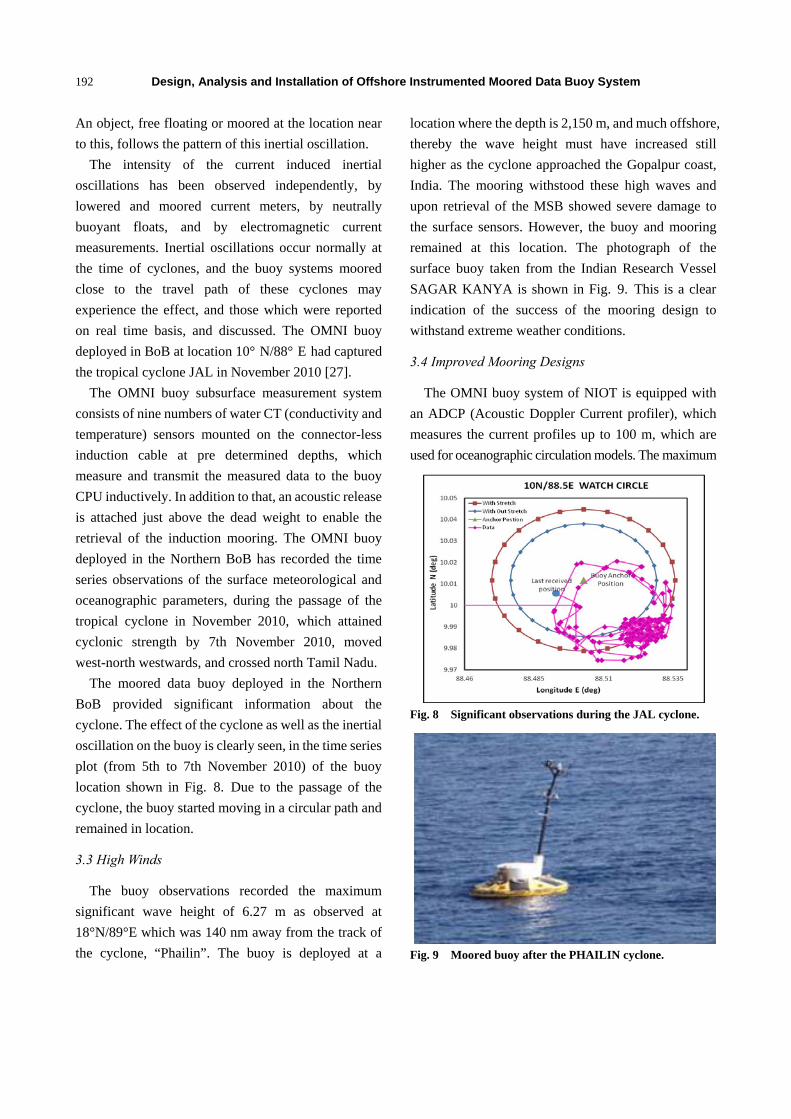
3.3 High Winds
The buoy observations recorded the maximum
significant wave height of 6.27 m as observed at
18°N/89°E which was 140 nm away from the track of
the cyclone, “Phailin”. The buoy is deployed at a
location where the depth is 2,150 m, and much offshore,
thereby the wave height must have increased still
higher as the cyclone approached the Gopalpur coast,
India. The mooring withstood these high waves and
upon retrieval of the MSB showed severe damage to
the surface sensors. However, the buoy and mooring
remained at this location. The photograph of the
surface buoy taken from the Indian Research Vessel
SAGAR KANYA is shown in Fig. 9. This is a clear
indication of the success of the mooring design to
withstand extreme weather conditions.
3.4 Improved Mooring Designs
The OMNI buoy system of NIOT is equipped with
an ADCP (Acoustic Doppler Current profiler), which
measures the current profiles up to 100 m, which are
used for oceanographic circulation models. The maximum
Fig. 8 Significant observations during the JAL cyclone.
Fig. 9 Moored buoy after the PHAILIN cyclone.
Design, Analysis and Installation of Offshore Instrumented Moored Data Buoy System
193
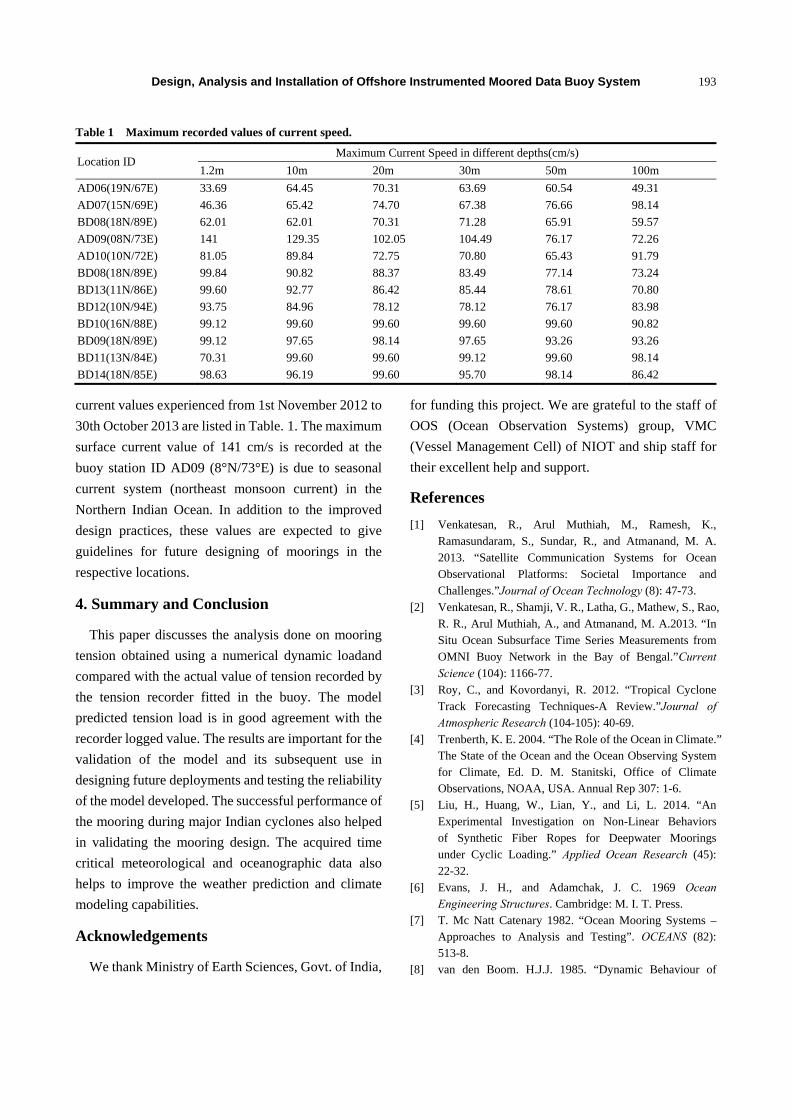
Table 1 Maximum recorded values of current speed.
Location ID Maximum Current Speed in different depths(cm/s)
1.2m 10m 20m 30m 50m 100m
AD06(19N/67E) 33.69 64.45 70.31 63.69 60.54 49.31
AD07(15N/69E) 46.36 65.42 74.70 67.38 76.66 98.14
BD08(18N/89E) 62.01 62.01 70.31 71.28 65.91 59.57
AD09(08N/73E) 141 129.35 102.05 104.49 76.17 72.26
AD10(10N/72E) 81.05 89.84 72.75 70.80 65.43 91.79
BD08(18N/89E) 99.84 90.82 88.37 83.49 77.14 73.24
BD13(11N/86E) 99.60 92.77 86.42 85.44 78.61 70.80
BD12(10N/94E) 93.75 84.96 78.12 78.12 76.17 83.98
BD10(16N/88E) 99.12 99.60 99.60 99.60 99.60 90.82
BD09(18N/89E) 99.12 97.65 98.14 97.65 93.26 93.26
BD11(13N/84E) 70.31 99.60 99.60 99.12 99.60 98.14
BD14(18N/85E) 98.63 96.19 99.60 95.70 98.14 86.42
current values experienced from 1st November 2012 to
30th October 2013 are listed in Table. 1. The maximum
surface current value of 141 cm/s is recorded at the
buoy station ID AD09 (8°N/73°E) is due to seasonal
current system (northeast monsoon current) in the
Northern Indian Ocean. In addition to the improved
design practices, these values are expected to give
guidelines for future designing of moorings in the
respective locations.
4. Summary and Conclusion
This paper discusses the analysis done on mooring
tension obtained using a numerical dynamic loadand
compared with the actual value of tension recorded by
the tension recorder fitted in the buoy. The model
predicted tension load is in good agreement with the
recorder logged value. The results are important for the
validation of the model and its subsequent use in
designing future deployments and testing the reliability
of the model developed. The successful performance of
the mooring during major Indian cyclones also helped
in validating the mooring design. The acquired time
critical meteorological and oceanographic data also
helps to improve the weather prediction and climate
modeling capabilities.
Acknowledgements
We thank Ministry of Earth Sciences, Govt. of India,
for funding this project. We are grateful to the staff of
OOS (Ocean Observation Systems) group, VMC
(Vessel Management Cell) of NIOT and ship staff for
their excellent help and support.
References
[1] Venkatesan, R., Arul Muthiah, M., Ramesh, K., Ramasundaram, S., Sundar, R., and Atmanand, M. A. 2013. “Satellite Communication Systems for Ocean Observational Platforms: Societal Importance and Challenges.”Journal of Ocean Technology (8): 47-73.
[2] Venkatesan, R., Shamji, V. R., Latha, G., Mathew, S., Rao, R. R., Arul Muthiah, A., and Atmanand, M. A.2013. “In Situ Ocean Subsurface Time Series Measurements from OMNI Buoy Network in the Bay of Bengal.”Current Science (104): 1166-77.
[3] Roy, C., and Kovordanyi, R. 2012. “Tropical Cyclone Track Forecasting Techniques-A Review.”Journal of Atmospheric Research (104-105): 40-69.
[4] Trenberth, K. E. 2004. “The Role of the Ocean in Climate.” The State of the Ocean and the Ocean Observing System for Climate, Ed. D. M. Stanitski, Office of Climate Observations, NOAA, USA. Annual Rep 307: 1-6.
[5] Liu, H., Huang, W., Lian, Y., and Li, L. 2014. “An Experimental Investigation on Non-Linear Behaviors of Synthetic Fiber Ropes for Deepwater Moorings under Cyclic Loading.” Applied Ocean Research (45): 22-32.
[6] Evans, J. H., and Adamchak, J. C. 1969 Ocean Engineering Structures. Cambridge: M. I. T. Press.
[7] T. Mc Natt Catenary 1982. “Ocean Mooring Systems – Approaches to Analysis and Testing”. OCEANS (82): 513-8.
[8] van den Boom. H.J.J. 1985. “Dynamic Behaviour of

Design, Analysis and Installation of Offshore Instrumented Moored Data Buoy System
194
Mooring Lines.” In Proceedings of Behaviour of Offshore Structures: 359-68.
[9] Mark A. Grosenbaugh and Spyros A. Mavrakos 1995. “Design of Oceanographic Surface Moorings for Harsh—Weather Environments.” In proceedings of the 103rd Annual Meetings of the Society of Naval Architects and Marine Engineers: 395-423.
[10] Han S. M., and Mark Grosenbaugh 2006. “The Design of Single Point Cable Linked Moorings for Ocean Observations.” IEEE Journal of Ocean Engineering (31): 585-98.
[11] Mark A. Grosenbaugh 1996. “On The Dynamics of Oceanographic Surface Moorings.” Ocean Engineering (23): 7-25.
[12] John l. Pattison 1997. “Components of Force Generated by Harmonic Oscillations of Small Scale Mooring Lines in Water.” David W. Taylor Naval Ship Research and Development Center, Report SPD (589): 3-5.
[13] Jason I. Gobat and Mark A. Grosenbaugh 2000. “WHOI Cable v2.0: Time Domain Numerical Simulation of Moored and Towed Oceanographic Systems.” Technical report of Woods Hole Oceanographic Institution. http://iop.apl.washington.edu/~jgobat/cable.pdf
[14] Prat, J., and Del Rio, J. 2013. “Simulations of a Moored Power Cable at OBSEA Platform”. In the Proceedings of OCEANS’13.
[15] OrcaFlex Manual, Version 9.8a. Orcina Ltd. Daltongate, Cumbria. 2014. http://www.orcina.com/SoftwareProducts/OrcaFlex
[16] Venkatesan, R., Simi Mathew, Vimala J, Latha G, Arul Muthiah, M, Ramasundaram, S., Sundar, R., Lavanya, R, and Atmanand, M. A. 2014. “Signature of Very Severe Cyclonic Storm Phailin in the Met-Ocean Parameters Observed by Moored Buoy Network in the Bay of Bengal.” Current Science (107): 589-95.
[17] Venkatesan, R., Vedachalam, N., Sundar, R., Arul Muthiah M., Prasad, P., and Atmanand M. A. 2015. “Assessment of the Reliability of the Indian Tsunami Buoy System.” Society of Underwater Technology (32): 255-70.
[18] Ricci, P., Rico, A., Ruiz-Minguela, P., Boscolo, F., and Villate, J. L. 2012. “Design, Modeling and Analysis of an Integrated Mooring System for Wave Energy Arrays.” In the Proceedings of 4th International Conference on Ocean Energy.
[19] Paul, W., Irish, J., Gobat, J., and Grosenbaugh, M. 1999. “Coastal Mooring Design: Taut Elastomeric and Chain Catenary Surface Buoy Moorings.” OCEANS '99 MTS/IEEE. Riding the Crest into the 21st Century (1):419-426.
[20] Gilhousen, D. B. 1998. “Improved Real Time Quality Control of NDBC Measurements.” Preprints of the 10th Symposium on Meteorological Observations and Instrumentation: 363-6. http://www.ndbc.noaa.gov/realtime.pdf.
[21] Venkatesan, R. 2011. “NIOT Document on Best of Practice Methods for Met-Ocean Buoys.” http://www.iode.org/index.php?option=com_oe&task=viewDocumentRecord&docID=7573.
[22] Henry O. Berteaux 1976. “Oceanographic Buoy System.” In Buoy Engineering (2nd ed.), New York: John Wiley & Sons: 197-265.
[23] Robet O. Reid and Basil W. Wilson 1962. “Boundary Flow Along a Circular Cylinder”, Technical Report of National Engineering Science Company (204).
[24] MADI IMD, 2013. “Very Severe Cyclonic Storm ‘MADI’ over Bay of Bengal.”
[25] IMD, 2013. “Very Severe Cyclonic Storm, PHAILIN over the Bay of Bengal: A Report.” New Delhi, India: Cyclone Warning Division, IMD. http://www.imd.gov.in/section/nhac/dynamic/phailin.pdf
[26] Venkatesan, R., Arul Muthiah, M., Keshav Kumar, B., Sundar, R., Vedachalam, N., and Atmanand, M. A. 2015. “Evolution of Reliable and Cost-Effective Power Systems for Buoys Used in Monitoring Indian Seas.” Marine Technology Society Journal (49): 71-87.
[27] Venkatesan, R., Ramasundaram, S., Sundar, R., Vedachalam, N., Lavanya, R., and Atmanand, M. A. 2015. “Reliability Assessment of State-of-the-Art Real Time Data Reception and Analysis System for Indian Seas.” MTS (49):127-34.