Embed Size (px)
Citation preview
NASA-CR-[92938
DESIGN, ANALYSIS, AND CONTROL
• ; -_ ,
'/{,/ - <C! -',; ,. /,
)-,
OF LARGE TRANSPORT AIRCRAFT
UTILIZING ENGINE THRUST AS A BACKUP SYSTEM
FOR THE PRIMARY FLIGHT CONTROLS
SEMI-ANNUAL REPORT IN SUPPORT OF GRANTNAG 2-789
NATIONAL AERONAUTICS AND SPACE ADMINISTRATIONDRYDEN FLIGHT RESEARCH FACILITY
AMES RESEARCH CENTER
(NASA-CR-192938) DESIGN, ANALYSIS,
AND CONTROL OF LARGE TRANSPORT
AIRCRAFT UTILIZING ENGINE THRUST AS
A BACKUP SYSTEM FOR THE PRIMARY
FLIGHT CONTROLS (Kansas Univ.)
120 p
N93-27308
Unclas
G3/08 0158846
DONNA S. GERREN
UNIVERSITY OF KANSAS
FEBRUARY 1993
https://ntrs.nasa.gov/search.jsp?R=19930018119 2018-07-06T00:35:49+00:00Z
TABLE OF CONTENTS
I.
.
Subject Pa_e
LIST OF SYMBOLS ...................................................................................... i......... iv
LIST OF TABLES .................................................................................................... ix
LIST OF FIGURES ................................................................................................. xii
CHAPTER I - INTRODUCTION ............................................................................ I
1.1. DOUGLAS DC-10 UNITED AIRLINES ACCIDENT ............................... I
1.2. NATIONAL TRANSPORTATION SAFETY BOARD
RECOMMENDAT IONS ................................................................................... 5
1.3. STUDIES REGARDING USE OF THROTTLES FOR
EMERGENCY FLIGHT CONTROL ................................................................ 6
1.4. PURPOSE AND OBJECTIVES ...................................................................... 7
CHAPTER 2 - BACKGROUND INFORMATION ............................................. 13
2.1. INTRODUCTION .................................................. •................... .................... 13
2.2. AIRCRAFT INCIDENTS WITH SIGNIFICANT FLIGHT
CONTROL FAILURES ................................................................................. 14
2.2.1. DOUGLAS DC-10 AMERICAN AIRLINES INCIDENT ........ 15
2.2.2. DOUGLAS DC- I0 TURKISH AIRLINES ACCIDENT ............ 16
2.2.3. LOCKHEED C-5A USAF ACCIDENT .......................................... 16
2.2.4. LOCKHEED L-1011 DELTA AIRLINES INCIDENT ............. 17
2.2.5. BOEING 747 JAPAN AIRLINES ACCIDENT ......................... 19
2.3. PRINCIPLES OF ENGINES-ONLY CONTROL ....................................... 20
YAW-ROLL CONTROL .................................................................. 20
PITCH CONTROL ............................................................................ 21
2.3.2.1. PHUGOID OSCILLATIONS..., ..................................... 21
TABLE OF CONTENTS (CON'T)
Subject Pa_e
2.3.2.2. FLIGHT PATH ANGLECHANGE RESULTING
FROM SPEED STABILITY .......................................... 23
2.3.2.3. PITCHING MOMENT RESULTING FROM
THRUST LINE OFFSET .................... ............................ 24
2.3.2.4. FLIGHT PATH ANGLE CHANGE RESULTING
FROM THE VERTICAL COMPONENT OF
THRUST ......................... i.................................................. 24
2.3.3. SPEED CONTROL ............................................................................ 24
2.3.4. THRUST RESPONSE ....................................................................... 25
2.3.5. EFFECTS OF THRUST ON PROPULSIVE CONTROL
POWER .............................................................................................. 25
2.4. HISTORICAL REVIEW .............................................................................. 26
2.4.1. FLIGHT RESEARCH STUDIES .................................................... 27
2.4.1.1. F-15 AIR SUPERIORITY FIGHTER ......................... 27
2.4.1.2. LEAR 24 EXECUTIVE JET TRANSPORT ................ 28
2.4,1.3. PA-30 PISTON-POWERED LIGHT TWIN-
ENGINE PLANE ............................................................. 29
2.4.2. SIMULATOR STUDIES ................................................................. 30
2.4.2.1. B-720 COMMERCIAL JET TRANSPORT ............... 30
2.4.2.2. B-727 COMMERCIAL JET TRANSPORT ............... 31
2.4.2.3. F-15 AIR SUPERIORITY FIGHTER ......................... 32
2.4.2.4. MD-II COMMERCIAL JET TRANSPORT .............. 33
2.4.3. OVERALL FLYING QUALITIES ................................................ 33
ii
TABLE OF CONTENTS (CON'T)
.
Subject Pa_e
2.4.3.1. AUGMENTED CONTROL SYSTEM ............................ 34
2.5. CURRENT RESEARCH ................................................................................. 37
CHAPTER 3 - OUTLINE OF PROPOSED WORK ............................................ 49
3. I. INTRODUCTION .......................................................................................... 49
3.2. FAMILIARIZATION WITH PREVIOUS NASA WORK
AND APPLICABLE NASA RESEARCH TOOLS ................................... 51
3.3. BASELINE DESIGN OF A MEGA-TRANSPORT ................................. 54
3.3.1. MISSION SPECIFICATIONS ....................................................... 54
3.3.2. MISSION PROFILE ........................................................................ 55
3.3.3. SUMMARY OF THE MEGA-TRANSPORT DATA ................. 57
3.4. DEVELOP A SIMULATION OF THE MEGA-TRANSPORT ............. 57
3.5. MEGA-TRANSPORT SIMULATION FLYING QUALITIES
EVALUATION .............................................................................................. 58
3.6. MEGA-TRANSPORT SIMULATION FLYING QUALITIES
ANALYSIS ................................................................................................... .59
3.7. DETERMINATION OF .BENEFITS ASSOCIATED WITH
AUGMENTED THROTTLES-ONLY CONTROL SYSTEM .................... 64
974. CHAPTER 4 - REFERENCES ................................................................................
iii
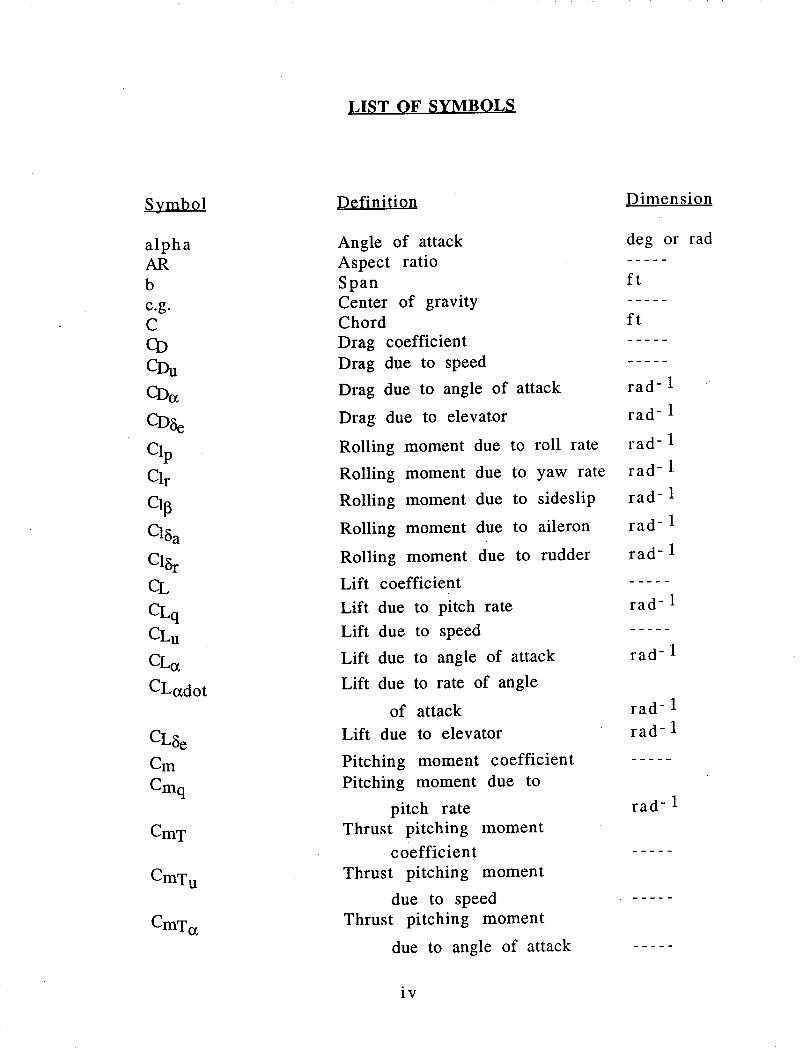
LIST OF SYMBOLS
Symbol
alphaAR
b
c.g.C
CDCDuCDa
CD_e
ClpClr
Cl_
C18a
Cl_rCL
CLq
CLu
CLa
CLo_dot
CL_eCm
Cmq
CmT
CmTu
CmTot
Angle of attack
Aspect ratio
Span
Center of gravity
Chord
Drag coefficient
Drag due to speed
Drag due to angle of attack
Drag due to elevator
Rolling moment due to roll rate
Rolling moment due to yaw rate
Rolling moment due to sideslip
Rolling moment due to aileron
Rolling moment due to rudder
Lift coefficient
Lift due to pitch rate
Lift due to speed
Lift due to angle of attack
Lift due to rate of angle
of attack
Lift due to elevator
Pitching moment coefficient
Pitching moment due to
pitch rate
Thrust pitching moment
coefficient
Thrust pitching moment
due to speed
Thrust pitching moment
due to angle of attack
Dimension
deg or rad
ft
ft
rad- 1
rad- 1
rad- 1
rad- 1
rad- 1
rad- 1
rad- 1
rad- 1
rad- 1
rad- 1
rad- 1
rad- 1
iv
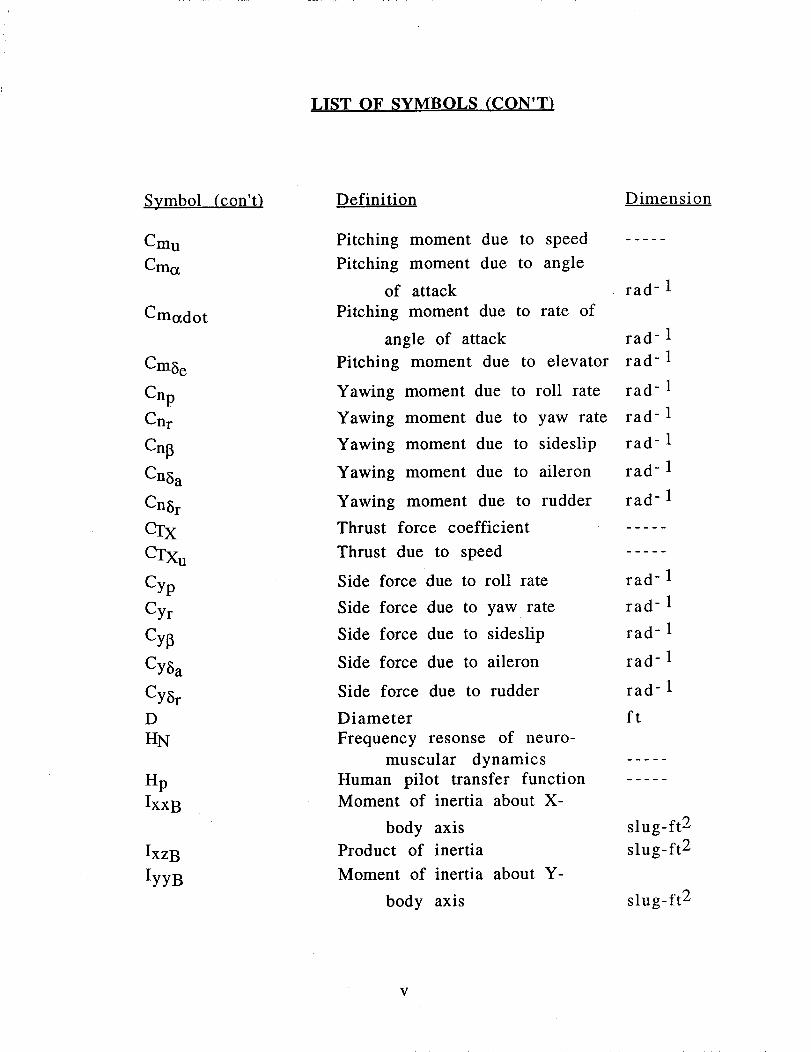
LIST OF SYMBOLS (CON'T)
Symbol (con't)
Cm u
Cmot
Cmadot
CmSe
Cnp
Cnr
Cn_
Cn_ a
Cng r
eixCTXu
Cyp
Cyr
Cyf_
Cyg a
CySr
D
HN
Hp
IxxB
IxzB
IyyB
Definition
Pitching moment due to speed
Pitching moment due to angle
of attack
Pitching moment due to rate of
angle of attack
Pitching moment due to elevator
Yawing moment due to roll rate
Yawing moment due to yaw rate
Yawing moment due to sideslip
Yawing moment due to aileron
Yawing moment due to rudder
Thrust force coefficient
Thrust due to speed
Side force due to roll rate
Side force due to yaw rate
Side force due to sideslip
Side force due to aileron
Side force due to rudder
Diameter
Frequency resonse of neuro-
muscular dynamics
Human pilot transfer function
Moment of inertia about X-
body axis
Product of inertia
Moment of inertia about Y-
body axis
Dimension
rad- 1
rad- 1
rad- 1
rad- 1
rad- 1
rad- 1
rad- 1
rad- 1
rad- 1
rad- 1
rad- 1
rad- 1
tad- 1
ft
slug-ft 2
slug-ft 2
slug-ft 2
V
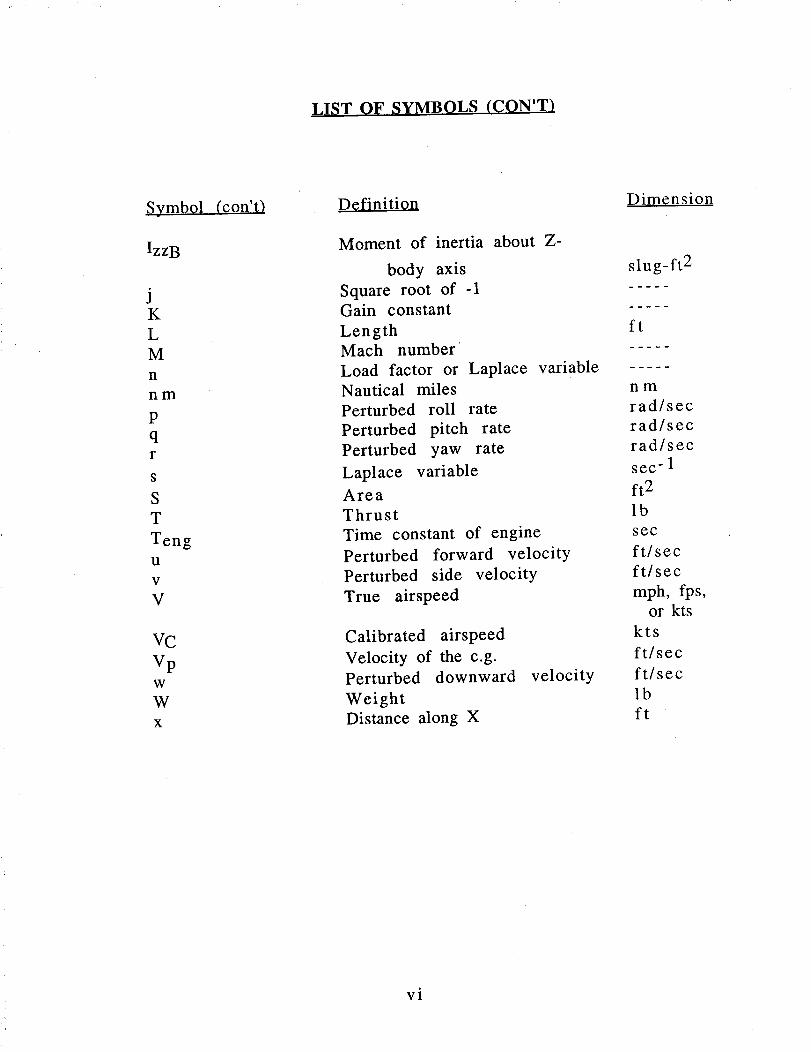
LIST OF SYMBOLS (CON'T)
Symbol (con't)
IzzB
JK
L
M
n
nm
P
qr
s
S
T
TengU
V
V
VC
VpW
W
X
Definition
Moment of inertia about Z-
body axis
Square root of -1Gain constant
LengthMach number
Load factor or Laplace variable
Nautical miles
Perturbed roll rate
Perturbed pitch rate
Perturbed yaw rate
Laplace variable
Area
Thrust
Time constant of engine
Perturbed forward velocity
Perturbed side velocity
True airspeed
Calibrated airspeed
Velocity of the c.g.
Perturbed downward
Weight
Distance along X
velocity
Dimension
slug-ft 2
ft
nm
rad/sec
rad/sec
rad/sec
sec- 1
ft 2
lb
sec
ft/sec
ft/sec
mph, fps,or kts
kts
ft/sec
ft/sec
lb
ft
vi
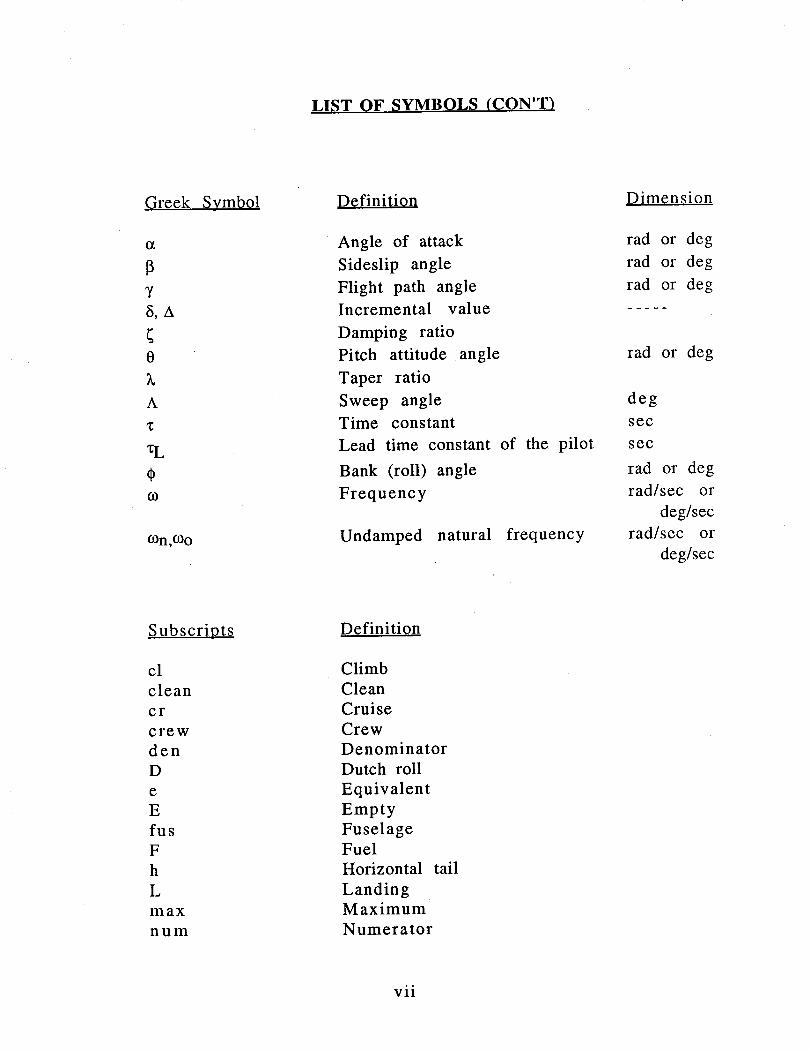
LIST OF SYMBOLS (CON'T)
Greek Symbol
Y
8, A
0
A
4)60
O)n,O)o
Dcfinition
Angle of attack
Sideslip angle
Flight path angle
Incremental value
Damping ratio
Pitch attitude angle
Taper ratio
Sweep angle
Time constant
Lead time constant of the pilot
Bank (roll) angle
Frequency
Undamped natural frequency
Dimension
rad or deg
rad or deg
rad or deg
rad or deg
deg
see
see
rad or deg
rad/sec or
deg/sec
rad/sec or
deg/sec
Subscripts
cl
clean
cr
crew
den
D
e
E
fus
F
h
L
max
num
Definition
Climb
Clean
Cruise
Crew
Denominator
Dutch roll
Equivalent
Empty
FuselageFuel
Horizontal tail
LandingMaximum
Numerator
vii
LIST OF SYMBOLS (CON'T)
Subscripts (con't)
PP
PL
r
reqdR
S
SP
t
tfo
TO
V
W
1
Definition
Pilot
Phugoid
PayloadRoot
RequiredRoll
Spiral
Short-period
Tip
Trapped fuel and oilTakeoff
Vertical tail
Wing
Steady state
Acronyms
AAA
AIAA
CAS
DAC
FAA
FAR
LDP
NASA
NTSB
PCA
PIO
PLA
PLF
USAF
Definition
Advanced Aircraft Analysis
American Institute of Aeronautics and
Astronautic s
Control Augmentation System
Douglas Aircraft CompanyFederal Aviation Administration
Federal Aviation Regulations
Landing Difficulty ParameterNational Aeronautics and
Space Administration
National Transportation Safety Board
Propulsion Controlled Aircraft
Pilot Induced Oscillation
Power Lever Angle
Power for Level Flight
United States Air Force
viii
LIST OF TABLES
Table
2.1
.Title
Physical Characteristics of the Airplanes
Pa_e
39
3.1 Classification of Airplanes 66
3.2 Flight Phase Categories 67
3.3 Levels of Flying Qualities 69
3.4 Allowable Probability of Certain System Failures 69
3.5 Cooper-Harper Pilot Opinion Rating Scale 70
3.6 Summary of the Geometry, Weight, Drag Polar, and
Performance Sizing Data for the Mega-Transport 71
3.7 Nondimensional Stability and Control Derivatives
for the Mega-Transport 74
3.8 Longitudinal Transfer Functions for the
Mega-Transport - Cruise Condition 77
ix
LIST OF TABLES (CON'T)
Table
3.9
Title Pa_e
Longitudinal Mode Flying Quality Parameters
and Flying Quality Levels for the Mega-Transport -
Cruise Condition 78
3.10 Longitudinal Transfer Functions for the
Mega-Transport - Approach Condition 79
3.11 Longitudinal Mode Flying Quality Parameters
and Flying Quality Levels for the Mega-Transport -
Approach Condition 8O
3.12 Lateral-Directional Transfer Functions for the
Mega-Transport - Cruise Condition 81
3.13 Lateral-Directional Roll Performance Parameters
and Flying Quality Levels for the Mega-Transport -
Cruise Condition 83
3.14 Lateral-Directional Spiral and Dutch Roll
Parameters and Flying Quality Levels for the
Mega-Transport - Cruise Condition 84
X
LIST OF TABLES (CON'T)
Table
3.15
Title
Lateral-Directional Transfer Functions for the
Mega-Transport - Approach Condition
Pa_e
85
3.16 Lateral=Directional Roll Performance Parameters
and Flying Quality Levels for the Mega-Transport -
Approach Condition 87
3.17 Lateral-Directional Spiral and Dutch Roll
Parameters and Flying Quality Levels for the
Mega-Transport - Approach Condition 88
xi
LIST OF FIGURES
Figure
1.1
Title
The DC- I0 Commercial Jet Transport
Pa_e
9
1.2 Landing Results, F- 15 Simulation I0
1.3(a) Boeing's 600 - 650-Passenger Transport Concept 11
1.3(b) Airbus Industrie's 600-Passenger Transport
Concept II
1.3(c) McDonnell-Douglas MD- 12 511 -Passenger
Transport Concept 12
2.1 Dutch Roll Mode as Seen by an Outside Observer 40
2.2 Phugoid Mode as Seen by an Outside Observer 41
2.3 Effect of Speed on F-15 Flight and Simulation
Maximum Pitch Rates (CAS Off) 42
2.4 Landing Difficulty Parameter (LDP) for F-15
Simulation Flown with Manual Throttles-Only
Control (Trim Airspeed 170 knots) 42
xii
LIST OF FIGURES (CON'T)
Figure
2.5
Title
The F-15 Air Superiority Fighter
Pa_e
43
2.6 The Lear 24 Executive Jet 43
2.7 The PA-30 Light, Twin-Engine Airplane 44
2.8 The B-720 Commercial Jet Transport 44
2.9 The B-727 Commercial Jet Transport 45
2.10 The MD-I I Commercial Jet Transport 45
2.11 Longitudinal Block Diagram - Flight Path Angle
Control 46
2.12 Lateral-Directional Block Diagram - Bank Angle
and Heading Control 46
2.13 Time History of Throttles-Only Manual Landing
of the F- 15 Simulation (Trim Airspeed 170 knots -
Pilot Inexperienced with Manual Throttles-Only
Control) 47
i,o
XIII
LIST OF FIGURES (CON'T)
Figure
2.14
Title
Time. History of Augmented Throttles-Only
Landing of the F-15 Simulation (Trim Airspeed
170 knots - Inexperienced Pilot's First Landing
Using System)
Pa_e
48
3.1 NASA Dryden B-720 Simulation Cockpit 89
3.2 Time-History of B-720 Augmented Throttles-Only
Control System Approach and Landing; 160 knots,
No Flaps, Light Turbulence, 1,000 Foot Offset from
Runway 90
3.3 Mission Profile of the Mega-Transport 91
3.4 A Preliminary Three-View of the Mega-Transport 92
3.5 Short=Period Frequency Requirements for the
Mega-Transport - Cruise Condition 93
3.6 Short-Period Frequency Requirements for the
Mega-Transport - Approach Condition 93
xiv
LIST OF FIGURES (CON'T)
Figure
3.7
Title Pa_e
Minimum Dutch Roll Frequency and Damping Ratio
Requirements for the Mega-Transport -
Cruise Condition 94
3.8 Minimum Dutch Roll Frequency and Damping Ratio
Requirements for the Mega-Transport -
Approach Condition 94
3.9 Pilot/Engine/Airframe Closed Loop System 95
3.10 Measured Data with Fitted Pilot Model Hp((O)
for Disturbance Task 96
XV
CHAPTER 1
INTRODUCTION
I.I. DOUGLAS DC-10 UNITED AIRLINES ACCIDENT 1,2,3,4'5'6
United Airlines Flight 232 from Denver to Chicago was cruising
above Iowa at 37,000 feet on July 19, 1989. About one hour into the
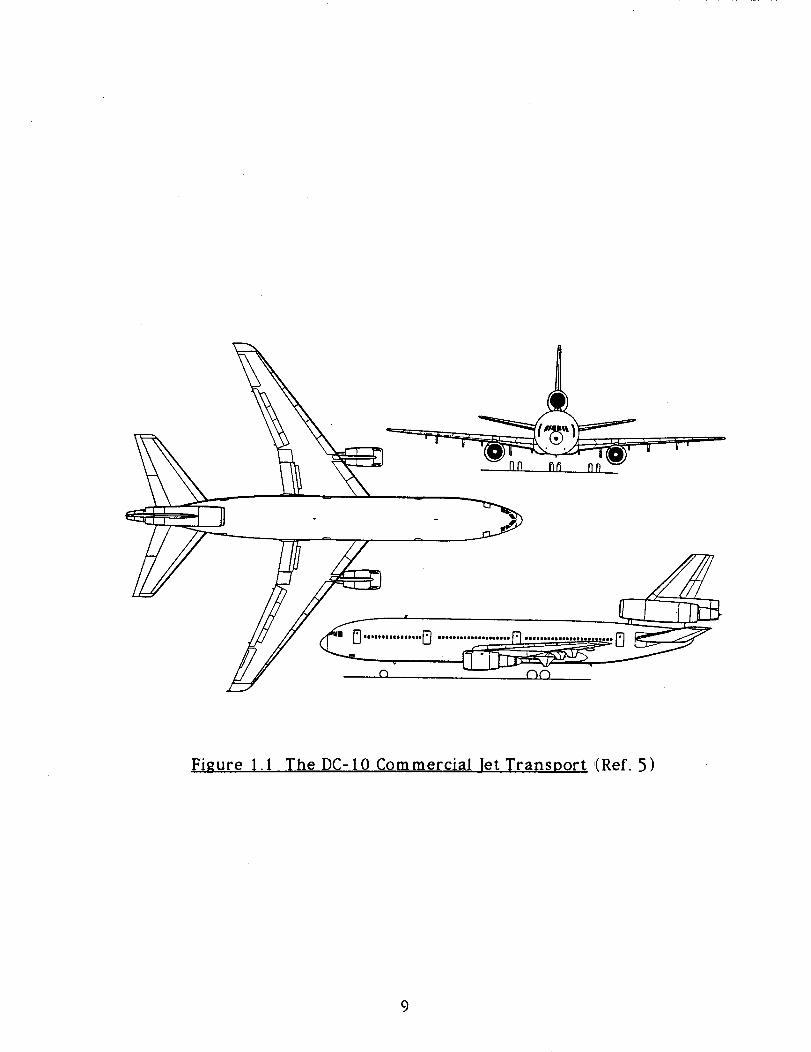
flight, the flight crew heard an explosion and the DC-10 (see Figure
1.1) began to shudder. The instruments showed that the tail-
mounted engine had failed.
As the captain and the first officer struggled to control the
aircraft, the flight engineer reported that all the hydraulic gauges
were reading zero. There was no fluid and no pressure in any of the
three independent hydraulic systems.
Primary flight controls on the DC-10 consist of inboard and
outboard ailerons, two-section elevators, and a two-section rudder.
Secondary flight controls consist of leading edge slats, spoilers,
inboard and outboard flaps, and a dual-rate movable horizontal
stabilizer. Flight control surfaces are segmented to achieve
redundancy. Each primary and secondary control surface is powered
by two of three independent hydraulic systems.
The three independent, continuously operating hydraulic
systems are intended to provide power for full operation and control
of the airplane in the event that one or two of the hydraulic systems
are rendered inoperative. System integrity of at least one hydraulic
system is required - fluid present and the ability to hold pressure -
for continued flight and landing. There are no provisions for
reverting to manual flight control inputs.
Loss of hydraulic fluid in all three hydraulic systems made
control of the aircraft using the flight control systems impossible. At
this time the pilot declared an emergency. The aircraft was re-
routed to Sioux City municipal airport due to the 8,999 foot long
runway.
The passengers were told of the engine failure and the flight
attendants were instructed to prepare the cabin for an emergency
landing. Among the passengers was an off-duty United Airlines
training check pilot, who had logged 3,000 of his 23,000 flight hours
in DC-10s. He offered his help and was immediately invited up to
the cockpit.
The check pilot was asked to go back into the cabin and inspect
the wings. The inboard ailerons were displaced slightly upwards, the
spoilers were locked down, and there was no movement of the flight
control surfaces. The first officer would later perform a cabin check
and report that, in addition, the horizontal stabilizers were badly
damaged.
The captain directed, the check pilot to take control of the
throttles to free the captain and first officer to try once more to
manipulate the flight controls. The check pilot attempted to use
engine power to control pitch and roll. Control of the aircraft was
extremely difficult. It took anywhere from 20 to 40 seconds after a
thrust adjustment for the intended change in attitude to occur.
The pilots jettisoned as much fuel as possible and extended the
landing gear by means of a backup system. The flight crew said that
they made visual contact with the airport about nine miles out.
Though they had planned on landing on Runway 31 due to its length,
the aircraft was lined up with shorter Runway 22. Because of the
difficulty in making turns, the crew decided to land on Runway 22.
The check pilot worked the throttles continuously during final
approach. The flaps and slats could not be extended since they
operated using the hydraulic system. Visual cues and the first
officer's airspeed indicator were used to determine the flight path
and the need for thrust changes. The aircraft was fairly well aligned
with the runway, but was descending at a high rate.
On final approach, the nose pitched down and the right wing
dropped. First ground contact was made by the right wing tip
followed by the right main landing gear. The airplane skidded to the
right of the runway and rolled to an inverted position. The airplane
cartwheeled and ignited in flame, coming to rest after crossing
Runway 17.
Fire fighting and rescue operations began immediately, but the
aircraft was destroyed by impact and fire. There were 296
passengers and crewmembers aboard Flight 232 - 185 of them
survived the crash.
The FAA determined that the tail-mounted engine experienced
an uncontained failure of the stage 1 fan rotor disk assembly. The
engine fragments severed the Number I and Number 3 hydraulic
system lines. In addition, the forces of the engine failure fractured
the Number 2 hydraulic system, rendering the three hydraulic-
powered flight control systems inoperative. Typical of all wide-body
3
transport aircraft, there are no alternate power sources for the flight
control systems.
Because of the loss of the three hydraulic systems, the flight
crew was confronted with a unique situation that left them with very
limited control of the airplane. The only means available to fly the
airplane was manipulation of thrust available from the remaining
two wing-mounted engines. The primary task confronting the flight
crew was controlling the flight path. This task was extremely.
difficult to accomplish because of the need to use the engine throttles
asymmetrically to maintain lateral roll control coupled with the need
to use increases and decreases in thrust to maintain pitch control.
The flight crew found that despite their best efforts, they could not
maintain a stabilized flight condition.
Douglas Aircraft Company, the FAA, and United Airlines
considered the total loss of hydraulic-powered flight controls so
remote that no procedure to counter such a situation was ever
conceived. The simulator reenactment of the events leading to the
crash landing revealed that landing under these conditions involves
many variables that affect the extent of controllability during the
approach and landing such as airspeed, ground effect, aircraft
attitude, and rate of descent. While any one of these parameters
might be controllable by the flight crew, it was virtually impossible
to control all parameters simultaneously.
The National Transportation Safety Board concluded that the
damaged DC-10 aircraft was marginally flyable using throttle
controls to control the thrust on the remaining two engines.
However, a safe landing on a runway was determined to be virtually
4
impossible with the loss of all hydraulic flight controls. The Safety
Board ruled that under the circumstances, the United Airlines flight
crew performance was highly commendable and greatly exceeded
reasonable expectations.
1.2. NATIONAL TRANSPORTATION SAFETY BOARD
RECOMMENDATIONS I
As a result of the United Airlines DC-I0 accident at Sioux City,
the National Transportation Safety Board reviewed alternate flight
control system design concepts for wide-body airplanes. The concept
of three independent hydraulic systems, as installed on the DC-10, is
not unique. Boeing and Airbus have three such systems on some of
their most recently certified models. Lockheed and Boeing have also
provided four independent systems on some of their wide-body
airplanes.
The Safety Board could find no inherent safety advantage to
the installation of additional independent hydraulic systems for
flight controls beyond those currently operating in today's fleet.
However, the Safety Board believes that backup systems to the
primary hydraulic systems should be developed and included in the
initial design for certification. Such backup systems are particularly
important for the coming generation of wide-body airplanes. Manual
reversion flight control systems are quite likely impractical because
of the power requirements to deflect large control surfaces that are
heavily loaded. Therefore, the Safety Board recommended that the
5
FAA encourages continued research and development into backup
flight control systems for newly certificated wide-body airplanes
that employ an alternate source of motive power separate than that
used for the conventional control system.
1.3. STUDIES REGARDING USE OF THROTTLES FOR EMERGENCY
FLIGHT CONTROL 7,8,9
The NASA Dryden Flight Research Facility (NASA Dryden) at
Edwards Air Force Base, California, has been the site for conducting
preliminary flight, ground simulator, and analytical studies regarding
the use of throttles for emergency flight control of a multi-engine
aircraft. This investigation was begun as a result of the relatively
successful attempted landing of the United Airlines DC-10 at Sioux
City. The objective has been to determine the degree of control
power available with the throttles for various classes of airplanes
and to investigate the development of possible control modes for
future airplanes.
The research work performed thus far at NASA Dryden
appears to indicate that control of an aircraft with partial or total
flight control system failure using throttles-only control is feasible.
Based on simulator and flight results, all of the airplanes studied at
NASA Dryden to date have exhibited some control capability with
throttles-only control. All airplanes could be controlled in a gross
manner, although it was very difficult to achieve precise control with
6
manual throttle control. Landings using manual throttles-only
control were extremely difficult.
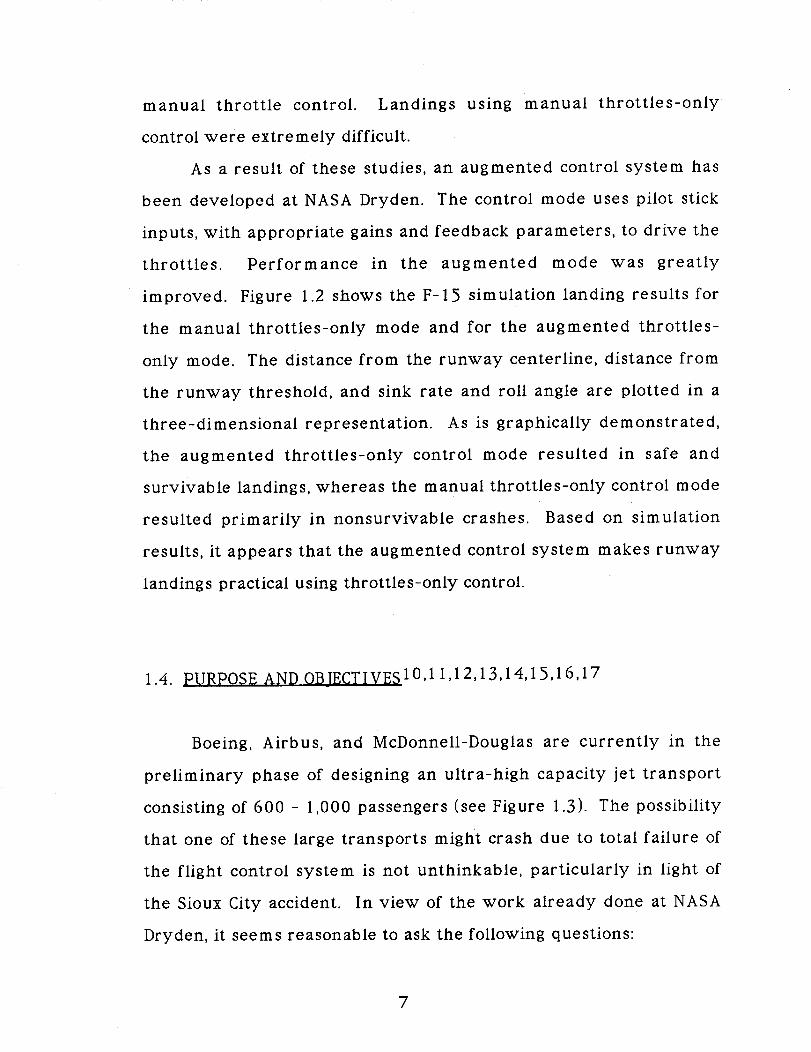
As a result of these studies, an augmented control system has
been developed at NASA Dryden. The control mode uses pilot stick
inputs, with appropriate gains and feedback parameters, to drive the
throttles. Performance in the augmented mode was greatly
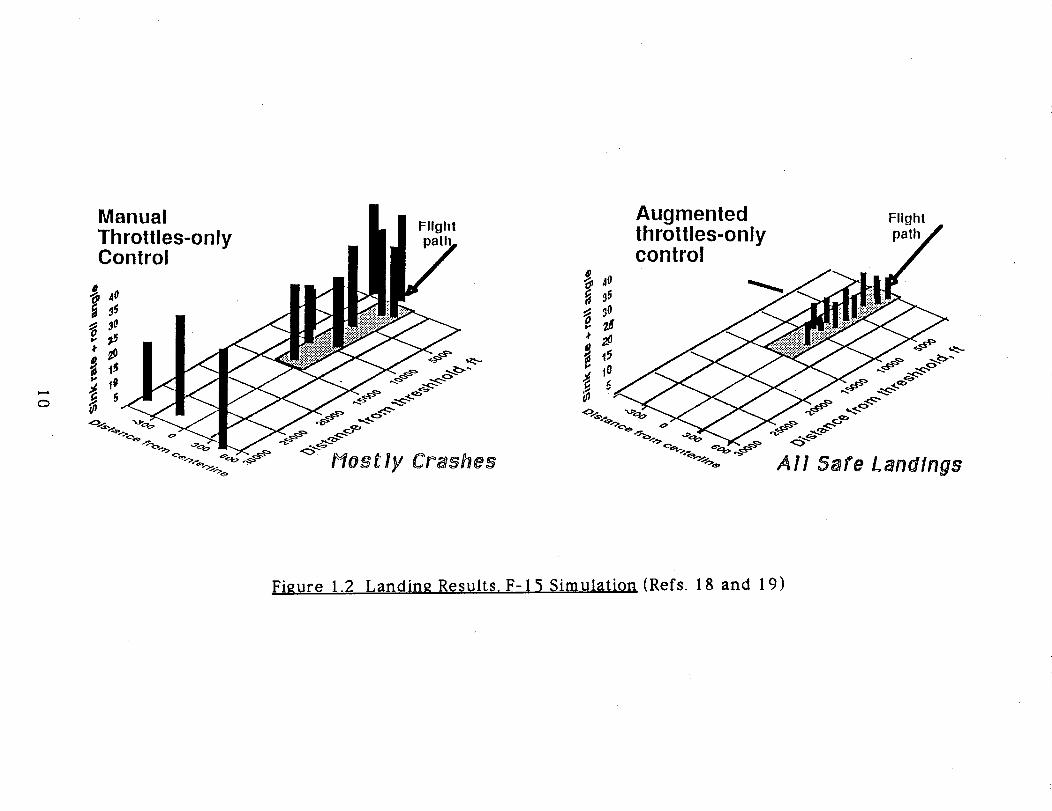
improved. Figure 1.2 shows the F-15 simulation landing results for
the manual throttles-only mode and for the augmented throttles-
only mode. The distance from the runway centerline, distance from
the runway threshold, and sink rate and roll angle are plotted in a
three-dimensional representation. As is graphically demonstrated,
the augmented throttles-only control mode resulted in safe and
survivable landings, whereas the manual throttles-only control mode
resulted primarily in nonsurvivable crashes. Based on simulation
results, it appears that the augmented control system makes runway
landings practical using throttles-only control.
1.4. PURPOSE AND OBJECTIVES I0,I 1,12,13,14,15,16,17
Boeing, Airbus, and McDonnell-Douglas are currently in the
preliminary phase of designing an ultra-high capacity jet transport
consisting of 600 - 1,000 passengers (see Figure 1.3). The possibility
that one of these large transports might crash due to total failure of
the flight control system is not unthinkable, particularly in light of
the Sioux City accident. In view of the work already done at NASA
Dryden, it seems reasonable to ask the following questions:
7
• Is it possible to arrange the engines in a large passenger
transport in such a way that flight path control using only the
engines is not only possible, but meets Level 1 or Level 2 handling
quality require ments?
• Since total failure of the primary flight control system can be
caused by the failure of an engine, can the number of engines and
their arrangement be selected such that flight path control with one
engine inoperative is still possible with Level I or Level 2 handling
quality requirements?
• Can one or more levels of primary flight control system
redundancy be eliminated in an airplane equipped with a Level I or
Level 2 engine control system, allowing the engine thrust to be used
as a backup flight control system?
• What are the weight, drag, systems design, and cost benefits
associated with such a design?
This comprehensive proposal will present a procedure which
will attempt to answer these important questions. Chapter 2
contains the background information pertinent to this proposal, while
Chapter 3 presents an outline of the proposed work.
8
n AN
Figure 1.1 The DC-10 Commercial Jet Transport ,(Ref. 5)
9
CD
ManualThrottles-onlyControl
4O
FlightAugmented Flightthrottles-only path,/'control /"
_0 jii .....
" _ _ 2<__ "_ ..o_"
_- A 11 Safe Landings
Figure 1.2 Landing Results, F-|5 Simulation (Refs. 18 and 19)
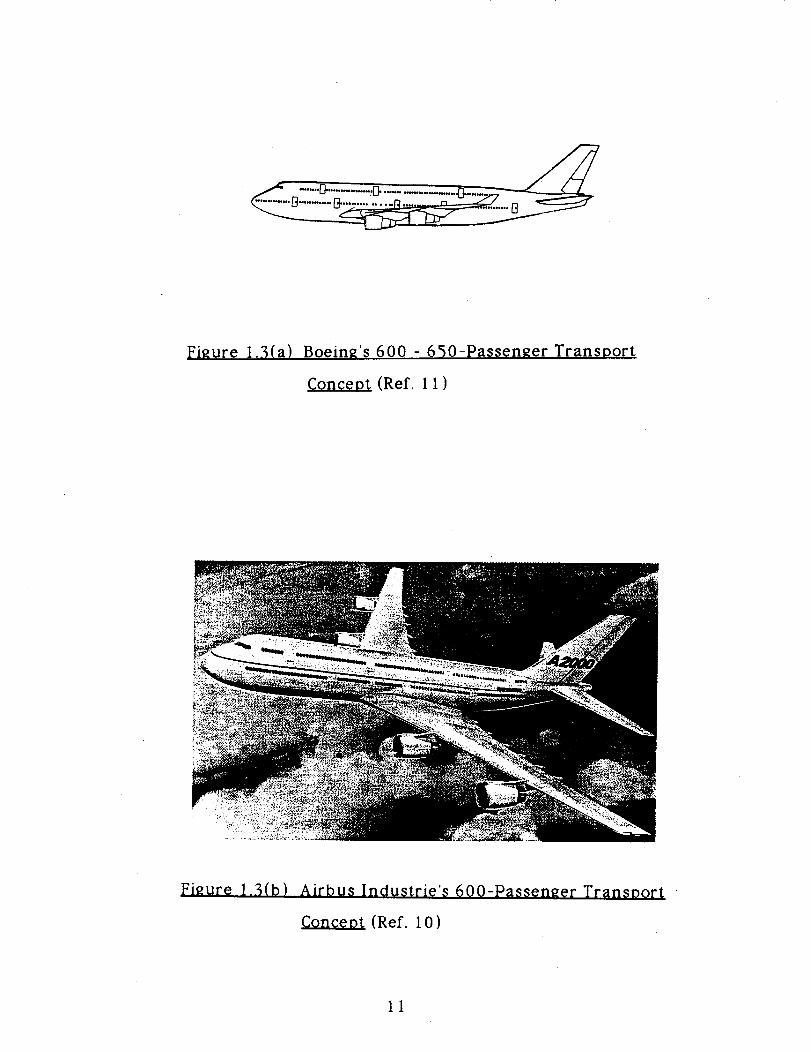
Figure 1.3(a) Boein_'s600-650-Passen_erTransDort
Concept (Ref. I I )
Figure 1.3(b) Airbus Industrie's 600-Passenger Transport
Conce_t (Ref. I0)
II
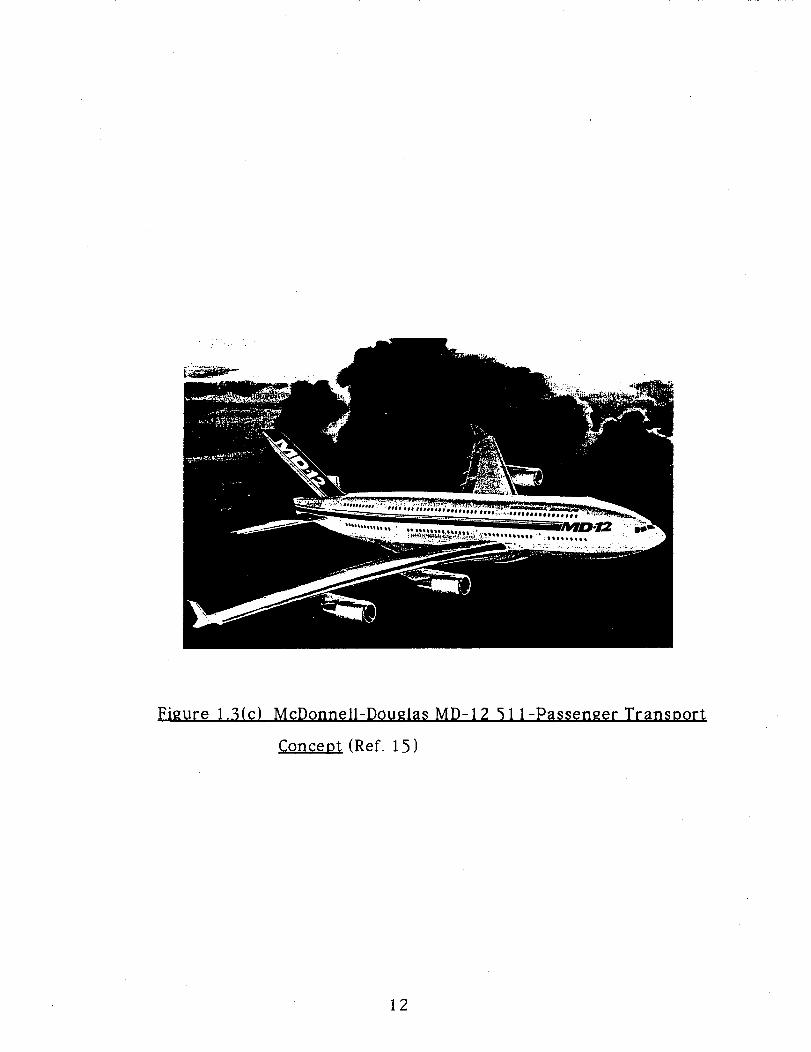
Figure 1.3(c) McDonnell-Dou_las MD- 12 5 1 1 -Passenger Transoort
Concept (Ref. 15)
12
CHAPTER 2
BACKGROUND INFORMATION
2.1. INTRODUCTION 1,9
Steady level cruise flight is attained when the forces acting on
the airplane are in a state of equilibrium; that is, thrust equals drag
and the weight of the airplane is balanced by the lift forces produced
primarily by the wing and horizontal stabilizer. Lift, drag, and thrust
vary with airspeed, angle of attack, and atmospheric conditions.
Transient changes from the steady cruise condition are
achieved by manipulating the cockpit controls to move the
longitudinal controls (stabilizer, elevator, canard, or canardvator) or
the lateral-directional controls (aileron, spoiler, differential stabilizer,
or rudder). The deflection of the longitudinal control surface causes
a change in the attitude, angle of attack, and airspeed of the aircraft.
In routine flight, the pilot will change both thrust and longitudinal
control surface position to attain a new steady flight path. Lateral-
directional control is normally achieved by using the lateral-
directional control surfaces to produce a bank angle that will result
in a turn or change in the direction of the flight heading.
An inability to reposition the control surfaces severely restricts
the pilot's control over such flight path and heading changes by
eliminating the essential means of changing the normal force balance.
Flight control systems are one of the most crucial systems on an
aircraft.
13
Current generation aircraft rely on multiple, independent flight
control systems so that any single failure of an aircraft component
will not disable more than one system, thus leaving the aircraft with
satisfactory flight control capability. Despite these design objectives,
failures have occurred where aerodynamic control surface
effectiveness has been significantly impaired or completely lost. This
can result from impairment and failures in the electrical, hydraulic,
and hardware systems. Such problems can be the result of internal
aircraft system failures (due to engine failure, fatigue, corrosion,
improperly executed repairs, or terrorist damage) or external
damage (due to bird strikes, mid-air collision, or tactical battle
damage). In such cases, throttles can be used as the primary means
of controlling the aircraft. Several examples will be described in the
following section.
2.2. AIRCRAFT INCIDENTS WITH SIGNIFICANT FLIGHT CONTROL
FAILURES
The DC-10 accident in Sioux City, Iowa, was not an isolated
incident regarding the loss of the flight control system. Significant
flight control failures have been documented in at least five other
recent incidents. These incidents are described in detail in the
following sub sections.
14
2.2. I. Douglas DC- I0 American Airlines Incident 20
On June 12, 1972, American Airlines Flight 96 took off for
Buffalo from Detroit with 57 passengers and I0 crew members on
board. Approximately 10 minutes into the flight, the aft left cargo
door separated from the aircraft, causing cargo compartment
decompression.
When the door separated, a section of the aft coach lounge floor
6 - 8 feet square on the left side of the cabin broke loose from the
support frames and dropped part way into the cargo bay. Part of the
right side floor buckled to a lesser degree. There were no passengers
seated there.
The only sign of an abnormal condition initially was a swirl of
dust and debris in the cockpit and in the cabin, the pilot reported.
Then the aircraft entered a slight right yaw as a result of the
severing of several control cables when the aft cabin floor buckled.
The control cables which were severed were the rudder control
cables, except for those controlling the rudder trim system, the left
elevator control and stabilizer trim, and the power control and fuel
shutoff cables for the tail-mounted engine.
Both sections of the rudder and the left elevator went into trail
position and the tail engine went to idle power. The pilot reported
no unusual attitude changes except for a slight right yaw. There
were no significant difficulties in controlling the aircraft during
flight. Ailerons alone appeared to provide enough directional control.
Controlling the aircraft after touchdown was more difficult.
The flight crew used spoilers and differential reverse thrust on the
15
two wing-mounted engines to steer and stop the aircraft. Minor
injuries were suffered by nine passengers in the escape chute
evacuation of the aircraft on the ground, but none were hospitalized.
2.2.2. Douglas DC- I0 Turkish Airlines Accident 21,22
A Turkish Airlines DC-10 took off from Paris to London with
335 passengers and II crew members aboard on March 3, 1974.
Approximately 9 minutes after takeoff, the aft left cargo door
separated while the aircraft was at 12,000 feet and cruising at 300
knots. Cabin depressurization followed separation of the door.
The aircraft went into a pronounced nose-down attitude, power
was reduced, and a roll to the left began. Accident investigators
determined that the DC-10 hit the ground at 420 knots and with the
left wing down. A swath more than 3,000 feet long had been cut
through the forest where the aircraft struck. The aircraft literally
disintegrated as it plowed through the trees, killing all on board.
It was assumed that when the cabin depressurized, the cabin
floor buckled, severing the hydraulic lines and control cables in a
manner similar to that of the American Airlines incident in 1972.
When the hydraulic lines were severed, the hydraulic-powered flight
control systems were rendered inoperative.
2.2.3. Lockheed C-SA USAF Accident 23,24
April 4, 1975, a USAF/C-5A took off from an airfield in Viet
Nam with 178 persons, mostly Vietnamese orphans, aboard. The
16
aircraft was passing through 23,000 feet and was about 5 miles
offshore en route to Clark air base in the Philippines when the rear
pressure bulkhead, which is part of the cargo-loading ramp, failed.
This failure caused the complete loss of the primary and secondary
hydraulic systems, loss of cabin pressurization, and secondary
damage to the aft fuselage.
Loss of both the hydraulic systems caused the crew to lose
rudder, elevator, and flap control. The aircraft remained roughly in
trim and was maneuvered using ailerons and throttle controls. The
crew commented on the difficulty in achieving precise control due to
the slow response of the engines. They practiced using this control
mode for 30 minutes, made a practice landing at I0,000 feet, then
tried an approach to the runway.
About 7 miles from the airport at 5,000 feet and aligned with
the runway, the crew lowered the landing gear and at about the
same time the aircraft's rate of descent increased excessively. The
aircraft hit very hard about 1.5 miles short of the runway, broke up,
and was destroyed by fire. There were no survivors.
2.2.4. Lockhee_I L- | 011 Delta Airlines Incident 25
Near midnight, April 12, 1977, Delta Airlines Flight 1080
prepared to depart San Diego for a flight to Los Angeles. During taxi
out, a flight control check of the stabilizer, ailerons, and spoilers was
made. The proper response was verified by the surface position
indicators and by the normal 'feel' of the wheel.
17
During takeoff acceleration, the L-I011 lifted off with little or
no control input and a zero stick force. Immediately after liftoff, an
abrupt nose-high excursion in pitch and a roll to the left was
experienced that was controllable, although the pilot did hit the full
forward limit of the control column during the abrupt pitch-up.
At an altitude of approximately 400 feet and an airspeed of
170 knots, the pitch exceeded 18 degrees. The aircraft was trimmed
with full nose-down stabilizer trim, but no change in the pitch
attitude was observed. The aircraft continued to pitch up and climb
as the airspeed decayed. In addition, the pilot continually fought a
tendency of the aircraft to maintain a left-bank attitude.
Pitch attitude exceeded 22 degrees and the airspeed fell to 138
knots when the pilot felt that loss of the aircraft due to stall was
eminent. If pitch could be reduced, airspeed would be regained and
some degree of controllability might be obtained.
The pilot abruptly reduced thrust on all three engines and
recognized a change in control 'feel'. The airspeed increased as the
pitch angle dropped. Increased thrust on the left engine was
implemented to compensate for the left-roll tendency. One inch of
control stick movement was'now available to the pilot.
The L-I011 was controlled during flight by using the throttles
as the primary flight control system. The approach was set up and a
successful landing was made. Upon touchdown, the pilot found that
the nose did not come down even with the control column full-
forward. It was necessary to apply main-wheel braking to force the
nose wheel down.
18
Upon examination of the aircraft, the malfunction was
determined to be the left elevator jammed in a 19 degree nose-up
attitude. Presumably the left elevator aft drive quadrant and drive
cable failed during the flight control check prior to takeoff. There is
no cockpit indication for this type of failure on the L- I01 i.
2.2.5. Boeing 747 Japan Airlines Accident 26,27,28,29,30,31
August 12, 1985, Japan Airlines Flight 123 took off from
Tokyo's Haneda Airport bound for Osaka. At an altitude of 24,000
feet, an impact force occurred which raised the nose of the 747
aircraft. Immediately after the impact force, hydraulic pressure
dropped and rudders, ailerons, elevators, and yaw dampers became
inoperative. Significant altitude and speed changes and roll
oscillations occurred. The aircraft rolled +/-40 degrees and altitude
and speed changed by +/-1,500 feet and +/-25 knots, respectively.
The flight crew attempted to fly the aircraft using only throttle
controls for approximately 30 minutes. The pilot radioed that he was
unable to control the aircraft immediately before the aircraft crashed
into a mountainside 51 miles from Tokyo. The 747 had 520
passengers aboard. There were only 4 survivors.
Upon examination of the wreckage, it was believed that the
impact force was a ruptured aft bulkhead. When the bulkhead
ruptured, the rudders, part of the vertical stabilizer, and most of the
tail cone separated from the fuselage while the aircraft was in flight.
All four hydraulic lines, which run into the tail cone, were severed
19
when the tail cone separated, rendering all control surfaces
inoperable.
2.3 PRINCIPLES OF ENGINES-ONLY CONTROL
The aircraft incidents described in Section 2.2 all experienced
partial or total flight control system failure and all exhibited an
ability to use engine thrust for emergency control. Engine thrust can
be used to control the heading and flight path of a multi-engine
airplane. This section presents the principles of engine-only flight
control.
2.3. I. yaw-Roll Control 7,18,32,33
Differential thrust, a difference in thrust between the engines
on the right side of the fuselage and the left side of the fuselage,
generates sideslip. Through the normal dihedral effect present on
most airplanes, this results in roll. Roll from differential thrust is
controlled to establish a bank angle, which results in a turn and a
change in aircraft heading.
Some aircraft will exhibit a coupled mode between roll and
yaw called dutch roll. The dutch roll mode consists of a lightly
damped, moderately low frequency oscillation. An example of what
a complete three-degrees-of-freedom dutch roll motion looks like to
an outside observer is shown in Figure 2.1.
20
Controlling dutch roll using throttles alone can cause roll and
heading control difficulties for the pilot. The dutch roll frequency
during low altitude cruise flight for a Boeing 747 aircraft is 1.05
radians/second. The control system time delay in response to
throttles is approximately one second. During that one second, the
747 has completed 1.05 radians, or 60 degrees, of the dutch roll
cycle. Therefore, there is a 60 degree phase lag that the pilot must
attempt to anticipate. The F-15 fighter aircraft, during low altitude
slow flight, has an even larger 112 degree phase lag in the dutch roll.
2.3.2. Fitch Control 7,18
Pitch control caused by throttle Changes is more complex. The
desired result is to stabilize and control the vertical flight path.
There are several effects that may be present which are described in
the following subsections. One of these effects may dominate,
depending on the aircraft characteristics and flight conditions.
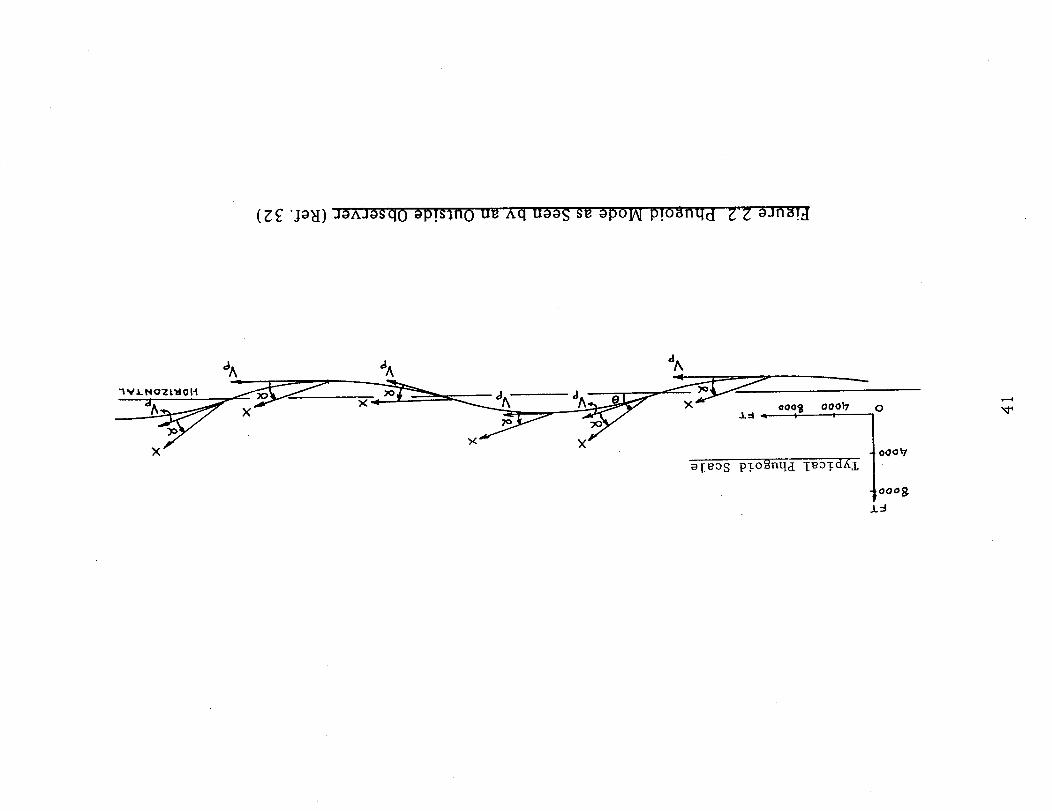
2.3.2. I. Phu_ojd Oscillations 1,7,18,32
The airplane will continuously seek the airspeed and flight
path angle at which the forces balance for the existing longitudinal
control surface position and the existing thrust level. This produces
an approximately constant angle of attack motion in which kinetic
and potential energies (airspeed and altitude) are traded. This
longitudinal oscillation is called the phugoid mode. An example of
21
what the phugoid motion looks like to an outside observer is shown
in Figure 2.2.
The phugoid produces a long period of pitch oscillation and will
produce speed variations about the trim speed. If the speed varies
from the trim speed, the airplane will change pitch and either climb
or descend to recover to the trim speed. For example, if the speed
falls below the trim speed while the airplane is in level flight, the lift
produced by the wing is not sufficient to maintain altitude. The
airplane will start to descend and pick up speed. Normally, the
airspeed will increase beyond the trim speed and the airplane lift
will become greater than required, resulting in an increase in vertical
velocity and subsequent climb. During the climb, the airspeed will
fall toward the trim speed and the cycle continues.
The time to complete one oscillation is called the period of the
phugoid. The period of the phugoid is directly proportional to the
forward velocity and is typically about one minute for large jet
transports, but may be as long as several minutes for some airplanes.
The period is a function primarily of speed and not of aircraft design.
Whenever elevator control is present, the phugoid is easily
damped and is not noticeable to the pilot. In a situation involving
control surface failure, however, the control surfaces are 'frozen' at
the time of failure and, therefore, the trim speed is set. Phugoid
damping becomes a critical factor during approach and landing. A
landing which occurs on the down slope of the phugoid sinusoidal
curve will have an extremely high rate of descent.
Properly sized and timed throttle inputs to control pitch can be
used to damp unwanted phugoid oscillations, but the phugoid is
22
difficult to damp with changes in thrust alone without prior
experience flying throttles-only flight control. One reason for this
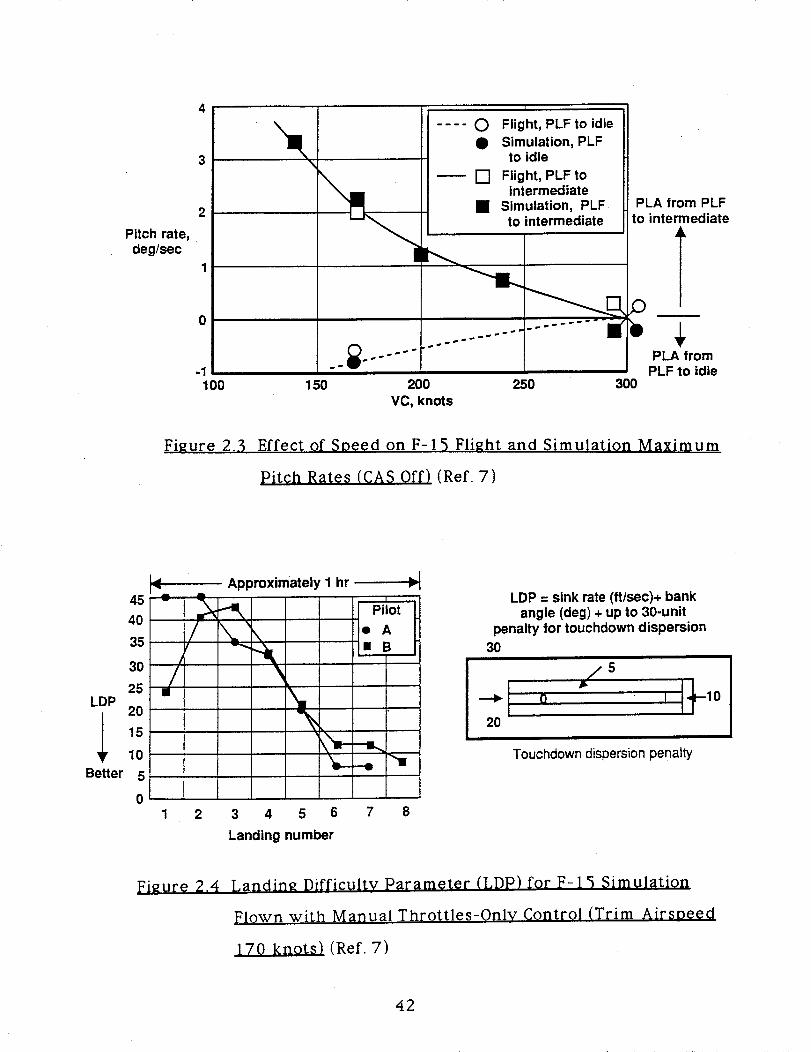
difficulty is that pitch rate, shown in Figure 2.3, is a function of both
speed and of whether the throttles are being commanded to go from
high thrust to lower thrust, or from low thrust to higher thrust. The
low pitch-down capability relative to the pitch-up capability is
because the throttle setting for power for level flight (PLF) is much
closer to idle than to intermediate.
Techniques for finding the proper degree of throttle input to
make a survivable landing were learned after approximately five
landings for the F-15 fighter, as can be seen in Figure 2.4. These
techniques will vary depending on the aircraft, engine response for a
transport being different from that of a fighter.
2.3.2.2. Fli_ht Path An_le Chan_e Resultin_ from Speed
Stability7,18
Most airplanes exhibit positive speed stability. An increase in
thrust will create a speed increase which, in turn, causes an increase
in lift. This produces an increase in the flight path angle. The flight
path angle will increase for about I0 seconds. During this time, the
airplane climbs, the airspeed will fall toward the trim speed, and
phugoid oscillations will be initiated. The degree of speed stability is
affected by aircraft configuration and the center of gravity (c.g.)
location.
23
2.3.2.3. Pitching Moment Resulting from Thrust Line Offset 7,18
If the engine thrust line does not pass through the c.g., there
w.ill be a pitching moment introduced by thrust change. For many
transport aircraft, the thrust line is below the c.g. Increasing thrust
results in a nose-up pitching moment, with the magnitude being a
linear function of the thrust change. This is the desirable geometry
for throttles-only control, because a thrust change immediately starts
the nose in the same direction needed for the long-term flight path
angle change. High-mounted engines result in this effect fighting the
speed stability effects. The pitching moment caused by the thrust
will cause a change in the trimmed angle of attack and airspeed as
well as changing the long-term flight path angle.
2.3.2.4. Fli_ht Path Angle Chan_e Resultin_ from the Vertical
Component of Thrust7,18
If the thrust line is inclined to the flight path, an increase in
thrust will cause a direct increase in vertical velocity, that is, rate of
climb. For a given aircraft configuration, this effect will increase as
angle of attack increases.
• 2.3.3. Speed Control 7,18
Once the flight control surfaces become locked at a given
position, the trim airspeed of most airplanes is affected only slightly
by engine thrust. Retrimming to a different speed may be achieved
24
by other techniques. These techniques include moving the c.g.,
lowering the flaps and landing gear, and by using stabilizer trim, if
available. In general, the speed will need to be reduced to an
acceptable landing speed, implying the need to develop nose-up
pitching moments. Methods for accomplishing this include moving
the c.g. aft and selective lowering of flaps. In aircraft with more than
two engines, speed can be reduced by increasing the thrust of low-
mounted engines. The retrimming capability varies widely between
airplanes.
2.3.4. Thrust Response 7, 18
Most turbine engines respond faster at higher thrust levels
than at lower thrust levels. High-bypass turbofans are particularly
slow to respond at flight idle. A high-bypass ratio engine takes as
long as three seconds to go from flight idle to 30 percent thrust, then
three more seconds to go from 30 to I00 percent thrust. Turbojet
and low-bypass ratio turbofan engines typical of fighter airplanes
and older transports are faster in response, in some cases as fast as
2.5 seconds from idle to full'thrust.
2.3.5. Effects of Speed on Propulsive Control Power 7, 18
For turbine-powered airplanes, engine thrust is not a strong
function of airspeed. However, the stabilizing effects of vertical and
horizontal stabilizers are a function of dynamic pressure, which is
25
proportional to the square of the airspeed. Consequently, the
propulsion system control power increases as airspeed decreases.
For example, at high airspeed differential thrust develops a yawing
moment that is small compared to the restoring moment produced
by the vertical tail. Therefore, the sideslip is small and the roll rate
resulting from differential thrust is low. At low speed, the
differential thrust moment may be the same as at high speed. The
aerodynamic restoring moment will be much smaller and larger
sideslip will develop, producing higher roll rates. A similar effect
occurs in the pitch axis, where speed stability increases as speed
decreases.
2.4. HISTORICAL REVIEW 7,8,18
The NASA Dryden Flight Research Facility (NASA Dryden) at
Edwards AirForce Base, California, has been the site for conducting
preliminary flight, ground simulator, and analytical studies regarding
the use of throttles for emergency flight control of a multi-engine
aircraft. This investigation was begun by Frank W. Burcham, Jr.,
chief of NASA Dryden's propulsion and performance branch, as a
result of the relatively successful attempted landing of the United
Airlines DC-10 at Sioux City, Iowa, in July 1989. The objective has
been to determine the degree of control power available with the
throttles for various classes of airplanes and to investigate the
development of possible control modes for future airplanes.
26
Several airplanes, including a light twin-engine piston-powered
airplane, jet transports, and a high performance fighter were studied
during flight and piloted simulations. Simulation studies used the B-
720, B-727, MD-11, and F-15 aircraft. Flight studies used the Lear
24, Piper PA-30, and F-15 airplanes. Some physical characteristics of
these airplanes are given in Table 2.1.
2.4.1. Flight Research Studies
Some preliminary flight research studies were conducted on
three airplanes: the F-15, the Lear 24, and the PA-30 aircraft.
2.4.1.1. F-15 Air Superiority Fighter 7,18
The F-15 airplane (see Figure 2.5) is a high performance fighter
with a maximum speed of Mach 2.5. It has a high wing with 45
degrees of leading-edge sweep and twin vertical tails. It is powered
by two FI00 afterburning turbofan engines mounted close together
in the aft fuselage. The thrust=to-weight ratio is very high,
approaching one at low altitudes. The engine response is fast - 3
seconds from idle to intermediate power. The F-15 has a mechanical
flight control system augmented with a high-authority electronic
control augmentation system. Hydraulic power is required for all
flight control surfaces.
In flight tests using the NASA F-15 airplane, three pilots
evaluated the controllability of the F-15 airplane with throttles only,
leaving the stick and rudder centered. Using only manual throttle
27
control, pilots could roll the airplane, hold a bank angle, and hold an
assigned heading.
If the airplane was trimmed at 170 knots, adequate pitch
control was available to hold altitude within approximately 100 feet.
If a flight control failure occurred at higher speeds, some method
would be necessary to retrim the F-15 to lower speeds. Use of fuel
transfer to move the c.g. aft would be one way to develop nose-up
pitching moments, which would slow the F-15. The ramps of the
variable capture inlets are also useful in generating nose-up
moments. Extension of the landing gear results in almost no change
in speed on the F-15 airplane.
2.4.1.2. Lear 24 Executive let Transoort 7,18
The Lear 24 airplane (see Figure 2.6) is a twin-engine business
jet. The low-mounted wing has 13 degrees of sweep. The engines,
GE CJ610 turbojets with 2,900 pounds of thrust each, are mounted
high on the aft fuselage. The airplane has a T-tail arrangement.
Maximum weight is 11,800 pounds. The Lear 24 has a thrust-to-
weight ratio of approximately 0.5. The turbojet engines respond
rapidly to throttle changes, 2.5 seconds from idle to full thrust.
The airplane used in this evaluation was the Calspan variable
stability airplane. It is equipped with the basic Lear 24 mechanical
control system, including an electric stabilizer pitch trim capability.
In addition, there are hydraulic actuators that add electric inputs
from the variable stability system to the mechanical system.
28
The Lear 24 characteristics with throttles-only control were
investigated at a speed of approximately 200 knots. Roll control
power is quite large. The basic Lear 24 pitch control capability was
also investigated. In contrast to the roll axis, pitch control with
thrust was very difficult. Because of the high engine placement, a
thrust increase caused a nose-down pitch. Eventually, the speed
stability would bring the nose back up. The phugoid was very
difficult to damp with throttle inputs. Despite these difficulties, the
Lear 24 was flown for 20 minutes using only the throttles. Roll and
heading were controlled precisely and altitude was maintained
within 500 feet.
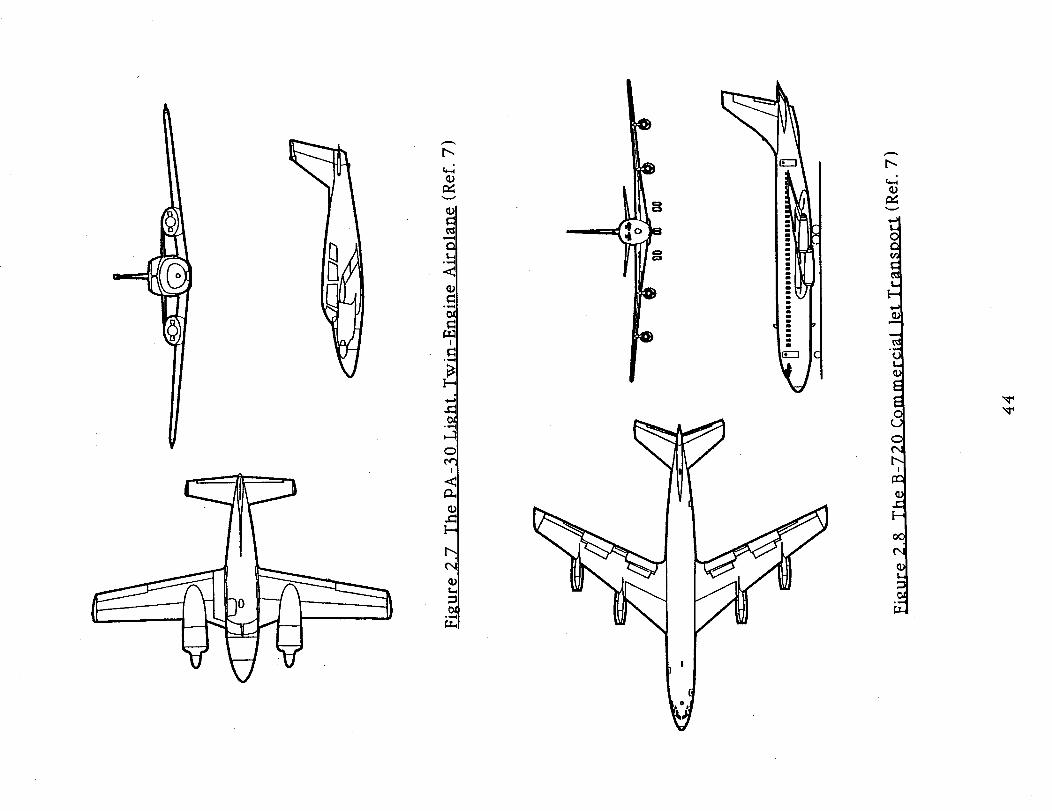
2.4.1.3. PA-30 Piston-powered Light Twin-Engine Plane 7,18
The Piper PA-30 airplane (see Figure 2.7) is a light, twin-
engine, four-place airplane. It has a low-mounted unswept wing,
and the engines are mounted ahead of the wing in nacelles.
Maximum weight is 3,600 pounds. The engines are the Lycoming I0-
320 model, rated at 160 horsepower each.
The PA-30 was flown with throttles only and it had significant
control power. The roll control on the PA-30 is highly nonlinear. It
appears that the major rolling moment is caused by reducing the
throttle on one side until the blowing over the wing is sharply
reduced. The linear response to differential thrust seen on other jet-
powered airplanes was not present. Pitch control is difficult. There
is adequate control power available from speed stability, but the
longitudinal phugoid is hard to damp. Overall, it was possible to
29
maintain gross control of heading and altitude, but landing on a
runway would be extremely difficult.
2.4.2. Simulator Studies
Piloted simulator studies of engines-only flight control
capability were conducted on the B-720, B-727, MD-I I, and the F-15
aircraft. One task evaluated was 'up-and-away' control. This is the
ability to control heading to within a few degrees, and to control
altitude to within +/- 200 feet. The other task was landing on a
runway.
2.4.2.1. B-720 Commercial |et Transport 7,18
The Boeing 720 airplane (see Figure 2.8) is a four-engine
transport designed in the late 1950's. It has a35 degree swept wing
mounted low on the fuselage, the four engines mounted on pods
below and ahead of the wing. The engines are Pratt and Whitney
JT3C-6 turbojets. The airplane is equipped with a conventional flight
control system incorporating control cables and hydraulic boost. It
also incorporates a slow-rate electric stabilizer trim system. The
flaps are electrically controlled.
The pilot of the B-720 simulation flew manually using the
throttles only. Good roll capability was evident. Good pitch
capability was also found, with some pitching moment caused by the
thrust line being below the c.g., and some pitching moment caused by
speed stability.
30
It was possible for a pilot to maintain gross control, hold
heading and altitude, and make a controlled descent. However, it
was extremely difficult for a pilot to make a landing on a runway.
There was a one second lag in pitch and roll before the airplane
began to respond to the throttles. Judging the phugoid damping was
difficult, and the lightly damped dutch roll was a major problem in
roll and heading control. Although a few pilots did develop
techniques for successful landings using manual throttles, most were
unable to make repeatable successful landings.
2.4.2.2. B-727 Commercial let Transport 7,18
The Boeing 727 three-engine transport (see Figure 2.9) has a
swept wing and a T-tail. The three Pratt and Whitney low-bypass
ratio turbofan engines are mounted in the aft fuselage. The two
outboard engines are mounted on short pylons, while the center
engine is located in the aft fuselage and has an inlet above the
fuselage. The engine response was slow from idle to an engine
pressure ratio of 1.2, then fast until full thrust was reached.
Pitch control power was evaluated. There is significant
pitching authority with thrust on the B-727. The roll capability,
while much less than the F-15 or B-720 airplanes, was surprisingly
large considering the fuselage-mounting of the engines.
The airplane was flown using differential engine thrust for
bank angle and electric stabilizer trim in pitch, and gross control was
possible. Precise control of the flight path angle using throttles was
more difficult, however. Landings were attempted using differential
31
throttle and electric trim. Neither of the evaluation pilots could
successfully land the airplane on the runway by themselves. The
low roll rate and roll control lag made it nearly impossible to remain
lined up with the runway.
Improved roll control was achieved by reducing the center
engine throttle to idle; the higher thrust and the faster thrust
response of the outboard engines improved directional control.
Splitting the control task between two pilots also helped. One pilot
would fly pitch with electric trim, while the other pilot used
differential throttles for roll and heading control. Even with this
technique, it was not possible to make consistent landings on the
runway.
2.4.2.3. F-15 Air Superiority Fighter 7,18
A simulator study was performed on the NASA F-15 airplane.
It was flown in a simulator cockpit with actual F-15 stick and
throttles. A visual scene, including the Edwards dry lake bed
runways, was provided on a video monitor.
The piloted F-15 simu'lation was used in a landing study. The
pilots used throttles-only control to fly approaches and landings
using the video display of the 15,000 foot-long Edwards Runway 22.
During the initial landing attempts, control was extremely difficult.
The phugoid mode was excited close to the ground and was a
constant problem throughout touchdown. Throttle inputs to damp
the phugoid were hard to judge. Roll control, while adequate in rate,
had a troublesome one second lag. Most landings had such a high
32
sink rate that they were categorized in the 'certain damage' category;
many were not survivable landings.
2.4.2.4. MD-I I Commercial let Transport 7,18,34
The MD-11 airplane (see Figure 2.10) is a large, long-range
commercial transport. It has a 35 degree sweep, low-mounted wing.
It is powered by three high-bypass turbofan engines, two mounted
in underwing pods and the third mounted in the base of the vertical
tail. The engines are slow to respond at low thrust levels, but
respond well above 30 percent thrust.
Initial simulator results showed that up-and-away flight was
possible -altitude could be maintained and heading could be held
within reasonable limits. The low roll rate of the MD-II made
runway lineup very difficult, however, when landings were
attempted in the simulator. While itwas possible to come close to
the runway, it was not possible to make repeatable controlled
landings on the runway.
Later MD-II simulator results with higher fidelity models
showed that roll rates were higher than previously thought and that,
with practice, manual landings were possible. These results were
substantiated with flight data.
2.4.3. Overall FIyin_ Oualities 7,18
Based on simulator and flight results, all the airplanes
exhibited some control capability with throttles. All airplanes could
33
be controlled in a gross manner (heading and altitude could be
maintained) although pilot workload was very high. Because of the
phugoid characteristics and the lag associated with the engine thrust
response, it was very difficult to achieve precise control with manual
throttle control. Landings using manual throttles-only control were
extremely difficult; landing at a predetermined point and airspeed
on a runway was a highly random event.
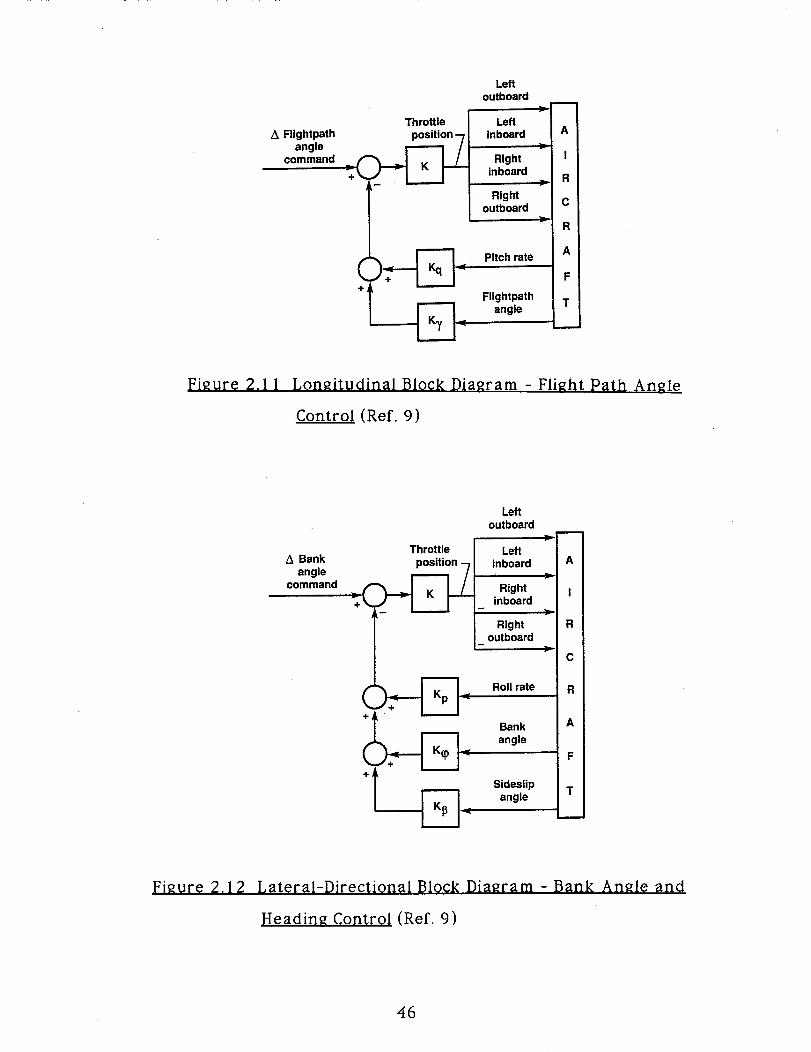
2.4.3.1. Augmented Control System7, 9,18
An augmented control system was developed by Glenn B.
Gilyard and Joseph L. Conley, both engineers at NASA Dryden, for the
B-720 simulation. The control mode uses.pilot stick inputs, with
appropriate gains and feedback parameters, to drive the throttles.
In the pitch axis, a flight path angle command loop was
implemented. The command is designed to act through the forward
and aft motion of the stick and have a command capability of +/-I0
degrees of flight path angle. In addition to flight path angle
feedback, pitch rate is also fed back to augment the damping (see
Figure 2.11 ).
The control for the roll axis was mechanized using differential
throttle to command yaw, and hence, through dihedral effect, roll.
Bank angle was commanded by lateral stick position. The damping
of the augmented dutch roll mode is very light despite roll rate and
sideslip feedback (see Figure 2.12). However, the mean bank angle
holds well if care is taken not to excite the dutch roll. A study of
lateral stick commanding only differential throttle (without any
34
feedback) was also conducted. The dutch roll damping problem was
significantly reduced. However, there was a spiral instability to
manually control.
Using the augmented control mode, it was possible for a pilot to
make successful landings. Pilot proficiency improved rapidly with
time, as the lead time required to compensate for slow engine
response was learned. Landings without turbulence or with light
turbulence were generally good. With moderate turbulence, pilot
ratings degraded, but most landings were still successful.
The augmented mode developed for the B-720 airplane was
incorporated into the F-15 simulator. Gain changes were made to
account for the differences in throttle range and thrust, but the basic
control concept remained the same. All the roll feedback gains were
set to zero, making the lateral stick command differential thrust
directly.
Performance of the F-15 in the augmented mode was greatly
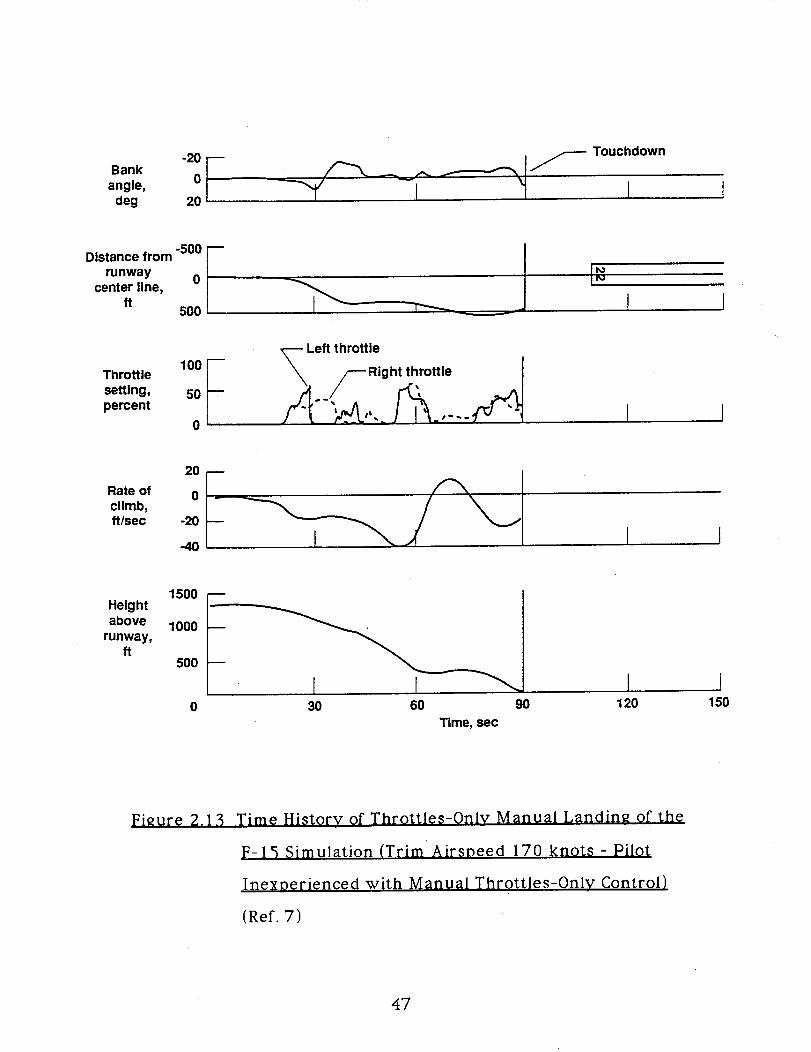
improved. Figure 2.13 demonstrates the time history of athrottles-
only manual landing of the F-15 simulation. As can be seen from the
figure, the pilot landed well short and to the right of the runway
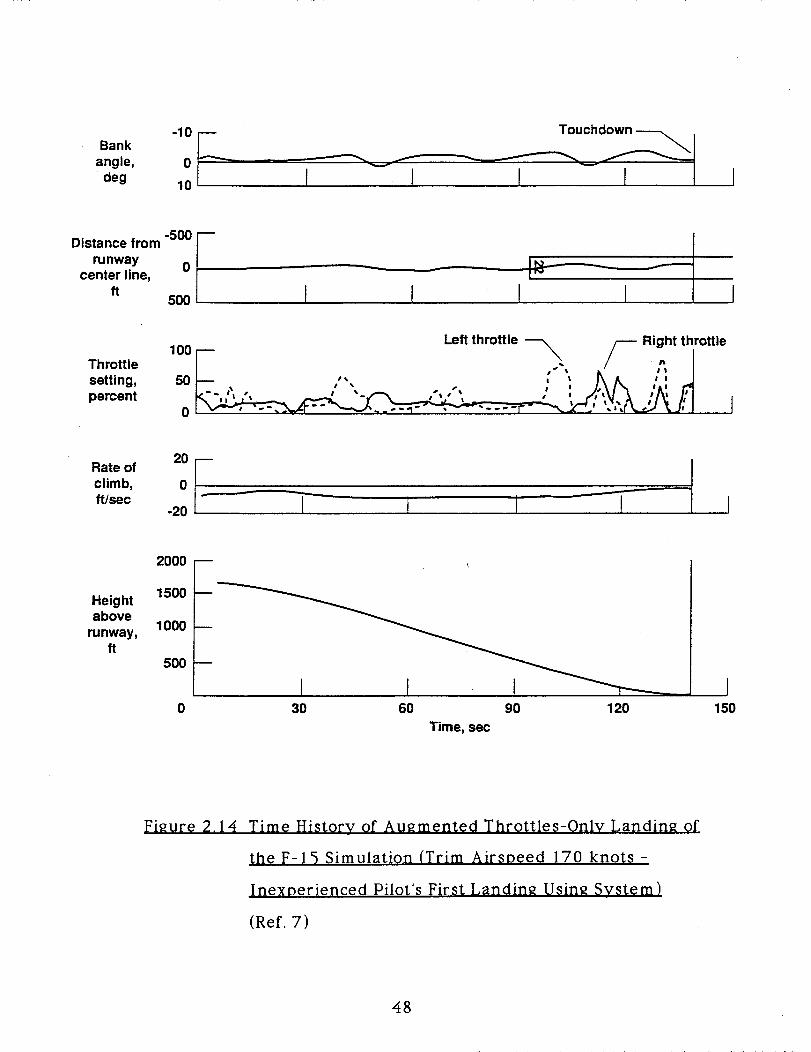
with a rate of sink of 20 feet per second. Figure 2.14 demonstrates
the time history of an augmented throttles-only landing of the F-15
simulation. The rate of sink was well-controlled and the landing was
on the center line of the runway.
As further testing was done on evaluating pilot performance
while flying the augmented mode simulation, suggestions were made
by some of the pilots to develop thumbwheel controllers to command
bank angle and pitch attitude directly. The augmented mode aircraft
35
performance was sluggish and slow to respond compared with the
baseline unaffected aircraft which the pilots were used to flying.
Several pilots had some difficulty in flying the augmented mode with
the control stick due to overcompensation and pilot induced
oscillation (PIO) tendencies.
Currently, both methods of flying the augmented mode are
available in the simulator. The advantage of the control stick is that
it enables the pilot to control the disabled aircraft with conventional
control methods (moving the stick forward and aft to control pitch
and from side to side to control roll). The advantages of the
thumbwheel are:
• reminds the pilot that the system is a slow-response, low-
authority system
• good resolution (incremental commands are easily attained)
• the pilot is not required to hold the thumbwheel to maintain
command (thumbwheels remain Where set)
• separate thumbwheels for pitch and roll control (the control
stick has virtually no pitch/roll isolation) and
• similar controls are used in transport aircraft to command
the autopilot.
Further evaluation of pilot preference and performance is currently
being researched.
The augmented control provided two important improvements
over manual throttles-only control. First, the augmented control
system used conventional flight control effectors such as a stick or
autopilot pitch and bank angle control knobs, rather than the
throttles. Second, feedback of key pitch and roll parameters was
36
provided to stabilize the flight path. In the pitch axis, flight path
angle and pitch rate feedback are provided. The pitch rate feedback
provides phugoid damping. In the roll axis, bank angle feedback was
used for roll control.
By using the augmented system, precise control capability was
greatly enhanced. The augmented modes effectively damped the
phugoid and improved the roll characteristics. With the augmented
system, it was possible to make repeatable landings on a runway and
inexperienced pilots were able to make good landings on their first
tries as was seen in Figure 2.14. Based on simulation results, it
appears that the augmented control system makes runway landings
practical using throttles-only control.
2.5. CURRENT RESEARCH 19,35,36
Douglas Aircraft Company (DAC), in conjunction with NASA
Dryden, is currently performing an evaluation of the augmented
throttles-only control concept for the MD-11 on their MD-11 Flight
Deck Simulator. In addition to the simulator studies, manual
throttles=only control was flown on an actual MD-I I aircraft in
September 1992. Although no throttles-only landings were
attempted, an approach was made within 70 feet above the runway.
The preliminary evaluation by both DAC and NASA pilots is that the
results are "very promising".
In addition to the work being done on the MD-II, an
augmented propulsion controlled aircraft (PCA) system has been
37
designed for the NASA F-15. On February 5, 1993, the F-15 was
flown within I 0 feet above the runway under PCA control. Sink rate
was well within acceptable limits and bank angle was less than one
degree. There have been nine PCA flights to date with additional
flights planned for March 1993. The F-15 has been flown in PCA
mode at different fuel weights, different speeds, and different
attitudes. These flight data are currently being analyzed before the
next flights in March. On the basis of on initial flight test results, an
augmented throttles=only control system shows promise of making
repeatable runway landings of the F-15 practical.
38
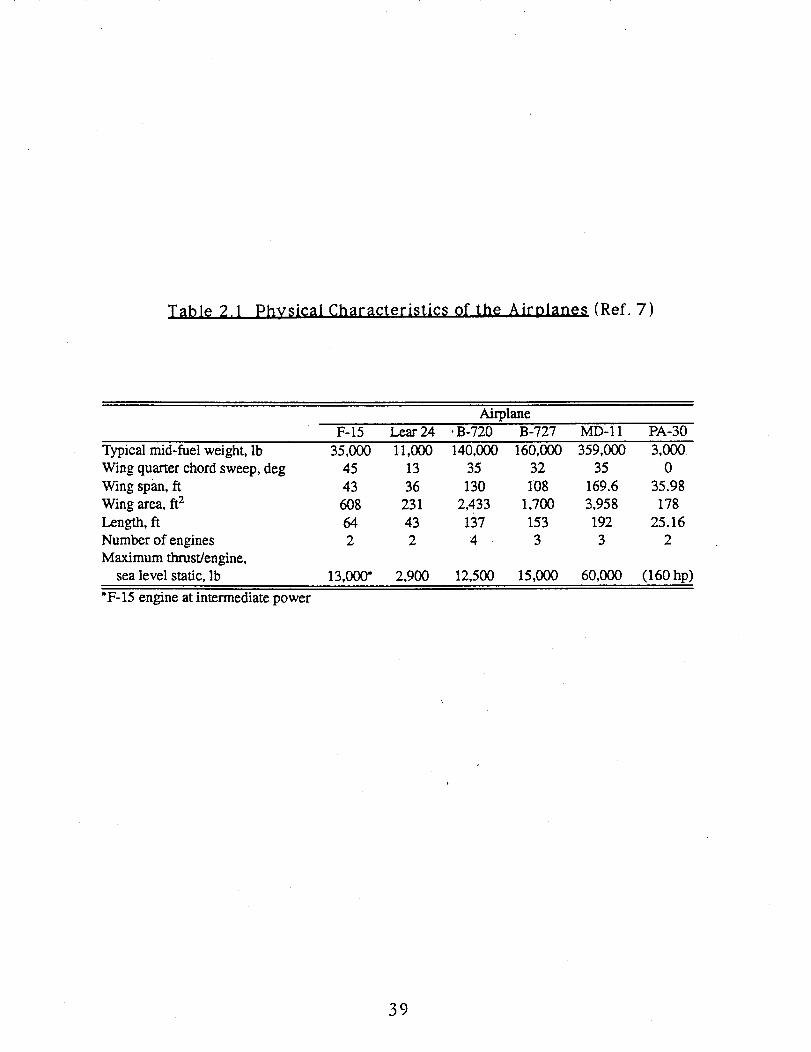
Table 2.1 Physical Characteristics of the Airolanes (Ref. 7)
AirplaneF-15 Lear 24 . B-720 B-727 MD-11 PA-30
Typical mid-fuel weight, lb 35,000 11,000 140,000 160,000 359,000 3,000
Wing quarter chord sweep, deg 45 13 35 32 35 0
Wing span, ft 43 36 130 108 169.6 35.98
Wing area, ft 2 608 231 2,433 1,700 3,958 178
Length, ft 64 43 137 153 192 25.16
Number of engines 2 2 4 3 3 2
Maximum thrust/engine,
sea level static, lb 13,000* 2,900 12,500 15,000 60,000 (160 hp)
*F- 15 engine at intermediate power
39
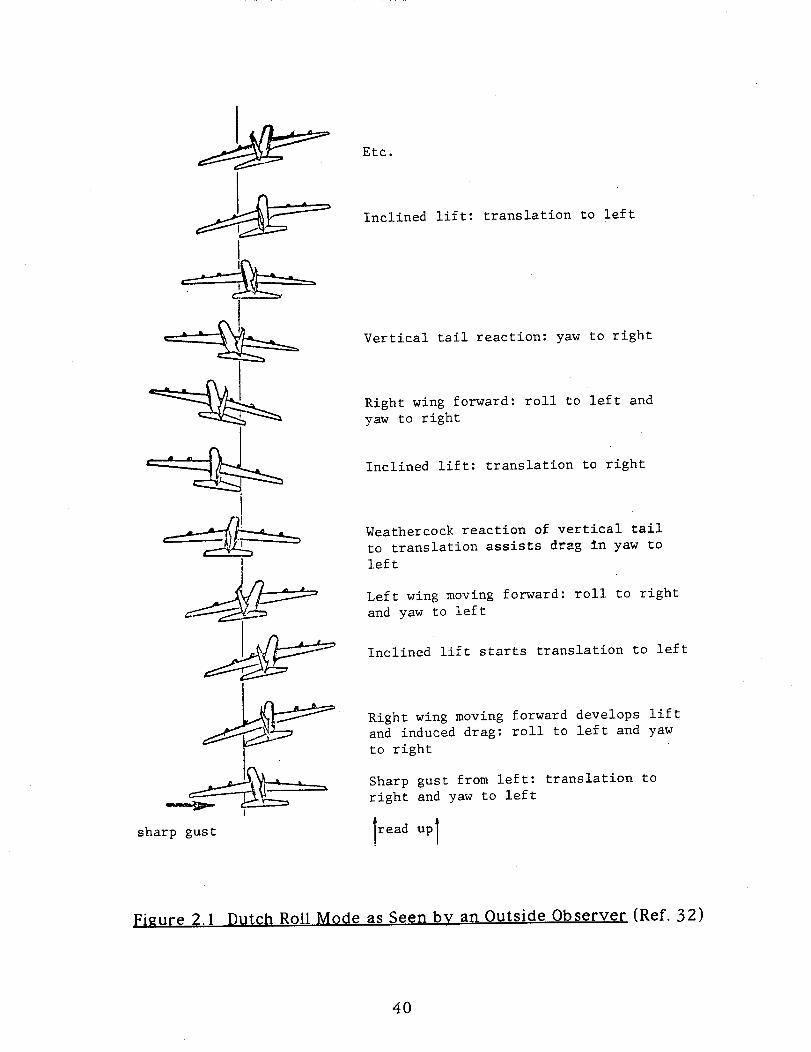
Etc.
Inclined lift: translation to left
Vertical tail reaction: yaw to right
Right wing forward: roll to left and
yaw to right
Inclined lift: translation to right
Weathercock reaction of vertical tail
to translation assists drag in yaw to
left
Left wing moving forward: roll to right
and yaw to left
Inclined lift starts translation to left
Right wing moving forward develops lift
and induced drag: roll to left and yaw
to right
Sharp gust from left: translation to
right and yaw to left
sharp gust !read uP I
Figure 2.1 Dutch Roll Mode as Seen by an Outside Observer (Ref. 32)
40
(E[ "JAN) JOAJOSqoap!slno us Xq uaas se apolAI p!osnqd g'g aJns!_t
X
aleoS pTo_nq_ leoTdk,T,
o
ooo_7
Pitch rate,deg/sec
4
3
2
C) Flight, PLF to idle
• Simulation, PLFto idle
[] Flight, PLFtointermediate
• Simulation, PLFto intermediate
-1100 150 200 250 300
VC, knots
PLA from PLFto intermediate
TPLA from
PLF to idle
Figure 2.3 Effect of Speed on F-15 Fli_ht and Simulation Maximum
Pitch Rates (CAS Off) (Ref. 7)
LDP
Better
L. Approximately I hr
40
35 .._
_o/25
20
15
10
I
Pilot
• A• B
1 2 3 4 5 6 7 8
Landing number
LDP = sink rate (ft/sec)+ bankangle (deg) + up to 30-unit
penalty for touchdown dispersion3O
<' I-'t o " ' -1°2O
Touchdown dispersion penalty
Figure 2.4 Landin_ Difficult v Parameter (LDP) for F-15 Simulation
Flown with Manual Throttles-0niY Control (Trim Airspeed
170 knots) (Ref. 7)
42
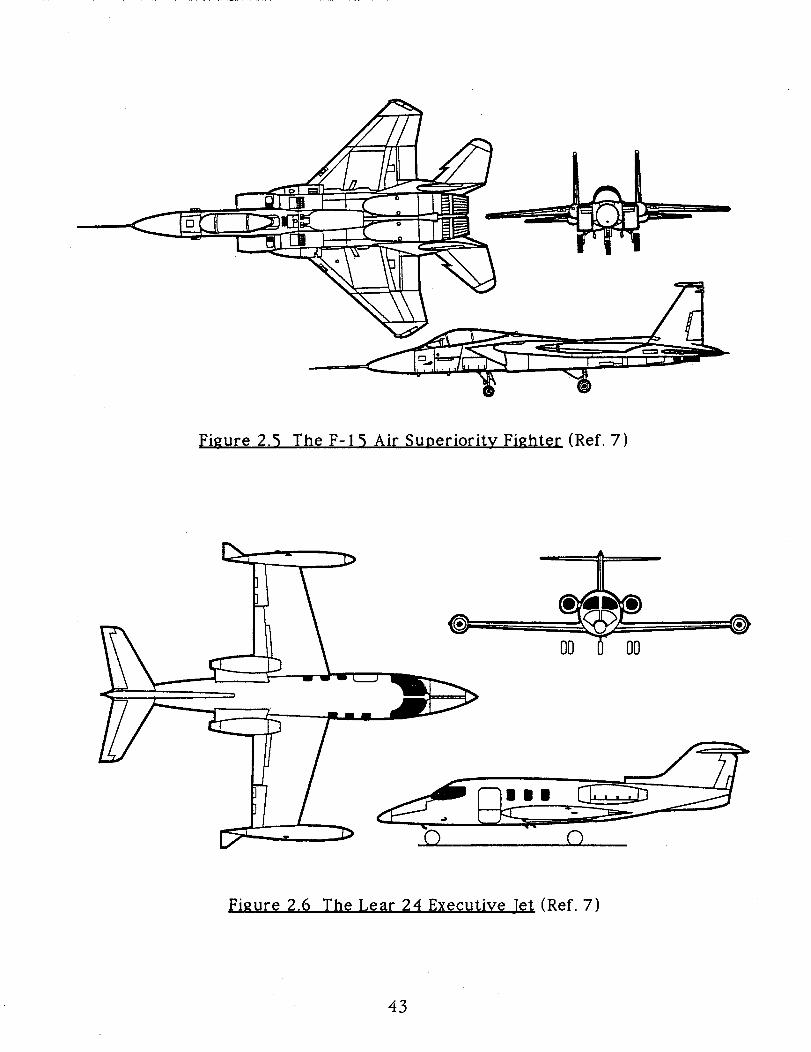
Figure 2.5 The F-15 Air Suoerioritv Fighter (Ref. 7)
© ©
Figure 2.6 The Lear 24 Executive Jet (Ref. 7)
43
t_
c_
or_
I--
tJ
Q;
EE
C
I--
o_
c_
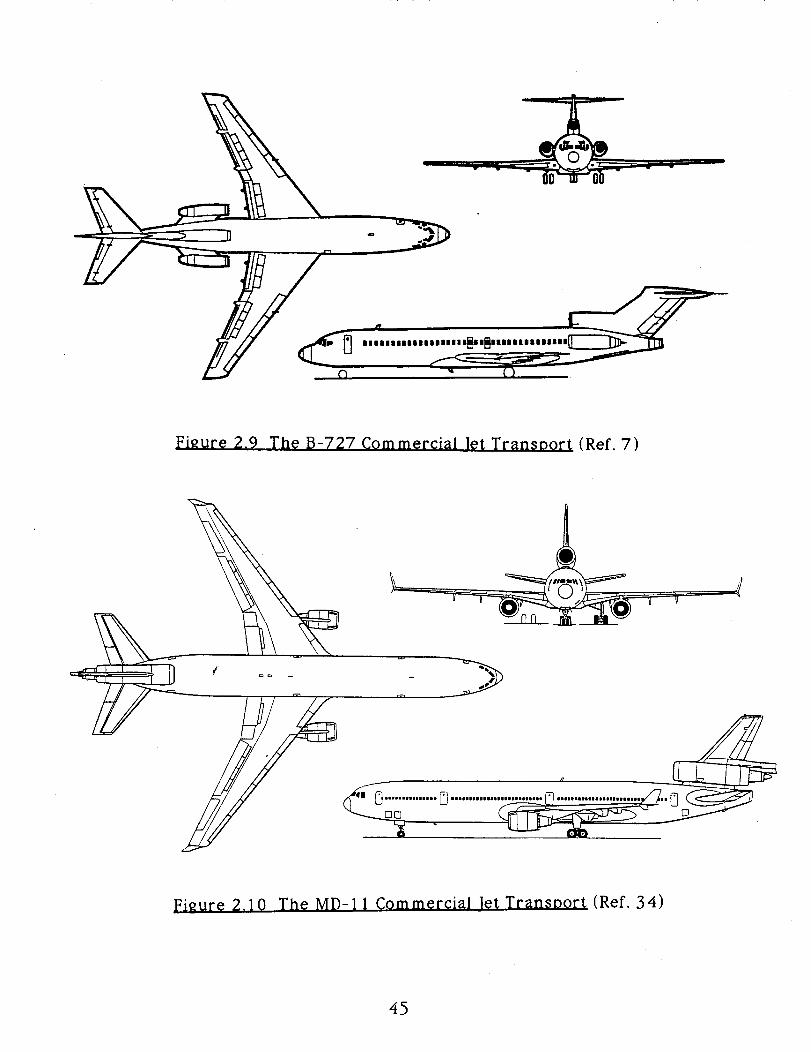
Figure 2.9 The B-727 Commercial Jet Transoor( (Ref. 7)
Figure 2.10 TheMD-11 Commercial JetTransDort(Ref. 34)
45
Throttle
A Flightpathanglecommand +m
Leftoutboard
Leftinboard
Rightinboard
Rightoutboard
Pitch rate
Flightpathangle
I
A_
I
R
Cl
R
A
F
T
Figure 2.11 Longitudinal Block Diagram - Flight Path Angle
Control (Ref. 9)
Throttle
A Bank
angle
command _ f
T D-
Leftoutboard
Leftinboard A I
Right I Iinboard
m
Right R Ioutboard
Cl
Roll rate R I
Bank A I
angle
F I
Sideslip T Iangle
• - " ectional Block Diagram - Bank An_le and
Heading Control (Ref. 9)
46
Bank -20 _--angle, 0
deg 20
Distance from -500 F-
runway 0 |center line,
ft 500
Throttle 100setting, 50percent
0
Left throttle
°"/[/_Right_thr°ttle _) I
Rate of
climb,ft/sec ,o°f-20
-40) I
Heightabove
runway,ft
1500
1000
5O0
0 30 60 90
Time, sec
I f120 150
Figure 2.13 Time Historv of Throttles-Onlv Manual Landin_ of the
F-15 Simulation (Trim Airspeed 170 knots - Pilot
Inexperienced with Manual Throttles-Onlv Control)
(Ref. 7)
47
Bankangle,deg
-10 Touchdown
0 -_o I I I W I
Distance from
runwaycenter line,
ft5O I I I
Throttlesetting,percent
Left throttle _X /--- Right throttle
50 '" ' _ ' 'I • • I I I I
o_j_",;'" , ,. ,-,,, , , , ,
Rate of 20 F-
climb, 0 I_.____.Jsec I ) I I-20
2000 i
Height 1500above
runway, 1000ft
50O
0 30 60 90 120
Time, sec
I150
Figure 2.14 Time Historv of Augmented Throttles-Onlv Landin_ of
the F-15 Simulation (Trim Airspeed 170 knots -
Inexperienced Pilot's F_rst Landin_ Usin_ System)
(Ref. 7)
48
CHAPTER 3
OUTLINE OF PROPOSED WORK
3. i. INTRODUCTION 7,17,19,32,35,36,37
In the absence of control power due to primary control system
failure, control power generated by selective application of engine
thrust has proven to be a viable alternative. NASA Dryden has
demonstrated the feasibility of controlling an aircraft during level
flight, approach, and landing conditions using an augmented
throttles-only control system. This system has been successfully
flown in the flight test simulator for the B-720 passenger transport
and the F-15 air superiority fighter and in actual flight tests for the
F- 15 aircraft.
The Douglas Aircraft Company is developing a similar system
for the MD-II aircraft. The simulator results show that the
augmented throttles-only control system performance is promising.
These results have been substantiated with actual flight data and
additional flight tests are planned for the future. These aircraft may
be controllable using engine thrust to supplement or replace the
flight control system, but exactly how adequate are the flying
qualities of the airplane when using engine thrust to control the
flight path of the airplane?
All commercial transports must meet certain flying quality
requirements before they are deemed certifiable. In the United
States, commercial aircraft operating under ordinary flight conditions
49
are required to meet FAR 25 regulations. From an aircraft designer's
viewpoint, these regulations can be considered to be met if the
airplane meets Level I flying qualities as defined in the current
USAF Military Specification - Flying Qualities of Piloted Airplanes
document. The specifications are given in numerical tables and
graphs, thereby establishing analytical criteria by which to measure
whether or not the aircraft achieves the desired handling qualities.
In specifying handling quality criteria, it is necessary to
recognize differences in types of aircraft, in types of flying
maneuvers to be performed during some phase of flight, and in
failure states of airplane systems. These differences are recognized
in the flying qualities specifications and are defined in Tables 3.1 -
3.4.
The flying quality levels as defined in Table 3.3 are tied in
with the Cooper-Harper pilot rating scale. This scale represents a
very successful attempt to relate pilot comments about the ease or
difficulty with which airplanes can be controlled in certain flight
situations to a numerical rating. The Cooper-Harper scale is shown in
Table 3.5. The tie-in with the flying quality levels as previously
defined is indicated in the table.
In view of the current development and promising test results
of the throttles-only control system, it seems reasonable to ask the
following questions:
• Is it possible to arrange the engines in a large passenger
transport in such a way that flight path control using only the
augmented throttles-only control system is not only possible, but
meets Level I or Level 2 handling quality requirements?
50
• Since total failure of the primary flight control system can be
caused by the failure of an engine, can the number of engines and
their arrangement be selected such that flight path control with one
engine inoperative is still possible with Level I or Level 2 handling
quality requirements?
• Can one or more levels of primary flight control system
redundancy be eliminated in an airplane equipped with a Level I or
Level 2 augmented throttles=only control system, allowing the engine
thrust to be used as a backup flight control system?
• What are the weight, drag, systems design, and cost benefits
associated with such a design?
The proposed research work which addresses these issues will
be carried out in phases which will be described in the following
sections.
3.2. FAMILIARIZATION WITH PREVIOUS NASA WORK AND
APPLICABLE NASA RESEARCH TOOLS9,19,38
Previous NASA work in this area was discussed in Chapter 2.
Applicable NASA research tools include a batch simulation which can
be run on a SUN SPARC workstation as well as a real-time simulation.
A six-degree-of-freedom, real-time simulation of the B-720
aircraft was developed by interfacing the models for the
aerodynamics, control systems, actuators, gear dynamics, and engines
of the aircraft to a fixed-base cockpit with user interfaces. The B-
720 model was selected because a high-fidelity fixed-base simulation
51
of the aircraft was available based on an earlier NASA/FAA
controlled impact flight test program in 1984 to further the
technology for improving crash survivability onboard a transport
aircraft. Because only limited envelope models were needed, the
existing simulation primarily reflects the low-speed/low-altitude
flight conditions required for the impact demonstration.
The B-720 simulation is currently interfaced with a fixed-base
cockpit of a modified F-15 fighter. The F-15 has only two throttle
levers, therefore the inboard and outboard engines on each wing of
the B-720 are grouped together. This grouping has not been
considered a serious limitation for throttles-only control studies thus
far.
The cockpit provides the basic instruments necessary to
operate the B-720 aircraft. A photograph of the cockpit layout
appears in Figure 3.1. In addition to flight instrumentation, the pilot
has fingertip control of the simulation through a series of switches
that enables him to hold, reset, or operate the simulation, initiate
strip chart recording, vary or capture initial conditions_ or select
automatic trim features. A field of general purpose toggle switches is
also provided at the cockpit'and is currently used to initiate a control
surface failure, initiate an engine failure, enter a propulsion-only
control mode, or activate an automatic landing system.
A flight control system failure is simulated by bypassing the
actuator model at the activation of a switch, thus locking the surfaces
at their last position. In addition to the throttles, the pilot still has
control of the flaps and the stabilizer which are electrically
controlled. Separate switches are used to activate the engines-only
52
augmented control modes in the longitudinal and lateral directions
for independent study.
The simulation has dynamic 'out the window' runway scenes
displaying a 160 square nautical mile area of Edwards Air Force Base
with its various runways on a 19 inch graphics display unit.
The B-720 simulation also includes a continuous random
turbulence model that calculates turbulence velocities and angular
rates (u, v, w, p, q, and r). Crosswind components can also be added
as a function of altitude.
The aerodynamic model for the B-720 aircraft is implemented
based on the manufacturer's documents. The data from both wind
tunnel and flight tests were reduced to support only the low altitude
and Mach flight envelope.
Each aerodynamic coefficient is the sum of individual
aerodynamic terms made up of nondimensional derivatives and
coefficient deltas. These terms are obtained by table lookup and
linear interpolation. Ground effects and the effects of c.g. position
change are also modeled.
The B-720 aircraft uses the JT3C-7 turbojet engine. The
simulation uses a modified J-57 turbojet engine simulation model
that includes control servo dynamics. The model has both table
lookup functions and dynamic elements.
The batch simulation uses the same turbulence, aerodynamic,
and engine models as the real-time simulation. The input commands,
whether an input function to the batch simulation or a control stick
input to the real=time simulation, as well as the calculated output
parameters, are plotted in graphical form. Figure 3.2 shows plots of
53
the input commands and the output parameters for a B-720
approach and landing using the real-time simulation.
3.3. BASELINE DESIGN OF A MEGA-TRANSPORT 17,39,40,41
An ultra-high capacity aircraft, or mega-transport, will be
designed utilizing the Advanced Aircraft Analysis (AAA') design
program. AAA is an interactive computer program which was
developed by Design, Analysis and Research Corporation in
conjunction with the University of Kansas to perform preliminary
design and analysis functions for fixed wing aircraft.
The mission specifications and mission profile are presented in
the following subsections.
3.3. I. Mission Specifications
• Role
• 800 passenger capacity commercial jet transport
aircraft
• Crew
• 2 flight crews - each flight crew consisting of I pilot
and I co-pilot
• 16 flight attendants
• Payload
• Each crewmember is allowed 30 Ib of baggage
• Each passenger is allowed 40 Ib of baggage
54
• Performance
• Range :5,000 nautical miles
• Cruise Speed : M = 0.85 at 35,000 ft
• Cruise Altitude :35,000 ft
• Service Ceiling :40,000 ft
• Field Length : I0,000 ft @ 5,000 ft field elevation, 95 ° F
day
• Climb : Direct climb to cruise altitude
• Powerplant
• 4 - 6 turbofan engines
• Certification
• FAR 25
• Fuel Reserves
• Must meet FAR 121.645 fuel supply requirements for
turbine-engine-powered flag carrier operations.
3.3.2. Mission Profile
FAR 121.645 states, in part, that no turbine-engine-powered
flag carrier may be dispatched unless it has enough fuel:
• to fly and land at the airport to which it is released;
• after that, to fly for a period of I 0 percent of the total time
required to fly from the airport of departure to, and land at
the airport to which it was released;
• after that, to fly to and land at the most distant alternate
airport specified in the flight release, if an alternate is
required; and
55
• after that, to fly for 30 minutes at holding speedat 1,500
feet above the alternate airport under standard temperature
conditions.
The conditions of the FAR 121.645 fuel requirements
determine the mission profile of the mega-transport as follows. The
mission profile consists of the following 14 mission segments:
• Warmup
• Taxi
• Takeoff to destination airport
• Climb to cruise altitude
• Cruise to destination airport
• Loiter for a time period equal to I0 percent of the total time
required to fly from the airport of departure to, and land at
the airport to which it was released
• Descent
• Land/Taxi
• Takeoff to alternate airport
• Climb to intermediate altitude
• Cruise to alternate airport
• Loiter for a time period of 30 minutes at holding speed at
1,500 feet above the alternate airport
• Descent
• Land/Taxi.
The mission profile of the mega-transport is shown in Figure 3.3.
56
3.3.3. Summary of the Me_a-Transport Data 40
A preliminary three-view of the mega-transport is shown in
Figure 3.4. A summary of the geometry, weight, drag polar, and
performance sizing data which have been calculated thus far for the
mega-transport is presented in Table 3.6. Table 3.7 contains the
nondimensional stability and control derivatives for the mega-
transport.
The longitudinal transfer functions, flying quality parameters,
and flying quality levels for both cruise and approach conditions are
found in Tables 3.8 - 3.1 I. Figures 3.5 and 3.6 show the short-period
frequency requirements for the cruise and approach conditions. The
lateral-directional transfer functions, flying quality parameters, and
flying quality levels for both cruise and approach conditions are
found in Tables 3.12 - 3.17. Figures 3.7 and 3.8 show the minimum
dutch roll frequency and damping ratio requirements for the cruise
and approach conditions.
3.4. DEVELOP A SIMULATION OF THE MEGA-TRANSPORT 17,34,40
A simulation of the mega-transport will be developed for the
batch simulation as well as for the real-time simulator. The
aerodynamic data will be developed by using the parameters which
were calculated in the design phase of the mega-transport (which
includes the data in Tables 3.6 - 3.17 along with the external
dimensions of the aircraft and the c.g. envelope). These data, along
57
with flight condition information, will be used to modify the existing
B-720 aerodynamic data decks.
The JT3C-7 turbojet engine data will be replaced with a Pratt
and WhitneyPW 4084 turbofan engine deck. ThePW 4084 turbofan
is scheduled to be installed on the new Boeing 777 passenger
transport and is much more representative of the high thrust/fuel
efficient turbofan engines currently available to power the next
generation of passenger transports than the older JT3C-7 turbojet
engine.
3.5. MEGA-TRANSPORT SIMULATION FLYING QUALITIES
EVALUATIONI7,32
Several parameters which could affect the flying qualities of
the mega-transport will be varied on the mega-transport simulation
and flown, both with and without the augmented throttles-only flight
control system engaged. Some of the parameters which will be
examined are:
• number of engines
• placement of engines [vertical and lateral]
• engine out
• engine time constants
• flaps/slats/gear
• center of gravity.
The simulator will be flown in both cruise and approach-to-
land flight conditions. The flying qualities of the mega-transport in a
58
particular configuration will be evaluated by having the flight test
pilot fly a specified task and then assign the flying qualities a rating
number on the Cooper-Harper scale. The objective is to determine
under what conditions Level I or Level 2 flying qualities are
obtainable during cruise and approach flight phases with total
primary flight control system failure using either manual thrust
input or augmented throttles-only flight control system input to
control the flight path.
3.6. MEGA-TRANSPORT SIMULATION FLYING QUALITIES
ANALYS I S 17,32,42,43,44,45,46,47,48,49
Although the Cooper-Harper rating is a very successful method
used to evaluate the handling qualities of an airplane under certain
flight conditions, the evaluation is subject to the pilot's opinion of the
ease or difficulty of flying the assigned task. Pilot opinions are likely
to vary depending on factors such as pilot training, knowledge,
experience, physical condition, and ability to assess the specific task.
Because of the subjective nature of evaluating flying qualities
based solely on pilot opinion, it is desirable to quantify these Cooper-
Harper rating results by analytically examining the performance of
the human pilot/engine/airframe combination from the viewpoint of
the closed loop system shown in Figure 3.9. To perform closed loop
analysis on the pilot/engine/airframe system, it is necessary to have
available a mathematical model of the basic aircraft characteristics,
the engine time constants, and the human pilot.
59
The basic aircraft response to a specified input is characterized
by the longitudinal and lateral-directional airplane transfer
functions, which depend on the dimensional stability derivatives.
These stability derivatives take into account factors such as the
weight, geometry, inertia, and flight condition of the airplane. The
effects of varying the number of engines, placement of engines,
engine out condition, flaps/slats/gear configuration, and center of
gravity location can be examined through the effects these
parameters have on the weight, geometry, and inertia of the
airplane.
The number of engines, placement of engines, engine out
condition, flaps/slats/gear configuration, and center of gravity
location will all affect the geometry and/or inertia of the airplane. In
addition, the number of engines will affect the airplane weight in the
following two ways:
• additional engines means additional weight
• number and placement of engines affect wing weight.
The wing weight is a function of many factors such as shear
forces, bending moments, stress levels, and material properties.
These, in turn, depend upon the number and placement of engines.
Torenbeek (Ref. 48) has developed a design-sensitive weight
prediction method for wing structures which can be used to modify
the wing weight according to the number of engines and their
location on the wing.
Varying the number and location of engines, engine out
condition, flaps/slats/gear configuration, and center of gravity
parameters affect the stability derivatives and, hence, the transfer
60
functions of the airplane. The response (transfer function) of most
interest to the pilot using engine thrust alone to maneuver the
airplane is how the flight path angle and bank angle of the airplane
respond to change in throttle control, the desired transfer functions
being (T/ST) and ((_/ST), respectively.
The engine time constant, the time it takes the engine to
produce the commanded thrust, is primarily a function of the spool
up time from the current thrust level to the commanded thrust level.
The spool up time depends on many factors such as gas temperature,
pressure levels, engine materials, radial and axial clearances,
variable stator vane position, rotor balance, aerodynamic matching of
components, inlet flow conditions, and age of the engine. The engine
time constant can be modeled by a simple first-order lag, (I/(Tengs +
1)).
The primary objective of most of the past experimental and
analytical programs to develop mathematical descriptions for pilot
response characteristics has been to achieve reasonable descriptions
of the pilot as a component in the engineering system. Major efforts
in model building have thus been placed on the evolution of models
which can predict pilot dynamic response characteristics of
engineering significance, but which are otherwise of minimum
analytical complexity. Such models are conceptual descriptions of
the human. There are a number of possible models with increasing
complexity and an increasing number of parameters. All have
special merits in that they can describe or model certain general or
more specific measured characteristics of human control behavior.
61
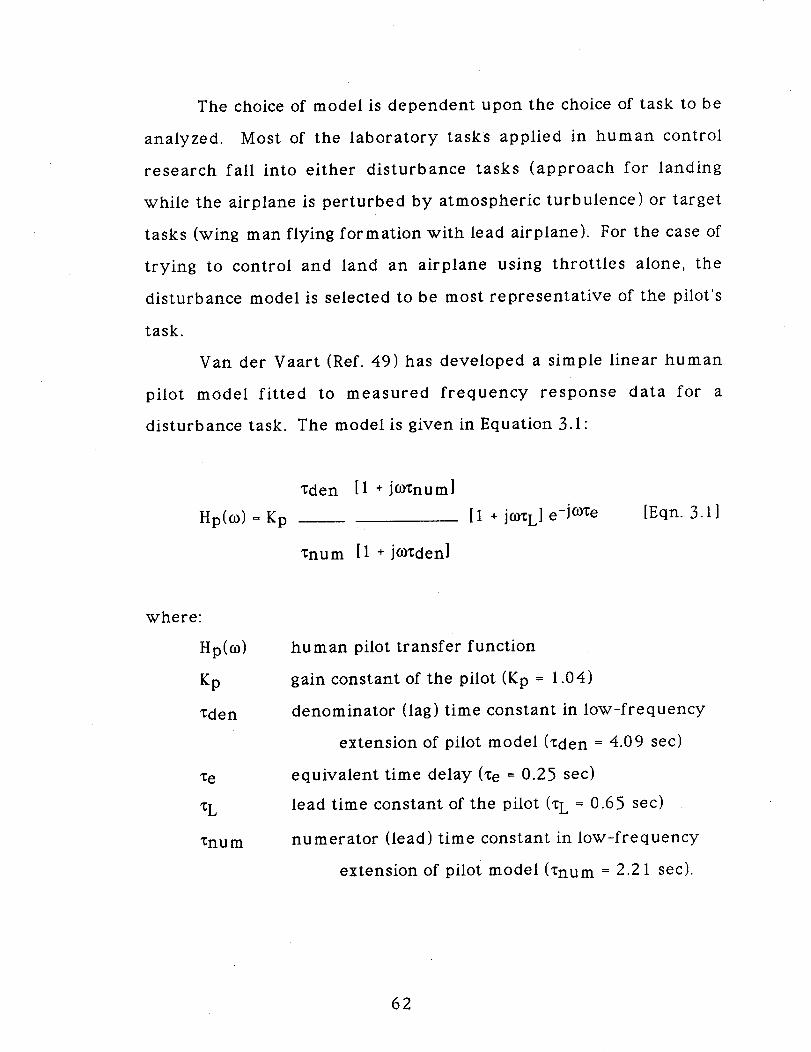
The choice of model is dependent upon the choice of task to be
analyzed. Most of the laboratory tasks applied in human control
research fall into either disturbance tasks (approach for landing
while the airplane is perturbed by atmospheric turbulence) or target
tasks (wing man flying formation with lead airplane). For the case of
trying to control and land an airplane using throttles alone, the
disturbance model is selected to be most representative of the pilot's
task.
Van der Vaart (Ref. 49) has developed a simple linear human
pilot model fitted to measured frequency response data for a
disturbance task. The model is given in Equation 3.1:
Hp(o)) = Kp
%den [I + jo)znum]
%num [I + jo)Xden]
[I + joy: L] e-J °xce [Eqn. 3. I ]
where:
Hp(o))
Kp
Zden
"Ce
_L
xnu m
human pilot transfer function
gain constant of the pilot (Kp = 1.04)
denominator (lag) time constant in low-frequency
extension of pilot model (%den = 4.09 sec)
equivalent time delay (Xe = 0.25 sec)
lead time constant of the pilot (XL = 0.65 sec)
numerator (lead) time constant in low-frequency
extension of pilot model (Xnum = 2.21 sec).
62
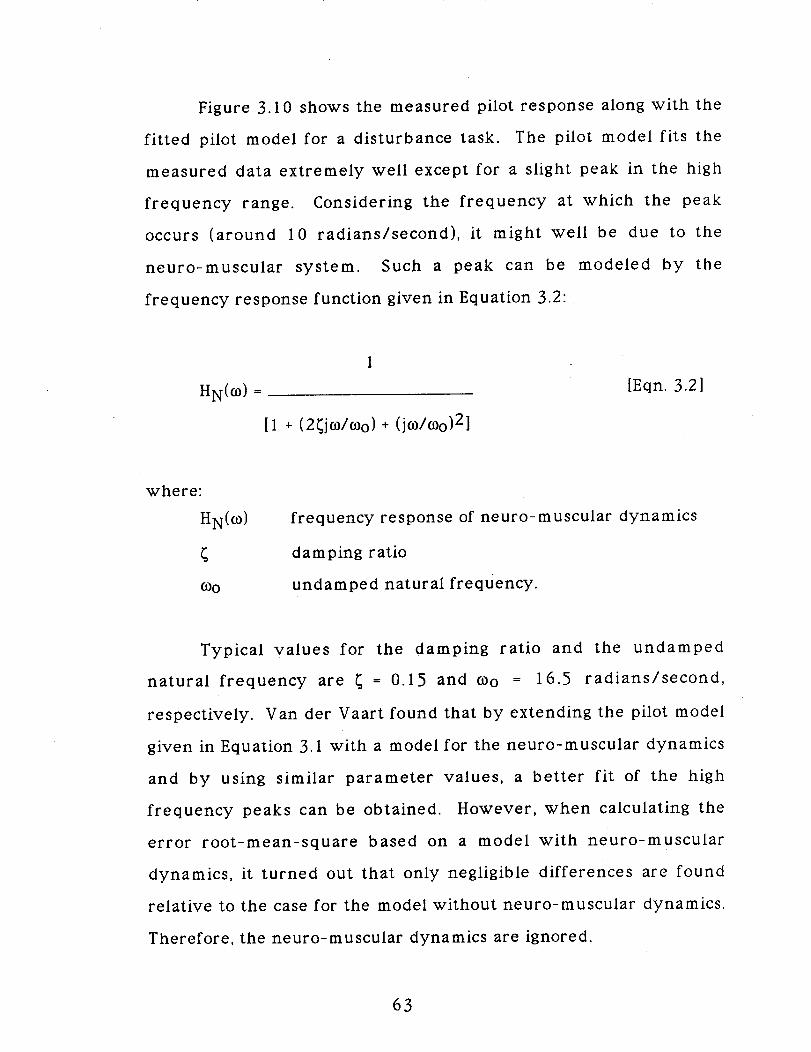
Figure 3.10 shows the measured pilot response along with the
fitted pilot model for a disturbance task. The pilot model fits the
measured data extremely well except for a slight peak in the high
frequency range. Considering the frequency at which the peak
occurs (around 10 radians/second), it might well be due to the
neuro-muscular system. Such a peak can be modeled by the
frequency response function given in Equation 3.2:
I
HN(O) =
[I + (2_jo/c0o) + (jo/oo) 2]
[Eqn. 3.2 ]
where:
HN(O)
{00
frequency response of neuro-muscular dynamics
damping ratio
undamped natural frequency.
Typical values for the damping ratio and the undamped
natural frequency are _ = 0.15 and Oo = 16.5 radians/second,
respectively. Van der Vaart found that by extending the pilot model
given in Equation 3.1 with a model for the neuro-muscular dynamics
and by using similar parameter values, a better fit of the high
frequency peaks can be obtained. However, when calculating the
error root-mean=square based on a model with neuro-muscular
dynamics, it turned out that only negligible differences are found
relative to the case for the model without neuro-muscular dynamics.
Therefore, the neuro-muscular dynamics are ignored.
63
Bode and root=locus analyses are two methods used to study
the stability behavior of closed loop systems such as that shown in
Figure 3.9. These methods will be used to analyze the behavior of
the pilot/engine/mega-transport system in a particular
configuration, explain the reasons behind a Cooper-Harper rating, by
examining what influence the parameters under investigation have
on the system dynamics and, hence, flying qualities of the airplane,
and determine the 'design drivers' which most influence the flight
path control response of the airplane using engine thrust alone.
3.7. DETERMINATION OF BENEFITS ASSOCIATED WITH
AUGMENTED THROTTLES-ONLY CONTROL SYSTEM 17
Designing an aircraft such that Level I or Level 2 flying
qualities are obtained using the augmented throttles_only control
system should insure that one level of redundancy can be reduced in
the flight control system. An augmented throttles-only flight control
back-up system could enable the aircraft manufacturers to reduce
the number of hydraulic systems in the aircraft (or reduce or
eliminate mechanical cable backup for fly-by-wire control systems).
A trade study should be performed comparing the weight and
the cost associated with the purchase, installation, and maintenance
of both the augmented throttles-only control system and the
conventional redundant hydraulic back-up system. This study would
indicate which system was economically more feasible. Aircraft
manufacturers, while concerned with the relative costs of these
64
systems, should not lose sight of the primary benefit of the
augmented throttles-only control system - saving human lives. The
level of passenger and flight crew safety could be improved as the
complete loss of the flight control system would no longer render an
aircraft uncontrollable.
65
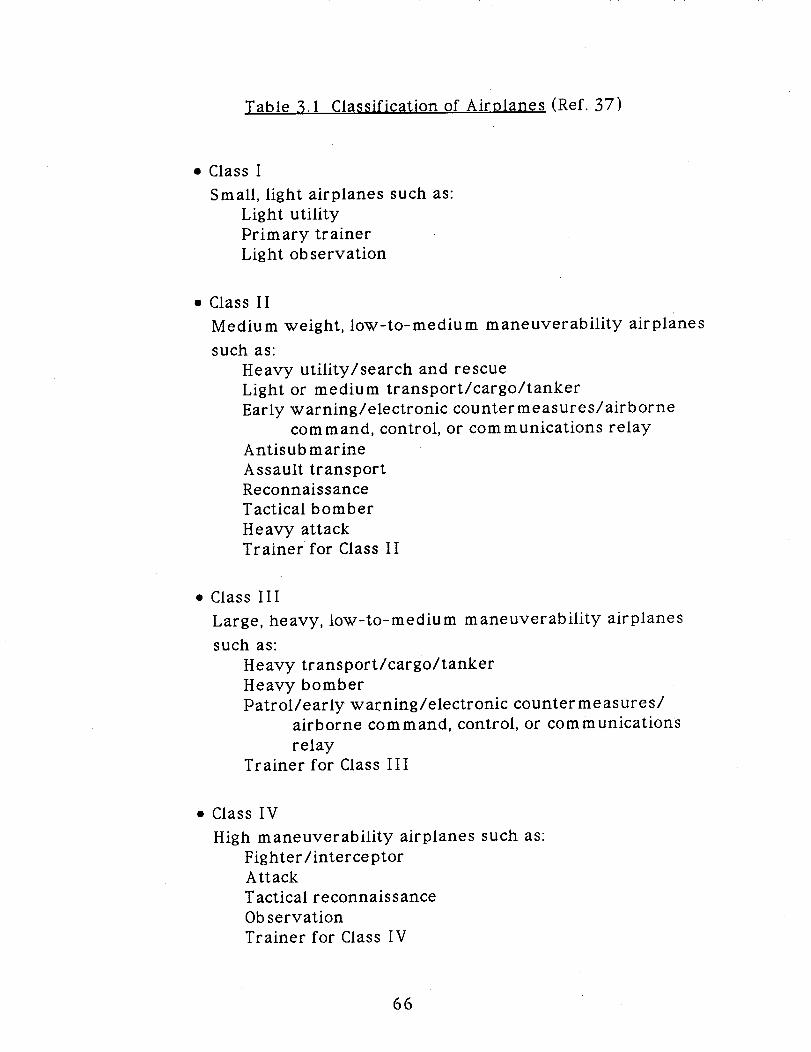
Table 3.1 Classification of Airplanes (Ref. 37)
• Class I
Small, light airplanes such as:
Light utility
Primary trainer
Light observation
• Class I I
Medium weight, low-to-medium maneuverability airplanes
such as:
Heavy utility/search and rescue
Light or medium transport/cargo/tanker
Early warning/electronic countermeasures/airborne
command, control, or communications relay
Antisub marine
Assault transport
Reconnaissance
Tactical bomber
Heavy attackTrainer for Class II
• Class I I I
Large, heavy, low-to-mediu m maneuverability airplanes
such as:
Heavy transport/cargo/tanker
Heavy bomber
Patrol/early warning/electronic countermeasures/
airborne command, control, or communications
relayTrainer for Class I I I
• Class IV
High maneuverability airplanes such as:
Fighter/interceptor
Attack
Tactical reconnaissance
Observation
Trainer for Class IV
66
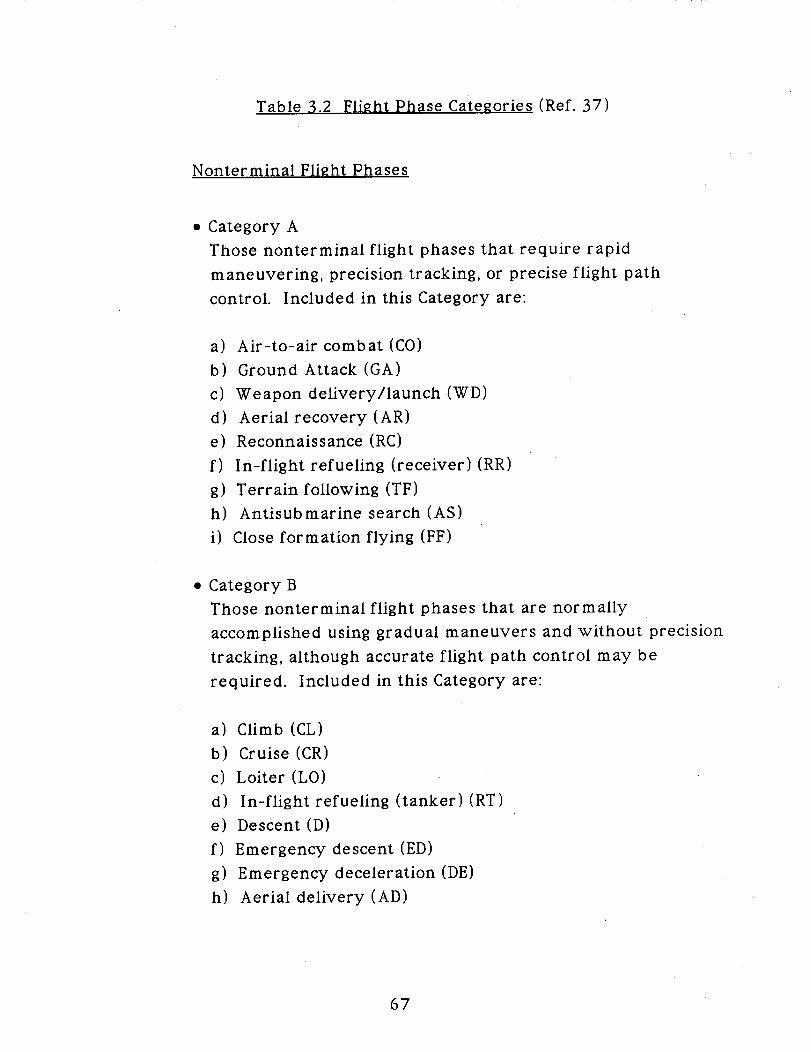
Table 3.2 Flight Phase Categories (Ref. 37)
Nonter minal Flight Phases
• Category A
Those nonterminal flight phases that require rapid
maneuvering, precision tracking, or precise flight path
control. Included in this Category are:
a) Air-to-air combat (CO)
b) Ground Attack (GA)
c) Weapon delivery/launch (WD)
d) Aerial recovery (AR)
e) Reconnaissance (RC)
f) In-flight refueling (receiver) (RR)
g) Terrain following (TF)
h) Antisubmarine search (AS)
i) Close formation flying (FF)
• Category B
Those nonterminal flight phases that are normally
accomplished using gradual maneuvers and without precision
tracking, although accurate flight path control may be
required. Included in this Category are:
a) Climb (CL)
b) Cruise (CR)
c) Loiter (LO)
d) In-flight refueling (tanker) (RT)
e) Descent (D)
f) Emergency descent (ED)
g) Emergency deceleration (DE)
h) Aerial delivery (AD)
67
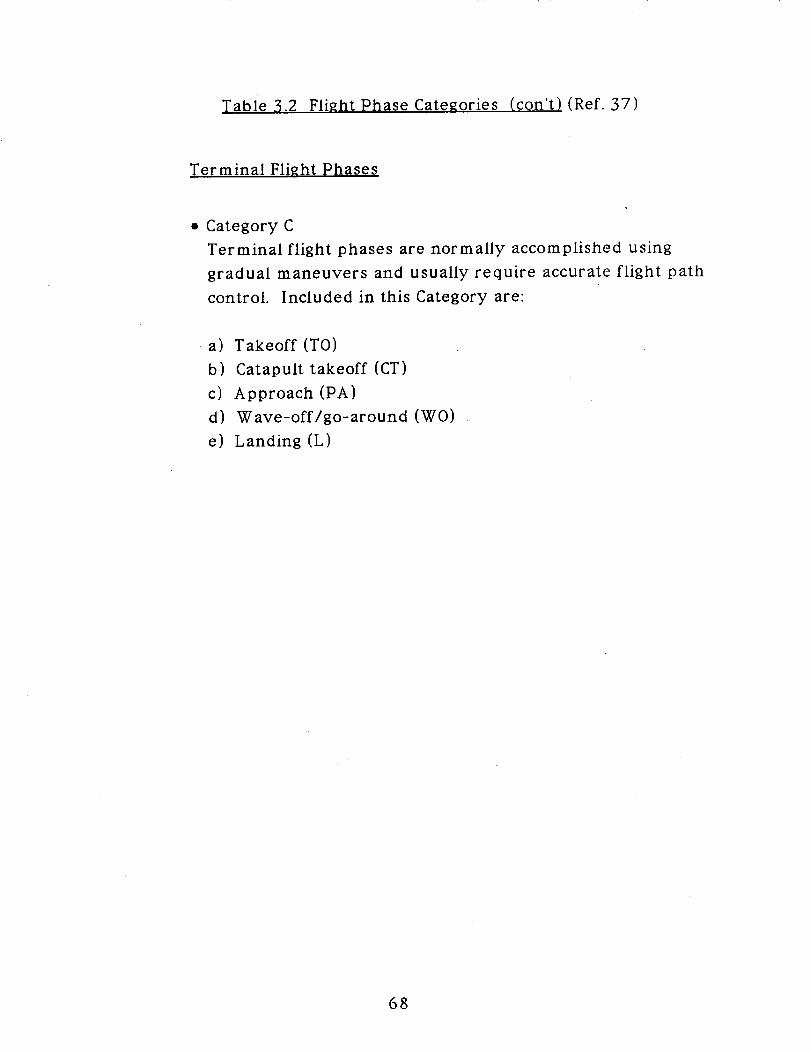
Table 3.2 Flight Phase Categories (con't) (Ref. 37)
Terminal Flight Phases
• Category C
Terminal flight phases are normally accomplished using
gradual maneuvers and usually require accurate flight path
control. Included in this Category are:
a) Takeoff (TO)
b) Catapult takeoff (CT)
c) Approach (PA)
d) Wave-off/go-around (WO)
e) Landing (L)
68
Table 3.3 Levels of FWing Qualities (Ref. 37)
• Level I
Flying qualities clearly adequate for the mission flight
phase.
• Level 2
Flying qualities adequate to accomplish the mission flight
phase, but some increase in pilot workload or degradation in
mission effectiveness, or both, exists.
• Level 3
Flying qualities such that the airplane can be controlled
safely, but pilot workload is excessive or mission
effectiveness is inadequate, or both. Category A flight
phases can be terminated safely, and Category B and C flight
phases can be completed.
Table 3,4 Allowable Probability of Certain System Failures (Ref. 32)
• At Least Level I - for airplane normal (no failure) state
• At Least Level 2 = after failures that occur less than once per
I O0 flights
• At Least Level 3 - after failures that occur less than once per
I 0,000 flights
Flying quality levels below Level 3 are not allowed except
under special circumstances.
69
Table 3.5 Coover-Haroer Pilot Ovinion Ratin_ Scale (Ref. 32)
"-4O
I ADEQUACY FOR SELECTED I
TASK OR REQUIRED OPERATION I
Yes
is it ] No
satisfactory with- I ]Deficiencies|
°ut impr°vement_" _----_ warrant
I improvement j
Yes
is adequate NIN_Dperformance
eftciencles Iobtainable with a__ require
tolerableworkload pilot I I improvement
t Yes No
I is it _lmprovement_control lable I _nunda [.o_y
L'PILOT DECISIONS
AIRCRAFT
CIIARACTERISTICS
DEMANDS ON TIlE PILOT IN SELECTED
TASK OR REQUIRED OPERATION
Excellent
llighly desirable
Pilot compensation not a factor
for desired performance
Good
Negligible defi-
ciencies
Pilot compensation not a factor
for desired performance
I PILOT FLYING
RATING QUALITIESLEVELS
I
2 i
Falr-some mldly
unpleasant de-
flciencies
Minor but
annoying
deficiencies
Moderately
objectionable
deficiencies
Very objection-
able but tolerable
deflclencles
Minimal pilot compensation required 3
for desired performance
Desired performance requires
moderate pilot compensation
Adequate performance requires
considerable pilot compensation
Adequate performance requires
extensive pilot compensation
Intense pilot compensation Is
required to retain control
4
5 2
6
Major Control will be lost during I0
deficiencies some portion of required
operation
n_
Major Adequate performance not attainable 7
deficiencies with maximum tolerable pilot compen-
sation. Controllability not in
question.
Major Considerable pilot compensation is 8 3
deficiencies required for control
Major 9deficiencies
Table 3.6 Summary of the Geometry, Weight, Drag Polar, and
Performance Sizin_ Data for the Me_a-TransDort
(Ref. 40)
GEOMETRY
Win_
• Sw, wing area ................................................................. 11,900 ft 2
• bw, wing span ...................................................................... 318.0 ft
• ARw, wing aspect ratio .............................................................. 8.5
• _.w, wing taper ratio ................................................................. 0.30
• Awc/4, wing quarter-chord sweep ............................... 30 deg
• Cw, wing mean geometric chord .................................... 41.0 ft
• Crw, wing root chord ........................................................... 57.6 ft
• Ctw, wing tip chord .............................................................. 17.3 ft
Horizontal Tail
• Sh, horizontal tail area .............................. i................... 2,800 ft 2
• bh, horizontal tail span .................................................... 105.8 ft
• ARh, horizontal tail aspect ratio ........................ . ................... 4.0
• _.h, horizontal tail taper ratio ............................................... 0.34
• Ahc/4, horizontal tail quarter-chord sweep ............. 35 deg
• Ch, horizontal tail mean geometric chord ................... 28.6 ft
• Crh, horizontal tail root chord ....................... .................. 39.5 ft
• Cth, horizontal tail tip chord ............................................ 13.4 ft
Vertical Tail
• Sv, vertical tail area ....................................................... 2,051 ft 2
• bv, vertical tail span ............................................................ 57.3 ft
• ARv, vertical tail aspect ratio ................................................. 1.6
• _v, vertical tail taper ratio .................................................... 0.35
• Avc/4, vertical tail quarter-chord sweep .................. 37 deg
• Cv, vertical tail mean geometric chord ........................ 38.6 ft
• Crv, vertical tail root chord .............................................. 53.0 ft
• Ctv, vertical tail tip chord ................................................. 18.6 ft
71
Table 3.6 Summary of the Geometry, Weight, Dra_ Polar, and
Performance Sizin_ Data for the Me_a-Transport
(con't) (Ref. 40)
GEOMETRY (con't)
Fuselage
• Lfus, fuselage length ................................. ........................... 277 ft
• Dfus, average fuselage diameter ........................................ 25 ft
WEIGHT
• WPL, payload weight .............................................................. 185,900 Ib
• Wcrew, crew weight ..................................................................... 4, I 00 Ib
• WE, empty weight .................................................................... 683,400 Ib
• WF, fuel weight ......................................................................... 541,400 Ib
• Wtfo, trapped fuel and oil weight .......................................... 7,110 Ib
• WTO, gross takeoff weight ................................................ 1,421,900 Ib
DRAG POLARS
• Takeoff, gear down
• Takeoff, gear up
• Clean
• Landing, gear up
• Landing, gear down
CD = 0.0464 + 0.0468 CL 2
CD = 0.0264 + 0.0468 CL 2
CD = 0.0124 + 0.0441 CL 2
CD = 0.0764 + 0.0499 CL 2
CD = 0.0964 + 0.0499 CL 2
72
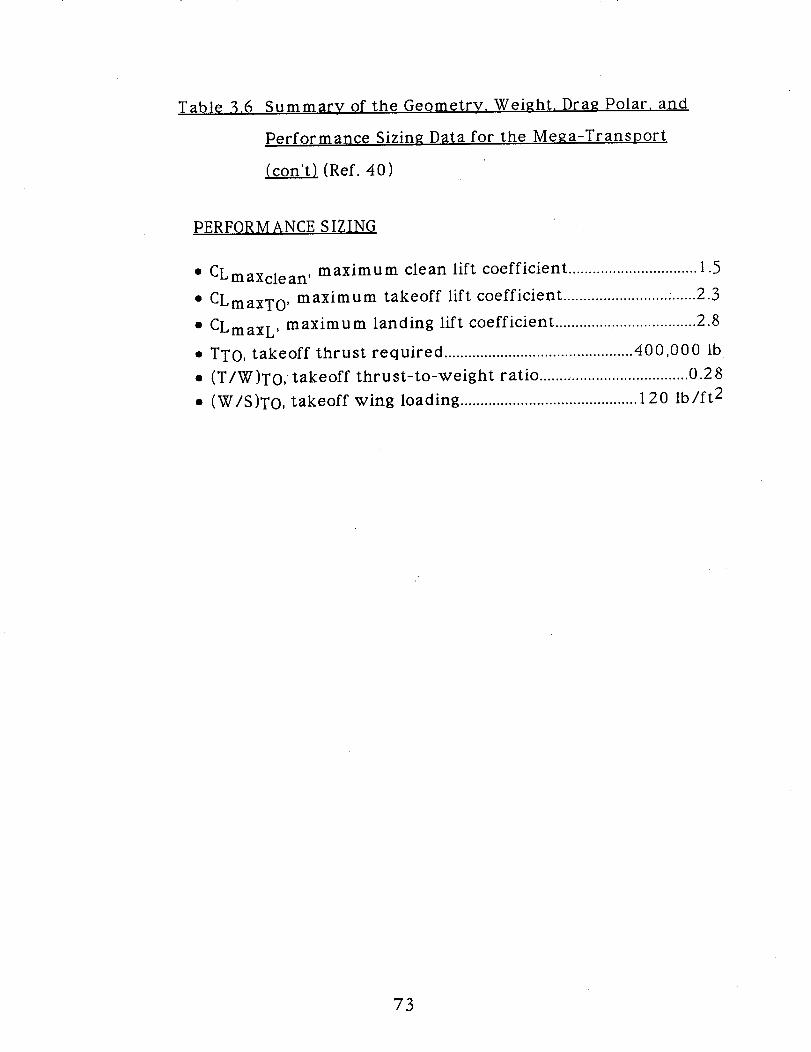
Table 3.6 Summary of the Geometry, Weight, Dra_ Polar, and
Performance Sizing Data for the Me_a-Transport
(con't) (Ref. 40)
PERFORMANCE SIZING
maximum clean lift coefficient ................................ i .5• CLmaxclean,
• CLmaxTo, maximum takeoff lift coefficient .... ...................... ....... 2.3
• CLmaxL, maximum landing lift coefficient ................................... 2.8
• TTO, takeoff thrust required ............................................... 400,000 Ib
• (T/W)TO, takeoff thrust-to-weight ratio ........ ............................. 0.28
• (W/S)TO, takeoff wing loading ............................................ 120 Ib/ft 2
73
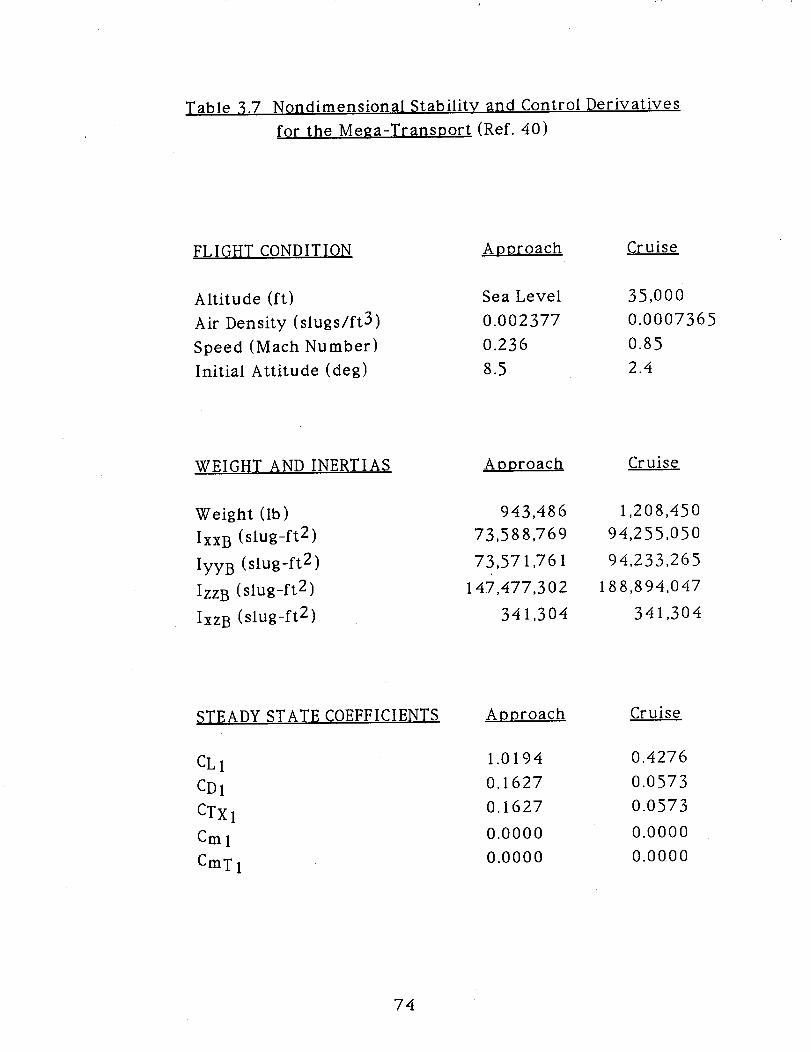
Table 3.7 Nondimensional Stabilit¥ and Control Derivatives
for the Mega-Transport (Ref. 40)
FLIGHT CONDITION Approach Cruise
Altitude (ft)
Air Density (slugs/ft3)
Speed (Mach Number)
Initial Attitude (deg)
Sea Level 35,000
0.002377 0.0007365
O.236 O.85
8.5 2.4
WEIGHT AND INERTIAS Approach Cruise
Weight (Ib)
IxxB (slug-ft2)
lyy B (slug-ft 2)
IzzB (slug -ft2)
IxzB (slug -ft2)
943,486
73,588,769
73,571,761
147,477,302
341,304
1,208,450
94,255,O5O
94,233,265
188,894,047
341,304
STEADY STATE COEFFICIENTS Approach Cruise
CL i
CDI
CTx I
Cml
CmTI
1.0194
0.1627
0.1627
0.0000
0.0000
0.4276
0.0573
0.0573
0.0000
0.0000
74
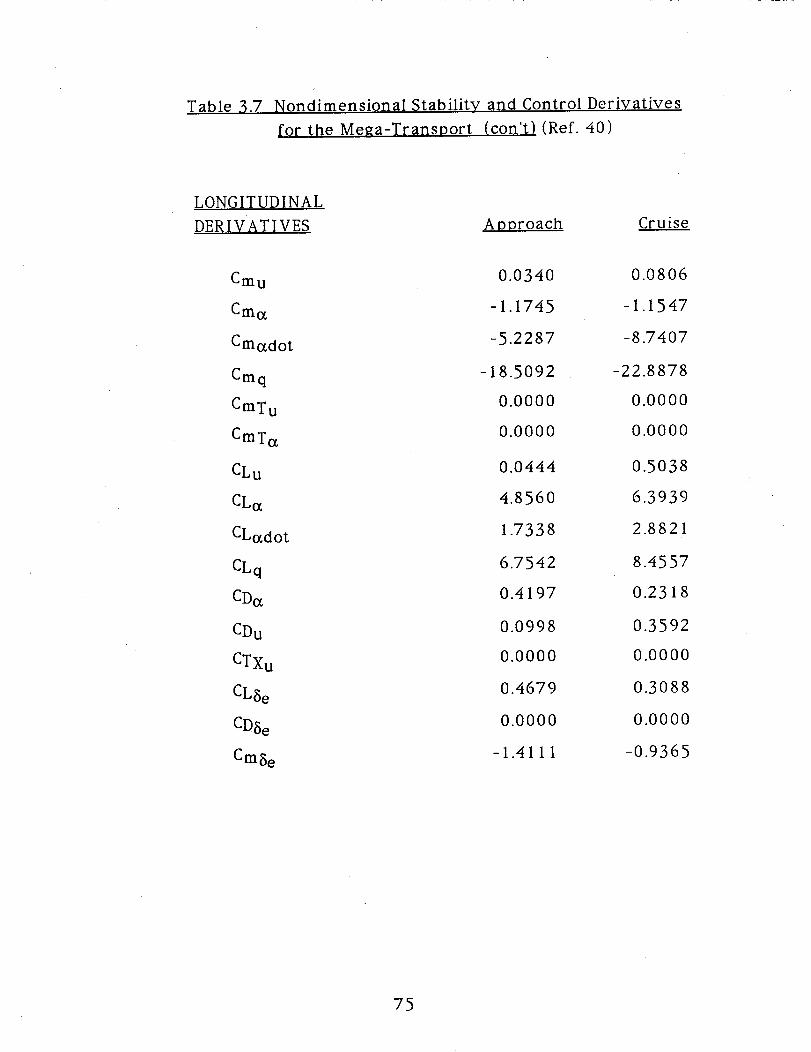
Table 3.7 Nondimensional Stability and Control Derivatives
for the Mega-Transport (con't) (Ref. 40)
LONGITUDINAL
DERIVATIVES Approach Cruise
Cmu 0.0340 0.0806
Cmcz -1.1745 -1.1547
Cmczdot -5.2287 -8.7407
Cmq -18.5092 -22.8878
CmTu 0.0000 0.0000
CmTcz 0.0000 0.0000
CLu 0.0444 0.5038
CLcz 4.8560 6.3939
CL(zdot 1.7338 2.8821
CLq 6.7542 8.4557
CDcz 0.4197 0.2318
CDu 0.0998 0.3592
CTXu 0.0000 0.0000
CLSe 0.4679 0.3088
CDSe 0.0000 0.0000
CmSe -1.4111 -0.9365
75
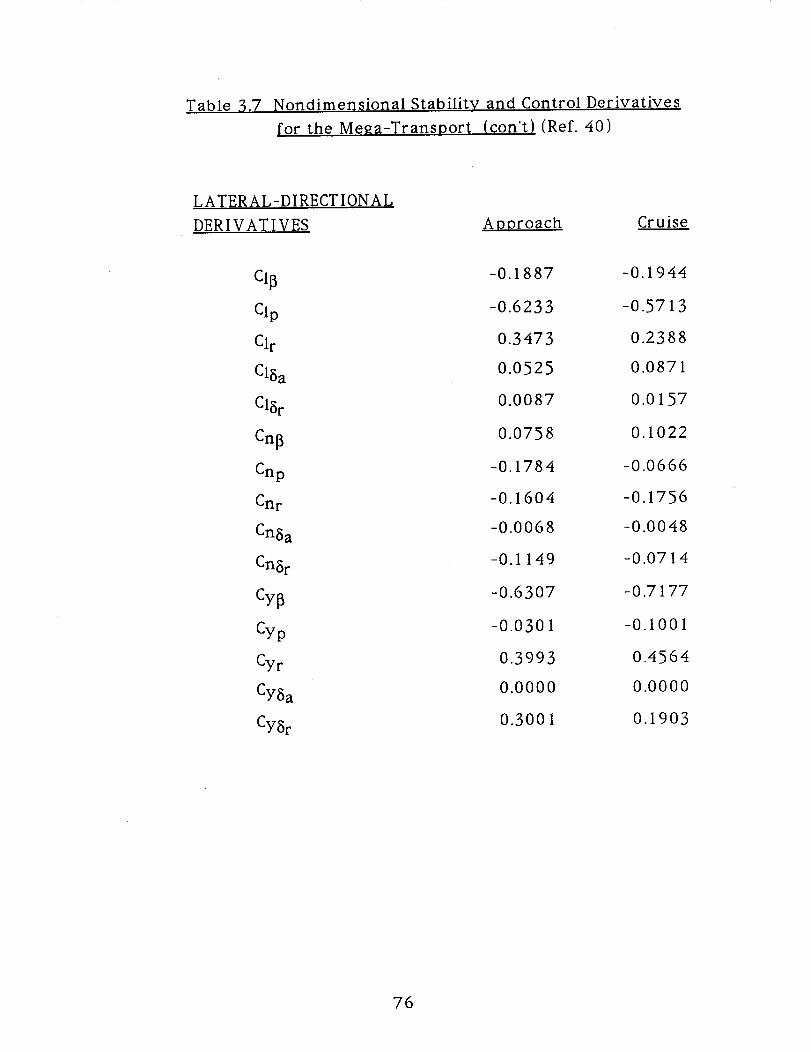
Table 3.7 Nondimensional Stability and Control Derivatives
for the Mega-Transport (con't) (Ref. 40)
LATERAL-DIRECT IONAL
DERIVATIVES Approach Cruise
CI_ -0.1887 -0.1944
Clp -0.6233 -0.5713
Clr 0.3473 0.2388
ClSa 0.0525 0.0871
ClSr 0.0087 0.0157
Cn]3 0.0758 0.1022
Cnp -0.1784 -0.0666
Cnr -0.1604 -0.1756
CnSa -0.0068 -0.0048
CnSr -0.1149 -0.0714
Cy_ -0.6307 -0.7177
Cyp -0.0301 -0.I001
Cy r 0.3993 0.4564
CySa 0.0000 0.0000
CySr 0.3001 0.1903
76
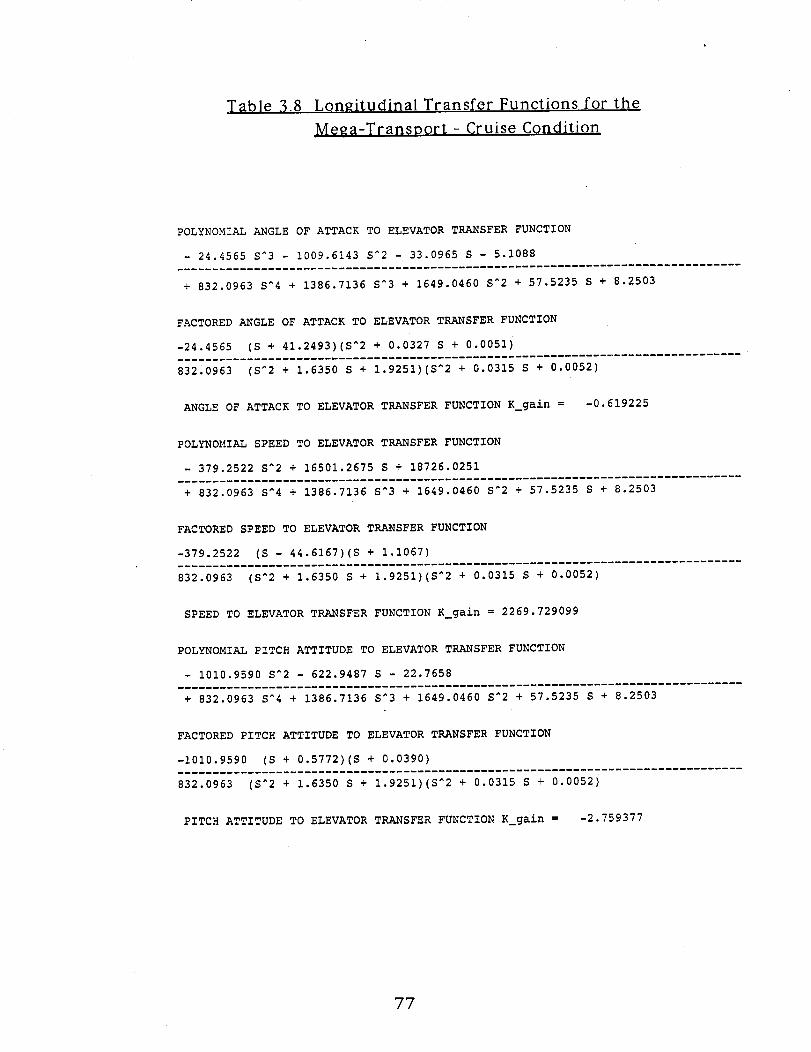
Table 3.8 Longitudinal Transfer Functions for the
Me_a-Transoort - Cruise Condition
POLYNOMIAL ANGLE OF ATTACK TO ELEVATOR TRANSFER FUNCTION
- 24.4565 S^3 - 1009.6143 S^2 - 33.0965 S - 5.1088
+ 832.0963 S^4 + 1386.7136 S^3 + 1649.0460 S^2 + 57.5235 S + 8.2503
FACTORED ANGLE OF ATTACK TO ELEVATOR TRANSFER FUNCTION
-24.4565 (S + 41.2493)(S^2 + 0.0327 S + 0.0051)
832.0963
ANGLE OF ATTACK TO ELEVATOR TRANSFER FUNCTION K_gain =
POLYNOMIAL SPEED TO ELEVATOR TRANSFER FUNCTION
- 379.2522 S^2 + 16501.2675 S + 18726.0251
(S^2 + 1.6350 S + 1.9251)(S^2 + 0.0315 S + 0.0052)
-0.619225
+ 832.0963 S^4 + 1386.7136 S^3 + 1649.0460 S^2 + 57.5235 S + 8.2503
FACTORED SPEED TO ELEVATOR TRANSFER FUNCTION
-379.2522 (S - 44.6167)(S + 1.1067)
832.0963 (S^2 + 1.6350 S + 1.9251)(S^2 + 0.0315 S + 0.0052)
SPEED TO ELEVATOR TRANSFER FUNCTION K_gain = 2269.729099
POLYNOMIAL PITCH ATTITUDE TO ELEVATOR TRANSFER FUNCTION
- 1010.9590 S^2 - 622.9487 S - 22.7658
+ 832.0963 S^4 + 1386.7136 S^3 + 1649.0460 S^2 + 57.5235 S + 8.2503
FACTORED PITCH ATTITUDE TO ELEVATOR TRANSFER FUNCTION
-1010.9590 (S + 0.5772)(S + 0.0390)
832.0963 (S^2 + 1.6350 S + 1.9251)(S^2 + 0.0315 S + 0.0052)
PITCH ATTITUDE TO ELEVATOR TRANSFER FUNCTION K_gain = -2.759377
77
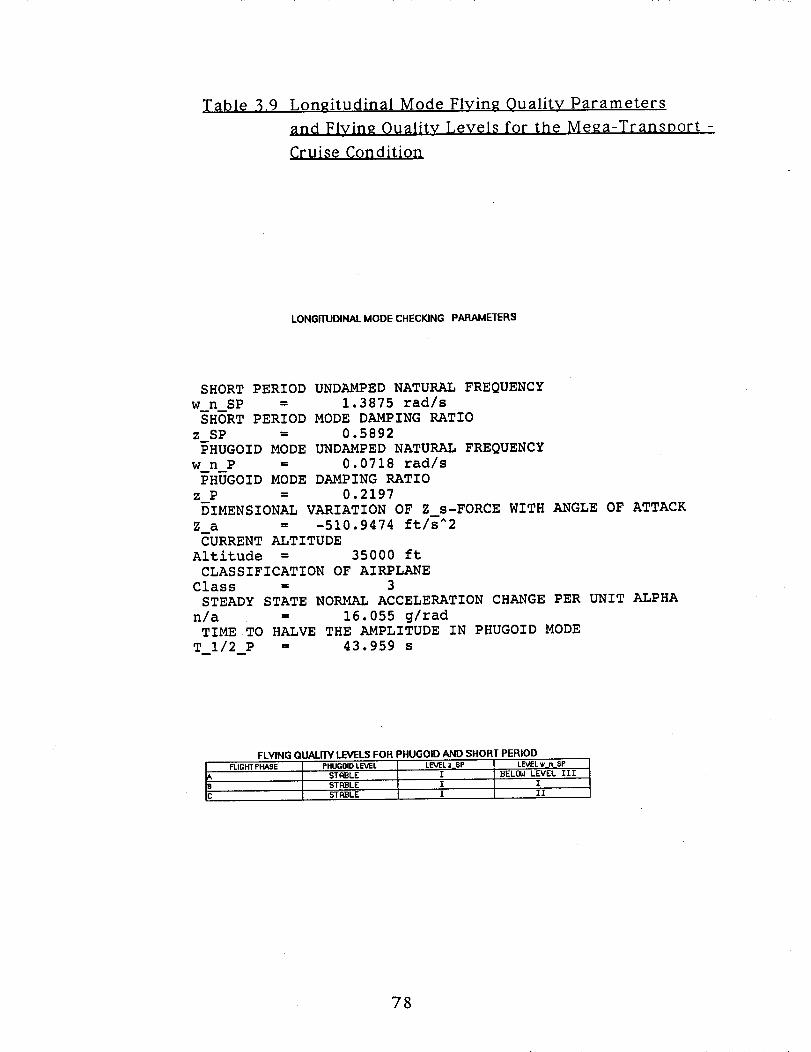
Table 3.9 Longitudinal Mode Flying Quality Parameters
_nd Flyin_ Oualitv Levels for the Me_a-Transoort -
Cruise Condition
LONGITUDINAL MODE CHECKING PARAMETERS
SHORT PERIOD UNDAMPED NATURAL FREQUENCYw n SP = 1.3875 rad/s
SHORT PERIOD MODE DAMPING RATIO
z SP = 0.5892
PHUGOID MODE UNDAMPED NATURAL FREQUENCY
w n P = 0.0718 rad/s
PHUGOID MODE DAMPING RATIO
z P = 0.2197
DIMENSIONAL VARIATIONOF Z s-FORCE WITH ANGLE OF ATTACK
Z a = -510. 9474 ft/s^2
CURRENT ALTITUDE
Altitude = 35000 ft
CLASSIFICATION OF AIRPLANE
Class = 3
STEADY STATE NORMAL ACCELERATION CHANGE PER UNIT ALPHA
n/a = 16.055 g/radTIME TO HALVE THE AMPLITUDE IN PHUGOID MODE
T_I/2_P = 43.959 s
FLYING QUALITY LEVELS FOR PHUGOID AND SHORT PERIOD
FLIGHT PHASE PHUG01D LE_/EL LEVEL z SP LEVEL w_n_SP
STRBLE I BELOW LEVEL llI
STRBLE I ISTRBLE I IT
78
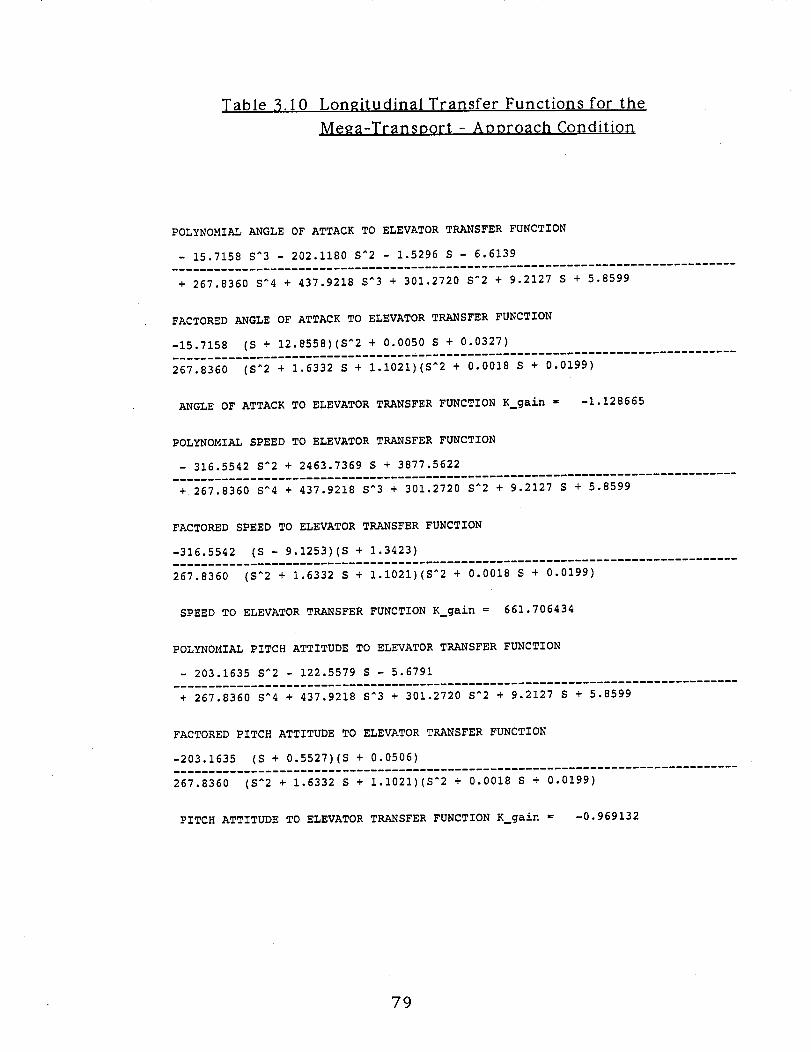
Table 3.10 Longitudinal Transfer Functions for the
Me_a-TransDort - Approach Condition
POLYNOMIAL ANGLE OF ATTACK TO ELEVATOR TRANSFER FUNCTION
- 15.7158 S^3 - 202.1180 S^2 - 1.5296 S - 6.6139
+ 267.8360 S^4 + 437.9218 S^3 + 301.2720 S^2 + 9.2127 S + 5.8599
FACTORED ANGLE OF ATTACK TO ELEVATOR TRANSFER FUNCTION
-15.7158 (S + 12.8558)(S ^2 + 0.0050 S + 0.0327)
267.8360
ANGLE OF ATTACK TO ELEVATOR TRANSFER FUNCTION K gain =
POLYNOMIAL SPEED TO ELEVATOR TRANSFER FUNCTION
- 316.5542 S^2 + 2463.7369 S + 3877.5622
(S^2 + 1.6332 S + 1.1021)(S ^2 + 0.0018 S + 0.0199)
-1.128665
+ 267.8360 S^4 + 437.9218 S^3 + 301.2720 S^2 + 9.2127 S + 5.8599
FACTORED SPEED TO ELEVATOR TRANSFER FUNCTION
-316.5542 (S - 9.1253)(S + 1.3423)
267.8360 (S^2 + 1.6332 S + 1.1021)(S^2 + 0.0018 S + 0.0199)
SPEED TO ELEVATOR TRANSFER FUNCTION K_gain = 661.706434
POLYNOMIAL PITCH ATTITUDE TO ELEVATOR TRANSFER FUNCTION
- 203.1635 S^2 - 122.5579 S - 5.6791
+ 267.8360 S^4 + 437.9218 S^3 + 301.2720 S^2 + 9.2127 S + 5.8599
FACTORED PITCH ATTITUDE TO ELEVATOR TRANSFER FUNCTION
-203.1635 (S + 0.5527)(S + 0.0506)
267.8360 (S^2 + 1.6332 S + 1.1021)(S^2 + 0.0018 S + 0.0199)
PITCH ATTITUDE TO ELEVATOR TRANSFER FUNCTION K_gain = -0.969132
79
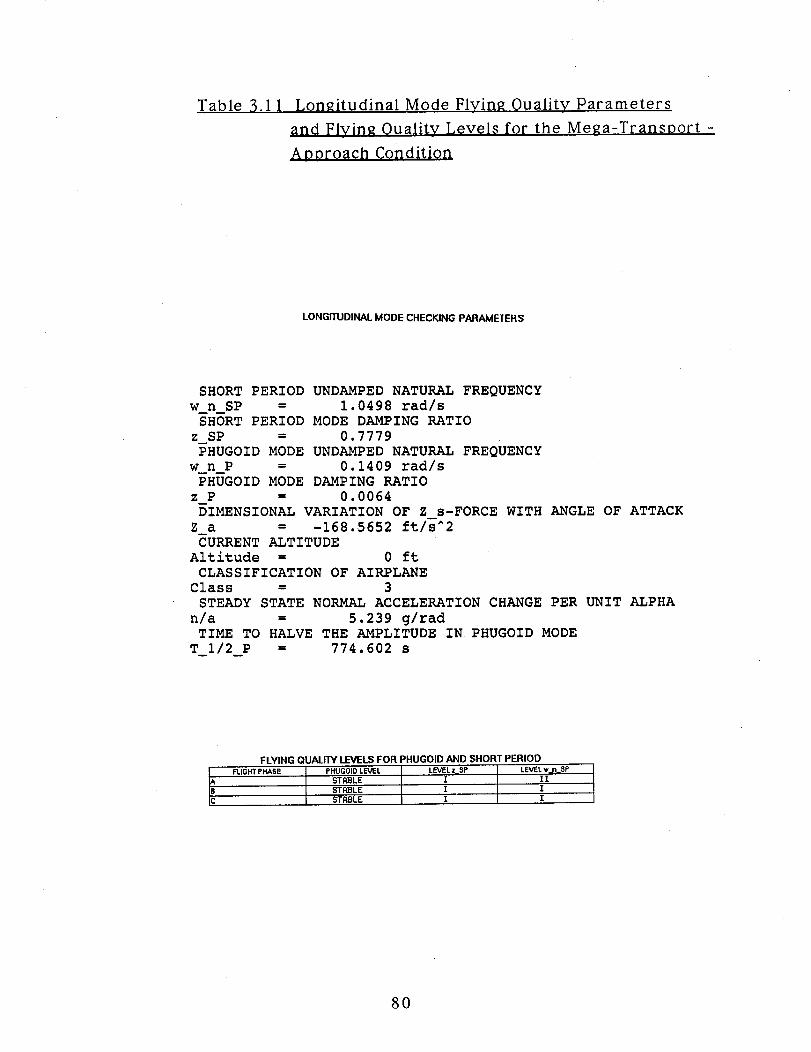
Table 3.1 1 Longitudinal Mode FIvinR Ouality Parameters
and Flvin_ Oualit_v Levels for the MeRa-Transport -
Aooroach Condition
LONGITUDINAL MODE CHECKING PARAMETERS
SHORT PERIOD UNDAMPED NATURAL FREQUENCYw n SP = 1.0498 rad/s
SHORT PERIOD MODE DAMPING RATIO
z SP = 0.7779
PHUGOID MODE UNDAMPED NATURAL FREQUENCY
w n P = 0.1409 rad/s
PHUGOID MODE DAMPING RATIO
z P = 0.0064
DIMENSIONAL VARIATION OF Z s-FORCE WITH ANGLE OF ATTACK
Z a = -168.5652 ft/s^2
CURRENT ALTITUDE
Altitude = 0 ft
CLASSIFICATION OF AIRPLANE
Class = 3
STEADY STATE NORMAL ACCELERATION CHANGE PER UNIT ALPHA
n/a = 5.239 g/rad
TIME TO HALVE THE AMPLITUDE IN PHUGOID MODE
T_1/2 P = 774.602 s
FLYING QUALITY LEVELS FOR PHUGOID AND SHORT PERIOD
FLIGHT PHASE PHUGOID LEVEL LEVEL z SP LEVEL w_n_SP
k STRBLE I IIB STABLE I I
STABLE I I
8O
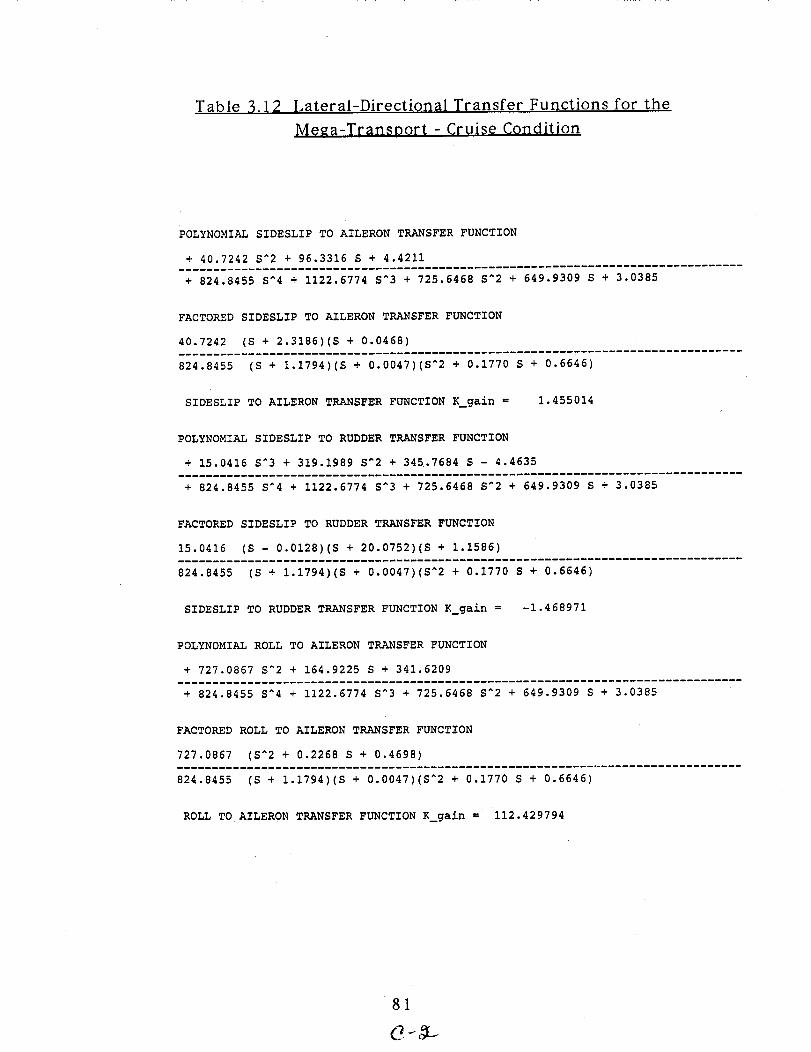
Table 3.12 Lateral-Directional Transfer Functions for the
Me_a-Transoort - Cruise Condition
POLYNOMIAL SIDESLIP TO AILERON TRANSFER FUNCTION
+ 40.7242 S^2 + 96.3316 S + 4.4211
+ 824.8455 S^4 + 1122.6774 S^3 + 725.6468 S^2 + 649.9309 S + 3.0385
FACTORED SIDESLIP TO AILERON TRANSFER FUNCTION
40.7242 (S ÷ 2.3186)(S + 0.0468)
824.8455 (S + 1.1794)(S + 0.0047)(S^2 + 0.1770 S + 0.6646)
SIDESLIP TO AILERON TRANSFER FUNCTION K_gain = 1.455014
POLYNOMIAL SIDESLIP TO RUDDER TRANSFER FUNCTION
+ 15.0416 S^3 + 319.1989 S^2 + 345.7684 S - 4.4635
+ 824.8455 S^4 + 1122.6774 S^3 + 725.6468 S^2 + 649.9309 S + 3.0385
FACTORED SIDESLIP TO RUDDER TRANSFER FUNCTION
15.0416 (S - 0.0128)(S + 20.0752)(S + 1.1586)
824.8455
SIDESLIP TO RUDDER TRANSFER FUNCTION K_gain =
POLYNOMIAL ROLL TO AILERON TRANSFER FUNCTION
+ 727.0867 S^2 + 164.9225 S + 341.6209
(S + 1.1794)(S + 0.0047)(S^2 + 0.1770 S + 0.6646)
-1.468971
+ 824.8455 S^4 + 1122.6774 S^3 + 725.6468 S^2 + 649.9309 S + 3.0385
FACTORED ROLL TO AILERON TRANSFER FUNCTION
727.0867 (S^2 + 0.2268 S + 0.4698)
824.8455 (S + 1.1794)(S + 0.0047)(S^2 + 0.1770 S + 0.6646)
ROLL TO AILERON TRANSFER FUNCTION K_gain = 112.429794
81
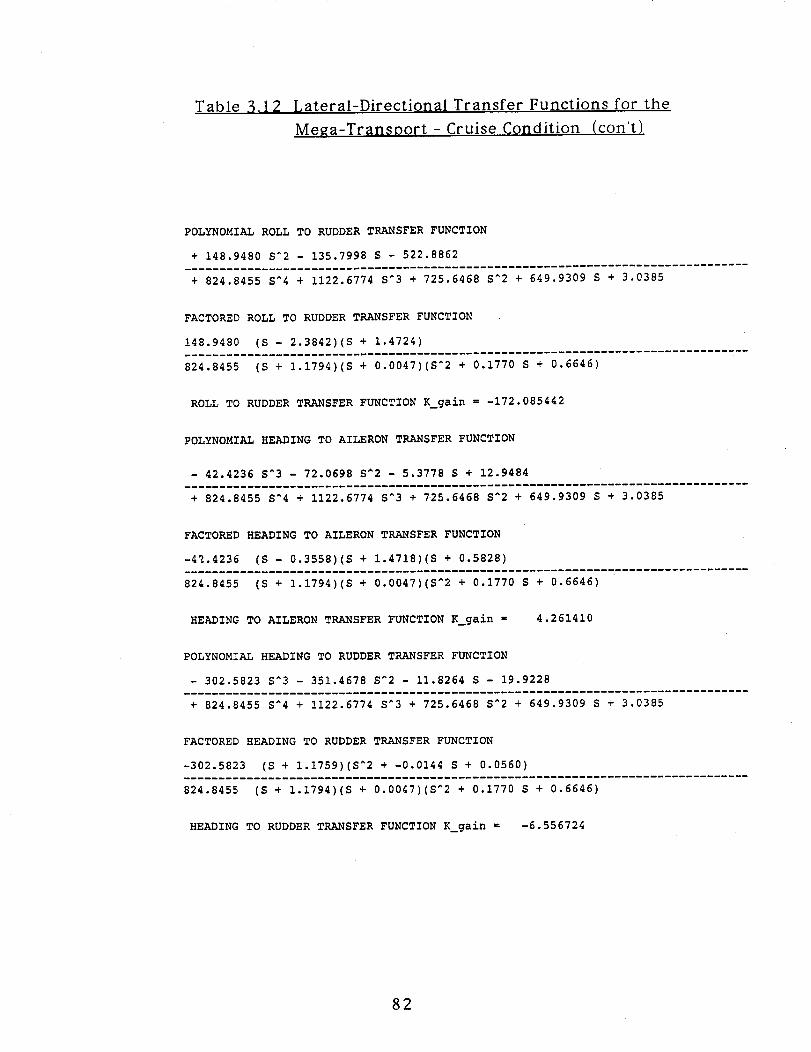
Table 3.12 Lateral-Directional Transfer Functions for the
Mega-Transport - Cruise Condition (con't)
POLYNOMIAL ROLL TO RUDDER TRANSFER FUNCTION
+ 148.9480 S^2 - 135.7998 S - 522.8862
+ 824.8455 S^4 + 1122.6774 S^3 + 725.6468 S^2 + 649.9309 S + 3.0385
FACTORED ROLL TO RUDDER TRANSFER FUNCTION
148.9480 (S - 2.3842)(S + 1.4724)
824.8455 (S + 1.1794)(S + 0.0047)(S^2 + 0.1770 S + 0.6646)
ROLL TO RUDDER TRANSFER FUNCTION K_gain = -172.085442
POLYNOMIAL HEADING TO AILERON TRANSFER FUNCTION
- 42.4236 S^3 - 72.0698 S^2 - 5.3778 S + 12.9484
+ 824.8455 S^4 + 1122.6774 S^3 + _25.6468 S^2 + 649.9309 S + 3.0385
FACTORED HEADING TO AILERON TRANSFER FUNCTION
-4_.4236 (S - 0.3558)(S + 1.4718)(S + 0.5828)
824.8455 (S + 1.1794)(S + 0.0047)(S^2 + 0.1770 S + 0.6646)
HEADING TO AILERON TRANSFER FUNCTION K_gain _ 4.261410
POLYNOMIAL HEADING TO RUDDER TRANSFER FUNCTION
- 302.5823 S^3 - 351.4678 S^2 - 11.8264 S - 19.9228
+ 824.8455 S^4 + 1122.6774 S^3 + 725.6468 S^2 + 649.9309 S + 3.0385
FACTORED HEADING TO RUDDER TRANSFER FUNCTION
-302.5823 (S + 1.1759)(S^2 + -0.0144 S + 0.0560)
824.8455 (S + 1.1794)(S + 0.0047)(S^2 + 0.1770 S + 0.6646)
HEADING TO RUDDER TRANSFER FUNCTION K_gain = -6.556724
82
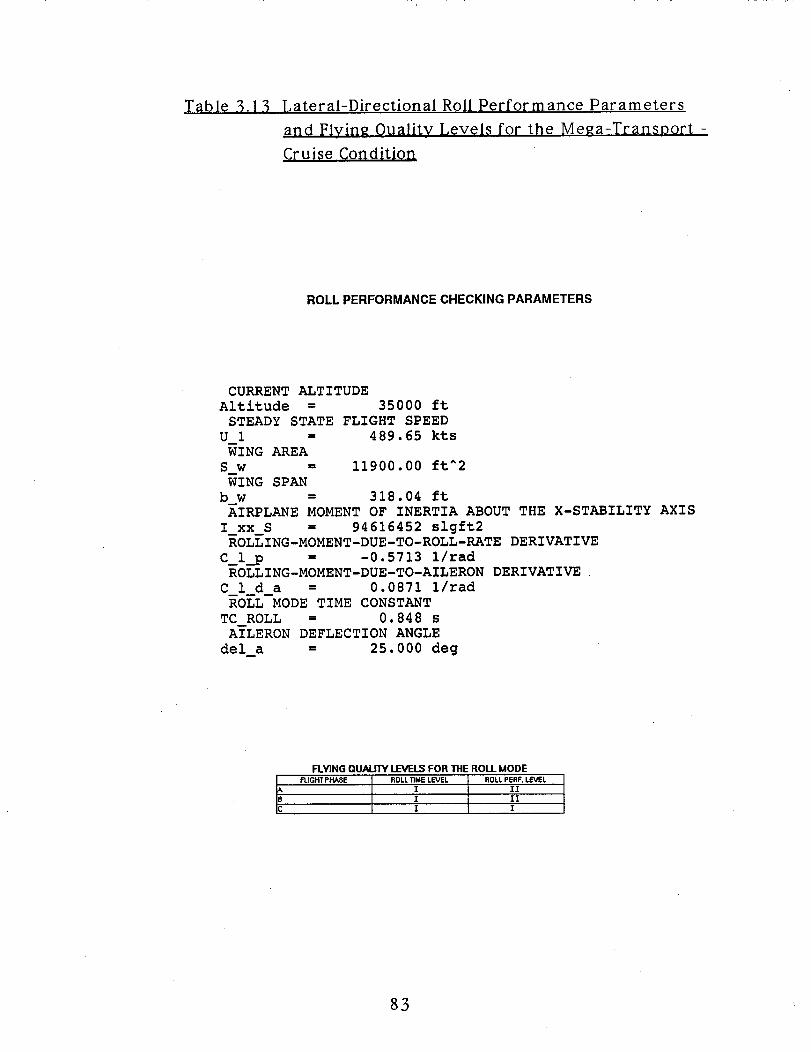
Table 3.13 Lateral-Directional Roll Performance Parameters
and Flvin_ Oualitv Levels for the Me_a-TransDort -
Crube Condition
ROLLPERFORMANCE CHECKING PARAMETERS
CURRENT ALTITUDE
Altitude = 35000 ft
STEADY STATE FLIGHT SPEEDU 1 = 489.65 kts
WING AREA
S w = 11900.00 ft^2
WING SPAN
b w = 318.04 ft
AIRPLANE MOMENT OFINERTIA ABOUT THE X-STABILITY AXIS
I xx S = 94616452 slgft2ROLLING-MOMENT-DUE-TO-ROLL-RATE DERIVATIVE
C_l_p = -0.5713 1/radROLLING-MOMENT-DUE-TO-AILERON DERIVATIVE
C 1 d a = 0.0871 1/rad
ROLL MODE TIME CONSTANT
TC ROLL = 0.848 s
A_LERON DEFLECTION ANGLE
del a = 25.000 deg
FLYINGQUALITYLEVELSFORTHEROLLMODEFLIGHTPHA$E ROLLTIME LEVEL ROLLPERF. LEVEL
I ITI IT
1"
83
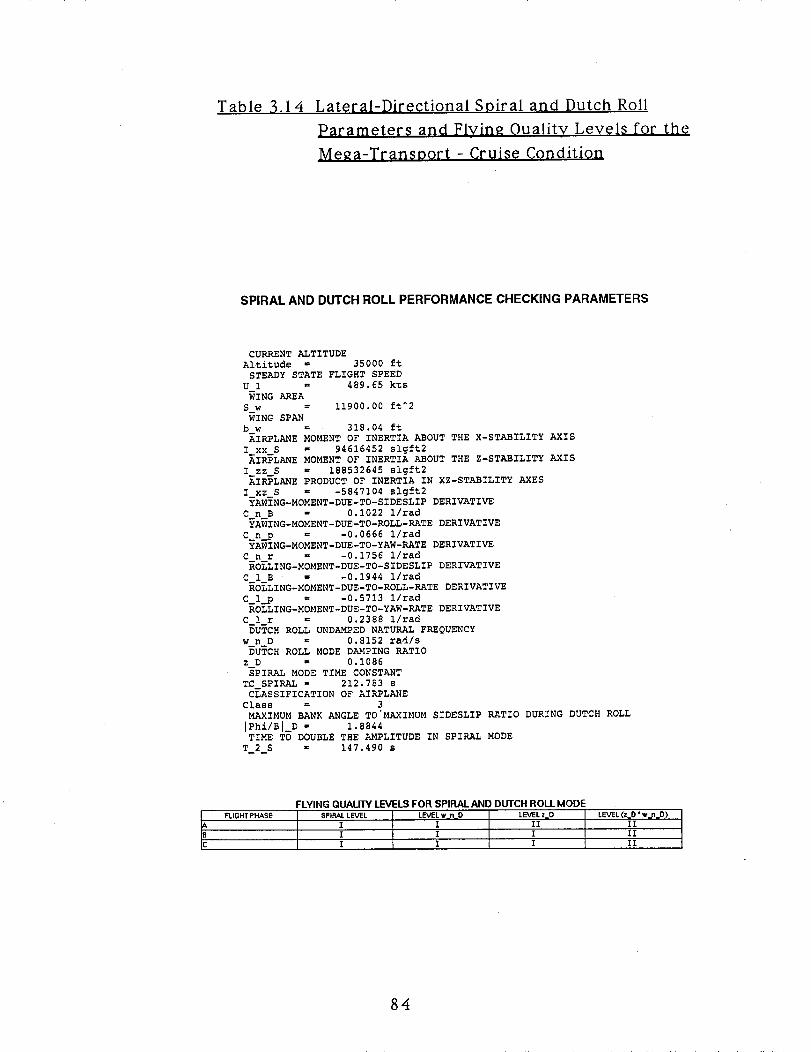
Table 3.1 4 Lateral-Directional Spiral and Dutch Roll
Parameters and Flvin_ Oualitv Levels for the
Me_a-Transoort - Cruise Condition
SPIRAL AND DUTCH ROLL PERFORMANCE CHECKING PARAMETERS
CURRENT ALTITUDE
Altitude © 35000 ft
STEADY STATE FLIGHT SPEED
U 1 = 489.65 kts
WING _EAS w = 11900.00 ft^2
WING SPAN
b w = 318.04 ft
AIRPLANE MOMENT OF INERTIA ABOUT THE X-STABILITY AXIS
I xx S = 94616452 slgft2AIRPLANE MOMENT OF INERTIA ABOUT THE Z-STABILITY AXIS
I zz S = 188532645 slgft2
AIRPLANE PRODUCT OF INERTIA IN XZ-STABILITY AXES
I xz_S = -5847104 slgft2
YAWING-MOMENT-DUE-TO-SIDESLIP DERIVATIVE
C n_B = 0 1022 1/rad
YAWING-MOMENT-DUE-TO-ROLL-RATE DERIVATIVE
C n_p = -0 0666 I/rad
YAWING-MOMENT-DUE-TO-YAW-RATE DERIVATIVE
C_n_r = -0 1756 I/rad
ROLLING-MOMENT-DUE-TO-SIDESLIP DERIVATIVE
C I_B " = -0 1944 i/rad
ROLLING-MOMENT-DUE-TO-ROLL-RATE DERIVATIVE
C_l_p = -0 5713 i/rad
ROLLING-MOMENT-DUE-TO-YAW-RATE DERIVATIVE
C_l r = 0 2388 l/tad
DUTCH ROLL UNDAMPED NATURAL FREQUENCY
w_n D = 0 8152 rad/sDUTCH ROLL MODE DAMPING RATIO
z D = 0 1086
SPIRAL MODE TIME CONSTANT
TC SPIRAL = 212.783 S
C_ASSIFICATION OF AIRPLANE
Class = 3
MAXIMUM BANK ANGLE T0'MAXIMUM SIDESLIP RATIO DURING DUTCH ROLL
)Phi/B]_D = 1.8844
TIME TO DOUBLE THE AMPLITUDE IN SPIRAL MODE
T_2_S = 147.490 s
FLIGHT PHASE
FLYING QUALITY LEVELS FOR SPIRAL AND DUTCH ROll MODE
SPIRAL LEVEL LEVELw,,.n O LEVEL z DI I II
I I I
I I I
LEVEL(z_D •w_n_D)II
II
II
84
Table 3.1 5 Lateral-Directional Transfer Functions for the
Me_a-TransDort - ADDrOach Condition
POLYNOMIAL SIDESLIP TO AILERON TRANSFER FUNCTION
+ 9.1638 S^2 + 25.3714 S + 1.0306
+ 258.1840 S^4 + 490.3246 S^3 + 235.6321 S^2 + 146.2961 S + 0.6694
FACTORED SIDESLIP TO AILERON TRANSFER FUNCTION
9.1638 (S + 2.7274)(S + 0.0412)
258.1840
SIDESLIP TO AILERON TRANSFER FUNCTION K_gain =
POLYNOMIAL SIDESLIP TO RUDDER TRANSFER FUNCTION
+ 9.8836 S^3 + 82.1551 S^2 + 107.1098 S - 6.5702
(S + 1.5451)(S + 0.0046)(S^2 + 0.3494 S + 0.3640)
1.539566
+ 258.1840 S^4 + 490.3246 S^3 + 235.6321 S^2 + 146.2961 S + 0.6694
FACTORED SIDESLIP TO RUDDER TRANSFER FUNCTION
9.8836 (S - 0.0587)(S + 6.6734)(S + 1.6975)
258.1840
SIDESLIP TO RUDDER TRANSFER FUNCTION K_gain =
POLYNOMIAL ROLL TO AILERON TRANSFER FUNCTION
+ 56.9494 S^2 + 13.0235 S + 6.7117
(S + 1.5451)(S + 0.0046)(S^2 + 0.3494 S + 0.3640)
-9.814506
+ 258.1840 S^4 + 490.3246 S^3 + 235.6321 S^2 + 146.2961 S + 0.6694
FACTORED ROLL TO AILERON TRANSFER FUNCTION
56.9494 (S^2 + 0.2287 S + 0.1179)
258.1840 (S + 1.5451)(S + 0.0046)(S^2 + 0.3494 S + 0.3640)
ROLL TO AILERON TRANSFER FUNCTION K_gain = 10.025851
85
Table 3.15 Lateral-Directional Transfer Functions for the
Me_a-Transport - Approach Condition (con't)
POLYNOMIAL ROLL TO RUDDER TRANSFER FUNCTION
+ 21.7794 S^2 - 60.1188 S - 51.6889
+ 258.1840 S^4 + 490.3246 S^3 + 235.6321 S^2 + 146.2961 S + 0.6694
FACTORED ROLL TO RUDDER TRANSFER FUNCTION
21.7794 (S - 3.4485)(S + 0.6882)
258.1840 (S + 1.5451)(S + 0.0046)(S^2 + 0.3494 S + 0.3640)
ROLL TO RUDDER TRANSFER FUNCTION K_gain = -77.212545
POLYNOMIAL HEADING TO AILERON TRANSFER FUNCTION
- 9.5908 S^3 - 19.7949 S^2 - 1.5449 S + 0.7599
+ 258.1840 S^4 + 490.3246 S^3 + 235.6321 S^2 + 146.2961 S + 0.6694
FACTORED HEADING TO AILERON TRANSFER FUNCTION
-9.5908 (S - 0.1561)(S + 1.9612)(S + 0.2588)
258.1840
HEADING TO AILERON TRANSFER FUNCTION K_gain =
POLYNOMIAL HEADING TO RUDDER TRANSFER FUNCTION
- 66.2688 S^3 - 105.1347 S^2 - 3.7830 S - 5.9391
(S + 1.5451)(S + 0.0046)(S^2 + 0.3494 S + 0.3640)
1.135098
+ 258.1840 S^4 + 490.3246 S^3 + 235.6321 S^2 + 146.2961 S + 0.6694
FACTORED HEADING TO RUDDER TRANSFER FUNCTION
-66.2688 (S + 1.5861)(S^2 + 0.0004 S + 0.0565)
258.1840 (S + 1.5451)(S + 0.0046)(S^2 + 0.3494 S + 0.3640)
HEADING TO RUDDER TRANSFER FUNCTION K_gain = -8.871804
86
Table 3.16 Lateral-Directional Roll Performance Parameters
and FIying Quality Levels for the Me_a-Transport -
APproach Condition
ROLL PERFORMANCE CHECKING PARAMETERS
CURRENT ALTITUDE
Altitude = 0 ft
STEADY STATE FLIGHT SPEED
U 1 = 156.00 kts
WING AREA
S w = 11900.00 ft^2
WING SPAN
b w = 318.04 ftAIRPLANE MOMENT OF INERTIA ABOUT THE X-STABILITY AXIS
I xx S = 76622459 slgft2ROLLING-MOMENT-DUE-TO-ROLL-RATE DERIVATIVE
C_l_p = -0.6233 i/radROLLING-MOMENT-DUE-TO-AILERON DERIVATIVE
C 1 d a = 0.0525 1/rad
ROLL MODE TIME CONSTANT
TC ROLL = 0.647 s
AILERON DEFLECTION ANGLE
del_a = 25.000 deg
FLYINGQUALITYLEVELSFORTHEROLLMODEFLIGHT PHASE ROLL TIME LEVEL ROLL PERF. LEVEL
l BELOW LEVEL IIl
I BELOW LEVEL III
I BELOW LEVEL III
87
Table 3.17 Lateral-Directional Spiral and Dutch Roll
Parameters and Flying Quality Levels for the
Mega-Transport - Approach Condition
SPIRAL AND DUTCH ROLL PERFORMANCE CHECKING PARAMETERS
CURRENT ALTITUDE
Altitude - 0 ft
STEADY STATE FLIGHT SPEED
U 1 = 156.00 kts
WING AREA
S w = 11900.00 ft^2
WING SPAN
b w = 318.04 ft
AIRPLANE MOMENT OF INERTIA ABOUT THE X-STABILITY AXIS
I xx S = 76622459 slgft2
AIRPLANE MOMENT OF INERTIA ABOUT THE Z-STABILITY AXIS
I zz S - 144443543 slgft2
AIRPLANE PRODUCT OF INERTIA IN XZ-STAEILITY AXES
I xz S = -14662220 slgft2
YAWING-MOMENT-DUE-TO-SIDESLIP DERIVATIVE
C n B = 0.0758 i/rad
_AWING-MOMENT-DUE-TO-ROLL-RATE DERIVATIVE
C_n__p = -0.1784 i/rad
YAWING-MOMENT-DUE-TO-YAW-RATE DERIVATIVE
C n r = -0.1604 i/rad
ROLLING-MOMENT-DUE-TO-SIDESLIP DERIVATIVE
C 1 B = -0.1887 1/rad
RO_LING-MOMENT-DUE-TO-ROLL-RATE DERIVATIVE
C_l_p = -0.6233 I/rad
ROLLING-MOMENT-DUE-TO-YAW-RATE DERIVATIVE
C l_r = 0.3473 i/rad
DUTCH ROLL UNDAMPED NATURAL FREQUENCY
w_n_D = 0.6034 rad/s
DUTCH ROLL MODE DAMPING RATIO
z D = 0.2896
SPIRAL MODE TIME CONSTANT
TC SPIRAL = 216.929 s
CLASSIFICATION OF AIRPLANE
Class = 3
MAXIMUM BANK ANGLE TO MAXIMUM SIDESLIP RATIO DURING DUTCH ROLL
IPhi/Bl_D = 0.9439TIME TO DOUBLE THE AMPLITUDE IN SPIRAL MODE
T_2_S - 150.364 s
FLYING QUALITY LEVELS FOR SPIRAL AND DUTCH ROLL MODE
FLIGHT PHASE SPIRAL LEVEL LE_Lw_DI
LEVEL z DII
I I I I
." I I I I
LEVEL (z_O "w_n_D)II
88
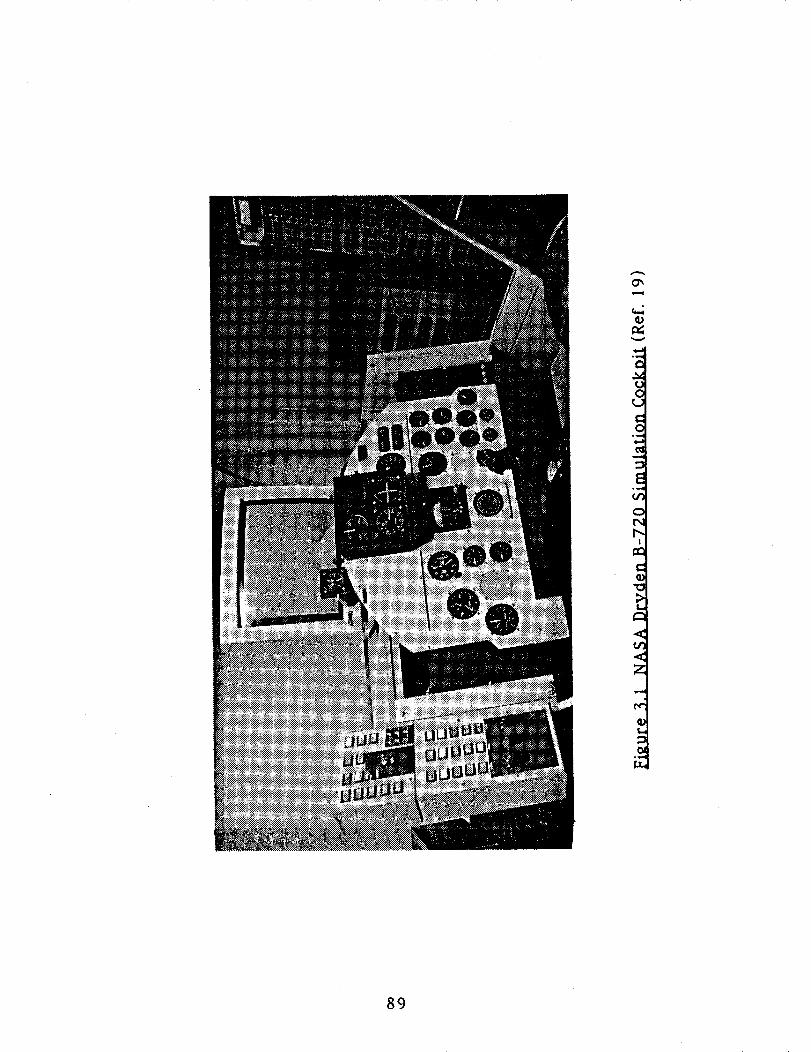
a_Vm_
c_
ow
m
Eo_
C
Z
_d
89
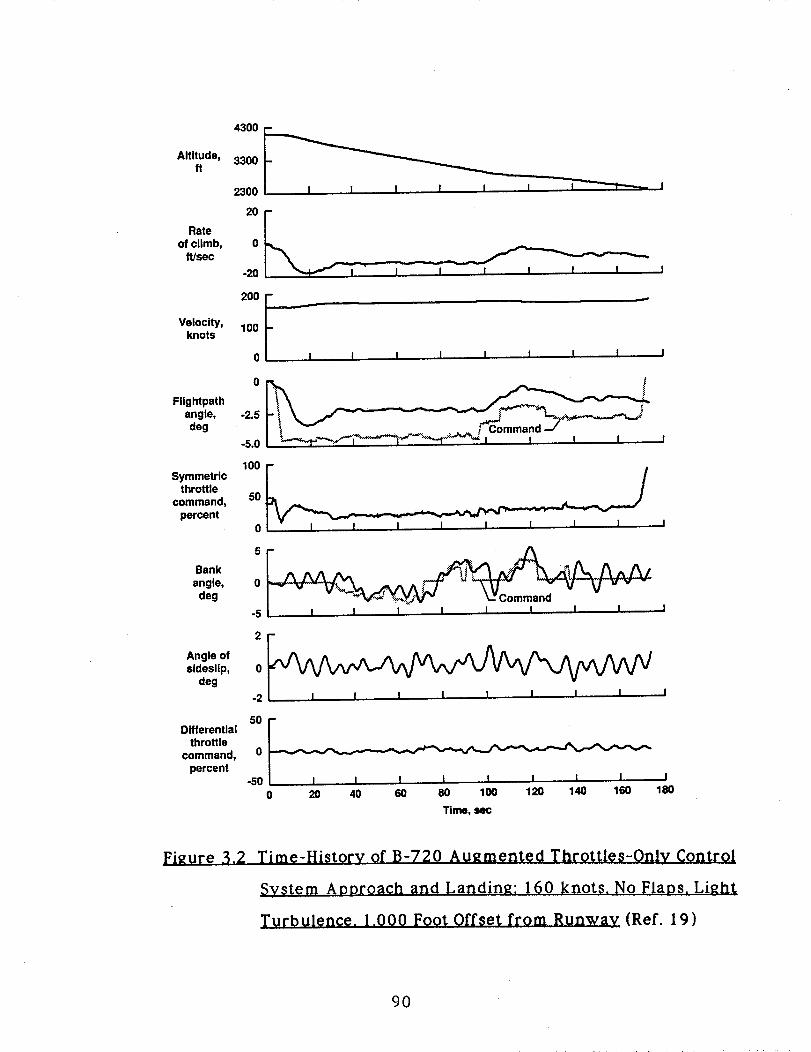
Altitude,ff
Rateof climb,
ft/sec
4300_
3300
2300
0
Velocity,knots '°°I100
0 I I I I I I I I I
Fiightpathangle,deg
-2.5
-5.0
Symmetricthrottle
command,percent
100
O
angle, 0deg
-5 I I I I I I I I
Angle of 2 r^_ ^/_ ^ A/_/_t ,j_ AA^/_ A .,, /_^ /_ j
sideslip, 0deg
-2
Differential 50
throttlecommand, 0
percent-50 I
0 20 40 60 80 100 120 140 160 180
Time,
Figure 3.2 Time-History of B-720 Augmented Throttles-Only Control
System Approach and Lar)din_: 160 knots. No FlaDs. Light
Turbulence. 1.000 Foot Offset from Runway (Ref. 19)
90
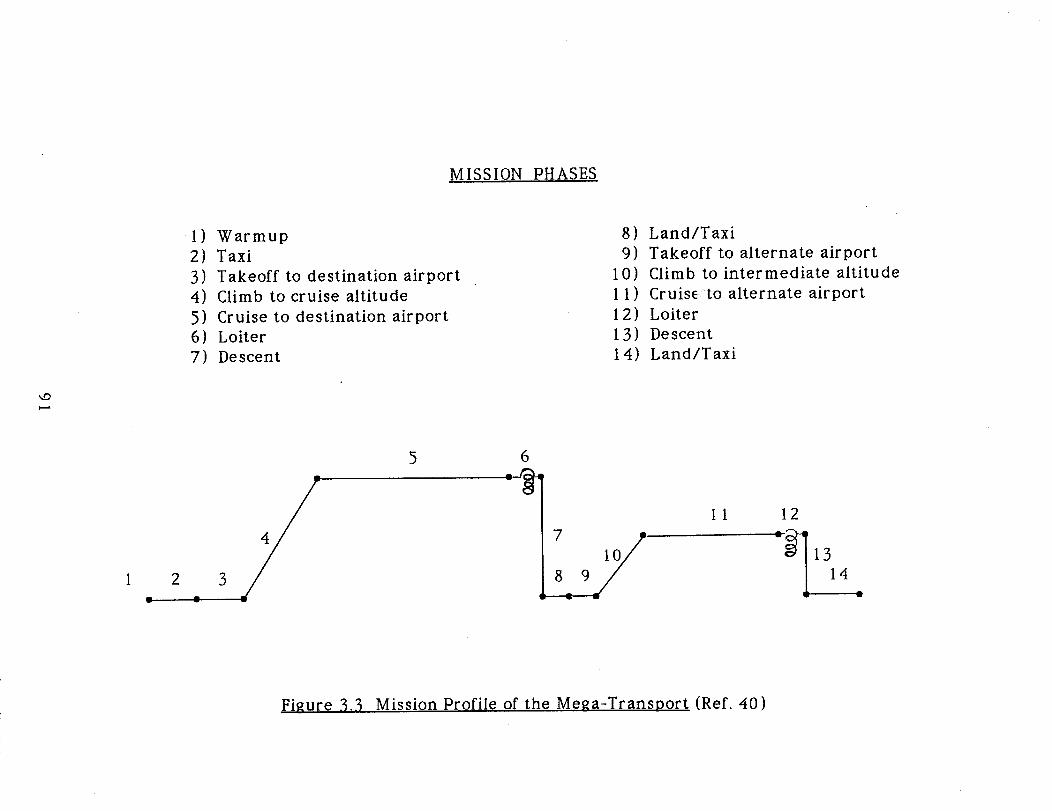
MISSION PHASES
I ) Warmup
2) Taxi
3) Takeoff to destination airport
4) Climb to cruise altitude
5) Cruise to destination airport
6) Loiter
7) Descent
8) Land/Taxi
9) Takeoff to alternate airport
10) Climb to intermediate altitude
I I) Cruis_ to alternate airport
12) Loiter
13) Descent
14) Land/Taxi
)===_
2
5 6
7 O/I
8 9__.L/
II 12
13
14
Figure 3.3 Mission Profile of the Me_a-Transport (Ref. 40)
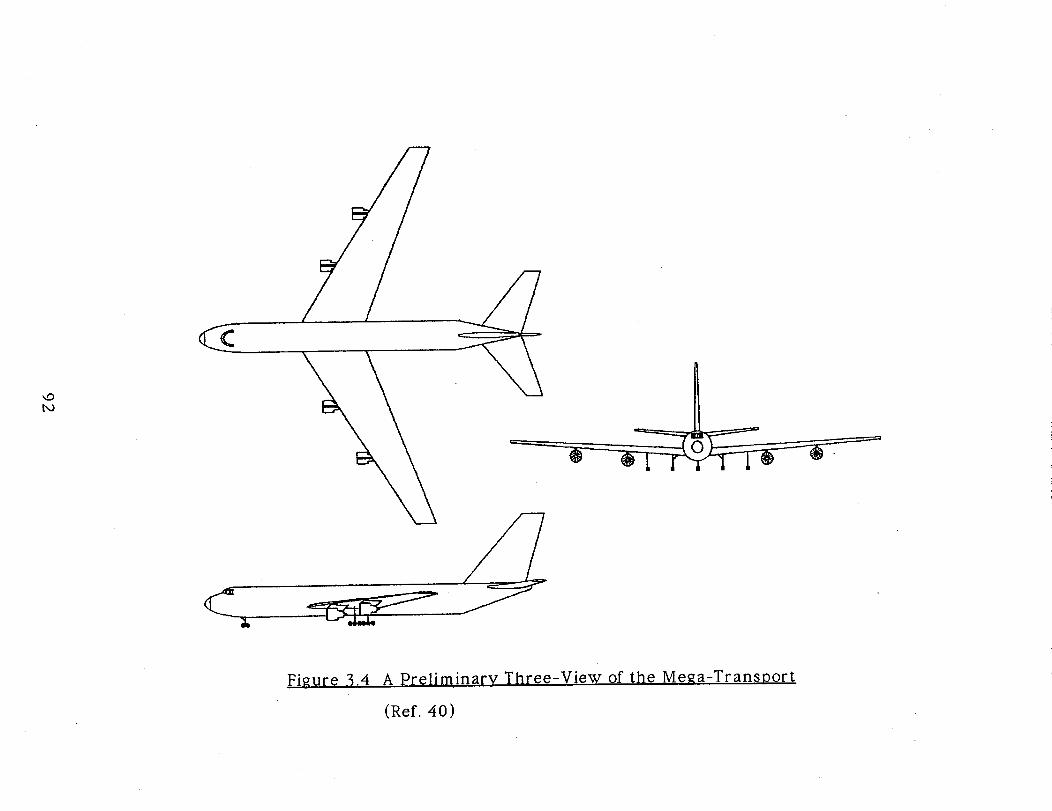
/
Figure 3.4 A preliminary Three-View of the Mega-Transport
(Ref. 40)
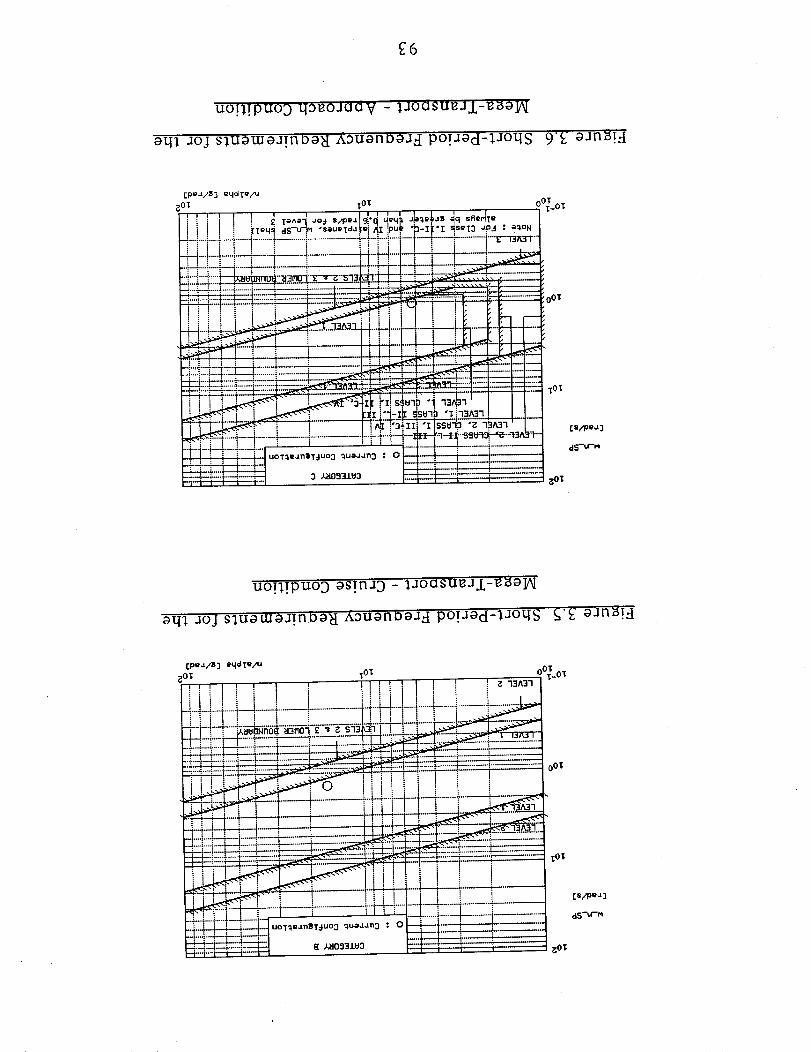
E6
uo!l!puo_ qo_oJaav - _joasug.sJ-gBg_
aql Jo] sluawaJ!nbg_ R::)uBnDg.J_ po!Jgd-lJoqs 9"E aJnm!d
uo!1!puoD as!nJD - 1.soasugJX-e;_a_
aql JOJ SIT_a_aJT.noa_ _iouanDaJ._ po!_ad-_Joqs S'E a-mB!d
gOT
1
-4.--4_---4---
- '--'---l---'__..:
I 1 1
II I I :• ' ,i---
[pe_/33 eCld "(e/uTOT
i i i !.... ................................. !_._'.-.-_-- ---.- _--f_ -'_ _"_'__au_no¢ a_m'_ _ • _ sns ]. .... L_.L_ _ --___r-v-"-___ : ....L--._........_ _ _--_._ ---_--_--'_'---'_--'...... ,'-T-- .... ,'___.._l_ _- --- _ _
.....__ ; =e_ = ---_---__ I--I.... _
: __ .L4 ........ ,---' ........... _--:,,--_._._,_'__
i I i I i _,,_-_ra_
--_ ....__+ .... f....... ..._- a-- -.--_._..._,'.__ =:. _-....... _- ____
"i _" llli I I _ '-A___." ", II i i I ! i i '
li. iii i _ i' I .__1 :'__ -_.'-4--4----L"_, ........ "....... .'9---"r -----i ........ ! i i I I'-__----1 i i i .....[ .....
| .... o T_.. JTI, T_UO_ __.___ ! !i Ii
--T- i i
005
TO'_
_OT
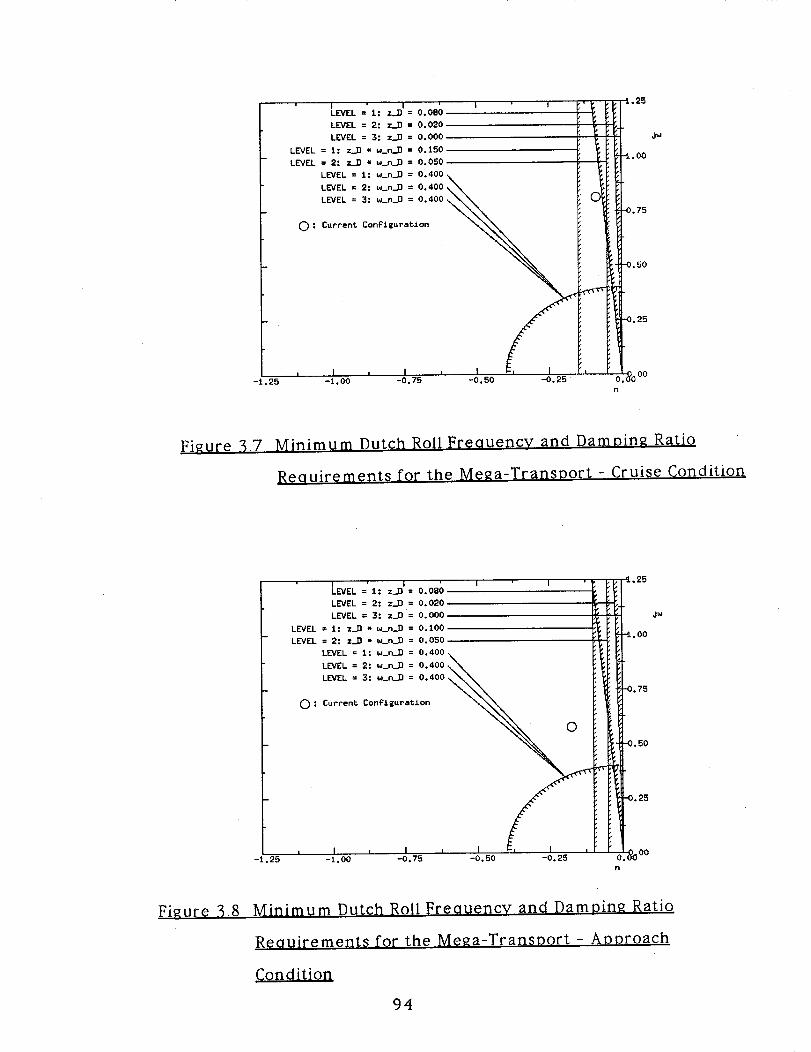
-1.25
ILEVEL =' t : z_,D I = 0.080
LEVEL = 2: z_D = 0.020
LEVEL = 3: z..D = 0.000
LEVEL = 1: z..D * w_n..O = 0.150
LEVEL = 2: z_D * w_n_,D = 0°050
LEVEL = 1: w_n..D = 0.400
LEVEL 2" w_n_D 0.400
LEVEL 3: w_n..,D 0.400
O : Current ConFiguration
, I , I )-1.00 -0.75
I I
-0 o50 -0.25
_ 1.25
_: ,
I " ;_.oo;
0.75
i 0.50h_
0.25
) 0.000 O0
n
Jw
Figure 3.7 Minimum Dutch Roll FreQuency and Dampin_ Ratio
Requirements for the MeRa-Transport - Cruise Condition
-i.25
, ='1: = o l , ' " _LEVEL z_D = 0.08
LEVEL = 2: z..O = 0.020 EL
LEVEL = 3: z.,D = 0o000
= 1: z_I) * u_n_]_ = 0.100
= 2: z._D * w_n_ = 0.050
LEVEL = 1: w_r'L.JJ= 0.400\
LEVEL 2: w_n_D = 0.400 \_
LEVEL 3: w_n.=D = 0.400_
0 " Current ConFiguration
, I , I ,
.... jld
LEVEL -t. 00LEVEL
-1.25 -1. O0 -0.75 -0.50 -0.25
0.75
:'_I 0.500.25
0"_)0 O0
n
Figure 3.8 Minimum Dutch Rot! FreQuency and Dampine Ratio
Requirements for the MeRa-Transport - Approach
Condition
94
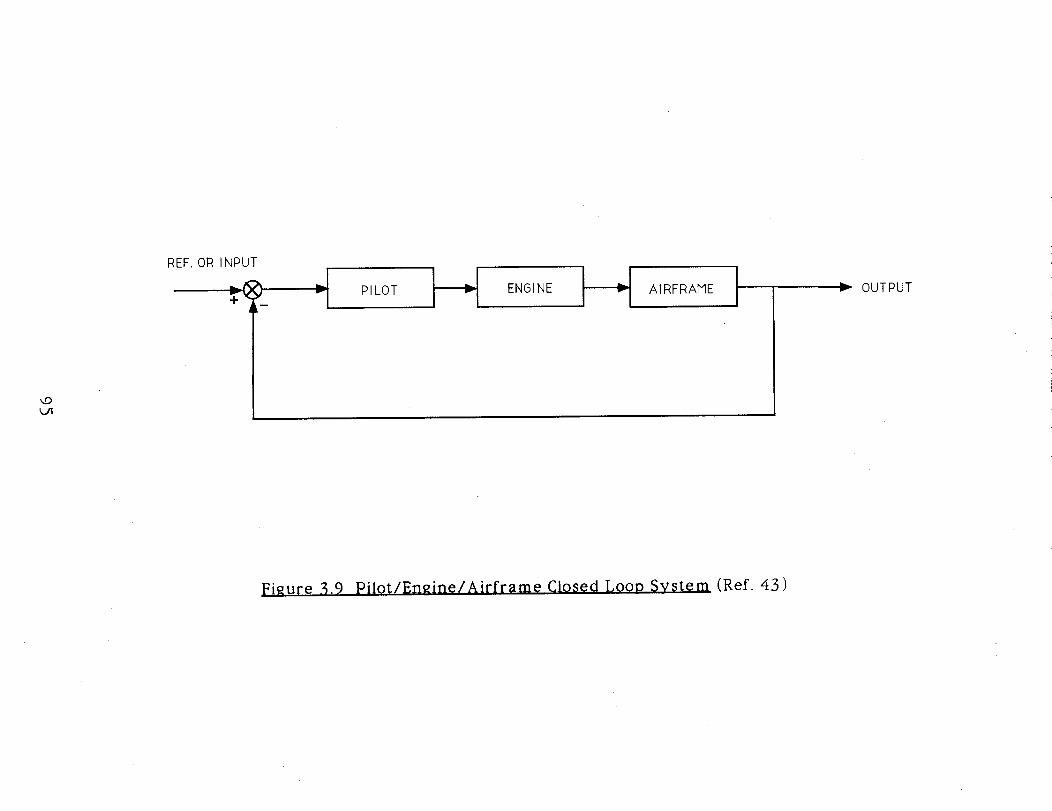
k_
REF. OR INPUT
PILOT _1_ ENGINE AIRFRAME v OUTPUT
Figure 3.9 Pilot/Engine/Airframe Closed Loop System (Ref. 43)
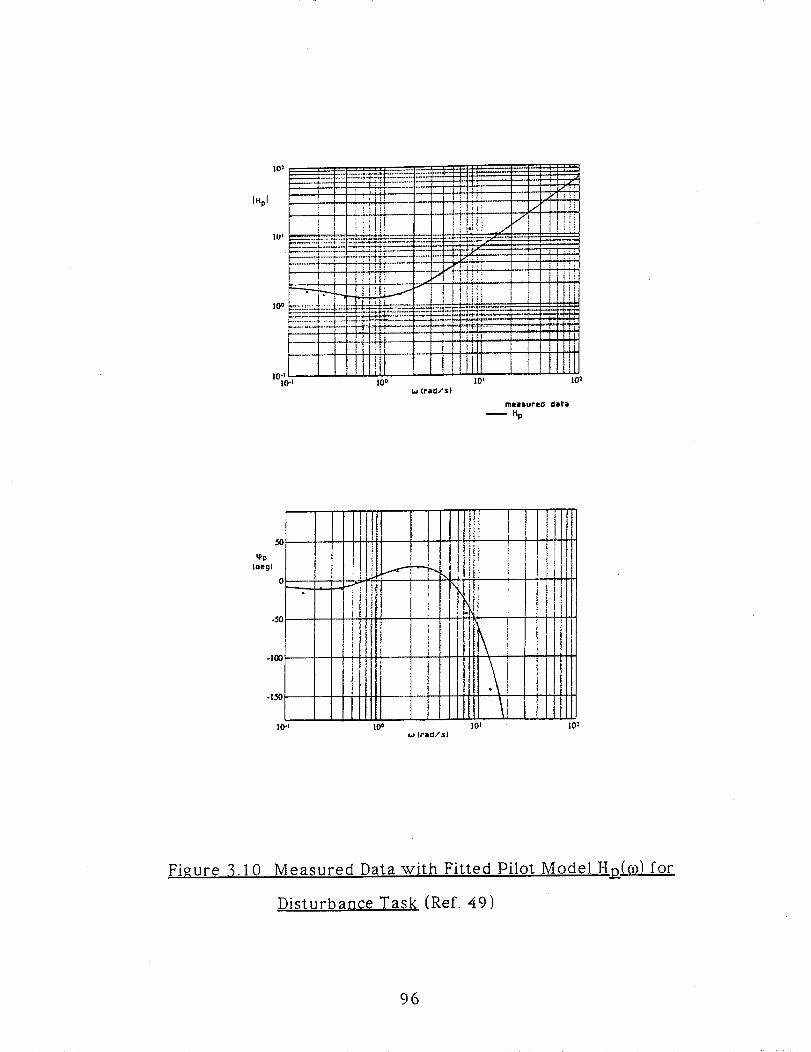
IHpl
102
IUl
10 o
10-1!0 d
__ l_ L.L=:+_::::-- I _! =---i ' i i i ii
) _i_, i!{ ! ..........I I i ii!U
10 o I01 lO _w (racl/s)
mo.lsured CIIIta
Hp
lO-]
t Itl t _ I[t
tllilil i,,, IllIIIitl ] _i I tl
I0 o I01 10 lw IraII/s}
Figure 3.10 Measured Data with Fitted Pilot Model H]2(c0) for
Disturbance Task (Ref. 49)
96
CHAPTER 4
i • National Transportation Safety Board, Aircraft Accident Report,
PB90-910406, NTSB/AAR-90/06, United Airlines Flight 232,
McDonnell-Douglas DC-I 0-I 0, Sioux Gateway Airport, Sioux City,
Iowa, July 19, 1989.
, Hughes, David, and Michael A. Dornheim, United DC-10 Crashes m
Sioux City, Iowa, Aviation Week & Space Technology : Vol. 13 I, No.
4, 96 - 97, July 24, 1989.
, Ott, James, Probe Focuses on Failure of Fan Disk in DC-10 Crash,
Aviation Week & Space Technology : Vol. 13 I, No. 5, 30 - 3 I, July
31, 1989.
. Ott, James, Investigators Find Reconstructed Tail of DC-10 Riddled
with Damage, Aviation Week & Space Technology : Vol. 13 I, No.
6, 22 - 23, August 7, 1989.
° Taylor, J.W.R., Jane's All the World's Aircraft, Jane's Information
Group, Sentinel House, 163 Brighton Rd., Coulsdon, Surrey, CR5
2NH, UK, 1984- 1985.
6. Lacagnina, Mark, Locked Controls at 37,000 Feet in a DC-10,
Aviation Safety : Vol. XI, No. 7, 4 - 6, April I, 199 I.
97
° Burcham, F., Jr., C. Fullerton, G. Gilyard, T. Wolf, and J. Stewart, "A
Preliminary Investigation of the Use of Throttles for Emergency
Flight Control", NASA TM-4320, 199 I.
° Dornheim, Michael A., NASA Develops Software to Control Aircraft
With Throttles Alone, Aviation Week & Space Technology " Vol.
134, No. 25, 42, June 24, 1991.
. Gilyard, Glenn B., Joseph L. Conley, Jeanette L. Le, and Frank W.
Burcham, Jr., "A Simul_tion Evaluation of a Four-Engine Jet
Transport Using Engine Thrust Modulation for Flightpath Control",
NASA TM-4324, September 199 I.
I0. Lenorovitz, Jeffrey M., Airb us Survey Confirm s Require men t For
Very Large Transport Aircraft, Aviation Week & Space
Technology Vol. 135, No. 18, 34 - 35, October 28, 1991.
11. Boeing Seeking Carrier Input In Planning New Large Aircraft,
Aviation Week & Space Technology • Vol. 136, No. i, 20 - 22,
January 6, 1992.
12. Various Cross Sections Evaluated for Large Transport,
Aviation Week & Space Technology Vol. 136, No. 8, 35,
February 24, 1992.
13. Mass-Transporter, Flight International" Vol. 141, No. 4312, 22 -
28, I -7 April, 1992.
98
14. Smith, Bruce A., Douglas Plans Shorter, Double-Deck MD-12,
Aviation Week & Space Technology : Vol. 136, No. 15, 18 - 19,
April 13, 1992.
15. Smith, Bruce A., Large Transport Could Mark New Era for Douglas
Aircraft, Aviation Week & Space Technology : Vol. 136, No. 18,
22 - 24, May 4, 1992.
16. Sparaco, Pierre, Airbus Pursues 600-Seat UHCA Program,
Aviation Week & Space Technology : Vol. 137, No. 1 I, 39 - 41,
September 14, 1992.
17. Roskam, Jan, Proposal to NASA Ames Research Center, Moffett
Field, California, for Design, Analysis and Control of Large
Transports so that Control of Engine Thrust Can be Used as a
Back-up of the Primary Flight Controls, University of Kansas,
Department of Aerospace Engineering, April 1992.
18. Burcham, Frank W. Jr. and C. Gorden Fullerton, "Controlling
Crippled Aircraft - With Throttles", NASA TM-104238, 199 I.
19. Burcham, Frank W., Jr., Trindel Maine, and Thomas Wolf, "Flight
Testing and Simulation of an F-15 Airplane Using Throttles for
Flight Control", NASA TM-I04255, August 1992.
20. NTSB Probes DC-10 Cargo Door Devices, Aviation Week & Space
Technology : Vol. 96, No. 25, 23, June 19, 1972.
99
2 I. Cargo Door Focus of Paris Crash Study, Aviation Week & Space
Technology : Vol. I00, No. I0, 198 - 199, March 1 Ii 1974.
22. DC-10 Evidence Points to Cargo Door, Aviation Week & Space
Technolo__v : Vol. 100, No. 13, 26 - 27, April I, 1974.
23. C-5 Crash Cause Sought, Aviation Week & S)_ace Technolo_¥ : Vol.
102, No. 15, 18, April 14, 1975.
24. Internal memo at NASA Dryden Flight Research Facility,
Edwards, California, from Bill Burcham concerning C-5 loss of
flight control, May 29, 1992.
25. McMahan, Jack, Flight 1080, Air Line Pilot, July 1978.
26. Japan Orders Checks of 747 Tail Sections After JAL Crash,
Aviatjo_ Week and Space Technology : Vol. 123, No. 7, 30,
August 19, 1985.
27. JAL Crash Inquiry Team Examining Damage in Aft Pressure
Bulkhead, Aviation Week and Space Technology : Vol. 123, No. 8,
28 - 30, August 26, 1985.
28. JAL Crash Investigators Set to Transfer Wreckage, Aviation
Week and Space Technology : Vol. 123, No. 9, 33, September 2,
1985.
I00
29. Inquiry Committee Analyzes JAL 747 Flight Data Recorder,
Aviation Week and Space Technolo_¥ : Vol. 123, No. i 0, 97,
September 9, 1985.
30. 747 Inquiry Team Examines Repaired Bulkhead Replicas,
Aviatior) Week and Space Technology : Vol. 123, No. 1 i, 3 i,
September 16, 1985.
3 I. Limited Repairs to Follow 747 Bulkhead Review, Aviation Week
and Space Technology : Vol. 123, No. 12, 28, September 23, 1985.
32. Roskam, Jan, Airplane Flight Dynamics and Automatic Flight
Controls : Part I. Roskam Aviation and Engineering Corporation,
120 East Ninth, Suite 2, Lawrence, Kansas, Second Printing, 1982.
33. NASA Dryden Flight Research Facility F-15 Simulation Data
34. Taylor, J.W.R., Jane's All the World's Aircraft, Jane's Information
Group, Sentinel House, 163 Brighton Rd., Coulsdon, Surrey, CR5
2NH, UK, 1991 - 1992.
35. Propulsion Controlled Aircraft (PCA) MD-I I Simulator
Demonstration briefing at Douglas Aircraft Company, Long Beach,
California, August 6, 1992.
36. Internal memo at NASA Dryden Flight Research Facility,
Edwards, California, from Bill Burcham concerning MD-I I, Ship
I01
506, Flight 51, September 13, 1992.
37. MIL-F-8785C (USAF), Military Specification - Flying Qualities of
Piloted Airplanes, November 5, 1980.
38. Horton, Timothy W. and Robert W. Kempel, "Flight Test
Experience and Controlled Impact of a Remotely Piloted Jet
Transport Aircraft", NASA TM-4084, November 1988.
39. Advanced Aircraft Analysis Computer Program, Version 1.4,
Design, Analysis and Research Corporation, 120 East Ninth St.,
Suite 2, Lawrence, Kansas, 66044, 1993.
40. Gerren, Donna S., Mission Weight Sizing, Takeoff Weight
Sensitivities, and Performance Constraint Analysis for the Mega-
Transport, University of Kansas/Dryden Flight Research Facility,
September 1992.
41. FAR 12 I, Certification and Operations :Domestic, Flag, and
Supplemental Air Carriers and Commercial Operators of Large
Aircraft, Federal Aviation Agency, Washington, D.C.,May 198 I.
42. Walsh, K., "Summary of the Effects of Engine Throttle Response
on Airplane Formation-Flying Qualities", AIAA-92-3318, July
1992.
102
43. Roskam, Jan, Airplane Flight Dynamics and Automatic Flight
Controls : Part II. Roskam Aviation and Engineering Corporation,
120 East Ninth, Suite 2, Lawrence, Kansas, First Printing, 1979.
44. Bauerfeind, Klaus, "Some General Topics in the Field of Engine
Handling", AGARD Conference Proceedings No. 324 - Engine
Handling, Paper No. I, October 11 - 14, 1982.
45. Koff, Bernard L., "Designing For Fighter Engine Transients",
AGARD Conference Proceedings No. 324 - Engine Handling,
Paper No. 2, October II - 14, 1982.
46. Patterson, Grant T., "Techniques For Determining Engine Stall
Recovery Characteristics", AGARD Conference Proceedings No.
324 - Engine Handling, Paper No. 28, October 11 - 14, 1982.
47. McRuer, Duane, Dunstan Graham, Ezra Krendel, and William
Reisener, Jr., "Human Pilot Dynamics in Compensatory Systems -
Theory, Models, and Experiments with Controlled Element and
Forcing Function Variations", AFFDL-TR-65- 15, July 1965.
48. Torenbeek, E., "Development and Application of a
Comprehensive, Design-Sensitive Weight Prediction Method for
Wing Structures of Transport Category Aircraft", Report LR-
693, Delft University Press, Delft, The Netherlands, September
1992.
103

49. Van der Vaart, Johannes C., "Modelling of Perception and Action
in Compensatory Manual Control Tasks", Delft University Press,
Delft, The Netherlands, 1992.
I04