Embed Size (px)
Citation preview
Desert Tortoise Translocation Plan for Fort Irwin’s Land Expansion Program at the U. S. Army National Training Center (NTC) & Fort Irwin
Prepared for
U.S. Army National Training Center, Directorate of Public Works
Prepared by:
Todd C. Esque, Kenneth E. Nussear, and Philip A. Medica
United States Geological Survey, Western Ecological Research Center Las Vegas Field Office
160 N Stephanie St. Henderson NV, 89074
In collaboration with: Thomas Leuteritz, Paul Burgess, Frank Davenport, Nathan Strout, Redlands Institute Jill Heaton, and Rich Inman, University of Nevada Reno Kristin H. Berry, United States Geological Survey, Western Ecological Research Center Neil Lynn, ITS Corporation Michael Burroughs, United States Fish and Wildlife Service
29 July 2005
Ft Irwin Translocation Plan. ii
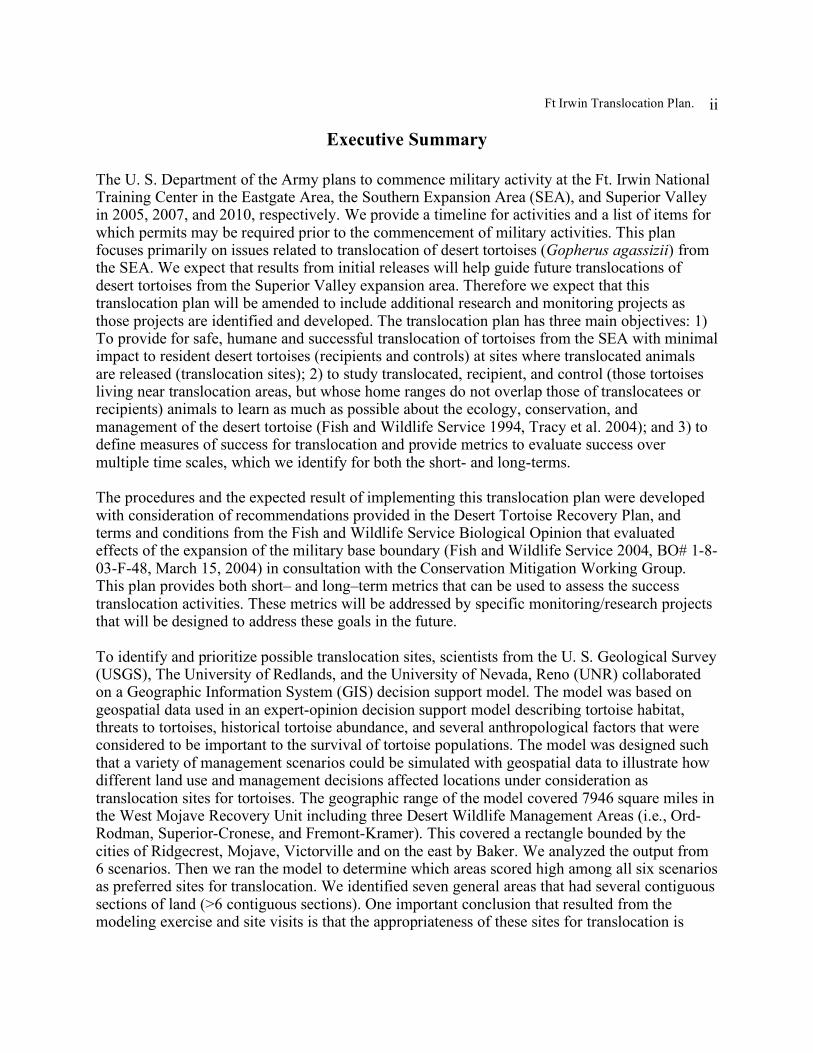
Executive Summary
The U. S. Department of the Army plans to commence military activity at the Ft. Irwin National Training Center in the Eastgate Area, the Southern Expansion Area (SEA), and Superior Valley in 2005, 2007, and 2010, respectively. We provide a timeline for activities and a list of items for which permits may be required prior to the commencement of military activities. This plan focuses primarily on issues related to translocation of desert tortoises (Gopherus agassizii) from the SEA. We expect that results from initial releases will help guide future translocations of desert tortoises from the Superior Valley expansion area. Therefore we expect that this translocation plan will be amended to include additional research and monitoring projects as those projects are identified and developed. The translocation plan has three main objectives: 1) To provide for safe, humane and successful translocation of tortoises from the SEA with minimal impact to resident desert tortoises (recipients and controls) at sites where translocated animals are released (translocation sites); 2) to study translocated, recipient, and control (those tortoises living near translocation areas, but whose home ranges do not overlap those of translocatees or recipients) animals to learn as much as possible about the ecology, conservation, and management of the desert tortoise (Fish and Wildlife Service 1994, Tracy et al. 2004); and 3) to define measures of success for translocation and provide metrics to evaluate success over multiple time scales, which we identify for both the short- and long-terms. The procedures and the expected result of implementing this translocation plan were developed with consideration of recommendations provided in the Desert Tortoise Recovery Plan, and terms and conditions from the Fish and Wildlife Service Biological Opinion that evaluated effects of the expansion of the military base boundary (Fish and Wildlife Service 2004, BO# 1-8-03-F-48, March 15, 2004) in consultation with the Conservation Mitigation Working Group. This plan provides both short– and long–term metrics that can be used to assess the success translocation activities. These metrics will be addressed by specific monitoring/research projects that will be designed to address these goals in the future. To identify and prioritize possible translocation sites, scientists from the U. S. Geological Survey (USGS), The University of Redlands, and the University of Nevada, Reno (UNR) collaborated on a Geographic Information System (GIS) decision support model. The model was based on geospatial data used in an expert-opinion decision support model describing tortoise habitat, threats to tortoises, historical tortoise abundance, and several anthropological factors that were considered to be important to the survival of tortoise populations. The model was designed such that a variety of management scenarios could be simulated with geospatial data to illustrate how different land use and management decisions affected locations under consideration as translocation sites for tortoises. The geographic range of the model covered 7946 square miles in the West Mojave Recovery Unit including three Desert Wildlife Management Areas (i.e., Ord-Rodman, Superior-Cronese, and Fremont-Kramer). This covered a rectangle bounded by the cities of Ridgecrest, Mojave, Victorville and on the east by Baker. We analyzed the output from 6 scenarios. Then we ran the model to determine which areas scored high among all six scenarios as preferred sites for translocation. We identified seven general areas that had several contiguous sections of land (>6 contiguous sections). One important conclusion that resulted from the modeling exercise and site visits is that the appropriateness of these sites for translocation is
Ft Irwin Translocation Plan. iii
highly influenced by whether or not Interstate-15 and other high traffic roads are fenced with tortoise proof fencing. We provide guidance on appropriate translocation timing and procedures, and aspects of tortoise ecology and the habitat that should be studied. Most of the research identified by this plan was recommended by the Desert Tortoise Recovery Plan (Fish and Wildlife Service 1994). Desert tortoises found to be infected with Mycoplasma spp. (i.e., clinical sign and/or ELISA positive) may be used in research programs under strict guidelines and will be contained in quarantine facilities outside of Desert Wildlife Management Areas (DWMAs). The general translocation area where desert tortoises in the SEA are moved to will be surveyed for the presence, distribution, health status of, and habitat use by resident tortoises. A portion of the residents will be monitored as controls and to document any effects of translocation on resident populations.
Ft Irwin Translocation Plan. iv
Acknowledgements
Guidance on this plan was provided by the Conservation Mitigation Working Group: Becky Jones and Glenn Black - California Department of Fish and Game; Charles Sullivan, Becki Gonzales, Roxie Trost – Bureau of Land Management; Ray Bransfield, Doug Threloff, and Roy Averill-Murray – US Fish and Wildlife Service; David Delaney and Larry Pater – CERL, Priscilla Kernek, Kimberley Rainey, Anthony Rekas, Neil Lynn, Mickey Quillman and Ray Marler – Department of the Army. Earlier drafts of this manuscript benefited from discussions and comments from Kristin Berry, Julie Yee, Karen Philips – USGS, Mary Cablk - Desert Research Institute and Alice Karl, Jill Heaton – UNR, Larry Pater and David Delaney – ERDC/CERL, and the members of the Conservation Mitigation Working Group listed above. Peer reviews were provided by R. Ashton, J. (Diemer) Berish, D. Focardi, J. W. Gibbons, B. Henen, G. Goodlett, K. Nagy, M. Vaughn, R. Woodard, and 2 anonymous reviewers. We thank Lisa Benvenuti at the Redlands Institute, who created most of the maps used in this document.
Ft Irwin Translocation Plan. v
Table of Contents
EXECUTIVE SUMMARY ...............................................................................................................................................II
ACKNOWLEDGEMENTS ............................................................................................................................................ IV
I. INTRODUCTION ...........................................................................................................................................................1
II. TRANSLOCATION PLAN – GENERAL.................................................................................................................3
DESCRIPTION OF EXPANSION AREAS ...............................................................................................................................3 Southern Expansion Area ...........................................................................................................................................5 Superior Valley............................................................................................................................................................5
SELECTION OF PROSPECTIVE TRANSLOCATION SITES.....................................................................................................6 Model Input Parameters .............................................................................................................................................7 Decision Scenarios....................................................................................................................................................11 Site Visit by Conservation Mitigation Working Group...........................................................................................13 Proposed Translocation Sites...................................................................................................................................14
III. CLEARANCE PROCEDURES FOR THE SEA ..................................................................................................18
TIMING OF CLEARANCES ................................................................................................................................................18 RESEARCH AND DEVELOPMENT OF CLEARANCE METHODS.........................................................................................18 SEA CLEARANCE TEAMS ...............................................................................................................................................18
Tortoise Procedures ..................................................................................................................................................19 Health screening and disposition of ELISA positive tortoises ...............................................................................19 Clearance of Subadult and Smaller Tortoises.........................................................................................................21
V. TRANSLOCATION PROCEDURES ......................................................................................................................22
DISPOSITION OF DESERT TORTOISES FROM THE SEA...................................................................................................22 TRANSLOCATION DENSITIES ..........................................................................................................................................22 PROTECTION OF TRANSLOCATION SITES .......................................................................................................................23 TRANSLOCATION PROCEDURES......................................................................................................................................23 DETERMINING WHEN DESERT TORTOISES WOULD BE MOVED ACROSS THE SOUTHERN BOUNDARY FENCE ................25
VI. MONITORING FOR SHORT AND LONG TERM SUCCESS AND THE ASSESSMENT OF THREATS..............................................................................................................................................................................................26
SHORT TERM METRICS OF SUCCESS ..............................................................................................................................28 Growth rates ..............................................................................................................................................................28 Movements, site fidelity, and home range considerations......................................................................................29 Survival rates.............................................................................................................................................................30 Stress ..........................................................................................................................................................................31 Incidence of Disease .................................................................................................................................................32 Egg production ..........................................................................................................................................................32 Nest success ...............................................................................................................................................................33 Recruitment................................................................................................................................................................33 Nutrition of tortoises .................................................................................................................................................33 Behavior and Social interactions .............................................................................................................................34 Demography ..............................................................................................................................................................35
LONG TERM METRICS OF SUCCESS..................................................................................................................................35 Survivorship...............................................................................................................................................................35 Demographics............................................................................................................................................................36 Genetics .....................................................................................................................................................................37
TRANSLOCATION OF TORTOISES INTO DIE-OFF AREAS.................................................................................................37 Predation ...................................................................................................................................................................38 Roads/habitat fragmentation and human impacts ..................................................................................................39 Invasive species and fire ...........................................................................................................................................39
Ft Irwin Translocation Plan. vi
VII. SITE CHARACTERIZATION OF THE EXPANSION AREAS AND TRANSLOCATION SITES ........40
HABITAT VARIABLES AND MODELS ..............................................................................................................................40 LAND USE AND SURFACE DISTURBANCES.....................................................................................................................41
VIII. PERMIT ITEMS .....................................................................................................................................................42
X. TIME LINE OF ACTIVITIES ..................................................................................................................................43
FALL 2004 .......................................................................................................................................................................43 SPRING 2005....................................................................................................................................................................43 FALL 2005 .......................................................................................................................................................................43 SPRING 2006....................................................................................................................................................................43 FALL 2006 .......................................................................................................................................................................43 SPRING 2007....................................................................................................................................................................43 JULY 2007 .......................................................................................................................................................................43 FALL 2007 AND BEYOND ................................................................................................................................................43 2010.................................................................................................................................................................................44
XI. LITERATURE CITED..............................................................................................................................................45
APPENDIX 1. GUIDANCE ON TRANSLOCATIONS PROVIDED BY THE DESERT TORTOISE RECOVERY PLAN..........................................................................................................................................................55
GUIDELINE 1....................................................................................................................................................................55 GUIDELINE 2....................................................................................................................................................................56 GUIDELINE 3....................................................................................................................................................................56 GUIDELINE 4....................................................................................................................................................................57 GUIDELINE 5....................................................................................................................................................................57 GUIDELINE 6....................................................................................................................................................................57 GUIDELINE 7....................................................................................................................................................................58 LITERATURE CITED.........................................................................................................................................................58
APPENDIX 2. MINIMUM REQUIREMENTS FOR THE TRANSLOCATION PLAN ESTABLISHED IN THE BIOLOGICAL OPINION......................................................................................................................................60
A. THE METHODS USED TO COLLECT, HOLD, TRANSPORT, AND RELEASE TORTOISES AT TRANSLOCATION (RECIPIENT) SITES. ..........................................................................................................................................................60 B. A PROCEDURE ON HOW TO DETERMINE APPROPRIATE TRANSLOCATION SITES. ......................................................60 C. THE PERSONNEL WHO WOULD BE INVOLVED IN THE MECHANICS AND RESEARCH MONITORING RELATED TO TRANSLOCATION. ............................................................................................................................................................60 D. THE PROCEDURES FOR DETERMINING THE HEALTH OF THE DESERT TORTOISES AND FOR THE DISPOSITION OF UNHEALTHY ANIMALS. ...................................................................................................................................................61 E. THE METHODS THAT WILL BE USED TO MANAGE AND PROTECT THE TRANSLOCATION SITES. ................................61 F. A METHOD OF DETERMINING WHEN DESERT TORTOISES WOULD BE MOVED ACROSS THE SOUTHERN BOUNDARY
FENCE OR TO A MORE DISTANT TRANSLOCATION SITE. .................................................................................................61 G. A DESCRIPTION OF ANY RADIO TRANSMITTERS, DATA RECORDERS AND PIT TAGS THAT MAY BE USED...............61
APPENDIX 3. DETAILED DESCRIPTION OF THE DECISION SUPPORT MODEL....................................62
BASE DATA .....................................................................................................................................................................62 CRITERIA .........................................................................................................................................................................63 MODEL WEIGHTING........................................................................................................................................................97 SCENARIOS ......................................................................................................................................................................98
APPENDIX 4. PHOTOS OF PROSPECTIVE TRANSLOCATION AREAS .....................................................107
SITE A............................................................................................................................................................................107 SITE B ............................................................................................................................................................................108 SITE C ............................................................................................................................................................................109 SITE D............................................................................................................................................................................110 SITE F ............................................................................................................................................................................111
Ft Irwin Translocation Plan. vii
APPENDIX 5. ELISA POSITIVE AND JUVENILE DESERT TORTOISE PLAN...........................................112
INTRODUCTION..............................................................................................................................................................113 ELISA POSITIVE DESERT TORTOISES..........................................................................................................................113 JUVENILE DESERT TORTOISES......................................................................................................................................115 LITERATURE CITED.......................................................................................................................................................118
APPENDIX 6. DESIGN OF DESERT TORTOISE PROOF FENCING ..............................................................119
FENCE CONSTRUCTION.........................................................................................................................................119 Materials ..................................................................................................................................................................119 Retrofitting Existing Livestock Fence ....................................................................................................................119 New Fence Construction.........................................................................................................................................120
INSPECTION OF DESERT TORTOISE BARRIERS .............................................................................................120 MAINTENANCE AND REPAIR OF DESERT TORTOISE BARRIERS.............................................................121
Ft Irwin Translocation Plan. 1
I. Introduction
When properly implemented, translocation may provide a valuable tool that can be used to minimize direct impacts to tortoises, augment natural population, or to repatriate otherwise suitable areas that have experienced local extirpations and assist in recovery (Fish and Wildlife Service 2004, Field 1999, Nussear 2004). Translocation activities also provide a forum for collecting monitoring data to determine if desert tortoises respond in a manner predicted by resource managers, and an opportunity to conduct research that yields new data that can be used to manage the species in a proactive manner. Recent research on translocation in Nevada and Utah indicated that translocated tortoises had similar levels of mortality compared to resident tortoises, and that translocated females produced similar numbers of eggs compared to resident females (Nussear 2004). Translocated tortoises in these studies initially moved further than resident animals, but adopted similar movement patterns with increased site fidelity (comparable to that of resident tortoises) after one or two activity seasons (Field 1999, Nussear 2004). Furthermore, there appeared to be no adverse effects on the resident populations into which tortoises were translocated as measured by survivorship, reproductive output, and movement patterns of residents (Nussear 2004). Thus in the short-term (3 years), translocation was deemed by the authors of these studies to be a successful solution for the disposition of displaced tortoises. However, there are still many aspects of the responses of tortoises to translocation (both translocatees and resident animals) that have not been addressed quantitatively, and warrant further investigation. For example (but not exclusively), the physiological stresses imposed on translocated and resident tortoises have not been documented and the fate of tortoises translocated into areas where natural populations have experienced significant declines (due to unknown causes) has not been investigated. The success of translocation is typically taken to be the ability of the translocated or augmented population to become self-sustaining in the long-term (Griffith et al. 1989, Dodd and Seigel 1991, Fischer and Lindenmayer 2000). Success, however, may be measured at several temporal scales, each of which may be important precursors to judging the long-term success of a translocation program (Tasse 1989, Dickinson and Fa 2000, Fischer and Lindenmayer 2000). In the short-term (3-5 years) there may be many goals used to judge the success of a translocation program. For example, there may be some level of mortality above which a translocation study is judged to be unsuccessful (Platenberg and Griffiths 1999), it may be required that a particular release site is adopted by the translocated population (Lohoefener and Lohmeier 1986, Diemer 1984) and demonstrated by levels of site fidelity, or that the translocated animals integrate into the social structure of the existing population (Berry 1986, Reinert 1991), and translocated animals may be expected to find mates and reproduce (Berry 1986, Pedrono and Sarovy 2000). Because the desert tortoise is a long lived species, the success of translocations must be measured over longer periods (e.g., 15 – 20 years) than the time frame of most experiments. The long-term success of translocation cannot necessarily be gauged by the same metrics typically measured in the short-term, although the evaluation of long-term success includes the success of the short-term goals. Beginning in the spring of 2005, resident tortoises will be monitored throughout the greater translocation area. This will

Ft Irwin Translocation Plan. 2
include residents that live within translocation sites (hereafter referred to as recipients) and tortoises that live throughout the area but whose movements do not overlap with translocatees or recipients (hereafter referred to as controls). Detailed descriptions of what will be monitored are provided below. Long-term monitoring will involve return surveys to the areas where translocation occurred to assess the status of the translocated population and residents (i.e., recipients and controls) at several time intervals. This assessment may be achieved using one or more of several different measures. For example, one might compare the survivorship of translocated and resident animals that remain at the site, and the demographics and size (age) structure of the translocated population over time relative to control populations. The assessment of long-term success will benefit from genetic analyses to reveal the relative contributions of translocated animals to future generations of tortoises in the recipient population. Detecting these contributions requires some degree of genetic differentiation between the translocated animals and the recipient population in order to differentiate between them initially. This differentiation will likely be at the level of private alleles, rather than broad scale genetic differences. Whatever methods are invoked, the ultimate goal of such monitoring would be to document if the translocation and subsequent management of the translocated population resulted in self-sustaining and healthy populations of desert tortoises. Although this may be an unrealistic goal with current environmental and habitat conditions and subsequently declining tortoise populations. The ultimate measure of success for this translocation plan is the assimilation of the translocated tortoises into the recipient population. Long-term monitoring to assess this goal will include monitoring of the resident and translocated tortoises in the augmented populations and control populations over several time scales (Berry 1986, Dodd and Seigel 1991, Nussear 2004) including months, years and decades. Sufficient funding will be allocated to complete the requisite monitoring over a period of at least two decades. In addition to those measures of success already discussed, the questions of what role translocation plays in relation to a net loss of habitat and whether or not there is a net gain of desert tortoises such that populations are “bolstered” are relevant questions for which there are no easy answers. The only guaranteed benefit of this translocation is the knowledge gained that can help manage these populations more successfully in the future. Although we expect a high likelihood of success as defined in this document, it is prudent to be prepared for contingencies that have the potential to compromise the status of the translocated, resident, or control desert tortoises. The simplest scenario might be to consider a site where the tortoise population has been locally extirpated of unknown causes. To simply repatriate translocated tortoises to that site without consideration of the original cause of mortality and furthermore to expect the population to flourish seems unreasonable. In this case success would be either for the population to maintain itself, or if it declined to determine the cause of declines such that they could be remedied. Placing translocated tortoise within an existing population creates an even more complicated situation. Since populations are generally declining, the question becomes are they declining in relation to the reduced availability of required and limited resources caused by increased competition, or are they declining due to some other form of disturbance.
Ft Irwin Translocation Plan. 3
II. Translocation Plan – General
Description of Expansion Areas
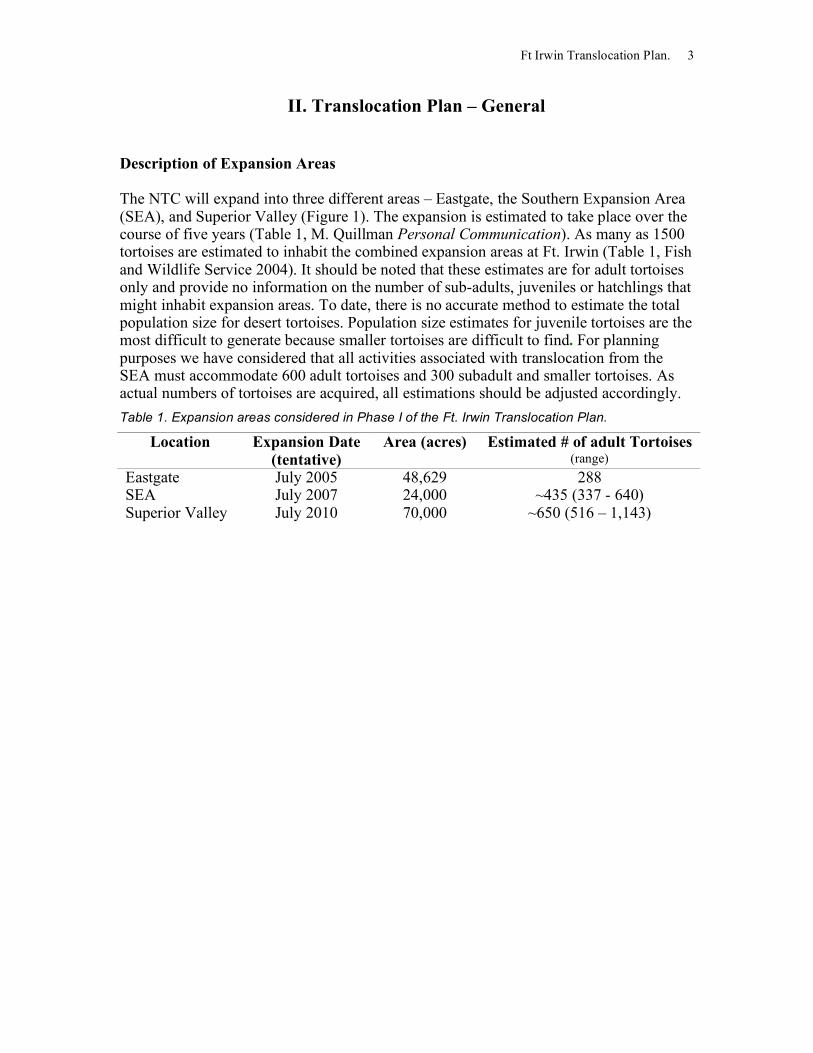
The NTC will expand into three different areas – Eastgate, the Southern Expansion Area (SEA), and Superior Valley (Figure 1). The expansion is estimated to take place over the course of five years (Table 1, M. Quillman Personal Communication). As many as 1500 tortoises are estimated to inhabit the combined expansion areas at Ft. Irwin (Table 1, Fish and Wildlife Service 2004). It should be noted that these estimates are for adult tortoises only and provide no information on the number of sub-adults, juveniles or hatchlings that might inhabit expansion areas. To date, there is no accurate method to estimate the total population size for desert tortoises. Population size estimates for juvenile tortoises are the most difficult to generate because smaller tortoises are difficult to find. For planning purposes we have considered that all activities associated with translocation from the SEA must accommodate 600 adult tortoises and 300 subadult and smaller tortoises. As actual numbers of tortoises are acquired, all estimations should be adjusted accordingly.
Table 1. Expansion areas considered in Phase I of the Ft. Irwin Translocation Plan.
Location Expansion Date (tentative)
Area (acres) Estimated # of adult Tortoises (range)
Eastgate July 2005 48,629 288 SEA July 2007 24,000 ~435 (337 - 640) Superior Valley July 2010 70,000 ~650 (516 – 1,143)

Ft Irwin Translocation Plan. 4
Figure 1. Fort Irwin and the proposed Eastgate, Southern, and Superior Valley expansion areas
Eastgate - Expansion is scheduled to occur in the Eastgate area (Figure 1) by July of 2005. The Fish and Wildlife Service Biological Opinion (2004:4-26) stated “The Eastgate parcel has low to very low tortoise densities” and did not require that tortoises be translocated from this area prior to expansion (Fish and Wildlife Service 2004, pg 46).
Ft Irwin Translocation Plan. 5
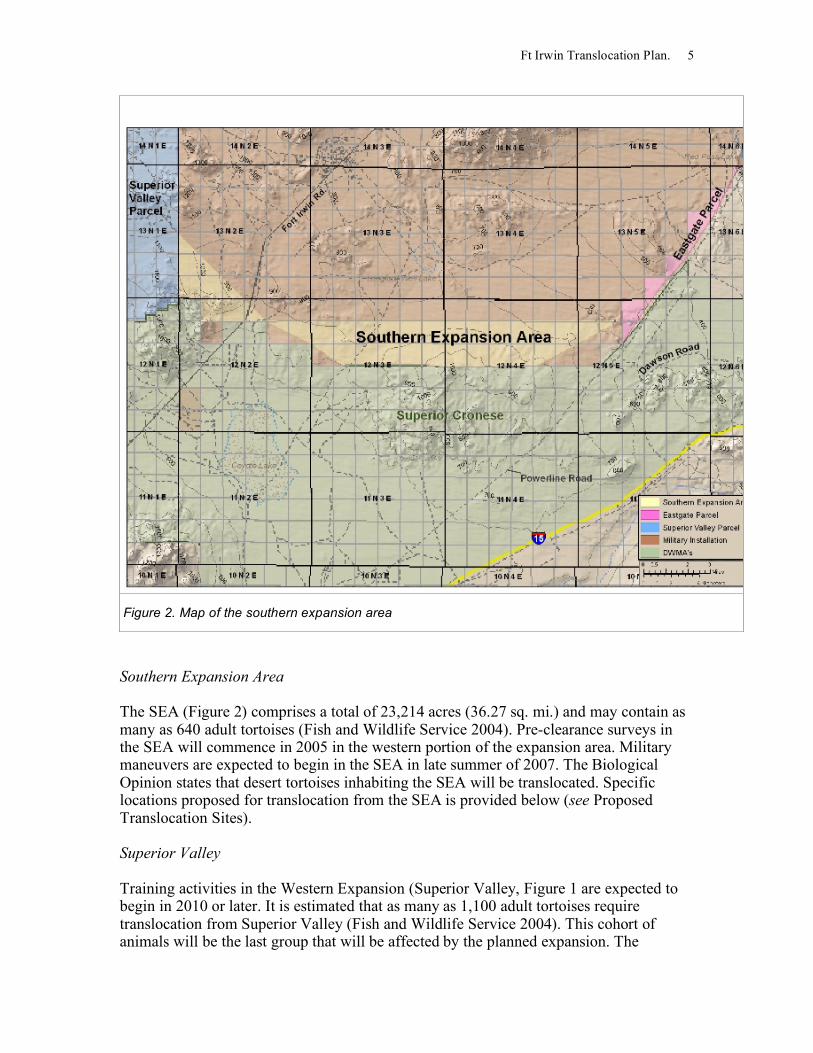
Figure 2. Map of the southern expansion area
Southern Expansion Area
The SEA (Figure 2) comprises a total of 23,214 acres (36.27 sq. mi.) and may contain as many as 640 adult tortoises (Fish and Wildlife Service 2004). Pre-clearance surveys in the SEA will commence in 2005 in the western portion of the expansion area. Military maneuvers are expected to begin in the SEA in late summer of 2007. The Biological Opinion states that desert tortoises inhabiting the SEA will be translocated. Specific locations proposed for translocation from the SEA is provided below (see Proposed Translocation Sites). Superior Valley
Training activities in the Western Expansion (Superior Valley, Figure 1 are expected to begin in 2010 or later. It is estimated that as many as 1,100 adult tortoises require translocation from Superior Valley (Fish and Wildlife Service 2004). This cohort of animals will be the last group that will be affected by the planned expansion. The

Ft Irwin Translocation Plan. 6
research findings from the studies on animals translocated from the SEA will be used to provide insight into the best ways to incorporate the Superior Valley animals into future conservation/recovery/ research activities. Selection of Prospective Translocation Sites
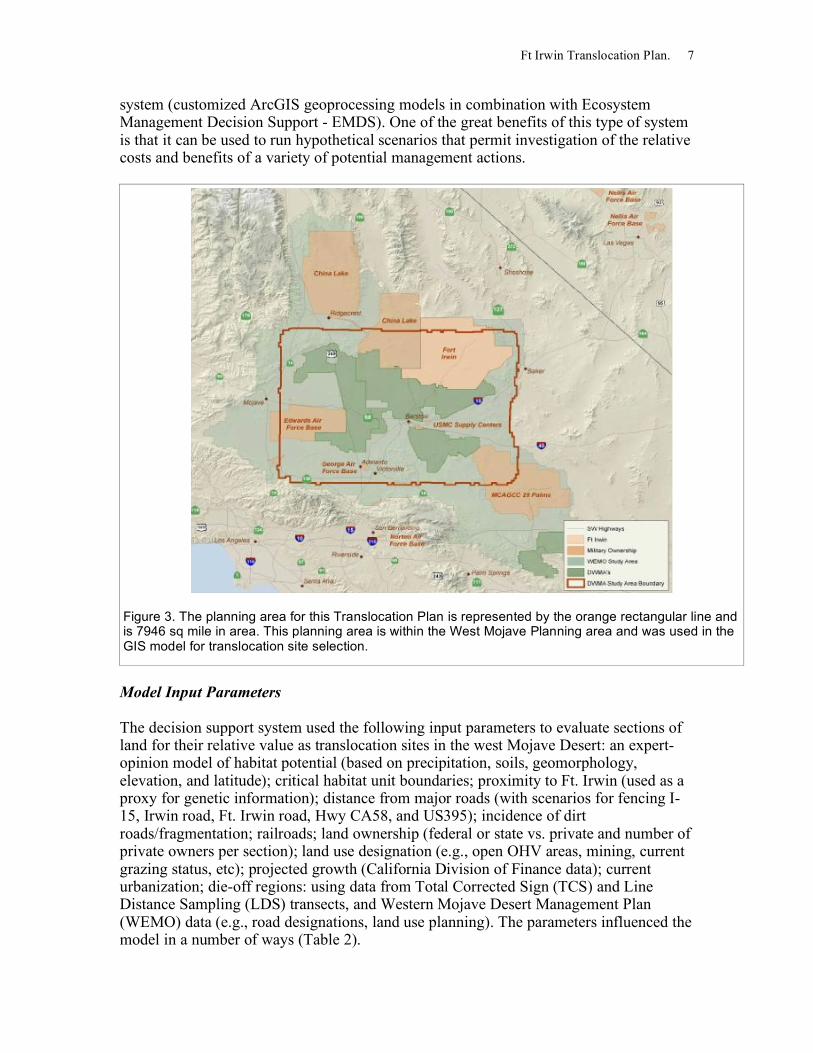
The Recovery Plan (Fish and Wildlife Service 1994) provides several guidelines for the disposition of translocated desert tortoises (Appendix 1). In brief, these guidelines suggest that translocated tortoises should not be placed into DWMAs, they should be placed in good habitat with depleted desert tortoise populations – e.g., along highways (von Seckendorff Hoff and Marlow 2002), and the translocation areas should be fenced. In addition, the Biological Opinion (Fish and Wildlife Service 2004) for the expansion of Ft. Irwin National Training Center (NTC) states that at least some of the displaced tortoises should be placed south of the SEA and on “managed parcels” of land, which places them within a DWMA and in conflict with the guidance provided in the Recovery Plan. Guidance regarding the selection of translocation sites was also received from resource managers from a variety of agencies on the Conservation Mitigation Working Group. In some cases, differing agency goals confound each other if not considered from a broad perspective. The Biological Opinion required that the translocation plan explain procedures to determine translocation sites (Appendix 2). Ideally, a quantitative habitat model would be used to identify translocation sites. Such a habitat model would rely on multiple interacting parameters at a broad geographic scale that describe desert tortoise habitat in relation to distribution and abundance of tortoises and would need to be validated independently of the data used to develop the model. However, there are currently no widely used models based on quantitative habitat relationships for desert tortoises. For this reason, members of the CMWG decided to take advantage of an existing GIS-based decision support system designed to support tortoise conservation related to the Ft. Irwin expansion. The system was developed by the Redlands Institute, University of Redlands, and funded through the Army Research Office, Department of Defense. Scientists from the University of Redlands, USGS-Biological Resources Division-Western Ecological Research Center, and the University of Nevada, Reno collaborated to parameterize the GIS decision support system to determine the most suitable sites for translocation. The model was based on geospatial data used in an expert-opinion model of habitat potential, threats to tortoises, recent tortoise surveys, and several anthropogenic factors (i.e., land use, ownership, urban planning) that were considered to be important to the survival of tortoise populations. The expert opinion model is distinguished from a quantitative model, in that, opinions from knowledgeable biologists rather than quantitative information was used to define model parameters. Furthermore, the expert opinion model was not validated. For a detailed explanation of the model and the input parameters please see Appendix 3. The model covered a 7946 sq. mi. core area within the West Mojave Desert Management Planning area (Figure 3). This core area included areas proximate to Fort Irwin, and the DWMAs in the West Mojave, where most of the recent tortoise surveys have been conducted. The unit of analysis for the model was one section of land (~ 1 sq mi). Translocation sites were identified using a spatial decision support
Ft Irwin Translocation Plan. 7
system (customized ArcGIS geoprocessing models in combination with Ecosystem Management Decision Support - EMDS). One of the great benefits of this type of system is that it can be used to run hypothetical scenarios that permit investigation of the relative costs and benefits of a variety of potential management actions.
Figure 3. The planning area for this Translocation Plan is represented by the orange rectangular line and is 7946 sq mile in area. This planning area is within the West Mojave Planning area and was used in the GIS model for translocation site selection.
Model Input Parameters
The decision support system used the following input parameters to evaluate sections of land for their relative value as translocation sites in the west Mojave Desert: an expert-opinion model of habitat potential (based on precipitation, soils, geomorphology, elevation, and latitude); critical habitat unit boundaries; proximity to Ft. Irwin (used as a proxy for genetic information); distance from major roads (with scenarios for fencing I-15, Irwin road, Ft. Irwin road, Hwy CA58, and US395); incidence of dirt roads/fragmentation; railroads; land ownership (federal or state vs. private and number of private owners per section); land use designation (e.g., open OHV areas, mining, current grazing status, etc); projected growth (California Division of Finance data); current urbanization; die-off regions: using data from Total Corrected Sign (TCS) and Line Distance Sampling (LDS) transects, and Western Mojave Desert Management Plan (WEMO) data (e.g., road designations, land use planning). The parameters influenced the model in a number of ways (Table 2).
Ft Irwin Translocation Plan. 8
Table 2. The categories into which all model parameters were placed depending on how they functioned in the model.
1. Proximity – caused the assigned value in the model for land parcel rank to increase or decrease as a function of its distance from the following features: • Rank increased with distance from: major roads (unfenced); urban areas; railroads; • Rank decreased with distance from: Ft Irwin (a substitute for Genetics); fenced roads (repatriation of reclaimed habitat)
2. Inclusion – caused the assigned value of a parcel to increase if areas were determined to be die-off regions for desert tortoises (calculated from LDS/TCS transect data and explained subsequently), or where the lands were federally owned or had few (<3) private owners.
3. Exclusion – caused strict exclusion of land parcels if they occurred in areas characterized by the following criteria: an area of projected urban growth (California Department of Finance data) open OHV areas, and areas with unfavorable physical characteristics due to geomorphology (e.g., playas), elevation (e.g., areas exceeding 4250 ft in elevation).
4. Other factors were used to create preference or avoidance of certain areas such as disturbance due to road fragmentation.
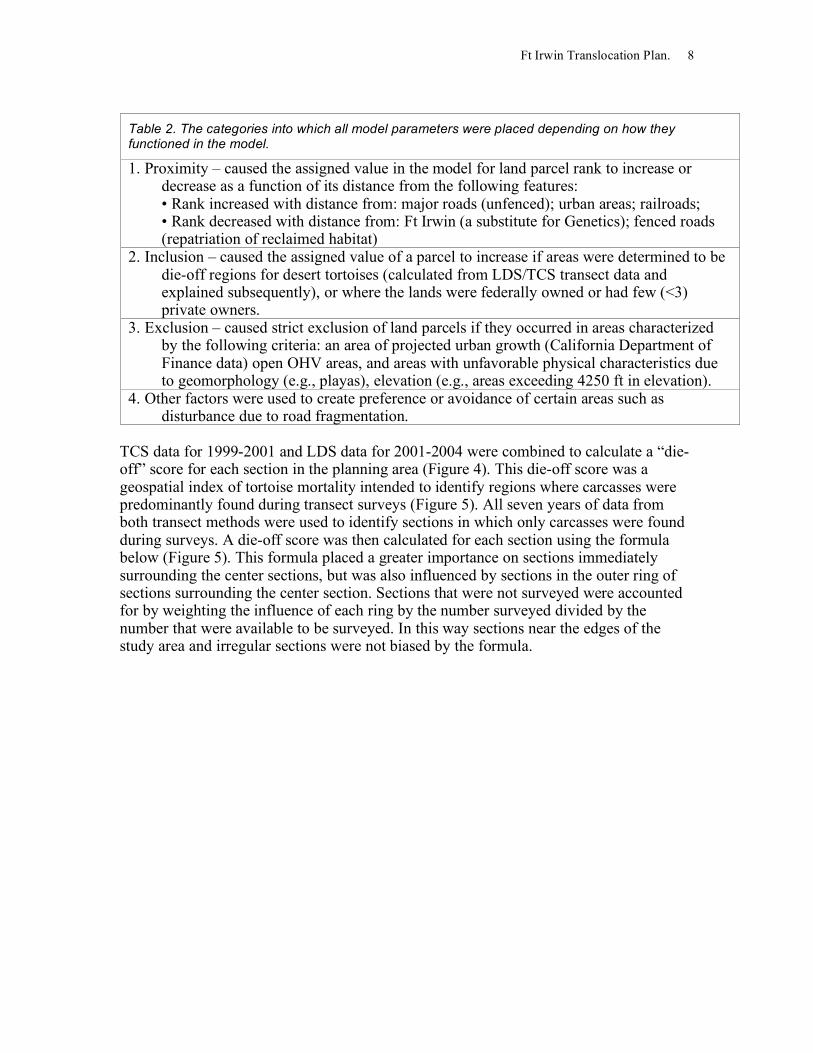
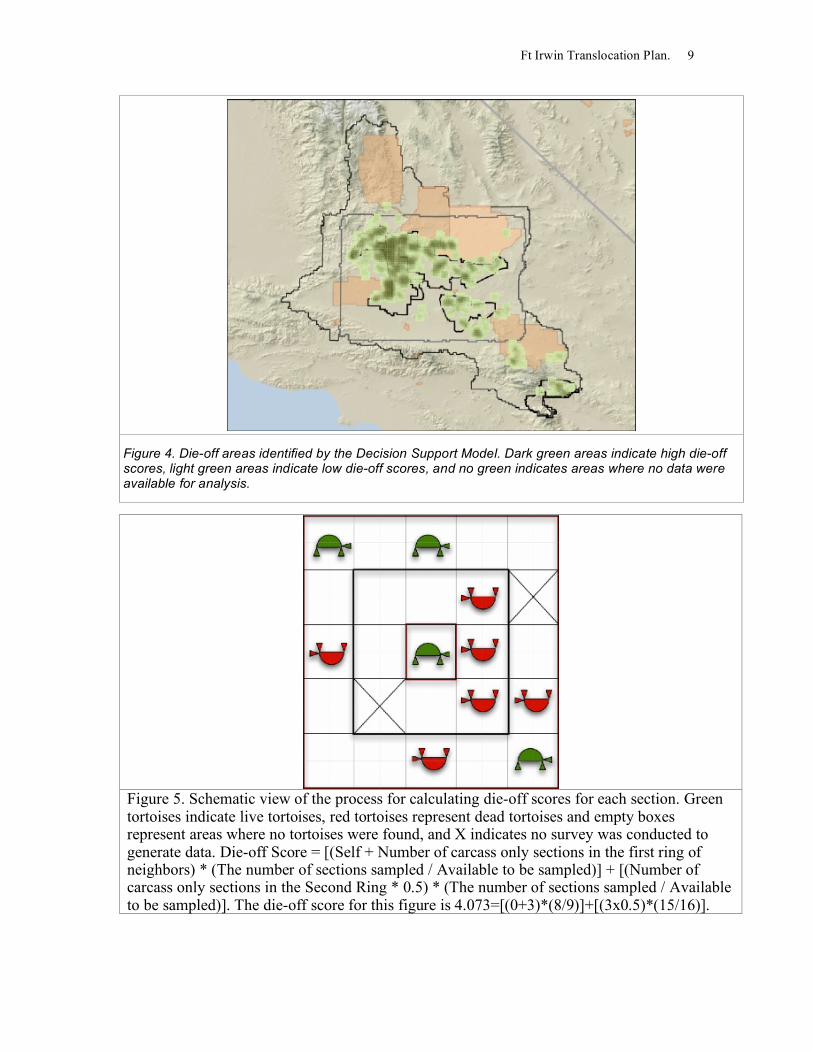
TCS data for 1999-2001 and LDS data for 2001-2004 were combined to calculate a “die-off” score for each section in the planning area (Figure 4). This die-off score was a geospatial index of tortoise mortality intended to identify regions where carcasses were predominantly found during transect surveys (Figure 5). All seven years of data from both transect methods were used to identify sections in which only carcasses were found during surveys. A die-off score was then calculated for each section using the formula below (Figure 5). This formula placed a greater importance on sections immediately surrounding the center sections, but was also influenced by sections in the outer ring of sections surrounding the center section. Sections that were not surveyed were accounted for by weighting the influence of each ring by the number surveyed divided by the number that were available to be surveyed. In this way sections near the edges of the study area and irregular sections were not biased by the formula.
Ft Irwin Translocation Plan. 9
Figure 4. Die-off areas identified by the Decision Support Model. Dark green areas indicate high die-off scores, light green areas indicate low die-off scores, and no green indicates areas where no data were available for analysis.
Figure 5. Schematic view of the process for calculating die-off scores for each section. Green tortoises indicate live tortoises, red tortoises represent dead tortoises and empty boxes represent areas where no tortoises were found, and X indicates no survey was conducted to generate data. Die-off Score = [(Self + Number of carcass only sections in the first ring of neighbors) * (The number of sections sampled / Available to be sampled)] + [(Number of carcass only sections in the Second Ring * 0.5) * (The number of sections sampled / Available to be sampled)]. The die-off score for this figure is 4.073=[(0+3)*(8/9)]+[(3x0.5)*(15/16)].

Ft Irwin Translocation Plan. 10
The parameters in the decision support model were arranged in a logical structure, which effectively ranked them according to how important they were considered to be in the decision process. This logical structure was developed by combining the expert opinion of many scientists, managers and stakeholders during workshops hosted by the Redlands Institute Desert Tortoise Project (J. Heaton, University of Nevada, Reno – Personal Communication) with guidance from the authors of this plan. Parameters were assigned to one of two groups according to their importance in the decision process (Figure 6). The most influential group consisted of the following parameters: geomorphology, elevation, land ownership, urban areas, and major roads. This group was weighted such that if any one of the parameters was unsuitable that section was considered unsuitable for translocation (i.e., the logical AND operator – Figure 6). The second group contained parameters that were weighted in proportion to their potential influence on the success or failure of translocation and these values were combined (i.e., the logical UNION operator – Figure 6). For example, this group of parameters considered whether the section was within Critical Habitat Units, an open or closed OHV area, an area considered to be probable for future urban development, whether the area was within a die-off area of resident desert tortoise populations, the level of fragmentation due to open and closed BLM routes, and whether railroad tracks transected the section (Figure 6). The score for each of these parameters was averaged to create a suitability value for the section. This suitability value was then combined with results from the first group to create results expressed as a decision surface for each scenario that was developed with the model. In this way, none of the UNION parameters were allowed to eliminate a land section in and of themselves, but the combined effect of each parameter influenced the overall results.

Ft Irwin Translocation Plan. 11
Figure 6. Schematic showing the logical structure of the habitat selection model. Parameters in group 1 are the row of rectangles at the top of the figure. Group 2 are the parameters in the column of ovals. The numbers next to each parameter in group 2 are the assigned weights.
Decision Scenarios
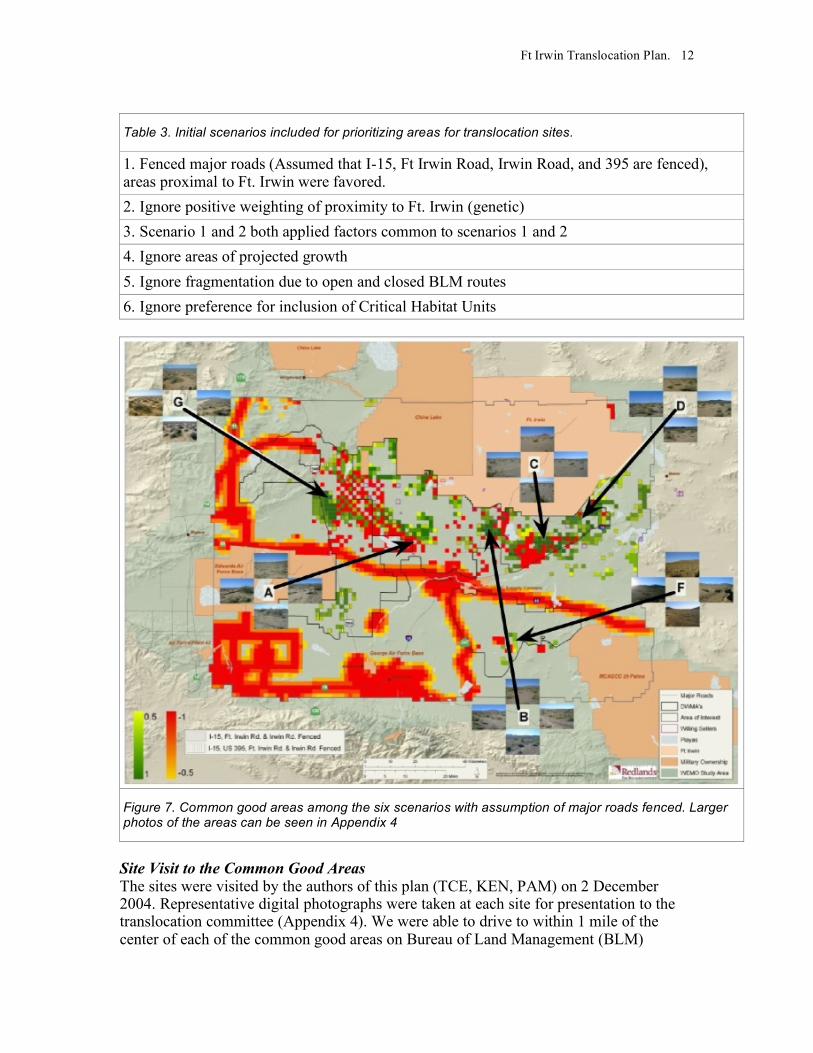
Six permutations of the input parameters were combined to create modeling scenarios that differed from one another in ways thought to be of particular interest for desert tortoise translocation (Table 3). For example, scenario “1” was designed to highlight sections that would be gained by completely fencing all major highways, while still ranking sections higher that were closer to Ft. Irwin. In contrast, scenario “2” was designed to consider the current level of fencing along major highways and not providing a higher rank for proximity to Ft. Irwin. Scenario “3” then combined the factors that were isolated in scenarios “1” and “2” for a final contrast of those important scenarios. To identify the sites that met selection criteria in the most robust way, the results from all six scenarios were then analyzed simultaneously to identify which areas received favorable ratings as translocation sites, and were common among all six scenarios (e.g., Figure 7). From the combined analysis we selected seven areas that contained large contiguous blocks of sections that were ranked favorably as translocation sites for tortoises by the model (Figure 7). The model output for each of the scenarios and the combination of all six scenarios were interpolated to color maps for consideration by the Conservation Mitigation Working Group.
Ft Irwin Translocation Plan. 12
Table 3. Initial scenarios included for prioritizing areas for translocation sites.
1. Fenced major roads (Assumed that I-15, Ft Irwin Road, Irwin Road, and 395 are fenced), areas proximal to Ft. Irwin were favored.
2. Ignore positive weighting of proximity to Ft. Irwin (genetic)
3. Scenario 1 and 2 both applied factors common to scenarios 1 and 2
4. Ignore areas of projected growth
5. Ignore fragmentation due to open and closed BLM routes
6. Ignore preference for inclusion of Critical Habitat Units
Figure 7. Common good areas among the six scenarios with assumption of major roads fenced. Larger photos of the areas can be seen in Appendix 4
Site Visit to the Common Good Areas The sites were visited by the authors of this plan (TCE, KEN, PAM) on 2 December 2004. Representative digital photographs were taken at each site for presentation to the translocation committee (Appendix 4). We were able to drive to within 1 mile of the center of each of the common good areas on Bureau of Land Management (BLM)

Ft Irwin Translocation Plan. 13
designated open routes. On visitation of the sites, we concluded that some of the sites resulting from model output had atypical vegetation patterns for tortoise habitat (Figure 7 G, F) and others looked like they contained typical tortoise habitat (Figure 7 A, B, D). Sites C, and D were accessible by a major utility corridor. Site D was in proximity to the Ft. Irwin Study Site (FISS – Hazard and Morafka 2002) and consisted of hilly country with outcrops of silt and mudstone and several moderately deep (2-5 m deep) washes. Vegetation at this site was moderate to sparse relative to other Larrea/Ambrosia dominated sites (i.e. Sites A and B). Site C had more sparse vegetation than any other site. Site B was bisected by Ft. Irwin Road and had the greatest cover of Larrea/Ambrosia and the shrubs here were tallest of any of the sites. Site A was accessible by a BLM open route that has had heavy use both on and off the road by Off-Highway Vehicle (OHV) traffic. Soils at Site A were coarse sandy/loam. This site was a mixed shrub community with Yucca brevifolia as visual co-dominants. Site G was accessed by a graded dirt road and characterized partly as a valley sink with fine soils and vegetation dominated by Atriplex spp. and Grayia spinosa (many of which were dead). Site F was intermediate between Site G and the other sites with respect to vegetation and soils. Site F also appeared to be in an active grazing allotment as there were cattle present on the site. The maps and site photographs were presented to the Conservation Mitigation Working Group for consideration as translocation sites on 7 December 2004 (e.g., Figure 7). After thorough consideration of the maps, the Conservation Mitigation Working Group identified additional sites for consideration in addition to those sites identified by the model. Site Visit by Conservation Mitigation Working Group
Key members of the Conservation Mitigation Working Group returned to the field to visit the sites for further confirmation of the suitability of sites proposed to be used for the translocation of tortoises from the SEA. Six additional sites were visited on December 22, 2004, and a helicopter over-flight of most of the proposed translocation areas was conducted. The first site was on the north side of some low hills east and north of Dawson Road. The soil was very gravelly and had evidence of lots of sheet type erosion. There was a fair amount of cover from Larrea tridentata shrubs with some Ambrosia dumosa, Encelia farinosa, and Hymenoclea salsola. This site would possibly make a good location for the release of translocated tortoises. The second site visited was south of the Kern River pipeline and the power line corridor and about 2 km west of Dawson Road. The habitat looked good, there were a fair number of moderate sized Larrea shrubs present. East of the landing site we observed the remains of an adult female desert tortoise (no marks of scavenging present). This location possessed a fair amount of relief with bajadas about 10 m high and lots of open-faced banks that would afford desert tortoises ample locations to construct burrows. The first and second sites were near site D described above.
Ft Irwin Translocation Plan. 14
The third site was at the Southeast end of Alvord Mountain north of the numerous power lines, and just north of site C described above. This site consisted of much open habitat without much cover. There were widely spaced Larrea shrubs and not much else in the way of cover. Mounding was present around Larrea shrubs from rodent activity and numerous caches of seeds were seen germinating. To the north of the landing site we observed a number of incised canyons with arroyos draining the mountainous habitat. These canyons are likely to be excellent tortoise habitat but are probably not able to support large numbers of tortoises as would be required for translocation sites. Between Site three and Site four we flew around the north slope of Alvord Mt. The area between the UTM 87 line and the northern slope of the mountains appears to be an excellent location to consider placement of tortoises not retrieved during the clearances of the expansion areas. (i.e., tortoises found after major translocation efforts are completed). Site four was on the west side of Alvord Mountain on the juncture of the bajada and the foothills, and east of the Coyote Dry Lake. The slope leading to Coyote Lake has numerous washes and a fair amount of Larrea with Cassia linata present in many places. This site looks like good habitat, the downside is the presence of numerous private land parcels to the south and west that preclude acquisition. Site five was southwest of Coyote Lake on the north slope of Calico Mountains. This site looks very good, there were numerous fair sized Larrea shrubs ~1.5 m tall, lots of rodent activity and excellent germination of annual plants. The soil looks friable and excellent for maintaining tortoise burrows. The foothills on the north slope of the Calico Mountains possess a fair number of canyons and this may serve as a good translocation site. The only drawback might be the proximity of private land parcels to the north as you approach Coyote Lake. The sixth site was approximately 3 km West of Ft. Irwin Rd. in the foothills of the south side of Superior Valley. Inspection of this highly dissected habitat of low hills and Larrea/Ambrosia habitat indicates that it would be an excellent location for desert tortoises. There was a large wash/road traversing the Superior Valley north/south to the north of the site. The valley bottom possesses large widely spaced Larrea shrubs with not much cover between them. Likewise, numerous annual plants have germinated and it will provide much food for tortoises this spring. Sites four and five were in the valley surrounding site B described above. Proposed Translocation Sites
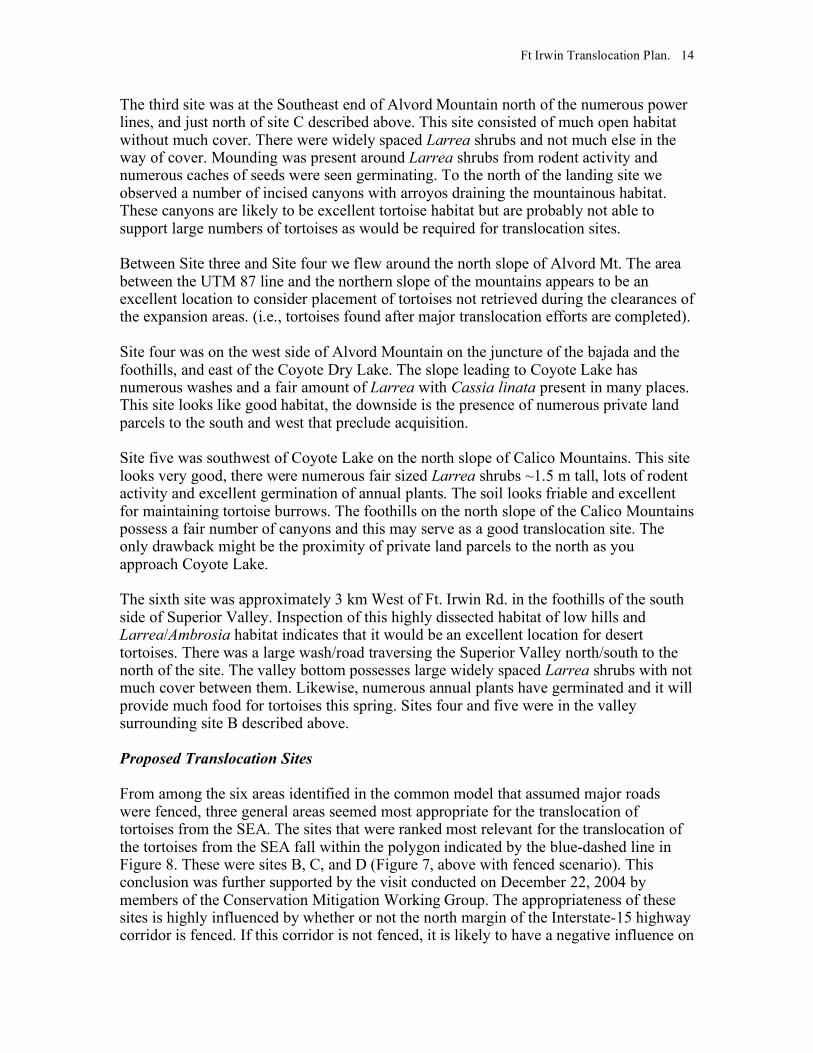
From among the six areas identified in the common model that assumed major roads were fenced, three general areas seemed most appropriate for the translocation of tortoises from the SEA. The sites that were ranked most relevant for the translocation of the tortoises from the SEA fall within the polygon indicated by the blue-dashed line in Figure 8. These were sites B, C, and D (Figure 7, above with fenced scenario). This conclusion was further supported by the visit conducted on December 22, 2004 by members of the Conservation Mitigation Working Group. The appropriateness of these sites is highly influenced by whether or not the north margin of the Interstate-15 highway corridor is fenced. If this corridor is not fenced, it is likely to have a negative influence on
Ft Irwin Translocation Plan. 15
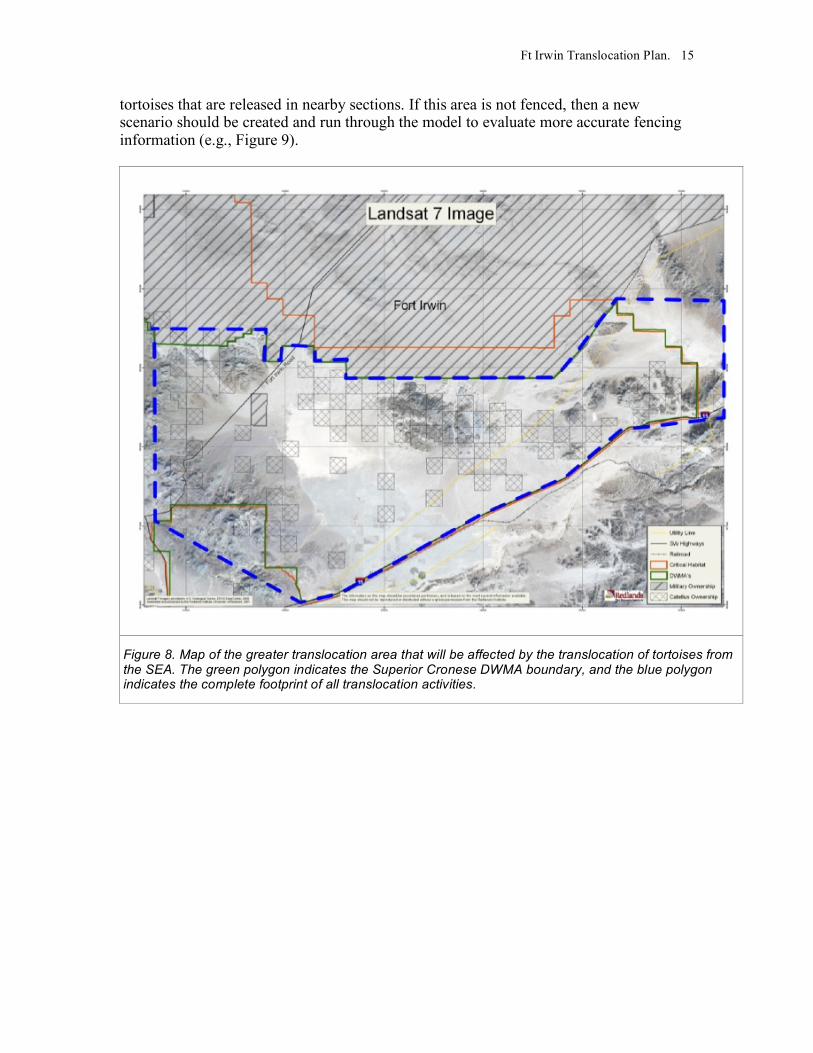
tortoises that are released in nearby sections. If this area is not fenced, then a new scenario should be created and run through the model to evaluate more accurate fencing information (e.g., Figure 9).
Figure 8. Map of the greater translocation area that will be affected by the translocation of tortoises from the SEA. The green polygon indicates the Superior Cronese DWMA boundary, and the blue polygon indicates the complete footprint of all translocation activities.
Ft Irwin Translocation Plan. 16
Figure 9. Common scenarios where the major roads are not fenced.
Ft Irwin Translocation Plan. 17
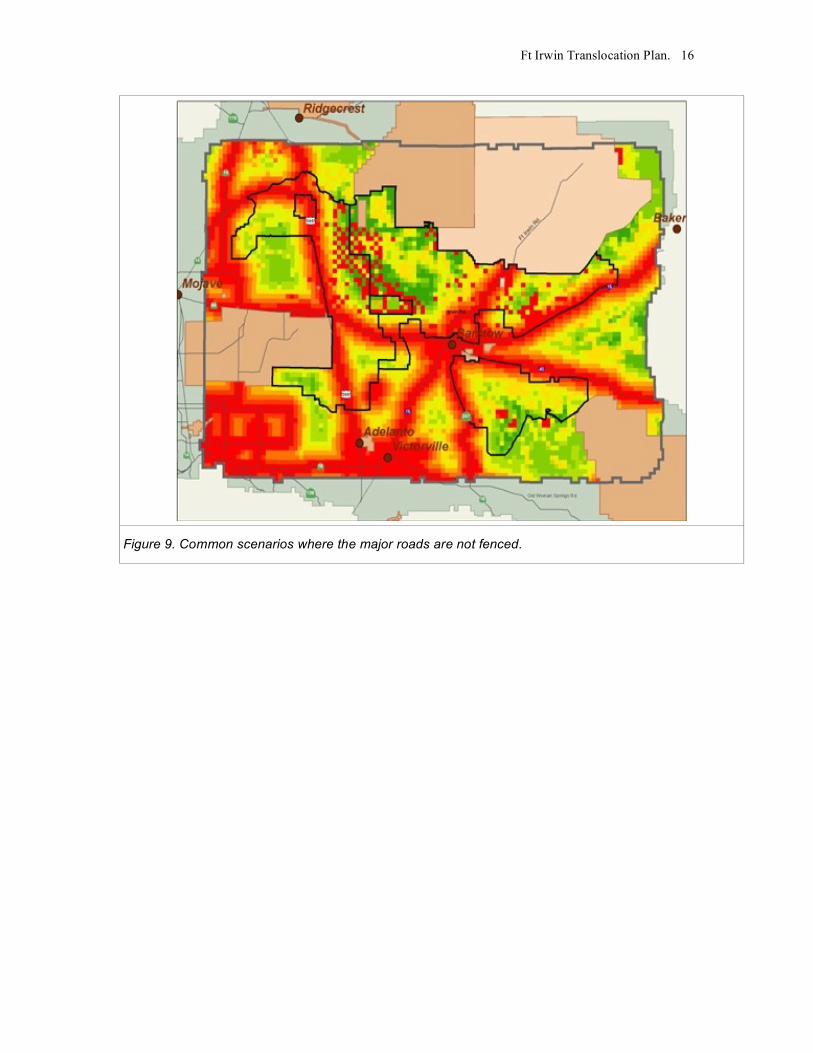
Figure 10. First year displacement distances of tortoises translocated to sites in typical habitat in Nevada (Bird Springs, LSTS, Lake Mead) and Utah (Sandstone MTN), and of tortoises translocated to atypical habitat (Pahcoon, Shivwits).
Translocated tortoises have been reported to move long distances immediately after release while in search of home ranges, or new territories (Berry 1986, Field 1999, Nussear 2004) (Figure 10). The ability of tortoises to move large distances creates a dangerous situation if major roads are not fenced. If tortoises are to be released within 10 km of a major road it will be fenced prior to translocation. This may be especially relevant in atypical or unfavorable habitat. We estimate that approximately 13.6 miles of the northern side of Interstate 15 would need to be fenced, in addition to the fencing already planned for Ft. Irwin Road, and the UTM 87 line. Fort Irwin will work with CalTrans in erecting desert tortoise-proof fencing along Interstate 15 from Afton Canyon exit to the vicinity of Yermo by providing funding, manpower, or both.
Ft Irwin Translocation Plan. 18
III. Clearance Procedures for the SEA
Timing of Clearances
Prior to translocation of any tortoises each expansion area will be completely surveyed for desert tortoises. Tortoises located during surveys must be removed from the SEA by the spring of 2007 if military activities are to commence by July 2007 (Table 1). This requires enumeration of tortoises in the SEA, and complete preparation of translocation sites (specific site selection, screening the health of individual tortoises, planning for fencing where required, contracting for fencing, etc.). Enumeration of tortoises in the SEA will be completed by fall of 2006. Survey of translocation sites and studies of resident tortoises will also be initiated as soon as possible (i.e., spring of 2005) so that baseline data on habitats and resident tortoises can be acquired prior to translocations as recommended by Guideline 7 of the Recovery Plan (Fish and Wildlife Service 1994). Permits authorizing all activities related to tortoise capture and handling will be acquired from appropriate agencies (i.e., Fish and Wildlife Service, California Department of Fish and Game, and Bureau of Land Management). All work identified below is subject to Terms and Conditions of state and federal permits and may be altered or modified to meet these conditions. Research and Development of Clearance Methods
Recent research on surveys for tortoises opens the possibility to use canine-assisted search teams to increase efficiency and accuracy of searches compared to human search teams (Bjurlin 2004, Cablk and Heaton 2004). This method could result in a more complete removal of tortoises in the expansion areas. Scientists from the University of Nevada, Reno, the Desert Research Institute, and the USGS will conduct an experiment in 2005 to compare the costs and benefits of using human search teams for desert tortoise surveys compared to canine-assisted search teams. Briefly, the experiment is designed to determine if canine or human teams locate desert tortoises of all size classes more efficiently and with equal safety for the tortoises involved. An area of approximately 10 square miles has been selected for experimental surveys. One-half of the sections will be surveyed first by canine-assisted teams, and the other half will initially be surveyed by human teams. Then the teams will switch locations and search the areas previously searched by the other team. At the conclusion of the searches researchers will provide an analysis of the results and recommendations to the U. S. Army and the Conservation Mitigation Working Group for conducting additional clearance surveys on the remaining 26 square miles in the SEA that contain desert tortoise and that were not part of the human/canine-assisted search team experiment. SEA Clearance Teams
After the most effective search method is identified the remaining area of approximately 26 square miles of the SEA will continue to be searched using the most efficient method. The remainder of the expansion area will be searched using two complete passes by tortoise survey teams as recommended by the Fish and Wildlife Service (R. Bransfield Personal Communication). All clearance activities will occur when ambient temperatures
Ft Irwin Translocation Plan. 19
are below 35°C and in accordance with permitting requirements for handling desert tortoises. Clearances should be conducted using 3 teams including: a search team, a telemeter/data team, and a field coordination team. This is because search teams must maintain an adequate pace in order to complete daily coverages on schedule. Every tortoise that is found will require a significant amount of processing time to attach radio transmitters and perform necessary measurements. This would best be handled by specialists whom we refer to as the telemeter/data team. There may be multiple search teams and during first passes across sections there should be a telemeter team assigned for each search team. The field coordination team should be used to determine work force, maintain communications, provide oversight for the safety of tortoises and field teams, and collect data at the conclusion of each day. Tortoise Procedures
Upon locating each tortoise during surveys the following information will be recorded and archived: time tortoise is located, time telemeter team arrives, the location of each animal will be determined using a GPS, tortoises will be marked appropriately according to size, measured (Carapace Length in mm), weighed, general notes on appearance and health will be recorded (i.e., eyes, nares, shell condition, etc.) and then, they will be released, as soon as possible at the point of capture. Time of release will also be recorded. All of these data will be included in a final report of activities. Tortoises found during clearances may be: 1) marked with Passive Integrated Transducer (PIT) tags (Gibbons and Andrews 2004) (e.g., Biomark model TX1400L); 2) fitted with an external label and notched (ASIH 2004), and 3) have a light-weight radio transmitter attached with a battery life of at least one year (e.g., Holohil model AI-2F). Approved sterilization and handling techniques will be used as required by the Terms and Conditions of State and Federal permits (Desert Tortoise Council 1994, revised 1999). This redundant method of marking tortoises ensures that tortoises are easily identified by field workers, even in the case of predation or shell wear. Transmitters should be attached using methods similar to those described in Boarman et al. (1998). Dataloggers may be attached to tortoises to record micro-climate and body temperatures (Nussear et al. 2002). All transmittered tortoises will be monitored at least monthly until they are translocated to a release site. By fitting transmitters to tortoises and leaving them in situ, we obviate the need to hold tortoises between the period when they are initially captured, and the time when they are subsequently transferred to the translocation area. This procedure will help to minimize stress prior to translocation Health screening and disposition of ELISA positive tortoises
The presence of Upper Respiratory Tract Disease (hereafter referred to as URTD) has been hypothesized as always having been present in wild desert tortoise populations and is exacerbated by stress (M. Brown – Personal Communication to Tracy et al. 2004). Stress can be imposed by a number of factors, such as drought, habitat degradation, poor nutrition, and the densities of tortoise populations (Jacobson et al. 1991, Peterson 1994, Saethre et al. 2003).

Ft Irwin Translocation Plan. 20
The emergency listing of the desert tortoise as endangered in 1989, and its subsequent listing as threatened in 1990 (Fish and Wildlife Service 1989, 1990) was in part due to the documentation of URTD in wild tortoise populations. This disease may have been, in part, responsible for the significant declines observed in the Western Mojave Recovery Unit in association with other stressful factors and impacts to tortoise populations. Additional diseases have subsequently been documented in wild tortoise populations, including shell disease (cutaneous dyskeratosis) (Christopher et al. 2003), herpes virus (Origgi et al. 2002), Mycoplasma testudinium and proliferative pneumonia (Jacobson and Berry 2004). The prevalence of these two conditions has been documented in a few specific locations within the Mojave Desert. Although seroepidemiological research has been conducted (Brown et al. 1999), epidemiology and the impacts of these organisms on tortoise populations have not been assessed widely (Tracy et al. 2004). The Biological Opinion on the Fort Irwin expansion (Fish and Wildlife Service 2004: 41) stated that the translocation plan should address issues related to the detection and transmission of disease. All tortoises (i.e., monitored recipient, control and translocated) will have examinations for the purposes of disease screening and genetic sampling before they are taken from their original habitat. This examination may include an assessment of the overall condition of the animal and its shell, looking for visible signs of herpes lesions, URTD symptoms, trauma, and cutaneous dyskeratosis (Berry and Christopher 2001). In addition, blood samples will be collected for laboratory examination of disease, assessment of genetics, and possibly to determine baseline stress levels (Henen et al. In Press). Blood samples will be collected later in the activity season in order to ensure that the immune system is active (e.g., May through October). Blood can be drawn from a variety of locations, including ventral coccygeal, brachial, jugular, cardiac, subcarapacial venipuncture, supraorbital sinus, and toenail clipping (Jacobson 2000, ASIH 2004). The exact location used for bleeding should be determined by the volume of blood needed to complete all analyses desired at that time. Tortoises that are moribund and too sick to be used in field studies may be necropsied for pathological study. Tortoises that are ELISA positive for the antibodies to Mycoplasma and tortoises that show signs of URTD, will be isolated when translocation occurs. These tortoises will be placed in isolated sites either outside the DWMA boundary, or on property already owned by the Department of the Army just inside of the DWMA boundary, or within the boundaries of the military installation. The quarantined desert tortoises will be confined within double-fenced pens to ensure that they do not come into physical contact with resident tortoises in the area. It is estimated that approximately 6 miles of fencing would be required to build a double fence that covers ¾ of a square mile. These tortoises may be used during future research activities or participate in headstart programs as appropriate. Rostal et al. (2001) studied a group of captive tortoises that were diagnosed as ELISA positive in 1991 and have been maintained successfully for over 10 years at the Desert Tortoise Conservation Center in Las Vegas, Nevada. Those tortoises are watered and provided with supplemental food. These animals reproduce normally producing the same number of eggs and clutch sizes as control animals. This suggests that captive ELISA positive animals may contribute to recovery of depleted tortoise populations.
Ft Irwin Translocation Plan. 21
Resident tortoises in the translocation area are currently (as of May -September 2005) being evaluated for baseline clinical health and disease by Kristin H. Berry and others. Each assessment includes examination for clinical signs of health and disease; photographs or images of carapace, plastron, nares, and eyes, including additional images of any abnormalities, recent trauma, or old trauma, or signs of shell disease; blood samples from the brachial vein of each tortoise sufficient for multiple tests, e.g., 2 ELISA tests for Mycoplasma agassizii and M. testudinium, potential herpes virus tests, PCRs; sufficient blood for future tests; and nasal lavage for cultures of Mycoplasma species and other organisms. Clearance of Subadult and Smaller Tortoises
Size is currently a limiting factor to monitoring desert tortoises. Some tortoises are too small to carry a transmitter (i.e., tortoises <300g, or 150 mm (Medica et al. 1975)) that will last 1 year and will be marked and removed from the field, tested for disease and moved to temporary storage enclosures (i.e., mini-FISS enclosures (Williams 2002), or the FISS neonatal tortoise enclosures that are already established at Ft. Irwin (Hazard and Morafka 2002) as they are encountered. The mini-FISS enclosures consist of temporary structures (i.e., lacking a foundation) supported by metal poles (2-3 m tall) and completely covered by mesh to exclude all types of vertebrate predators including common ravens. The temporary structures enclose native vegetation and are erected in such a way as to minimize surface disturbances. While in the FISS enclosures the tortoises and the enclosures will be checked according to the “ELISA and Juvenile Tortoise Plan” (Appendix 5). Juvenile tortoises will temporarily be held at the enclosures until they are moved to the translocation area or are used to benefit ongoing research on neonatal tortoise ecology, head-starting, etc.
Ft Irwin Translocation Plan. 22
V. Translocation Procedures
Prior to translocation of animals the selection of recipient sites and inter-agency agreements will be finalized. In addition the Army will coordinate with any ongoing research in the area. The fencing of major roads and any tortoise containment fencing will be identified so that construction of those fences can be planned, contracted, implemented and completed in time for the sites to receive tortoises from the expansion areas prior to training activities (see Time Line of Activities). Disposition of Desert Tortoises From the SEA
Those tortoises found to be ELISA negative will be moved to one of two general types of translocation sites including: 1) long-term translocation sites, and 2) manipulative experimental translocation sites. Due to the multiple use mandates on BLM lands it is unlikely that fenced plots used for manipulative experiments can be located on BLM lands within the timeline necessary for translocation. Therefore, it is likely that these plots would be constructed on lands acquired by DOD that are within the translocation areas. It has also been proposed to place some proportion of translocated animals into areas where die-offs have previously occurred (Fish and Wildlife Service 2004). Tortoises in the Superior Valley expansion area may be more conducive to this research as there is more evidence of large die-offs adjacent to that expansion area (Figure 4, Tracy et al. 2004). The proportions of tortoises to be placed in areas where die-offs have or have not previously occurred will be determined by the Conservation Mitigation Working Group and the requirements for experiments in the translocation sites. Translocation Densities
It is unlikely that the sites that meet other translocation criteria will have empirically known “pre-decline” densities. We have considered historic densities, results from recent experiments and guidance in the Recovery Plan to aid in determining target densities for proposed tortoise translocation sites. Research on the effects of density on desert tortoise ecology has been conducted by the USGS and UNR in several semi-natural tortoise enclosures. Possible density effects on growth were observed at densities greater than 500-800 tortoises per sq. km [1295-2072/sq mi] (Saethre et al. 2003). Adult tortoises will be translocated in small groups (e.g., 50-70 /sq. mi [19–27 / sq km]) to many different sites in order to disperse them throughout the release areas. Recent density surveys for the Superior-Cronese DWMA estimate approximately 7.5 tortoises per sq km [19/ sq mi] (P. Medica, Personal Communication). Thus, given these densities, the number of adult tortoises is not expected to exceed densities of 100 per square mile [39/sq km] after translocation. The majority of these animals may not need transmitters, but could be monitored using less intensive sampling methods. If conducted correctly a subset of these animals could be monitored more closely (in combination with resident tortoises of comparable numbers). The remaining tortoises could be translocated into several fenced plots for more closely controlled experimental manipulations. The proportions of animals assigned to each of these types of translocation sites should allow for sufficient replication and controls required by any experimental design. To distribute 600 animals at release densities of 50-70 tortoises per square mile approximately 9 to 12 sections of
Ft Irwin Translocation Plan. 23
land will need to be designated as translocation sites. In addition, an appropriate number of local control animals will be monitored in similar habitat throughout the translocation area. Protection of Translocation Sites
Each site will likely have its own protection and management needs. Major roads near release areas will be fenced in order to prevent tortoises from crossing, or being killed on these roads. The entire translocation area will not be fenced due to the prohibitive logistics and costs associated with constructing fencing. Alternatively we suggest that fencing be placed strategically and that physiography also be used as barriers to tortoise movements where possible. For example, during previous translocations in Nevada, mountainous areas that provided a precipitous change in elevation in excess of 2500’ functioned as barriers to the movements of translocated tortoises (Nussear 2004). A portion of the tortoises will be monitored as they disperse and settle into the recipient habitat. If a particular desert tortoise that has a transmitter approaches a dangerous feature, such as a portion of a major road that has not been fenced, it will be moved to a location more central to the translocation area. Similarly, if a translocated desert tortoise is found on privately-owned property, it too may be moved to another area to ensure its safety. As mentioned above some tortoises may be released into smaller experimental release pens. These pens will be monitored by researchers frequently to ensure that the animals are not falling prey to unnatural levels of mortality due to the experimental manipulations, and that the pens are not damaged by flooding or vandalism. The wire mesh used to build tortoise-proof fences is fine enough to capture debris carried during surface flow of precipitation, even during mild storms. Eventually this debris accumulates on such fences and if not removed potentially can cause a breach in the fence thus putting animals and experiments at risk. During previous desert tortoise experiments, using similar pens, storms in excess of 2.5 cm falling in less than 2 hours produced enough runoff to damage perimeter fences and place experiments at risk (T. Esque, Personal Observation). For these reasons a perimeter check of experimental fences and highway fences will be conducted quarterly. Precipitation events that result in intense storms will result in immediate perimeter checks and appropriate maintenance. In the long-term, if all of the proposed translocation sites are located within Desert Wildlife Management Areas (DWMAs), their long-term protection should be assured by the land management agency with jurisdiction over the lands contained in and surrounding the translocation sites by management plans that are already in place. If tortoises are translocated to public lands that are not within DWMAs they will require additional management considerations if their long-term protection is to be ensured. Translocation Procedures
Translocations will only occur in the spring (i.e., March – early May), fall (i.e., late September to early November), or winter if necessary (i.e., December –February) to avoid extremely high thermal conditions (Cook et al. 1978, Nussear 2004). Tortoises will not be released in the summer (i.e., June - August) for any reason. No desert tortoise shall
Ft Irwin Translocation Plan. 24
be captured, moved, transported, released, or purposefully caused to leave its burrow for whatever reason when the ambient air temperature is above 95 degrees Fahrenheit (35 degrees Celsius). No desert tortoise shall be captured if the ambient air temperature is anticipated to exceed 95 degrees Fahrenheit before handling or processing can be completed. Tortoises will probably be found in burrows when field crews are removing tortoises from expansion areas. These animals will be “tapped” to encourage them to exit (Medica et al. 1986) or they may require careful excavation (Desert Tortoise Council 1994). Multiple visits will be necessary if tortoises are inaccessible in caves. Tortoises with radios that were attached during clearances will be collected from field sites and transported in vehicles or helicopters to the translocation sites by biologists that have been approved by the Fish and Wildlife Service to handle desert tortoises, and released on the same day. Juvenile tortoises (those too small for radio attachment) which were housed elsewhere after clearance will be translocated at this time as well. During translocation, tortoises will be transported in clean protective containers to ensure their safety during translocation. If re-used, these containers will be sterilized using a 10% bleach solution before being used to translocate other tortoises. Upon release, all tortoises will be provided drinking water for 15 to 20 minutes, and then be released into an unoccupied tortoise burrow (if available) or in the shade of a shrub. Previously, desert tortoises released into artificially made burrows showed no fidelity to those sites, often leaving them immediately (Field 1999, Nussear 2004). Suitability of release depends on the severity of the daily ambient temperature at the time of release (Lohoefener and Lohmeier 1986, Corn 1991, Field 1999, Nussear 2004). Tortoises released in winter will be placed in a burrow that is covered by a masonite board to encourage the tortoise to remain in hibernation (Nussear 2004). Previous experience with this technique indicates that to procedure does not confine the tortoises against their will. If they want to leave the site, they can. The masonite board will be removed by early March when resident tortoises are observed to be active. In recent studies on translocation, animals were observed after release under similar conditions to those proposed herein, and all those animals were able to find suitable shade resources without showing signs of overheating or thermal duress (Field 1999, Nussear 2004). The released animals rarely returned to the burrows in which they were released but found or constructed other suitable cover sites nearby. Tortoises that are equipped with transmitters and released into unfenced areas may be tracked at least once, or preferably twice weekly until the onset of hibernation (Nussear et al. In Review). This is because these animals are likely to disperse from the site of their initial release and may range widely (Field 1999, Nussear 2004). The typical range of radio transmitters for tortoises (~700 - 900 m) makes them particularly difficult to track during periods of large movements which can be greater than the range of the transmitter in a single day (Esque 1994, K. Nussear Unpublished Data).
Ft Irwin Translocation Plan. 25
Determining when desert tortoises would be moved across the southern boundary
fence
Tortoises that are not found during the clearances of the expansion areas may be encountered at a later date during military training activities. If possible, these animals may be incorporated into one of the translocation/research programs. If there is no way for them to be incorporated into one of the research programs, they will be moved to a pre-determined location across the southern boundary of the training area, such as between the Alvord Mountains and the UTM 87 line, as suggested in the Biological Opinion (Fish and Wildlife Service 2004). However, animals that are placed over the fence (a relatively short distance) should be held in captivity until environmental conditions are hospitable for the release of tortoises and consistent with the conditions described for translocation.
Ft Irwin Translocation Plan. 26
VI. Monitoring for Short and Long Term Success and the Assessment of
Threats
A properly designed monitoring program includes short and long-term metrics and hypotheses that are used to provide information that can be used to critically evaluate if management goals are met and provide guidance for adaptive management for future actions (Morrison 2002). Due to financial limitations, it is unlikely that every metric identified below can be measured. Prior to translocation, the scope of the research program for monitoring the short- and long-term success of this translocation will be finalized by the Conservation Mitigation Working Group. The research program will be structured (Latta 2000, Salafsky et al. 2002) to ensure that there is coordination among all of the research activities conducted under this translocation plan. To facilitate plan administration, the Conservation Mitigation Working Group or a similar body will meet on an annual basis to review progress and share information. These meetings are to be focused on the annual activities and progress over the year, and to assess whether the research activities are within the thresholds bounded for the goals for each of the criteria for success. In addition this review committee will facilitate coordination and data dissemination among all field researchers. A framework will be developed to collect and archive all field data so that the assessments of the long-term goals are accurate and to assure that the data from all activities conducted under this plan are archived. Criteria for evaluating the success of this translocation plan must be based on parameters that are quantifiable and hypothesis driven (Tracy et al. 2004). The parameters that are described in the following section were selected to measure responses of tortoises to the range of environmental variation they encounter such that success of the translocation project can be evaluated. While each of the variables have different responses we generally expect that translocated tortoises should have similar responses as that of control animals after they have had up to five years to adjust to their new environments in order for translocation to be judged “successful” in the short-term. The ultimate measure of success for this translocation plan is the assimilation of the translocated tortoises into the recipient population. Growth, reproduction and physiological parameters are an integration of nutrition, behavior and social interactions. Long-term monitoring of at least one generation of tortoises will be required to determine if the translocation is successful. We define a generation as the time required from hatching to first reproduction. Desert tortoises are generally sexually mature when they reach over 180 mm carapace length (Turner et al. 1986, 1987b). The time it takes for desert tortoises to reach this size ranges between 15 to 20 years depending on resource availability and environmental conditions during their development (Turner et al. 1987b, Tracy and Tracy 1995). Many metrics can be used to measure the success of translocation in both the short- and long -term. This translocation project involves a sufficiently large number of tortoises that will make it possible to test hypotheses rigorously, which will increase our knowledge of how to conserve this species into the future. Importantly, each parameter that is measured will be compared between translocated, recipient and control populations. Short-term ecological metrics will provide information about the ways
Ft Irwin Translocation Plan. 27
translocated tortoises are adjusting to their new locations and whether or not the introduction of translocated tortoises into a population has a negative or positive effect on resident tortoises. Short-term ecological metrics may include: growth rates (more relevant for smaller size classes); movements; site fidelity; survival rates; stress; incidence of disease; nesting success; reproduction; recruitment; nutritional ecology; and behavior and social interactions. Long-term metrics of success will be measured at several time scales over one tortoise generation. These metrics may include: survivorship (proportions of residents vs. translocated animals surviving); population status (e.g., population densities over time); demographics; genetics (e.g., paternity and maternity); and disease (to understand the long-term ramifications of disease at artificially increased population densities). Research on many of the metrics that we will use to assess short-and long-term success of translocation will address nearly all of the recommended research specified in the Recovery Plan (Fish and Wildlife Service 1994, p54). It is important to acknowledge that threshold values used to measure success of the translocation activities may initially be somewhat unrealistic but our ability to identify more realistic values will improve as new data and techniques are acquired and developed. To the extent possible, the thresholds suggested herein were developed using data from previous translocation studies although these may still be value judgments and we will not know the ultimate result of our management actions until long term criteria are analyzed. However such values are useful as milestones against which to compare differences between translocated and control populations in relation to one another, and to local environmental change. Differences in short or long-term metrics between translocated and control populations that exceed threshold values may be a reason to alter management actions or even to discontinue specific activities in the most severe cases. Ultimately the translocation must be measured in consideration of the costs and benefits of moving the tortoises and their effect on recipient populations compared to the potential loss of the translocated populations had they remained in the expansion areas. All response variables that are used to evaluate the level of success for this translocation plan must be considered relative to the responses among the three experimental groups of tortoises (treatment groups). We can not simply interpret the responses of the different treatment groups independently from one another, but rather comparisons must be made relative to one another. This avoids the problem of interpreting responses (e.g. mortality) as a result of translocation, when they may in fact be caused by uncontrollable conditions (such as extended periods of drought). Most response thresholds are proposed herein to be a differential of 20%. Note - this is not an absolute response level, but rather a differential response level to be compared among the treatment groups of animals. Furthermore, this value is provided as initial guidance, and as such is subject to change as new insights or data become available. The 20% difference is thought to be biologically meaningful (i.e., a difference of this magnitude between translocatees and controls reflects something that will likely affect the persistence of a cohort of animals and therefore the success of the translocation effort) and 20% is also a difference that is likely to be detectable given the sample sizes that will be available. For example, suppose there are 12 release sites where translocated and recipient tortoises are monitored, and control tortoises are monitored in surrounding control areas. We record (in a hypothetical year) mortality levels of 22% (± 4 = 1

Ft Irwin Translocation Plan. 28
standard errors from the mean (SE)) for translocated populations, 23% (± 3 SE) for recipient tortoise populations, and 19% (± 2 SE) for control populations. The percentage values are the means for each treatment group of the experimental populations and although these values would probably result in great concern among managers and scientists, the differences among the populations are not statistically discernible and are substantially smaller than the pre-determined threshold to determine success or failure. Thus one would conclude that while mortality is high, it is high in each of the treatment groups including tortoises not affected by translocation, and is probably influenced by drought conditions, or other factors acting at the scale of he entire study area. Some response variables may be more important than others when assessing the success of the translocation. For example, translocated animals could have high survivorship, low stress, normal movement patterns, high reproduction, but slower growth rates than resident animals, and this might spur additional investigation, but relatively few changes to the program, or the determination of success. In contrast, translocated animals could have low stress, and egg production that is not different from resident populations, but could have unusually high mortality relative to resident animals. This may call for closer investigation of the sources of mortality, which could aid in adaptive management of the translocation program based on what was learned in the initial translocation efforts. It is expected that differences among the tortoise populations may result in changes in procedures during subsequent translocation efforts or a re-evaluation of our expectations. Short Term Metrics of Success
Short term metrics that will be used as evaluation criteria for the success of translocation activities include daily, seasonal and inter-annual analyses of tortoise movements, and relevant parameters for stress, disease, survival, and possibly other parameters as listed below. This work will occur during the first three to five years of the translocation project, including the year the tortoises are moved. Environmental variability can be substantial in desert biomes and can confound ecological research projects if not anticipated. In addition each of the response variables can have inherent natural variation that can cause differences among treatment groups to be difficult to detect. We conducted power analyses to aid us in interpreting the level of detection possible for various responses using estimates of sample sizes anticipated for this research program. We determined that a 20% mean difference in evaluation criteria would be statistically discernible in most cases and acceptable for initial evaluation criteria under most circumstances. Translocated tortoises and the residents that inhabit the recipient sites (and are thus directly impacted by the translocation) may have responses in each of the metrics listed below. For translocation to be successful, these two groups of animals should return to normal (or acceptable) levels of the response variables, when compared to control animals, measured over the short term. Growth rates
Bodily growth rates of vertebrates are highly variable and can be affected by several factors such as nutrition, health, and age. Even healthy tortoises may show little or no growth in some years. Growth also varies between adult male and female tortoises
Ft Irwin Translocation Plan. 29
(Turner et al. 1987b). Growth rates can be measured by recording dimensions of the shell by using calipers, and measuring the mass of animals over time (Woodbury and Hardy 1948, Turner et al. 1987b). Due to the slow growth rate of adults, short term comparisons are probably best conducted with neonatal or juvenile animals that grow at faster rates than adults (Turner et al. 1987b). Growth of small tortoises has been reported to be more highly correlated with precipitation than annual plant production (Berry 2002). Thus, making measurements on tortoises will require the comparisons of growth between residents versus translocated tortoises in light of the variable rainfall and resulting plant production in different years. Monitoring average annual growth rates in light of plant production will address recommended research item 3.f. of the Recovery Plan, which entails measuring the nutritional and physiological ecology of different size classes of tortoises (Fish and Wildlife Service 1994, p. 54). Differences in growth rates will be difficult to detect among adult tortoises because of their slow growth rates (P. Medica et al., Unpublished Data). Therefore the most important demographic group for this evaluation are desert tortoises that are pre-reproductive - generally those less or equal to than 180 mm maximum carapace length. As part of sampling in the general study area, all tortoises that are encountered should be marked and measured (not just those that are to be radio transmittered). Therefore, smaller tortoises (< 180 MCL) can be encountered, and these size classes are necessary to adequately document growth over time. This method of comparison requires that small size classes of tortoises be translocated in addition to adults, in order to provide comparable measures of growth among treatment groups. If growth is measured as a success criterion, repeated captures of small sized tortoises will be required for estimating growth. This will result in average growth estimates for different locations, but likely not provide annualized growth measurements unless the tortoises have radios attached. Growth rates of individual desert tortoises in translocated populations should not be, on average, 20% different than individuals in recipient, or control populations after accounting for age, gender, and variation among sites in the amount of annual rainfall and forage availability. Movements, site fidelity, and home range considerations
The analysis of animal movements provides a quantitative measure that integrates how desert tortoise populations relate to their habitats (e.g., availability of nutrients, and cover sites). Based on previous experiments, translocated tortoises are expected to have increased movements when compared to residents for a period of one to three years, and then they tend to “settle” into their new sites (Nussear 2004). Movements and space use by animals are calculated as a by-product of locating the animals repeatedly using radio telemetry techniques, or satellite tracking of animals. Movements of tortoises may vary in response to age/size, season, environmental conditions, reproductive status, or the availability of nutritive resources. Data on movements can be analyzed using many different methods (Turchin 1998, Doerr and Doerr 2004). For example, the maximum distance displaced, the net distance displaced, the cumulative distance displaced, and the meander-ratio of movements over time have all been used to describe movements of translocated tortoises (Field 1999, Nussear 2004). Site fidelity and home range can also be calculated from measuring multiple locations of animals over time using telemetry or
Ft Irwin Translocation Plan. 30
similar technologies. Site fidelity gives a quantitative estimation of repeated site use over time, and is especially useful for animals that have not established home ranges (Burt 1943). Home range is, “that area traversed by an individual in its normal activities of food gathering, mating, and caring for its young (Burt 1943)." Home range can be calculated using a number of methods including minimum convex polygons, harmonic means and kernel estimators (Worton 1987, O’Connor et al. 1994, Seeman and Powell 1996). Home ranges of tortoises can be extremely variable (O’Connor et al. 1994), and thus are difficult to compare statistically. In addition home ranges may be influenced by the amount of forage available in a given year (Fish and Wildlife Service 1994). The home range concept assumes that animals are not dispersing (Burt 1943) and therefore it has little utility for short-term comparisons of translocated animals. Animal movements are classified according to their timing, seasonality, repeatability and associated behaviors. One important classification in desert tortoise ecology is the concept of home range (Woodbury and Hardy 1948). Previous translocation studies have indicated that tortoises moved to atypical habitat, are less likely to establish home ranges and demonstrate site fidelity than tortoises moved to areas known to be desert tortoise habitat (Nussear 2004). We predict that desert tortoises translocated to most of the proposed recipient sites will establish home ranges in the short-term, as every one of those sites that has been surveyed for tortoises does have tortoises – thus demonstrating that they are already habitat. It is expected that translocated tortoises will establish a home range and/or show site fidelity similar to that of controls the third season in the field after release. If after the third season there is greater than a 20% difference in movement parameters the topic should be considered at the annual translocation technical review meeting. Survival rates
The desert tortoise Recovery Plan recommended research that would contribute to a comprehensive model of desert tortoise demography (recommendation 3.b), and the population dynamics of populations augmented by translocation (recommendation 3.c), as well as understanding the sources of mortality in tortoise populations (recommendation 3.b.2) (Fish and Wildlife Service 1994, p 54). One baseline population measurement that is required to model demography is a survival rate. Survival rates are quantified by quantifying survival/mortality over time by the periodic monitoring of marked individuals (e.g. monthly, and annually, or longer intervals). Survival rates may also depend on the environmental conditions of the year (Turner et al. 1984, Peterson 1994) or the cumulative effects of several years (Longshore et al. 2003). In addition to annual responses to environmental conditions, survival among different populations may depend on long-term site conditions that vary geographically. Although it can be assumed that survival rates vary from place to place, acquisition of empirical data to determine the mechanisms causing such patterns are rarely acquired. The best way to understand these variables is to compare translocated tortoises with local control populations in similar habitats.
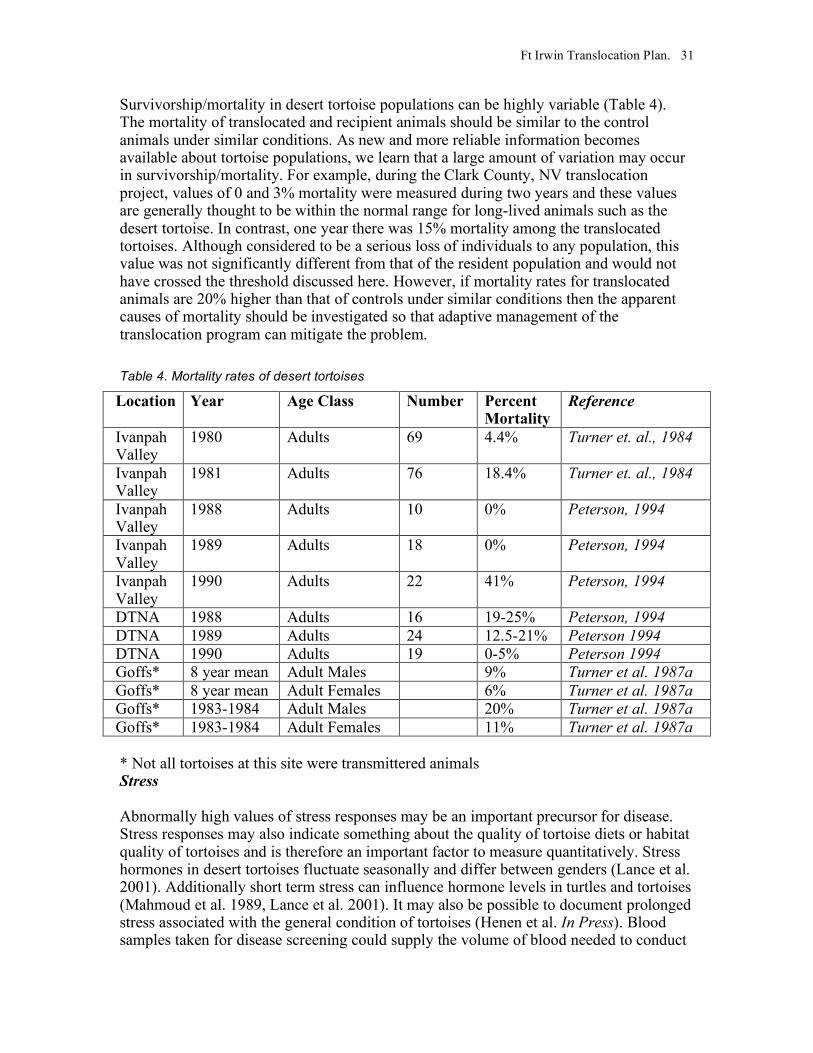
Ft Irwin Translocation Plan. 31
Survivorship/mortality in desert tortoise populations can be highly variable (Table 4). The mortality of translocated and recipient animals should be similar to the control animals under similar conditions. As new and more reliable information becomes available about tortoise populations, we learn that a large amount of variation may occur in survivorship/mortality. For example, during the Clark County, NV translocation project, values of 0 and 3% mortality were measured during two years and these values are generally thought to be within the normal range for long-lived animals such as the desert tortoise. In contrast, one year there was 15% mortality among the translocated tortoises. Although considered to be a serious loss of individuals to any population, this value was not significantly different from that of the resident population and would not have crossed the threshold discussed here. However, if mortality rates for translocated animals are 20% higher than that of controls under similar conditions then the apparent causes of mortality should be investigated so that adaptive management of the translocation program can mitigate the problem.
Table 4. Mortality rates of desert tortoises
Location Year Age Class Number Percent Mortality
Reference
Ivanpah Valley
1980 Adults 69 4.4% Turner et. al., 1984
Ivanpah Valley
1981 Adults 76 18.4% Turner et. al., 1984
Ivanpah Valley
1988 Adults 10 0% Peterson, 1994
Ivanpah Valley
1989 Adults 18 0% Peterson, 1994
Ivanpah Valley
1990 Adults 22 41% Peterson, 1994
DTNA 1988 Adults 16 19-25% Peterson, 1994 DTNA 1989 Adults 24 12.5-21% Peterson 1994 DTNA 1990 Adults 19 0-5% Peterson 1994 Goffs* 8 year mean Adult Males 9% Turner et al. 1987a Goffs* 8 year mean Adult Females 6% Turner et al. 1987a Goffs* 1983-1984 Adult Males 20% Turner et al. 1987a Goffs* 1983-1984 Adult Females 11% Turner et al. 1987a * Not all tortoises at this site were transmittered animals Stress
Abnormally high values of stress responses may be an important precursor for disease. Stress responses may also indicate something about the quality of tortoise diets or habitat quality of tortoises and is therefore an important factor to measure quantitatively. Stress hormones in desert tortoises fluctuate seasonally and differ between genders (Lance et al. 2001). Additionally short term stress can influence hormone levels in turtles and tortoises (Mahmoud et al. 1989, Lance et al. 2001). It may also be possible to document prolonged stress associated with the general condition of tortoises (Henen et al. In Press). Blood samples taken for disease screening could supply the volume of blood needed to conduct

Ft Irwin Translocation Plan. 32
screening for packed cell volume, hemoglobin, and stress hormone levels, and would add much to the interpretation of the relative stress induced on animals at different release sites. This metric falls under the physiological research category (3.f) recommended in the Recovery Plan (Fish and Wildlife Service 1994, p 54). We expect that stress differential may be measurable among translocated or recipient tortoise populations relative to controls associated with initial movement into the new area and for a period of time prior to establishing a home range. As given above, we predict that within 3 years home ranges will be established. Furthermore, after this time stress parameters should be indistinguishable between the translocatees, recipients and resident control tortoises. Should stress parameters vary by more than 20% among these groups after this time period, then the topic should be considered at the annual translocation technical review meeting. Incidence of Disease
Research on disease and epidemiology were recommended in the Recovery Plan (Fish and Wildlife Service 1994, p 54, recommendation 3.b.1). Many animals have increased rates of illness when exposed to increased levels of stress. The incidence of disease in translocated, recipient, and control populations will be monitored by taking periodic blood samples for analysis as described above. These samples should be screened for the various pathogens that cause URTD, Herpes virus, and other diseases when definitive laboratory assays are available. All translocation tortoises must be free of Mycoplasma agassizii antibodies prior to release into the recipient sites. Therefore, it is expected that conversion of translocated and recipient tortoises to a compromised ELISA status should not exceed (by > 20%) the levels of disease present in the resident control population. The percentage of resident tortoises exposed to URTD within the general translocation area is currently under study, and results will be available prior to the release of animals. Egg production
Egg production is an important factor to measure in order to estimate the potential of the translocated populations to become assimilated into the population, and to predict their effect on demographic patterns. In addition, reproductive allocation may indicate whether physiological stressors are affecting tortoises at an ecological level. Thus egg production may be both a measure of population potential, and of ecological performance that can be an important indication of success of translocation in many scenarios. X-radiography has been used to determine clutch size and frequency in turtles and tortoises for approximately 40 years and is not thought to place adult tortoises, embryos or populations in jeopardy, however, further research into the long-term effects of this activity is still required (Hinton et al. 1997). Egg production is easily measured by taking bi-weekly x-rays of female tortoises in the field (Turner et al. 1986, Henen 1997, Nussear 2004), and to date, no ill effects have been reported to animals in these programs. In addition ultrasonography could be conducted in the fall to document the development of yolk follicles (Kuchling 1989, Rostal et al. 1994) and to reduce the need for extra X-rays

Ft Irwin Translocation Plan. 33
in the spring. This may be especially important in interpreting why animals do not lay eggs in some years. Research on this topic would fulfill research recommendation 3.g. in the Recovery Plan (Fish and Wildlife Service 1994, p 54). We expect that egg production among tortoise treatment groups will not differ by more than 20%. Nest success
Research on nesting success is important to research recommendations 3.b.3 and 3.g of the Recovery Plan (Fish and Wildlife Service 1994, p 54). The second component of reproduction is a measure of the proportion of eggs that produce hatchling tortoises emerging from nests. Tortoise nests can have a high incidence of predation (Bjurlin 2001, Franks 2002), and this may be higher in areas where greater predator densities occur (Bjurlin 2001), as predator species vary, or where appropriate nesting substrates are not adequately available. Tortoise nests can be found by attaching thread trailers to gravid female tortoises near the time when shells form on the eggs (Bjurlin 2001), or by using fluorescing powder on gravid females with hard shelled eggs (as determined using x-rays) and following this trail to the nest (Keller 1993). Once nests are located they can be monitored for hatchling success and nest predation (Bjurlin 2001). Nests may be caged to protect them from predators if necessary (Turner et al. 1986). Minimizing the number of times that a nest is visited may be beneficial in reducing the number of nests which are preyed upon. Less intrusive methods should be developed to reduce the possible impact upon nests. We would expect that nest success would not vary by more than 20% between resident and translocated tortoises. Recruitment
Recruitment is the measure of tortoises entering the adult breeding population (Gotelli 2001). Smaller desert tortoises are located less frequently than adult tortoises, and are thought to have higher mortality rates than adults, as is seen in most species. This may be quantified by either following juveniles as they grow to maturity, or by analyzing periodic age structure distributions over time to infer demography. Thus the methods will either involve tracking juvenile tortoises over long periods of time (which is difficult) or random field surveys of areas over regular intervals with an emphasis on finding juvenile as well as adult tortoises. Unless new technologies are developed and applied that can help human searchers find a larger portion of non-adult tortoises, this method is likely not going to be successful on its own. Wildlife detection dogs may be helpful in these surveys if they show the ability to locate juvenile tortoises. Research in this area was recommended by 3.b.3 in the Recovery Plan (Fish and Wildlife Service 1994, p 54). Nutrition of tortoises
Nutritional ecology is an important topic when considering the management decisions that affect conservation of desert tortoises (Bjorndal 1995) and the dynamics underlying the
Ft Irwin Translocation Plan. 34
demographics of managed tortoise populations (Nagy and Medica 1986, Henen 2002). Recent research has focused on the effects of diet and nutrition on the physiology (Oftedal et al.1995) and the nutritional ecology (Henen 2002) of desert tortoises, and on forage preferences for and nutrient contents of individual plant species (Avery 1993, Esque 1994, Nagy et al. 1998, Jennings 2002, Van Devender et al. 2002). This research collectively has demonstrated that overall nutrition and individual nutrients can influence the diet selection (Nussear et al. 1995, Oftedal et al. 2002, Tracy et al. 2003), and growth of tortoises (Oftedal et al. 1995) and that diet can influence the egg production of tortoises (Turner et al. 1986, Henen 1997, Wallis et al. 1999). However, we still lack a general understanding of the influences of degraded habitat and exotic vegetation on the diet and the physiological ecology of desert tortoises. Although, Nagy et al. (1998) indicated little or no nutritional differences between native and exotic species for a few species, as long as natives were compared to exotics that were similar in growth form and life history (i.e., annual exotic grasses compared to annual native grasses). Nevertheless it is frequently taken as fact that invasive exotics are causing nutritional stresses on desert tortoise populations (Boarman 2002a). Furthermore, these stressors may influence the physiology (Peterson 1994) and ecology (Henen 2002) of tortoises, which may increase susceptibility of tortoises to disease (Jacobson 2000, Peterson 1994), but to date these interactions remain hypotheses. If exotic grasses compete with native species, and their presence causes nutritional stress on tortoises, then tortoises subjected to eating a diet composed largely exotic species should have higher levels of nutritional stress, and lower ecological performance measures. If possible, the nutritional consequences on the physiology and ecology of desert tortoises as a result of invasive exotic plants will be investigated, as these may be relevant in the interpretation of stress, disease and reproduction in translocated tortoises. Research on these topics was recommended in the Recovery Plan (recommendations 3.e, 3.f, and 3.g, Fish and Wildlife Service 1994, p 54). Baseline monitoring of vegetation in the tortoise habitats could support knowledge about nutritional ecology of tortoises. We suggest monitoring annual vegetation as the primary food resource for desert tortoises. If availability of forage species is equal among experimental and control populations, then it can be ruled out as a factor in other population differences. Behavior and Social interactions
Another aspect that could be considered when studying the potential effects of translocation on desert tortoises is animal behavior, and activity (Berry 1986, Walde et al. 2004). Because tortoises spend much of their time in burrows this is especially difficult for desert tortoises (Nagy and Medica 1986). Monitoring behavior and social interactions can involve intensive monitoring of tortoises by human observers (Ruby and Niblick 1994, Ruby et al. 1994, Esque 1994, Hillard 1996) or automated telemetry systems (Walde et al. 2003). Current research using this automated telemetry over the last two years has revealed many interesting aspects of desert tortoise activity and behavior. It is unknown what impact translocation may have on desert tortoise behavior either on a daily or seasonal basis. It is suspected that translocated tortoises will be more active shortly after being moved as they search their new landscape and search out food and shelter.

Ft Irwin Translocation Plan. 35
Ruby et al. (1994) were unable to detect differences in behavior among animals spaced in higher stress environments under experimental conditions. While aspects of social structure and behavior may be so complex that they are difficult to quantify in a manner that facilitates statistical comparisons among populations of tortoises, there may be simpler aspects of behavior that lend themselves toward this purpose. For example comparisons of the number of agonistic interactions, sexual interactions, etc could be compared among treatment groups of tortoises. There are no current threshold levels reported in the literature upon which to gauge the variance of the expected difference in behavioral responses. Demography
Demographic predictive models can then be used to evaluate population growth and other population parameters contributing to our overall understanding of the demographic processes for this species (research recommendation 3.b.4, Fish and Wildlife Service 1994, p 54). Life tables and predictive population models can be developed by integrating several of the parameters described individually above (e.g., generation time, egg production, recruitment, nesting success, etc.) in addition to other population metrics. This process is not sufficient to evaluate success of translocation activities alone, however, predictive models can be used to develop further hypotheses about the population dynamics of the control, translocated and recipient populations. Long term metrics of success
Long term measures of success must be viewed and evaluated somewhat differently from short term measures. During short-term measures we focused on determining with some certainly that we have not damaged a resident population or caused undue mortality in the translocated population. Long term metrics of success should be monitored for at least one tortoise generation (i.e., 15-25 y). Long term metrics will be measured by less intensive monitoring of animals over longer periods of time than is possible using radio telemetry. Populations should be monitored rather than individuals, and survivorship, demographic responses, and genetic samples can be collected over time to provide data the aid in the interpretation of long-term success. As previously discussed, this will require development of new techniques, at least to measure demography. Minimally, this will require intensive surveys of the translocation sites and surrounding areas to gather comparative data from undisturbed residents. Survivorship
Long term survivorship, like short-term survivorship must be quantified by tracking a statistically relevant proportion of tortoises in experimental populations in comparison with those in control populations. Long-term survivorship can be estimated by return surveys to translocation sites (and to where translocated tortoises have dispersed to) and quantifying proportions of marked live tortoises and/or carcasses that are found. This may be accomplished using search strategies, such as intensively sampled study plots,

Ft Irwin Translocation Plan. 36
transects randomly selected throughout the release area, or by cooperating with other survey/research efforts in the release areas. Canine-assisted teams could greatly enhance this endeavor if proven to be a viable means of tortoise surveying. Efforts to quantify long-term survivorship may be enhanced by cooperating with other monitoring efforts in the area, e.g., coordination with the Fish and Wildlife Service transect sampling that occurs in the DWMAs that are likely to receive translocated tortoises. Long term research on survivorship and factors that contribute to mortality of desert tortoises, and the long term effect of translocation on population dynamics was recommended by 3.b.2 and 3.c in the Recovery Plan (Fish and Wildlife Service 1994, p 54). Surveys of the recipient sites and control area should be conducted regularly over the long term. On these surveys, live and dead tortoise should be encountered and measured for several parameters (e.g., growth, presence/absence of disease, genetics, etc.). Tortoises that were marked during the short-term phase of the translocation study will be especially useful in determining the long term survivorship among groups of tortoises identified in the short term. Thus if there is not differential survivorship (by 20%) among the treatment groups, as measured over the long-term, then we may judge translocation to be successful. Demographics
Demography is the study of the population characteristics and integrates several of the parameters measured in the short-term monitoring program. For example, demographics includes population size, growth, density, distribution, size class distributions, and vital statistics such as generation time, reproductive rates, recruitment rates, mortality rates, and rates at which individuals move from one size class to another or among populations (Gotelli 2001). Research on demographics (3.b.4) was recommended by the recovery plan for this species (Fish and Wildlife Service 1994, p 54). Comparisons of the demographics of populations augmented by translocation, and in local control populations would aid in the determination of the long-term success of translocation. To have a complete understanding of demographics over the long-term, the short-term metrics that collectively define demography must be quantified. Demographic parameters are not measured in the same way as other criteria. A healthy or growing population of desert tortoises is expected to be characterized by stable or increasing numbers of reproductive individuals. Generally, reproduction occurs in desert tortoises greater than or equal to 180 mm MCL. There is no empirical evidence for the demographic pattern in healthy desert tortoise populations since most of those populations for which there are population profiles are in decline. Additionally, we do not currently have the ability to confidently estimate the demographic profile for tortoises of non-reproductive sizes because these animals are difficulty to find reliably and repeatedly. We will only be able to quantify such patterns if we develop techniques for monitoring small size classes of desert tortoises. This depends on new and innovative techniques that are yet to be discovered.
Ft Irwin Translocation Plan. 37
Genetics
Genetic techniques may assist in documenting the long-term success of translocation by documenting whether genetic material from translocated tortoises appears in future generations. This could indicate the relative contribution of translocated individuals to the reproduction of augmented populations. This technique requires that blood samples be taken for both the translocated animals, and for individuals in the resident control populations, and that the populations be sampled after sufficient recruitment has occurred. Analyses should be conducted to determine whether discernible differences exist among animals from the expansion area (prior to translocation) and in the control populations at the translocation sites. If such differences are not discernible, then analyses at the level of paternal and maternal lineages would be required to meet the evaluation criteria. There may be more definitive analyses available to researchers in the future and we recommend that samples be banked to take advantage of that possibility. Genetic evidence of success would provide evidence that the translocated tortoises and recipient populations had successfully assimilated by producing new tortoises of mixed parental lineages in the proportions that translocated tortoises were used to augment the population. Research on the genetics of tortoise populations was recommended (3.b.4) by the Recovery Plan (Fish and Wildlife Service 1994, p 54). Success in relation to genetic parameters should indicate that the translocated tortoises have been fully assimilated into the recipient population. Assimilation can be measured among populations by comparisons of alleles from the translocated animals, and those in the recipient populations over time. If rare alleles are present in the translocated tortoises and they begin to appear in hatchling or subadult tortoises in the general translocation area over time, then this metric can be used to demonstrate that the translocated tortoises are contributing reproductively to future generations of tortoises. Other parameters may be estimated using genetic analyses, such as effective population sizes, migration rates, etc. These and other metrics should be explored to provide evidence of the integration of translocated tortoises into recipient populations Translocation of Tortoises into Die-off Areas
The Biological Opinion and the Recovery Plan (Fish and Wildlife Service 2004 and 1994, respectively) suggest using translocated tortoises to repopulate areas that have experienced die-offs in tortoise populations, or reclaimed habitat with depressed tortoise populations (such as land along unfenced highways). While initially compelling, this management action is not without risk and the possible implications of this action should be considered in depth (Frazer 1992). This is because the causes of the die-offs that have occurred at several locations across the West Mojave are currently unknown. In fact, many populations that have been monitored for decades are still declining despite ten years of increased conservation management (Tracy et al. 2004). This suggests that the suite of impacts that are causing tortoise populations to decline are still present (Frazer 1992). Thus, in addition to the stresses associated with translocating animals, those released into die-off areas will likely be submitted to other, as yet, unknown or unquantified stress factors. When multiple factors are suspected of causing population declines (e.g., road mortality, versus invasive species, versus some unknown

Ft Irwin Translocation Plan. 38
contaminate) it is difficult to design experiments that include all possible factors and simply observational studies are unlikely to reveal these multi-factorial relationships. Translocations into areas that have experienced, or are currently experiencing, die-offs should be done so in an experimental context in order to ensure that the impacts to the natural population in that area can be identified and eliminated (Tracy et al. 2004). The short- or long-term success of any experimental release of tortoises into these areas may depend greatly on the discovery of additional stressors, and learning what management actions can be enacted to alleviate them. In order to quantify the myriad of interacting impacts that are likely to influence tortoise populations, researchers must quantify as many impacts as possible. The following paragraphs provide consideration of several potential impacts (but not an exhaustive list) that should be quantified (in addition to the short- and long- term metrics off success that apply more generally) if we are to understand what is causing die-offs in these areas. As potential impacts are identified and characterized, management actions will be developed and implemented to reduce the magnitude of those impacts Predation
Predation upon desert tortoises and their nests has been documented for a number of species vertebrates as well as invertebrates, these include but are not limited to: kit foxes, badgers (Coombs 1977), coyotes (Berry and Woodman 1984b, and Hohman and Ohmart 1980) bobcats, skunks, ringtails (Coombs 1977 Grover and DeFalco 1995 and Luckenbach 1982) Gila monsters (Hensley 1950) coachwhip snakes (Luckenbach 1982) golden eagles (Luckenbach 1982) ravens (Boarman 2002a) and even ants, (Goodwin et al. 1995). There are several ways to measure predation by monitoring possible predators. First, increased monitoring of adult tortoises, their nests and non-adult tortoises over the course of several years will likely provide additional information about sources and rates of predation. Predation potential could be measured by direct methods using mark recapture estimates of predator density, or by indirect methods such as using cameras triggered by the animals (Karanth 1995), or track stations (Ng et al. 2004). These methods will not indicate the probability of predation, but would be sufficient to enumerate the relative population numbers of potential predators that are present at different release sites. Correlations between the numbers of predators, and predation events would have to be documented. Research on sources of mortality, including natural predation is recommended by the Recovery Plan (research recommendation 3.b.2, Fish and Wildlife Service 1994, p 54). Ravens are known to prey on juvenile tortoises (Esque and Duncan 1985, Boarman 1993). The recent increases in raven population sizes in the southwestern US have caused their potential impacts to tortoises to be a concern to management (Boarman 2002b). Relative impacts by ravens at different sites have been quantified using small styrofoam tortoises as an indicator of potential predation levels (Kristan and Boarman 2003). Other than ravens, the incidence of predation on tortoises is mostly unquantified. This is because it is difficult to provide causal evidence of tortoise mortality when the evidence is based mostly on carcasses. Still a few studies provide some insight into predation on adult tortoises (Woodbury and Hardy 1948, Peterson 1994, Nussear 2004, P. Medica,

Ft Irwin Translocation Plan. 39
Personal Communication). These studies indicate that large predators (e.g., Felis concolor and Canis latrans) are capable of preying on adult tortoises, and that predation levels may be related to the climatic conditions in the habitat. Roads/habitat fragmentation and human impacts
Paved and unpaved roads and routes have the potential to impact tortoises directly and indirectly (Stebbins 1974, Bury et al. 1977, Boarman 2002a, Tracy et al. 2004). Recent inventories and analyses indicate that the number of roads and routes have increased in the west Mojave, including the areas being considered for translocation of animals in this plan (Tracy et al. 2004). These roads (whether designated open or closed) are a prominent feature on the landscape, and must be considered in any experimental design or analysis of short and long term success measures for translocation. There are literally hundreds of metrics to evaluate landscape patterns of these features. They can be grouped however, according to the aspect of landscape pattern measured: area/density/edge, shape, core area, isolation/proximity, contrast, contagion/interspersion, connectivity, and diversity (McGarigal et. al. 2002). Linear network pattern analysis may be particularly useful, and a whole variety of metrics have been developed (Forman 1995). While not an exact measurement of fragmentation, road density is often used as a surrogate for fragmentation. Road density measures the number of miles or kilometers of roads per unit area. In addition to road density, other quantitative metrics for evaluating landscape fragmentation should be considered, such as mean patch size, number of patches, edge density, landscape shape index, etc. These measures may be correlated with changes in the composition of native perennial plant communities, as well as changes in the relative presence of exotic and native annual plants which may in turn have influences on the diets of tortoises. These potential correlations and other possible influences of roads on tortoise populations should be investigated further. Roads increase access to desert environments thus potentially increasing other human impacts such as poaching, plinking, attacks by feral dogs, and the releases of pet tortoises may also be correlated with the prevalence of roads in the desert. Major roads may also cause additional impacts such as pollution from vehicles, corridors for the dispersal of invasive exotic species, etc. Impacts of pollution (either direct or indirect) on tortoise populations have not been studied, but should not be overlooked given that the sources of decline have not been identified in these depleted populations. Research on the impacts of roads and other disturbances is recommended by the Recovery Plan (3.c, Fish and Wildlife Service 1994, p 54). Invasive species and fire
Invasive species have been discussed in reference to their potential affect on tortoise diets. However, an immediate and well-documented relationship is that between invasive species and desert fires. Desert fires affect tortoise populations directly by fire related tortoise mortality and indirectly by long-term habitat changes associated with fire (Brooks and Esque 2003, Esque et al. 2003, Esque 2004).
Ft Irwin Translocation Plan. 40
VII. Site Characterization of the Expansion Areas and Translocation
Sites
Habitat Variables and Models
Previously, the use of an expert-opinion habitat model was described for its role in the decision support model. The expert-opinion habitat model already demonstrated its value in the decision making process, however, this should not be confused with a quantitative habitat model. Reliable quantitative habitat models are not currently available for desert tortoises, although research groups are currently developing such models (Gass et al. 2004, Mary Cablk, Desert Research Institute, Personal Communication). Climate, soils, and vegetation are all interrelated in Mojave Desert ecosystems and are important to characterization of the expansion and recipient sites because they are primary factors likely to affect desert tortoise populations. Climate is linked to the health of tortoises and tortoise populations in a variety of ways. For example, it has been shown that the growth of juvenile tortoises is directly related to availability of precipitation (Medica, et al. 1975), while adult tortoises may show adverse responses to prolonged drought (Peterson 1994, Longshore et al. 2003). Indirectly, the timing and amount of precipitation affects the production of Mojave Desert annual plants (Went 1948, Beatley 1974) which are important foods for the desert tortoise (Hansen, et al. 1976, Nagy and Medica 1986, Avery 1993, Esque 1994, Jennings 2002). Climatic data are valuable for the interpretation of ecological pattern, especially for long-lived desert plants and animals (Beatley 1974, 1980). Climate data will be recorded at translocation sites. The climate stations may record precipitation, temperature, and wind speed among other variables. Vegetative cover also varies with the amount of annual precipitation (Beatley 1974) and may vary widely with climate fluctuations (Webb et al. 2003). Vegetation provides cover from predators and climatic extremes, as well as, nutrition for tortoise populations (Woodbury and Hardy 1948, Luckenbach 1982). Perennial vegetation communities may be evaluated at least to the level of vegetation association. Annual vegetation may be mapped in relation to soil surface patterns and historic surface disturbances. Classification of soil surfaces can provide a means to understand mechanisms underlying ecological patterns (Webb and Wilshire 1980). Soil type, parent materials and the relative amount of calcium carbonate hardpan in the soil subsurface may be used to characterize release areas for later analysis in combination with data on vegetation and soil surface disturbances. Soil friability and depth may affect the amount of cover or nest sites available to tortoises (Wilson 1989, Merkler and Lato 1999). Permeability and composition of soil surfaces may affect the availability of drinking sites for tortoises (Medica et al. 1980). Chemical composition of soils may provide tortoises with mineral nutrients (Marlow and Tollestrup 1982, Esque and Peters 1994). Soil classifications may be instrumental in understanding soil nutrients in relation to desert tortoise food plants and possibly soil toxicants that could become a factor in the health of desert animals in locations where the soils are disturbed. The Mojave Desert is one of the most poorly mapped areas in the lower 48 states with respect to soil surface maps. Soils surveys or
Ft Irwin Translocation Plan. 41
geomorphology may be mapped for all of the expansion area and recipient sites. Research on the spatial variability of climate and productivity of vegetation and the relationships with population parameters was recommended by the Recovery Plan (3.e, Fish and Wildlife Service 1994, p 54). Land Use and Surface Disturbances
Land use and surface disturbances can affect desert tortoise populations and individuals and should be considered the monitoring program. Land uses that result in surface disturbances and may affect tortoises include: urbanization, agriculture, military operations, mining, livestock grazing, feral animals, utility corridors, and a variety of recreational uses such as OHV, mountain bikes (Berry 1984, Bury and Marlow 1973, Bury, et al. 1977, Fish and Wildlife Service 1994). Research on the effects of disturbance on tortoise populations is recommended by the recovery plan (3.c, Fish and Wildlife Service 1994, p 54).
Ft Irwin Translocation Plan. 42
VIII. Permit Items
It is anticipated that the following activities will require permits from the USFWS and the California Department of Fish and Game. Some of these items will need approval for both resident and translocated tortoises. • Survey for tortoises with canine-assisted teams • Survey for tortoises with human teams • Capture tortoises • Tap tortoises out of burrows • Handle tortoises • Incidental take with harm of minimal numbers of tortoises • Attach radio transmitters • Attach dataloggers • Handle tortoises to download dataloggers or to change out transmitters • Weigh tortoises • Measure tortoises (carapace and plastron width and height with calipers) • Mark tortoises (PIT tag, notching of marginal scutes, attaching external numbers, and
painting of dots or numbers on the carapace) • Track tortoises using radio telemetry • Draw blood, inspect for disease, submit blood for laboratory analysis, genetics
analysis, and stress analyses. Blood can be drawn from humeral or jugular punctures, toenail clipping. Analyses for toxicology, or stable isotope ratios may be possible using the nail clippings.
• Translocate tortoises – this will involve retrieval of tortoises from the field, possible excavation of animals from their burrows. Transporting animals to vehicles or aircraft. Transporting animals to translocation sites. Hydration of animals by providing drinking water, and release of animals at translocation sites in the spring, fall and winter
• Hold juvenile tortoises in fenced pens • Hold adult tortoises in fenced pens • Assess reproduction – this will involve x-radiography or ultra-sound scanning animals
at least bi-weekly. • Assess nesting success – this will involve the attachment of thread trailers and/or
fluorescent powder, marking of nests, excavation and measurement of eggs, caging of nests prior to hatching, and measuring/bleeding of hatchlings for genetics and health surveys.
• Collection/salvage and marking of shells of deceased animals • Salvage of moribund animals for possible necropsy • Collection of scats for analysis • Trapping of predators • Marking of burrows with numbered tags • Conduct behavioral studies • Use fiber-optic scopes, or similar methods to look in burrows for tortoises • Place meteorological monitoring equipment on the landscape to monitor weather
conditions • Place antenna towers on the landscape as part of an automated telemetry system

Ft Irwin Translocation Plan. 43
X. Time Line of Activities
Fall 2004
Evaluation of potential recipient areas Spring 2005
Interagency agreements, i.e., NEPA, land uses and right-of-ways Apply for State and Federal permits Apply for animal care and use committee approval Order equipment (transmitters may take 6 month prep time) Fencing plans in place for conservation research area Telemeter residents in the recipient sites and begin monitoring them Collect baseline environmental data on SEA and recipient sites
Build Juvenile tortoises holding pens
Fall 2005
Begin K9/human surveys / radio attachment / blood work at SEA Fence construction along release area borders Place Juvenile tortoises in holding pens
Annual Review with Conservation Mitigation Working Group Spring 2006
Continue clearance surveys / radio attachment / blood work at all SEA recipient sites Complete tortoise containment fences (i.e. highway fencing, boundary fences for conservation areas, etc. as needed for experiments Begin translocating tortoises from SEA if possible
Fall 2006
Last chance to complete surveys of SEA Continue translocation of animals from SEA
Annual Review with Conservation Mitigation Working Group
Spring 2007
Complete translocation of all tortoises from the SEA July 2007
Military training activities begin in SEA
Fall 2007 and beyond
Assessment of short-term effectiveness monitoring plan for SEA tortoises

Ft Irwin Translocation Plan. 44
Adaptive planning for Superior Valley Surveys and marking of Superior Valley tortoises and resident tortoises
Annual Review Clearances of Superior Valley and translocate to recipient area 2010
Military training begins in Superior Valley
Ft Irwin Translocation Plan. 45
XI. Literature Cited
ASIH. 2004. Guidelines for use of live amphibians and reptiles in field and laboratory
research. Second Edition. Revised by the Herpetological Animal Care and Use Committee (HACC) of the American Society of Ichthyologists and Herpetologists. (Committee Chair: Steven J. Beaupre, Members: Elliott R. Jacobson, Harvey B. Lillywhite, and Kelly Zamudio).
Avery, H. W.1993. Challenges to a changing plant community: Food selectivity and
digestive performance of desert tortoises fed native vs. forage plants. In: Proceedings: Conservation, restoration and management of tortoises and turtles – An International Conference. Van Abbema, J., ed. 11-16 July. Purchase, New York. Pp. 474.
Beatley, J. C. 1974. Effects of rainfall and temperature on the distribution and behavior of
Larrea tridentata (creosote-bush) in the Mojave Desert of Nevada. Ecology 55:245-261.
Beatley, J. C. 1980. Fluctuations and stability in climax shrub and woodland vegetation
of the Mojave, Great Basin and transition deserts of southern Nevada. Israel Journal of Botany 28:149-168.
Berry, K. H. 1984a. The status of the desert tortoise (Gopherus agassizii) in the United
States. Report to the US Fish and Wildlife Service from the Desert Tortoise Council. Order No. 11310-0083-81. 396 pp.
Berry, K. H. and A. P. Woodman 1984b. Methods used in analyzing mortality data for
most tortoise populations in California, Nevada, Arizona, and Utah. In: Berry, K.H., ed. The status of the desert tortoise (Gopherus agassizii) in the United States. Report to the US Fish and Wildlife Service from the Desert Tortoise Council. Order No. 11310-0083-81. 396 pp.
Berry, K. H. 1986. Desert tortoise (Gopherus agassizii) relocation: implications of social
behavior and movements. Herpetologica 42:113-125. Berry, K. H. 2002. Using growth rings to age juvenile desert tortoises (Gopherus
agassizii) in the wild. Chelonian Conservation and Biology 4:416-424. Berry, K. H., and M. M. Christopher. 2001. Guidelines for the field evaluation of desert
tortoise health and disease. Journal of Wildlife Diseases. 37:427-450. Bjorndal, K. A., 1995. Role of nutritional studies in the development of management
plans for populations of herbivorous reptiles. National Biological Service Desert Tortoise Nutrition Workshop: 17-22
Bjurlin, C. D. 2001. Early life stage ecology of the desert tortoise (Gopherus agassizii) in
the south-central Mojave Desert. Utah State University, Logan, Utah.
Ft Irwin Translocation Plan. 46
Bjurlin, C. D., W. J. Vanherweg, P. Mackay, R. Long , S. Weigley, B. Davenport. 2004.
The Scenting Abilities of Detector Dogs for Desert Tortoise Surveys: Pilot Study Results. Proceedings of the Desert Tortoise Council.
Boarman, W. I. 1993. When a native predator becomes a pest: a case study. Chapter
13:191-206 in Conservation and Resource Management. The Pennsylvania Academy of Science.
Boarman, W. I. 2002a. Threats to desert tortoise populations: A critical review of the
literature. Unpublished Report to West Mojave Planning Team, Bureau of Land Management. August 9. 86 Pp.
Boarman, W. I. 2002b. Reducing predation by common ravens on desert tortoises in the
Mojave and Colorado deserts. U. S. Geological Survey, Western Ecological Research Center, Sacramento, CA.
Boarman, W. I., T. Goodlett, and P. Hamilton. 1998. Review of radio transmitter
attachment techniques for turtle research and recommendations for improvement. Herpetological Review 29:26-33.
Brooks, M. L., and T. C. Esque. 2002. Alien plants and fire in desert tortoise (Gopherus
agassizii) habitat of the Mojave and Colorado Deserts. Chelonian Conservation and Biology 4:330-340.
Brown, M. B., K. H. Berry, I. M. Schumacher, K. A. Nagy, M. M. Christopher, and P. A.
Klein. 1999. Seroepidemiology of upper respiratory tract disease in the desert tortoise in the western Mojave Desert of California. Journal of Wildlife Diseases 35: 716-727.
Burt, W. H. 1943. Territoriality and home range concepts applied to mammals. Journal of
Mammalogy 24:346-352. Bury, R. B., R. A. Luckenbach, and S. D. Busack. 1977. Effects of off-road vehicles on
vertebrates in the California desert. Bury, R. B. and R. W. Marlow. 1973. The desert tortoise: Will it survive? National Parks
and Conservation Magazine 47:9-12. Cablk, M, and J. Heaton. 2004. Using K9s to survey for desert tortoise. Annual meeting
of the Ecological Society of America, Portland Oregon. Cagle, F. R. 1939. A system for marking turtles for future identification. Copeia
1939:170-173. Christopher, M. M., K. H. Berry, B. T. Henen, and K. A. Nagy 2003. Clinical disease
and laboratory abnormalities in free-ranging desert tortoises in California (1990-1995). Journal of Wildlife Diseases 39:35-56.

Ft Irwin Translocation Plan. 47
Cook, J. C., Wever, A. E., and G. R. Stewart. 1978. Survival of captive tortoises released in California. Proceedings of the Desert Tortoise Council, Las Vegas, NV.
Coombs, E.M. 1977 Status of the desert tortoise Gopherus agassizii, in the state of Utah.
In M. Trotter and C.G. Jackson, Jr. ed. Proceedings of the 1977 Symposium of the Desert Tortoise Council. Pp 95-101.
Corn, P. S. 1991. Displacement of desert tortoises: Overview of a study at the apex heavy
industrial use zone, Clark County, Nevada. Pages 295-303 in Proceedings of the Desert Tortoise Council.
Desert Tortoise Council. 1994 (Revised 1999). Guidelines for Handling Desert Tortoises
During Construction Projects. Edward L. LaRue, Jr., editor. Wrightwood, California. Dickinson, H. C., and J. E. Fa. 2000. Abundance, demographis and body condition of a
translocate population of St. Lucia whiptail Lizards (Cnemidophorus vanzoi). Journal of the Zoological Society of London. 251:187-197.
Diemer, J. E. 1984. Tortoise relocation in Florida: solution or problem? Pages 131-135 in
Proceedings of the Desert Tortoise Council. Dodd, C. K. J., and R. A. Seigel. 1991. Relocation, repatriation, and translocation of
amphibians and reptiles: are they conservation strategies that work? Herpetologica 47:336-350.
Doerr, V. A., and E. D. Doerr. 2004. Fractal analysis can explain individual variation in
dispersal search paths. Ecology 85:1428-1438. Esque, T. C. 1994. Diet and diet selection of the desert tortoise (Gopherus agassizii) in
the northeast Mojave Desert. Department of Biology. 243pp. Esque, T. C., and R. B. Duncan. 1985. A population study of the desert tortoise
(Gopherus agassizii) at the Sheep Mountain Study Plot in Nevada. In 1985 Proceedings of the Desert Tortoise Council Symposium, M. W. Trotter, ed. Pp. 47-67.
Esque, T. C. and E. L. Peters. 1994. Ingestion of bones, stones and soil by desert
tortoises. In Biology of North American Tortoises. Bury, R. B., and D. J. Germano, eds. National Biological Survey. Washington, D.C. Fish and Wildlife Research Report #13. Pp. 105-113.
Esque, T.C., C.R. Schwalbe, L.A. DeFalco, T.J. Hughes and R.B. Duncan. 2003. Effects
of wildfire on small desert vertebrates, especially desert tortoises (Gopherus agassizii). The Southwestern Naturalist 48:103-110.
Esque, T.C. 2004. The role of fire, rodents and ants in changing plant communities in the
Mojave Desert. Dissertation. University of Nevada, Reno.168 pp.
Ft Irwin Translocation Plan. 48
Field, K. J. 1999. Translocation as a conservation tool applied to the desert tortoise: effects of the pre-release availability of water. Masters Thesis. University of Nevada, Reno, NV.
Fischer, J., and D. B. Lindenmayer. 2000. An assessment of the published results of
animal relocations. Biological Conservation 96(2000):1-11. Fish and Wildlife Service. 1989. Endangered and threatened wildlife and plants; Finding
on desert tortoise petition. Federal Register 50:49868-49870. Fish and Wildlife Service. 1990. Endangered and threatened wildlife and plants:
determination of threatened status of the Mojave population of the desert tortoise; Federal Register 55:12178-12191.
Fish and Wildlife Service. 1994. Desert tortoise (Mojave population) Recovery Plan. Fish and Wildlife Service. 2004. Biological opinion for the proposed addition of
maneuver training lands at Fort Irwin, California. BO# 1-8-03-F-48, March 15, 2004. Forman, R. T. T. 1995. Land mosaics: the ecology of landscapes and regions. Cambridge
University Press, Cambridge, UK. Franks, B. R. 2002. Nesting success of desert tortoises (Gopherus agassizii) at Ivanpah
Valley and Fort Irwin reference site, California, during the year 2000 [Abstract]. In Proceedings of the Desert Tortoise Council. P. 13.
Frazer, N. B. 1992. Sea turtle conservation and halfway technology. Conservation
Biology 6:179-184. Gass, L., T. Esque, K. Thomas, R. Webb, and D. Miller. 2004. Poster Presentation. A
quantitative habitat model for the Mojave Population of the desert tortoise. Poster Presentation at the Mojave Desert Science Symposium. November 16-18. Redlands, CA.
Germano, D.J. and M.A. Joyner. 1989. Changes in a desert tortoise (Gopherus agassizii)
population after a period of high mortality. In: Szaro, R.C., K.E. Severson, and D.R. Patton. (ed.). Management of amphibians, reptiles and small mammals in North America. USDA. Forest Service. General Technical Report RM-166:190-198.
Gibbons, J. W., and K. M. Andrews. 2004. PIT tagging: simple technology at its best.
BioScience. 54:447-454. Goodwin, R. G., J. M. Miller, and K. R. Rautenstrauch. 1995. Survival, movements, and
burrow use of hatchling desert tortoises at Yucca Mountain, Nevada (Abstract). The Proceedings of the Desert Tortoise Council. P. 70.
Gotelli, N. 2001. A primer of ecology, 3rd edition. Sinauer Associates, 265 pp.

Ft Irwin Translocation Plan. 49
Griffith, B., M. Scott, J. W. Carpenter, and C. Reed. 1989. Translocation as a species conservation tool status and strategy. Science 245:477-480.
Grover, M.C. and L.A. DeFalco. 1995. Desert tortoise (Gopherus agassizii): Status-of-
knowledge outline with references. U.S. Department of Agriculture. General Tech. Report. INT-GTR-316. 134pp.
Hansen, R. M., M. K. Johnson, and T. R. Van Devender. 1976. Foods of the Desert
Tortoise, Gopherus agassizii, in Arizona and Utah. Herpetologica 32:247-251. Hazard, L. C., and D. J. Morafka. 2002. Comparative dispersion of neonate and
headstarted juvenile desert tortoises (Gopherus agassizii): a preliminary assessment of age effects. Chelonian Conservation and Biology 4:406-409.
Henen, B. T. 1997. Seasonal and annual energy budgets of female desert tortoises
(Gopherus agassizii). Ecology 78:283-296. Henen, B. T. 2002. Energy and water balance, diet, and reproduction of female desert
tortoises (Gopherus agassizii). Chelonian Conservation and Biology 4:319-329. Henen, B. T., M. D. Hofmeyr, and E. H. W. Baard. 2005. Preliminary health assessments
of confiscates southern African tortoises: a conservation success. Chelonii. In Press. Hensley, M.M. 1950.Notes on the natural history of Heloderma suspectum. Transactions
of the Kansas Academy of Science. 53:268-269 Hillard, S. 1996. The importance of the thermal environment to juvenile desert tortoises.
Masters Thesis. Colorado State University, Ft. Collins, CO. Hinton, T. G., P. D. Fledderman, J. E. Lovich, J. D. Congdon, and J. W. Gibbons. 1997.
Radiographic determination of fecundity: is the technique safe for developing turtle embryos? Chelonian Conservation and Biology 2: 409-414.
Hohman, J.P. and R.D. Ohmart. 1980. Ecology of the desert tortoise on the Beaver Dam
Slopes, Arizona. Contract YA-510-PH7-54. Report for the U.S. Department of the Interior, Bureau of Land Management , Arizona Strip District Office, St. George, UT. 45p + appendix.
Jacobson, E. R. 2000. Collecting biological samples for clinical evaluation. In Concepts
of reptile disease and surgical techniques. University of Florida. http://iacuc.ufl.edu/OLD%20Web%20Site/bloodsample.htm
Jacobson, E. R., and K. H. Berry. 2004. Necropsies of six desert tortoises (Gopherus
agassizii) from California. Presentation at the Desert Tortoise Council Symposium, Las Vegas, Nevada. [Presentation with Abstract].
Ft Irwin Translocation Plan. 50
Jacobson, E. R., J. M. Gaskin, M. B. Brown, R. K. Harris, C. H. Gardiner, J. L. LaPointe, H. P. Adams, and C. Reggiardo. 1991. Chronic Upper Respiratory Tract Disease of Free-Ranging Desert Tortoises (Xerobates agassizii). Journal of Wildlife Diseases 27:296-316.
Jennings, W. B. 2002. Diet selection by the desert tortoise in relation to the flowering
phenology of ephemeral plants. Chelonian Conservation and Biology 4:353-358. Karanth, K. U. 1995. Estimating tiger Panthera tigris populations from camera-trap data
using capture-recapture models. Biological Conservation 71:333-338. Keller, C. 1993. Use of fluorescent pigment for tortoise nest location. Herpetological
review 24:140-141. Kristan, W. B., and W. I. Boarman. 2003. Spatial pattern of risk of common raven
predation on desert tortoises. Ecology 84:2432-2443. Kuchling, G. 1989. Assessment of ovarian follicles and oviductal eggs by ultra-sound
scanning in live freshwater turtles, Chelonia oblonga. Herpetologica 45:89-94. Lance, V. A., J. S. Grumbles, and D. C. Rostal. 2001. Sex differences in plasma
corticosterone in desert tortoises, Gopherus agassizii, during the reproductive cycle. Journal of Experimental Biology 289:285-289.
Latta, S. C. 2000. Making the leap from researcher to planner: lessons from avian
conservation planning in the Dominican Republic. Conservation Biology 14:132-139. Lohoefener, R., and Lohmeier, L. 1986. Experiments with gopher tortoise (Gopherus
polyphemus) relocation in southern Mississippi. Herpetological Review 17:37-40. Longshore, K. M. 2003. Desert tortoise (Gopherus agassizii) survival at two eastern
Mojave Desert sites: death by short-term drought? Journal of Herpetology 37:169-177.
Luckenbach, R. A. 1982. Ecology and management of the desert tortoise (Gopherus
agassizii) in California. In North American tortoises: Conservation and Ecology. Bury, R. B., ed. United States Department of the Interior, Fish and Wildlife Service. Washington, D. C. Fish and Wildlife Research #12:1-37.
Mahmoud, I., L. J. Guillette, M. E. McAsey, and C. Cady. 1989. Stress-induced changes
in serum testosterone, estradiol 17b and progesterone in the turtle, Chelydra serpentina. Comparative Biochemistry and Physiology 93A:423-427.
Marlow, R. W., and, and K. Tollestrup. 1982. Mining and exploitation of natural mineral
deposits by the desert tortoise, Gopherus agassizii. Animal Behavior 30:475-478.
Ft Irwin Translocation Plan. 51
McGarigal, K., S. A. Cushman, M. C. Neel, and E. Ene. 2002. FRAGSTATS: Spatial pattern analysis program for categorical maps. Computer software program. University of Massachusetts, Amherst. www.umass.edu/landeco/research/fragstats/fragstats.html
Medica, P.A., R.B. Bury, and R.A. Luckenbach. 1980 Drinking and construction of water
catchments by the desert tortoise, Gopherus agassizii, in the Mojave Desert. Herpetologica 36:301-304.
_____, _____, F. B. Turner. 1975. Growth of the desert tortoise (Gopherus agassizii) in
Nevada. Copeia 1975:639-643. Medica, P. A., C. L. Lyons, and F. B. Turner. 1986. “Tapping”: A technique for capturing
tortoises. Herpetological Review 17:15-16. Merkler, D. J. and L. J. Lato. 1999. Soil suitability for burrowing by desert tortoise. pp
212-272 in Soil survey of Clark County Area, Nevada. Lake Mead National Recreation Area Special Report, Natural Resources and Conservation Service.
Morrison, M. L. 2002. Wildlife Restoration. In Ch. 5 - Fundamentals of Monitoring.
Society for Ecological Restoration. Island Press. Washington, D.C. Pp. 103-117. Nagy, K. A., and P. A. Medica. 1986. Physiological ecology of desert tortoises in
southern Nevada. Herpetological 42:73-92. Nagy, K. A., B. T. Henen, and D.B. Vyas. 1998. Nutritional quality of native and
introduced food plants of wild desert tortoises. Journal of Herpetology 32:260-267. Ng, S. J., J. W. Dole, R. M. Sauvajot, S. P. D. Riley, and T. J. Valone. 2004. Use of
highway undercrossings by wildlife in southern California. Biological Conservation 115:499-507.
Nussear, K. E., T. C. Esque, and C. R. Tracy. In Review. Hibernation of Desert Tortoises:
Temperature, Timing and Environment. Submitted to Copeia. Nussear, K. E., T. C. Esque, and C. R. Tracy. 2002. Continuously Recording Body
Temperature in Terrestrial Chelonians. Herpetological Review 33:113-114. Nussear, K. E. 2004. Mechanistic investigation of the distributional limits of the desert
tortoise Gopherus agassizii. Dissertation. University of Nevada, Reno. Nussear, K. E., C. R. Tracy, T. C. Esque, K. Dean-Bradley, K. Castle, and L. A. Defalco.
1995. Diet selection: Addressing the hypothesis of nutritional wisdom. National Biological Service Desert Tortoise Nutrition Workshop. Zyzzx, CA.
O'Connor, M. P., L. C. Zimmerman, D. E. Ruby, S. J. Bulova, and J. R. Spotila. 1994.
Home range size and movements by desert tortoises, Gopherus agassizii, in the eastern Mojave desert. Herpetological Monographs 8:60-71.

Ft Irwin Translocation Plan. 52
Oftedal, O.T., M.P. Allen, and T. Christopher. 1995. Dietary potassium affects food
choice, nitrogen retention and growth of desert tortoises. The Proceedings of the Desert Tortoise Council. Pp. 58-61.
Oftedal, O. T., S. Hillard, and D. J. Morafka. 2002. Selective spring foraging by juvenile
desert tortoises (Gopherus agassizii) in the Mojave Desert: evidence of an adaptive nutrition strategy. Chelonian Conservation and Biology 4:341-352.
Origgi, F., C. H. Romero, P. Klein, K. Berry, and E. Jacobson 2002. Serological and
molecular evidences of herpesvirus exposure in desert tortoises from the Mojave Desert of California [Abstract]. Proceeding of the Desert Tortoise Council. 30-31.
Pedrono, M., and Sarovy, A. 2000. Trial release of the world's rarest tortoise Geochelone
yniphora in Madagascar. Biological Conservation 95(3):333-42. Peterson, C. C. 1994. Different rates and causes of high mortality in two populations of
the threatened desert tortoise Gopherus agassizii. Biological Conservation 70:101-108.
Platenberg, R. J., and Griffiths, R. A. 1999. Translocation of slow-worms (Anguis
fragilis) as a mitigation strategy: a case study from south-east England. Biological Conservation 90:125-32.
Reinert, H. K. 1991. Translocation as a conservation strategy for amphibians and reptiles:
Some comments, concerns, and observations. Herpetologica 47(3): 357-363. Rostal, D. C., V. A. Lance, J. S. Grumbles, and A. C. Alberts. 1994. Seasonal
reproductive cycle of the desert tortoise (Gopherus agassizii) in the eastern Mojave desert. Herpetological Monographs 8:72-82.
Rostal, D. C., J. S. Grumbles, and V. A. Lance 2001. Reproduction and URTD in the
desert Tortoise (Gopherus polyphemus): an eight year follow-up [abstract]. The Proceedings of the Desert Tortoise Council .81-82.
Ruby, D. E., and H. A. Niblick. 1994. A behavioral inventory of the desert tortoise:
development of an ethogram. Herpetological Monographs 8:88-102. Ruby, D. E., L.C. Zimmerman, S.J. Bulova, C.J. Salice, M.P. O'Connor, and J.R. Spotila.
1994. Behavioral responses and time allocation differences in desert tortoises exposed to environmental stress in semi-natural enclosures. Herpetological Monographs 8:27-44.
Saethre, M. B., T. C. Esque, P. A. Medica, R. Marlow, and C. R. Tracy. 2003.
Determining the carrying capacity of desert tortoises [abstract]. The Proceedings of the Desert Tortoise Council.149.
Ft Irwin Translocation Plan. 53
Salafsky, N., R. Margoluis, K. H. Redford, and J. G. Robinson. 2002. Improving the practice of conservation: a conceptual framework and research agenda for conservation science. Conservation Biology 16:1469-1479.
Seeman, D. E., and R. A. Powell. 1996. An evaluation of the accuracy of kernel density
estimators of home range analysis. Ecology 77:2075-2085. Stebbins, R. C., 1974. Off-road vehicles and the fragile desert. Environment Southwest:
3-8. Tasse, J. 1989. Translocation as a strategy for preserving endangered species.
Endangered species update 6:6. Tracy, C. R., and C. R. Tracy. 1995. Estimating age of desert tortoises (Gopherus
agassizii) from scute rings. Copeia 1995:964-966. Tracy, C.R., R. Averill-Murray, W. Boarman, D. Delehanty, J. Heaton, E. McCoy, D.
Morafka, K. Nussear, B. Hagerty, P. Medica. 2004. Desert Tortoise Recovery Plan Assessment.
Tracy, C.R., K.E. Nussear, T.C. Esque, K. Dean-Bradley, K. Castle, and L.A. DeFalco.
2003. Diet selection: The nutritional wisdom hypothesis [Abstract]. Proceedings of the Desert Tortoise Council. Pp. 167-169.
Turchin, P. 1998. Quantitative analysis of movement. Sinauer Associates Inc.,
Sunderland, MA. Turner, F. B., P. Hayden, B. L. Burge and J. B. Roberson. 1986. Egg production by the
desert tortoise (Gopherus agassizii) in California. Herpetologica 42:93-104. Turner, F. B., K. H. Berry, D. C. Randall and G. C. White. 1987a. Population ecology of
the desert tortoise at Goffs, California. 1983-1987. Report to Southern California Edison company, Research and Development Series 87-RD-81.
Turner, F. B., P. A. Medica and R. B. Bury. 1987b. Age-size relationships of desert
tortoises (Gopherus agassizii) in southern Nevada. Copeia 1987(4):974-979. Turner, F. B., P. A. Medica, and C. L. Lyons. 1984. Reproduction and survival of the
desert tortoise (Scaptochelys agassizii) in Ivanpah Valley, California. Copeia. 1984: 811-820.
Turner, R. 1982. Mojave Desertscrub. In Biotic Communities of the American
Southwest. Brown, D.E., (ed.). Special Issue - Desert Plants 4(1-4). University of Arizona.
Ft Irwin Translocation Plan. 54
Van Devender, T. R., R. C. Averill-Murray, T. C. Esque, P. A. Holm, V. M. Dickinson, C.R. Schwalbe, E. B. Wirt and S. L. Barrett. 2002. Grasses, mallows, desert vine and more: Diet of the desert tortoise in Arizona and Sonora. Chapter 8 In The Sonoran Desert tortoise: Natural history, biology, and conservation. T. R. Van Devender, ed. University of Arizona Press. Pp. 159-193.
von Seckendorff Hoff, K., and R. W. Marlow. 2002. Impacts of vehicle road traffic on
desert tortoise populations with consideration of conservation of tortoise habitat in southern Nevada. Chelonian Conservation Biology 4: 449-457.
Wallis, I. R. B. T. Henen, and K. A. Nagy. 1999. Egg size and annual egg production by
female desert tortoises (Gopherus agassizii): the importance of food abundance, body size and date of egg shelling. Journal of Herpetology 33: 394.
Walde, A., D. Delaney, L. Pater, M. Harless and M. Quillman. 2004. Proposed
application of automated technology to monitor the activity and movement of translocated desert tortoises in the Mojave Desert, CA. Paper presented at the 2004 Gopher Tortoise Council Symposium, Jekyll Island, GA.
Walde, A., L. Bol, D. Delaney, L. Pater, and M. Quillman. 2003. Activity patterns of
desert tortoises at the CERL study site, Fort Irwin in the Western Mojave Desert: First season results. CERL report.
Webb, R. H., and H. G. Wilshire. 1980. Recovery of soils and vegetation in a Mojave
Desert ghost town, Nevada, U.S.A. Journal of Arid Environments 3: 291-303. Webb, R. H., M. B. Murov, T. C. Esque, D. E. Boyer, L. A. DeFalco, D. F. Haines, D.
Oldershaw, S. J. Scoles, K. A. Thomas, J. B. Blainey, P. A. Medica. 2003. Perennial vegetation data form permanent plots on the Nevada Test Site, Nye County, Nevada. U.S. Geological Survey Open File Report 03-336. US Government Printing Office. 251 pp.
Went, F. W. 1948. Ecology of desert plants. I. Observations on germination in the Joshua
Tree National Monument, California. Ecology 29:242-253. Williams, R. 2002. Design Criteria and Development of the ARS-Vivant Wildlife
Protector System. Proceedings of the Desert Tortoise Council. Wilson, R. 1989. The relationship between soil types and population densities of the
desert tortoise (Gopherus agassizii). Proceedings of the 1987-1991 Desert Tortoise Council Symposia. P. 214.
Woodbury, A. M., and R. Hardy. 1948. Studies of the Desert Tortoise, Gopherus
agassizii. Ecological Monographs 18:146-200. Worton, B. J. 1987. A review of models of home range for animal movement. Ecological
Modelling 38:277-298.

Ft Irwin Translocation Plan. 55
Appendix 1. Guidance on Translocations Provided by the Desert
Tortoise Recovery Plan
The Desert Tortoise Recovery Plan (Fish and Wildlife Service 1994, Appendix B) contains specific recommendations for translocation of desert tortoises that are relevant to this plan (K. Berry – Personal Communication August 2004) and are addressed herein. The seven guidelines from the Recovery Plan are given below, and they provide cautions that the Recovery Team recommended for translocation projects. However, these guidelines have little possibility of all being applied simultaneously due to a lack of data for many metrics such as carrying capacity and population trends (Tracy et al. 2004:19-25). In addition new and relevant research has been conducted that provides new information on translocation of desert tortoises, and it has been recommended that these guidelines be revisited (Tracy et al. 2004:19-25). We discuss possible considerations and limitations that may be imposed on translocation efforts by the strict adherence to these guidelines. Where possible these guidelines have been followed. Guideline 1.
“Experimental translocations should be done outside experimental management zones. No desert tortoises should be introduced into DWMAs [Desert Wildlife Management Areas]—at least until relocation is much better understood.” The Recovery Plan for the desert tortoise is the basis and key strategy for recovery and delisting of the desert tortoise. The Recovery Plan divides the range of the desert tortoise into six distinct recovery units and recommends the establishment of 14 desert wildlife management areas (DWMAs) throughout the recovery units. Within each desert wildlife management area, the Recovery Plan recommends implementation of reserve level protection of desert tortoise populations and habitat, while maintaining and protecting other sensitive species and ecosystem functions. The Recovery Plan recognized both the potential merits and dangers associated with translocation of tortoises. For example, while the first guideline recommended not releasing translocated tortoises into DWMAs, the guideline itself, and other references in the Recovery Plan suggest this would be an accepted strategy once translocation was understood in greater detail (e.g., Fish and Wildlife Service 1994, p. 45). Indeed, translocation of tortoises into several DWMAs was prescribed as recommended research (Fish and Wildlife Service 1994, pages F21, F30, and F36). Tortoises translocated due to the expansion of Ft. Irwin will require fairly large protected areas due to the numbers of tortoises thought to inhabit the expansion areas. If these animals are to be assured long-term protection, then successful conservation management will require that the tortoises be placed in an area currently designated as a DWMA (Fish and Wildlife Service 1994), or in other areas that would have to be dedicated to tortoise conservation. To our knowledge the DWMAs are the only suitable large tracts of land that are available for translocation that afford long-term protection to translocated tortoise populations. If tortoises are not moved into DWMAs their chances for long-term survival

Ft Irwin Translocation Plan. 56
may be reduced, compromising the conservation value of the translocation, unless long-term conservation agreements can be established for other areas.
Guideline 2.
“All translocations should occur in good habitat where the desert tortoise population is known to be substantially depleted from its former level of abundance…”
The second guideline requires knowledge of historical abundance of tortoises, and the attributes that constitute “good tortoise habitat”. There has been considerable analysis of the status of desert tortoise populations throughout the range of the listed species. It is clear from these analyses that there have been serious declines on several permanent study plots throughout the Mojave Desert and in areas peripheral to Ft. Irwin in particular (Berry and Medica 1995, Karl 2002, Berry 2003, Tracy et al. 2004). The extent to which we can reliably extrapolate information from permanent study plots to larger populations is debatable (Tracy et al. 2004), but it is generally agreed that we do not have sufficient information to document population trends throughout the Western Mojave bio-regional planning area. Thus, there is no reliable way to guarantee that any site selected to translocate desert tortoises would meet the guideline. However, the consistency in population declines among study plots in the West Mojave Recovery Unit suggests the numbers of animals throughout much of the planning area are well below densities that existed in the 1970s and 1980s. To the extent possible, areas of suspected declines (e.g., along formerly unprotected highway rights-of-way, or die-off areas) should be used experimentally, as the causes for the declines are still unknown (Frazer 1992, Tracy et al. 2004). While many tortoise biologists have a general concept of what constitutes “good tortoise habitat” this has not been quantitatively documented in the peer-reviewed literature. Thus, other than heuristic examinations of the habitat, little can be done to guarantee that a given area is “good tortoise habitat”. Guideline 3.
“Areas into which desert tortoises are to be relocated should be surrounded by a desert tortoise-proof fence or similar barrier...”
The proposed recipient sites are within a large geographic area that will be bounded by tortoise-proof fences (e.g. along the southern boundary of the SEA, and the northern boundary of Interstate 15) or other effective boundaries (e.g., mountain ranges and playas) that should contain the translocated tortoises. In addition, tortoises may be released into smaller experimental pens within the larger area. Final determination of the fencing requirements for this plan requires coordination among several agencies (e.g., the Fish and Wildlife Service, the California Department of Fish and Game, the Bureau of Land Management, California Transportation Department, and the U. S. Army).
Ft Irwin Translocation Plan. 57
Guideline 4.
“The best translocations into empty habitat involve desert tortoises in all age classes, in the proportions in which they occur in a stable population…”
Search efforts will include efforts to locate tortoises of all size-classes. The numbers of juvenile tortoises that are encountered will likely depend on the climate for the last several years, and the method that is used during the majority of the clearances. Juvenile tortoises will be released at each of the recipient sites as they are available. This will result in a relatively even dispersion of animals throughout the recipient sites. Juveniles that are released will be monitored in order to quantify aspects of the short term goals that apply to smaller sized classes of animals. Research that focuses on juvenile tortoise issues may be a more efficacious use of juvenile tortoises (Doak et al. 1994).
Guideline 5.
“The number of desert tortoises introduced should not exceed the pre-decline density (if known). If the pre-decline density is not known, introductions should not exceed 100 adults or 200 animals of all age classes per square mile … ”
Reliable estimates of desert tortoise densities (especially historic estimates) are available for few sites in the Mojave. It is unlikely that the sites that meet other translocation criteria will have empirically known “pre-decline” densities. Research on the effects of density on desert tortoise ecology has been conducted by the USGS and UNR in several semi-natural tortoise enclosures. Possible density effects on growth were observed at densities greater than 500 - 800 tortoises per sq. km (Saethre et al. 2003). We have considered historic densities and results from recent experiments to aid in determining target densities for proposed tortoise translocation sites. Adult tortoises will be translocated in small groups (e.g., 50-70 /sq. mi) to many different translocation sites in order to disperse them throughout the release areas. Recent density surveys for the Superior-Cronese DWMA estimate approximately 7.5 tortoises per sq km (P. Medica Personal Communication). Thus, given these densities, the number of adult tortoises is not expected to exceed densities of 100 per square mile after translocation. Guideline 6.
“All potential translocatees should be medically evaluated in terms of general health and indications of disease, using the latest available technology, before they are moved. All translocatees should be genotyped unless the desert tortoises are to be moved only very short distances or between populations that are clearly “genetically” homogeneous. All translocated animals should be permanently marked, and most should be fitted with radio transmitters so that their subsequent movements can be closely tracked.” Thorough medical screening of all tortoises will be conducted prior to translocation. At the time of medical examination, sufficient samples will also be taken for genetic analysis.
Ft Irwin Translocation Plan. 58
Genetic analyses with sufficient resolution to distinguish differences among populations in the West Mojave Recovery Unit have not been conducted, although this is a subject of current research. Therefore the recipient sites suggested for translocation are in the DWMAs adjacent to expansion areas when possible. All animals that can accommodate a transmitter with a battery life of at least 1 year (i.e. transmitter package must be less than 10% of the tortoise body mass) will have radios attached prior to translocation during clearance surveys. Animals too small for the radios will be moved to holding structures designed for the containment of juvenile tortoises during clearances (e.g., the FISS enclosures, Hazard and Morafka 2002). All animals will be marked with an external number, have a PIT tag affixed to the carapace, and may be notched as permitting allows. Guideline 7.
“ If desert tortoises are to be moved into an area that already supports a population—even one that is well below carrying capacity—the recipient population should be monitored for at least 2 years prior to the introduction. Necessary data include the density and age structure of the recipient population, home ranges of resident desert tortoises, and general ecological conditions of habitat. Areas along paved highways can serve as good translocation sites, if properly fenced…” A thorough evaluation of the physical parameters of recipient sites will be conducted, as well as, a population and health survey of resident tortoises prior to translocation. The timeline and the urgency of the Ft. Irwin expansion into the SEA may not permit a full two-year study of resident populations in the recipient sites for the SEA tortoises before translocation must occur. The sites selected resulted from a decision support process that included scenarios that considered major roads in both fenced and unfenced status. In scenarios where major roads were considered to be fenced, the model identified possible recipient sites near roads. Literature Cited
Berry, K. H. 2003. Declining trends in desert tortoise populations at long-term study plots in California between 1979 and 2002: multiple causes. Paper presented at the 2003 Desert Tortoise Council Symposium, Las Vegas, Nevada.
Berry, K. H. and P. A. Medica, 1995. Desert tortoises In the Mojave and Colorado
Deserts. In Our Living Resources. LaRoe, E. T., G. S. Farris, C. E. Puckett, P. D. Doran, and M. J. Mac, eds. U.S. Department of the Interior – National Biological Service. Washington, DC. Pp. 135-137.
Doak, D., P. Kareiva, and B. Klepetka. 1994. Modeling population viability for the desert
tortoise in the western Mojave Desert. Ecological Applications 4:446-460

Ft Irwin Translocation Plan. 59
Fish and Wildlife Service. 1994. Desert tortoise (Mojave population) Recovery Plan. Frazer, N. B. 1992. Sea turtle conservation and halfway technology. Conservation
Biology 6:179-184. Karl, A. E. 2002. Desert tortoise abundance in the Fort Irwin National Training Center
expansion area: second-year studies. 45 pp. plus appendices. Hazard, L. C., and D. J. Morafka. 2002. Comparative dispersion of neonate and
headstarted juvenile desert tortoises (Gopherus agassizii): a preliminary assessment of age effects. Chelonian Conservation and Biology 4:406-409.
Saethre, M. B., T. C. Esque, P. A. Medica, R. Marlow, and C. R. Tracy. 2003.
Determining the carrying capacity of desert tortoises [abstract]. The Proceedings of the Desert Tortoise Council.149.
Tracy, C. R., R. Averill-Murray, W. Boarman, D. Delehanty, J. Heaton, E. McCoy, D.
Morafka, K. Nussear, B. Hagerty, P. Medica. 2004. Desert Tortoise Recovery Plan Assessment.
Ft Irwin Translocation Plan. 60
Appendix 2. Minimum Requirements for the Translocation Plan
Established in the Biological Opinion
Fish and Wildlife Service. 2004. Biological opinion for the proposed addition of maneuver training lands at Fort Irwin, California. BO# 1-8-03-F-48, March 15, 2004. The translocation plan was to provide information on: a. The methods used to collect, hold, transport, and release tortoises at translocation (recipient) sites. These methods are described in the Translocation Procedures section of the Translocation Plan. b. A procedure on how to determine appropriate translocation sites. The USFWS recommended that a GIS-based model be used to identify recipient sites for the placement of translocated tortoises (D. Threloff, USFWS – Personal Communication). Scientists at the USGS, the Redlands Institute and the University of Nevada, Reno (UNR) collaborated on the development of a geographical decision support model to provide an objective tool for the selection of recipient sites for translocated tortoises. The model combined data on attributes and expert-opinion about tortoise habitat, threats to tortoises, recent tortoise surveys and important anthropogenic factors (e.g., land ownership, road status, projected urban growth) that were available through a variety of sources. This model was used to construct several scenarios of the suitability of lands in the west Mojave Desert for translocation of tortoises. These scenarios were developed to identify acceptable translocation sites based on multiple criteria, such as population die off information (see below), land ownership attributes, habitat suitability, level of habitat disturbance, and accessibility by the public, and the presence of major roads (with fenced and unfenced scenarios). These scenarios were presented to the Conservation Mitigation Working Group, so that a final consensus on the most suitable sites for translocation could be achieved. The results of that decision are presented in the Translocation Plan as the areas proposed for translocation activities. c. The personnel who would be involved in the mechanics and research monitoring related to translocation. It is expected that there are many scientists that will be participating in different aspects of the translocation during the expansion of Ft. Irwin. The Conservation Mitigation Working Group determined that this plan would be limited to the selection of translocation sites, the movement of the tortoises, and a description of the criteria that may be used to measure short- and long-term success of this translocation. After the initial tasks of translocation, research will be conducted that is focused toward monitoring efficacy of the activities that are part of this plan. We cannot foresee all possible personnel or projects that will be involved in the translocation activities.
Ft Irwin Translocation Plan. 61
However all personnel working with tortoises will have appropriate experience and training as required by the permitting agencies. d. The procedures for determining the health of the desert tortoises and for the disposition of unhealthy animals. The health status of tortoises will be evaluated prior to and after translocation in accordance with goals of the short- and long-term monitoring programs. The procedures of determining the health status of translocated and resident animals affected by the Ft. Irwin expansion and the disposition of diseased animals is discussed in detail in the Health Screening and Translocation of Diseased Tortoises section of the translocation plan. e. The methods that will be used to manage and protect the translocation sites. Three types of recipient sites may be used for translocated tortoises. 1) Sites with extant tortoise populations will receive some of the tortoises with minimal restrictions, 2) sites with extant tortoise populations, depressed populations, or extirpated populations may receive a portion of the translocated animals as experimental releases, and 3) smaller fenced sites may be used for manipulative experiments or to segregate diseased individuals in groups. In addition there will be control sites where residents are not manipulated beyond monitoring the metrics identified in the short- and long-term goals, but where translocated tortoises are not present. Specific instructions about how translocation sites will be protected are provided in the section called, “Protection of Translocation Sites”. f. A method of determining when desert tortoises would be moved across the southern boundary fence or to a more distant translocation site. Methods of determining when tortoises are to be moved across the southern boundary fence or distant translocation sites are described above in the section entitled, “Determining when desert tortoises would be moved across the southern boundary fence.” g. A description of any radio transmitters, data recorders and PIT tags that may be used. The descriptions of the radio transmitters, or data recorders (loggers) that will be attached to tortoises, and PIT tags that will be used to mark tortoises are discussed in the SEA Clearance - Tortoise Procedures section of the Translocation Plan.
Ft Irwin Translocation Plan. 62
Appendix 3. Detailed Description of the Decision Support Model Redlands Institute: Thomas Leuteritz, Paul Burgess, Frank Davenport, Nathan Strout
Base Data
Public Land Survey System (PLSS)
The Public Land Survey System (PLSS) was used as the standard management unit for all geoprocessing analysis. All model criteria was generalized to the section level as defined by the PLSS.
Source Data
Public Land Survey System (PLSS), published January 1999, 1:100,000 California Spatial Information Library, Sacramento, CA http://gis.ca.gov Abstract The 'PLSFILL' layer is a polygon coverage depicting the township, range and sections contained in the Public Land Survey System grid for the State of California. Townships are roughly six miles square, and are numbered North and South from an established baseline. Likewise, ranges are numbered east and west from an established meridian. This grid is then subdivided into 36 one square-mile (640 acre) sections. California uses three baseline/meridians, these being Humboldt, Mt. Diablo, and San Bernardino, abbreviated H, M, and S. Meridian, township, range, and section values are combined in the redefined item MTRS to facilitate relates.
Processing Steps
The Public Land Survey System (PLSS) source data was altered to clip the source data to the study area as well as construct abstract sections for analysis in a previously un-sectioned area of the northeast the study area – the West Mojave Planning Unit (WEMO). These abstract sections were assigned a meridian of 9, all other attributes were assigned appropriate township, range, and section field values based on the standard PLSS numbering practices. Therefore, these sections may be identified by a value of 9 in the “Meridian” field as well as in the first character of the “MTRS” field.
Ft Irwin Translocation Plan. 63
Criteria
Urban Areas
Purpose
Tortoise habitat is degraded and human disturbance is high within or close to urban areas. Therefore translocating tortoises away from urban areas is more favorable.
Source Data
U.S. Census Urbanized Areas, published March 2000, 1:100,000 ESRI http://arcdata.esri.com/data/tiger2000/tiger_county.cfm?sfips=06 Abstract U.S. Census Urbanized Areas represents the Census 2000 Urbanized Areas (UA) and Urban Clusters (UC). A UA consists of contiguous, densely settled census block groups (BGs) and census blocks that meet minimum population density requirements (1000ppsm /500ppsm), along with adjacent densely settled census blocks that together encompass a population of at least 50,000 people. A UC consists of contiguous, densely settled census BGs and census blocks that meet minimum population density requirements, along with adjacent densely settled census blocks that together encompass a population of at least 2,500 people, but fewer than 50,000 people. The dataset covers the 50 States plus the District of Columbia within United States. An urbanized area (UA) consists of densely settled territory that contains 50,000 or more people. A UA may contain both place and nonplace territory. The U.S. Census Bureau delineates UAs to provide a better separation of urban and rural territory, population, and housing in the vicinity of large places. At least 35,000 people in a UA must live in an area that is not part of a military reservation. For Census 2000, UA delineations constitute a "zero-based" approach that requires no "grandfathering" of UA boundaries from the 1990 census. Because of the more stringent density requirements (and the less restrictive extended place criteria), some territory that was classified as urbanized for the 1990 census has been reclassified as rural. In addition, some areas that were identified as UAs for the 1990 census have been reclassified as urban clusters.
Processing Steps
A distance analysis was done to find the distance of the center of each PLSS section from the boundary of the nearest urban area. This was accomplished by developing a geoprocessing model that: Generated a point feature class of the midpoints of each section
1. A NEAR analysis was used to determine the distance from the midpoint to the boundary of the nearest urban area.
2. The distance results of the point feature class were joined back to the PLSS polygon feature class to reestablish geometry.
3. The results were then joined to a master criteria shapefile using the MTRS as the join item.
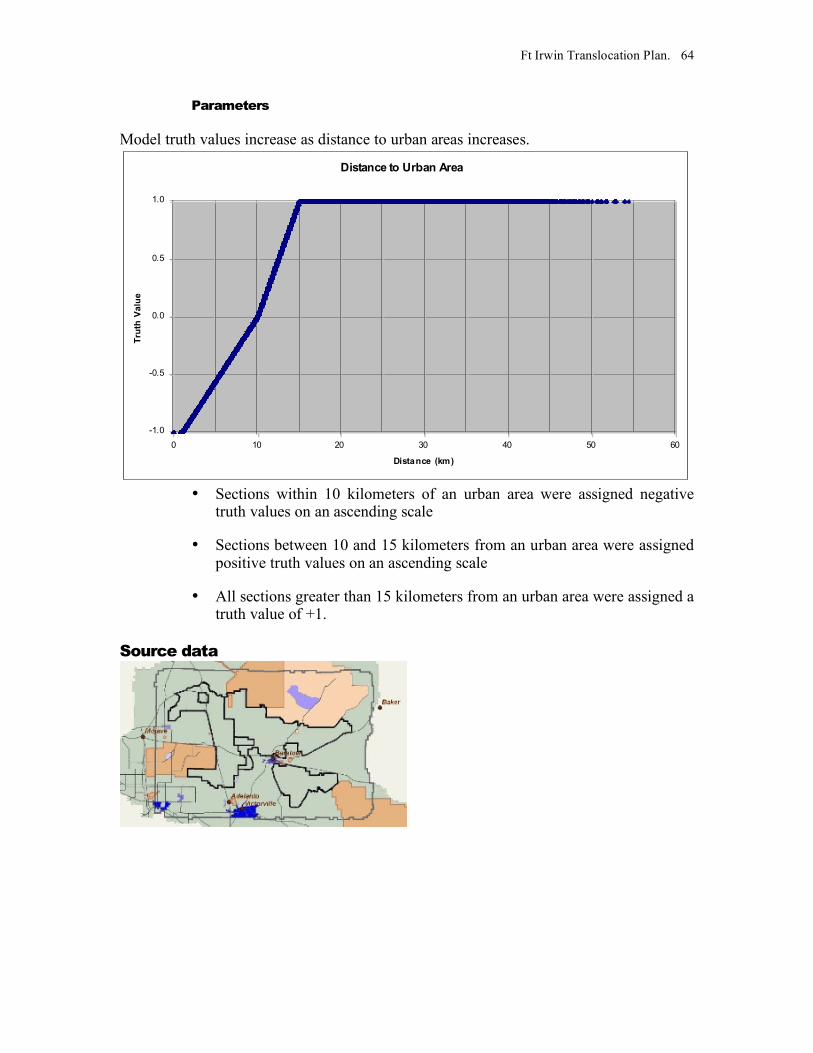
Ft Irwin Translocation Plan. 64
Parameters
Model truth values increase as distance to urban areas increases.
Distance to Urban Area
-1.0
-0.5
0.0
0.5
1.0
0 10 20 30 40 50 60
Distance (km)
Tru
th V
alu
e
• Sections within 10 kilometers of an urban area were assigned negative
truth values on an ascending scale
• Sections between 10 and 15 kilometers from an urban area were assigned positive truth values on an ascending scale
• All sections greater than 15 kilometers from an urban area were assigned a truth value of +1.
Source data

Ft Irwin Translocation Plan. 65
Results
Genetic
Purpose
Since the genetics for Desert Tortoises are not well known it is better to keep translocated tortoises closer to their source population than further away.
Source Data
Ft. Irwin NTC boundary, published May 1998, updated 2003, 1:100,000 DOD Ownership: Mojave Desert Ecosystem Project (MDEP) http://www.mojavedata.gov/home.html Abstract This dataset was extracted from the larger Mojave Desert land ownership database provided by the BLM and compiled by Utah State University. The data contained in this database includes polygons for DOD owned land only. The original linework was updated to reflect the final expansion boundary. In October 2000, extended negotiations between DA and DOI resulted in a DA/DOI agreement on proposed legislation that would determine boundaries of a western expansion area of Fort Irwin. This legislative proposal is a culmination of discussions in which the Army modified its training land requirements to avoid use of Paradise Valley, the most sensitive desert tortoise habitat. Under this new concept, the Army would seek the use of about 133,000 additional training acres, which includes approximately 22,000 acres of Fort Irwin land that is not currently used for this purpose, plus 46,438 acres east in Silurian Valley and 63,673 acres west in Superior Valley.
Processing Steps
A distance analysis was done to find the distance of the center of each PLSS section from the boundary of Fort Irwin. This was accomplished by developing a geoprocessing model that:
1. Generated a point feature class of the midpoints of each section
2. A NEAR analysis was used to determine the distance from the midpoint to the Fort Irwin boundary.

Ft Irwin Translocation Plan. 66
3. The distance results of the point feature class were joined back to the PLSS polygon feature class to reestablish geometry.
4. The results were then joined to a master criteria shapefile using the MTRS as the join item.
Parameters
Model truth values decrease as distance to Fort Irwin increases.
Distance to Fort Irwin
-1.000
-0.500
0.000
0.500
1.000
0 10 20 30 40 50 60 70 80 90 100 110 120
Distance (km)
Tru
th V
alu
e
• All sections within 10 kilometers of Fort Irwin were assigned a truth value of +1
• Sections between 10 – 25 kilometers from Fort Irwin were assigned values of +1 - +0.5 on a decreasing scale.
• Sections greater than 25 kilometers from Fort Irwin were assigned values of +0.5 - -1 on a descending scale. (The lowest truth value in the Area of Interest was -0.555)

Ft Irwin Translocation Plan. 67
Results
Source data
Fenced Roads
Purpose
Tortoises are known to wander at least 10 to 15 km after translocation. Since major roads act as a source of mortality and are barriers to tortoises, translocating tortoise should be less favorable at distances less than this. However, if major roads are fenced you increase the amount of usable habitat and you can translocate tortoises closer to the road since the fence prevents road mortality
Source Data
US Highways in California, published January 2002, 1:100,000 California Spatial Information Library, Sacramento, CA http://gis.ca.gov Abstract This dataset is one from a series of transportation layers are derived from the US Census Bureau Tiger 2K (June 7, 2002 Version) information.
Processing Steps
Required major roads were extracted for analysis. Parameters
Scenarios were run for assumptions about existing and planned fencing. Two different sets of parameters were established for these scenarios
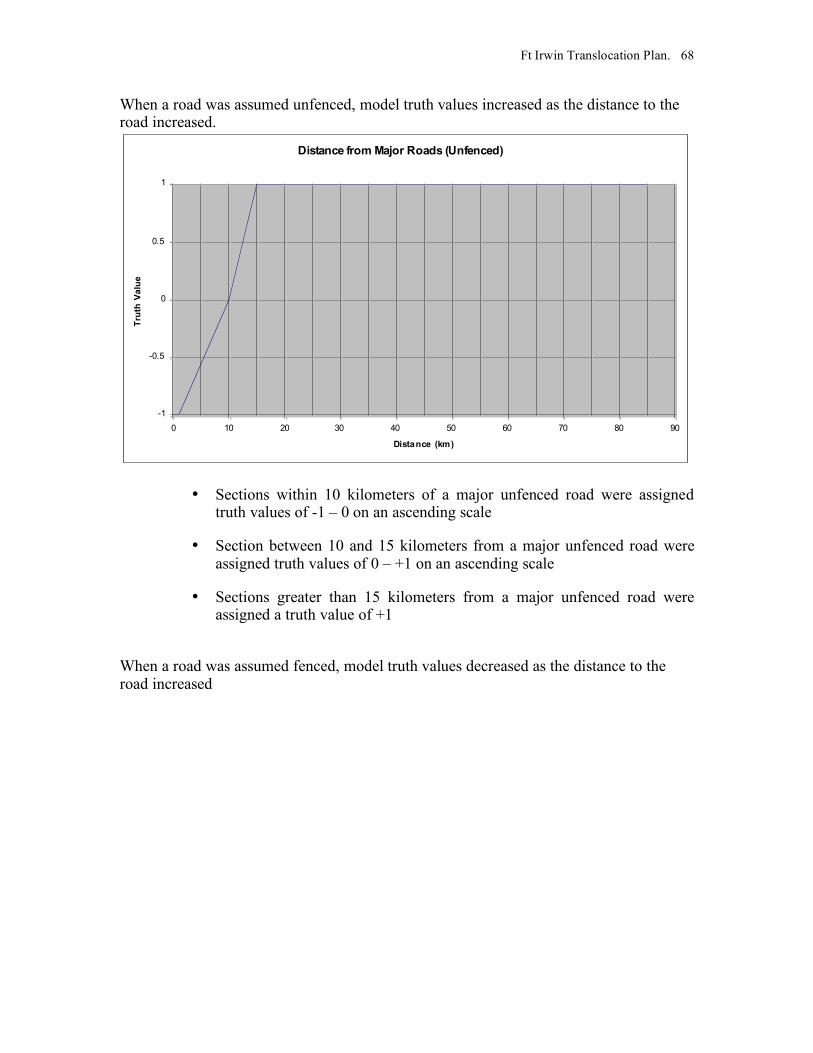
Ft Irwin Translocation Plan. 68
When a road was assumed unfenced, model truth values increased as the distance to the road increased.
• Sections within 10 kilometers of a major unfenced road were assigned
truth values of -1 – 0 on an ascending scale
• Section between 10 and 15 kilometers from a major unfenced road were assigned truth values of 0 – +1 on an ascending scale
• Sections greater than 15 kilometers from a major unfenced road were assigned a truth value of +1
When a road was assumed fenced, model truth values decreased as the distance to the road increased
Distance from Major Roads (Unfenced)
-1
-0.5
0
0.5
1
0 10 20 30 40 50 60 70 80 90
Distance (km)
Tru
th V
alu
e
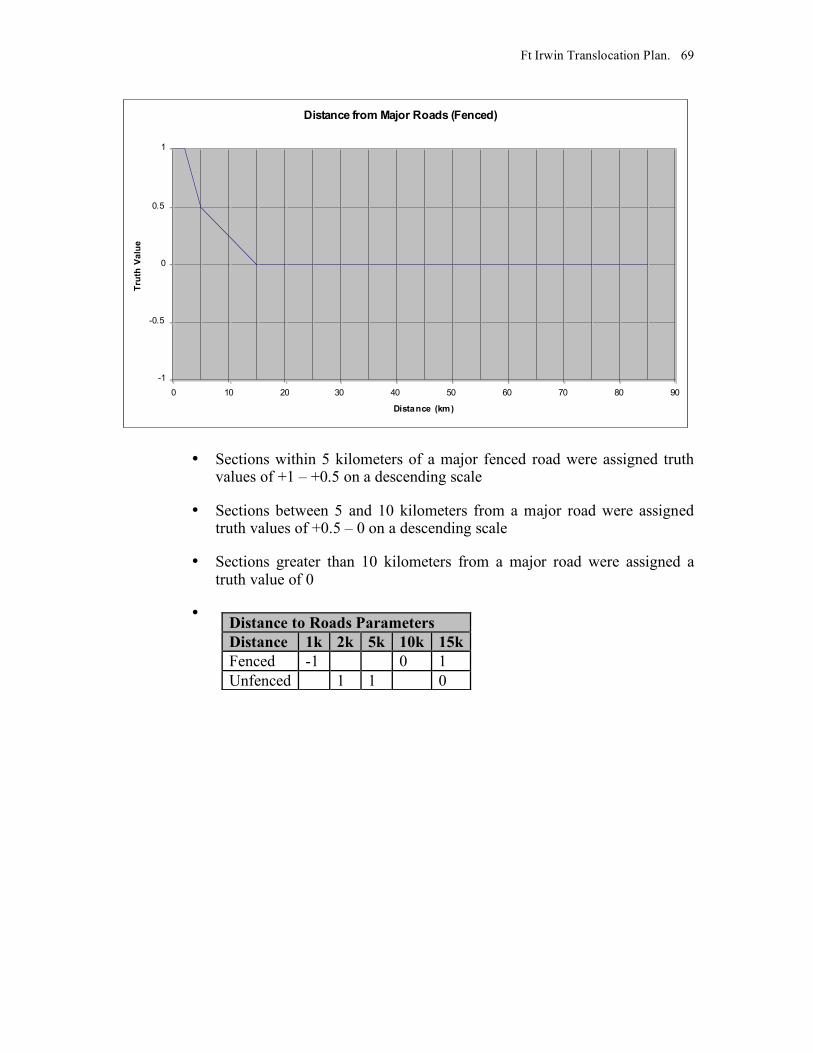
Ft Irwin Translocation Plan. 69
• Sections within 5 kilometers of a major fenced road were assigned truth
values of +1 – +0.5 on a descending scale
• Sections between 5 and 10 kilometers from a major road were assigned truth values of +0.5 – 0 on a descending scale
• Sections greater than 10 kilometers from a major road were assigned a truth value of 0
•
Distance to Roads Parameters Distance 1k 2k 5k 10k 15k Fenced -1 0 1 Unfenced 1 1 0
Distance from Major Roads (Fenced)
-1
-0.5
0
0.5
1
0 10 20 30 40 50 60 70 80 90
Distance (km)
Tru
th V
alu
e

Ft Irwin Translocation Plan. 70
Source data
Model Results – No roads fenced
Model Results - Fort Irwin Road, Irwin Road, I-15, and US 395 fenced
Ft Irwin Translocation Plan. 71
Road Fragmentation
Purpose
The more sections of road per unit area (miles of road per square mile) the more fragmented the habitat and the worse this was for tortoises. Translocation was therefore less favorable to given areas as fragmentation increased (on a gradient scale).
Source Data
1. California Local Roads, published January 2002, 1:100,000 California Spatial Information Library, Sacramento, CA http://gis.ca.gov
Abstract This dataset is one from a series of transportation layers are derived from the US Census Bureau Tiger 2K (June 7, 2002 Version) information. Local, Neighborhood, and Rural Road A road in this category (A4) is used for local traffic and usually has a single lane of traffic in each direction. In an urban area, this is a neighborhood road and street that is not a thorough-fare belonging in categories A2 or A3. In a rural area, this is a short-distance road connecting the smallest towns; the road may or may not have a state or county route number.
2. Other Thoroughfares in California, published January 2002, 1:100,000 California Spatial Information Library, Sacramento, CA http://gis.ca.gov
Abstract This dataset is one from a series of transportation layers are derived from the US Census Bureau Tiger 2K (June 7, 2002 Version) information. Road with Special Characteristics This category (A6) includes roads, portions of a road, intersections of a road, or the ends of a road that are parts of the vehicular highway system and have separately identifiable characteristics. Road as Other Thoroughfare A road in this category (A7) is not part of the vehicular highway system. It is used by bicyclists or pedestrians, and is typically inaccessible to mainstream motor traffic except for private-owner and service vehicles. This category includes foot and hiking trails located on park and forest land, as well as stairs or walkways that follow a road right-of-way and have names similar to road names.
3. California State Highways, published January 2002, 1:100,000 California Spatial Information Library, Sacramento, CA http://gis.ca.gov

Ft Irwin Translocation Plan. 72
Abstract This dataset is one from a series of transportation layers are derived from the US Census Bureau Tiger 2K (June 7, 2002 Version) information. Secondary and Connecting Road This category (A3) includes mostly state highways, but may include some county highways that connect smaller towns, subdivisions, and neighborhoods.
4. US Highways in California, published January 2002, 1:100,000 California Spatial Information Library, Sacramento, CA http://gis.ca.gov Abstract
This dataset is one from a series of transportation layers are derived from the US Census Bureau Tiger 2K (June 7, 2002 Version) information. Primary Highway with Limited Access Interstate highways and some toll highways are in this category (A1) and are distinguished by the presence of interchanges. Primary Road Without Limited Access This category (A2) includes nationally and regionally important highways that do not have limited access as required by category A1. It consists mainly of US highways, but may include some state highways and county highways that connect cities and larger towns.
5. Vehicular Trails in California, published January 2002, 1:100,000 California Spatial Information Library, Sacramento, CA http://gis.ca.gov Abstract
This dataset is one from a series of transportation layers are derived from the US Census Bureau Tiger 2K (June 7, 2002 Version) information. Vehicular Trail A road in this category (A5) is usable only by four-wheel drive vehicles, is usually a one-lane dirt trail, and is found almost exclusively in very rural areas.
6. 2001 BLM Route Designations, 2001, 1:100,000
Preliminary 2001 routes coverage acquired from Nanette Pratini, Staff Research Associate, UCR and GIS Database Manager, West Mojave and NECO PlansU.S. Bureau of Land Management http://www.ca.blm.gov/cdd/directory.html
Abstract This dataset contains routes which cross BLM designated land within the WEMO (West Mojave) management area. This dataset was developed to support the West Mojave Plan as "an attempt at defining a regional strategy for conserving plant and animal species and their habitats and to define an efficient, equitable, and cost-effective process for complying with threatened and endangered species laws."
Ft Irwin Translocation Plan. 73
Processing Steps
Due to the varying extent and scale of available road data (see source data descriptions above), it was necessary to append the datasets together into a new master roads dataset. This was done using a geoprocessing model to:
1. Append all datasets together using APPEND
2. Use INTEGRATE with a cluster tolerance of 50 meters to make digitizing discrepancies coincident.
3. Road fragmentation for this model was defined as the length of road per unit area. This was accomplished using a geoprocessing model. The process steps are as follows:
4. Use INTERSECT to split all road segments at the section boundaries. This will also assign section MTRS values to the appropriate road segments
5. DISSOLVE segments on the MTRS value
6. Calculate the length of dissolved road segments
7. JOIN to PLSS feature class using MTRS as the join item to establish polygon geometry
8. Calculate fragmentation values (length / area)
9. Convert meter length values to miles. (Miles were used for this criteria because sections are approximately one square mile)
10. The results were then joined to a master criteria shapefile using the MTRS as the join item.
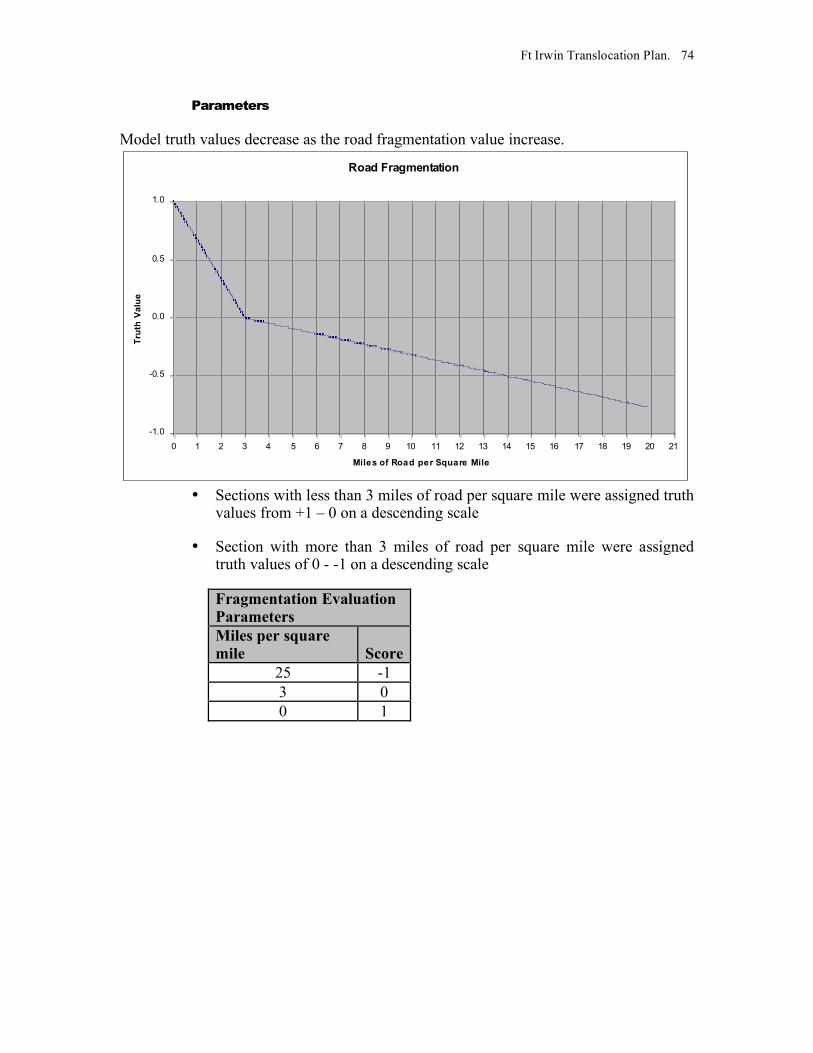
Ft Irwin Translocation Plan. 74
Parameters
Model truth values decrease as the road fragmentation value increase.
Road Fragmentation
-1.0
-0.5
0.0
0.5
1.0
0 1 2 3 4 5 6 7 8 9 10 11 12 13 14 15 16 17 18 19 20 21
Miles of Road per Square Mile
Tru
th V
alu
e
• Sections with less than 3 miles of road per square mile were assigned truth
values from +1 – 0 on a descending scale
• Section with more than 3 miles of road per square mile were assigned truth values of 0 - -1 on a descending scale
Fragmentation Evaluation Parameters Miles per square mile Score
25 -1 3 0 0 1

Ft Irwin Translocation Plan. 75
Source Data
Model Results
Die-Off Regions
Purpose
Translocating tortoises inside a die-off area can be good or neutral depending on the objective (i.e. suitability increases or decreases with die-off). Die-off region is good from the standpoint of repopulating an area that once had tortoises.
Source Data
1. Desert Tortoise Total Corrected Sign (TCS), 1998, 1999, 2001; 1:100,000, coverage acquired from Nanette Pratini, Staff Research Associate, UCR and GIS Database Manager, West Mojave and NECO PlansU.S. Bureau of Land Management http://www.ca.blm.gov/cdd/directory.html
Abstract This coverage contains desert tortoise transect information for the West Mojave regional planning area collected during 1998, 1999, and 2001 field survey efforts. Total Corrected Sign (TCS) is a derived value based on calculations involving observed desert tortoise sign. In 2001, Ed Larue and a team of biologist conducted field transects using BLM methodology looking for desert tortoise sign. From hard copy field notes, BLM

Ft Irwin Translocation Plan. 76
employee Emily Cohen entered the values into an EXCEL spreadsheet and gave each transect unique site #. Using the easting/northing coordinate data transect locations were entered into an Arc/Info coverage by Ric Williams. The site# attribute was the unique value used in database creation for attachment of observational data to point features.
2. Live and Carcass Observations of the Desert Tortoise in the Mojave
Desert (LDS), 2001, 2002, 2003, 2004; 1:100,000 U.S. Fish & Wildlife Service http://pacific.fws.gov/index.html
Abstract As a result of directives outlined in the 1994 Desert Tortoise (Mojave Population) Recovery Plan and decisions ultimately made by the Desert Tortoise Management Oversight Group, line distance sampling was chosen as the method for determining range wide population status. This multi-year coordinated effort was undertaken in 2001, under the direction the USFWS Desert Tortoise Recovery Coordinator, Mr. Phil Medica. Line distance sampling was chosen as the method for determining range wide population status and is to be continued consistently over the next several decades until adequate baseline data are established to determine population status (i.e. increasing, decreasing, stabilizing). For the sampling year 2002, field crews were outfitted with electronic data collection equipment instead of the pencil and paper data sheets used in the previous year. By entering data directly into an electronic format, transcription errors are eliminated and data standards are enforced. Data is then transferred to a relational database, and is maintained by the Mojave Desert Ecosystem Program (MDEP), which also provides logistical sampling, and data storage support. Distance sampling software is used to estimate tortoise densities on an individual Desert Wildlife Management Area (DWMA) basis. This analysis is being conducted by Dr. Steve Corn, of the USGS, in cooperation with Mr. Medica. In addition, spatial analyses are being conducted by the Redlands Institute, Desert Tortoise Project, under the direction of Dr. Jill S. Heaton.
Processing Steps
It was decided that all sections would be categorized into “Live”, “Dead”, “No Observation”, and “Unsampled” based on both TCS and LDS data. TCS points and LDS corner and observation points were used to categorize sections using the following criteria:
1. All sections with any scat or live observations for all available years were categorized as “Live” sections
2. All sections with only dead or carcass observations and no “Live” criteria for all available years were categorized as “Dead” sections
3. All sections that were sampled but no observations were made for all available years was categorized as “No Observation” sections
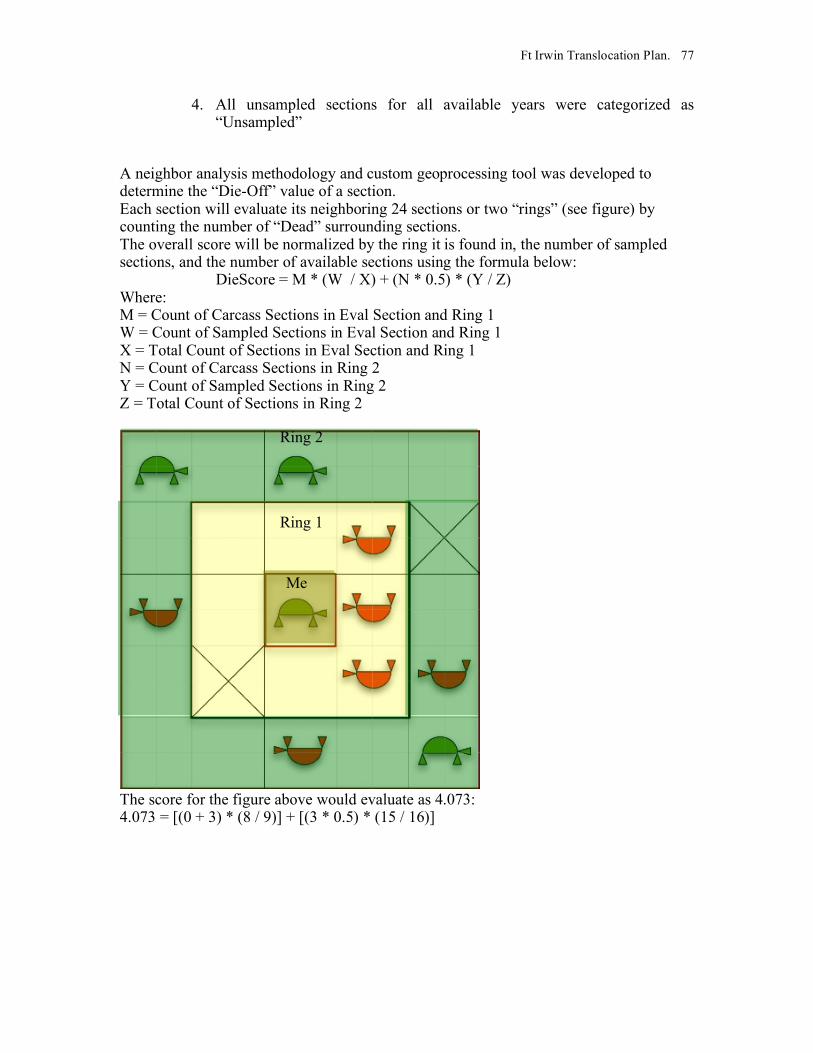
Ft Irwin Translocation Plan. 77
4. All unsampled sections for all available years were categorized as “Unsampled”
A neighbor analysis methodology and custom geoprocessing tool was developed to determine the “Die-Off” value of a section. Each section will evaluate its neighboring 24 sections or two “rings” (see figure) by counting the number of “Dead” surrounding sections. The overall score will be normalized by the ring it is found in, the number of sampled sections, and the number of available sections using the formula below: DieScore = M * (W / X) + (N * 0.5) * (Y / Z) Where: M = Count of Carcass Sections in Eval Section and Ring 1 W = Count of Sampled Sections in Eval Section and Ring 1 X = Total Count of Sections in Eval Section and Ring 1 N = Count of Carcass Sections in Ring 2 Y = Count of Sampled Sections in Ring 2 Z = Total Count of Sections in Ring 2
The score for the figure above would evaluate as 4.073: 4.073 = [(0 + 3) * (8 / 9)] + [(3 * 0.5) * (15 / 16)]
Ring 1
Me
Ring 2

Ft Irwin Translocation Plan. 78
Parameters
Model truth values increase as die-off score values increase.
Die-Off Scores
-1.0
-0.5
0.0
0.5
1.0
0 2 4 6 8 10 12 14
Die-Off Score
Tru
th V
alu
e
Sections were assigned truth values directly proportional to their Die-Off Score on a scale of 0 - +1.
Die-Off Score Parameters Die Score Score 0 0 12 1
Source Data
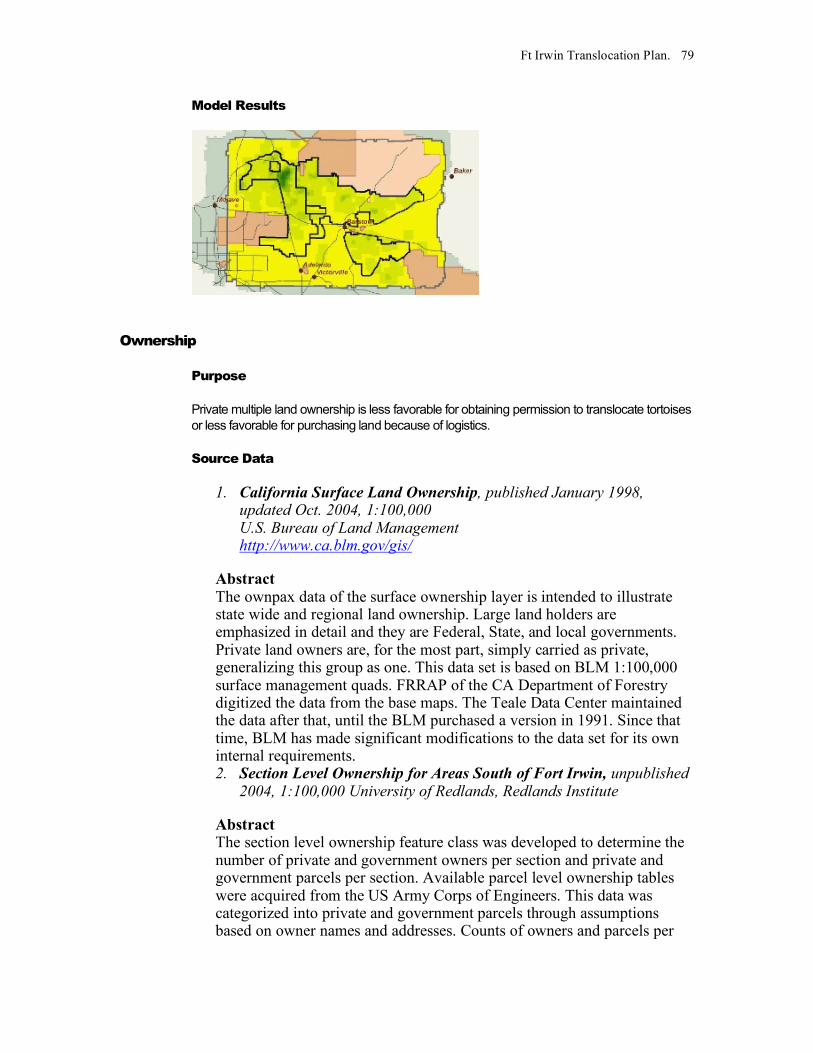
Ft Irwin Translocation Plan. 79
Model Results
Ownership
Purpose
Private multiple land ownership is less favorable for obtaining permission to translocate tortoises or less favorable for purchasing land because of logistics.
Source Data
1. California Surface Land Ownership, published January 1998, updated Oct. 2004, 1:100,000 U.S. Bureau of Land Management http://www.ca.blm.gov/gis/
Abstract The ownpax data of the surface ownership layer is intended to illustrate state wide and regional land ownership. Large land holders are emphasized in detail and they are Federal, State, and local governments. Private land owners are, for the most part, simply carried as private, generalizing this group as one. This data set is based on BLM 1:100,000 surface management quads. FRRAP of the CA Department of Forestry digitized the data from the base maps. The Teale Data Center maintained the data after that, until the BLM purchased a version in 1991. Since that time, BLM has made significant modifications to the data set for its own internal requirements. 2. Section Level Ownership for Areas South of Fort Irwin, unpublished
2004, 1:100,000 University of Redlands, Redlands Institute
Abstract The section level ownership feature class was developed to determine the number of private and government owners per section and private and government parcels per section. Available parcel level ownership tables were acquired from the US Army Corps of Engineers. This data was categorized into private and government parcels through assumptions based on owner names and addresses. Counts of owners and parcels per
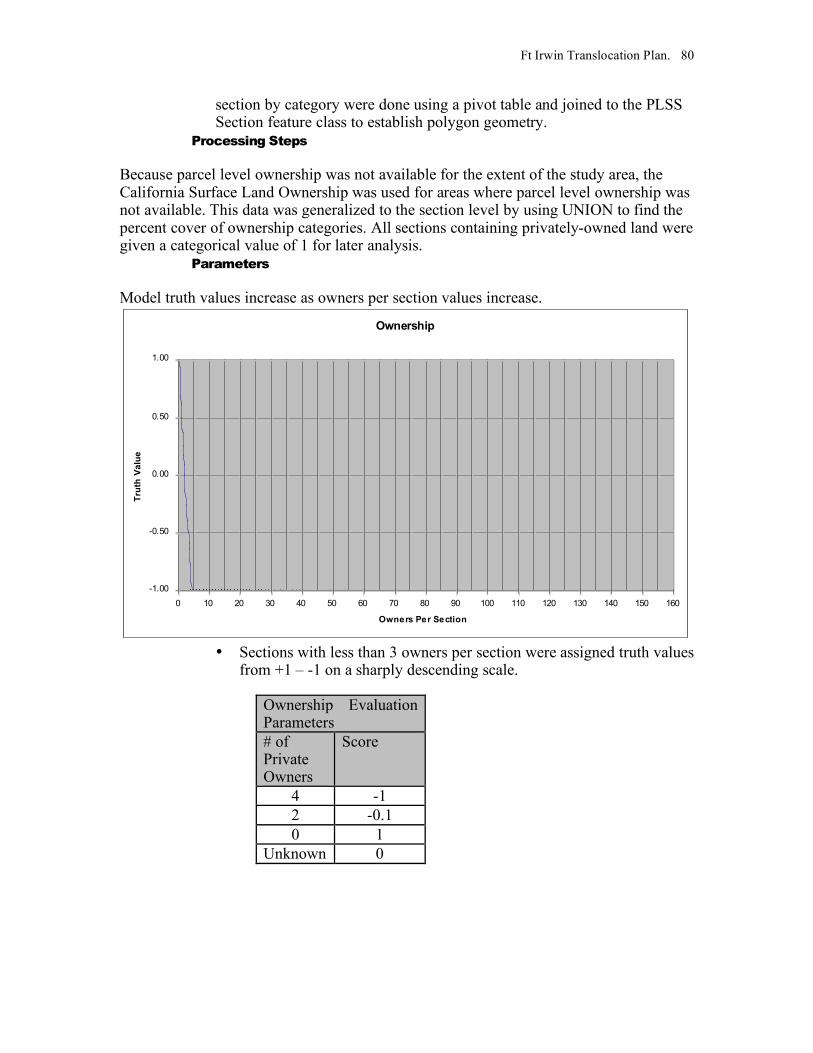
Ft Irwin Translocation Plan. 80
section by category were done using a pivot table and joined to the PLSS Section feature class to establish polygon geometry.
Processing Steps
Because parcel level ownership was not available for the extent of the study area, the California Surface Land Ownership was used for areas where parcel level ownership was not available. This data was generalized to the section level by using UNION to find the percent cover of ownership categories. All sections containing privately-owned land were given a categorical value of 1 for later analysis.
Parameters
Model truth values increase as owners per section values increase.
Ownership
-1.00
-0.50
0.00
0.50
1.00
0 10 20 30 40 50 60 70 80 90 100 110 120 130 140 150 160
Owners Per Section
Tru
th V
alu
e
• Sections with less than 3 owners per section were assigned truth values
from +1 – -1 on a sharply descending scale.
Ownership Evaluation Parameters # of Private Owners
Score
4 -1 2 -0.1 0 1
Unknown 0
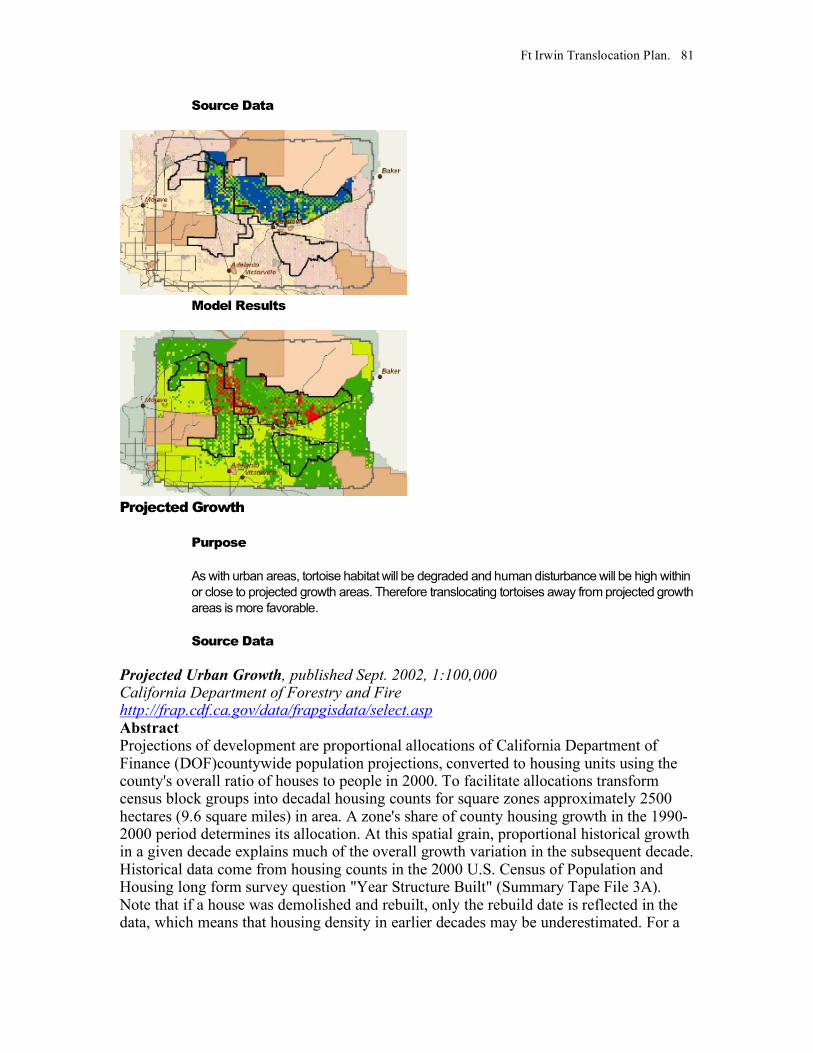
Ft Irwin Translocation Plan. 81
Source Data
Model Results
Projected Growth
Purpose
As with urban areas, tortoise habitat will be degraded and human disturbance will be high within or close to projected growth areas. Therefore translocating tortoises away from projected growth areas is more favorable.
Source Data
Projected Urban Growth, published Sept. 2002, 1:100,000 California Department of Forestry and Fire http://frap.cdf.ca.gov/data/frapgisdata/select.asp Abstract Projections of development are proportional allocations of California Department of Finance (DOF)countywide population projections, converted to housing units using the county's overall ratio of houses to people in 2000. To facilitate allocations transform census block groups into decadal housing counts for square zones approximately 2500 hectares (9.6 square miles) in area. A zone's share of county housing growth in the 1990-2000 period determines its allocation. At this spatial grain, proportional historical growth in a given decade explains much of the overall growth variation in the subsequent decade. Historical data come from housing counts in the 2000 U.S. Census of Population and Housing long form survey question "Year Structure Built" (Summary Tape File 3A). Note that if a house was demolished and rebuilt, only the rebuild date is reflected in the data, which means that housing density in earlier decades may be underestimated. For a
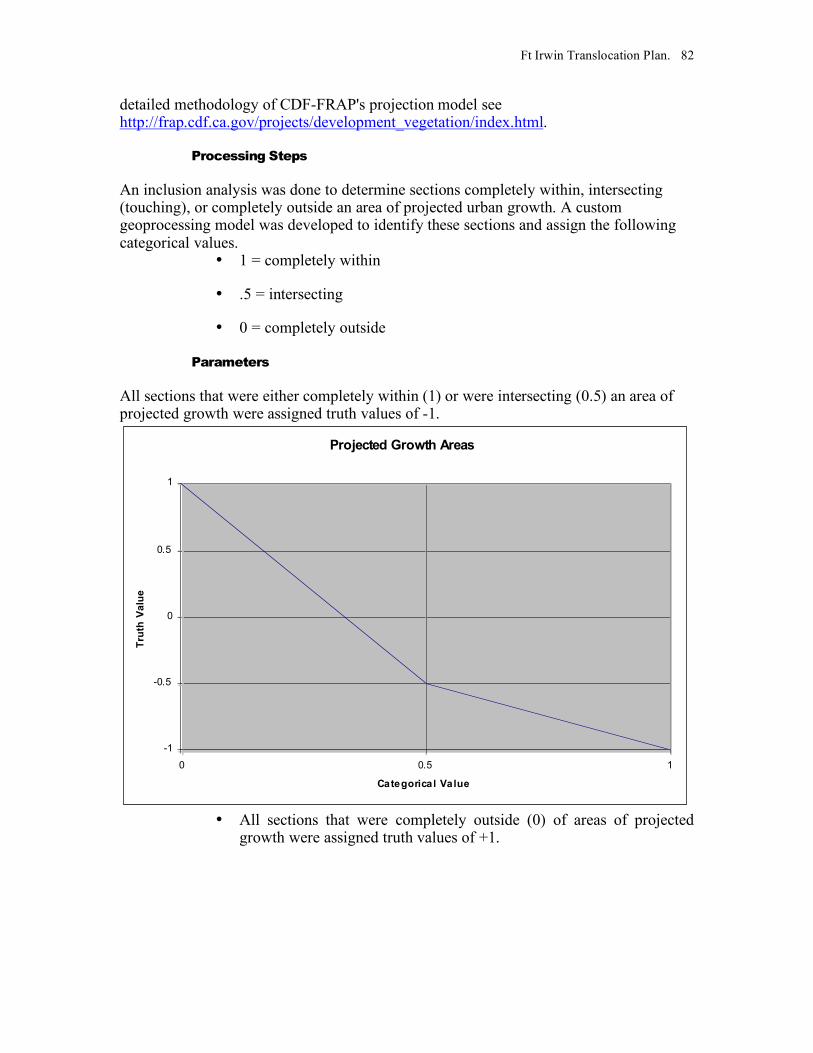
Ft Irwin Translocation Plan. 82
detailed methodology of CDF-FRAP's projection model see http://frap.cdf.ca.gov/projects/development_vegetation/index.html.
Processing Steps
An inclusion analysis was done to determine sections completely within, intersecting (touching), or completely outside an area of projected urban growth. A custom geoprocessing model was developed to identify these sections and assign the following categorical values.
• 1 = completely within
• .5 = intersecting
• 0 = completely outside
Parameters
All sections that were either completely within (1) or were intersecting (0.5) an area of projected growth were assigned truth values of -1.
Projected Growth Areas
-1
-0.5
0
0.5
1
0 0.5 1
Categorical Value
Tru
th V
alu
e
• All sections that were completely outside (0) of areas of projected
growth were assigned truth values of +1.
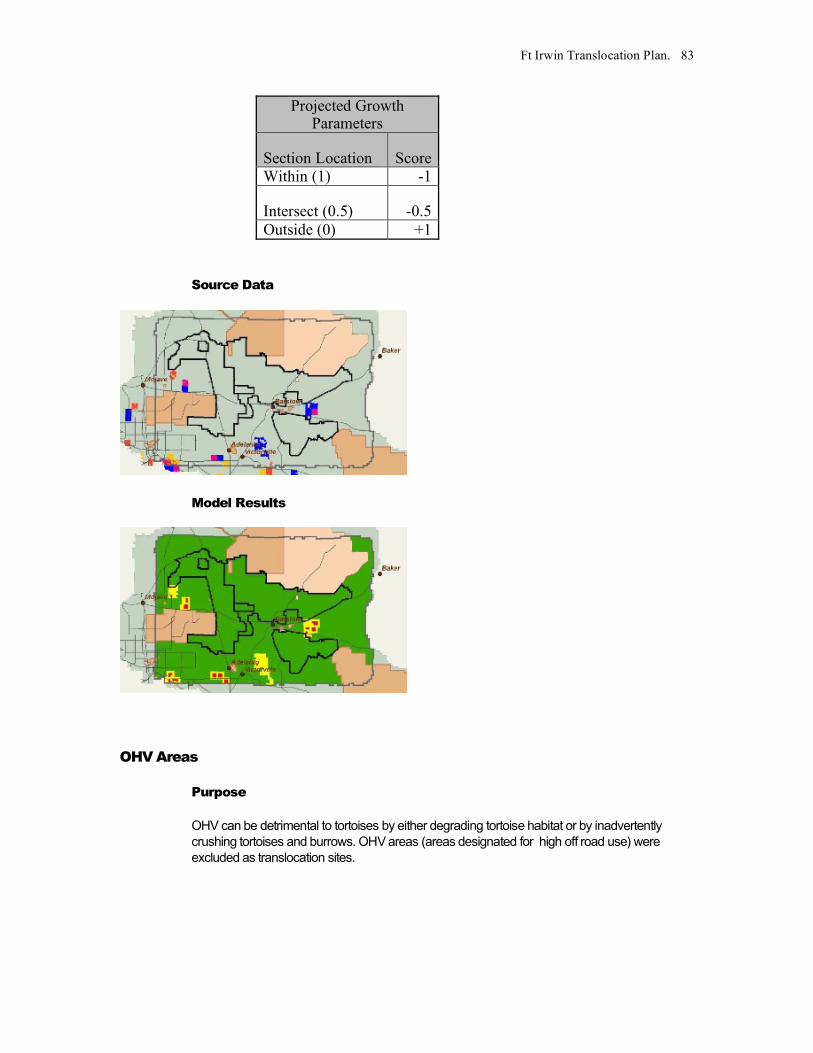
Ft Irwin Translocation Plan. 83
Projected Growth Parameters
Section Location Score Within (1) -1
Intersect (0.5) -0.5 Outside (0) +1
Source Data
Model Results
OHV Areas
Purpose
OHV can be detrimental to tortoises by either degrading tortoise habitat or by inadvertently crushing tortoises and burrows. OHV areas (areas designated for high off road use) were excluded as translocation sites.
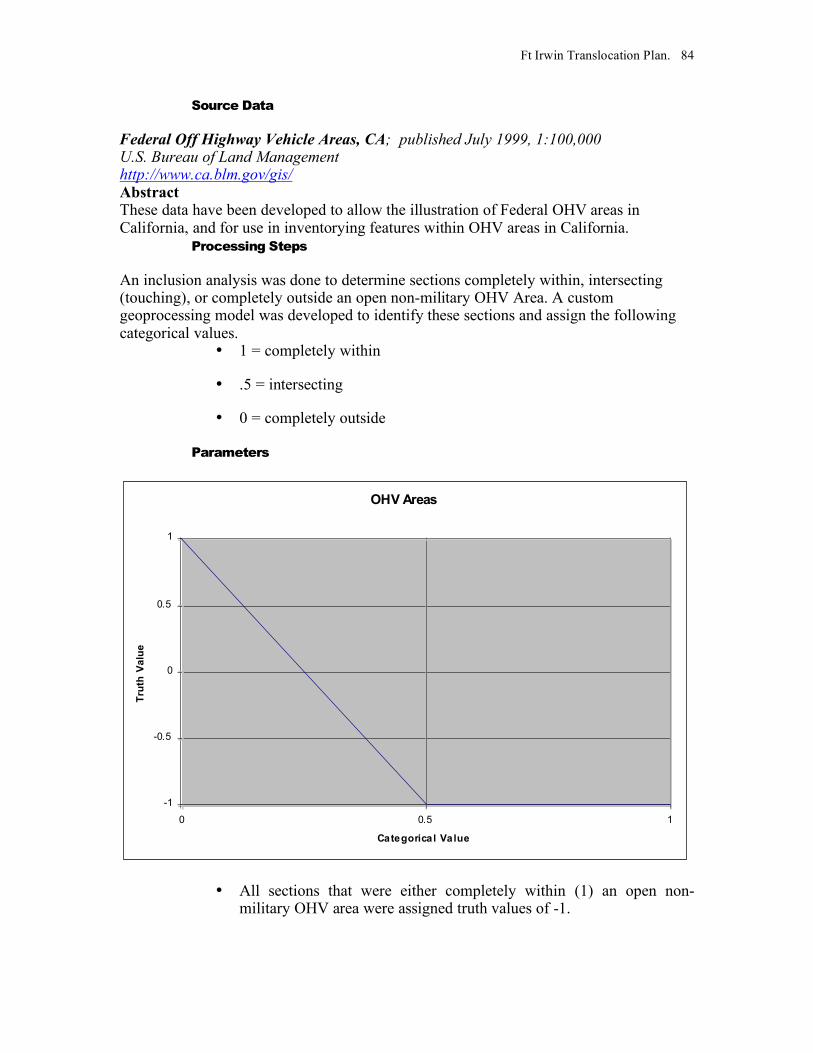
Ft Irwin Translocation Plan. 84
Source Data
Federal Off Highway Vehicle Areas, CA; published July 1999, 1:100,000 U.S. Bureau of Land Management http://www.ca.blm.gov/gis/ Abstract These data have been developed to allow the illustration of Federal OHV areas in California, and for use in inventorying features within OHV areas in California.
Processing Steps
An inclusion analysis was done to determine sections completely within, intersecting (touching), or completely outside an open non-military OHV Area. A custom geoprocessing model was developed to identify these sections and assign the following categorical values.
• 1 = completely within
• .5 = intersecting
• 0 = completely outside
Parameters
OHV Areas
-1
-0.5
0
0.5
1
0 0.5 1
Categorical Value
Tru
th V
alu
e
• All sections that were either completely within (1) an open non-military OHV area were assigned truth values of -1.
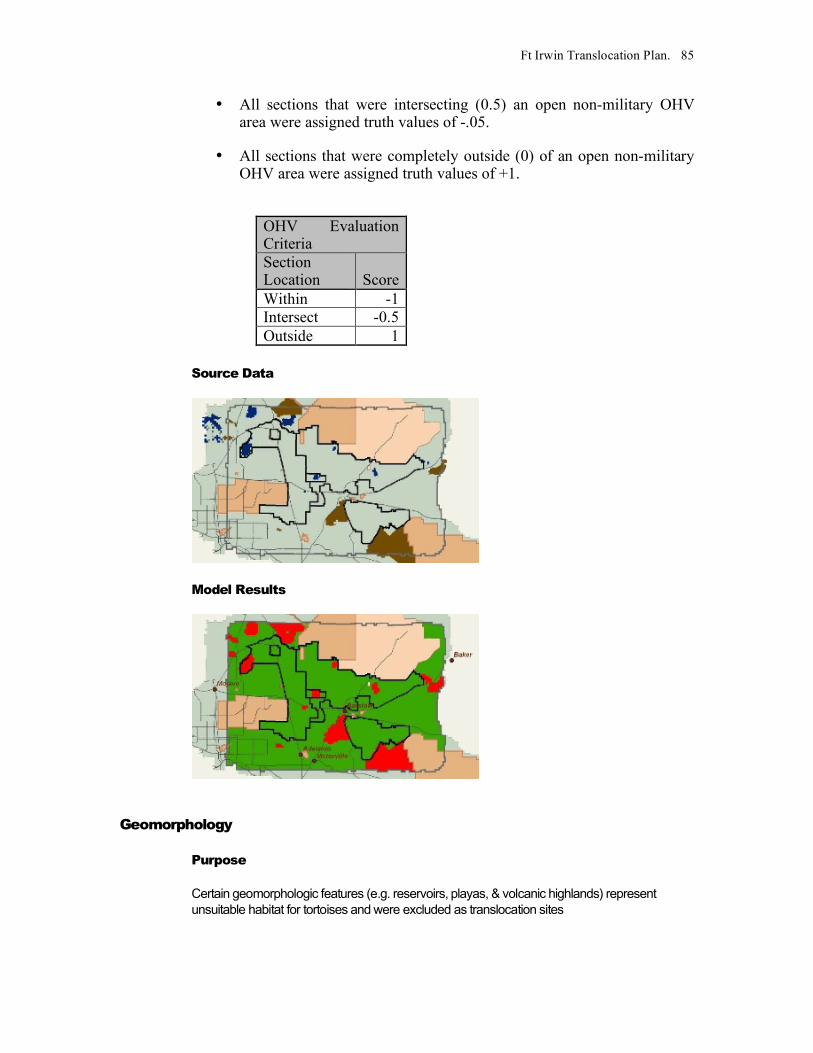
Ft Irwin Translocation Plan. 85
• All sections that were intersecting (0.5) an open non-military OHV area were assigned truth values of -.05.
• All sections that were completely outside (0) of an open non-military OHV area were assigned truth values of +1.
OHV Evaluation Criteria Section Location Score Within -1 Intersect -0.5 Outside 1
Source Data
Model Results
Geomorphology
Purpose
Certain geomorphologic features (e.g. reservoirs, playas, & volcanic highlands) represent unsuitable habitat for tortoises and were excluded as translocation sites
Ft Irwin Translocation Plan. 86
Source Data
1. Streams within the Mojave Desert Ecosystem; published May 1998, 1:100,000 U. S. Geological Survey (download from MDEP)
Abstract These data were prepared from the 1:100,000-scale materials associated with the USGS Topographic Map Series. They have been modified from the original USGS digital line graphs by Utah State University. 2. GLASC; published April 2000, 1:100,000
US Army Topographic Engineering Center & Louisiana State University, Baton Rouge, LA (download from MDEP)
Abstract The Louisiana State University and the US Army Topographic Engineering Center are mapping the earth materials and landforms of the California portion of the Mojave Desert using a combination of spaceborne spectral scanners, air photo interpretation, and geological field techniques. This effort is not a compilation of previous work but is instead an attempt to create a regionally uniform Geographic Information System (GIS) data layer whose accuracy and precision is known and verified; the digital form of the GIS layer also allows for rapid changes in the product as new information is obtained. The mapped area covers ~150,000 km2. The mapping base passes 24,000; the GIS layer contains ~30,000 polygons, with MMU of 10 hectares. The final products will include a digital GIS layer, 100,000, and a website that describes the methodology used in mapping, definitions of mapping units, and practical implications of the data.
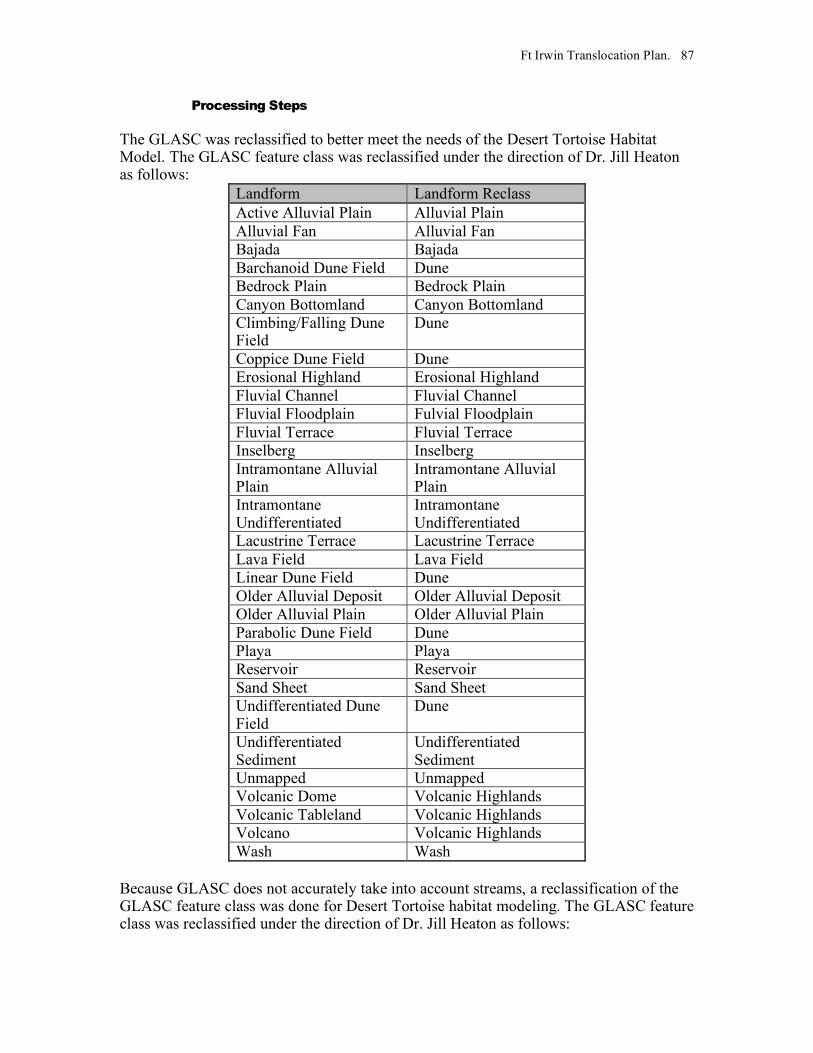
Ft Irwin Translocation Plan. 87
Processing Steps
The GLASC was reclassified to better meet the needs of the Desert Tortoise Habitat Model. The GLASC feature class was reclassified under the direction of Dr. Jill Heaton as follows:
Landform Landform Reclass Active Alluvial Plain Alluvial Plain Alluvial Fan Alluvial Fan Bajada Bajada Barchanoid Dune Field Dune Bedrock Plain Bedrock Plain Canyon Bottomland Canyon Bottomland Climbing/Falling Dune Field
Dune
Coppice Dune Field Dune Erosional Highland Erosional Highland Fluvial Channel Fluvial Channel Fluvial Floodplain Fulvial Floodplain Fluvial Terrace Fluvial Terrace Inselberg Inselberg Intramontane Alluvial Plain
Intramontane Alluvial Plain
Intramontane Undifferentiated
Intramontane Undifferentiated
Lacustrine Terrace Lacustrine Terrace Lava Field Lava Field Linear Dune Field Dune Older Alluvial Deposit Older Alluvial Deposit Older Alluvial Plain Older Alluvial Plain Parabolic Dune Field Dune Playa Playa Reservoir Reservoir Sand Sheet Sand Sheet Undifferentiated Dune Field
Dune
Undifferentiated Sediment
Undifferentiated Sediment
Unmapped Unmapped Volcanic Dome Volcanic Highlands Volcanic Tableland Volcanic Highlands Volcano Volcanic Highlands Wash Wash
Because GLASC does not accurately take into account streams, a reclassification of the GLASC feature class was done for Desert Tortoise habitat modeling. The GLASC feature class was reclassified under the direction of Dr. Jill Heaton as follows:
Ft Irwin Translocation Plan. 88
• All geomorphology types designated by GLASC as the following that intersect a stream (see source data description) should be reclassified as “Canyon Bottomland” within a 100 meter buffer of the stream:
• “Erosional Highland”, “Volcano”, “Volcanic Dome”, “Volcanic Tableland”, “Intramontane Alluvial Plain”, “Intramontane Undifferentiated”, “Canyon Bottomland”, and “Inselberg”.
• All other landforms (not listed above) that intersect streams minus unmapped and reservoir were reclassified as “Wash” within a 100 meter buffer of the stream.
Geoprocessing models and scripts were developed to generalize the reclassified GLASC data to the section level. The resulting feature class contained data about the dominant 5 landforms within the section and their percent of cover. The model processing steps were as follows:
1. UNION the reclassified GLASC feature class to the PLSS Section feature class
2. Add fields for each landform type and populate with the types percent cover. (Landform area / Section area)
3. DISSOLVE feature class based on MTRS value maintaining the total of the landform percent cover values.
4. Loop through each landform percent cover field to determine dominant landform type and write the type value to a new LF1_Type and the percent cover value to a new LF1_PercCov field. Calculate the original landform type field to 0. Loop through 4 more times. (Calculating the field to 0 ensures that the next loop will not evaluate this type as the dominant type, but will find the next most dominant for each iteration.)
5. The results were then joined to a master criteria shapefile using the MTRS as the join item.
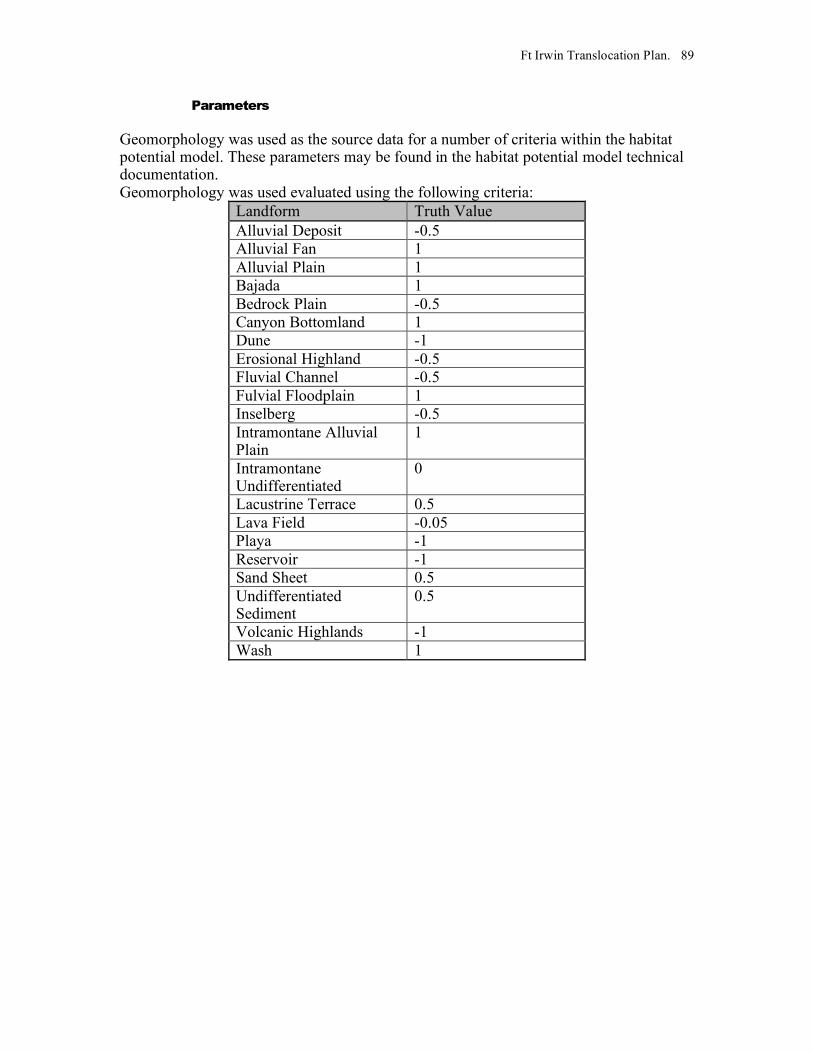
Ft Irwin Translocation Plan. 89
Parameters
Geomorphology was used as the source data for a number of criteria within the habitat potential model. These parameters may be found in the habitat potential model technical documentation. Geomorphology was used evaluated using the following criteria:
Landform Truth Value Alluvial Deposit -0.5 Alluvial Fan 1 Alluvial Plain 1 Bajada 1 Bedrock Plain -0.5 Canyon Bottomland 1 Dune -1 Erosional Highland -0.5 Fluvial Channel -0.5 Fulvial Floodplain 1 Inselberg -0.5 Intramontane Alluvial Plain
1
Intramontane Undifferentiated
0
Lacustrine Terrace 0.5 Lava Field -0.05 Playa -1 Reservoir -1 Sand Sheet 0.5 Undifferentiated Sediment
0.5
Volcanic Highlands -1 Wash 1
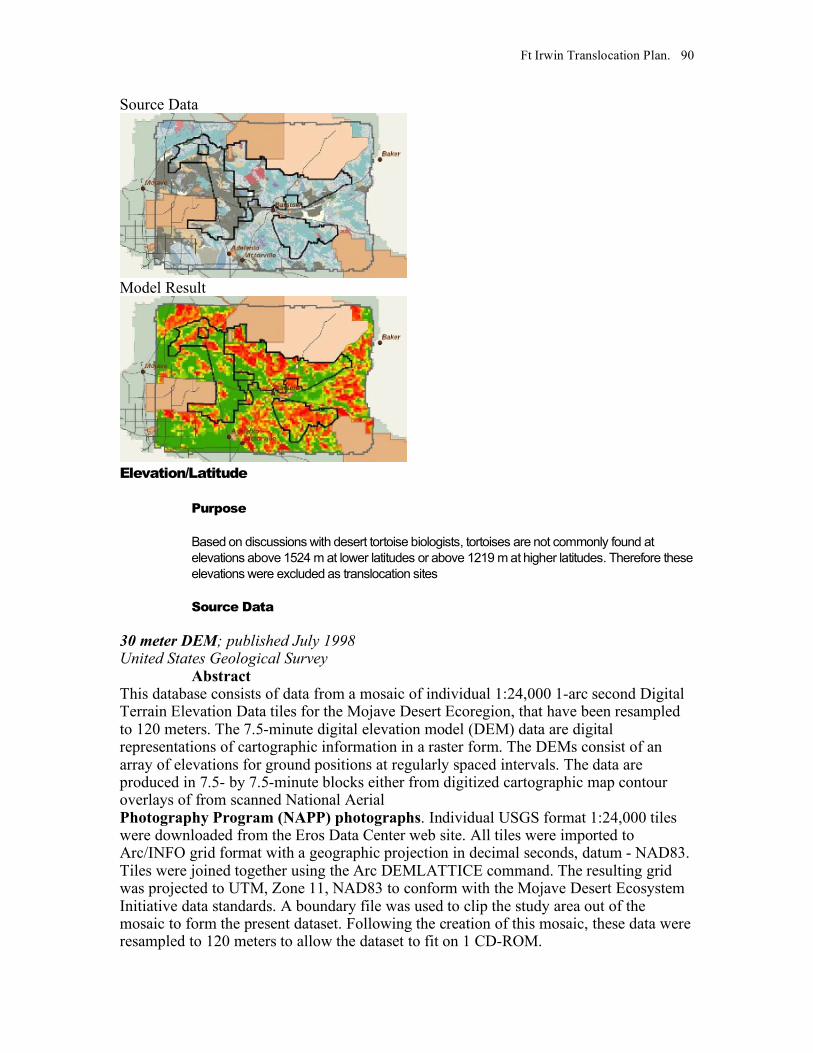
Ft Irwin Translocation Plan. 90
Source Data
Model Result
Elevation/Latitude
Purpose
Based on discussions with desert tortoise biologists, tortoises are not commonly found at elevations above 1524 m at lower latitudes or above 1219 m at higher latitudes. Therefore these elevations were excluded as translocation sites
Source Data
30 meter DEM; published July 1998 United States Geological Survey
Abstract This database consists of data from a mosaic of individual 1:24,000 1-arc second Digital Terrain Elevation Data tiles for the Mojave Desert Ecoregion, that have been resampled to 120 meters. The 7.5-minute digital elevation model (DEM) data are digital representations of cartographic information in a raster form. The DEMs consist of an array of elevations for ground positions at regularly spaced intervals. The data are produced in 7.5- by 7.5-minute blocks either from digitized cartographic map contour overlays of from scanned National Aerial Photography Program (NAPP) photographs. Individual USGS format 1:24,000 tiles were downloaded from the Eros Data Center web site. All tiles were imported to Arc/INFO grid format with a geographic projection in decimal seconds, datum - NAD83. Tiles were joined together using the Arc DEMLATTICE command. The resulting grid was projected to UTM, Zone 11, NAD83 to conform with the Mojave Desert Ecosystem Initiative data standards. A boundary file was used to clip the study area out of the mosaic to form the present dataset. Following the creation of this mosaic, these data were resampled to 120 meters to allow the dataset to fit on 1 CD-ROM.
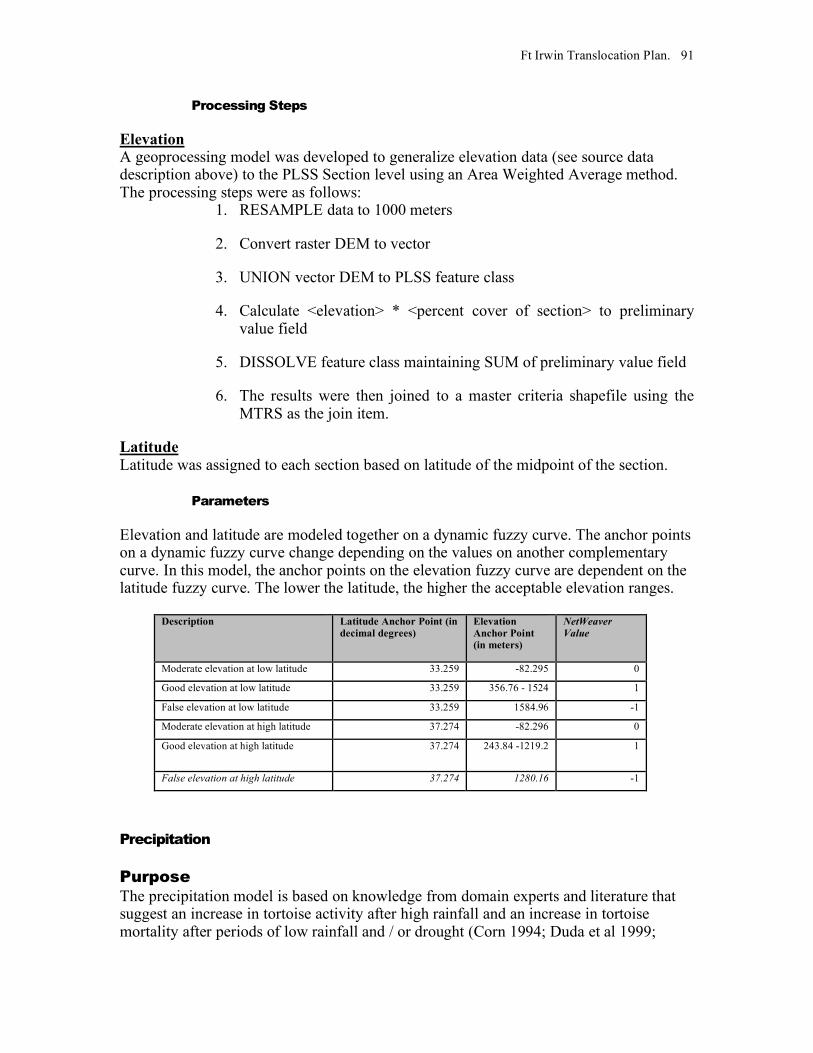
Ft Irwin Translocation Plan. 91
Processing Steps
Elevation A geoprocessing model was developed to generalize elevation data (see source data description above) to the PLSS Section level using an Area Weighted Average method. The processing steps were as follows:
1. RESAMPLE data to 1000 meters
2. Convert raster DEM to vector
3. UNION vector DEM to PLSS feature class
4. Calculate <elevation> * <percent cover of section> to preliminary value field
5. DISSOLVE feature class maintaining SUM of preliminary value field
6. The results were then joined to a master criteria shapefile using the MTRS as the join item.
Latitude Latitude was assigned to each section based on latitude of the midpoint of the section.
Parameters
Elevation and latitude are modeled together on a dynamic fuzzy curve. The anchor points on a dynamic fuzzy curve change depending on the values on another complementary curve. In this model, the anchor points on the elevation fuzzy curve are dependent on the latitude fuzzy curve. The lower the latitude, the higher the acceptable elevation ranges.
Description Latitude Anchor Point (in decimal degrees)
Elevation Anchor Point (in meters)
NetWeaver Value
Moderate elevation at low latitude 33.259 -82.295 0
Good elevation at low latitude 33.259 356.76 - 1524 1
False elevation at low latitude 33.259 1584.96 -1
Moderate elevation at high latitude 37.274 -82.296 0
Good elevation at high latitude 37.274 243.84 -1219.2 1
False elevation at high latitude 37.274 1280.16 -1
Precipitation
Purpose The precipitation model is based on knowledge from domain experts and literature that suggest an increase in tortoise activity after high rainfall and an increase in tortoise mortality after periods of low rainfall and / or drought (Corn 1994; Duda et al 1999;
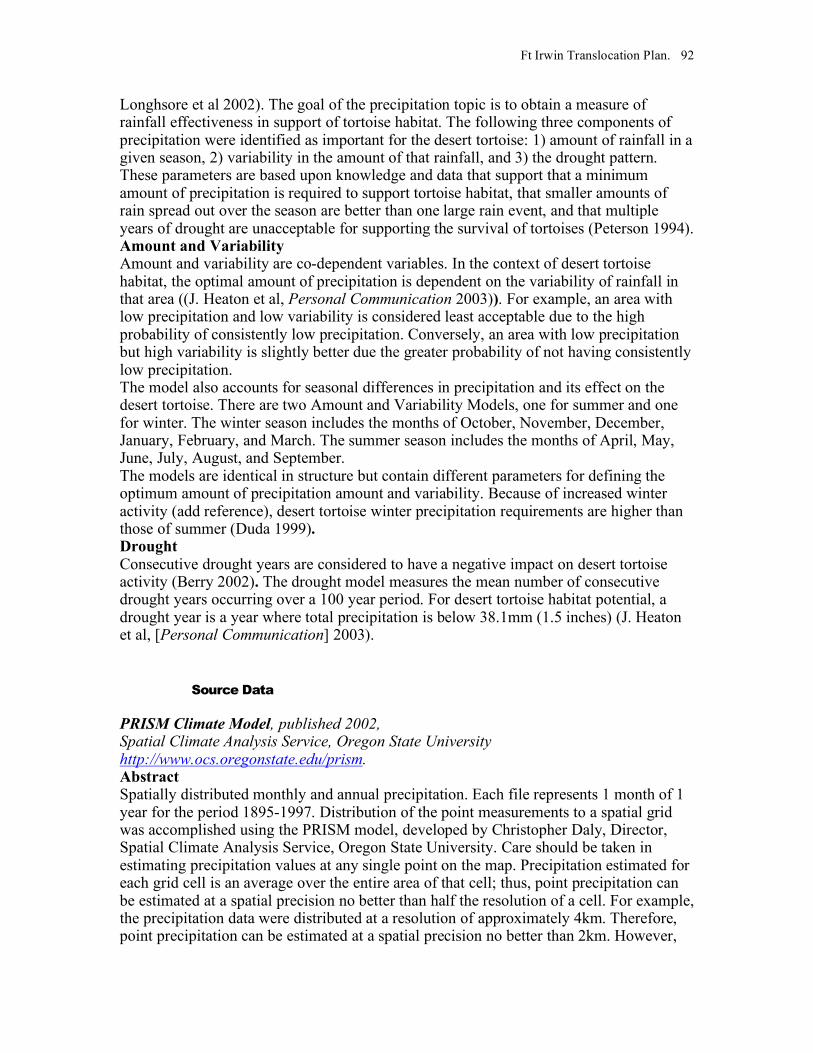
Ft Irwin Translocation Plan. 92
Longhsore et al 2002). The goal of the precipitation topic is to obtain a measure of rainfall effectiveness in support of tortoise habitat. The following three components of precipitation were identified as important for the desert tortoise: 1) amount of rainfall in a given season, 2) variability in the amount of that rainfall, and 3) the drought pattern. These parameters are based upon knowledge and data that support that a minimum amount of precipitation is required to support tortoise habitat, that smaller amounts of rain spread out over the season are better than one large rain event, and that multiple years of drought are unacceptable for supporting the survival of tortoises (Peterson 1994). Amount and Variability Amount and variability are co-dependent variables. In the context of desert tortoise habitat, the optimal amount of precipitation is dependent on the variability of rainfall in that area ((J. Heaton et al, Personal Communication 2003)). For example, an area with low precipitation and low variability is considered least acceptable due to the high probability of consistently low precipitation. Conversely, an area with low precipitation but high variability is slightly better due the greater probability of not having consistently low precipitation. The model also accounts for seasonal differences in precipitation and its effect on the desert tortoise. There are two Amount and Variability Models, one for summer and one for winter. The winter season includes the months of October, November, December, January, February, and March. The summer season includes the months of April, May, June, July, August, and September. The models are identical in structure but contain different parameters for defining the optimum amount of precipitation amount and variability. Because of increased winter activity (add reference), desert tortoise winter precipitation requirements are higher than those of summer (Duda 1999). Drought Consecutive drought years are considered to have a negative impact on desert tortoise activity (Berry 2002). The drought model measures the mean number of consecutive drought years occurring over a 100 year period. For desert tortoise habitat potential, a drought year is a year where total precipitation is below 38.1mm (1.5 inches) (J. Heaton et al, [Personal Communication] 2003).
Source Data
PRISM Climate Model, published 2002, Spatial Climate Analysis Service, Oregon State University http://www.ocs.oregonstate.edu/prism. Abstract Spatially distributed monthly and annual precipitation. Each file represents 1 month of 1 year for the period 1895-1997. Distribution of the point measurements to a spatial grid was accomplished using the PRISM model, developed by Christopher Daly, Director, Spatial Climate Analysis Service, Oregon State University. Care should be taken in estimating precipitation values at any single point on the map. Precipitation estimated for each grid cell is an average over the entire area of that cell; thus, point precipitation can be estimated at a spatial precision no better than half the resolution of a cell. For example, the precipitation data were distributed at a resolution of approximately 4km. Therefore, point precipitation can be estimated at a spatial precision no better than 2km. However,
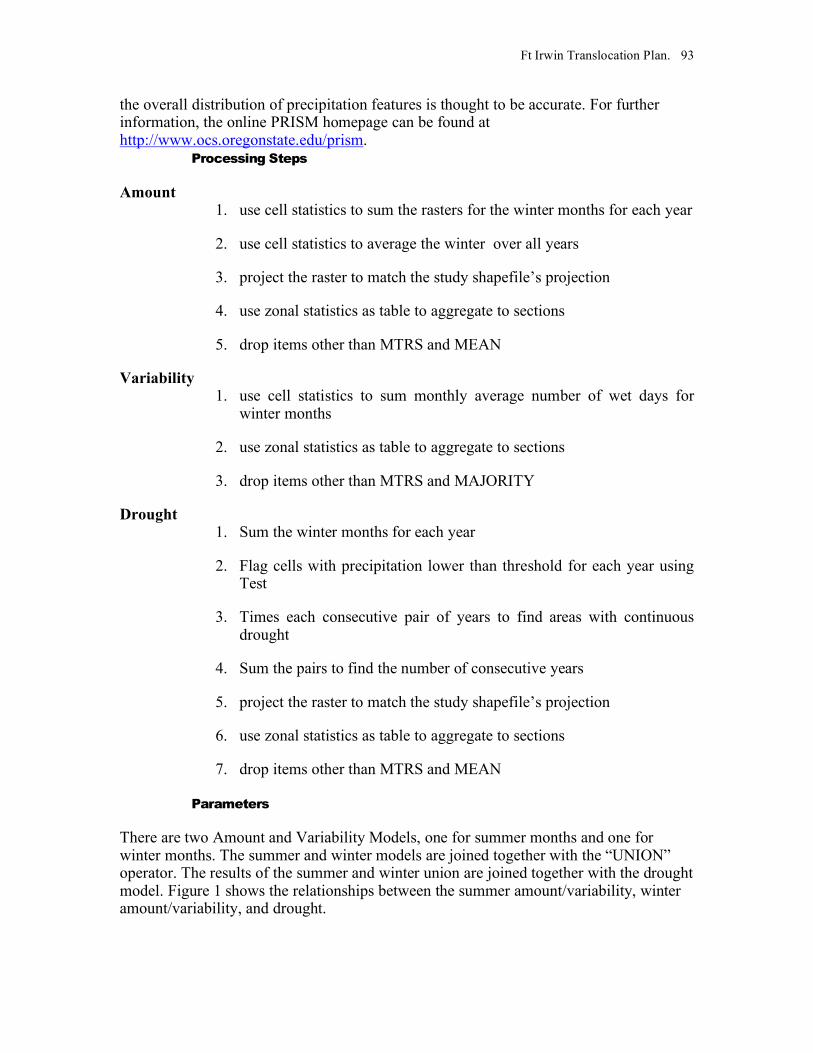
Ft Irwin Translocation Plan. 93
the overall distribution of precipitation features is thought to be accurate. For further information, the online PRISM homepage can be found at http://www.ocs.oregonstate.edu/prism.
Processing Steps
Amount 1. use cell statistics to sum the rasters for the winter months for each year
2. use cell statistics to average the winter over all years
3. project the raster to match the study shapefile’s projection
4. use zonal statistics as table to aggregate to sections
5. drop items other than MTRS and MEAN
Variability 1. use cell statistics to sum monthly average number of wet days for
winter months
2. use zonal statistics as table to aggregate to sections
3. drop items other than MTRS and MAJORITY
Drought 1. Sum the winter months for each year
2. Flag cells with precipitation lower than threshold for each year using Test
3. Times each consecutive pair of years to find areas with continuous drought
4. Sum the pairs to find the number of consecutive years
5. project the raster to match the study shapefile’s projection
6. use zonal statistics as table to aggregate to sections
7. drop items other than MTRS and MEAN
Parameters
There are two Amount and Variability Models, one for summer months and one for winter months. The summer and winter models are joined together with the “UNION” operator. The results of the summer and winter union are joined together with the drought model. Figure 1 shows the relationships between the summer amount/variability, winter amount/variability, and drought.
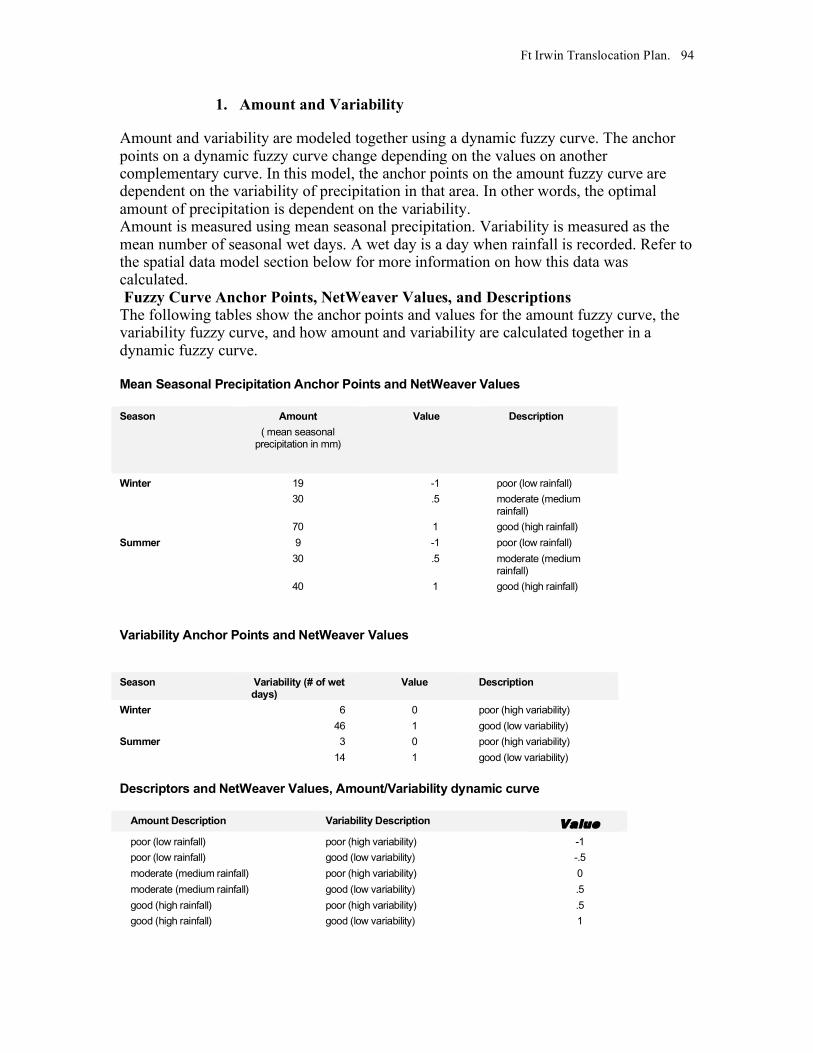
Ft Irwin Translocation Plan. 94
1. Amount and Variability
Amount and variability are modeled together using a dynamic fuzzy curve. The anchor points on a dynamic fuzzy curve change depending on the values on another complementary curve. In this model, the anchor points on the amount fuzzy curve are dependent on the variability of precipitation in that area. In other words, the optimal amount of precipitation is dependent on the variability. Amount is measured using mean seasonal precipitation. Variability is measured as the mean number of seasonal wet days. A wet day is a day when rainfall is recorded. Refer to the spatial data model section below for more information on how this data was calculated. Fuzzy Curve Anchor Points, NetWeaver Values, and Descriptions The following tables show the anchor points and values for the amount fuzzy curve, the variability fuzzy curve, and how amount and variability are calculated together in a dynamic fuzzy curve. Mean Seasonal Precipitation Anchor Points and NetWeaver Values Season Amount
( mean seasonal precipitation in mm)
Value Description
19 -1 poor (low rainfall)
30 .5 moderate (medium rainfall)
Winter
70 1 good (high rainfall)
9 -1 poor (low rainfall)
30 .5 moderate (medium rainfall)
Summer
40 1 good (high rainfall)
Variability Anchor Points and NetWeaver Values Season Variability (# of wet
days) Value Description
6 0 poor (high variability) Winter
46 1 good (low variability)
3 0 poor (high variability) Summer
14 1 good (low variability)
Descriptors and NetWeaver Values, Amount/Variability dynamic curve
Amount Description Variability Description Value
poor (low rainfall) poor (high variability) -1
poor (low rainfall) good (low variability) -.5
moderate (medium rainfall) poor (high variability) 0
moderate (medium rainfall) good (low variability) .5
good (high rainfall) poor (high variability) .5
good (high rainfall) good (low variability) 1

Ft Irwin Translocation Plan. 95
2. Drought
Drought is modeled on a fuzzy curve. Drought is measured in mean consecutive drought years. A consecutive drought year is two consecutive years where in each year the total precipitation is below 38.1mm (1.5 inches).
Drought Fuzzy Curve Values
Mean number of consecutive drought years
Description Value
1 poor -1
.5 moderate 0
0 good 1
Source Data
Critical Habitat Units
Purpose
Translocating tortoises inside the CHU can be good, bad, or neutral depending on the objective. CHU is good for translocation because it represents quality protected habitat. CHU is bad because translocated tortoise introduce disease or may be genetically dissimilar animals to a “good” population.
Source Data
Critical Habitat Units; published 2002, United States Fish and Wildlife Service, Mojave Desert Ecosystem Program (MDEP) Abstract Critical habitat is a term defined and used in the Endangered Species Act. It is a specific geographic area(s) that is essential for the conservation of a threatened or endangered species and that may require special management and protection. Critical habitat may include an area that is not currently occupied by the species but that will be needed for its recovery. An area is designated as "critical habitat" after the U.S. Fish & Wildlife Service publishes a proposed Federal regulation in the Federal Register and then receives and
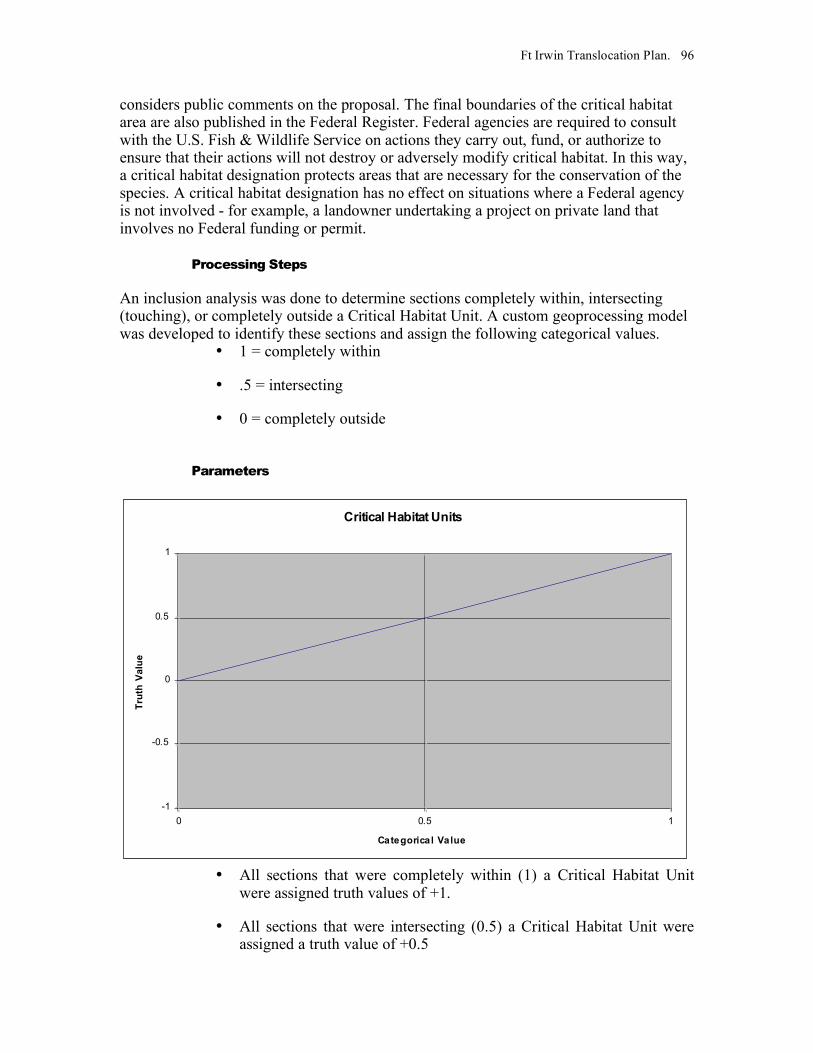
Ft Irwin Translocation Plan. 96
considers public comments on the proposal. The final boundaries of the critical habitat area are also published in the Federal Register. Federal agencies are required to consult with the U.S. Fish & Wildlife Service on actions they carry out, fund, or authorize to ensure that their actions will not destroy or adversely modify critical habitat. In this way, a critical habitat designation protects areas that are necessary for the conservation of the species. A critical habitat designation has no effect on situations where a Federal agency is not involved - for example, a landowner undertaking a project on private land that involves no Federal funding or permit.
Processing Steps
An inclusion analysis was done to determine sections completely within, intersecting (touching), or completely outside a Critical Habitat Unit. A custom geoprocessing model was developed to identify these sections and assign the following categorical values.
• 1 = completely within
• .5 = intersecting
• 0 = completely outside
Parameters
Critical Habitat Units
-1
-0.5
0
0.5
1
0 0.5 1
Categorical Value
Tru
th V
alu
e
• All sections that were completely within (1) a Critical Habitat Unit
were assigned truth values of +1.
• All sections that were intersecting (0.5) a Critical Habitat Unit were assigned a truth value of +0.5
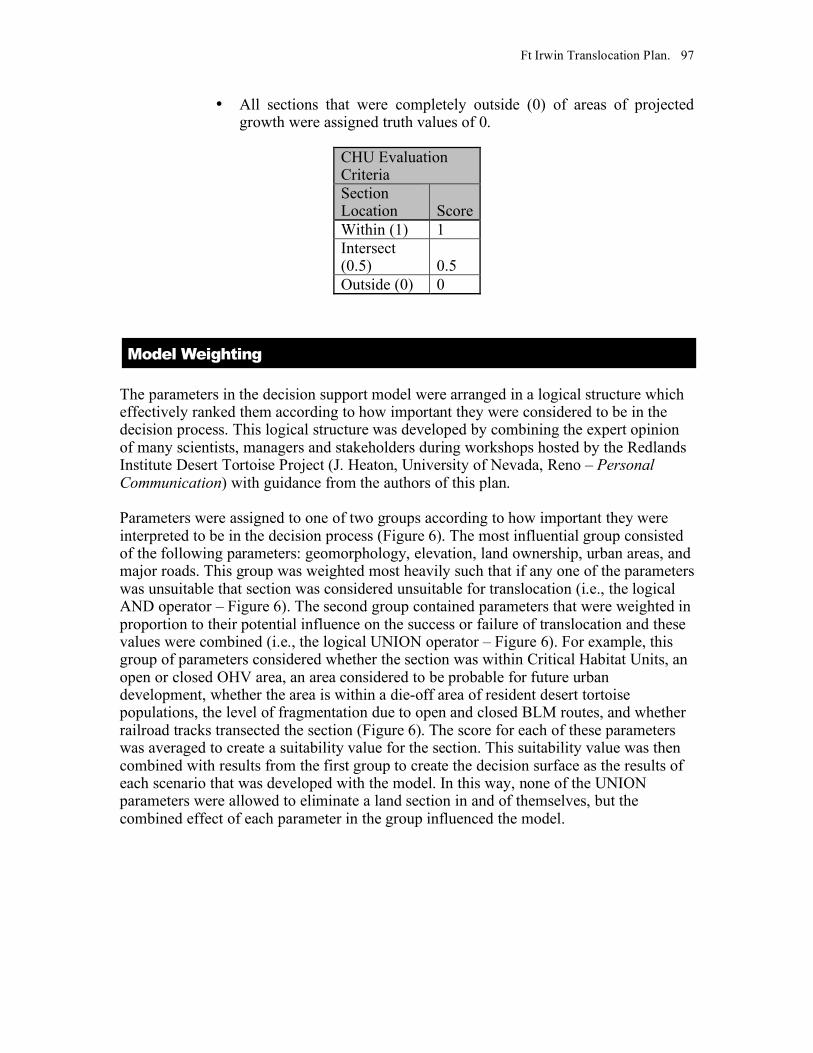
Ft Irwin Translocation Plan. 97
• All sections that were completely outside (0) of areas of projected growth were assigned truth values of 0.
CHU Evaluation Criteria Section Location Score Within (1) 1 Intersect (0.5) 0.5 Outside (0) 0
Model Weighting
The parameters in the decision support model were arranged in a logical structure which effectively ranked them according to how important they were considered to be in the decision process. This logical structure was developed by combining the expert opinion of many scientists, managers and stakeholders during workshops hosted by the Redlands Institute Desert Tortoise Project (J. Heaton, University of Nevada, Reno – Personal Communication) with guidance from the authors of this plan. Parameters were assigned to one of two groups according to how important they were interpreted to be in the decision process (Figure 6). The most influential group consisted of the following parameters: geomorphology, elevation, land ownership, urban areas, and major roads. This group was weighted most heavily such that if any one of the parameters was unsuitable that section was considered unsuitable for translocation (i.e., the logical AND operator – Figure 6). The second group contained parameters that were weighted in proportion to their potential influence on the success or failure of translocation and these values were combined (i.e., the logical UNION operator – Figure 6). For example, this group of parameters considered whether the section was within Critical Habitat Units, an open or closed OHV area, an area considered to be probable for future urban development, whether the area is within a die-off area of resident desert tortoise populations, the level of fragmentation due to open and closed BLM routes, and whether railroad tracks transected the section (Figure 6). The score for each of these parameters was averaged to create a suitability value for the section. This suitability value was then combined with results from the first group to create the decision surface as the results of each scenario that was developed with the model. In this way, none of the UNION parameters were allowed to eliminate a land section in and of themselves, but the combined effect of each parameter in the group influenced the model.

Ft Irwin Translocation Plan. 98
Scenarios
Seven permutations of the input parameters were combined to create modeling scenarios that differed from one another in ways thought to be of particular interest for desert tortoise translocation. These scenarios are summarized in table #######
1. I-15, Ft. Irwin Road, Irwin Road, and Route 395 are Fenced
This scenario considered the effects of fencing major highways. Doing this prioritizes sections near the fenced road because of access. This exposes a number of sections that were evaluated as “good” by all criteria other than proximity to major roads.
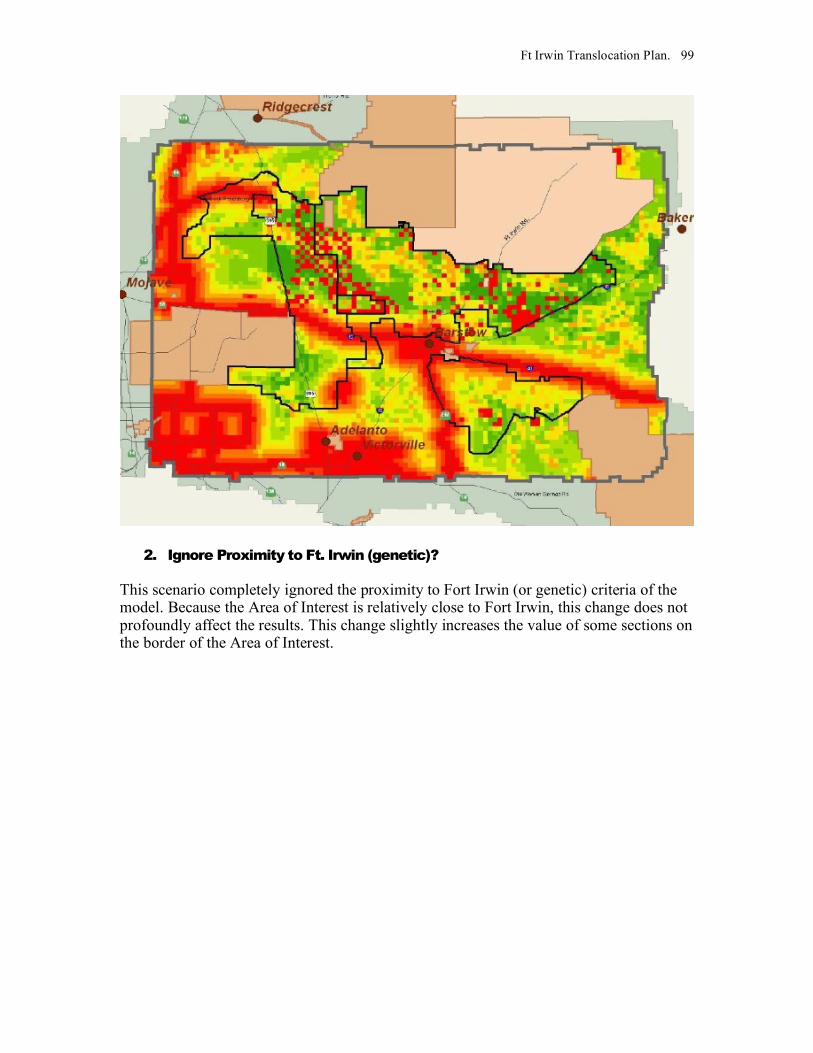
Ft Irwin Translocation Plan. 99
2. Ignore Proximity to Ft. Irwin (genetic)?
This scenario completely ignored the proximity to Fort Irwin (or genetic) criteria of the model. Because the Area of Interest is relatively close to Fort Irwin, this change does not profoundly affect the results. This change slightly increases the value of some sections on the border of the Area of Interest.
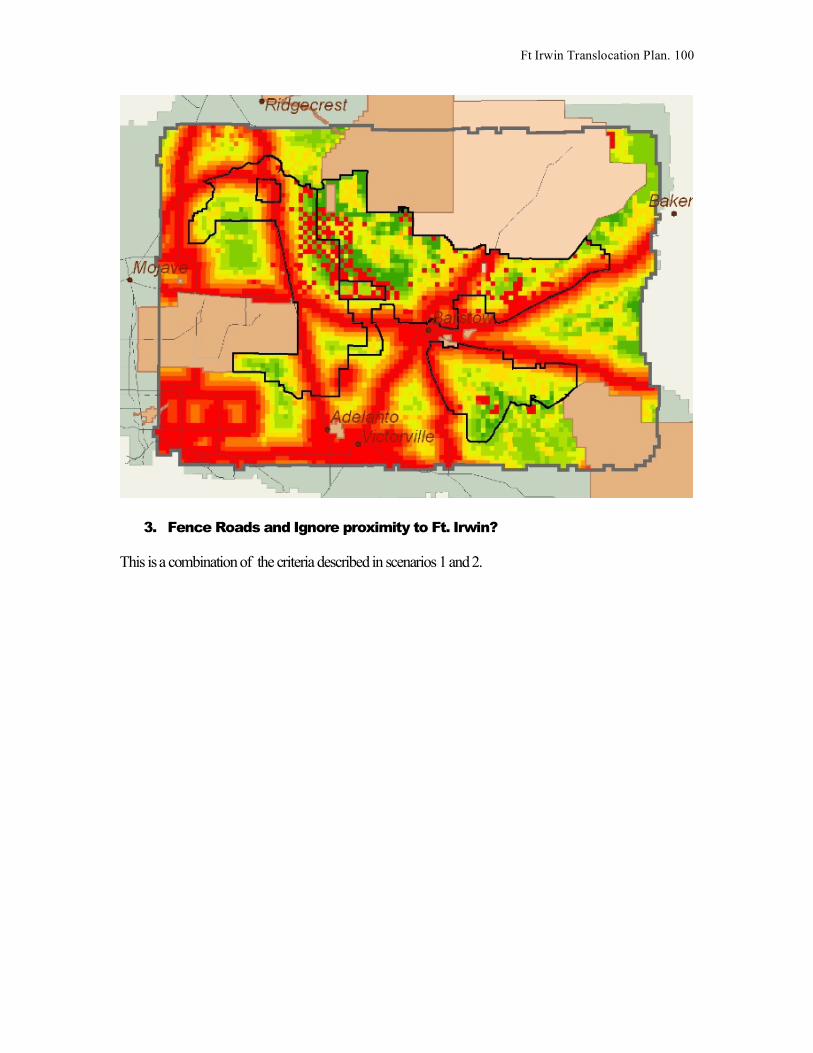
Ft Irwin Translocation Plan. 100
3. Fence Roads and Ignore proximity to Ft. Irwin?
This is a combination of the criteria described in scenarios 1 and 2.
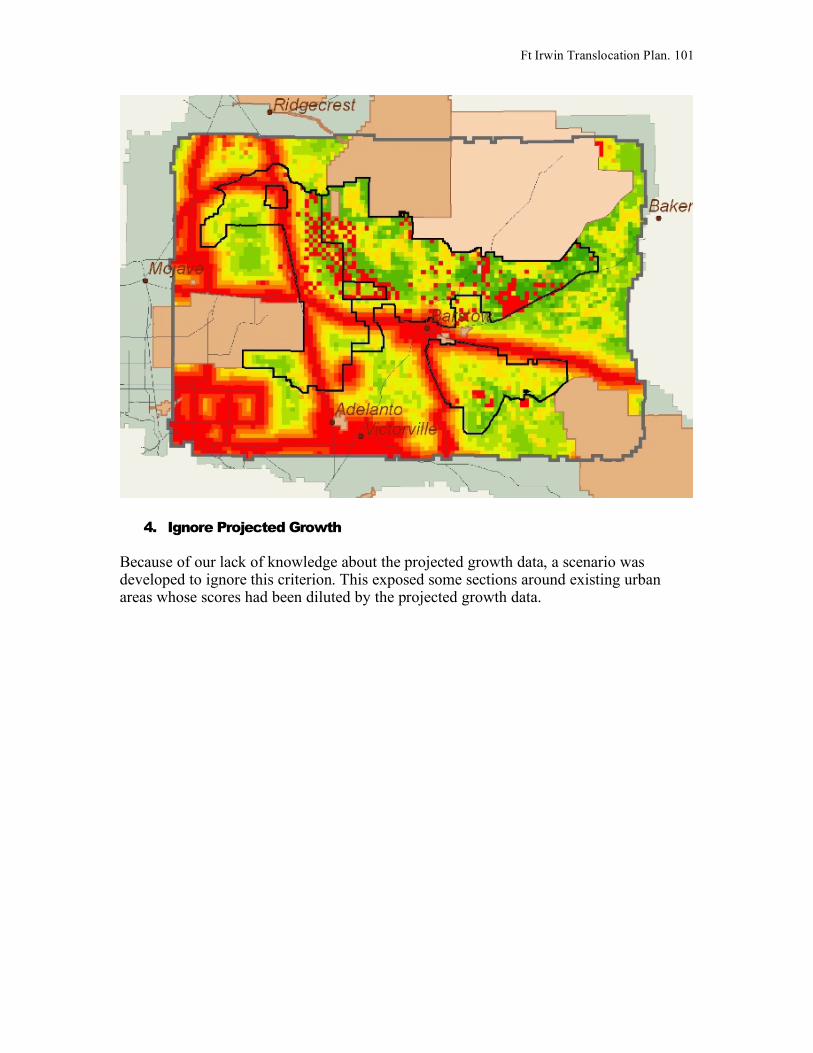
Ft Irwin Translocation Plan. 101
4. Ignore Projected Growth
Because of our lack of knowledge about the projected growth data, a scenario was developed to ignore this criterion. This exposed some sections around existing urban areas whose scores had been diluted by the projected growth data.
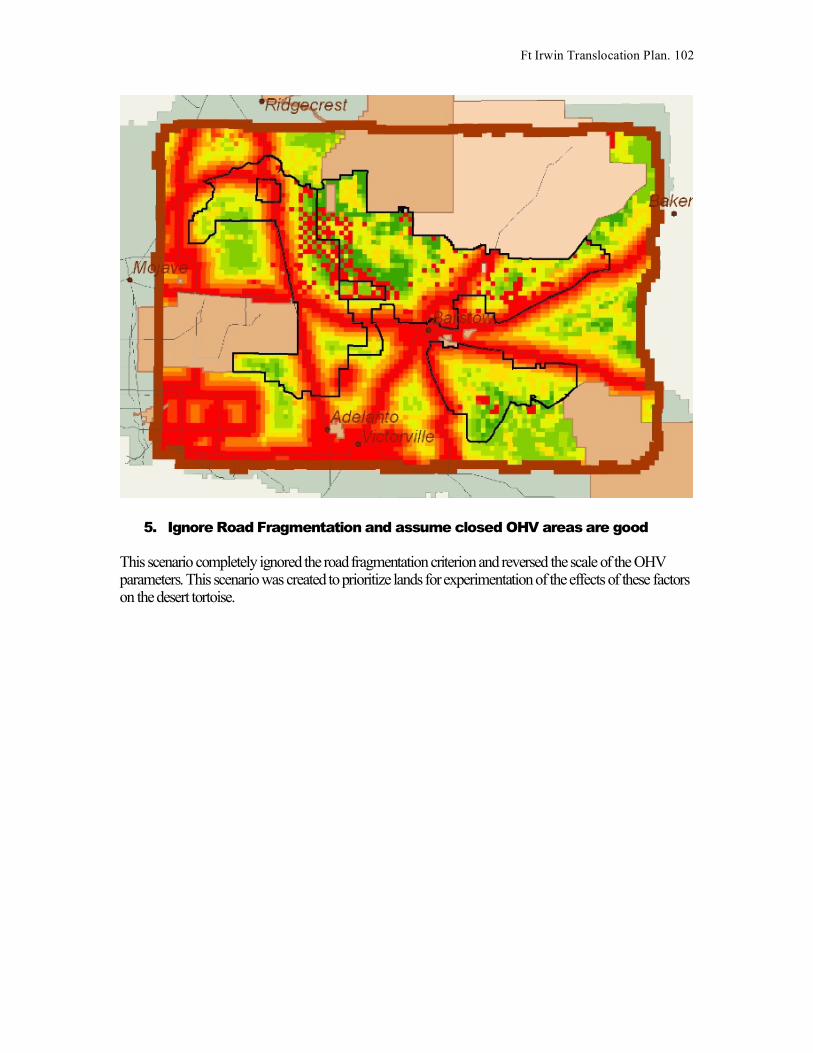
Ft Irwin Translocation Plan. 102
5. Ignore Road Fragmentation and assume closed OHV areas are good
This scenario completely ignored the road fragmentation criterion and reversed the scale of the OHV parameters. This scenario was created to prioritize lands for experimentation of the effects of these factors on the desert tortoise.
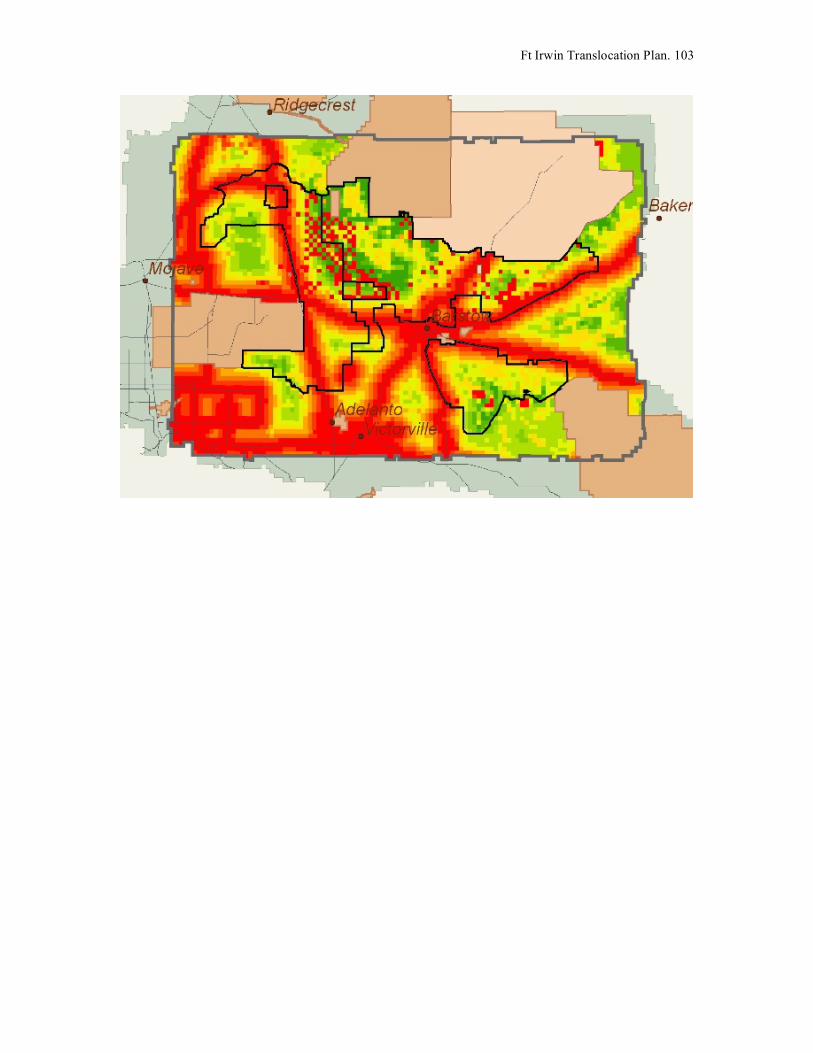
Ft Irwin Translocation Plan. 103
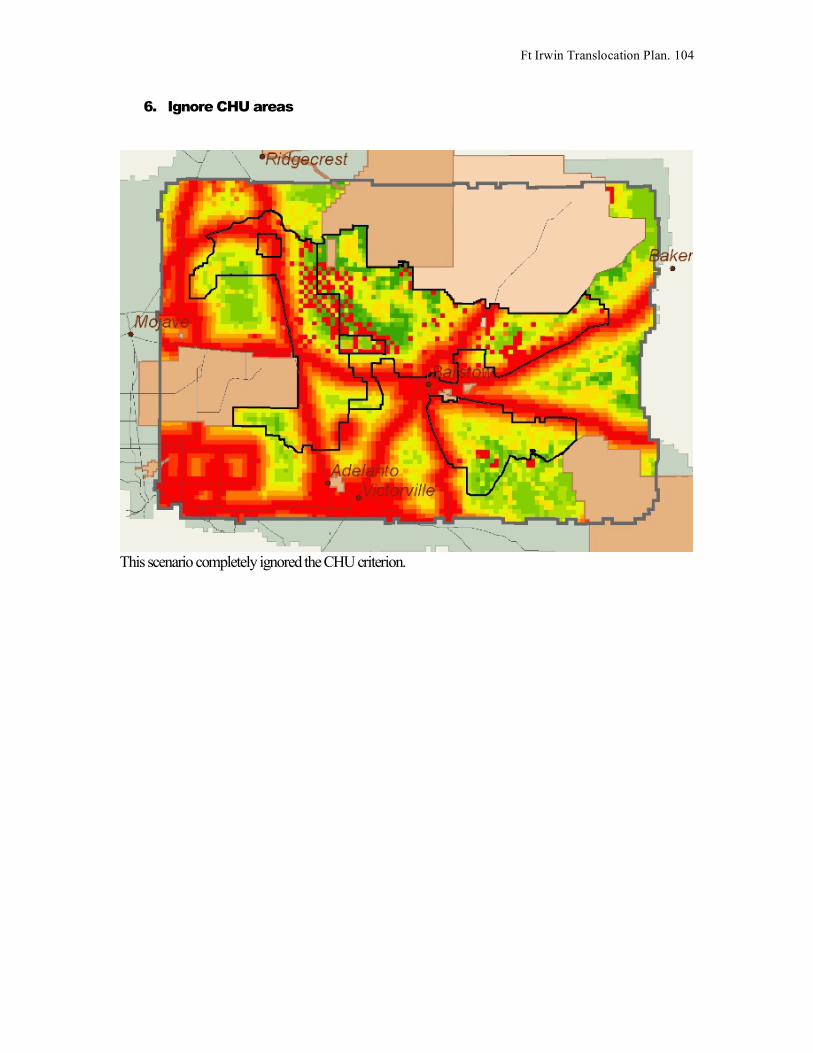
Ft Irwin Translocation Plan. 104
6. Ignore CHU areas
This scenario completely ignored the CHU criterion.
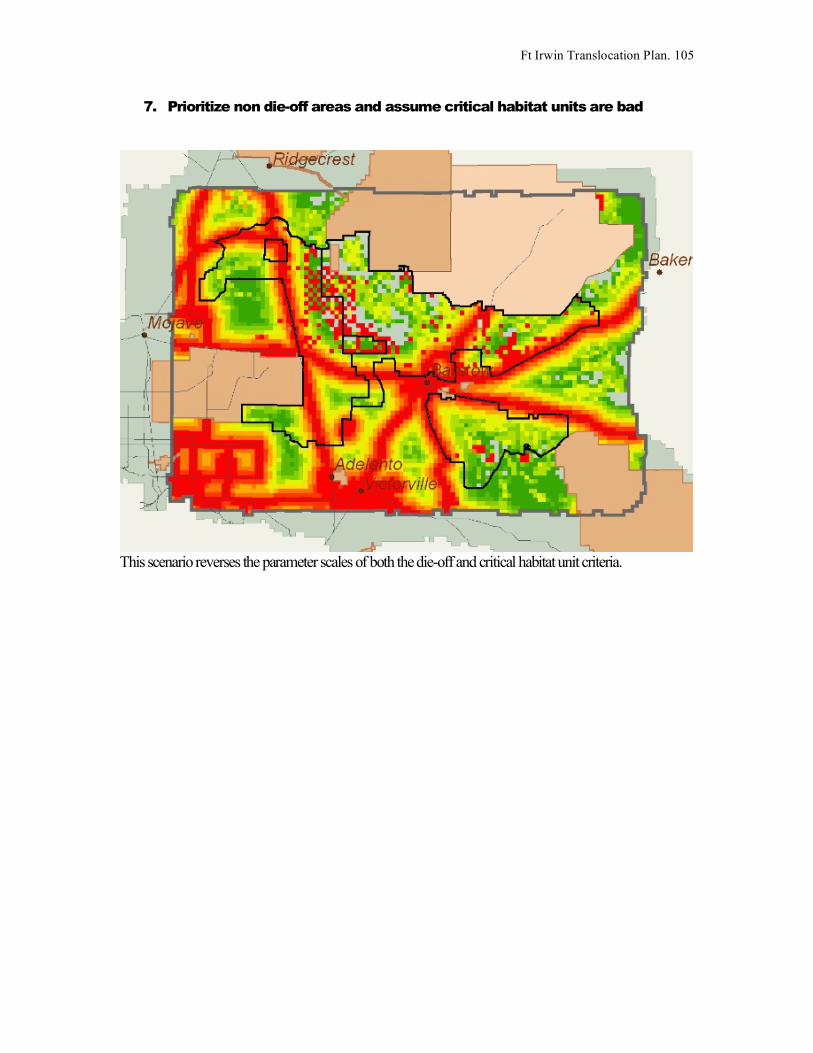
Ft Irwin Translocation Plan. 105
7. Prioritize non die-off areas and assume critical habitat units are bad
This scenario reverses the parameter scales of both the die-off and critical habitat unit criteria.

Ft Irwin Translocation Plan. 106
Table Summary of Modeling scenarios used to come up with potential locations for tortoise translocation.
1 2 3 4 5 6 7 8 9 10
Fence
Rt. 15
and Ft.
Irwin
Roads
Fence Rt.
15, Ft.
Irwin, and
395
Ignore
Genetic
(Proximit
y to Ft.
Irwin)
Fence 15,
Ft Irwin
and
Ignore
Genetic
Ignore
Projected
Growth
Ignore
Road
Fragment
ation and
Assume
Closed
OHV
areas are
good
Ignore
CHU
Areas
Prioritize
non die-
off areas
Ignore die-
off areas
Prioritize
non die-
off areas
and
assume
CHU’s are
bad
x x x x x x x x x x
x x x x x x x x x x
Geomorphology x x x x x x x x x x
Elevation/Latitude x x x x x x x x x x
Percipitation x x x x x x x x x x
Prop. Fenced x x x x x
Rail/Roads x x x x x
Road Frag x x x x x x x x x
Prox to Roads x x x x x x x x x x
Urban Potent growth x x x x x x x x x
Good x x x x x x x x
Bad x
Null x
All x=b x=b x=b x=b x=b x=b x=b x=b x=b
Open x=b
Closed x=g
Die-Off TCS/LDS x=g x=g x=g x=g x=g x=g x=g x=b x=b
Genetics Prox Ft. Irwin x x x x x x x x
x=g Good
x=b Bad
OHV
Senarios
Criteria
Physical
Ownership
Urban Proximity
Roads
CHU
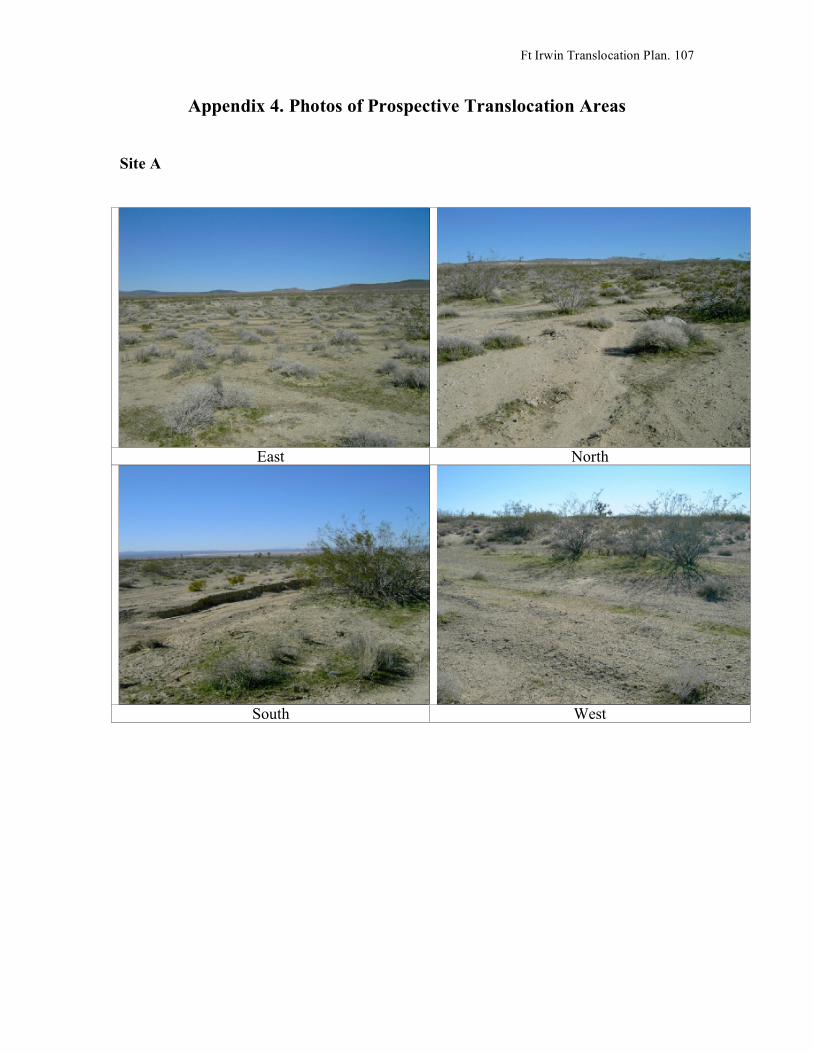
Ft Irwin Translocation Plan. 107
Appendix 4. Photos of Prospective Translocation Areas
Site A
East North
South West

Ft Irwin Translocation Plan. 108
Site B
East North
South West
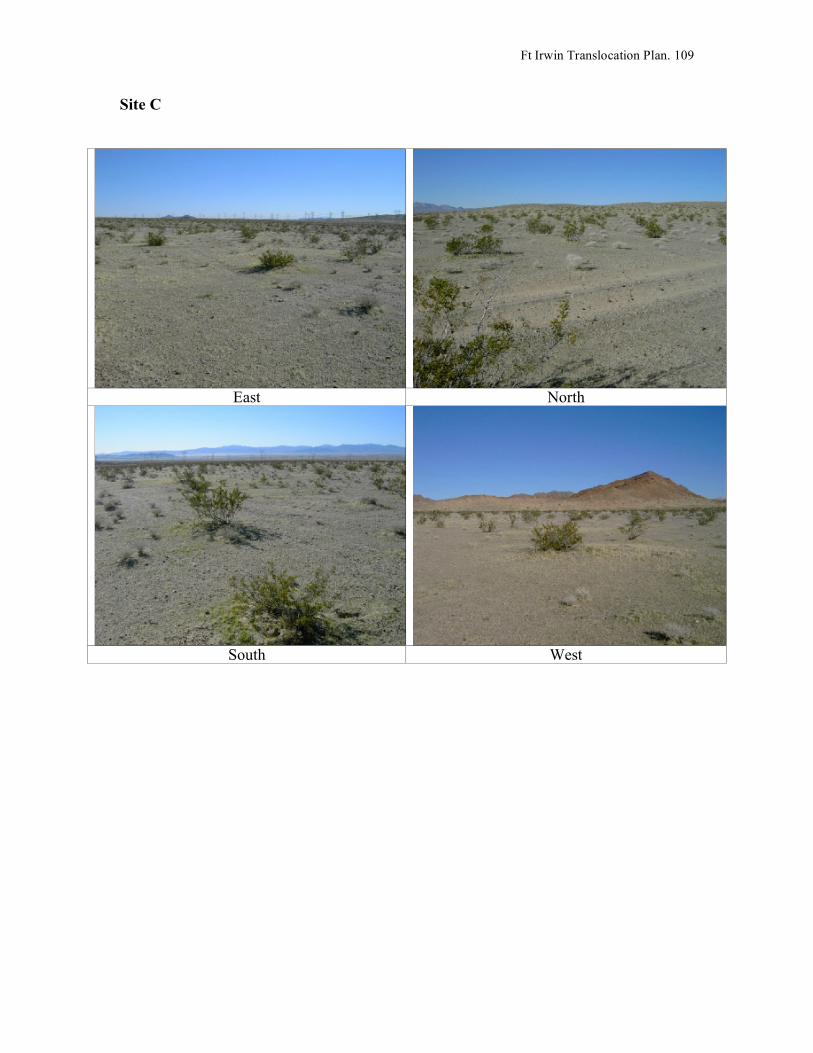
Ft Irwin Translocation Plan. 109
Site C
East North
South West

Ft Irwin Translocation Plan. 110
Site D
East North
South West

Ft Irwin Translocation Plan. 111
Site F
East North
South West
Ft Irwin Translocation Plan. 112
Appendix 5. ELISA Positive and Juvenile Desert Tortoise Plan
7/20/2005
Prepared for
U.S. Army National Training Center, Directorate of Public Works
By:
Neil Lynn ITS Corporation PO Box 105085
Fort Irwin, CA 92310

Ft Irwin Translocation Plan. 113
Introduction
Part of the National Training Center’s (NTC) plan to expand its base boundaries is the translocation of the desert tortoises (Gopherus agassizii) found in the Southern Expansion Area. A translocation plan covering all aspects of translocating animals has been written and reviewed by various researchers and scientists. A portion of the translocation plan deals with the disposition of the tortoises that are found to be ELISA positive and with juvenile tortoises that are too small to reasonably carry radio transmitters for extended time periods. This plan details how the ELISA positive and juvenile tortoises will be dealt with during the course of the translocation project. This plan is broken up into two sections; 1) ELISA positive desert tortoises and 2) juvenile desert tortoises found during the clearance surveys of the Southern Expansion Area. ELISA Positive Desert Tortoises
Upper Respiratory Tract Disease (URTD) played a role in the emergency listing of the tortoise as endangered in 1989 and eventual threatened status listing by the U. S. Fish and Wildlife Service (USFWS) in 1990 (Esque et al 2005). This disease may have also played a significant role in the decline of several populations of tortoises throughout the Western Mojave. URTD is characterized in desert tortoises by a nasal discharge, sunken and puffy eyes, and/or a general lethargy. URTD is a chronic disease and tortoises will go through periods of acute symptoms and dormancy. Tortoises could be ELISA positive, indicating that they have been exposed to the disease, but may not be infected with the organisms any longer. Testing in late 1980’s and early 1990’s showed that the disease is caused by Mycoplasma agassizii and is transmittable to other tortoises by direct contact (Brown et al 2002). All desert tortoises found within the expansion areas will have blood samples taken during the fall of 2005 and late spring of 2006 after transmitters are attached. Blood samples will be taken later in the activity season (May through October) to ensure the immune system is active (Jacobson 2000). These samples will be sent to Dr. Elliott Jacobson at the University of Florida-Gainesville for URTD testing. Tortoises that test positive for URTD will be located using radio telemetry and then moved to a quarantine pen for diseased tortoises. The diseased tortoise quarantine pens will total approximately 140 acres and be located within the UTM 90 East and 500 Meter Corridor conservation areas (Fig. 1). The holding area will be placed in an area that provides ample opportunity for the construction of cover sites and food resources for the tortoises. Prior to placing any tortoises in the holding pen, the area will be surveyed using USFWS accepted methods to determine the levels of tortoise activity in the area. The initial density of tortoises that will be in the quarantine pens will not exceed 200 tortoises/mi2 (80 tortoises/km2). Table 1 shows the breakdown of each quarantine pen. Quarantine pen density may be adjusted in the future
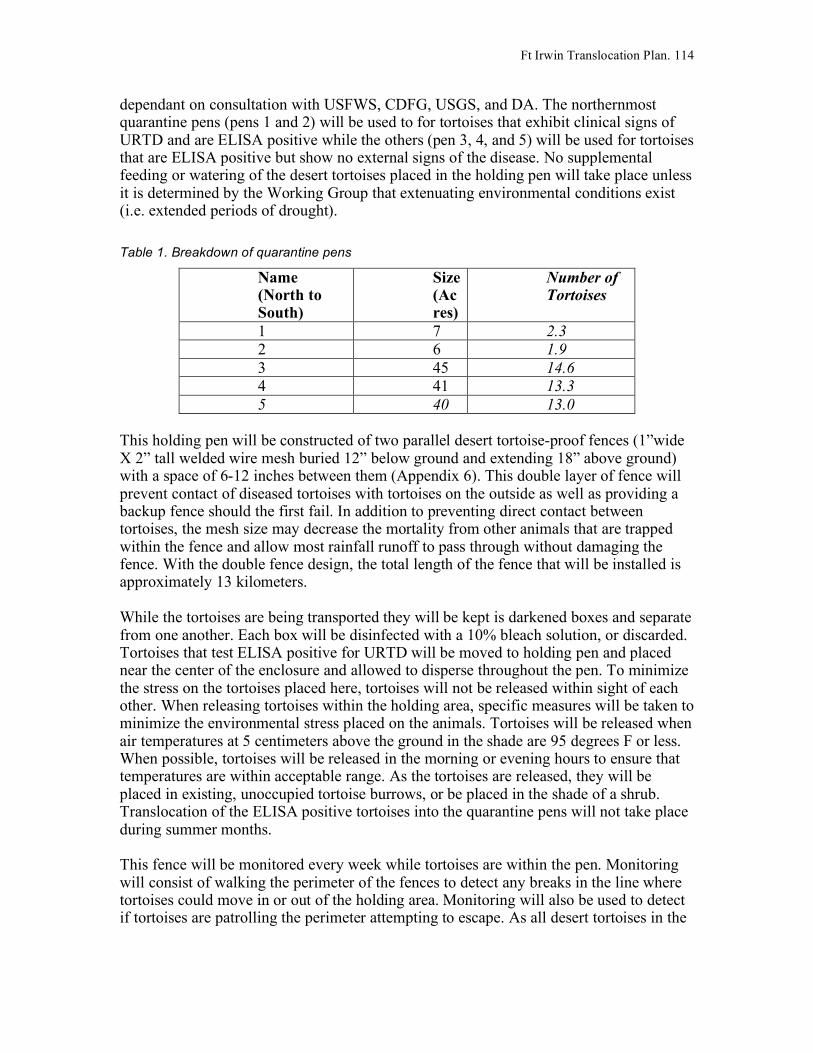
Ft Irwin Translocation Plan. 114
dependant on consultation with USFWS, CDFG, USGS, and DA. The northernmost quarantine pens (pens 1 and 2) will be used to for tortoises that exhibit clinical signs of URTD and are ELISA positive while the others (pen 3, 4, and 5) will be used for tortoises that are ELISA positive but show no external signs of the disease. No supplemental feeding or watering of the desert tortoises placed in the holding pen will take place unless it is determined by the Working Group that extenuating environmental conditions exist (i.e. extended periods of drought).
Table 1. Breakdown of quarantine pens
Name (North to South)
Size (Acres)
Number of Tortoises
1 7 2.3 2 6 1.9 3 45 14.6 4 41 13.3 5 40 13.0
This holding pen will be constructed of two parallel desert tortoise-proof fences (1”wide X 2” tall welded wire mesh buried 12” below ground and extending 18” above ground) with a space of 6-12 inches between them (Appendix 6). This double layer of fence will prevent contact of diseased tortoises with tortoises on the outside as well as providing a backup fence should the first fail. In addition to preventing direct contact between tortoises, the mesh size may decrease the mortality from other animals that are trapped within the fence and allow most rainfall runoff to pass through without damaging the fence. With the double fence design, the total length of the fence that will be installed is approximately 13 kilometers. While the tortoises are being transported they will be kept is darkened boxes and separate from one another. Each box will be disinfected with a 10% bleach solution, or discarded. Tortoises that test ELISA positive for URTD will be moved to holding pen and placed near the center of the enclosure and allowed to disperse throughout the pen. To minimize the stress on the tortoises placed here, tortoises will not be released within sight of each other. When releasing tortoises within the holding area, specific measures will be taken to minimize the environmental stress placed on the animals. Tortoises will be released when air temperatures at 5 centimeters above the ground in the shade are 95 degrees F or less. When possible, tortoises will be released in the morning or evening hours to ensure that temperatures are within acceptable range. As the tortoises are released, they will be placed in existing, unoccupied tortoise burrows, or be placed in the shade of a shrub. Translocation of the ELISA positive tortoises into the quarantine pens will not take place during summer months. This fence will be monitored every week while tortoises are within the pen. Monitoring will consist of walking the perimeter of the fences to detect any breaks in the line where tortoises could move in or out of the holding area. Monitoring will also be used to detect if tortoises are patrolling the perimeter attempting to escape. As all desert tortoises in the
Ft Irwin Translocation Plan. 115
holding pen will be transmittered, each tortoise will be located every 14 to 30 days to assess their condition. Disposition of the ELISA positive tortoises that are placed in the holding pen will be determined at a later date by the Tortoise Translocation working group. If the diseased tortoises are kept in the holding pen for any extended length of time, they may be used in approved research projects or have any eggs laid in the pen used for head starting programs. Juvenile Desert Tortoises
During the fall 2005 of the southern expansion area (SEA), juvenile tortoises found will be treated differently than adult tortoises. The cut-off point for juvenile tortoises is 400g. Any tortoise that is below this weight will be treated as a juvenile. Any tortoises over 400 g will be treated as an “adult.” Any juvenile tortoises that are found in SEA that are too small to carry a radio transmitter with a one year battery life will be taken out of the field immediately upon locating them. They will then be placed in a climate controlled temporary holding facility located at the Directorate of Public Works-Environmental office or another available office at Fort Irwin while blood samples are sent for ELISA testing. From the time that the juveniles are collected to when their testing results become available, these tortoises will be kept in isolation from one another by placing them in clear “Tupperware” containers roughly the size of a shoebox that are filled with sand, soil, or similar substance. Only one tortoise will be placed in each container at a time. Each tortoise will be monitored daily while in isolation. Disinfection of the containers will occur with a 10% bleach solution before any other tortoises are placed in them. Juvenile tortoises that are determined to be URTD negative will be moved to either the existing FISS enclosure or a new temporary enclosure to be built at the same location. Movement of juvenile tortoises will have the same climate restrictions as all other tortoises being moved as part of this translocation program. Both the existing FISS and the new temporary enclosures are designed to enclose native vegetation while minimizing surface disturbance. The temporary enclosures are built without a foundation supported by poles 2-3 meters tall. Both the existing facility and the temporary enclosures are designed in such a way as to exclude all predators of juvenile desert tortoises (ravens, coyotes, etc). When the translocation of tortoises to the recipient sites is ready to begin in 2006, the URTD negative juvenile tortoises will be taken from the FISS site and moved to the recipient sites at the same time as the adult tortoises. The juveniles will be transported in the same manner as before. Diseased juvenile tortoises will be kept in one of the FISS enclosures until such time that they are large enough to be put into the URTD positive pen. UTRD positive juveniles will not be placed in with disease free tortoises. All juvenile tortoises found will be affixed with specially designed radio transmitters that are small enough as to not induce significant detrimental stress. Due to the small size of these transmitters and the subsequent short battery life, these juvenile transmitters will
Ft Irwin Translocation Plan. 116
have to be exchanged out approximately every ten weeks. Juveniles will also be marked using either a Passive Integrated Transducer (PIT) tag and/or fitted with an external label and notched using appropriate standards (ASIH 2004). Juvenile tortoises may be used in future research projects as determined by the Tortoise Translocation Working Group. Monitoring of the FISS enclosures will occur in the same manner as the diseased tortoise holding pen with weekly trips being made to the enclosures to check for breaches and checking on the overall condition of the enclosure. As with the URTD holding area, no efforts will be made to supplement food or water resources within the enclosure unless the Working Group decides that it is necessary. While the juvenile tortoises are held within the FISS sites, they will be monitored every 14 to 30 days to assess their general condition. As the juvenile tortoises grow to be over 400g, they will then be released to the recipient sites for translocation or otherwise utilized in research.
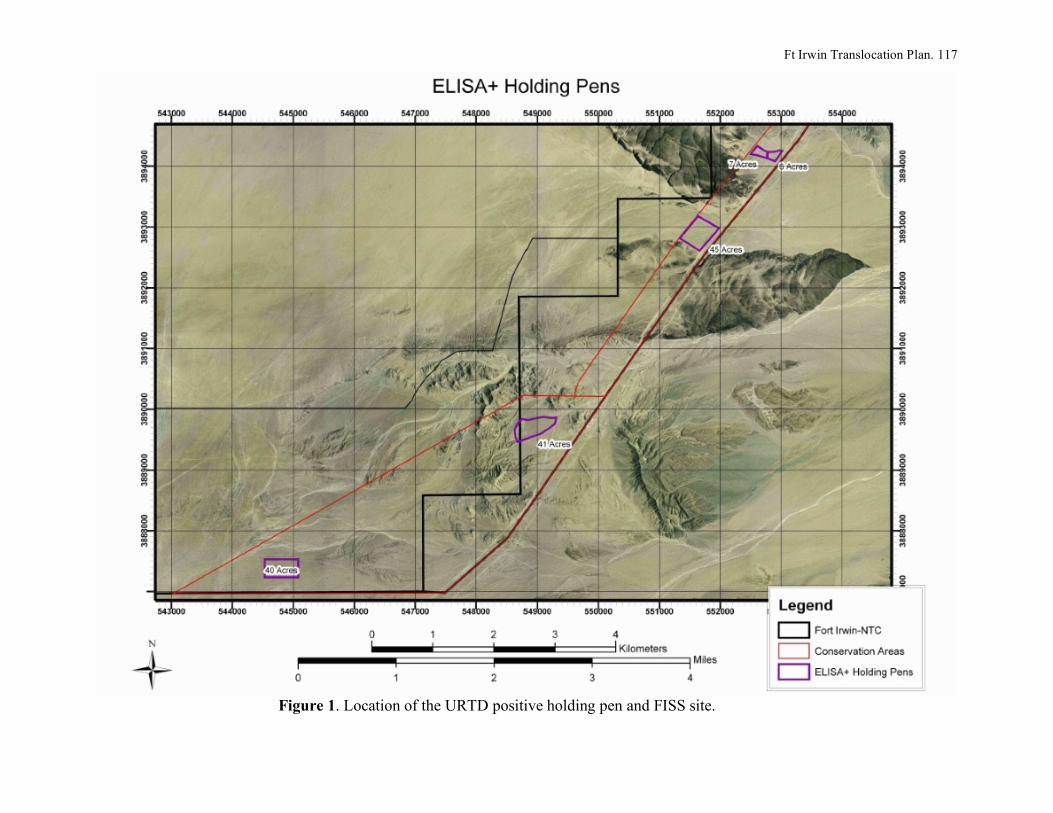
Ft Irwin Translocation Plan. 117
Figure 1. Location of the URTD positive holding pen and FISS site.

Ft Irwin Translocation Plan. 118
Literature Cited
ASIH. 2004 Guidelines for use of live amphibians and reptiles in field a laboratory research.
Second Edition. Revised by the Herpetological Animal Care and Use Committee (HACC) of the American Society of Ichthyologists and Herpetologists. (Committee Chair: Steven J. Beaupre, Members: Elliott R. Jacobson, Harvey B. Lillywhite, and Kelly Zamudio).
Brown, D.R., I.M. Schumacher, G.S. McLaughlin, L.D. Wendland, M.B. Brown, P.A. Klein, and
E.R. Jacobson. 2002. Application of diagnostic tests for mycoplasmal infections of the desert and gopher tortoises, with management recommendations. Chelonian Conservation and Biology 4: 497-507.
Esque, T. C., K. E. Nussear, and P.A. Medica. 2005. Desert Tortoise Translocation Plan for Fort
Irwin’s Land Expansion Program at the U. S. Army National Training Center (NTC) & Fort Irwin.
Jacobson, E. R. 2000. Collecting biological samples for clinical evaluation. In Concepts of
reptile disease and surgical techniques. University of Florida http://iacuc.ufl.edu/OLD%20WB%20Site/bloodsample.htm
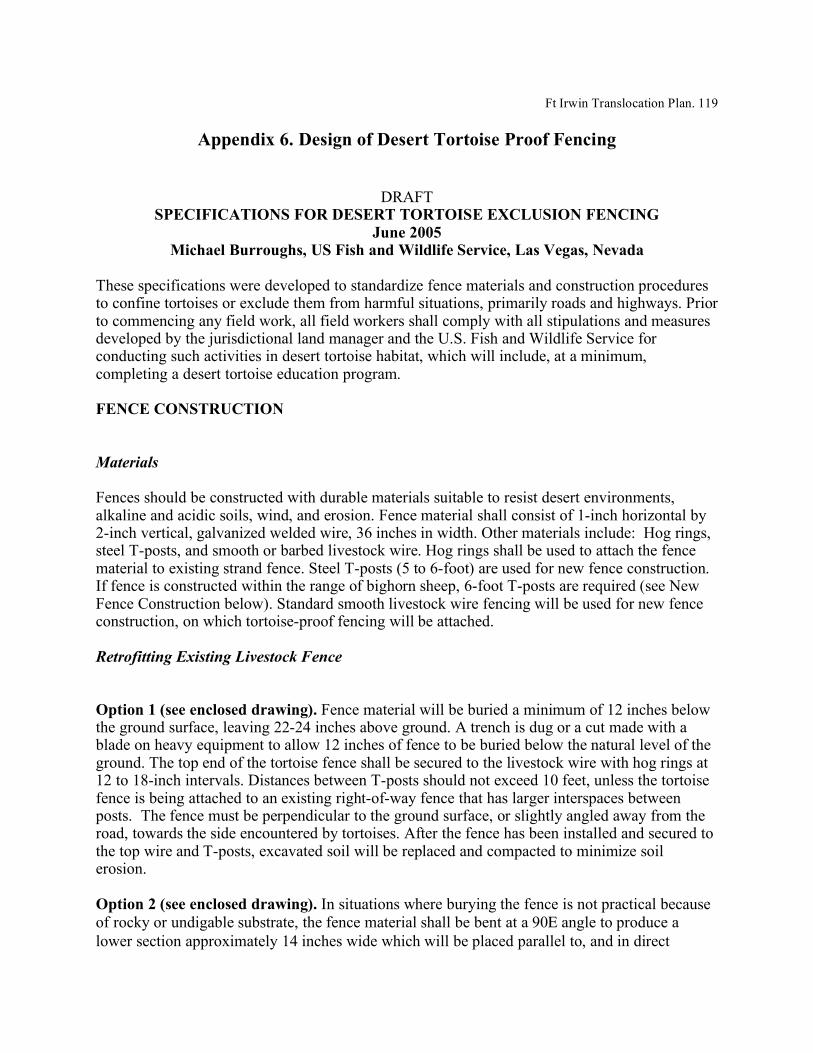
Ft Irwin Translocation Plan. 119
Appendix 6. Design of Desert Tortoise Proof Fencing
DRAFT
SPECIFICATIONS FOR DESERT TORTOISE EXCLUSION FENCING June 2005
Michael Burroughs, US Fish and Wildlife Service, Las Vegas, Nevada These specifications were developed to standardize fence materials and construction procedures to confine tortoises or exclude them from harmful situations, primarily roads and highways. Prior to commencing any field work, all field workers shall comply with all stipulations and measures developed by the jurisdictional land manager and the U.S. Fish and Wildlife Service for conducting such activities in desert tortoise habitat, which will include, at a minimum, completing a desert tortoise education program. FENCE CONSTRUCTION
Materials
Fences should be constructed with durable materials suitable to resist desert environments, alkaline and acidic soils, wind, and erosion. Fence material shall consist of 1-inch horizontal by 2-inch vertical, galvanized welded wire, 36 inches in width. Other materials include: Hog rings, steel T-posts, and smooth or barbed livestock wire. Hog rings shall be used to attach the fence material to existing strand fence. Steel T-posts (5 to 6-foot) are used for new fence construction. If fence is constructed within the range of bighorn sheep, 6-foot T-posts are required (see New Fence Construction below). Standard smooth livestock wire fencing will be used for new fence construction, on which tortoise-proof fencing will be attached. Retrofitting Existing Livestock Fence
Option 1 (see enclosed drawing). Fence material will be buried a minimum of 12 inches below the ground surface, leaving 22-24 inches above ground. A trench is dug or a cut made with a blade on heavy equipment to allow 12 inches of fence to be buried below the natural level of the ground. The top end of the tortoise fence shall be secured to the livestock wire with hog rings at 12 to 18-inch intervals. Distances between T-posts should not exceed 10 feet, unless the tortoise fence is being attached to an existing right-of-way fence that has larger interspaces between posts. The fence must be perpendicular to the ground surface, or slightly angled away from the road, towards the side encountered by tortoises. After the fence has been installed and secured to the top wire and T-posts, excavated soil will be replaced and compacted to minimize soil erosion. Option 2 (see enclosed drawing). In situations where burying the fence is not practical because of rocky or undigable substrate, the fence material shall be bent at a 90Ε angle to produce a lower section approximately 14 inches wide which will be placed parallel to, and in direct
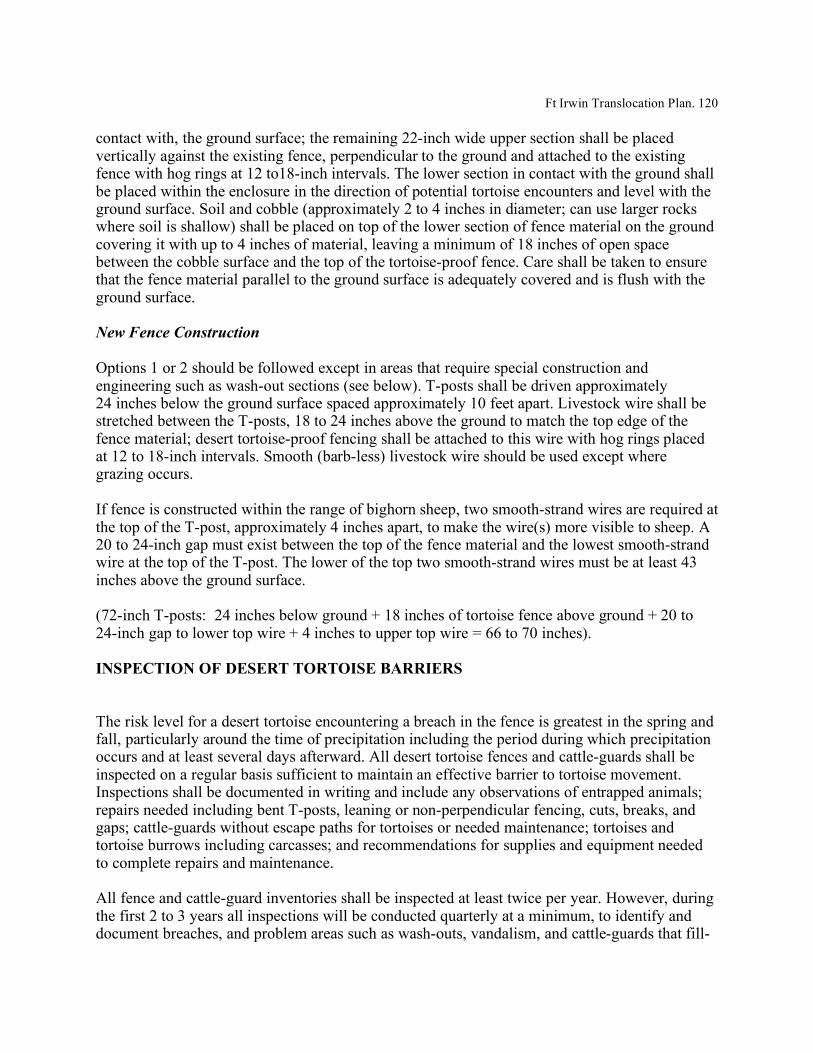
Ft Irwin Translocation Plan. 120
contact with, the ground surface; the remaining 22-inch wide upper section shall be placed vertically against the existing fence, perpendicular to the ground and attached to the existing fence with hog rings at 12 to18-inch intervals. The lower section in contact with the ground shall be placed within the enclosure in the direction of potential tortoise encounters and level with the ground surface. Soil and cobble (approximately 2 to 4 inches in diameter; can use larger rocks where soil is shallow) shall be placed on top of the lower section of fence material on the ground covering it with up to 4 inches of material, leaving a minimum of 18 inches of open space between the cobble surface and the top of the tortoise-proof fence. Care shall be taken to ensure that the fence material parallel to the ground surface is adequately covered and is flush with the ground surface. New Fence Construction
Options 1 or 2 should be followed except in areas that require special construction and engineering such as wash-out sections (see below). T-posts shall be driven approximately 24 inches below the ground surface spaced approximately 10 feet apart. Livestock wire shall be stretched between the T-posts, 18 to 24 inches above the ground to match the top edge of the fence material; desert tortoise-proof fencing shall be attached to this wire with hog rings placed at 12 to 18-inch intervals. Smooth (barb-less) livestock wire should be used except where grazing occurs. If fence is constructed within the range of bighorn sheep, two smooth-strand wires are required at the top of the T-post, approximately 4 inches apart, to make the wire(s) more visible to sheep. A 20 to 24-inch gap must exist between the top of the fence material and the lowest smooth-strand wire at the top of the T-post. The lower of the top two smooth-strand wires must be at least 43 inches above the ground surface. (72-inch T-posts: 24 inches below ground + 18 inches of tortoise fence above ground + 20 to 24-inch gap to lower top wire + 4 inches to upper top wire = 66 to 70 inches). INSPECTION OF DESERT TORTOISE BARRIERS
The risk level for a desert tortoise encountering a breach in the fence is greatest in the spring and fall, particularly around the time of precipitation including the period during which precipitation occurs and at least several days afterward. All desert tortoise fences and cattle-guards shall be inspected on a regular basis sufficient to maintain an effective barrier to tortoise movement. Inspections shall be documented in writing and include any observations of entrapped animals; repairs needed including bent T-posts, leaning or non-perpendicular fencing, cuts, breaks, and gaps; cattle-guards without escape paths for tortoises or needed maintenance; tortoises and tortoise burrows including carcasses; and recommendations for supplies and equipment needed to complete repairs and maintenance. All fence and cattle-guard inventories shall be inspected at least twice per year. However, during the first 2 to 3 years all inspections will be conducted quarterly at a minimum, to identify and document breaches, and problem areas such as wash-outs, vandalism, and cattle-guards that fill-

Ft Irwin Translocation Plan. 121
in with soil or gravel. GPS coordinates and mileages from existing highway markers should be recorded in order to pinpoint problem locations and build a database of problem locations that may require more frequent checking. Following 2 to 3 years of initial inspection, subsequent inspections shall focus on known problem areas which will be inspected more frequently than twice per year. In addition to semi-annual inspections, problem areas prone to wash-outs shall be inspected following precipitation that produces potentially fence-damaging water flow. A database of problem areas will be established whereby checking fences in such areas can be done efficiently. MAINTENANCE AND REPAIR OF DESERT TORTOISE BARRIERS
In addition to periodic inspections, debris shall be removed that accumulates along the fence. Repairs of fence wash-outs: (1) realign the fence out of the wash if possible to avoid the problem area, or (2) re-construct tortoise-proof fencing using techniques that will ensure that an effective desert tortoise barrier is established that will not require frequent repairs and maintenance. Gaps and breaks will require either: (a) repairs to the existing fence in place, with similar diameter and composition of original material, (b) replacement of the damaged section to the nearest T-post, with new fence material that original fence standards, (c) burying fence, and/or (d) restoring zero ground clearance by filling in gaps or holes under the fence and replacing cobble over fence constructed under Option 2. Tortoise-proof fencing shall be constructed and maintained at cattle-guards to ensure that a desert tortoise barrier exists at all times. All fence damage shall be repaired in a timely manner to ensure that tortoises do not travel through damaged sections. Similarly, cattle-guards will be cleaned out of deposited material underneath them in a timely manner. All cattle-guards that serve as tortoise barriers shall be installed and maintained to ensure that any tortoise that falls underneath has a path of escape without crossing the intended barrier.
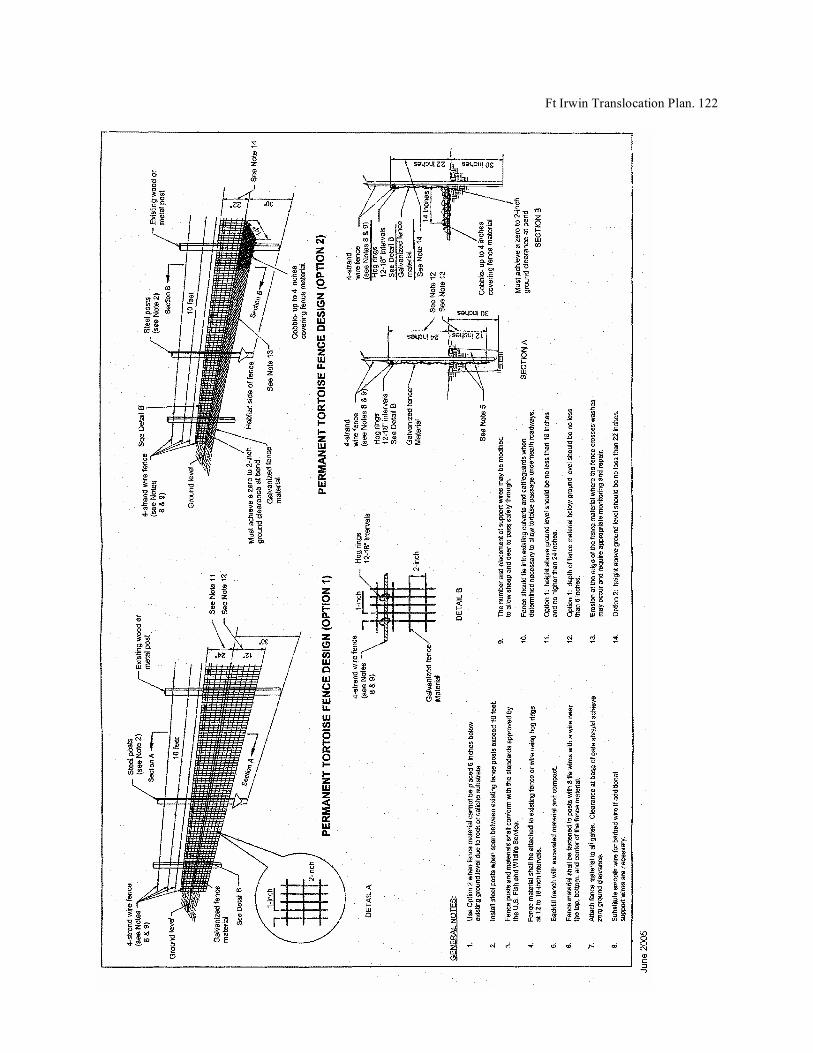
Ft Irwin Translocation Plan. 122