Embed Size (px)
Citation preview

Describing Behavior
Chapter 4

Data Analysis
Two basic types Descriptive
Summarizes and describes the nature and properties of the data
Inferential What is the likelihood the results in the sample
actually occur in the population (e.g., differences between groups, relationships
between variables)

Describing Individual Differences
Measures of Central Tendency
Measures of Variability
Distribution of the data

Mean average score of all observations in
distribution Median
midpoint of all scores in distribution Mode
most frequently occurring score in distribution
Measures of Central Tendency

Range subtract the lowest from the highest
score Standard Deviation
measure of the “spread” of the scores around the mean
– Variance square of the standard deviation
Measures of Variability

∑(xi – x)2
n-1√
(1 – 3)2 + (2 – 3)2 + (3 – 3)2 + (4 – 3)2 + (5 – 3)2
5 - 1√
(-2)2 +(-1)2 +(0)2 + (1)2 + (2)2
5 - 1√ 4 + 1 + 0 + 1 + 4
4√12345
153
SumMean
Data
10
4√ 2.5√1.58
Calculating the standard deviation

Data Distributions

Descriptive Statistics
Distribution of the data Shapes of distribution curves
Bell (normal distribution) The bell curve has desirable statistical properties A number of inferential statistics “assume” data is
normally distributed
Skewed Curves Negative Skew - tail of the curve is to the left Positive Skew - tail of the curve is to the right

Measures of central tendency are the same mean = median = mode
We know percentage of scores that fall within 1 standard deviation (68%) 2 standard deviations (95%) 3 standard deviations (99%)
Properties of a Normal Distribution


The extent to which one variable can be understood on the basis of another Properties of correlation coefficient
direction (positive or negative) magnitude (strength of the
relationship)
Correlation

0
50
100
150
200
250
300
350
0 20 40 60 80 100 120
Exam Points
Fin
al G
rade
Poi
nts r = .95
Positive Correlation

0
50
100
150
200
250
300
350
0 20 40 60 80 100 120
Exam Points
Fin
al G
rade
Poi
nts r = .00
No Correlation

Job Satisfaction
Tur
nove
r In
tent
ions
r = -.95
Low HighLow
High
Negative Correlation

Correlation: A Review
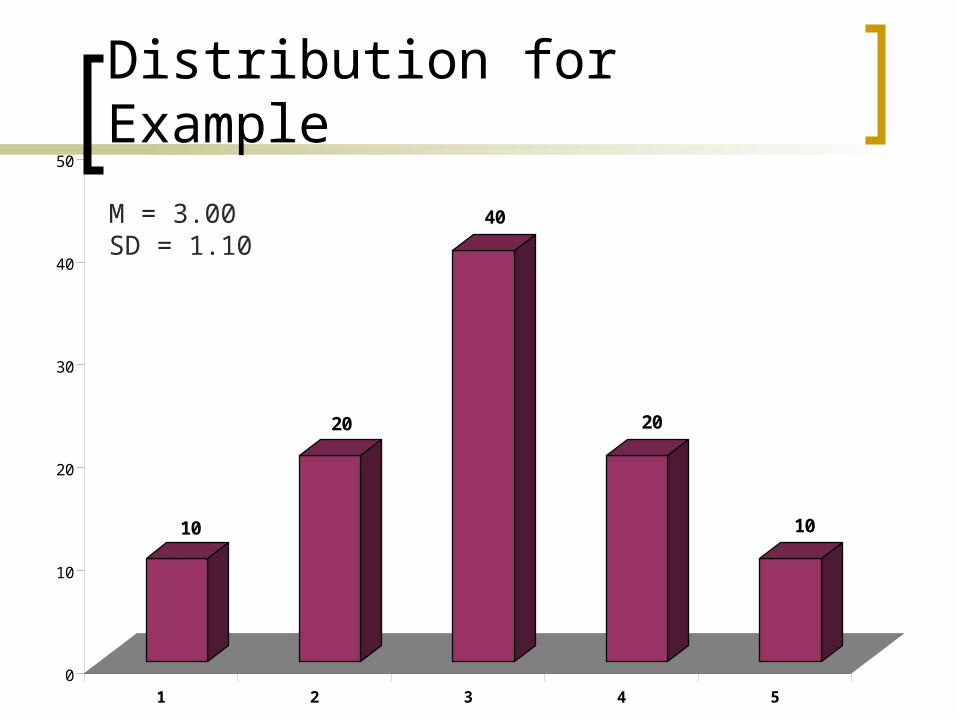
Distribution for Example
10
20
40
20
10
0
10
20
30
40
50
1 2 3 4 5
M = 3.00SD = 1.10