Embed Size (px)
Citation preview

155Revista Ingeniería de Construcción Vol. 27 Nº3, Diciembre de 2012 www.ricuc.cl
Desarrollo de un algoritmo computacional /Development of an computational algorith
Desarrollo de un algoritmo computacional para la estimación de la tensión de cables en puentes atirantados con base en la medición experimental en laboratorio y campo de sus modos y frecuencias naturales de vibraciónDevelopment of an computational algorith for estimating cables´tensile stress on cable-stayed bridges based on experi-mental laboratory and job site measurements on their natural vibration modes and frequencies
Giordano Avellaneda*, Ricardo Noguera*, Edgar Muñoz1*
* Pontificia Universidad Javeriana. COLOMBIA
Fecha de Recepción:27/06/2012Fecha de Aceptación:15/10/2012
PAG 155 - 180
Resumen
En la presente investigación, se propone una nueva metodología para estimar la tensión de los tirantes con base en sus modos y frecuencias naturales de vibración, mediante el desarrollo de un aplicativo computacional apoyado en el método de los elementos finitos (FEM) y en el análisis detallado de las señales. Para ello se presenta en este documento un estado del arte con algunos de los trabajos desarrollados en el mundo, un marco conceptual y la metodología planteada para su desarrollo y ejecución. El aplicativo computacional fue generado en MATLAB® y validado a través de mediciones experimentales en un prototipo a escala y en algunos cables de un puente atirantado en Colombia cuando estaba en proceso de construcción, con el cual se permite estimar la magnitud de la tensión de los tirantes con errores mínimos.
Palabras Clave: Frecuencias naturales, tensión, elementos finitos, señales, monitoreo e instrumentación.
Abstract
In the present research, is proposed a new methodology for estimating tension forces in cables on the basis of their modes and natural frequencies of vibration, by de-veloping a computer application leaning on the finite element method (FEM) and a detailed analysis of signals. In this paper is presented a state of the art with some of the work done around the world, a conceptual framework and a proposed methodology for its development and implementation. The computer application which was programmed in MATLAB ®, which was validated through experimental measurements on a scaled prototype and some cables of a cable stayed bridge under construction in Colombia, allows to estimate the magnitude of the cable’s tension with minimal errors.
Keywords: Natural frequencies, stress, finite elements, signals, monitoring and instrumentation.
1 Autor de correspondencia / Corresponding author:E-mail: [email protected]
1. Introduction
Nowadays the construction of cable-stayed bridges is becoming quite frequent. The implementation of such types of structures is not only based on esthetic and architectonical advantages they provide on the environment. The implementation is based on the characteristics approach they involve. Cable-stayed bridges enable the development of great spans that may achieve values up to 1088 m [Nanjing, 2008]; hence, such bridges together with suspension bridges make them the preferred structural systems for the development of such projects. Besides, their versatility facilitates their application on relatively short spans, between 100 and 150 m, competing against other systems, such as progressive cantilever bridges, extradosed bridges and arch bridges, among others.
Bridges as well as lanes are infrastructure civil works, which purpose is to facilitate vehicles mobility and flow. This means they are subject to loading and unloading scenarios, which generates a reduction in the resistance of elements due to fatigue and to other mechanical processes involved in such kind of situations.

156 Revista Ingeniería de Construcción Vol. 27 Nº3, Diciembre de 2012 www.ricuc.cl
Giordano Avellaneda, Ricardo Noguera, Edgar Muñoz
The entities dealing with “public” nature structures are well aware of these matters. Therefore, they apply established processes to mitigate such phenomena, which include permanent maintenance and the restoration of comprised elements, whenever is needed, in order to keep their functionality and purpose during the structure life span.
The maintenance and restoration program on cable-stayed bridges include the review of pylon, deck and straps. There are diverse laboratory tests and instrumentation processes which allow us to check and assess the mechanical properties of materials comprised in pylons and decks. However, for the case of straps, the current procedure is based on a visual inspection (in order to assess the cables integrity against chemical effects) and a their tensile stress check out assisted by a strand jack, which is a very accurate instrument but it requires a partial loosening of cable strands comprised by the strap. This situation leads to a loss of structural capacity during the procedure; therefore, this type of inspection demands a temporary closure (partial or total) of the structure in order to avoid any type of failure.
By taking above into consideration, the present research has the purpose of proposing a new methodology to estimate straps tensile stress based on their natural vibration modes and frequencies by means of a computer application supported on the finite elements method (FEM) and on a detailed signals analysis obtained through its monitoring and instrumentation.
2. Methodology
A thorough research was carried out on knowledge conditions, not only for studies directly related to the cables tensile stress estimation, but also for subjects involving the finite elements modeling on this kind of structure, as well as every single aspect of signals study and analysis. As far as scale modeling is concerned, information was collected regarding employed models which were likely used by other researches, such us conditions for geometry escalation without affecting the structure behavior and others.
Afterwards, the scale prototype was elaborated, which design was carefully reviewed in order to avoid measurement mistakes as a result of undesired deformations. As far as the structure behavior is concerned, several scenarios were developed to properly select the loads to be applied on cables, so as to represent with higher accuracy the vibration phenomenon to obtain frequencies similar to the ones existing on a real bridge that would enable us to validate a reliable algorithm.
Parallel to the scale prototype, a software application was developed including the procedure to be employed and the tools it will count with. For above studies and the correct prototype execution, flow diagrams were created in order to clarify the program operation. The employed finite element was selected with the contribution of the first instrumentations carried out to the scale model, as well as previous information available on other cables, with the purpose of ensuring a correct mathematical modeling (key for this procedure).

157Revista Ingeniería de Construcción Vol. 27 Nº3, Diciembre de 2012 www.ricuc.cl
Desarrollo de un algoritmo computacional /Development of an computational algorith
Año Referencia Tema Metodología
2010Kangas et al
2010
Identification of Cable Forces on Cable-StayedBridges: A Novel Application of the MUSIC Algorithm
Aplicación del algoritmo "Multiple Signal Classification" (MUSIC) el cual desarrolla un eigen-análisis en la secuencia de datos para
estimar y eliminar las constribuciones del sónido antes de crear el espectro de
frecuencias dando como resultado una estimación mas precisa de las frecuencias
naturalesde los cables que la brindada por los espectros de frecuencia basados en fourier. (los valores de la tensión se calcularon con la fórmula de la teoría de cables T=4mL2(fn/n)2).
se obtuvo errores del orden de ±3%
2009Badel et al
2009
Estudio e implementación de los métodos para la estimación de la fuerza de tensión en tirantes de puentes usando sus modos y frecuencias naturales de vibración
Realizado por estudiantes de la Pontificia Universidad Javeriana, en la cual se compararon
diferentes métodos para la estimación de la tensión en tirantes con ayuda de registros de
aceleración tomados al puente de dos quebradas (aplicación de métodos empíricos y
de un método análitico).
2009Li - Wang et
al 2009
Cable tension measurement for cable-stayed bridge considering on the effect of Damper
Implementación de los efectos de amortiguamiento en un modelo analítico para identificación de las frecuencias naturales en
los cables.
2005Ren et al
2005Empirical formulas to estimate cable tension by cable fundamental frequency
identificación de la tensión en los tirantes a partir de expresiones derivadas de la teoría de cables ajustadas a traves de procedimientos de laboratorio, las cuales consideran efectos como
el de catenaria, rigidez a flexión y geometría del cable.
2003Ren et al
2003Experimental modal analysis of stayed cables in cable stayed bridges
Se realiza un análisis minucioso del comportamiento del cable y su modelación matemática para el desarrollo de un análisis
modal del cable.
2010Thai et al
2010Nonlinear static and dynamic analysis of cable structures
Desarrollo de un elemento finito curvo tridimensional para el análisis del
comportamiento mecánico de un cable sometido a su peso propio y/o a una tensión
externa para su posterior aplicación y verificación.
1997Karoumi
1997
Some modeling aspects in the nonlinear finite element analysis of cable supported bridges
Desarrollo de un elemento finito de tipo catenaria bidimensional de solo dos nodos a
partir de la formulación directa del comportamiento de este tipo de elemento, análisis de los resultados obtenidos por el modelamiento, resultados de laboratorio y
contraste con programas especializados como SAP2000 y Ansys.
Table 1. Studies related with the present research
After concluding these two stages, the software calibration and adjustment was developed, taking into consideration the obtained information by the scale modeling, which provided data regarding the most prevailing variables of the phenomenon (such as mass and geometrical properties). At the same time, the number of work frequencies and tools for frequency selection were selected.
With the software application properly running, it was time to go one step further in this research: its application on an existing bridge. Above was possible due to the permissions granted by the construction company Conconcreto S.A. and the information released by VSL (entity in charge of tensioning execution). Measurements were conducted on straps belonging to the Gilberto Echeverry Mejía Bridge located in Medellin, Colombia.
Finally, the corresponding analysis results and conclusions were developed. So as to check the accuracy of the software application and the employed methodology.
2.1 State of the artFor the development of this investigation, conducted
studies and advances achieved by different authors were taken into consideration, which are summarized as follows:

158 Revista Ingeniería de Construcción Vol. 27 Nº3, Diciembre de 2012 www.ricuc.cl
Giordano Avellaneda, Ricardo Noguera, Edgar Muñoz
Year Reference Subject Methodology
2010 Kangas et al 2010
Identification of cable Forces on Cable-Stayed
Bridges: A Novel Application of the MUSIC algorithm
Application of “Multiple Signals classification” algorithm, which develops an Eigen-analysis for a data sequency to estimate and
eliminate sound contributions before creating the frequency spectrum, thus obtaining as a result a more
accurate estimation of cables natural frequency than the one delivered by frequency spectrum based on Fourier. (Tension values were calculated with
the cable theory formula T=4mL2 (fn/n)2). Obtained errors were ±
3% app.
2009 Badel et al 2009
Study and implementation of methods for estimating tensile
strength on bridges straps by using their vibration natural modes and
frequencies.
Developed by students from the Pontificia Universidad Javieriana,
where different methods were compared to estimate tension on straps supported on acceleration
records taken from Dos Quebradas Bridge (application of empirical
method and an analytical method).
2009 Li-Wang et al 2009
Cable tension measurement for cable-stayed bridge considering the
effect of Damper
Implementation of damping effects on an analytical model to identify
natural frequencies on cables.
2005 Ren et al 2005 Empirical formulas to estimate cable tension by cable fundamental
frequency
Identification of tension on straps based on expressions derived from adjusted cables theory by means of laboratory procedures, which
consider effects such as Catenary, flexure stiffness and cable geometry.
2003 Ren et al 2003 Experimental modal analysis of stayed cables in cable stayed
bridges
A detailed analysis is developed on the cable behavior and its
mathematical modeling in order to carry out a modal cable analysis.
2010 Thai et al 2010 Nonlinear static and dynamic analysis of cable structures
Development of a tridimensional curve finite element for the analysis
of a cable mechanical behavior which is subject to its own weight
and/or external tension for its later application and verification.
1997 Karoumi 1997 Some modeling aspects in the nonlinear finite element analysis of
cable supported bridges
Development of a finite element kind of two-dimensional Catenary having only two nodes, based on the direct
formulation of behavior for this type of element. Analysis of results
obtained from modeling, laboratory results and comparison to specialized
softwares such as SAP2000 and Ansys.
Above studies were employed for the selection and application of the finite element used by the software.
2.2 Conceptual framework 2.2.1 General theory of cables
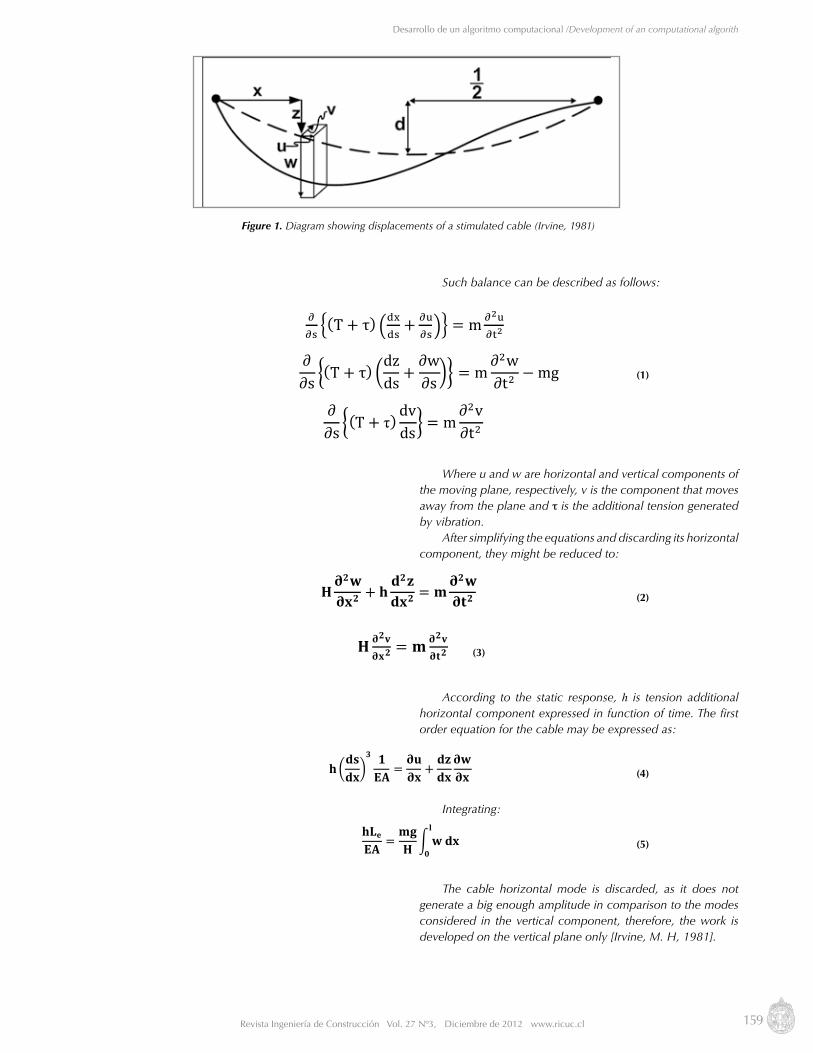
Cables are elements widely employed by civil engineering, whether for its construction application on pre-stressed elements or elements enduring tension to bear high vertical loads (such as straps in cable-stayed bridges) or because they have a very particular behavior due to their area/length relation, which suggests a thorough study on their mechanical behavior where the curvature generated by the Catenary effect is a parameter that highly conditions the element stiffness (effect produced by inducted deformation of its own weight). The second parameter is the tension a cable is subject to, which is a value inversely proportional to the deformation, resulting from its own weight. Displacements take place when a cable is slightly stimulated, as shown on Figure 1.
159Revista Ingeniería de Construcción Vol. 27 Nº3, Diciembre de 2012 www.ricuc.cl
Desarrollo de un algoritmo computacional /Development of an computational algorith
Figure 1. Diagram showing displacements of a stimulated cable (Irvine, 1981)
!!!
T+ τ !"!"+ !!
!!= m !!!
!!!
∂∂s T+ τ
dzds +
∂w∂s = m
∂!w∂t! −mg
∂∂s T+ τ
dvds = m
∂!v∂t!
(1)
𝐇𝐇𝛛𝛛𝟐𝟐𝐰𝐰𝛛𝛛𝐱𝐱𝟐𝟐 + 𝐡𝐡
𝐝𝐝𝟐𝟐𝐳𝐳𝐝𝐝𝐱𝐱𝟐𝟐 = 𝐦𝐦
𝛛𝛛𝟐𝟐𝐰𝐰𝛛𝛛𝐭𝐭𝟐𝟐 (2)
𝐇𝐇 𝛛𝛛𝟐𝟐𝐯𝐯𝛛𝛛𝐱𝐱𝟐𝟐
= 𝐦𝐦 𝛛𝛛𝟐𝟐𝐯𝐯𝛛𝛛𝐭𝐭𝟐𝟐
(3)
𝐡𝐡𝐝𝐝𝐝𝐝𝐝𝐝𝐝𝐝
𝟑𝟑 𝟏𝟏𝐄𝐄𝐄𝐄 =
𝛛𝛛𝛛𝛛𝛛𝛛𝛛𝛛 +
𝐝𝐝𝐝𝐝𝐝𝐝𝐝𝐝𝛛𝛛𝛛𝛛𝛛𝛛𝛛𝛛
𝐡𝐡𝐋𝐋𝐞𝐞𝐄𝐄𝐄𝐄 =
𝐦𝐦𝐦𝐦𝐇𝐇 𝐰𝐰 𝐝𝐝𝐝𝐝
𝐥𝐥
𝟎𝟎
(4)
(5)
Such balance can be described as follows:
Where u and w are horizontal and vertical components of the moving plane, respectively, v is the component that moves away from the plane and t is the additional tension generated by vibration.
After simplifying the equations and discarding its horizontal component, they might be reduced to:
According to the static response, h is tension additional horizontal component expressed in function of time. The first order equation for the cable may be expressed as:
Integrating:
The cable horizontal mode is discarded, as it does not generate a big enough amplitude in comparison to the modes considered in the vertical component, therefore, the work is developed on the vertical plane only [Irvine, M. H, 1981].
160 Revista Ingeniería de Construcción Vol. 27 Nº3, Diciembre de 2012 www.ricuc.cl
Giordano Avellaneda, Ricardo Noguera, Edgar Muñoz
𝐇𝐇𝐝𝐝𝟐𝟐𝐯𝐯𝐝𝐝𝐱𝐱𝟐𝟐 +𝐦𝐦𝛚𝛚
𝟐𝟐𝐯𝐯 = 𝟎𝟎 (6)
𝛚𝛚𝐧𝐧 =𝐧𝐧𝐧𝐧𝐥𝐥
𝐇𝐇𝐦𝐦
𝟏𝟏/𝟐𝟐
(7)
𝐓𝐓 = 𝟒𝟒𝟒𝟒𝐋𝐋𝟐𝟐𝐟𝐟𝐧𝐧𝐧𝐧
𝟐𝟐
(8)
𝐟𝐟𝐧𝐧𝐧𝐧
𝟐𝟐
=𝟏𝟏
𝟒𝟒𝟒𝟒𝐋𝐋𝟐𝟐 𝐓𝐓+𝐧𝐧𝟐𝟐𝛑𝛑𝟐𝟐
𝟒𝟒𝟒𝟒𝐋𝐋𝟐𝟐 𝐄𝐄𝐄𝐄 (9)
Movements out of the plane Vibration modes will be initially considered due to their
analysis simplicity. Writing v(x,t)= (x)eiw where w is the vibration angular frequency. Equation 3 can be simplified as s follows (Irvine, 1981):
Taking as initial condition that (0) = (l) = 0, thus determining that natural frequencies and associated modes are:
If the Catenary effect and flexure stiffness are taken into account, vibration methods can be classified into four cathegories. The first category does not consider catenary effect or flexure stiffness either, so the following equation can be established.
Where:T is cable tensionm is cable massL is cable length fn denotes natural frequency n
This formula is valid for a thin and long cable.The second category is referred to the cables modern
theory. When cable flexure stiffness is considered, the following equation shall be employed:
Where EI represents cable flexure stiffness
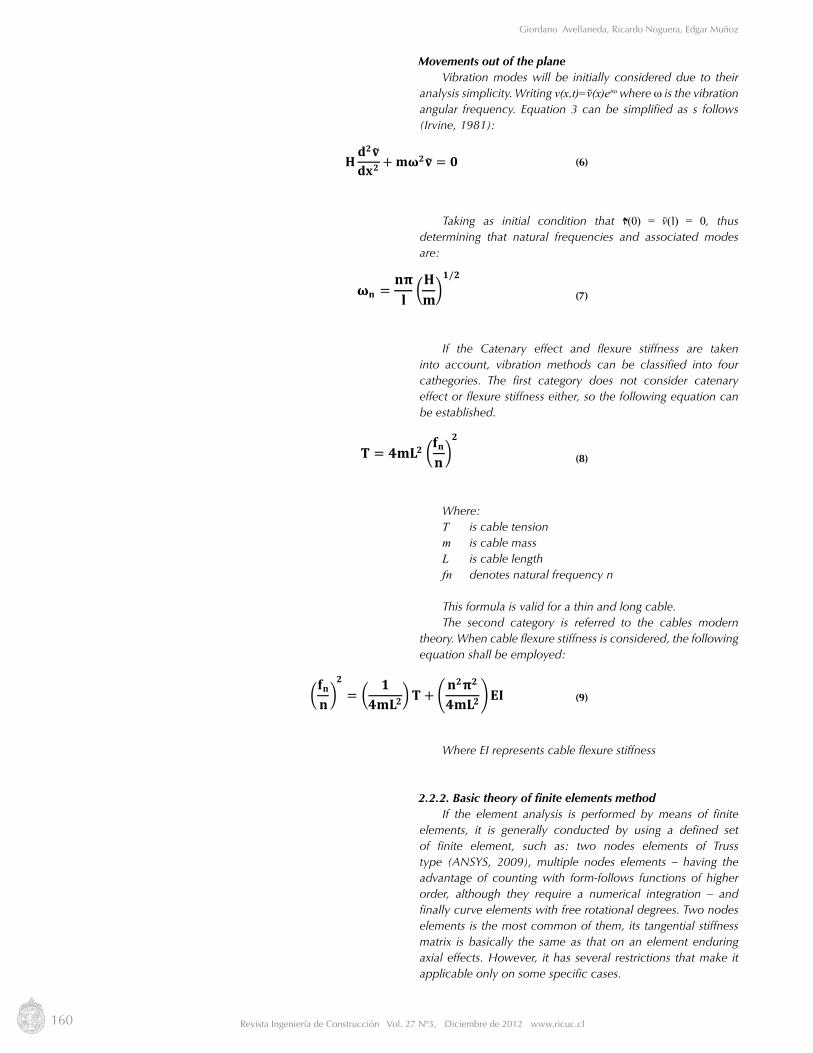
2.2.2. Basic theory of finite elements methodIf the element analysis is performed by means of finite
elements, it is generally conducted by using a defined set of finite element, such as: two nodes elements of Truss type (ANSYS, 2009), multiple nodes elements – having the advantage of counting with form-follows functions of higher order, although they require a numerical integration – and finally curve elements with free rotational degrees. Two nodes elements is the most common of them, its tangential stiffness matrix is basically the same as that on an element enduring axial effects. However, it has several restrictions that make it applicable only on some specific cases.
161Revista Ingeniería de Construcción Vol. 27 Nº3, Diciembre de 2012 www.ricuc.cl
Desarrollo de un algoritmo computacional /Development of an computational algorith
𝐊𝐊𝐊𝐊𝐊𝐊𝐊𝐊𝐊𝐊𝐊𝐊𝐊𝐊𝐊𝐊𝐊𝐊𝐊𝐊𝐊𝐊 =𝐀𝐀 ∗ Ê𝐋𝐋 ∗
𝟏𝟏 𝟎𝟎 −𝟏𝟏 𝟎𝟎 𝟎𝟎 𝟎𝟎 𝟎𝟎 𝟎𝟎−𝟏𝟏 𝟎𝟎 𝟏𝟏 𝟎𝟎 𝟎𝟎 𝟎𝟎 𝟎𝟎 𝟎𝟎
(10)
Ê = 𝐄𝐄 𝟏𝟏
𝟏𝟏+ 𝟏𝟏𝟏𝟏𝟏𝟏 ∗
𝛄𝛄𝛄𝛄𝐓𝐓𝟐𝟐
𝟐𝟐∗ 𝐄𝐄𝐄𝐄𝐄𝐄
(11)
𝐠𝐠𝐠𝐠𝐠𝐠𝐠𝐠é𝐭𝐭𝐭𝐭𝐭𝐭𝐭𝐭𝐭𝐭 =𝐓𝐓𝐋𝐋 ∗
𝟎𝟎 𝟎𝟎 𝟎𝟎 𝟎𝟎𝟎𝟎 𝟏𝟏 𝟎𝟎 −𝟏𝟏𝟎𝟎 𝟎𝟎 𝟎𝟎 𝟎𝟎𝟎𝟎 −𝟏𝟏 𝟎𝟎 𝟏𝟏
(12)
Among considerations we find that the cable to be modeled shall not have a too long length and it shall be highly pre-tensioned; for a correct modeling, a modulus effective axial stiffness must be calculated (in order to consider catenary effect). The tangential stiffness matrix of a catenary-type element is shown as follows:
Where “Ê” value is the equivalent elasticity modulus (considering catenary effect), which can be calculated by means of expression (Dischinger´s formula):
Where:g is the weight per cable length unit l is the horizontal projection of the cableT is the inner tension of the element A is y areaE is Young modulus
Replacing the use of cable horizontal projection by the weight projection on the cable local component is quite common, in order to factorize a cosine with one of two values. Beyond the tangential matrix, and additional geometric stiffness matrix and tension function are required:
This matrix provides stability for the element calculation. However, in addition to this information, it is necessary to employ interpolation - form follows functions equations and other expressions to describe catenary geometry. If calculation is performed using a non deformed condition, results will not be appropriated – for a modal analysis, this method may allow the appearance of imaginary Eigen-values as the result of the accuracy degree employed for calculating the element geometry.
The multimodal element is a more solid version of two-node element, as far as accuracy and convergence are concerned. Restrictions are still similar, therefore, its applicability is still relative on cables having little deformations, and otherwise, a great number of elements would be required in order to avoid convergence errors (it would also involve longer processing time). Finally, the element with curve elements is the most effective of all. It uses a simple two-node element - not requiring inner nodes - and may be used for little deflections, as the case of cable-stayed bridges (it also implies that the element enables the analysis for short and long cables on cable-stayed bridges with the same accuracy).

162 Revista Ingeniería de Construcción Vol. 27 Nº3, Diciembre de 2012 www.ricuc.cl
Giordano Avellaneda, Ricardo Noguera, Edgar Muñoz
Figure 2. Catenary three-dimensional element (Thai y Kim, 2010)
𝐓𝐓𝐝𝐝𝐝𝐝𝐝𝐝𝐝𝐝 = −𝐅𝐅𝟏𝟏 (13)
𝐓𝐓𝐝𝐝𝐝𝐝𝐝𝐝𝐝𝐝 = −𝐅𝐅𝟐𝟐 (14)
𝐓𝐓𝐝𝐝𝐝𝐝𝐝𝐝𝐝𝐝 = −𝐅𝐅𝟑𝟑 + 𝐰𝐰𝐰𝐰 (15)
𝐓𝐓 𝐬𝐬 = F𝟏𝟏𝟐𝟐 + F𝟐𝟐𝟐𝟐 + F𝟑𝟑 −𝐰𝐰𝐰𝐰 𝟐𝟐 (16)
𝐓𝐓 = 𝐄𝐄𝐄𝐄𝐄𝐄 = 𝐄𝐄𝐄𝐄𝐝𝐝𝐝𝐝− 𝐝𝐝𝐝𝐝𝐝𝐝𝐝𝐝 = 𝐄𝐄𝐄𝐄
𝐝𝐝𝐝𝐝𝐝𝐝𝐝𝐝 − 𝟏𝟏 (17)
Curve cable element: Catenary Element (Thai and Kim, 2010) and (Karoumi, 1997)
This element is based on identical analytical expressions of elastic catenary element, among considerations we find that the cable is perfectly flexible and its own weight is distributed alongside its length. The constant value of cable transversal area is also considered, as shown on Figure 2.
Balance cable equations are the following (in lagrangian coordinates):
Where:
F1, F2 and F3 are reactions in x, y and z, respectively.w is the weigh per length unit S is string length (curve deformed length)
By statics, tension can be expresses as the addition of components reactions:
Similarly, tension can be related with unit deformation by means of Hooke´s law, based on the following expression:
Where E is Young modulus and A is the transverse area

163Revista Ingeniería de Construcción Vol. 27 Nº3, Diciembre de 2012 www.ricuc.cl
Desarrollo de un algoritmo computacional /Development of an computational algorith
𝐱𝐱 𝐬𝐬 =𝐝𝐝𝐝𝐝𝐝𝐝𝐝𝐝 𝐝𝐝𝐝𝐝 =
𝐝𝐝𝐝𝐝𝐝𝐝𝐝𝐝
𝐝𝐝𝐝𝐝𝐝𝐝𝐝𝐝 𝐝𝐝𝐝𝐝
𝐲𝐲 𝐬𝐬 =𝐝𝐝𝐝𝐝𝐝𝐝𝐝𝐝 𝐝𝐝𝐝𝐝 =
𝐝𝐝𝐝𝐝𝐝𝐝𝐝𝐝
𝐝𝐝𝐝𝐝𝐝𝐝𝐝𝐝 𝐝𝐝𝐝𝐝
𝐳𝐳 𝐬𝐬 =𝐝𝐝𝐝𝐝𝐝𝐝𝐝𝐝𝐝𝐝𝐝𝐝 =
𝐝𝐝𝐝𝐝𝐝𝐝𝐝𝐝
𝐝𝐝𝐝𝐝𝐝𝐝𝐝𝐝 𝐝𝐝𝐝𝐝
(18)
(19)
(20)
𝐥𝐥𝐱𝐱 = − 𝐅𝐅𝟏𝟏𝐋𝐋𝟎𝟎𝐄𝐄𝐄𝐄
− 𝐅𝐅𝟏𝟏𝐰𝐰𝐥𝐥𝐥𝐥 𝐅𝐅𝟏𝟏𝟐𝟐 + 𝐅𝐅𝟐𝟐𝟐𝟐 + 𝐰𝐰𝐋𝐋𝟎𝟎 − 𝐅𝐅𝟑𝟑 𝟐𝟐 +𝐰𝐰𝐋𝐋𝟎𝟎 − 𝐅𝐅𝟑𝟑 − 𝐥𝐥𝐥𝐥 F𝟏𝟏𝟐𝟐 + F𝟐𝟐𝟐𝟐 + F𝟑𝟑𝟐𝟐 − 𝐅𝐅𝟑𝟑
𝐥𝐥𝐲𝐲 = − 𝐅𝐅𝟐𝟐𝐋𝐋𝟎𝟎𝐄𝐄𝐄𝐄
− 𝐅𝐅𝟐𝟐𝐰𝐰𝐥𝐥𝐥𝐥 𝐅𝐅𝟏𝟏𝟐𝟐 + 𝐅𝐅𝟐𝟐𝟐𝟐 + 𝐰𝐰𝐋𝐋𝟎𝟎 − 𝐅𝐅𝟑𝟑 𝟐𝟐 +𝐰𝐰𝐋𝐋𝟎𝟎 − 𝐅𝐅𝟑𝟑 − 𝐥𝐥𝐥𝐥 F𝟏𝟏𝟐𝟐 + F𝟐𝟐𝟐𝟐 + F𝟑𝟑𝟐𝟐 − 𝐅𝐅𝟑𝟑
𝐥𝐥𝐳𝐳 = −𝐅𝐅𝟑𝟑𝐋𝐋𝟎𝟎𝐄𝐄𝐄𝐄 +
𝐰𝐰𝐋𝐋𝟎𝟎𝟐𝟐
𝟐𝟐𝟐𝟐𝟐𝟐+𝟏𝟏𝐰𝐰 𝐅𝐅𝟏𝟏𝟐𝟐 + 𝐅𝐅𝟐𝟐𝟐𝟐 + 𝐰𝐰𝐋𝐋𝟎𝟎 − 𝐅𝐅𝟑𝟑 𝟐𝟐 − 𝐅𝐅𝟏𝟏𝟐𝟐 + 𝐅𝐅𝟐𝟐𝟐𝟐 + 𝐅𝐅𝟑𝟑𝟐𝟐
(21)
(22)
(23)
l! = f(F! , F! , F!) l! = g(F! , F! , F!) l! = h(F! , F! , F!)
𝐝𝐝𝐝𝐝𝐱𝐱 =𝛛𝛛𝛛𝛛𝛛𝛛𝐅𝐅𝟏𝟏
𝐝𝐝𝐅𝐅𝟏𝟏 +𝛛𝛛𝛛𝛛𝛛𝛛𝐅𝐅𝟐𝟐
𝐝𝐝𝐅𝐅𝟐𝟐 +𝛛𝛛𝛛𝛛𝛛𝛛𝐅𝐅𝟑𝟑
𝐝𝐝𝐅𝐅𝟑𝟑
𝐝𝐝𝐝𝐝𝐲𝐲 =𝛛𝛛𝛛𝛛𝛛𝛛𝐅𝐅𝟏𝟏
𝐝𝐝𝐅𝐅𝟏𝟏 +𝛛𝛛𝛛𝛛𝛛𝛛𝐅𝐅𝟐𝟐
𝐝𝐝𝐅𝐅𝟐𝟐 +𝛛𝛛𝛛𝛛𝛛𝛛𝐅𝐅𝟑𝟑
𝐝𝐝𝐅𝐅𝟑𝟑
𝐝𝐝𝐝𝐝𝐳𝐳 =𝛛𝛛𝛛𝛛𝛛𝛛𝐅𝐅𝟏𝟏
𝐝𝐝𝐅𝐅𝟏𝟏 +𝛛𝛛𝛛𝛛𝛛𝛛𝐅𝐅𝟐𝟐
𝐝𝐝𝐅𝐅𝟐𝟐 +𝛛𝛛𝛛𝛛𝛛𝛛𝐅𝐅𝟑𝟑
𝐝𝐝𝐅𝐅𝟑𝟑
(24)
(25)
(26)
𝐝𝐝𝐝𝐝𝐱𝐱𝐝𝐝𝐝𝐝𝐲𝐲𝐝𝐝𝐝𝐝𝐳𝐳
=𝐟𝐟𝟏𝟏𝟏𝟏 𝐟𝐟𝟏𝟏𝟏𝟏 𝐟𝐟𝟏𝟏𝟏𝟏𝐟𝐟𝟐𝟐𝟐𝟐 𝐟𝐟𝟐𝟐𝟐𝟐 𝐟𝐟𝟐𝟐𝟐𝟐𝐟𝐟𝟑𝟑𝟑𝟑 𝐟𝐟𝟑𝟑𝟑𝟑 𝐟𝐟𝟑𝟑𝟑𝟑
𝐝𝐝𝐝𝐝𝟏𝟏𝐝𝐝𝐝𝐝𝟐𝟐𝐝𝐝𝐝𝐝𝟑𝟑
= 𝐅𝐅𝐝𝐝𝐝𝐝𝟏𝟏𝐝𝐝𝐝𝐝𝟐𝟐𝐝𝐝𝐝𝐝𝟑𝟑
(27)
Relations between lagrangian and Cartesian coordinates are the following:
They present the following boundary conditions: x(0) = y(0) = z(0) = 0, x(L0) = lx, y(L0) = ly, z(L0) = lz. From above expressions, it is possible to formulate cable projected lengths on the three axes, as follows:
(25)
So that lx, ly and lz are respectively in function of F1, F2 and F3
Then the stiffness matrix and the matrixes corresponding to the element inner forces may be obtained from an iterative process of above functions; by deriving both sides of these expressions, the following equations are achieved:
They can be equally expressed in a matrix form:

164 Revista Ingeniería de Construcción Vol. 27 Nº3, Diciembre de 2012 www.ricuc.cl
Giordano Avellaneda, Ricardo Noguera, Edgar Muñoz
𝐟𝐟𝟏𝟏𝟏𝟏 = −𝐋𝐋𝟎𝟎𝐄𝐄𝐄𝐄+
𝟏𝟏𝐰𝐰 𝐥𝐥𝐥𝐥
𝐓𝐓𝐣𝐣 + 𝐅𝐅𝟔𝟔𝐓𝐓𝐢𝐢 − 𝐅𝐅𝟑𝟑
+𝐅𝐅𝟏𝟏𝟐𝟐
𝐰𝐰𝟏𝟏
𝐓𝐓𝐢𝐢 𝐓𝐓𝐢𝐢 − 𝐅𝐅𝟑𝟑−
𝟏𝟏𝐓𝐓𝐣𝐣 𝐓𝐓𝐣𝐣 − 𝐅𝐅𝟔𝟔
𝐟𝐟𝟏𝟏𝟏𝟏 = 𝐟𝐟𝟐𝟐𝟐𝟐 =𝐅𝐅𝟏𝟏𝐅𝐅𝟐𝟐𝐰𝐰
𝟏𝟏𝐓𝐓𝐢𝐢 𝐓𝐓𝐢𝐢 − 𝐅𝐅𝟑𝟑
−𝟏𝟏
𝐓𝐓𝐣𝐣 𝐓𝐓𝐣𝐣 − 𝐅𝐅𝟔𝟔, 𝐟𝐟𝟏𝟏𝟏𝟏 = 𝐟𝐟𝟑𝟑𝟑𝟑 =
𝐅𝐅𝟏𝟏𝐰𝐰
𝟏𝟏𝐓𝐓𝐣𝐣−𝟏𝟏𝐓𝐓𝐢𝐢
𝐟𝐟𝟐𝟐𝟐𝟐 = −𝐋𝐋𝟎𝟎𝐄𝐄𝐄𝐄+
𝟏𝟏𝐰𝐰 𝐥𝐥𝐥𝐥𝐥𝐥
𝐓𝐓𝐣𝐣 + 𝐅𝐅𝟔𝟔𝐓𝐓𝐢𝐢 − 𝐅𝐅𝟑𝟑
+𝐅𝐅𝟐𝟐𝟐𝟐
𝐰𝐰𝟏𝟏
𝐓𝐓𝐢𝐢 𝐓𝐓𝐢𝐢 − 𝐅𝐅𝟑𝟑−
𝟏𝟏𝐓𝐓𝐣𝐣 𝐓𝐓𝐣𝐣 − 𝐅𝐅𝟔𝟔
(28)
(29)
(30)
𝐟𝐟𝟐𝟐𝟐𝟐 = 𝐟𝐟𝟑𝟑𝟑𝟑 =𝐅𝐅𝟐𝟐𝐰𝐰
𝟏𝟏𝐓𝐓𝐣𝐣−𝟏𝟏𝐓𝐓𝐢𝐢
, 𝐟𝐟𝟑𝟑𝟑𝟑 =𝐋𝐋𝟎𝟎𝐄𝐄𝐄𝐄−
𝟏𝟏𝐰𝐰
𝐅𝐅𝟔𝟔𝐓𝐓𝐣𝐣+𝐅𝐅𝟑𝟑𝐓𝐓𝐢𝐢
(31)
𝐓𝐓𝐢𝐢 = 𝐅𝐅𝟏𝟏𝟐𝟐+𝐅𝐅𝟐𝟐𝟐𝟐 + 𝐅𝐅𝟑𝟑𝟐𝟐
𝐓𝐓𝐣𝐣 = 𝐅𝐅𝟒𝟒𝟐𝟐+𝐅𝐅𝟓𝟓𝟐𝟐 + 𝐅𝐅𝟔𝟔𝟐𝟐
(32)
(33)
𝐅𝐅𝟒𝟒 = −𝐅𝐅𝟏𝟏
𝐅𝐅𝟓𝟓 = −𝐅𝐅𝟐𝟐
𝐅𝐅𝟔𝟔 = −𝐰𝐰𝐰𝐰𝟎𝟎
(34)
(35)
(36)
(37)
(38)
𝐊𝐊 = 𝐅𝐅!𝟏𝟏 =𝐟𝐟𝟏𝟏𝟏𝟏 𝐟𝐟𝟏𝟏𝟏𝟏 𝐟𝐟𝟏𝟏𝟏𝟏𝐟𝐟𝟐𝟐𝟐𝟐 𝐟𝐟𝟐𝟐𝟐𝟐 𝐟𝐟𝟐𝟐𝟐𝟐𝐟𝐟𝟑𝟑𝟑𝟑 𝐟𝐟𝟑𝟑𝟑𝟑 𝐟𝐟𝟑𝟑𝟑𝟑
!𝟏𝟏
𝐊𝐊𝐓𝐓 = −𝐊𝐊 𝐊𝐊𝐊𝐊 −𝐊𝐊
𝐒𝐒 = 𝐥𝐥𝐳𝐳𝟐𝟐 + 𝐥𝐥𝐱𝐱𝟐𝟐 + 𝐥𝐥𝐲𝐲𝟐𝟐𝐬𝐬𝐬𝐬𝐬𝐬𝐬𝐬𝟐𝟐 𝛌𝛌𝛌𝛌𝟐𝟐 (39)
Where f is the flexibility matrix, which components are:
Ti and Tj are tensions at the beginning and at the end of the element that can be calculated as:
Similarly, F4, F5 and F6 can be calculated as:
Therefore, stiffness matrix comes from the result of inversely calculating the matrix f:
Finally, the element tangential stiffness matrix would be:
Once values are achieved, it is now possible to calculate the element geometry as well as its initial length and deformed length:

165Revista Ingeniería de Construcción Vol. 27 Nº3, Diciembre de 2012 www.ricuc.cl
Desarrollo de un algoritmo computacional /Development of an computational algorith
Deformed length, where l is calculated as:
Deflection is calculated using the following expression (where X is normalized in function of the horizontal projection).
2.3 Development of a computer algorithm
𝛌𝛌 =𝐰𝐰𝟐𝟐 𝐥𝐥𝐱𝐱𝟐𝟐 + 𝐥𝐥𝐲𝐲𝟐𝟐 / 𝐅𝐅𝟏𝟏𝟐𝟐 + 𝐅𝐅𝟐𝟐𝟐𝟐 (40)
𝐙𝐙𝐬𝐬 = 𝛌𝛌𝛌𝛌 𝟑𝟑+ 𝟏𝟏− 𝟐𝟐𝟐𝟐 𝛌𝛌 𝐬𝐬𝐬𝐬𝐬𝐬𝛉𝛉 𝐗𝐗 𝟏𝟏− 𝐗𝐗 /𝟑𝟑 (41)
Figure 3. Flow diagram that explains the application software operation Source (Avellaneda y Noguera 2011).
Cálculo de los demás resultados del cable 15.
The input parameters are the properties and geometry of the cable, the weight and position of the accelerometer and the file to use signals from the instrumentation performed. From the cable modeling and experimental results of the signals, the calculation is performed using a multiple regression (See Figure 4).
1 Start up algorithm
2. Define properties
6. Filtering the signals
8. Generate spectrum
11. Estimate Tension
12. Modeling finite elements and modal
analysis
15. Calculation of other cable results
3. Select signals4. Define calculation options
5. Select filter type, characteristic and range of signals
7. Selection of spectrum
10. Select peaks
14. Select frequencies to be calibrated
9. Select a sufficient
number of peaks
13. Selected frequencies are similar
to those calculated by FEM
Iniciar el algoritmo 1
Definir las propiedades 2
Filtrado de la Señal 6
Generar espectro 8
Estimar Tensión 11
Modelación con elementos finitos y análisis modal 12
Seleccionar la señal 3 Definir las opciones de cálculo 4
Selección del tipo de filtro, características y rango de la señal 5
Selección del espectro 7
Seleccionar picos 10
Seleccionar frecuencias para calibrar 14
Se identificaron suficientes
picos 9
Las frecuencias escogidas son similares a las calculadas por
FEM 13

166 Revista Ingeniería de Construcción Vol. 27 Nº3, Diciembre de 2012 www.ricuc.cl
Giordano Avellaneda, Ricardo Noguera, Edgar Muñoz
Figure 4. Shows the graph that depicts tension calculated for each one of the modes. (Avellaneda and Noguera 2011)
Figure 5. Theoretical software model for a bridge scale prototype, developed by SAP200. (Avellaneda and Noguera 2011).
The determination of the spectrum is performed by the Fourier transform, MUSIC, eigen-vectors and covariance modified. These methods are ideal for a clear understanding of what should be the value of the peaks to be identified, so that the use of these spectra in conjunction with modal analysis allows the selection of correct peaks.
2.4 Design and construction of scale modelFor the design of this prototype, a model developed by
SAP200 was initially created, where potential deformation endured by the pylon subject to straps loads was estimated, by making sure it was very low, so that it would not affect boundary conditions when implementing the straps. In this way, it was concluded that the model theoretically meets the requirements because conducted measures show similar results to the expected ones, as shown on Figure 5 and Figure 6.
167Revista Ingeniería de Construcción Vol. 27 Nº3, Diciembre de 2012 www.ricuc.cl
Desarrollo de un algoritmo computacional /Development of an computational algorith
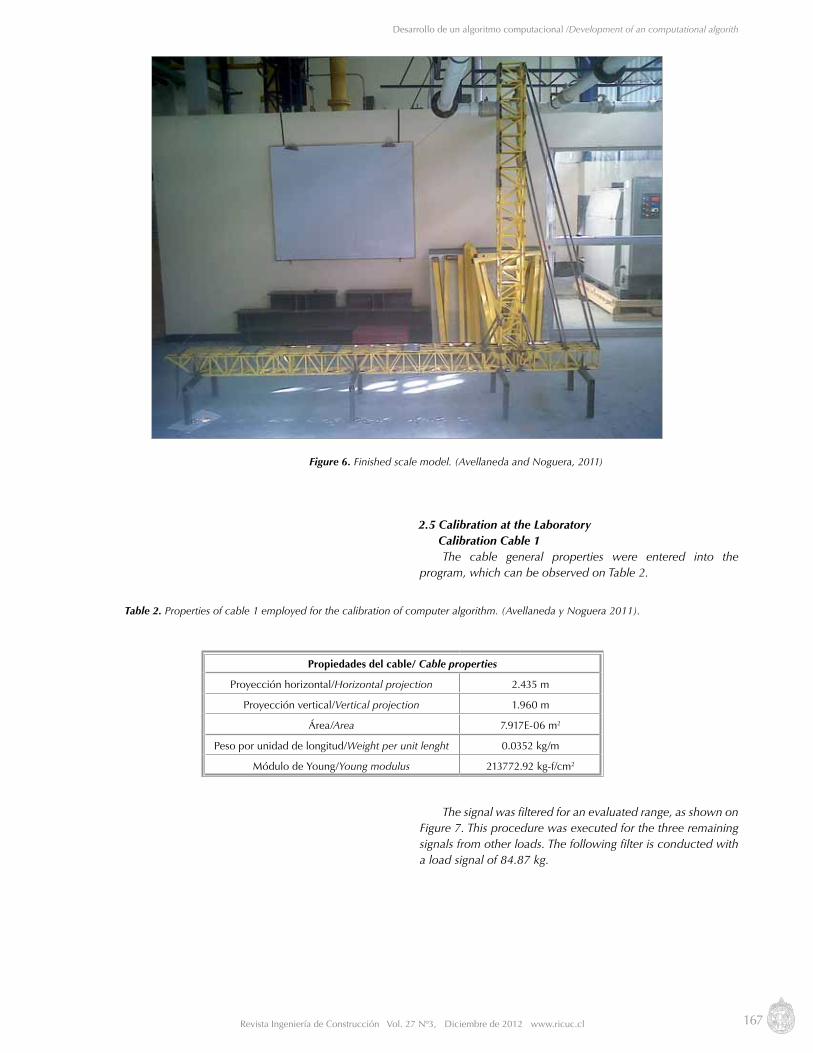
Figure 6. Finished scale model. (Avellaneda and Noguera, 2011)
Propiedades del cable/ Cable properties
Proyección horizontal/Horizontal projection 2.435 m
Proyección vertical/Vertical projection 1.960 m
Área/Area 7.917E-06 m2
Peso por unidad de longitud/Weight per unit lenght 0.0352 kg/m
Módulo de Young/Young modulus 213772.92 kg-f/cm2
Table 2. Properties of cable 1 employed for the calibration of computer algorithm. (Avellaneda y Noguera 2011).
2.5 Calibration at the Laboratory Calibration Cable 1
The cable general properties were entered into the program, which can be observed on Table 2.
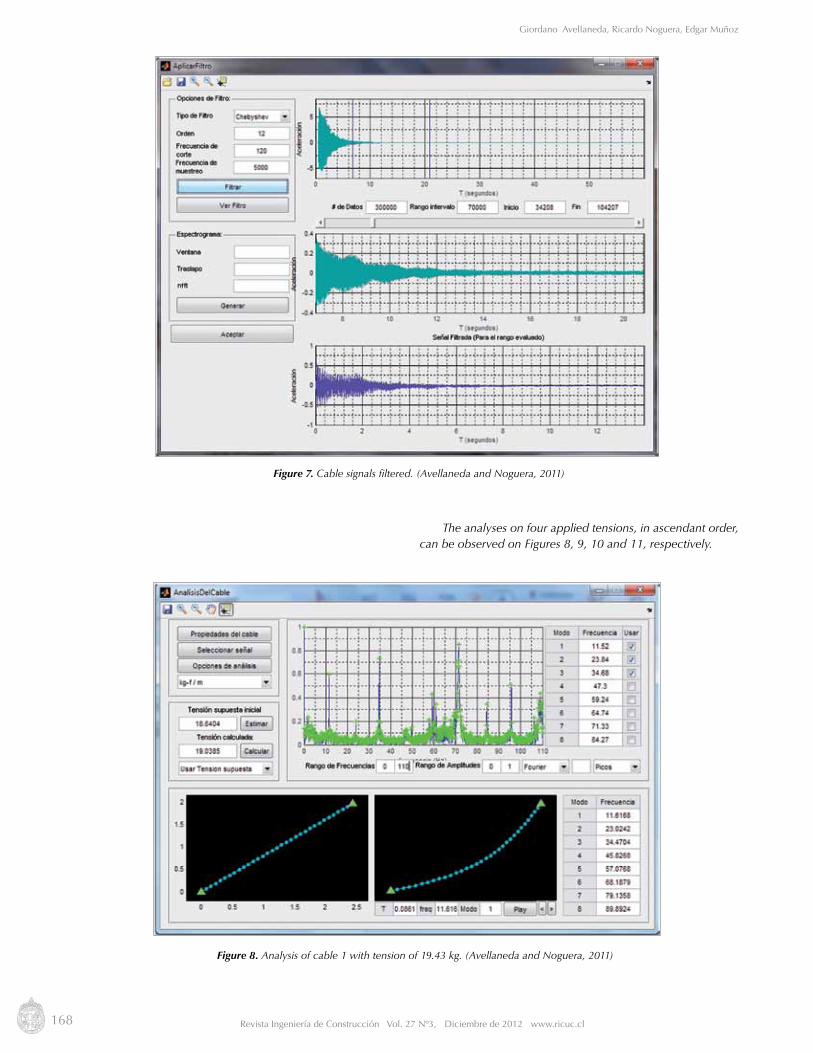
The signal was filtered for an evaluated range, as shown on Figure 7. This procedure was executed for the three remaining signals from other loads. The following filter is conducted with a load signal of 84.87 kg.
168 Revista Ingeniería de Construcción Vol. 27 Nº3, Diciembre de 2012 www.ricuc.cl
Giordano Avellaneda, Ricardo Noguera, Edgar Muñoz
Figure 7. Cable signals filtered. (Avellaneda and Noguera, 2011)
Figure 8. Analysis of cable 1 with tension of 19.43 kg. (Avellaneda and Noguera, 2011)
The analyses on four applied tensions, in ascendant order, can be observed on Figures 8, 9, 10 and 11, respectively.

169Revista Ingeniería de Construcción Vol. 27 Nº3, Diciembre de 2012 www.ricuc.cl
Desarrollo de un algoritmo computacional /Development of an computational algorith
Figure 9. Analysis of cable 1 with applied tension of 34.69 kg. (Avellaneda and Noguera, 2011)
Figure 10. Analysis of cable 1 with applied tension of 51.47 kg. (Avellaneda and Noguera, 2011)

170 Revista Ingeniería de Construcción Vol. 27 Nº3, Diciembre de 2012 www.ricuc.cl
Giordano Avellaneda, Ricardo Noguera, Edgar Muñoz
Table 3. Comparison between experimental results and the ones calculated for the cable. (Avellaneda and Noguera, 2011)
Tensión aplicada/Aplied tension Tensión calculada/Calculated tension % Error
19.4370 kg 19.0385 kg 2.05
34690 kg 34.9615 kg 1.43
51.4770 kg 50.8261 kg 1.26
84870 kg 84.6515 kg 0.98
Figure 11. Analysis of cable 1 with applied tension of 84.87 kg. (Avellaneda and Noguera, 2011)
Finally, from the analysis the comparison of real tension applied on the cable and the tension calculated by the computational calibrated algorithm can be observed on Table 3.
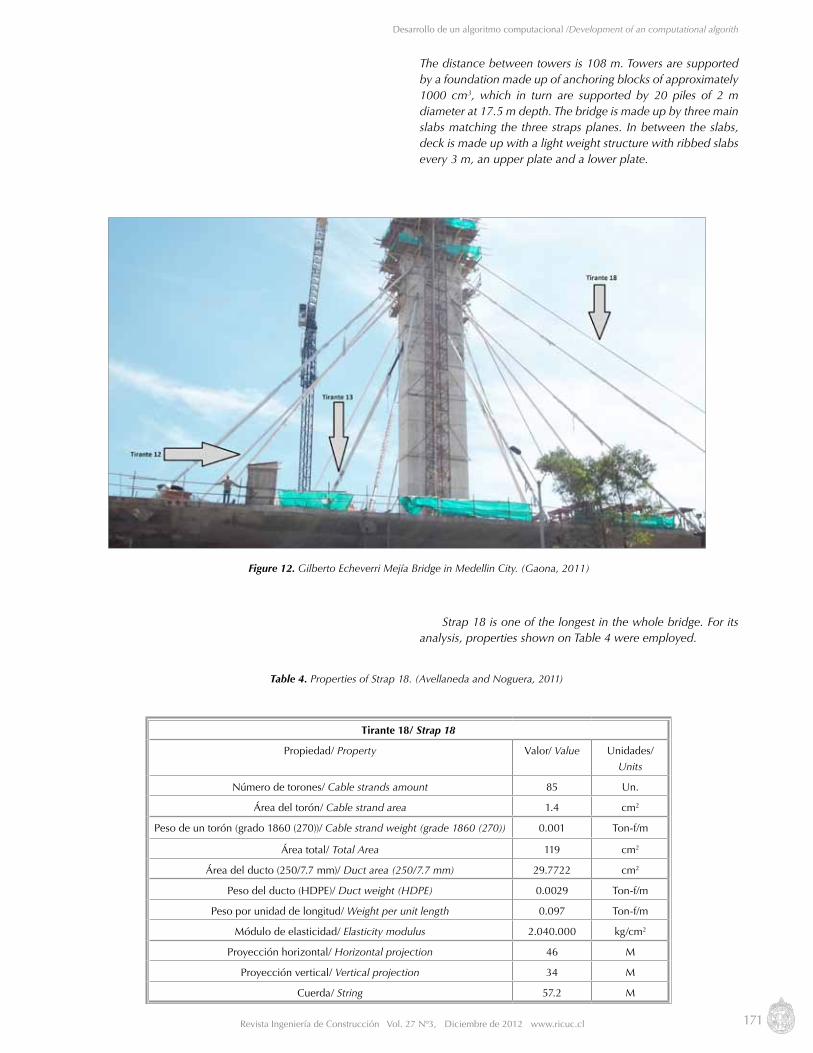
2.6 Bridge characteristicsGilberto Echeverri Mejía Bridge is located between 2nd
street, west side and the 4th street, east side. The bridge crosses Medellin River, the subway railway and Las Vegas Avenue. Its total length is 560 m, 213 m out of them correspond to a cable-stayed bridge and the remaining 347 m are distributed on successive bridges having two access viaducts. This bridge has three different straps planes coming from two pylons of 47 m height, which suspend deck – reinforced with multiple dowels – of 40.5 m width having four lanes in each direction, wide walkways and a garden separator.
The bridge has 51 straps, 18 of them on the lateral plane,
17 on the second lateral plane and 16 on the central plane.
171Revista Ingeniería de Construcción Vol. 27 Nº3, Diciembre de 2012 www.ricuc.cl
Desarrollo de un algoritmo computacional /Development of an computational algorith
Figure 12. Gilberto Echeverri Mejía Bridge in Medellin City. (Gaona, 2011)
Tirante 18/ Strap 18
Propiedad/ Property Valor/ Value Unidades/
Units
Número de torones/ Cable strands amount 85 Un.
Área del torón/ Cable strand area 1.4 cm2
Peso de un torón (grado 1860 (270))/ Cable strand weight (grade 1860 (270)) 0.001 Ton-f/m
Área total/ Total Area 119 cm2
Área del ducto (250/7.7 mm)/ Duct area (250/7.7 mm) 29.7722 cm2
Peso del ducto (HDPE)/ Duct weight (HDPE) 0.0029 Ton-f/m
Peso por unidad de longitud/ Weight per unit length 0.097 Ton-f/m
Módulo de elasticidad/ Elasticity modulus 2.040.000 kg/cm2
Proyección horizontal/ Horizontal projection 46 M
Proyección vertical/ Vertical projection 34 M
Cuerda/ String 57.2 M
Table 4. Properties of Strap 18. (Avellaneda and Noguera, 2011)
The distance between towers is 108 m. Towers are supported by a foundation made up of anchoring blocks of approximately 1000 cm3, which in turn are supported by 20 piles of 2 m diameter at 17.5 m depth. The bridge is made up by three main slabs matching the three straps planes. In between the slabs, deck is made up with a light weight structure with ribbed slabs every 3 m, an upper plate and a lower plate.
Strap 18 is one of the longest in the whole bridge. For its analysis, properties shown on Table 4 were employed.

172 Revista Ingeniería de Construcción Vol. 27 Nº3, Diciembre de 2012 www.ricuc.cl
Giordano Avellaneda, Ricardo Noguera, Edgar Muñoz
Figure 13. Monitoring of Strap 18, Re. Ciro Martinez, Eng.: VSL international. (Avellaneda and Noguera, 2011)
Figure 14. Results from tensioning strap 18 by using signals 1. (Avellaneda and Noguera, 2011)
Before analyzing tension on strap 18, VSL International released the tension analysis conducted for strap 18, which was the last re-tensioned strap, enduring 658 ton, as observed on Figure 13.
When this strap was installed, three different signals were considered, each one in two axes, so that it now has six signals. Each signal was used to conduct tension analysis which is presented below:
• Analysis using signals 1:
Monitoreo de Tirantes / VSL Straps Monitoring
Proyecto: Puente Calle 4 sur Medellín/Project: 4th south street
bridge, Medellin
Cliente: Constructora Conconcreto S.A./Client: Conconcreto Construction
Company
Tirante/Strap 18 cm Nº de cordones/String
courses number
85 String length 57.2 m
Área Cordón/String
courses area
140 mm2 Módulo Elasticidad/
Elasticity modulus
2.040.000 kg/cm2 Jack area 23.56 cm2
Chuequeo Nº/
Check #
Fecha/Date Lectura Promedio/
Average recording (Bar)
Fuerza Promedio/
Average Strength
(Ton)
Fuerza Total Tirante/Total
strap strength (Ton)
Observaciones/Remarks
1 10/14/2011 95 2.1 181 Fuerza de Instalación/
Installation strength
2 11/01/2011 190 4.4 375 Chequeo/Cross check
3 11/01/2011 329 7.7 658 Retensado/Re-tensioning

173Revista Ingeniería de Construcción Vol. 27 Nº3, Diciembre de 2012 www.ricuc.cl
Desarrollo de un algoritmo computacional /Development of an computational algorith
Figure 15. Results from tensioning strap 18 by using signals 2 with Fourier. (Avellaneda and Noguera, 2011)
Figure 16. Results from tensioning strap 18 by using signals 2 with MUSIC. (Avellaneda and Noguera, 2011)
Analysis using signals 2:
Fourier:
MUSIC:

174 Revista Ingeniería de Construcción Vol. 27 Nº3, Diciembre de 2012 www.ricuc.cl
Giordano Avellaneda, Ricardo Noguera, Edgar Muñoz
Figure 17. Results from tensioning strap 18 by using signals 2 with Eigen-Vectors. (Avellaneda and Noguera, 2011)
Figure 18. Results from tensioning strap 18 by using signals 2 with Fourier. (Avellaneda and Noguera, 2011)
Eigen-Vectors:
Modified covariance:
175Revista Ingeniería de Construcción Vol. 27 Nº3, Diciembre de 2012 www.ricuc.cl
Desarrollo de un algoritmo computacional /Development of an computational algorith
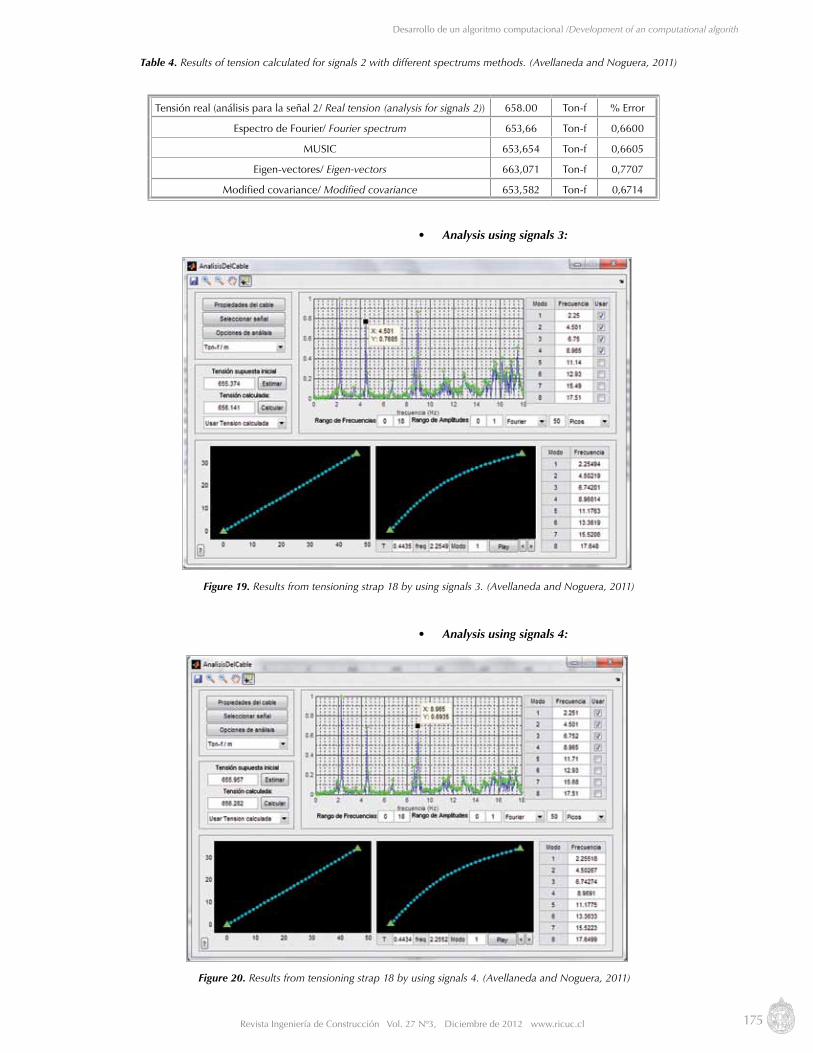
Tensión real (análisis para la señal 2/ Real tension (analysis for signals 2)) 658.00 Ton-f % Error
Espectro de Fourier/ Fourier spectrum 653,66 Ton-f 0,6600
MUSIC 653,654 Ton-f 0,6605
Eigen-vectores/ Eigen-vectors 663,071 Ton-f 0,7707
Modified covariance/ Modified covariance 653,582 Ton-f 0,6714
Table 4. Results of tension calculated for signals 2 with different spectrums methods. (Avellaneda and Noguera, 2011)
Figure 19. Results from tensioning strap 18 by using signals 3. (Avellaneda and Noguera, 2011)
Figure 20. Results from tensioning strap 18 by using signals 4. (Avellaneda and Noguera, 2011)
• Analysis using signals 3:
• Analysis using signals 4:

176 Revista Ingeniería de Construcción Vol. 27 Nº3, Diciembre de 2012 www.ricuc.cl
Giordano Avellaneda, Ricardo Noguera, Edgar Muñoz
Figure 21. Filter used for this signals. (Avellaneda and Noguera, 2011)
Figure 22. Filtering signals 5 on strap 18. (Avellaneda and Noguera, 2011)
• Analysis using signals 5:The signal was previously filtered.
Consequently, the analysis to calculate tensions was carried out:

177Revista Ingeniería de Construcción Vol. 27 Nº3, Diciembre de 2012 www.ricuc.cl
Desarrollo de un algoritmo computacional /Development of an computational algorith
Figure 23. Results from tensioning strap 18 by using the signals. (Avellaneda and Noguera, 2011)
Figure 24. Tension calculation procedure. (Avellaneda and Noguera, 2011)
In order to determine tensions, a regression process is developed:
Finally, other cable results were obtained:

178 Revista Ingeniería de Construcción Vol. 27 Nº3, Diciembre de 2012 www.ricuc.cl
Giordano Avellaneda, Ricardo Noguera, Edgar Muñoz
Figure 25. Results for the signals. (Avellaneda and Noguera, 2011)
Figure 26. Results from tensioning strap 18 by using signals 6. (Avellaneda and Noguera, 2011)
• Analysis using signals 6:
Table 6 shows all calculation results using different signalss for strap 18.

179Revista Ingeniería de Construcción Vol. 27 Nº3, Diciembre de 2012 www.ricuc.cl
Desarrollo de un algoritmo computacional /Development of an computational algorith
Tensión real/ Real tension 658.00 Ton-f % Error
Tensión calculada con la señal 1/ Tension calculated with signals 1 654.04 Ton-f 0.60
Tensión calculada con la señal 2/ Tension calculated with signals 2 653.66 Ton-f 0.66
Tensión calculada con la señal 3/ Tension calculated with signals 3 656.14 Ton-f 0.28
Tensión calculada con la señal 4/ Tension calculated with signals 4 656.28 Ton-f 0.26
Tensión calculada con la señal 5/ Tension calculated with signals 5 657.54 Ton-f 0.07
Tensión calculada con la señal 6/ Tension calculated with signals 6 656.26 Ton-f 0.26
Table 6. Tension results for different signals. (Avellaneda and Noguera, 2011)
3. Conclusions
The software application developed by MATLAB® fully meets its objective, being able to achieve tensile estimations and calculations with errors of 0.07%, although it is also possible to calculate tension without errors, if parameters involved in this process are fully known in advance.
The tool included in this software that generates cable behavior for each vibration mode, is a relevant parameter used to facilitate the selection of the most representative frequencies. The tool is able to develop a “cable modal identification” by enabling the correlation of measured frequencies with the ones corresponding to each vibration mode.
On site procedure only requires the installation of one or several accelerometers – preferably at the cable span center. By using the proper equipment, measuring even in one of the most inconvenient situations, the procedure took little longer than 30 minutes and 6 recordings were taken.
Test results from scale model demonstrated that predominant frequencies on the measured cable use to be the ones generating movements, which are perpendicular to the cable direction and they take place on the cable plane.
Analyzed lateral modes yielded values quite similar to their preceding modes, therefore, considering a three dimensions cable analysis was useless because each frequency will basically be repeated by itself.
The model also enabled us to conclude that the first set of frequencies was more representative for the cable analysis, because higher frequencies used to be more dispersing between one take and another. Then the use of this set for tension calculation was disregarded. Consequently, the first eight frequencies that easily appeared and showed less variation were employed.
The utilization of different methods to generate spectrums enabled a more objective identification of vibrations for the analyzed cable, therefore, peaks identification became more accurate and consequently the obtained results are more reliable.

180 Revista Ingeniería de Construcción Vol. 27 Nº3, Diciembre de 2012 www.ricuc.cl
Giordano Avellaneda, Ricardo Noguera, Edgar Muñoz
1. ReferenciasA. I. (octubre 2009), ANSYS Inc. Recuperado el 03 de diciembre de 2011, de Release 11.0 Documentation for ANSYS: http://www.kxcad.
net/ansys/ANSYS/ansyshelp/thy_el8.htmlAvellaneda G., y Noguera R. (2011), “Desarrollo de un algoritmo computacional para la estimación de la tensión de cables en puentes
atirantados con base en la medición experimental en laboratorio y campo de sus modos y frecuencias naturales de vibración”. Tesis de Grado de la Pontificia Universidad Javeriana. Director : Edgar Eduardo Muñoz Diaz. Bogotá. Colombia.
Badel R. J., y Bohórquez R. A. (2009), Estudio e implementación de los métodos para la estimación de la fuerza de tensión en tirantes de puentes usando sus modos y frecuencias naturales de vibración.Tesis de Grado de la Pontificia Universidad Javeriana. Director : Edgar Eduardo Muñoz Diaz. Bogotá. Colombia
Gaona W. (2011), Puente Gilberto Echeverri Mejía. Medellín, Antioquia: Asocreto. Hajdin N., Michaltsos G. T., y Konstantakopoulos T. G. (1998), “About the equivalent modulus of elasticity of cables of cable-stayed
bridges”. Facta Universitatis, 569-57Irvine M. H. (1981), Cable structures. Boston, Massachusetts, United States of America: The Massachusetts Institute of Technology.Kangas S., Helmicki A., Hunt V., Sexton R., y Swanson J. (2010), “Identification of cable forces on cable-stayed bridges: A novel
application of the MUSIC algorithm”. Experimental Mechanics, 957-968.Karoumi R. (1997), “Some modeling aspects in the nonlinear finite element analysis of cable supported bridges”. Computers and Structures,
397-412.Li F., Wang D., Ou Y., Zhang L., y Yang Z. (2009), “Cable tension measurement for cable-stayed bridge considering on the effect of
Damper”. International Conference on Mechatronics and AutomationNanjing S. C. (2008), Software Co., Ltd. Nanjing Jianpu. Recuperado el 29 de septiembre de 2011, de Jiangsu Sutong Bridge Co. Ltd.: http://
www.stbridge.com.cn/index.aspxRen W. X. y Chen G. (s. f.). Experimental modal analysis of stayed cables in cable stayed bridges. China: Fuzhou University, 1-6.Ren W. X., Chen G. y Hu W. H. (2005), “Empirical formulas to estimate cable tension by cable fundamental frequency”. Structural
Engineering and Mechanics, 20, 3, 363-380.Thai H. T. y Kim S. E. (2010), “Nonlinear static and dynamic analysis of cable structures”. Finite Elements in Analysis and Design, 237-246.
The most sensitive variation among input parameters is the mass (“weight” in the software, which is responsible of conducting the corresponding operation to calculate mass). It is inversely proportional to frequency and its impact on tension estimation and calculation is so relevant that a slight change may lead to easily modify the variation within an error range from 0.5% to 5%.
Due to the easy nature of this procedure set (instrumentation, analysis, calculation by means of the software) it becomes a quick and effective tool to conduct supervisions on a cable-stayed bridge type, although in general it is applicable to any kind of cable subject to tension and to its own weight.
The method reliability together with its versatility makes it an appropriate tool for construction compliance supervision and routine structure cross checking. Similarly this tool would be very practical at the moment of evaluating conditions on a previously constructed bridge (either for restoration or enlargement purposes).
Thanks to the reliability of this developed method, the utilization of a strand jack is no longer required to control strands and check that they meet international standards. In extreme cases, the method can be used to develop re-design processes on those existing strands.
4. Acknowledgements
Thanks to Conconcreto S.A. and VSL Colombia for their great logistic support and for granting authorizations to develop job site measurements for this research job. Special thanks to Ciro Martinez, Eng., VSL Colombia.