Embed Size (px)
Citation preview
523
Application of quaternion algorithms for multicomponent dataanalysis: a review
A. MAZZOTTI1, A. SAJEVA1, G.M. MENANNO2, A. GRANDI3 and E. STUCCHI4
1 Earth Sciences Department, University of Pisa, Italy 2 Earth Sciences Department, Dhahran, Saudi Arabia 3 TOTAL, Milan, Italy4 Earth Sciences Department, University of Milan, Italy
(Received: April 1, 2011; accepted: March 16, 2012)
ABSTRACT In this paper we illustrate the applications of three algorithms of multicomponentseismic data processing, velocity analysis, deconvolution, and seismic wavefieldseparation, that we implemented by means of quaternion algebra. After a briefintroduction on quaternions and a review of these methods, we focus our descriptionon the applications to actual multicomponent seismic data sets. Quaternion velocityanalysis results in an improved resolution and distinction of the velocity trendsassociated with the various wave phases, while the extension of the classical Wienerdeconvolution demonstrates the better performance of the quaternion filter on themulticomponent traces compared to the scalar filters. Wavefield separation by meansof quaternion SVD makes it possible to discern body waves from surface waves basedon their different polarization characteristics and eventually leads to their effectiveseparation.
Key words: seismic data processing, velocity analysis, deconvolution, seismic wavefield separation.
1. Introduction
With the advent of multicomponent seismology the volume of data to be processed increases,thus causing a proportional increase in the effort needed to perform the different processing steps.Even if multicomponent data carry a vectorial information, they are often processed componentwise, i.e., each component per time. We propose, instead, a multicomponent approach whichconsiders the vectorial nature of the wavefield, by introducing a quaternion algebra analysis.
Quaternions constitute an extension of the complex numbers to the hypercomplex domain.They were first introduced by Hamilton (1844) and they have an important role in physics, inwhich hypercomplex algebra is used for fundamental formulations of quantum mechanics (Adler,1995). In the applied sciences, quaternions are used to compactly represent spatial rotations and,for this reason, they find application in computer graphics, robotics, control theory and aerospaceproblems.
In the field of signal processing, there are several quaternion applications: in imageprocessing, pure quaternions are used to describe the colour components of RGB images(Sangwine, 1996). Furthermore, quaternion algebra is used to determine the direction of arrival(DOA) of polarized waves recorded by a vector-sensor array (Miron et al., 2006); in seismology,
Bollettino di Geofisica Teorica ed Applicata Vol. 53, n. 4, pp. 523-537; December 2012
DOI 10.4330/bgta0060
© 2012 – OGS
524
Boll. Geof. Teor. Appl., 53, 523-537 Mazzotti et al.
due to its capability to compactly describe a multicomponent acquisition, quaternion algebra isemployed to derive a sub-space method for the wavefield separation over a 3C vector-sensor array(Le Bihan and Mars, 2004).
In this paper we focus on the applications of hypercomplex algebra to exploration seismology,where quaternions can be used to concisely handle multicomponent data. In particular, we makea synthesis of the application results shown in Grandi et al. (2007), Sajeva et al. (2011), Menannoand Mazzotti (2012) for multicomponent (MC) velocity analysis, MC deconvolution and MCwavefields separation respectively. Theoretical developments and demostrations, which can befound in such papers, are not discussed here.
2. Brief introduction to quaternions
Quaternions are hypercomplex numbers, i.e., numbers with three imaginary components.They can be written as:
(1)
where a, b, c, d are real numbers, and i, j, and k are imaginary units. The imaginary units satisfythe multiplication rules:
(2)
It follows that quaternion multiplication is not commutative. The hypercomplex conjugate andthe quaternion norm can be defined analogously to the complex domain:
(3)
(4)
More exhaustive description of the mathematical properties of quaternions can be found inSudbery (1979) and Zhang (1997).
Quaternions can be conveniently used in seismic multicomponent data analysis, in fact, dueto their hypercomplex formulation, they are especially apt to represent up to four datacomponents. An example of four component acquisition is a 4C-OBC (4 Component OceanBottom Cable) survey, in which each receiver station is constituted by a hydrophone and a triaxialgeophone, placed on the sea floor. In a quaternion representation, the hydrophone recording is
q qq qq a b c d= = = + + +2 2 2 2
q a ib jc kd= − − −
j ji k
jk kj i
ki ik j
ii jj kk
= − == − =
= − == = − 1
q a ib jc kd= + + +
525
Application of quaternion algorithms for multicomponent data analysis: a review Boll. Geof. Teor. Appl., 53, 523-537
associated with the real part of the quaternion, while the geophone recordings with the imaginaryparts. 3C land acquisitions can be represented as well by means of quaternions, simply neglectingthe real part of the quaternion signal, i.e., by putting a=0 in Eq. (1).
As an example, let us consider a shot gather. If we denote pi(t) the time series representing thepressure recorded on the i-th hydrophone and xi(t), yi(t), and zi(t) respectively the three time seriesrepresenting the x, y, and z components of the signal on the i-th geophone, then we can define aquaternion time series, such as:
(5)
Similarly we can define a pure quaternion time series:
(6)
in case that the hydrophone recording is not of interest or not available.The set of quaternion time series for each recording station constitutes a quaternion matrix
which represents the entire input dataset.
3. Application to real data
We focus on the applications of quaternion analysis to exploration seismology, where many ofthe processing steps can be extended to quaternions in order to concisely handle multicomponentdata. In the following, three examples are explained in some details.
4. Quaternion velocity analysis
Grandi et al. (2004, 2005) proposed a method for velocity analysis applicable to 2C data: theyadded in quadrature vertical and horizontal components, and they computed complex coherencyfunctionals along given traveltime curves on the data trace gathers. These functionals are basedon the decomposition into eigenstructures of the spatial covariance matrix (Key and Smithson,1990), and on the approximate a priori knowledge of the propagating wavelet (Spagnolini et al.,1993; Grion et al., 1998). By means of this procedure velocity trends related to different wavetypes in a single velocity panel can be built.
However, this approach considers only two displacement components and discards theinformation that the hydrophone can bring in, when dealing with ocean bottom cable (OBC) data.To overcome this limitation, Grandi et al. (2007) proposed the introduction of quaternion algebrain the velocity analysis phase. In this paper, we investigate the quaternion implementation of oneof the simplest coherency functionals, namely the semblance (Neidell and Taner, 1971), appliedto the triaxial recording of a 2D multicomponent OBC acquisition. The data are at an early stepof processing, with few operations applied, such as first-break muting, band-pass filtering andnotch filtering. No attempts to match the frequency content of the various components have beentried and only a simple automatic amplitude gain has been applied to the data. Torsional modesand mud rolls have been partly attenuated by the notch filter.
q t ix t jy t kz ti i i j( ) = ( ) + ( ) + ( )
q t p t ix t jy t kz ti i i i i( ) = ( ) + ( ) + ( ) + ( )
526
Boll. Geof. Teor. Appl., 53, 523-537 Mazzotti et al.
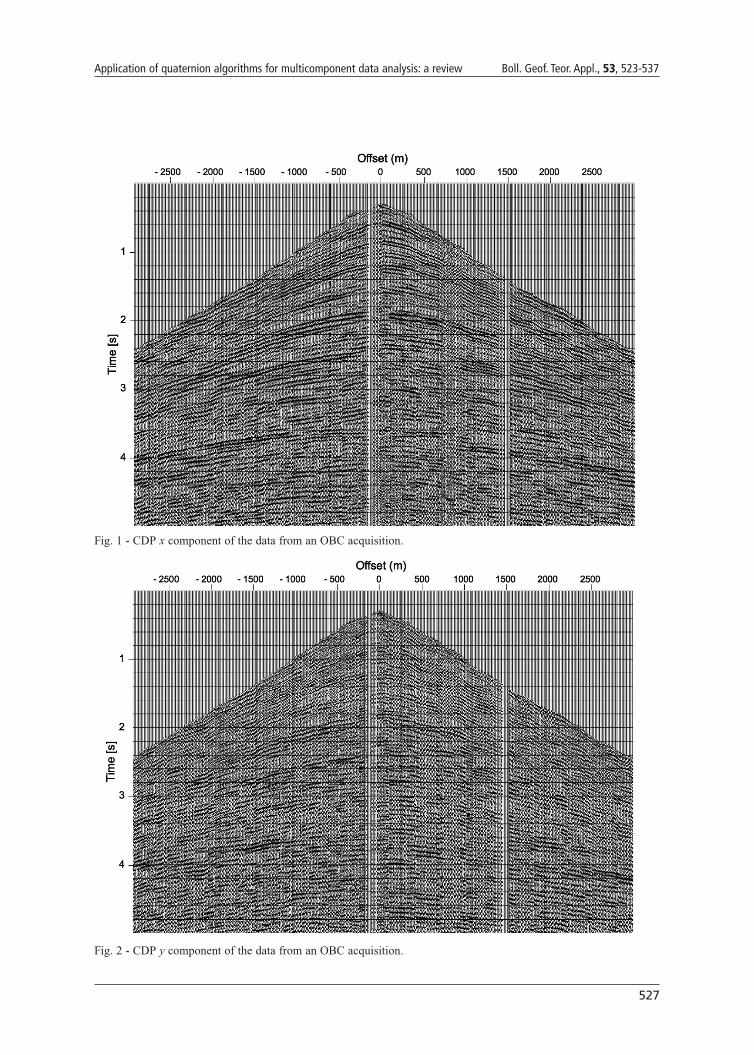
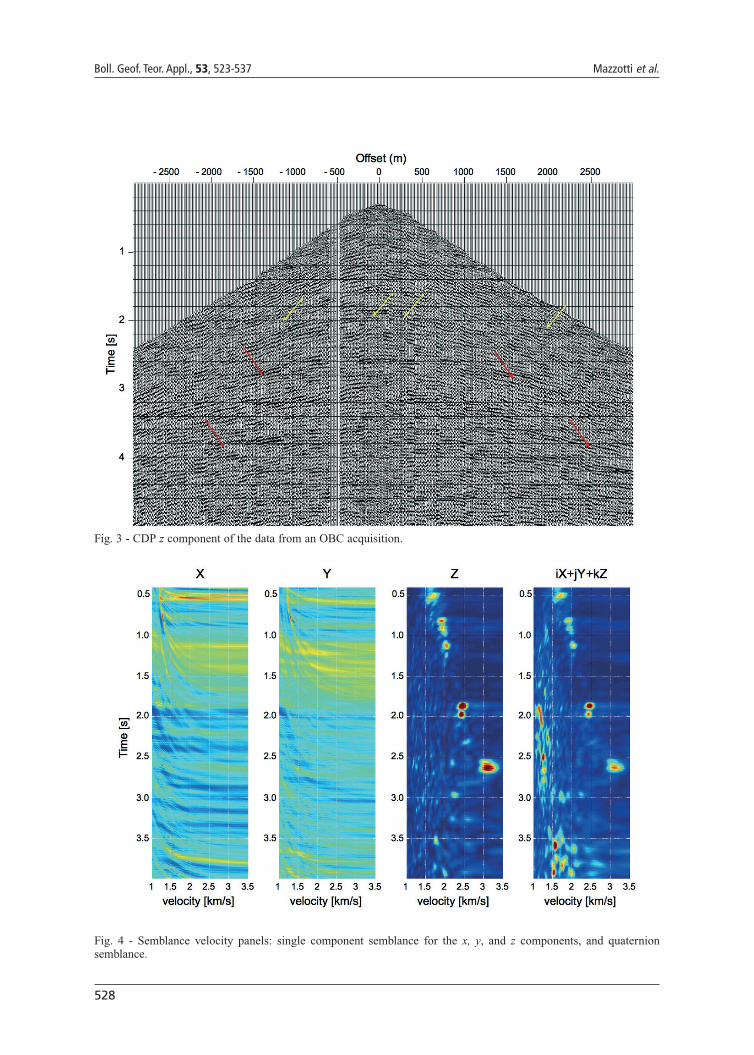
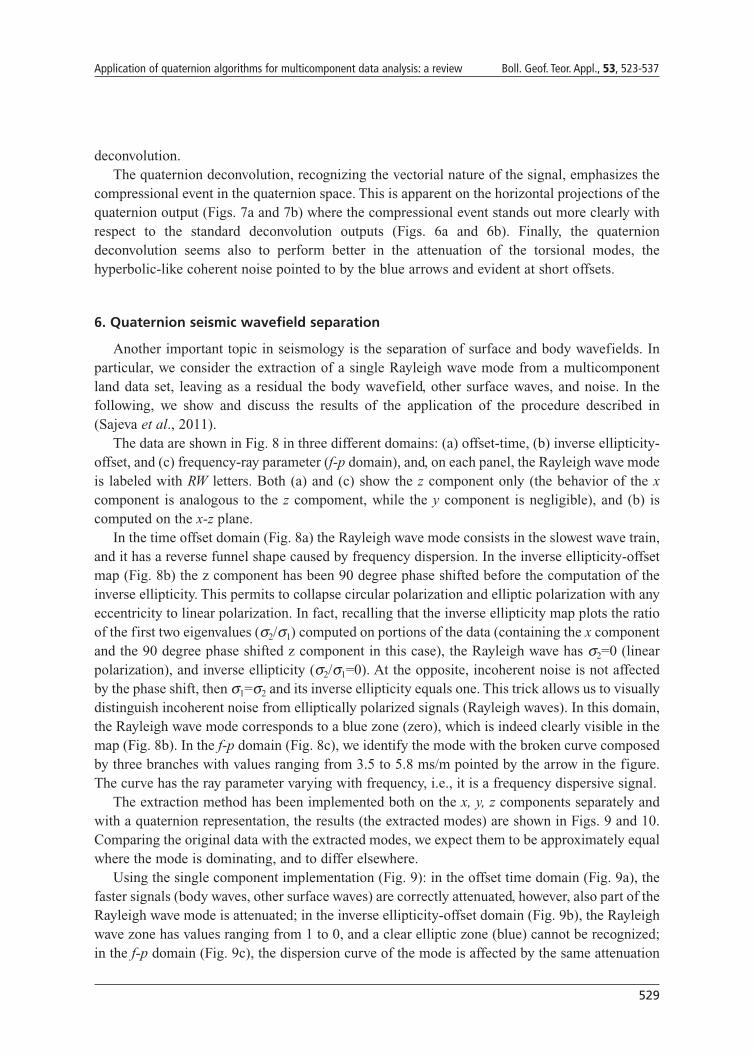
Figs. 1, 2, and 3 show respectively the x, y, and z components of the CDP used for the velocityanalysis. Note that the data quality is rather different among the three components: events on thex gather are more continuous than on the other gathers. Random and coherent noise contaminateall components and shear energy is dominant in geophone recordings. In the z gather (Fig. 3), itis possible to identify some P-wave reflections, such as the event at 1.85 s annotated with yellowarrows, and traces of C-wave reflections, indicated by red arrows. Differently, both x and ygathers (Figs. 1 and 2) are strongly affected by shear energy, which hides possible P reflections.
Fig. 4 shows the results of both single component and quaternion velocity analysis. Theanalysis carried out separately on each component produces unfocused results and evidencessingle velocity trends, that is, converted wave trends on x and y gathers and P-wave trend on zgather. The quaternion analysis, instead, simultaneously gives the velocity trends of the variouswave phases and produces a better focused velocity panel.
5. Quaternion deconvolution
Few attempts at vectorial multicomponent deconvolution exist. For instance, the design ofmultichannel deconvolution (Treitel, 1970) can be extended to the multicomponent case, asindicated by Claerbout (1985); in this approach, the multichannel filtering operation isrepresented as a linear system. A similar solution consists in concatenating each component timeseries into a long vector and then to process the resulting record as a single component. Andersonand Nehorai (1996), and Menanno and Le Bihan (2010) applied this procedure to vector-sensoracquisitions.
A quaternion formulation of deconvolution has been proposed for the first time by Menannoand Mazzotti (2012). They compare scalar and quaternion deconvolution in synthetic and realdata examples, and they show that quaternion deconvolution provides a better wavelet estimationand thus an improved deconvolution performance.
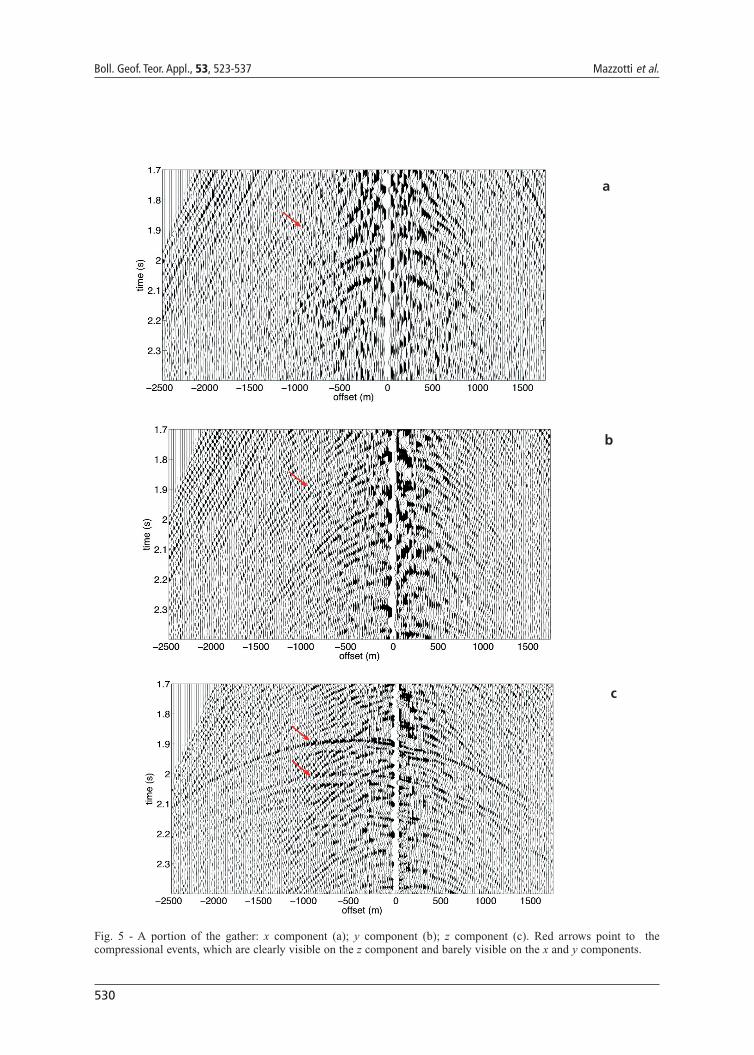
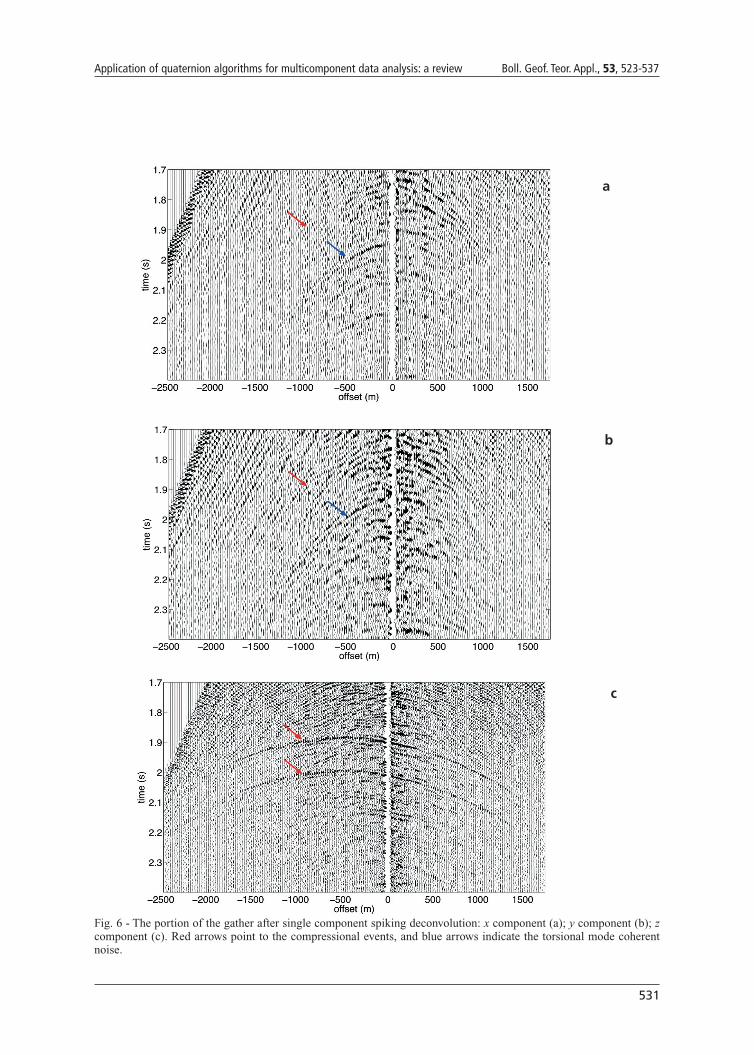
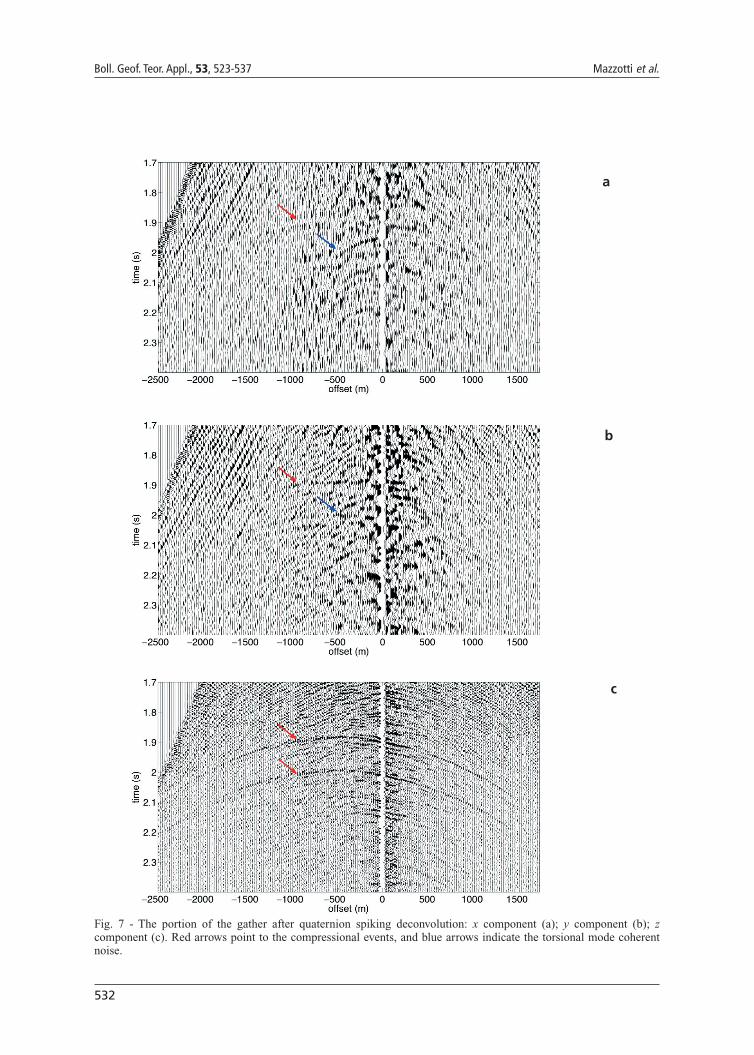
In this paper, we consider the application of quaternion spiking deconvolution to a realcommon receiver gather pertaining to an OBC multicomponent acquisition. A portion of themulti-component gather before the application of spiking deconvolution is shown in Fig. 5; thex, y, and z components are shown respectively in the (a), (b), and (c) panels. The data haveundergone a limited pre-processing that consists of 3-C amplitude balancing, first-break mutingand band-pass filtering to attenuate the torsional modes that affect all the recordings.
In the frame of the z component (Fig. 5c), a compressional event is clearly visible atapproximately 1.9 s, and it is marked with a red arrow; its pegleg, which is pointed to by a secondred arrow, follows with a delay of ≈ 0.15 s. Note that these events are also visible with loweramplitudes on the horizontal components. Furthermore a residual coherent noise, due to torsionalmodes, affects all the gathers, particularly at near offset. On the horizontal gathers this noise isstronger than the compressional event, while it is weaker on the vertical one.
The results of scalar and quaternion deconvolutions are shown in Figs. 6a, 6b, and 6c and Figs.7a, 7b, and 7c. For both deconvolutions the operator parameters are: filter length = 80 ms,prewhitening = 0.1%, and both operators are computed on a 1s long time window, which mainlycontains compressional energy. In figures, the red arrows point to the compressional event, andthe blue arrows indicates the coherent noise, which still affects the horizontal components after
527
Application of quaternion algorithms for multicomponent data analysis: a review Boll. Geof. Teor. Appl., 53, 523-537
Fig. 1 - CDP x component of the data from an OBC acquisition.
Fig. 2 - CDP y component of the data from an OBC acquisition.
528
Boll. Geof. Teor. Appl., 53, 523-537 Mazzotti et al.
Fig. 4 - Semblance velocity panels: single component semblance for the x, y, and z components, and quaternionsemblance.
Fig. 3 - CDP z component of the data from an OBC acquisition.
529
Application of quaternion algorithms for multicomponent data analysis: a review Boll. Geof. Teor. Appl., 53, 523-537
deconvolution.The quaternion deconvolution, recognizing the vectorial nature of the signal, emphasizes the
compressional event in the quaternion space. This is apparent on the horizontal projections of thequaternion output (Figs. 7a and 7b) where the compressional event stands out more clearly withrespect to the standard deconvolution outputs (Figs. 6a and 6b). Finally, the quaterniondeconvolution seems also to perform better in the attenuation of the torsional modes, thehyperbolic-like coherent noise pointed to by the blue arrows and evident at short offsets.
6. Quaternion seismic wavefield separation
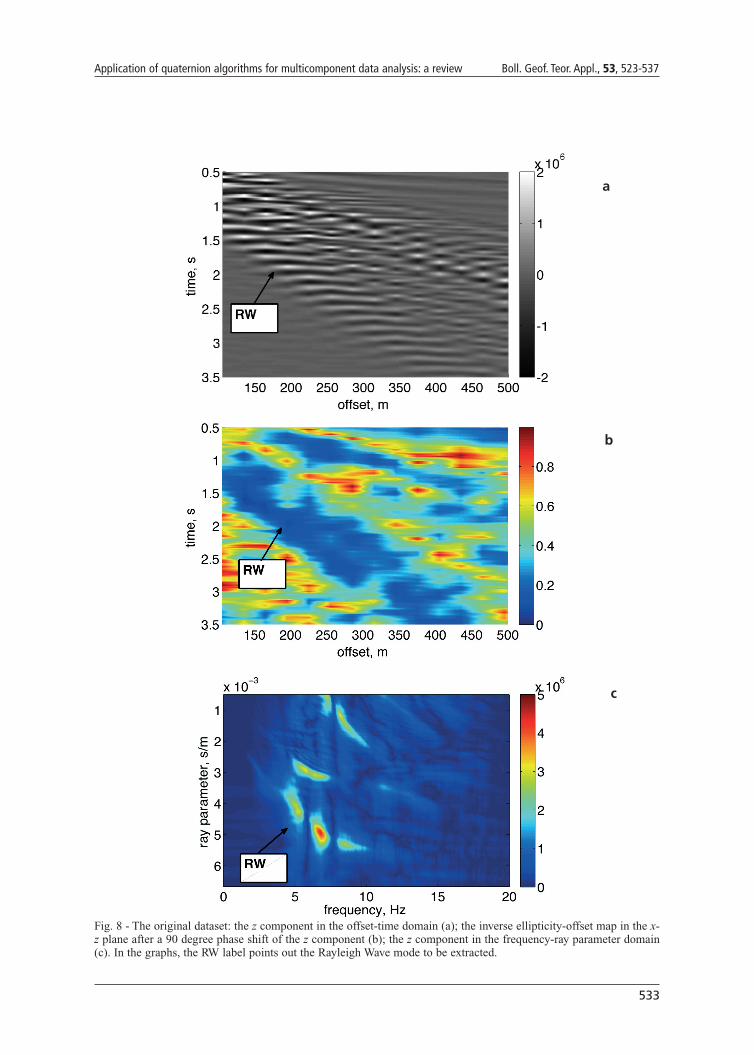
Another important topic in seismology is the separation of surface and body wavefields. Inparticular, we consider the extraction of a single Rayleigh wave mode from a multicomponentland data set, leaving as a residual the body wavefield, other surface waves, and noise. In thefollowing, we show and discuss the results of the application of the procedure described in(Sajeva et al., 2011).
The data are shown in Fig. 8 in three different domains: (a) offset-time, (b) inverse ellipticity-offset, and (c) frequency-ray parameter (f-p domain), and, on each panel, the Rayleigh wave modeis labeled with RW letters. Both (a) and (c) show the z component only (the behavior of the xcomponent is analogous to the z compoment, while the y component is negligible), and (b) iscomputed on the x-z plane.
In the time offset domain (Fig. 8a) the Rayleigh wave mode consists in the slowest wave train,and it has a reverse funnel shape caused by frequency dispersion. In the inverse ellipticity-offsetmap (Fig. 8b) the z component has been 90 degree phase shifted before the computation of theinverse ellipticity. This permits to collapse circular polarization and elliptic polarization with anyeccentricity to linear polarization. In fact, recalling that the inverse ellipticity map plots the ratioof the first two eigenvalues (σ2/σ1) computed on portions of the data (containing the x componentand the 90 degree phase shifted z component in this case), the Rayleigh wave has σ2=0 (linearpolarization), and inverse ellipticity (σ2/σ1=0). At the opposite, incoherent noise is not affectedby the phase shift, then σ1=σ2 and its inverse ellipticity equals one. This trick allows us to visuallydistinguish incoherent noise from elliptically polarized signals (Rayleigh waves). In this domain,the Rayleigh wave mode corresponds to a blue zone (zero), which is indeed clearly visible in themap (Fig. 8b). In the f-p domain (Fig. 8c), we identify the mode with the broken curve composedby three branches with values ranging from 3.5 to 5.8 ms/m pointed by the arrow in the figure.The curve has the ray parameter varying with frequency, i.e., it is a frequency dispersive signal.
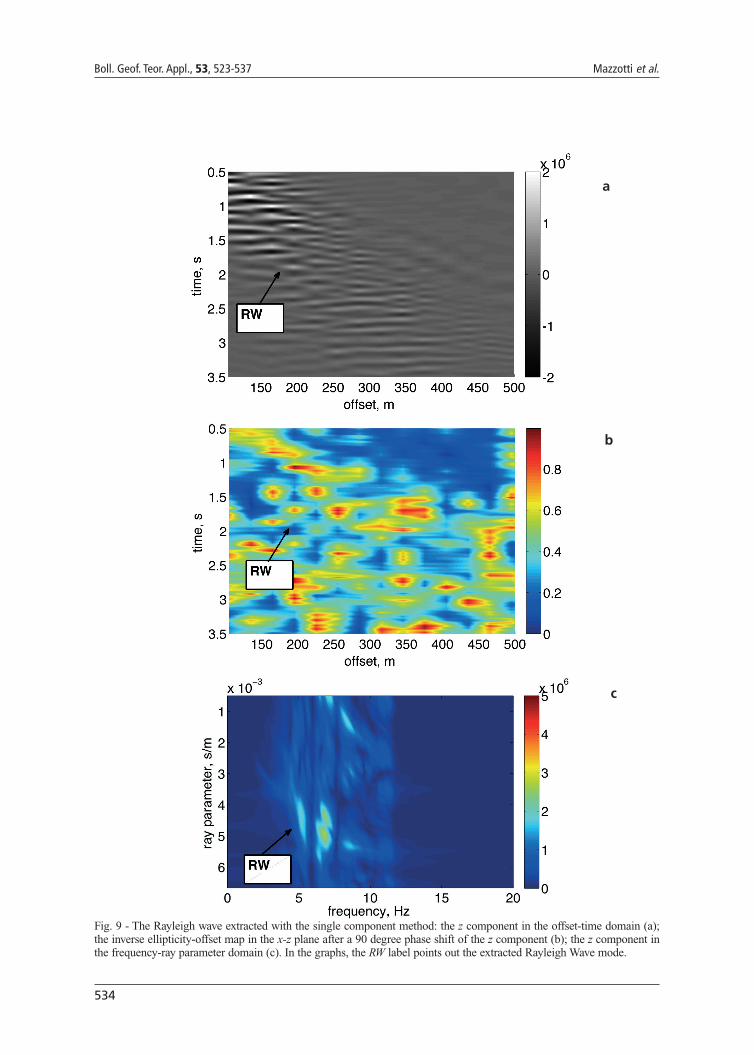
The extraction method has been implemented both on the x, y, z components separately andwith a quaternion representation, the results (the extracted modes) are shown in Figs. 9 and 10.Comparing the original data with the extracted modes, we expect them to be approximately equalwhere the mode is dominating, and to differ elsewhere.
Using the single component implementation (Fig. 9): in the offset time domain (Fig. 9a), thefaster signals (body waves, other surface waves) are correctly attenuated, however, also part of theRayleigh wave mode is attenuated; in the inverse ellipticity-offset domain (Fig. 9b), the Rayleighwave zone has values ranging from 1 to 0, and a clear elliptic zone (blue) cannot be recognized;in the f-p domain (Fig. 9c), the dispersion curve of the mode is affected by the same attenuation
530
Boll. Geof. Teor. Appl., 53, 523-537 Mazzotti et al.
Fig. 5 - A portion of the gather: x component (a); y component (b); z component (c). Red arrows point to thecompressional events, which are clearly visible on the z component and barely visible on the x and y components.
a
b
c
531
Application of quaternion algorithms for multicomponent data analysis: a review Boll. Geof. Teor. Appl., 53, 523-537
Fig. 6 - The portion of the gather after single component spiking deconvolution: x component (a); y component (b); zcomponent (c). Red arrows point to the compressional events, and blue arrows indicate the torsional mode coherentnoise.
a
b
c
532
Boll. Geof. Teor. Appl., 53, 523-537 Mazzotti et al.
Fig. 7 - The portion of the gather after quaternion spiking deconvolution: x component (a); y component (b); zcomponent (c). Red arrows point to the compressional events, and blue arrows indicate the torsional mode coherentnoise.
a
b
c
533
Application of quaternion algorithms for multicomponent data analysis: a review Boll. Geof. Teor. Appl., 53, 523-537
Fig. 8 - The original dataset: the z component in the offset-time domain (a); the inverse ellipticity-offset map in the x-z plane after a 90 degree phase shift of the z component (b); the z component in the frequency-ray parameter domain(c). In the graphs, the RW label points out the Rayleigh Wave mode to be extracted.
a
b
c
534
Boll. Geof. Teor. Appl., 53, 523-537 Mazzotti et al.
Fig. 9 - The Rayleigh wave extracted with the single component method: the z component in the offset-time domain (a);the inverse ellipticity-offset map in the x-z plane after a 90 degree phase shift of the z component (b); the z component inthe frequency-ray parameter domain (c). In the graphs, the RW label points out the extracted Rayleigh Wave mode.
a
b
c
535
Application of quaternion algorithms for multicomponent data analysis: a review Boll. Geof. Teor. Appl., 53, 523-537
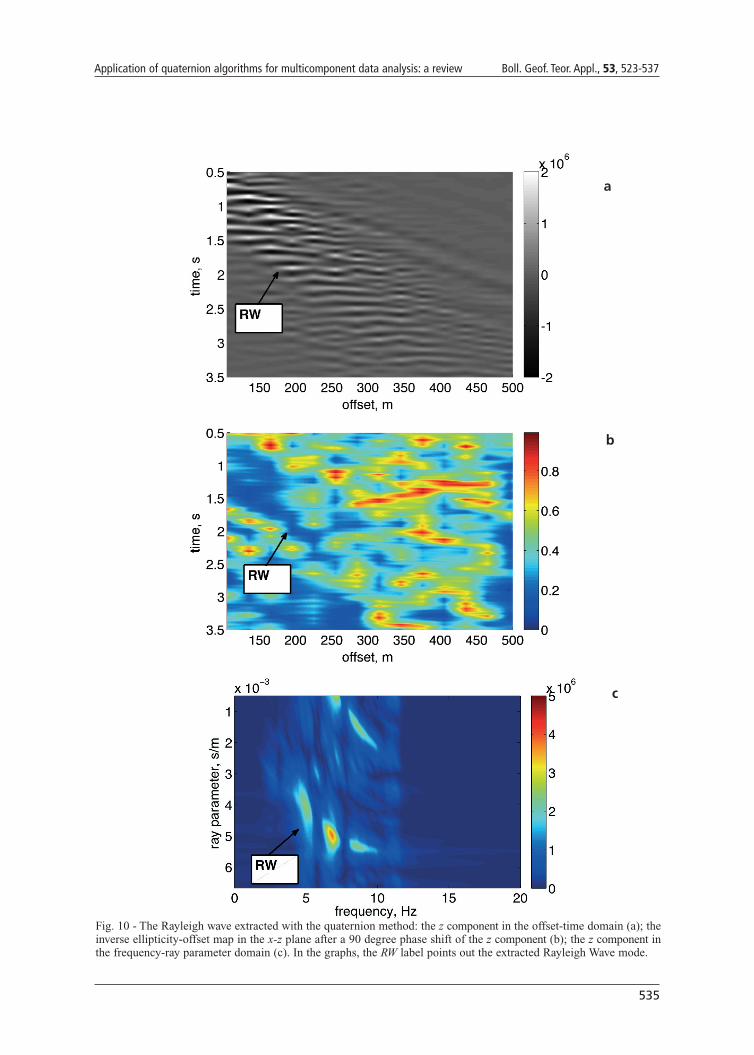
Fig. 10 - The Rayleigh wave extracted with the quaternion method: the z component in the offset-time domain (a); theinverse ellipticity-offset map in the x-z plane after a 90 degree phase shift of the z component (b); the z component inthe frequency-ray parameter domain (c). In the graphs, the RW label points out the extracted Rayleigh Wave mode.
a
b
c

536
Boll. Geof. Teor. Appl., 53, 523-537 Mazzotti et al.
present in (Fig. 9a).Using the quaternion implementation (Fig. 10): in the offset time domain (Fig. 10a) the energy
of the mode is better preserved along the offset; in the polarization map (Fig. 10b) a blue zone ispresent in the offset range 0-200 m, instead for longer offsets inverse ellipticity assumes valuesmainly in the range 0-0.6 and, as previously, a clear elliptic zone cannot be recognized; in the f-p domain (Fig. 10c), the dispersion curve of the mode is visible and most part of its energy ispreserved.
In conclusion, the quaternion implementation shows an improvement with respect to thesingle component implementation on each of the three different domains: offset-time, inverseellipticity-offset, and f-p domains.
7. Conclusions
The very nature of quaternions, hypercomplex numbers, makes them perfectly suited to treatmulticomponent seismic data and to honour the vectorial nature of the incoming wave fields. Inparticular, quaternion velocity analysis simultaneously evidences velocity trends pertaining todifferent wave modes, and it helps the interpreter to estimate interval Vp and Vs by means of eventcorrelation, and to correlate information between VSP and well logs. Moreover, it speeds up thevelocity picking, which can be performed in a single pass on a multicomponent velocity panel,rather than once for each single velocity panel.
Analogously, quaternion deconvolution performs superiorly than single componentdeconvolution, taking advantage of the signal that is simultaneously present in all thecomponents.
Finally, the results of the quaternion extraction of Rayleigh waves show a better performancewith respect to single component algorithms for both polarization and lateral continuityproperties; this is explained by the ability of quaternions to compactly represent ellipticallypolarized signals.
This overview of recently achieved research results, which have been separately published,suggests the chance of extending the quaternion approach to other steps of seismic processing,and eventually to perform a complete quaternion processing sequence for multicomponent data.
REFERENCESAdler S.; 1995: Quaternionic quantum mechanics and quantum fields. Oxford University Press, 586 pp.
Anderson S. and Nehorai A.; 1996: Analysis of a polarized seismic wave model. IEEE Trans. Signal Process., 44, 379-386.
Claerbout J.; 1985: Fundamentals of geophysical data processing with applications to petroleum prospecting.Blackwell Scientific Publications, Palo Alto, CA, USA, 274 pp.
Grandi A., Mazzotti A. and Stucchi E.; 2007: Multicomponent velocity analysis with quaternions. Geophys. Prospect.,55, 761-777.
Grandi A., Stucchi E. and Mazzotti A.; 2004: Multicomponent velocity analysis by means of covariance measures andcomplex matched filters. In: Proc. 74th SEG Meeting, Denver, CO, Texas, USA, Expanded Abstract, pp. 2415-2418.
Grandi A., Stucchi E. and Mazzotti A.; 2005: Vp/Vs Ratios through multicomponent velocity analysis. In: Proc. 67th
537
Application of quaternion algorithms for multicomponent data analysis: a review Boll. Geof. Teor. Appl., 53, 523-537
EAGE Conf., Madrid, Spain, Expanded Abstract, pp. B024 1-24.
Grion S., Mazzotti A. and Spagnolini U.; 1998: Joint estimation of AVO and kinematic parameters. Geophys. Prospect.,46, 405-422.
Hamilton W.R.; 1844: On quaternions: or a new system of imaginaries in algebra. The Philosophical Magazine, 3rdseries, 25, 489-495.
Key S.C. and Smithson S.B.; 1990: New approach to seismic-reflection event detection and velocity determination.Geophsics, 55, 1057-1069.
Le Bihan N. and Mars J.; 2004: Singular value decomposition of quaternion matrices: a new tool for vector-sensorsignal processing. Signal Process., 84, 1177-1199.
Menanno G. and Le Bihan N.; 2010: Quaternion polynomial matrix diagonalization for the separation of polarizedconvolutive mixture. Signal Process., 90, 2219-2231.
Menanno G. and Mazzotti A.; 2012: Deconvolution of multicomponent seismic data by means of quaternions: theoryand preliminary results. Geophys. Prospect., 60, 217-238.
Miron S., Le Bihan N. and Mars J.; 2006: Quaternion-MUSIC for vector-sensor array processing. IEEE Trans. SignalProcess., 54, 1218-1229.
Neidell N.S. and Taner M.T.; 1971: Semblance and other coherency measures for multichannel data. Geophsics, 36,482-497.
Sajeva A., Menanno G.M. and Mazzotti A.; 2011: Modal identification and extraction of Rayleigh waves by means ofquaternion SVD and group velocity curves. In: Proc. 73rd EAGE Conference & Exhibition Wien, Austria, pp. P0951-4.
Sangwine S.; 1996: Fourier transforms of colour images using quaternion, or hypercomplex numbers. Electron. Lett.,32, 1979-1980.
Spagnolini U., Macciotta L. and Manni A.; 1993: Velocity analysis by truncated singular value decomposition. In: Proc.63rd SEG Meeting, Washington, DC, USA, pp. 677-680.
Sudbery A.; 1979: Quaternionic analysis. Math. Proc. Camb. Phil. Soc., 85, 199-225.
Treitel S.; 1970: Principles of digital multichannel filtering. Geophys., 35, 785-811.
Zhang F.; 1997: Quaternion and matrices of quaternions. Linear Algebra and its Applications, 251, 21-57.
Corresponding author: Alfredo Mazzotti Earth Sciences Department, University of PisaVia Santa Maria 53, 56126 Pisa, ItalyPhone: +39 050 2215794; fax: +39 050 2215800; e-mail: [email protected]

Copyright of Bollettino di Geofisica Teorica ed Applicata is the property of Istituto Nazionale di Oceanografia e
di Geofisica Sperimentale-OGS and its content may not be copied or emailed to multiple sites or posted to a
listserv without the copyright holder's express written permission. However, users may print, download, or
email articles for individual use.


![Cámara y Cuaterniones en OpenGLcs.uns.edu.ar/cg/practicos/Camara_y_Cuaterniones[handout].pdfSi a y b son cuaterniones unitarios que representan rotaciones, la rotaci on que representa](https://img.pdfslide.us/doc/110x75/5eb34d30952380344f5a7ca5/cmara-y-cuaterniones-en-handoutpdf-si-a-y-b-son-cuaterniones-unitarios-que-representan.jpg)