Embed Size (px)
Citation preview

DE&S, ORISSAWELCOMES
THE DELEGATES
LocationLocationOrissa is one of the 28 States of Indian Union which was created on April 1, 1936. It is located between 170 48’ to 220 34’ north latitude and 810
24’ to 870 29’ east longitude. The State is bounded by the State of West-Bengal in the north-east, Jharkhand on the north, Chhatisgarh in the West, Andhra Pradesh in the south and the Bay of Bengal in the east.
ClimateClimate
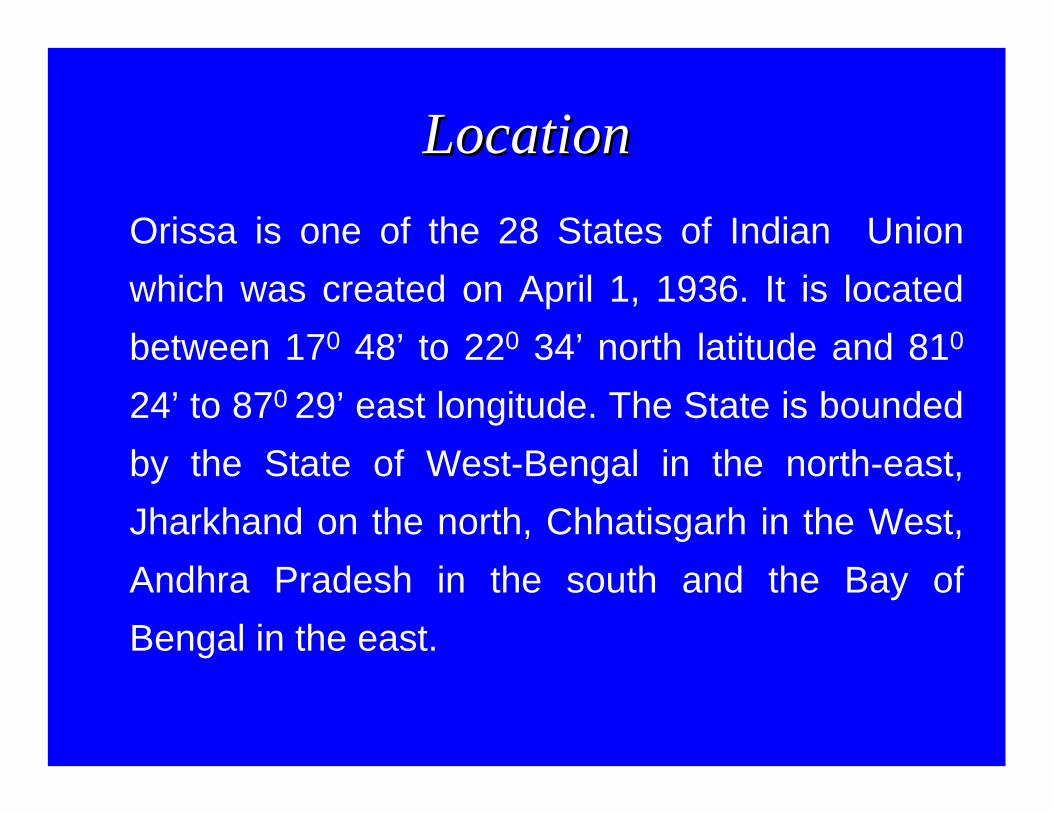
It enjoys a tropical climate with an average rainfall of 150 cms, most of which is received during the months of June to October. The maximum temperature in the State rises to nearly 480 centigrade in the month of May and declines to 100 centigrade during winter season. Orissa is one of the few states of the country where almost all the major natural disasters like drought, flood, cyclone occur.
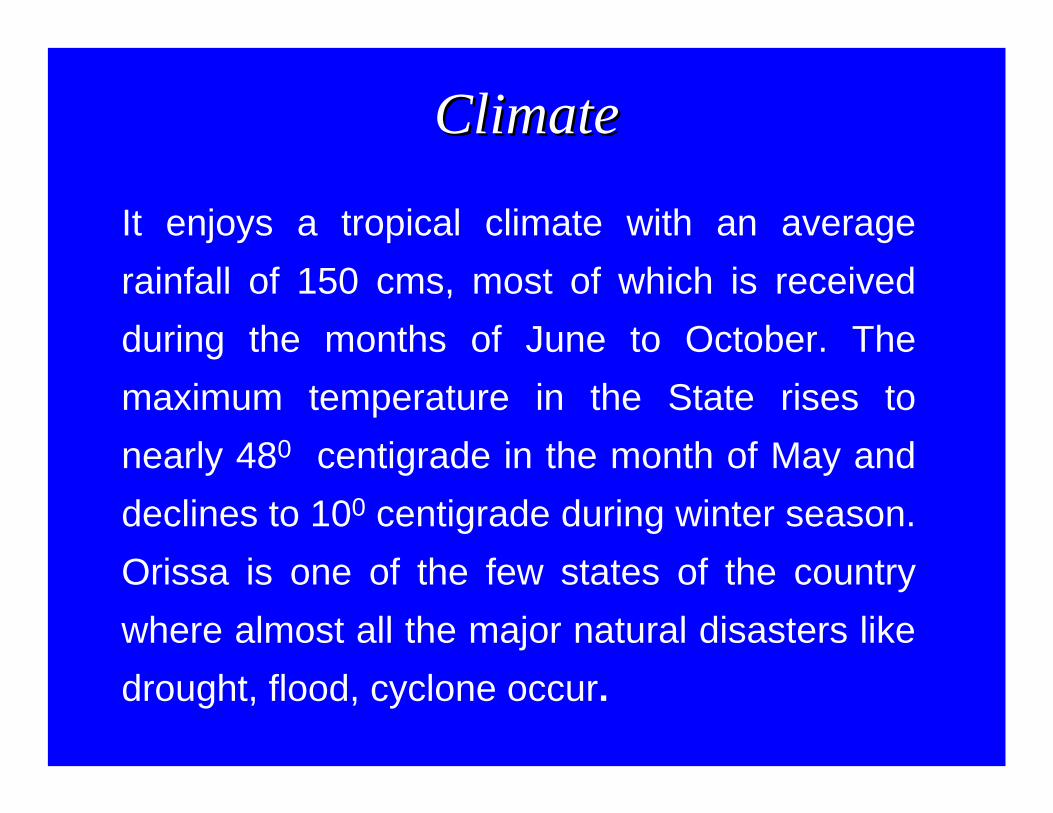
The State is divided in to 10 (ten) agro climatic zones with varied characteristics.
The entire land mass is classified into three categories with various types of soil like red yellow. Loamy. alluvial. Black. Laterite etc.
(i) Low Land 25.6 %(ii) Medium Land 33.6 %(iii) Up Land 40.8 %
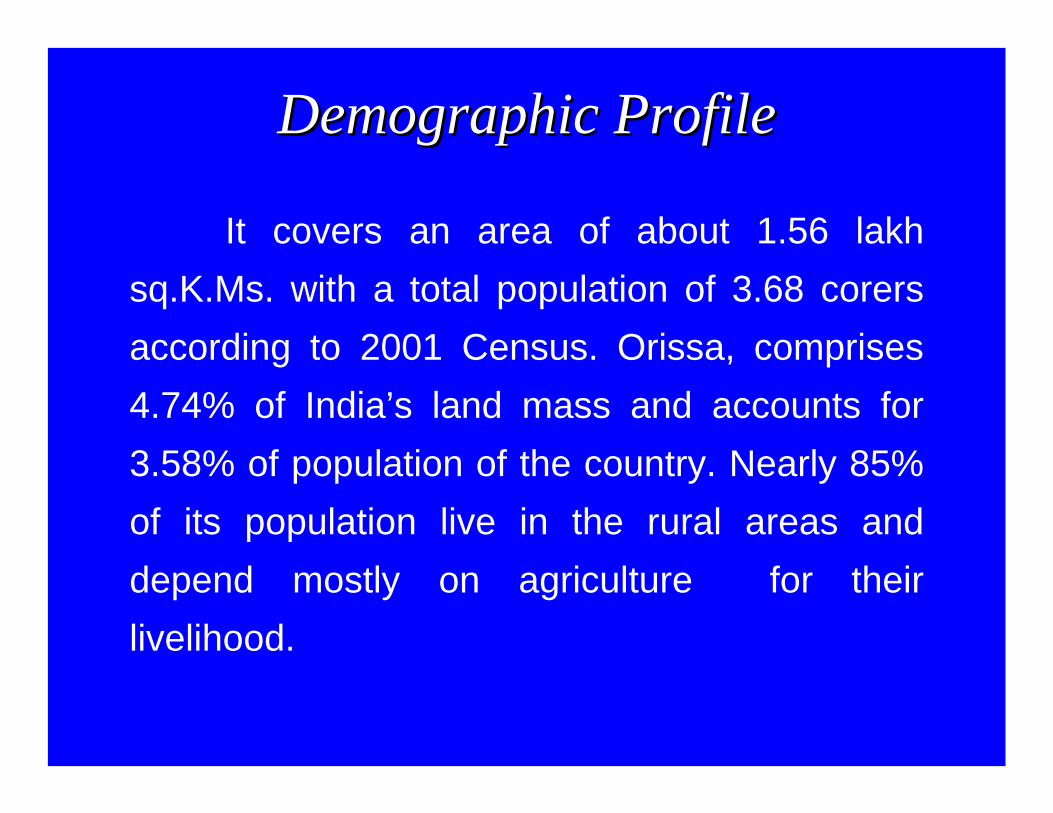
It covers an area of about 1.56 lakh sq.K.Ms. with a total population of 3.68 corers according to 2001 Census. Orissa, comprises 4.74% of India’s land mass and accounts for 3.58% of population of the country. Nearly 85% of its population live in the rural areas and depend mostly on agriculture for their livelihood.
Demographic ProfileDemographic Profile
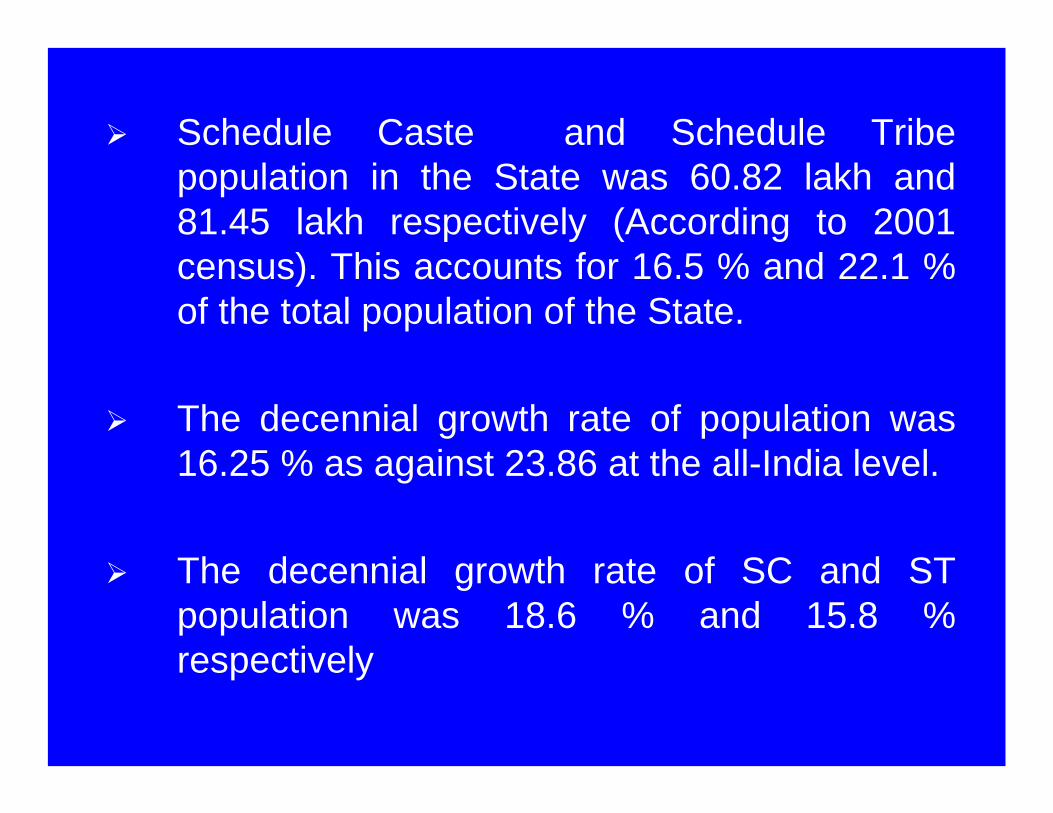
Schedule Caste and Schedule Tribe population in the State was 60.82 lakh and 81.45 lakh respectively (According to 2001 census). This accounts for 16.5 % and 22.1 % of the total population of the State.
The decennial growth rate of population was 16.25 % as against 23.86 at the all-India level.
The decennial growth rate of SC and ST population was 18.6 % and 15.8 % respectively
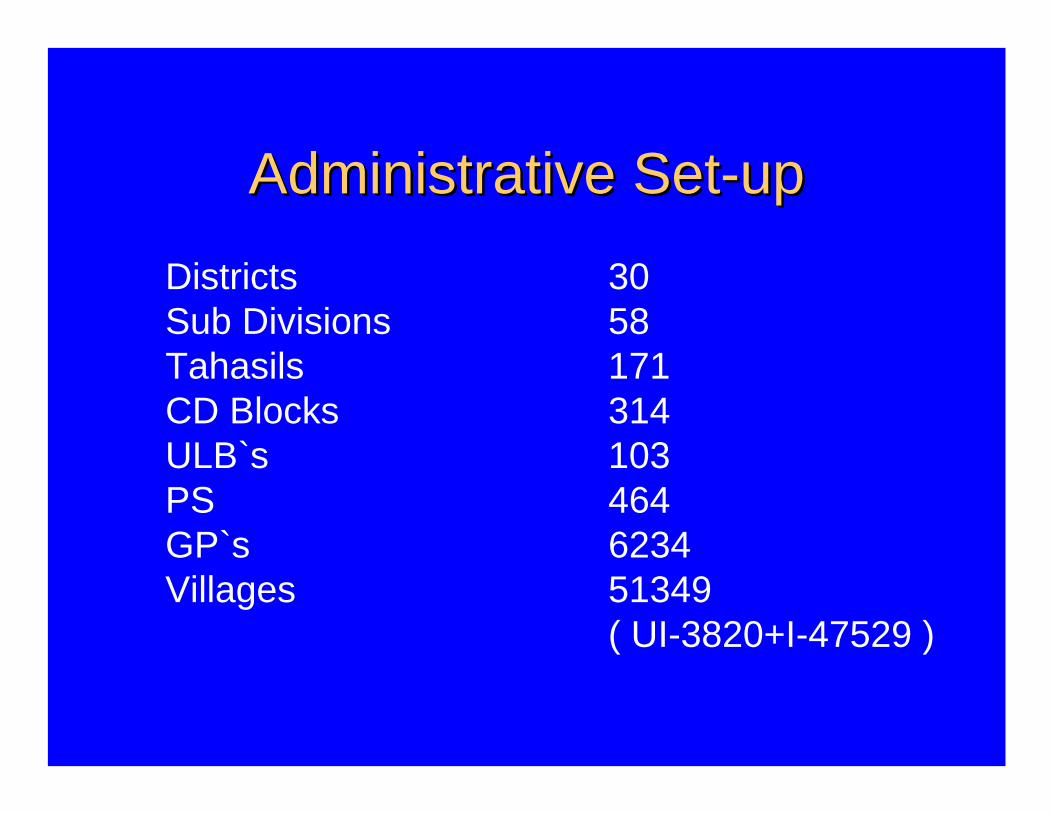
Administrative SetAdministrative Set--upupDistricts 30Sub Divisions 58Tahasils 171CD Blocks 314ULB`s 103PS 464GP`s 6234Villages 51349
( UI-3820+I-47529 )
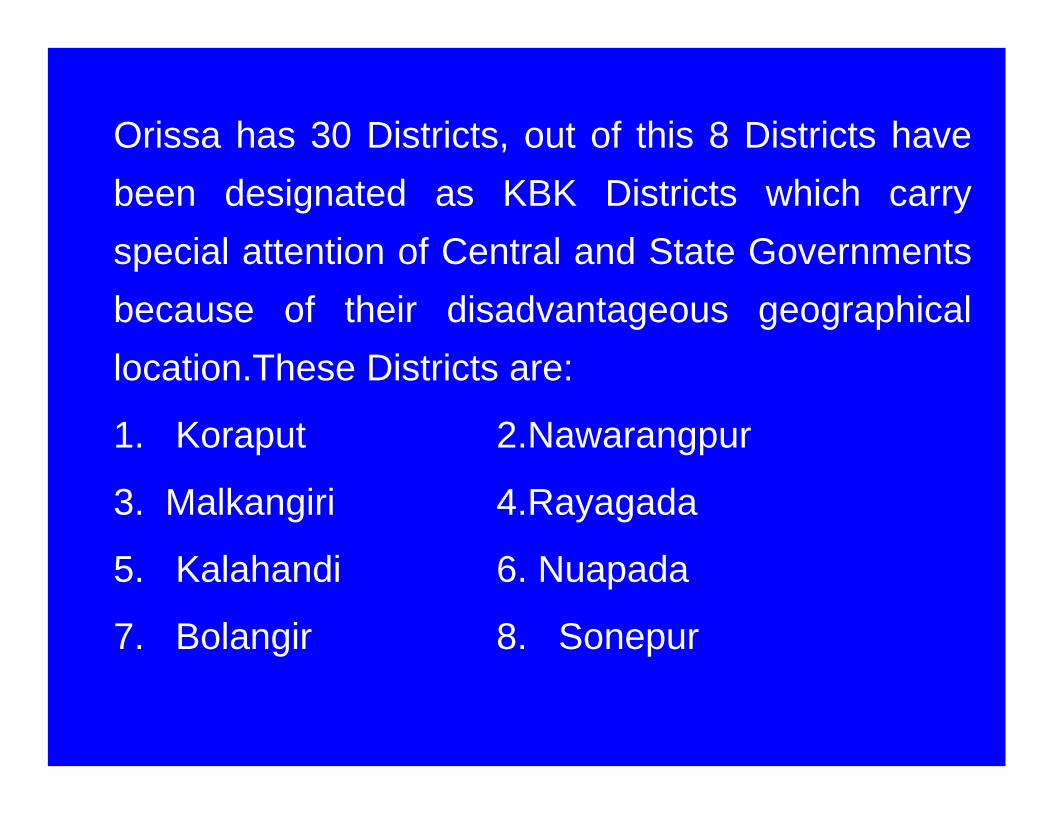
Orissa has 30 Districts, out of this 8 Districts have been designated as KBK Districts which carry special attention of Central and State Governments because of their disadvantageous geographical location.These Districts are:
1. Koraput 2.Nawarangpur
3. Malkangiri 4.Rayagada
5. Kalahandi 6. Nuapada
7. Bolangir 8. Sonepur
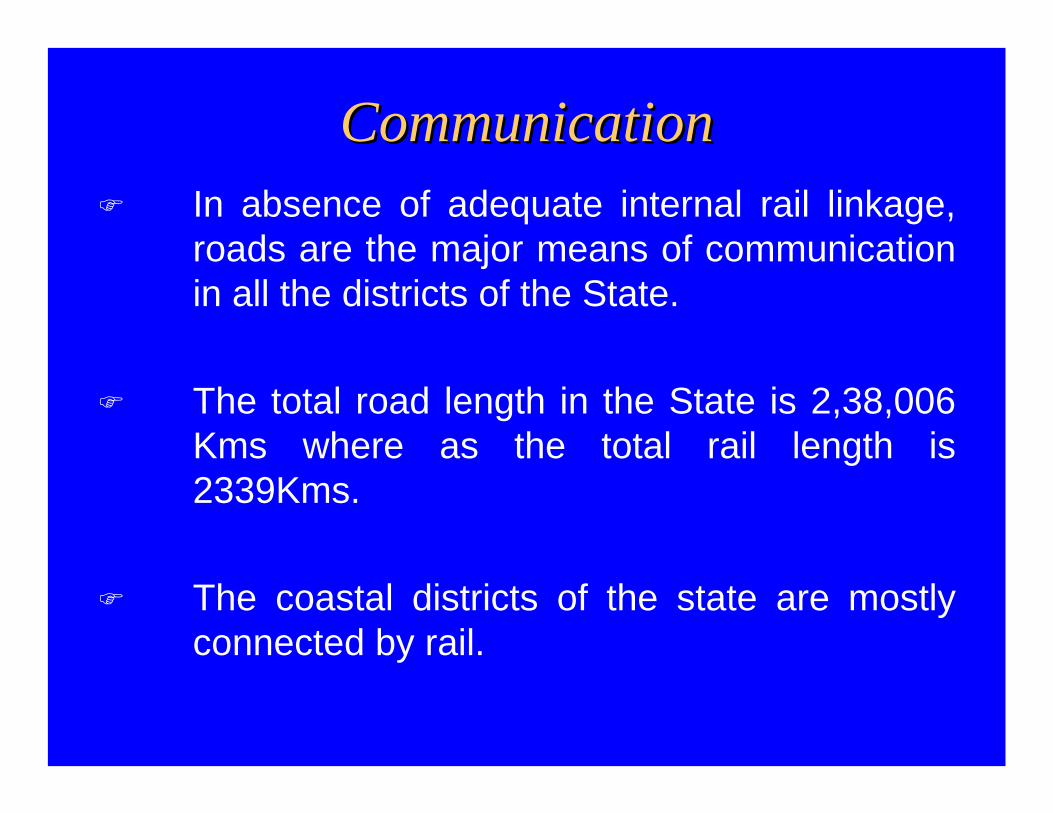
CommunicationCommunicationIn absence of adequate internal rail linkage, roads are the major means of communication in all the districts of the State.
The total road length in the State is 2,38,006 Kms where as the total rail length is 2339Kms.
The coastal districts of the state are mostly connected by rail.
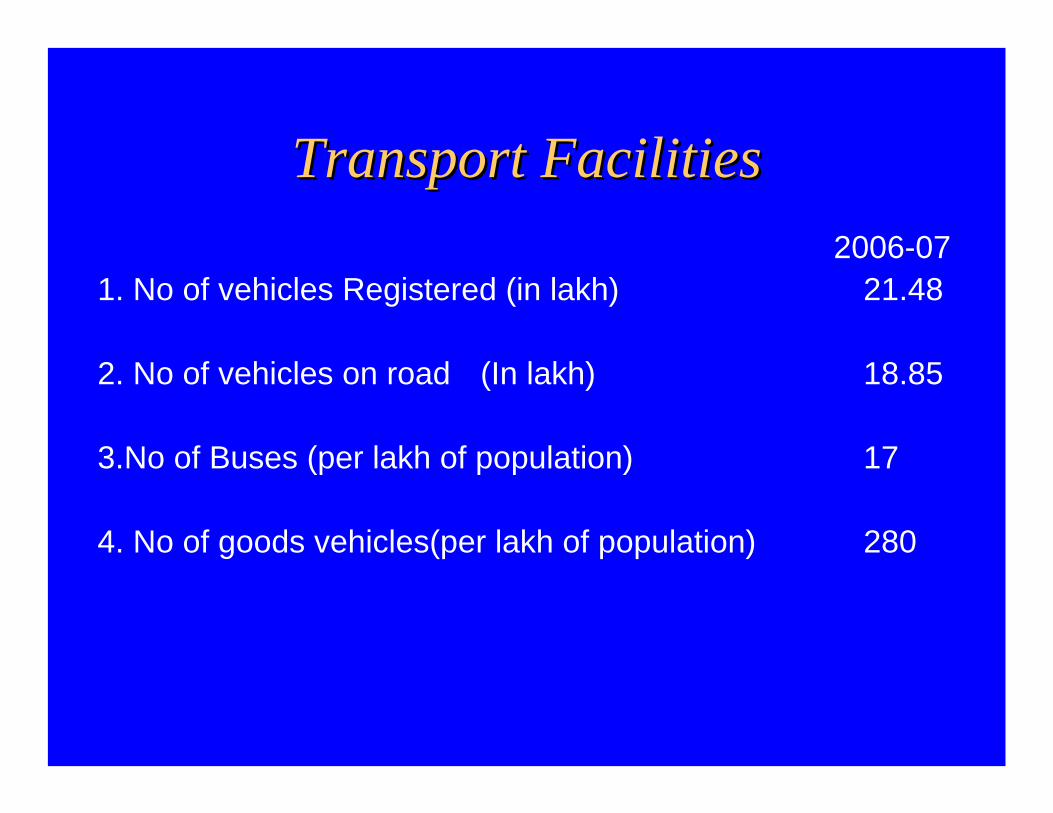
Transport FacilitiesTransport Facilities2006-07
1. No of vehicles Registered (in lakh) 21.48
2. No of vehicles on road (In lakh) 18.85
3.No of Buses (per lakh of population) 17
4. No of goods vehicles(per lakh of population) 280
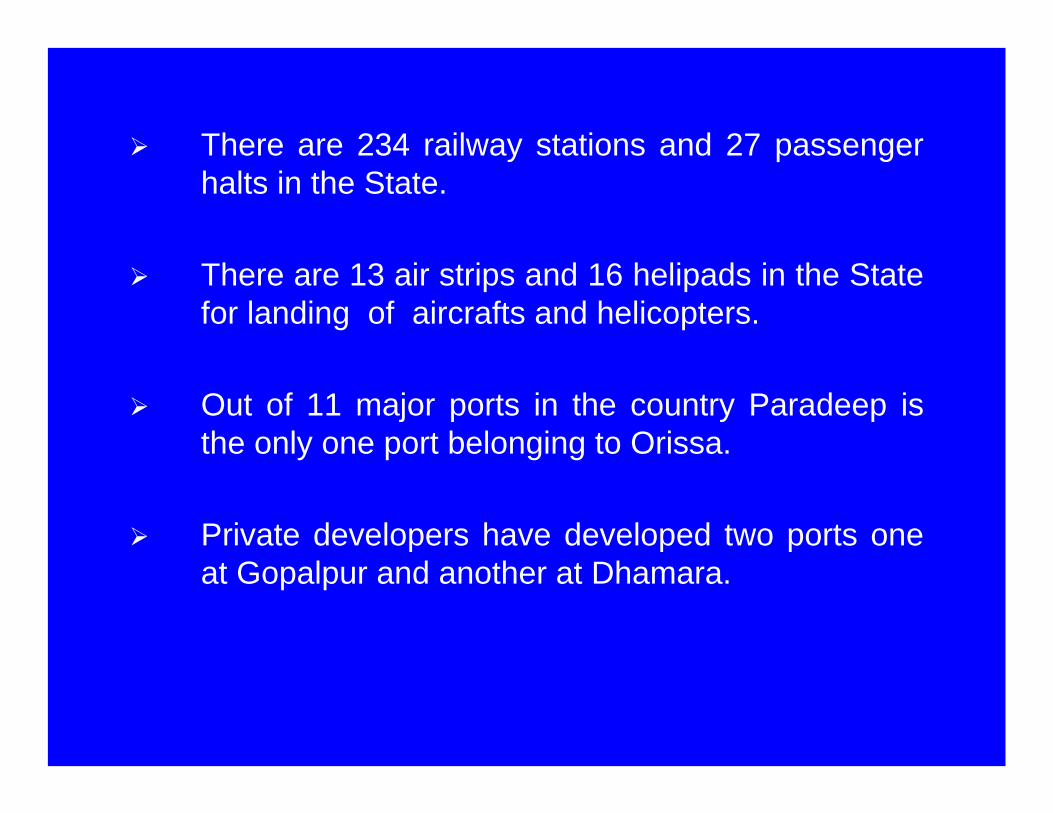
There are 234 railway stations and 27 passenger halts in the State.
There are 13 air strips and 16 helipads in the State for landing of aircrafts and helicopters.
Out of 11 major ports in the country Paradeep is the only one port belonging to Orissa.
Private developers have developed two ports one at Gopalpur and another at Dhamara.
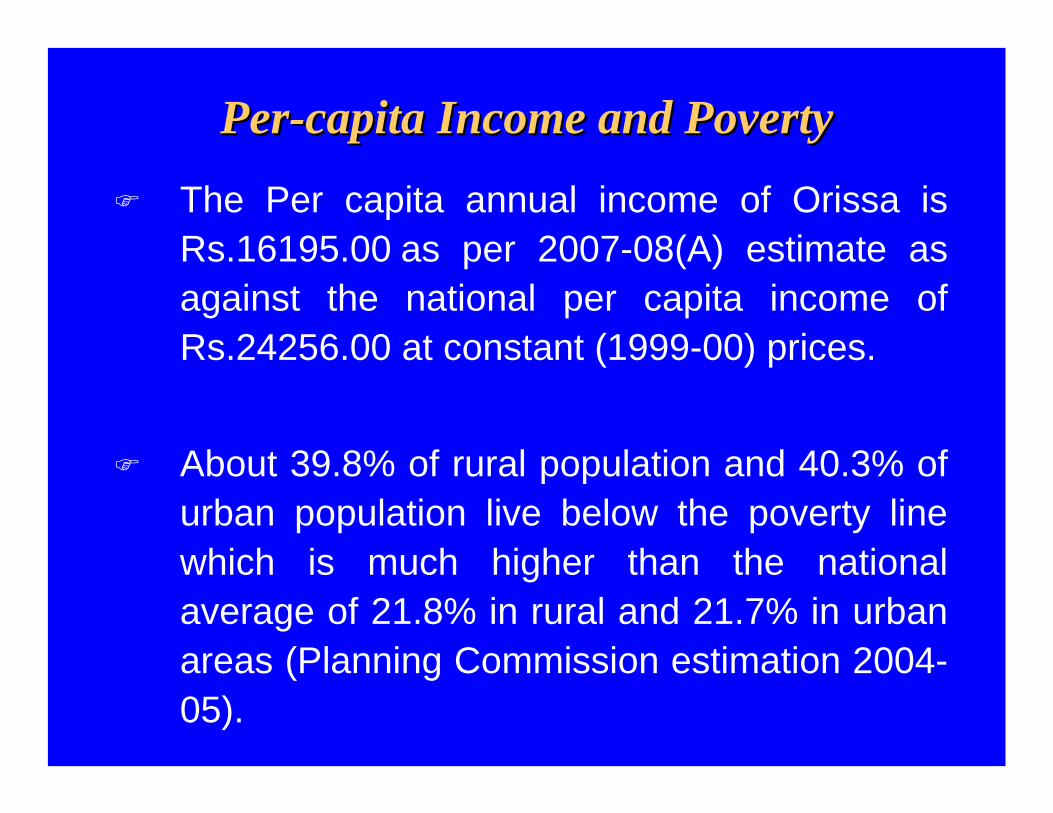
PerPer--capita Income and Povertycapita Income and Poverty
The Per capita annual income of Orissa is Rs.16195.00 as per 2007-08(A) estimate as against the national per capita income of Rs.24256.00 at constant (1999-00) prices.
About 39.8% of rural population and 40.3% of urban population live below the poverty line which is much higher than the national average of 21.8% in rural and 21.7% in urban areas (Planning Commission estimation 2004-05).
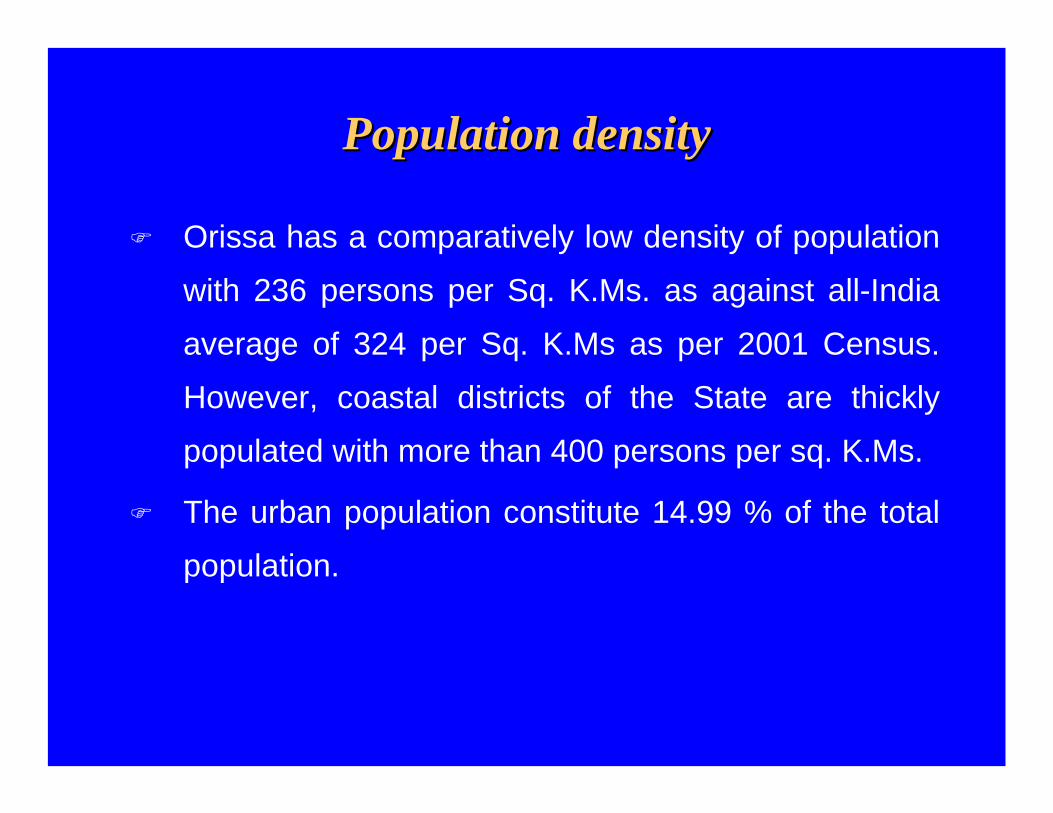
Population densityPopulation density
Orissa has a comparatively low density of population
with 236 persons per Sq. K.Ms. as against all-India
average of 324 per Sq. K.Ms as per 2001 Census.
However, coastal districts of the State are thickly
populated with more than 400 persons per sq. K.Ms.
The urban population constitute 14.99 % of the total
population.
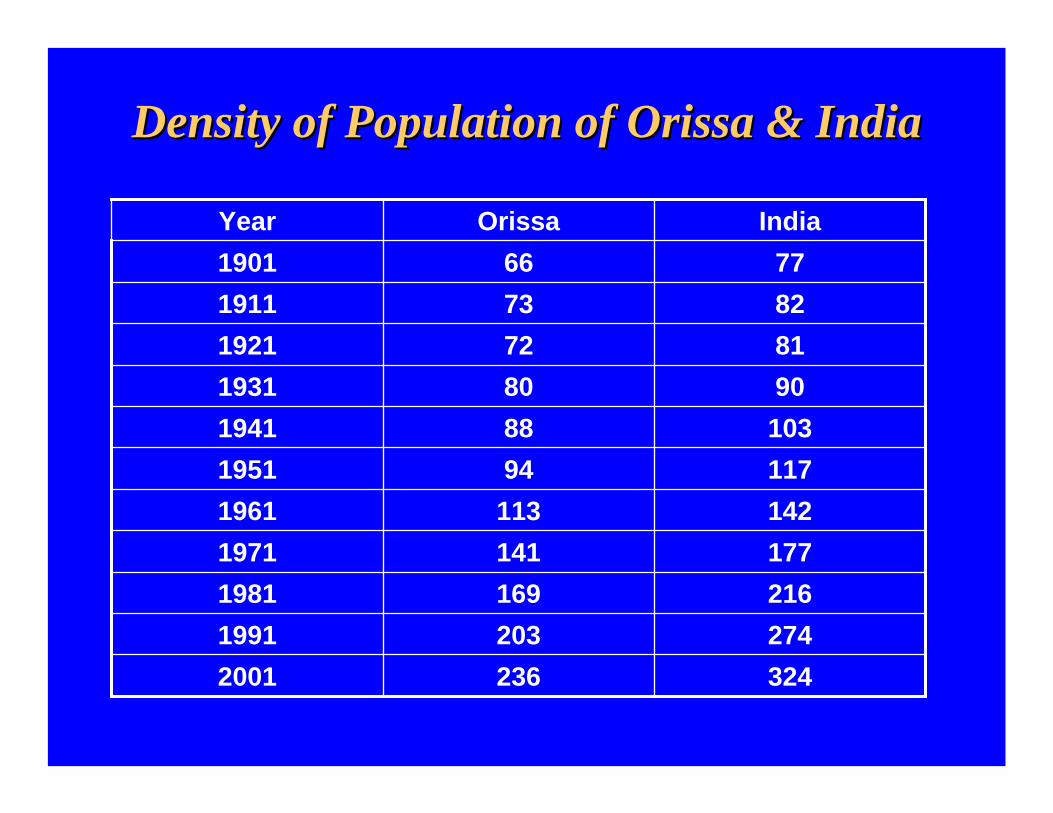
Density of Population of Orissa & IndiaDensity of Population of Orissa & India
82731911
324236200127420319912161691981177141197114211319611179419511038819419080193181721921
77661901IndiaOrissaYear
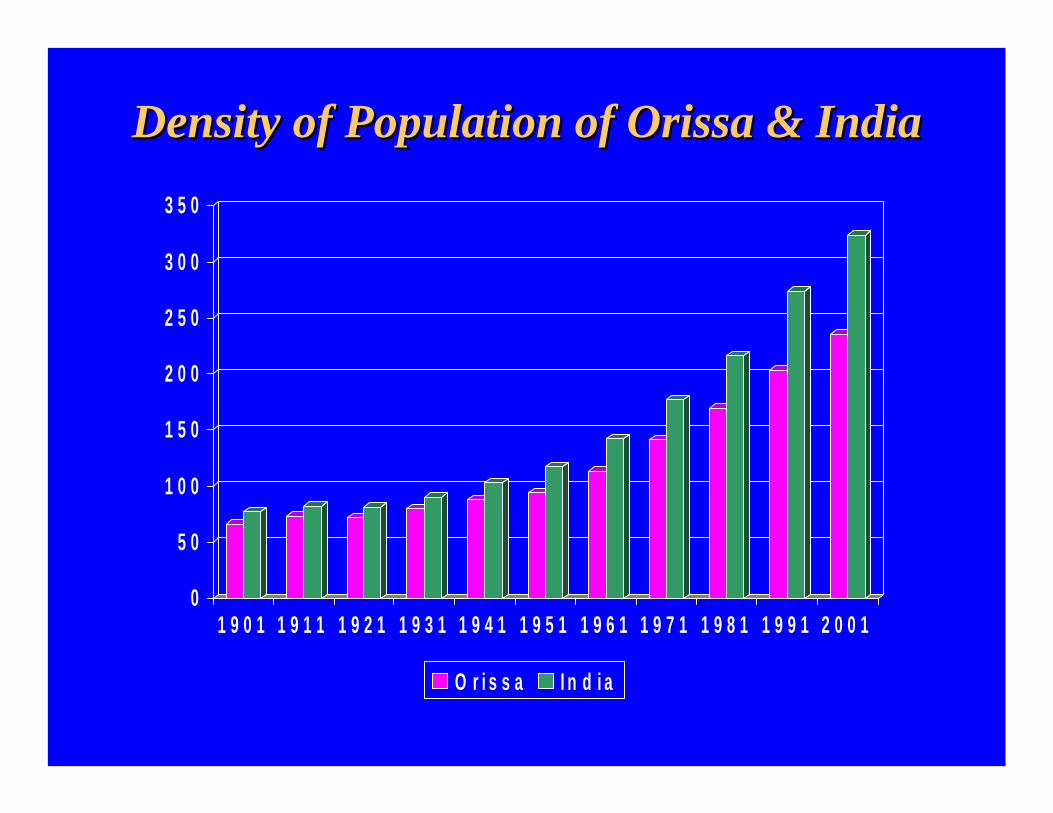
Density of Population of Orissa & IndiaDensity of Population of Orissa & India
0
5 0
1 0 0
1 5 0
2 0 0
2 5 0
3 0 0
3 5 0
1 9 0 1 1 9 1 1 1 9 2 1 1 9 3 1 1 9 4 1 1 9 5 1 1 9 6 1 1 9 7 1 1 9 8 1 1 9 9 1 2 0 0 1
O r i s s a I n d i a
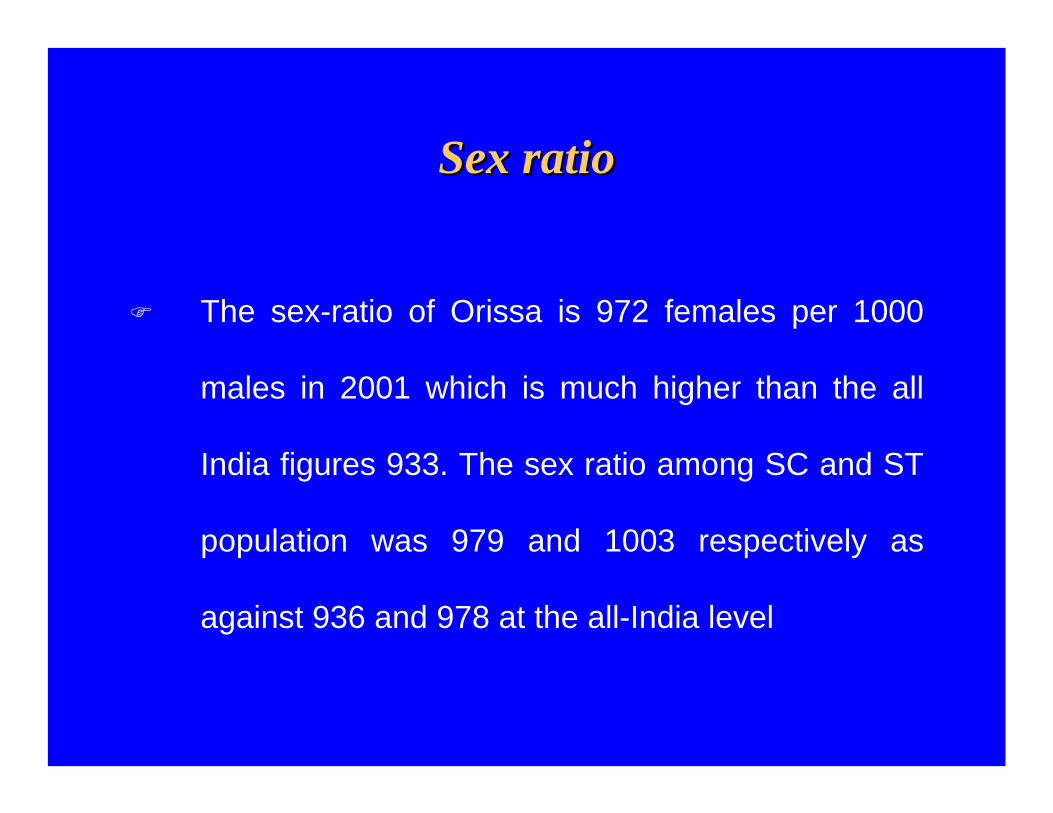
Sex ratioSex ratio
The sex-ratio of Orissa is 972 females per 1000
males in 2001 which is much higher than the all
India figures 933. The sex ratio among SC and ST
population was 979 and 1003 respectively as
against 936 and 978 at the all-India level
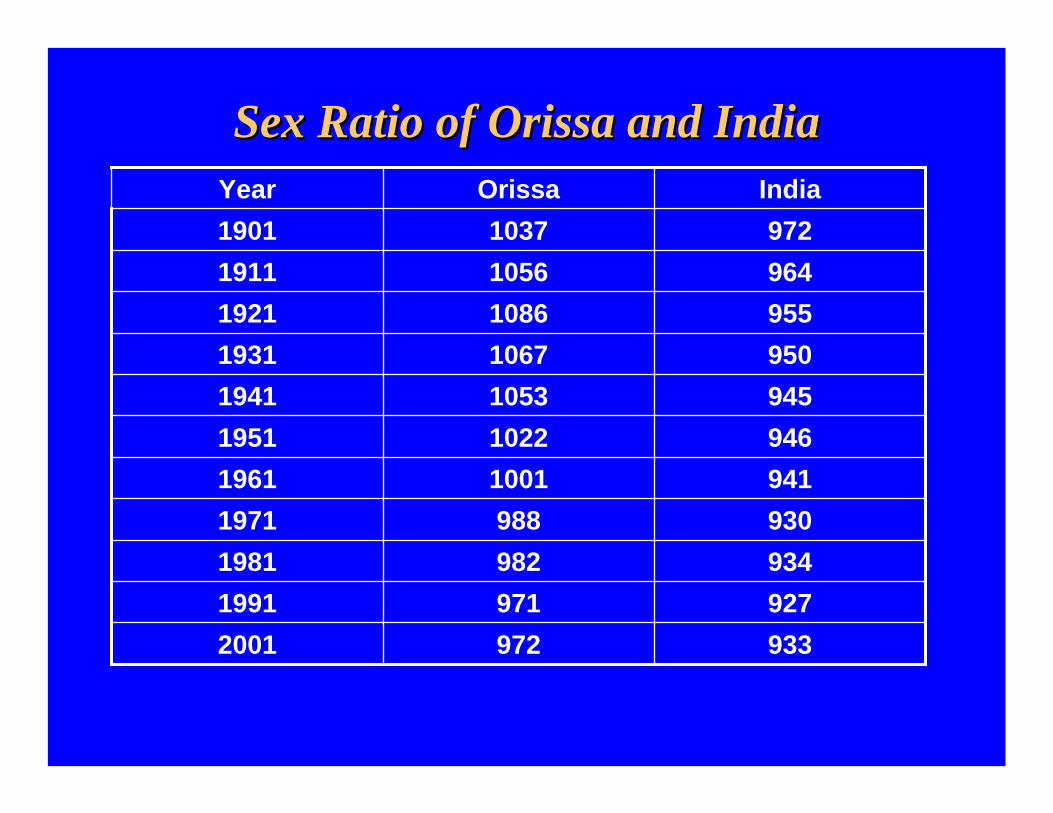
Sex Ratio of Orissa and IndiaSex Ratio of Orissa and India
96410561911
93397220019279711991934982198193098819719411001196194610221951945105319419501067193195510861921
97210371901IndiaOrissaYear
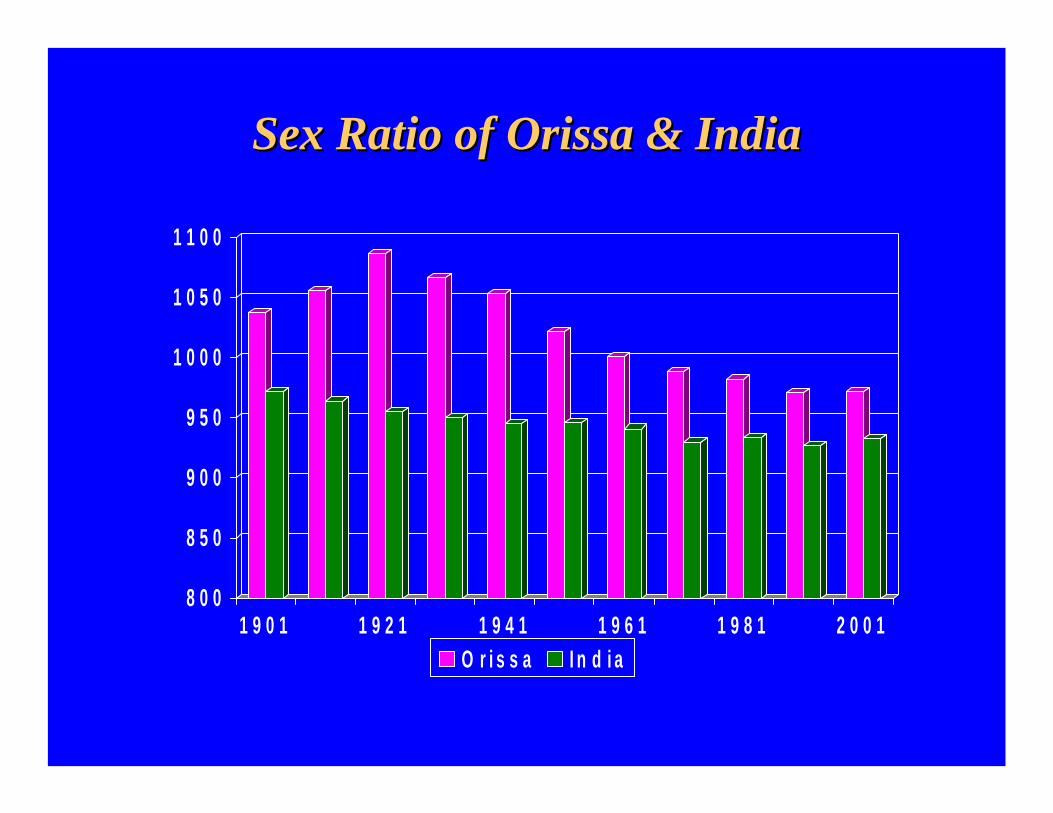
Sex Ratio of Orissa & IndiaSex Ratio of Orissa & India
8 0 0
8 5 0
9 0 0
9 5 0
1 0 0 0
1 0 5 0
1 1 0 0
1 9 0 1 1 9 2 1 1 9 4 1 1 9 6 1 1 9 8 1 2 0 0 1O r i s s a I n d i a
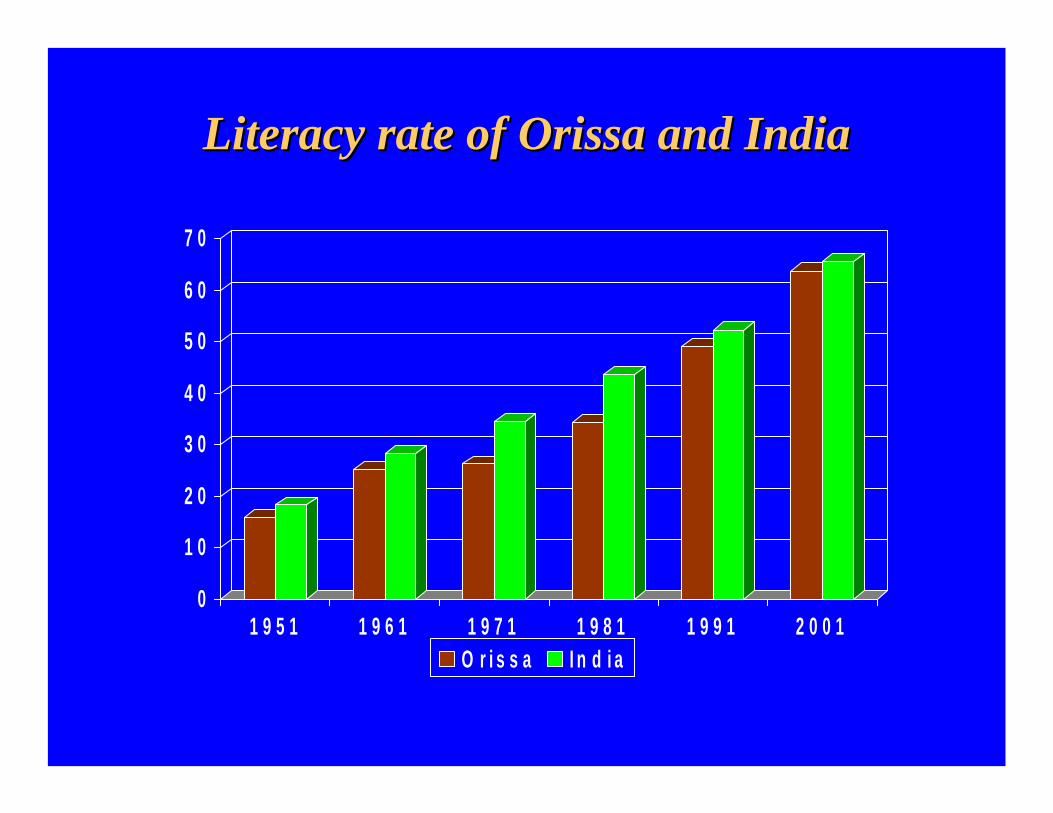
LiteracyLiteracy
The literacy rate of Orissa is 63.08% in 2001
census against the national figure 65.38%. The
literacy rate among male is 75.35% and that of
female is 50.51%
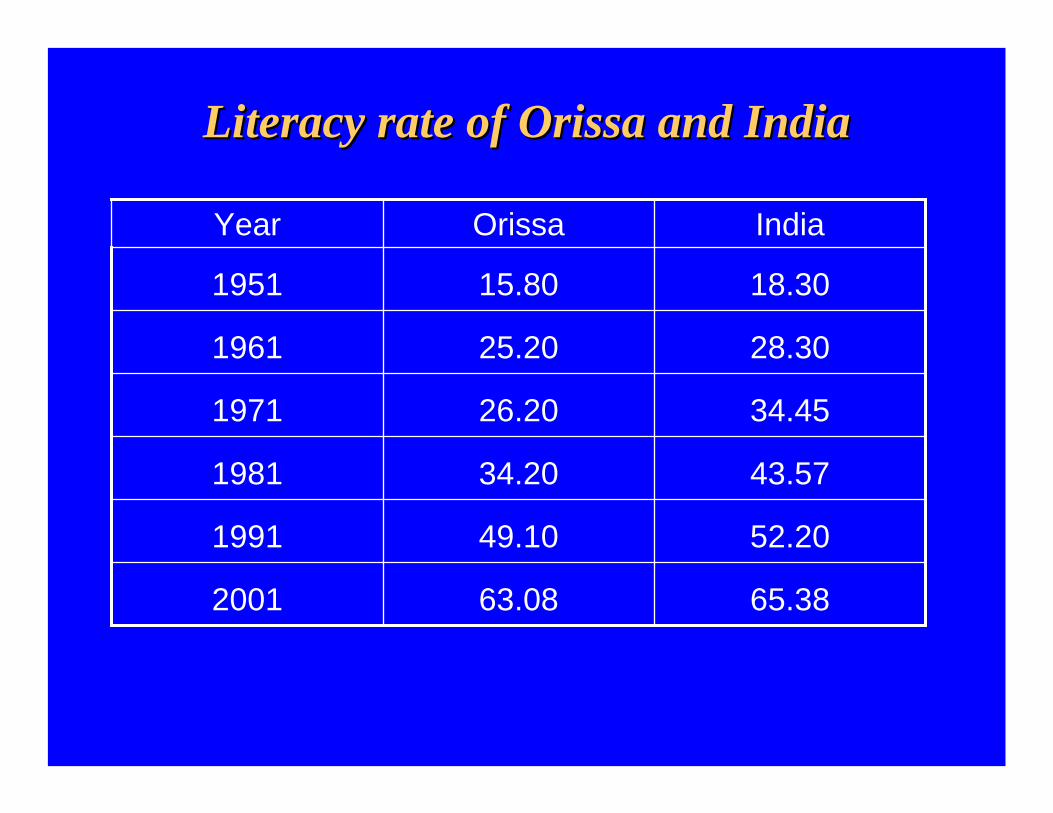
Literacy rate of Orissa and IndiaLiteracy rate of Orissa and India
65.3863.082001
52.2049.101991
43.5734.201981
34.4526.201971
28.3025.201961
18.3015.801951
IndiaOrissaYear
Literacy rate of Orissa and IndiaLiteracy rate of Orissa and India
0
1 0
2 0
3 0
4 0
5 0
6 0
7 0
1 9 5 1 1 9 6 1 1 9 7 1 1 9 8 1 1 9 9 1 2 0 0 1O r i s s a I n d i a
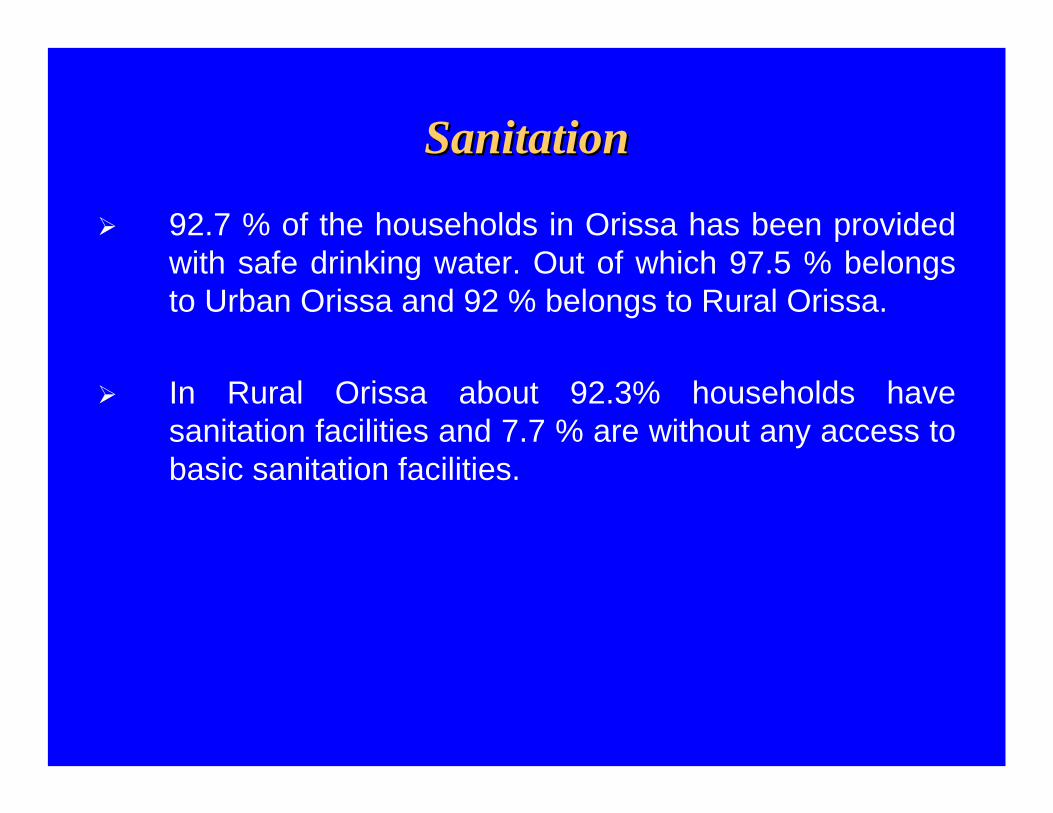
SanitationSanitation
92.7 % of the households in Orissa has been provided with safe drinking water. Out of which 97.5 % belongs to Urban Orissa and 92 % belongs to Rural Orissa.
In Rural Orissa about 92.3% households have sanitation facilities and 7.7 % are without any access to basic sanitation facilities.
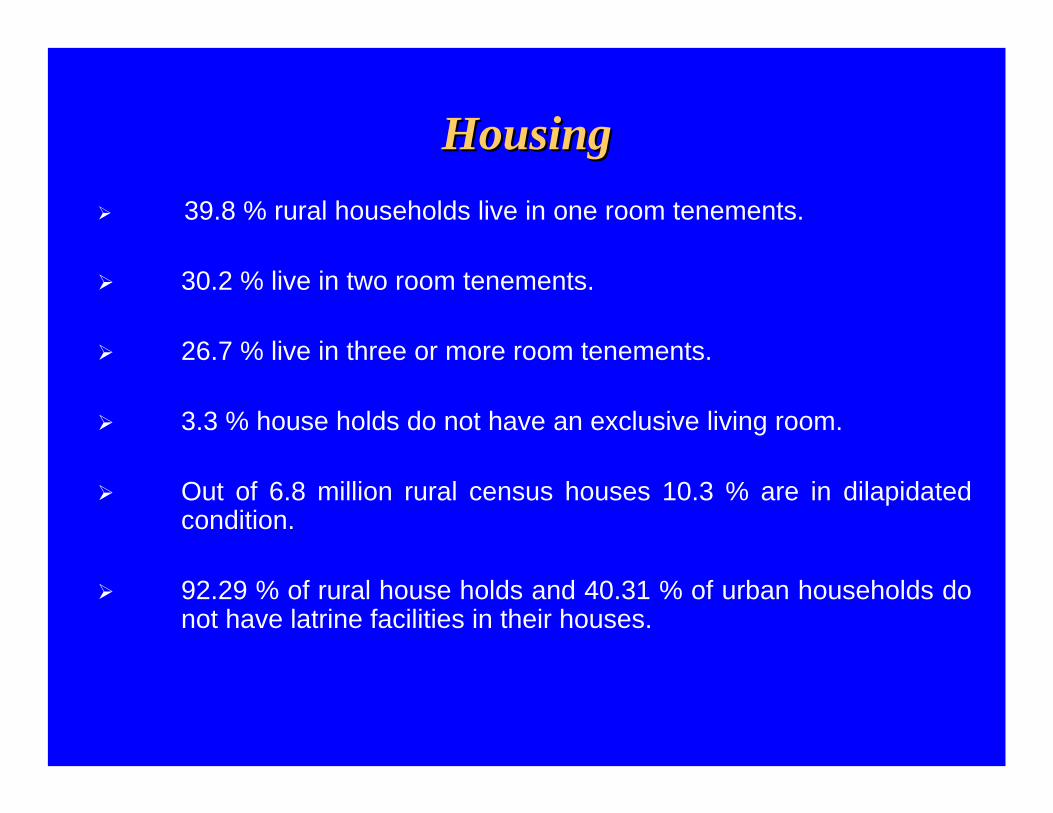
HousingHousing39.8 % rural households live in one room tenements.
30.2 % live in two room tenements.
26.7 % live in three or more room tenements.
3.3 % house holds do not have an exclusive living room.
Out of 6.8 million rural census houses 10.3 % are in dilapidatedcondition.
92.29 % of rural house holds and 40.31 % of urban households do not have latrine facilities in their houses.
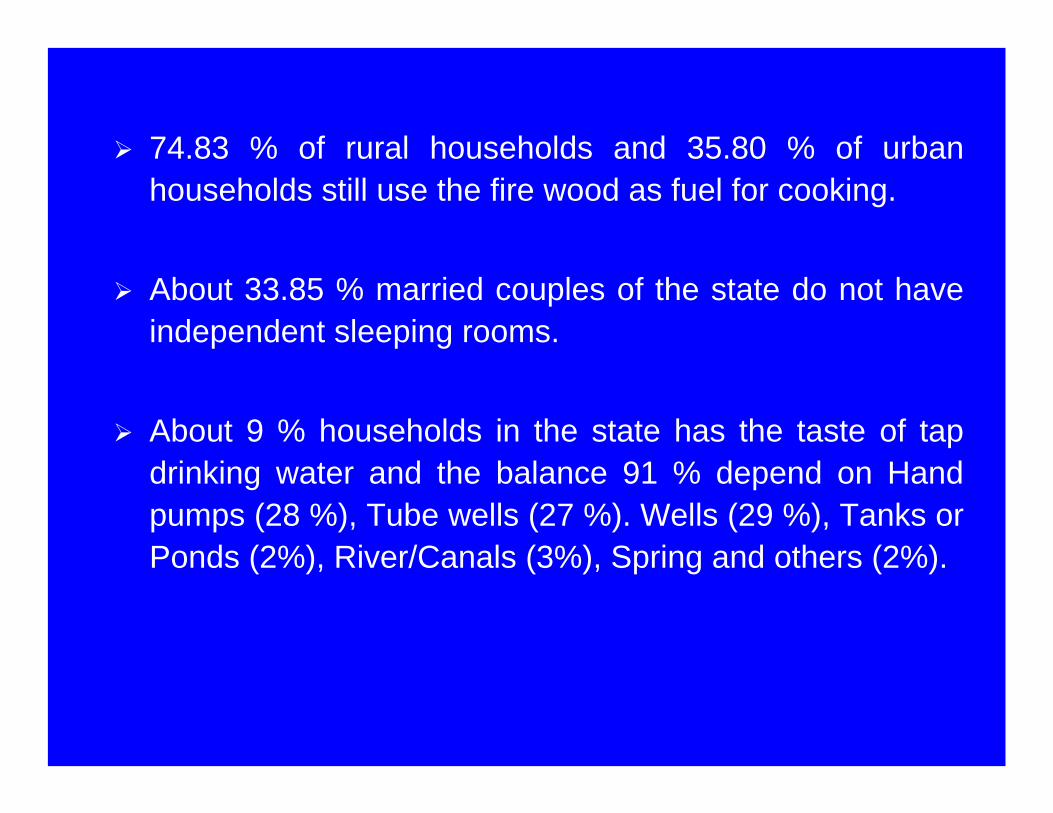
74.83 % of rural households and 35.80 % of urban households still use the fire wood as fuel for cooking.
About 33.85 % married couples of the state do not have independent sleeping rooms.
About 9 % households in the state has the taste of tap drinking water and the balance 91 % depend on Hand pumps (28 %), Tube wells (27 %). Wells (29 %), Tanks or Ponds (2%), River/Canals (3%), Spring and others (2%).
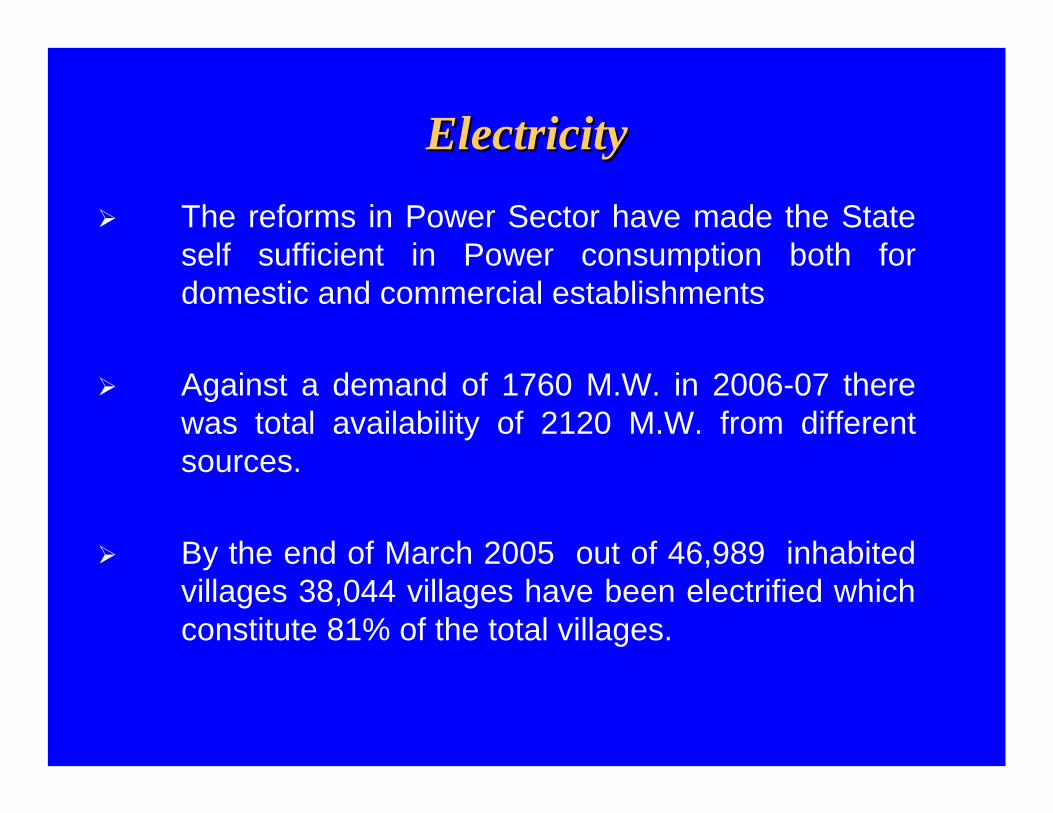
ElectricityElectricityThe reforms in Power Sector have made the State self sufficient in Power consumption both for domestic and commercial establishments
Against a demand of 1760 M.W. in 2006-07 there was total availability of 2120 M.W. from different sources.
By the end of March 2005 out of 46,989 inhabited villages 38,044 villages have been electrified which constitute 81% of the total villages.
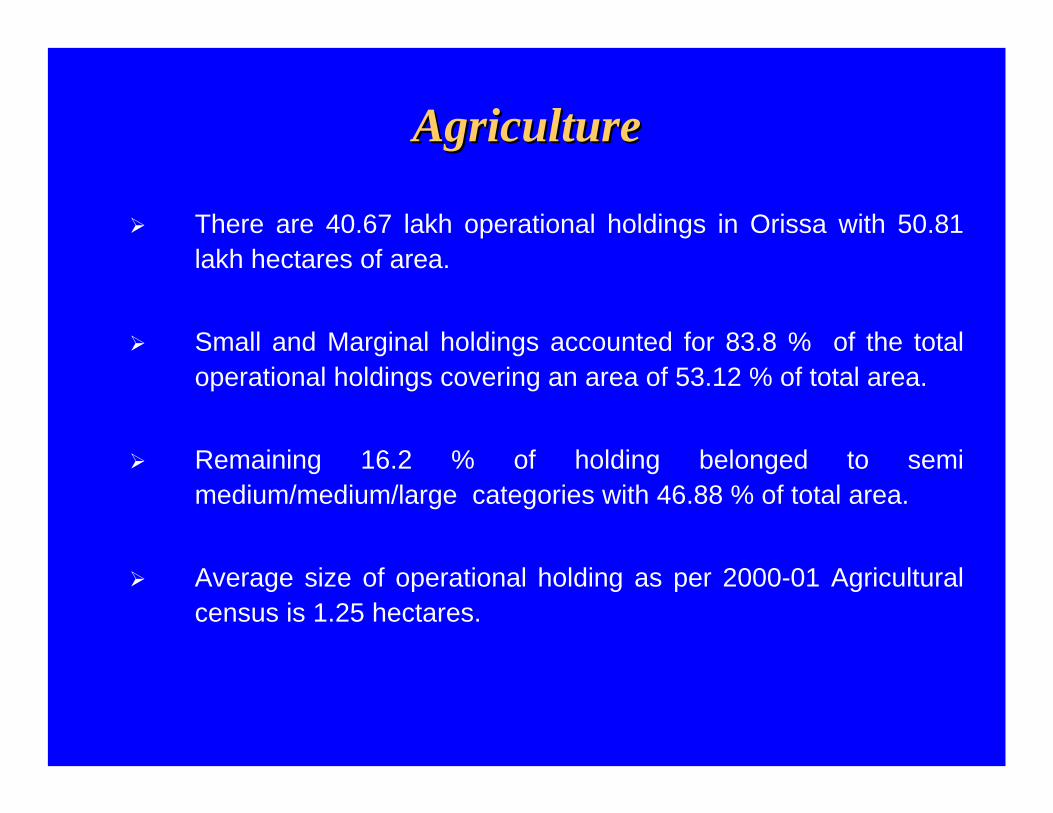
AgricultureAgriculture
There are 40.67 lakh operational holdings in Orissa with 50.81 lakh hectares of area.
Small and Marginal holdings accounted for 83.8 % of the total operational holdings covering an area of 53.12 % of total area.
Remaining 16.2 % of holding belonged to semi medium/medium/large categories with 46.88 % of total area.
Average size of operational holding as per 2000-01 Agricultural census is 1.25 hectares.
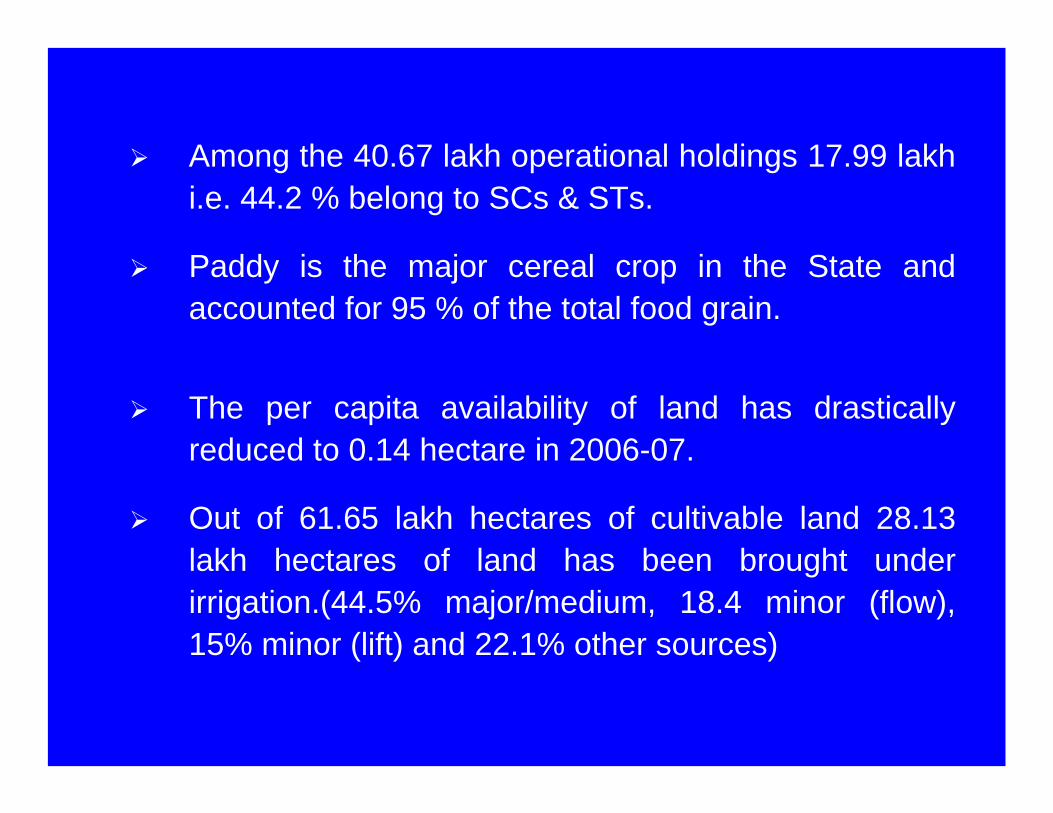
Among the 40.67 lakh operational holdings 17.99 lakh i.e. 44.2 % belong to SCs & STs.
Paddy is the major cereal crop in the State and accounted for 95 % of the total food grain.
The per capita availability of land has drastically reduced to 0.14 hectare in 2006-07.
Out of 61.65 lakh hectares of cultivable land 28.13 lakh hectares of land has been brought under irrigation.(44.5% major/medium, 18.4 minor (flow), 15% minor (lift) and 22.1% other sources)
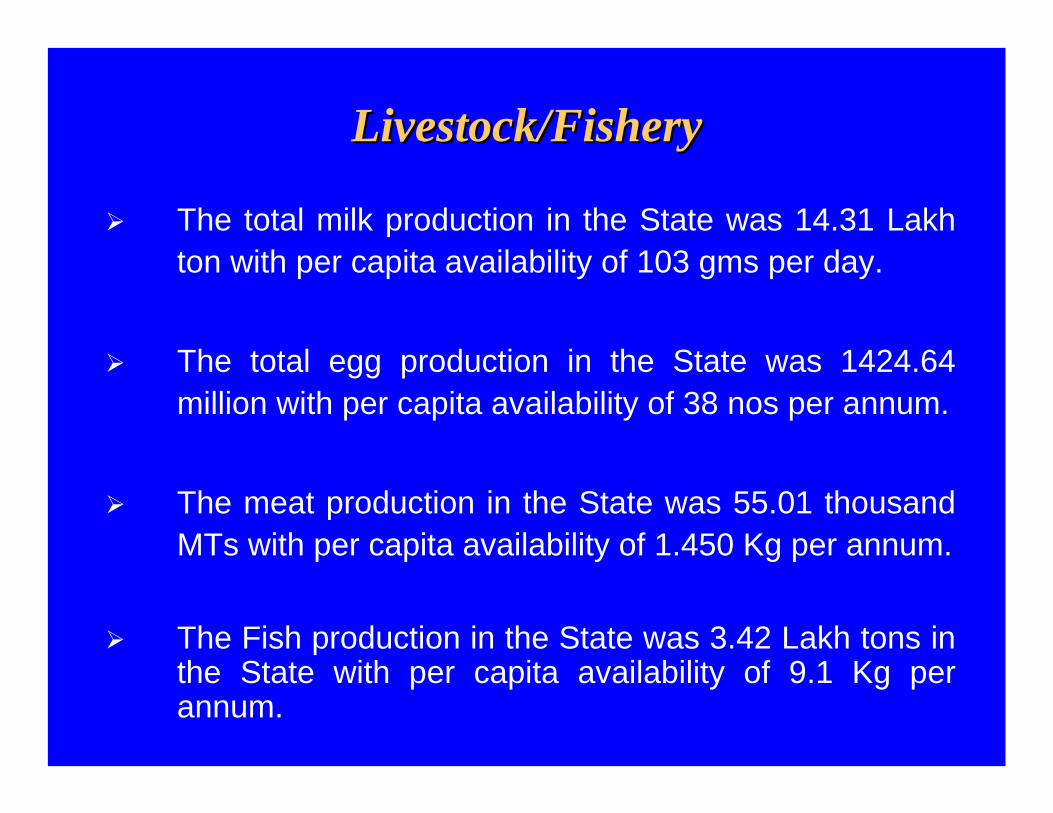
Livestock/FisheryLivestock/Fishery
The total milk production in the State was 14.31 Lakh ton with per capita availability of 103 gms per day.
The total egg production in the State was 1424.64 million with per capita availability of 38 nos per annum.
The meat production in the State was 55.01 thousand MTs with per capita availability of 1.450 Kg per annum.
The Fish production in the State was 3.42 Lakh tons in the State with per capita availability of 9.1 Kg per annum.
TourismTourism
During 2006-07 54.16 lakh tourists visited our State. Out of them 0.39 lakh (0.73%) were foreign tourists.
In Orissa about 92206 persons are directly and 276618 are indirectly engaged in tourism sector.
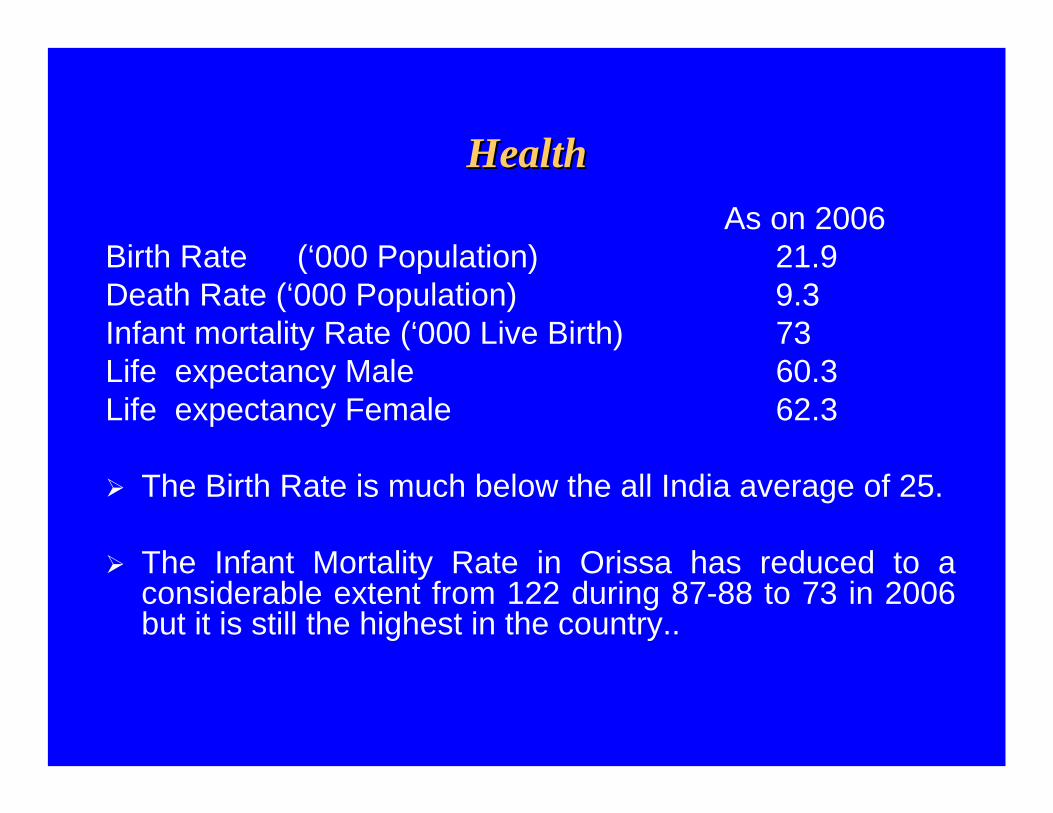
HealthHealthAs on 2006
Birth Rate (‘000 Population) 21.9Death Rate (‘000 Population) 9.3Infant mortality Rate (‘000 Live Birth) 73Life expectancy Male 60.3Life expectancy Female 62.3
The Birth Rate is much below the all India average of 25.
The Infant Mortality Rate in Orissa has reduced to a considerable extent from 122 during 87-88 to 73 in 2006 but it is still the highest in the country..
23,030 persons are served per Medical Institution by the end of 2006.
On an average one Medical Institution is available over an area of 92 Sq. Km.
There is a net work of 1704 Allopathic Medical Institution in the State with 14166 hospital beds.
There are 1188 Homoeopathic/ Ayurvedic/ Unani Medical Institution in the State with 383 hospital beds.
EducationEducationThere are 46722 primary schools with 44.85 lakh children enrolled and taught by 1.14 lakh teachers.
There are 16403 Upper Primary Schools with 18.17 Lakh children enrolled and taught by 0.36 lakh teachers.
There are 7408 High Schools with 13.52 lakh enrolment and 0.62 lakh teachers.
Thus during 2006-07 there was one School in every 3.3 sq Km area with the teacher pupil ratio of 1:36.
The higher education facility in the State is increasing rapidly due to growing participation of private sector in the field of education
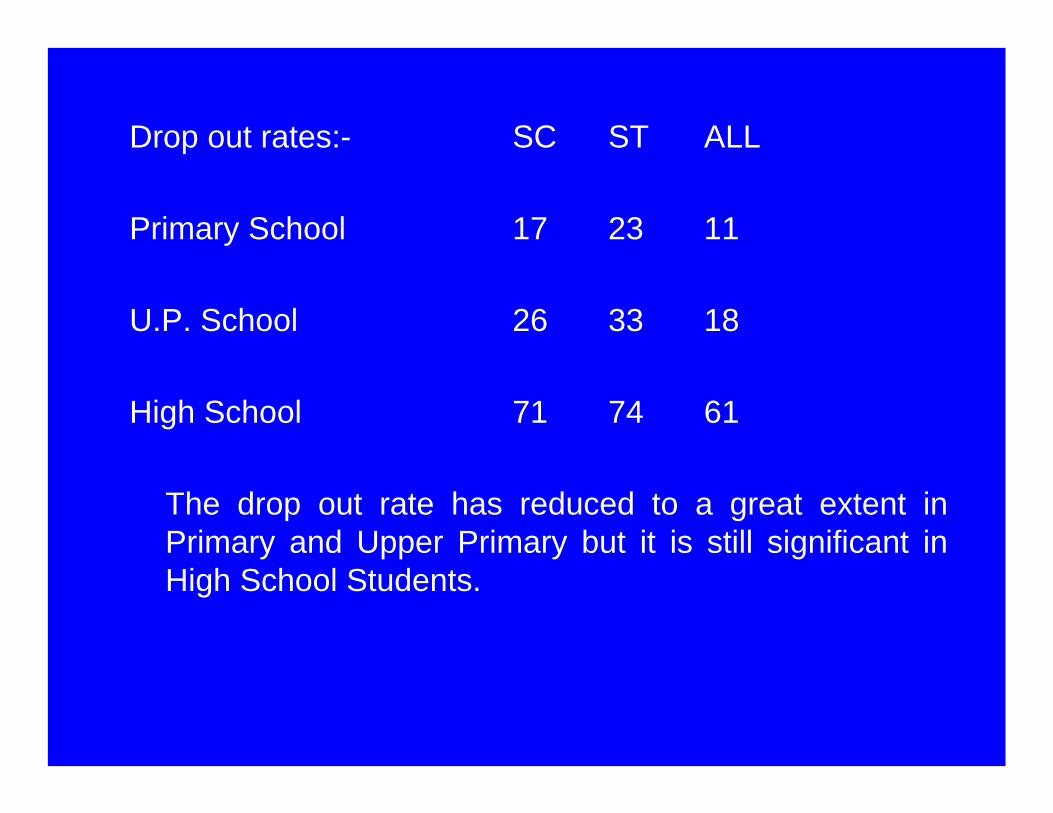
Drop out rates:- SC ST ALL
Primary School 17 23 11
U.P. School 26 33 18
High School 71 74 61
The drop out rate has reduced to a great extent in Primary and Upper Primary but it is still significant in High School Students.
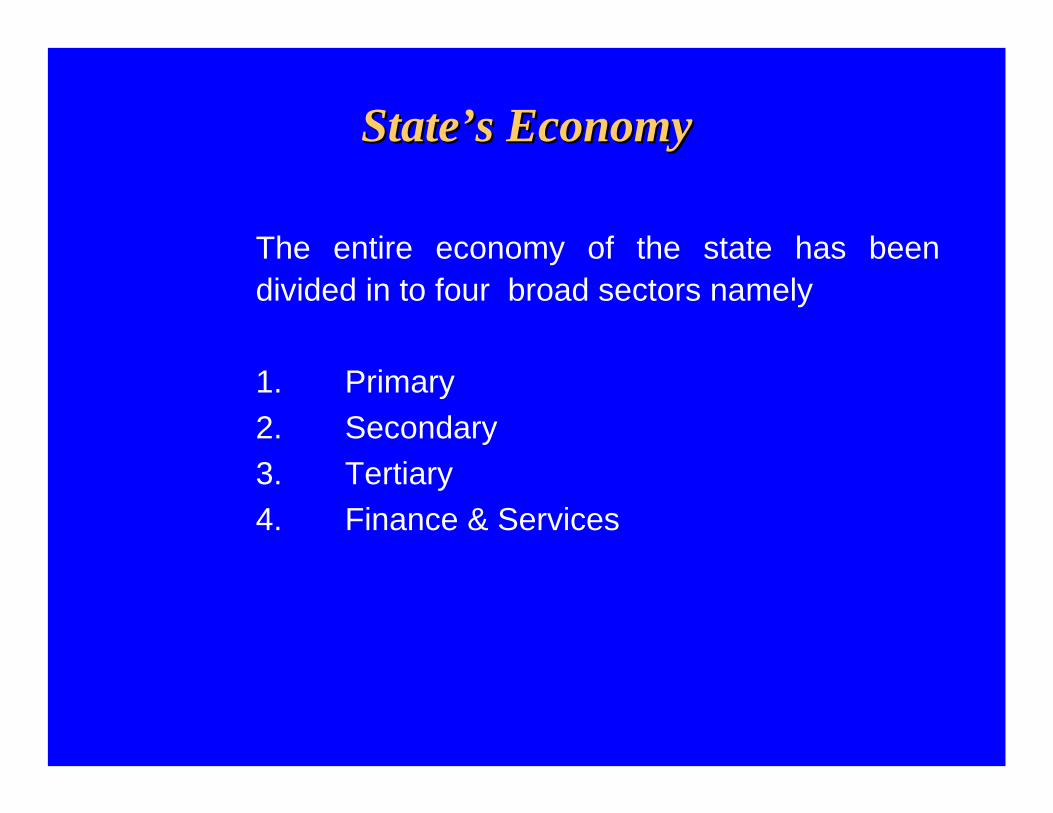
The entire economy of the state has been divided in to four broad sectors namely
1. Primary2. Secondary3. Tertiary4. Finance & Services
StateState’’s Economys Economy
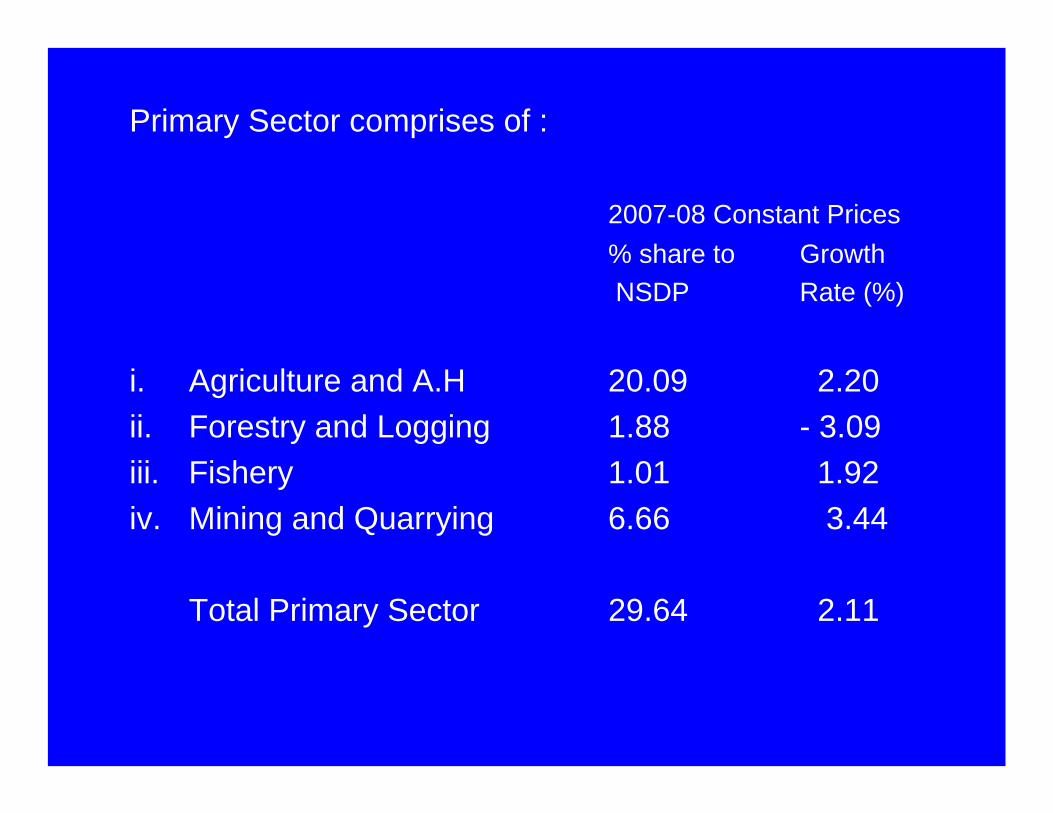
Primary Sector comprises of :
2007-08 Constant Prices% share to GrowthNSDP Rate (%)
i. Agriculture and A.H 20.09 2.20ii. Forestry and Logging 1.88 - 3.09iii. Fishery 1.01 1.92iv. Mining and Quarrying 6.66 3.44
Total Primary Sector 29.64 2.11
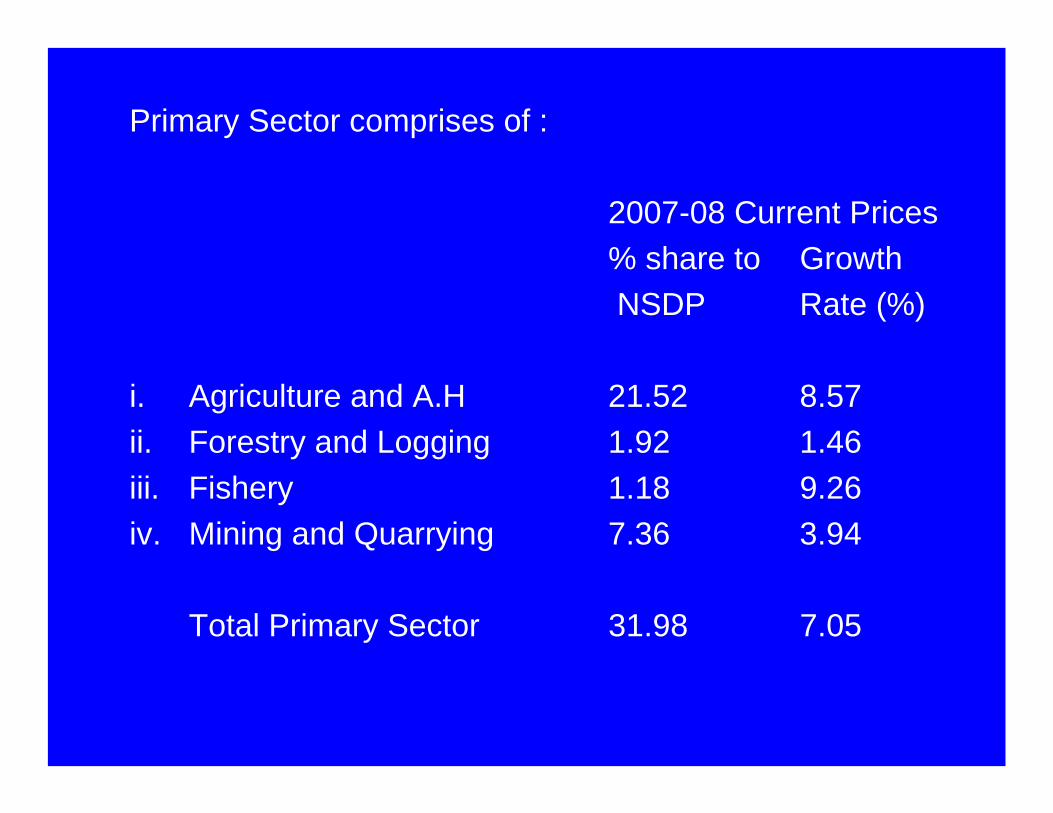
Primary Sector comprises of :
2007-08 Current Prices% share to GrowthNSDP Rate (%)
i. Agriculture and A.H 21.52 8.57ii. Forestry and Logging 1.92 1.46iii. Fishery 1.18 9.26iv. Mining and Quarrying 7.36 3.94
Total Primary Sector 31.98 7.05
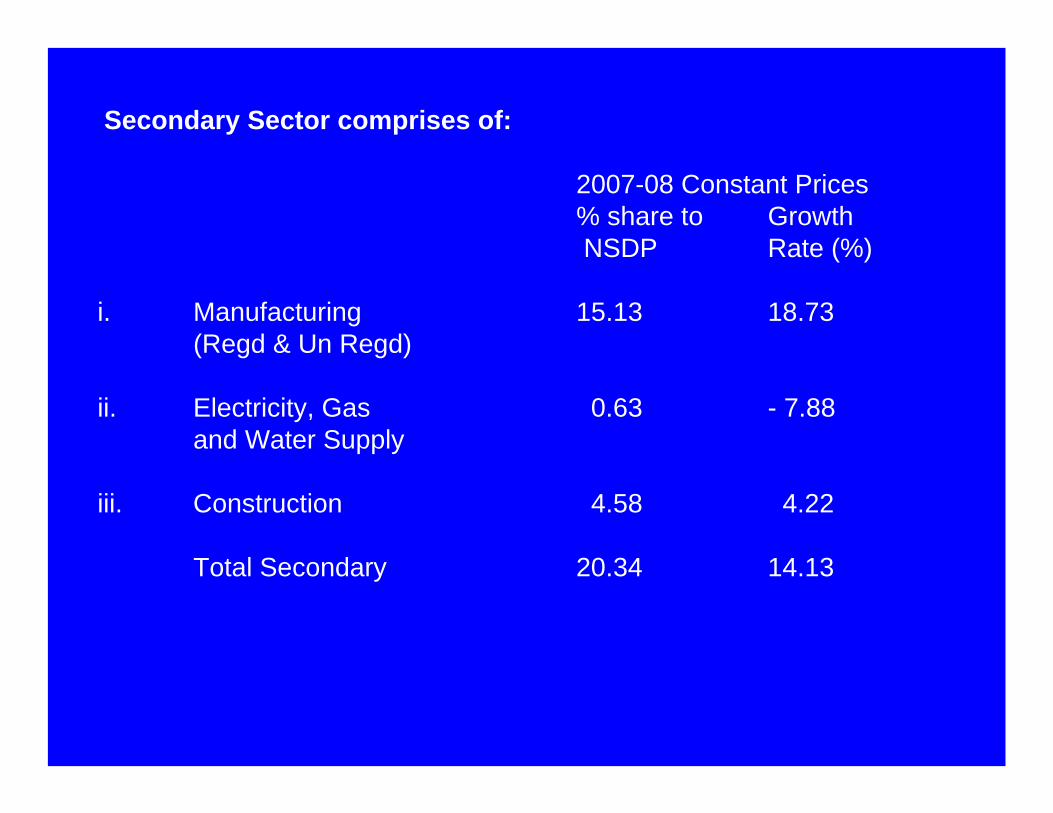
Secondary Sector comprises of:
2007-08 Constant Prices% share to GrowthNSDP Rate (%)
i. Manufacturing 15.13 18.73(Regd & Un Regd)
ii. Electricity, Gas 0.63 - 7.88and Water Supply
iii. Construction 4.58 4.22
Total Secondary 20.34 14.13
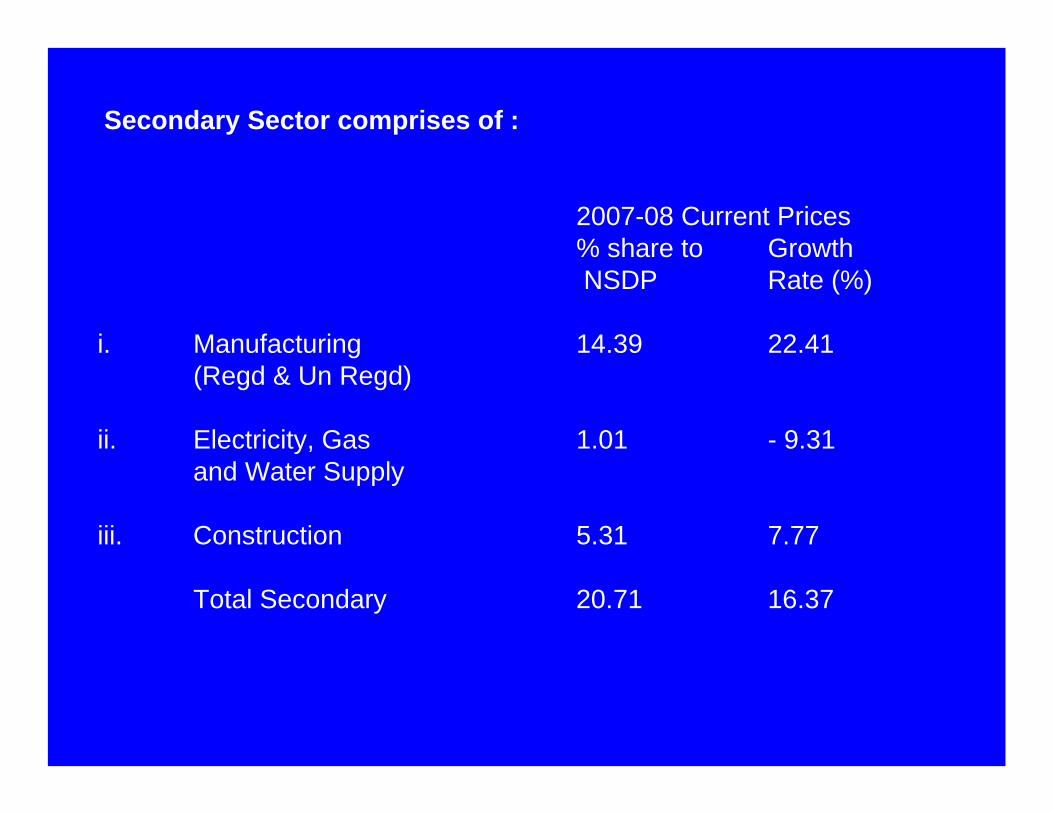
Secondary Sector comprises of :
2007-08 Current Prices% share to GrowthNSDP Rate (%)
i. Manufacturing 14.39 22.41(Regd & Un Regd)
ii. Electricity, Gas 1.01 - 9.31and Water Supply
iii. Construction 5.31 7.77
Total Secondary 20.71 16.37
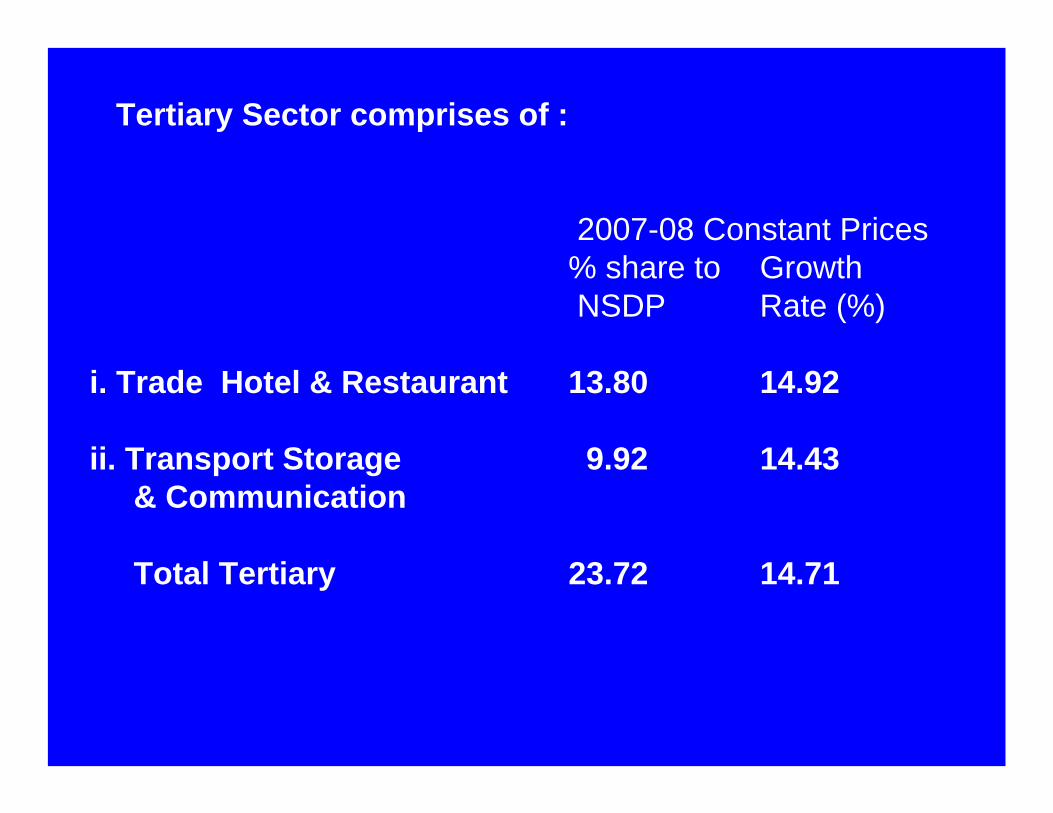
Tertiary Sector comprises of :
2007-08 Constant Prices% share to GrowthNSDP Rate (%)
i. Trade Hotel & Restaurant 13.80 14.92
ii. Transport Storage 9.92 14.43& Communication
Total Tertiary 23.72 14.71
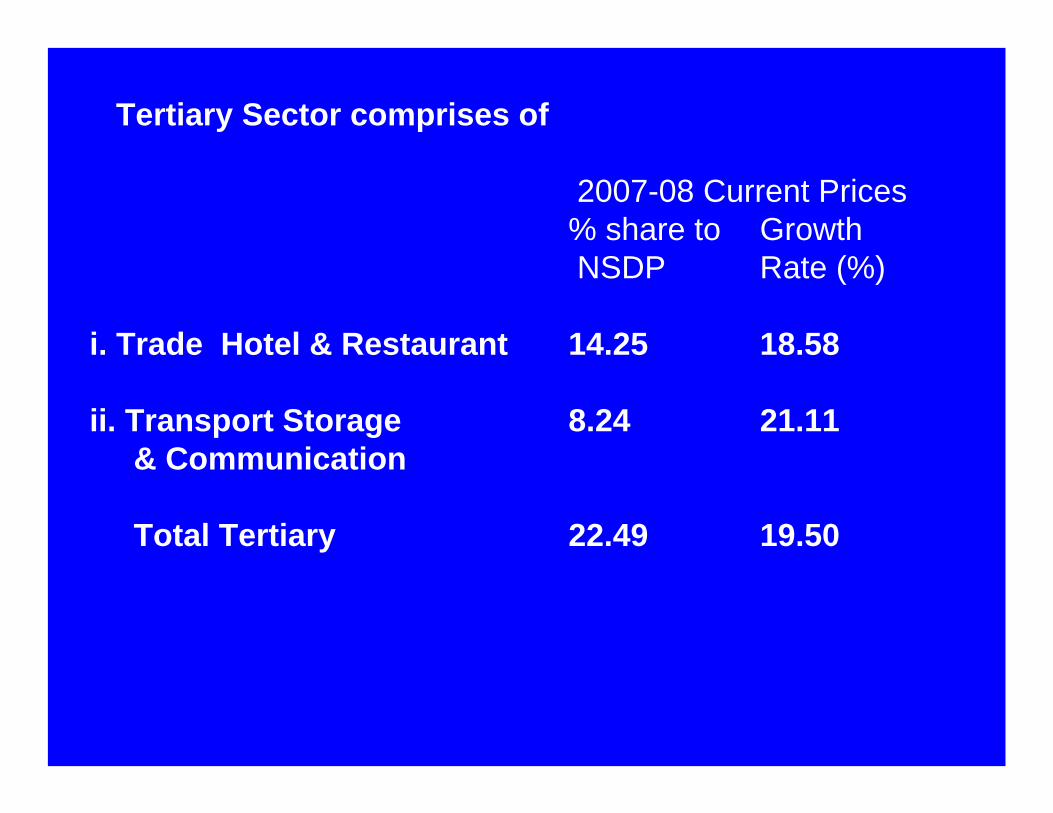
Tertiary Sector comprises of
2007-08 Current Prices% share to GrowthNSDP Rate (%)
i. Trade Hotel & Restaurant 14.25 18.58
ii. Transport Storage 8.24 21.11& Communication
Total Tertiary 22.49 19.50
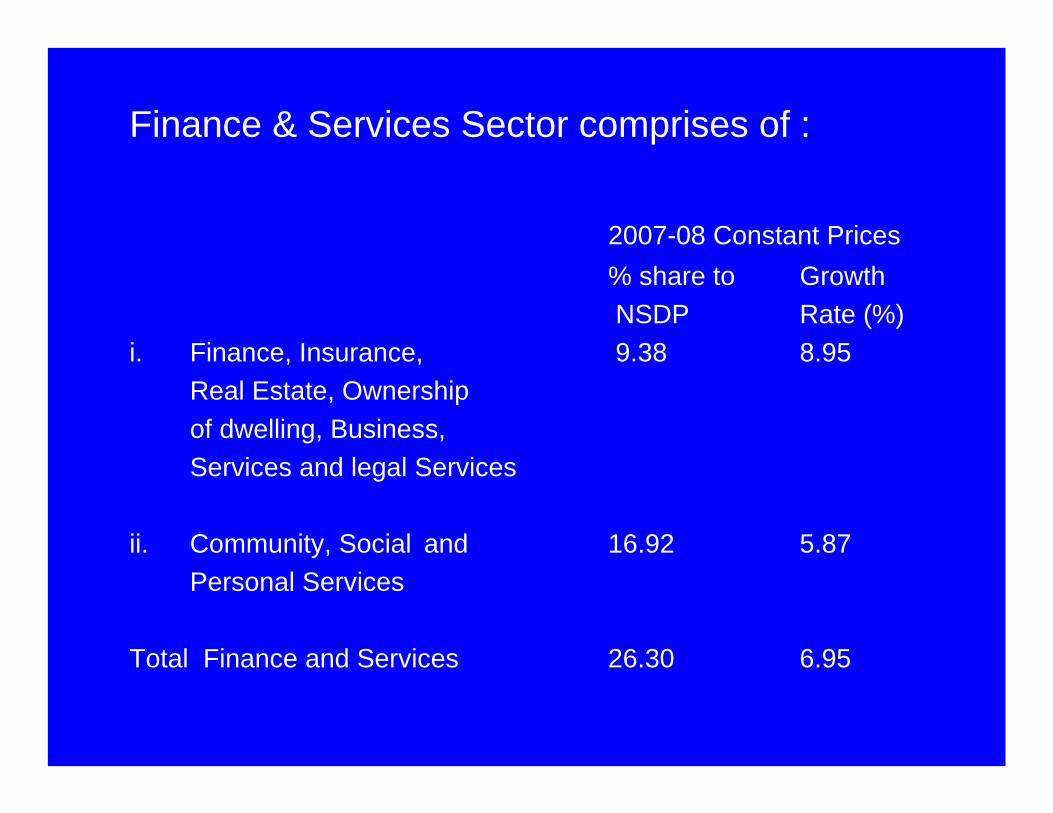
Finance & Services Sector comprises of :
2007-08 Constant Prices% share to GrowthNSDP Rate (%)
i. Finance, Insurance, 9.38 8.95Real Estate, Ownershipof dwelling, Business, Services and legal Services
ii. Community, Social and 16.92 5.87Personal Services
Total Finance and Services 26.30 6.95
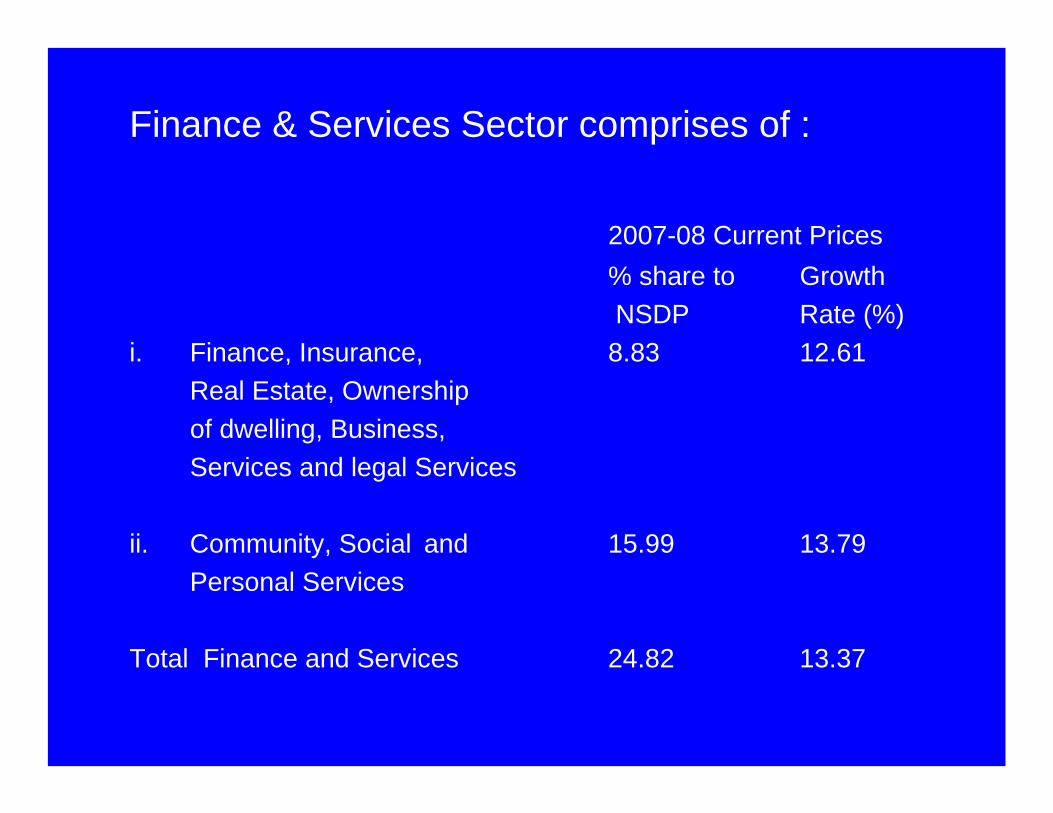
Finance & Services Sector comprises of :
2007-08 Current Prices% share to GrowthNSDP Rate (%)
i. Finance, Insurance, 8.83 12.61Real Estate, Ownershipof dwelling, Business, Services and legal Services
ii. Community, Social and 15.99 13.79Personal Services
Total Finance and Services 24.82 13.37
The estimates of Gross State Domestic product (GSDP) and Net State Domestic product (NSDP) both at current and constant prices are calculated annually by adopting Income Origination method instead of Income Accrual method.Income Accrual method is not adopted for SDP as
States do not have closed economy
Mechanism for measure of inflow & outflow of goods & services are not available.
State Level Estimates of income from Supra Regional Sectors such as Railway, Communication, Banking & Insurance, Central Govt. Administration etc are not available. This however is collected through CSO.
Orissa has a predominantly agrarian economy. The contribution of the primary sector to the Net State Domestic Product (NSDP) is significantly high compared to other sectors.
The contribution of Primary Sector to NSDP is around 30%, that of Secondary sector is 20, Tertiary Sector is around 24% and that of Services Sector is 26% during 2007-08.
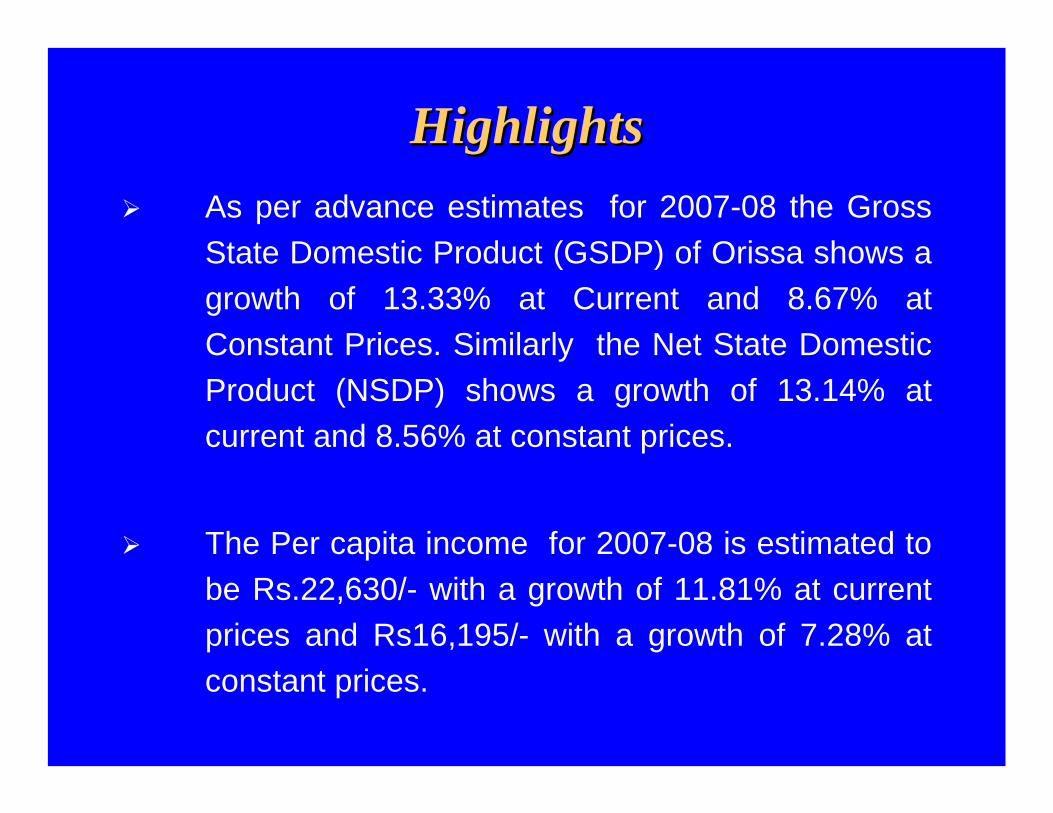
HighlightsHighlightsAs per advance estimates for 2007-08 the Gross State Domestic Product (GSDP) of Orissa shows a growth of 13.33% at Current and 8.67% at Constant Prices. Similarly the Net State Domestic Product (NSDP) shows a growth of 13.14% at current and 8.56% at constant prices.
The Per capita income for 2007-08 is estimated to be Rs.22,630/- with a growth of 11.81% at current prices and Rs16,195/- with a growth of 7.28% at constant prices.
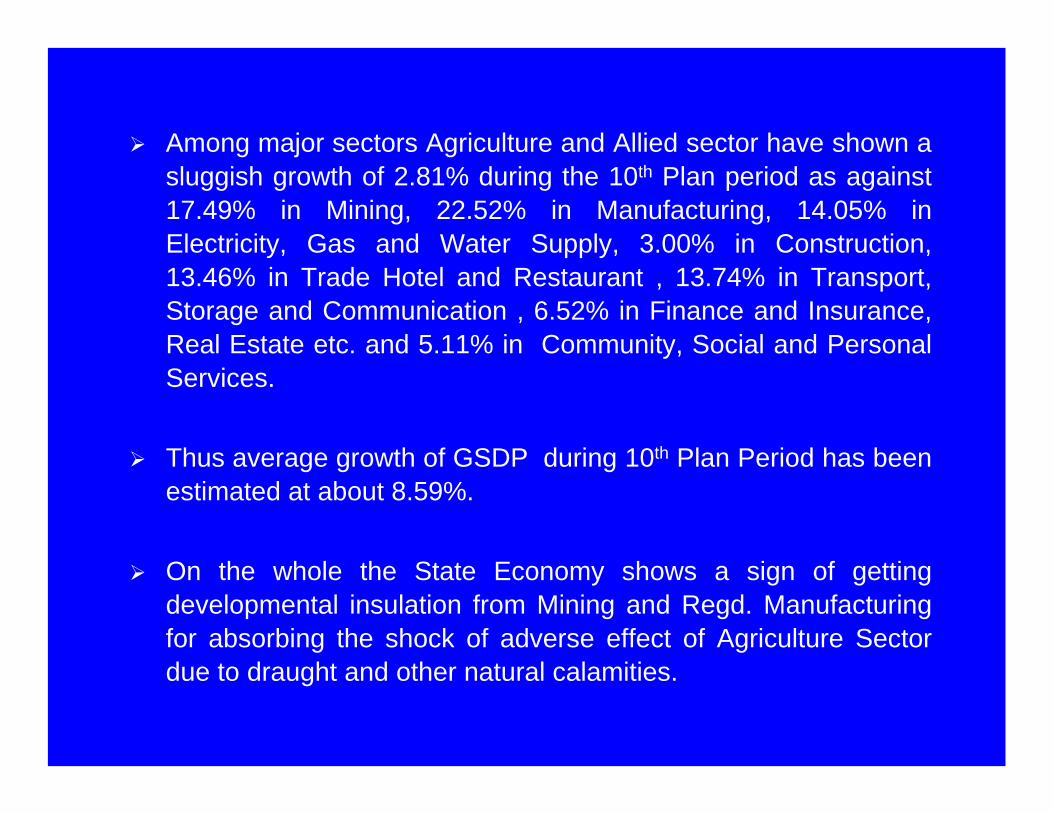
Among major sectors Agriculture and Allied sector have shown a sluggish growth of 2.81% during the 10th Plan period as against 17.49% in Mining, 22.52% in Manufacturing, 14.05% in Electricity, Gas and Water Supply, 3.00% in Construction, 13.46% in Trade Hotel and Restaurant , 13.74% in Transport, Storage and Communication , 6.52% in Finance and Insurance, Real Estate etc. and 5.11% in Community, Social and Personal Services.
Thus average growth of GSDP during 10th Plan Period has been estimated at about 8.59%.
On the whole the State Economy shows a sign of getting developmental insulation from Mining and Regd. Manufacturing for absorbing the shock of adverse effect of Agriculture Sector due to draught and other natural calamities.
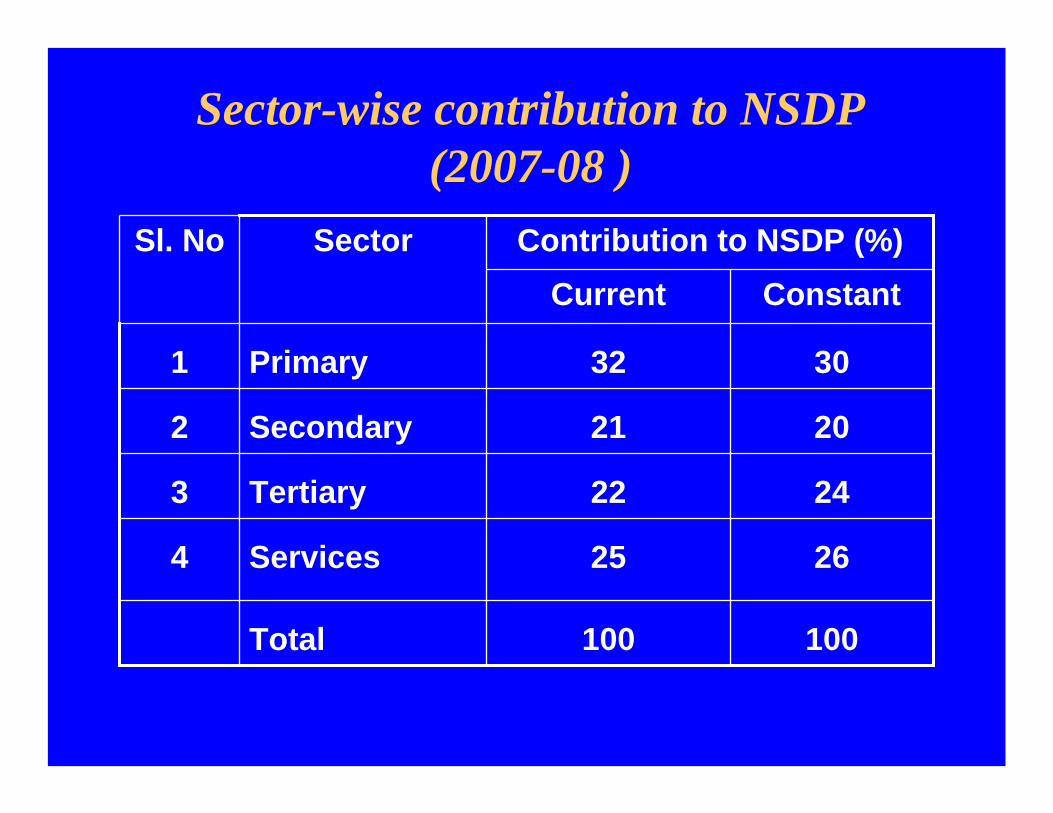
Sector-wise contribution to NSDP(2007-08 )
100100Total
2625Services4
2422Tertiary3
2021Secondary2
3032Primary1
ConstantCurrentContribution to NSDP (%)SectorSl. No
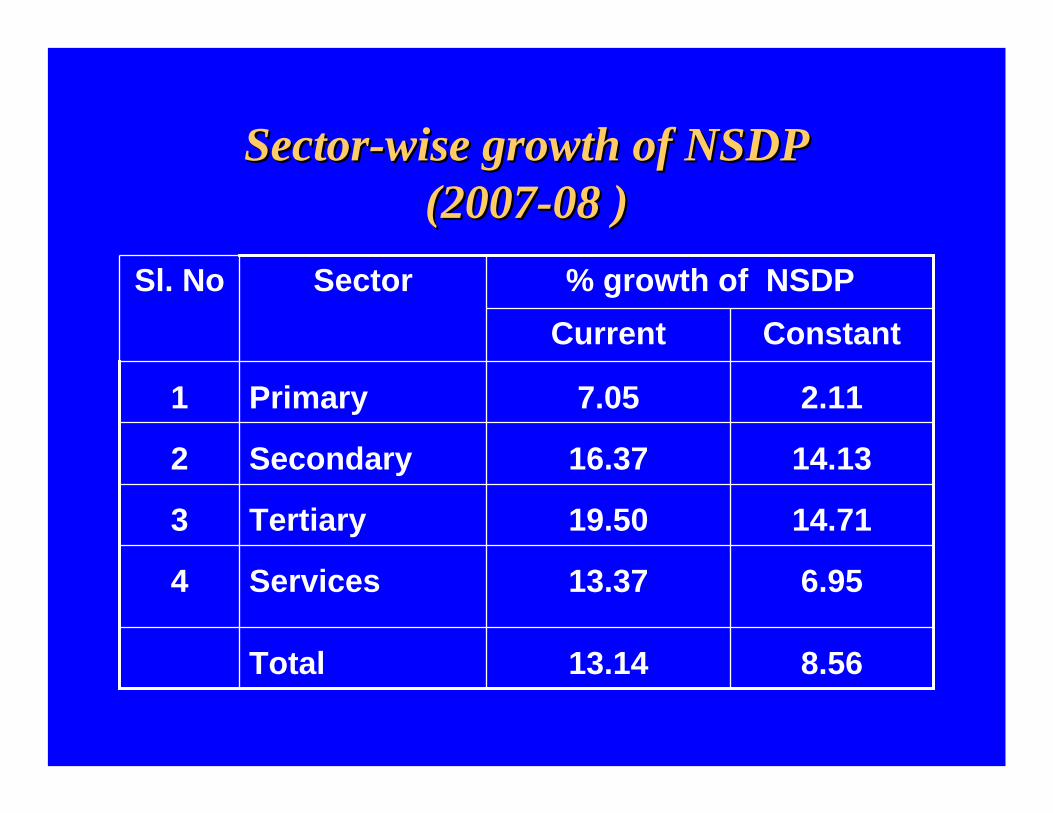
SectorSector--wise growth of NSDPwise growth of NSDP(2007(2007--08 )08 )
8.5613.14Total
6.9513.37Services4
14.7119.50Tertiary3
14.1316.37Secondary2
2.117.05Primary1
ConstantCurrent% growth of NSDPSectorSl. No
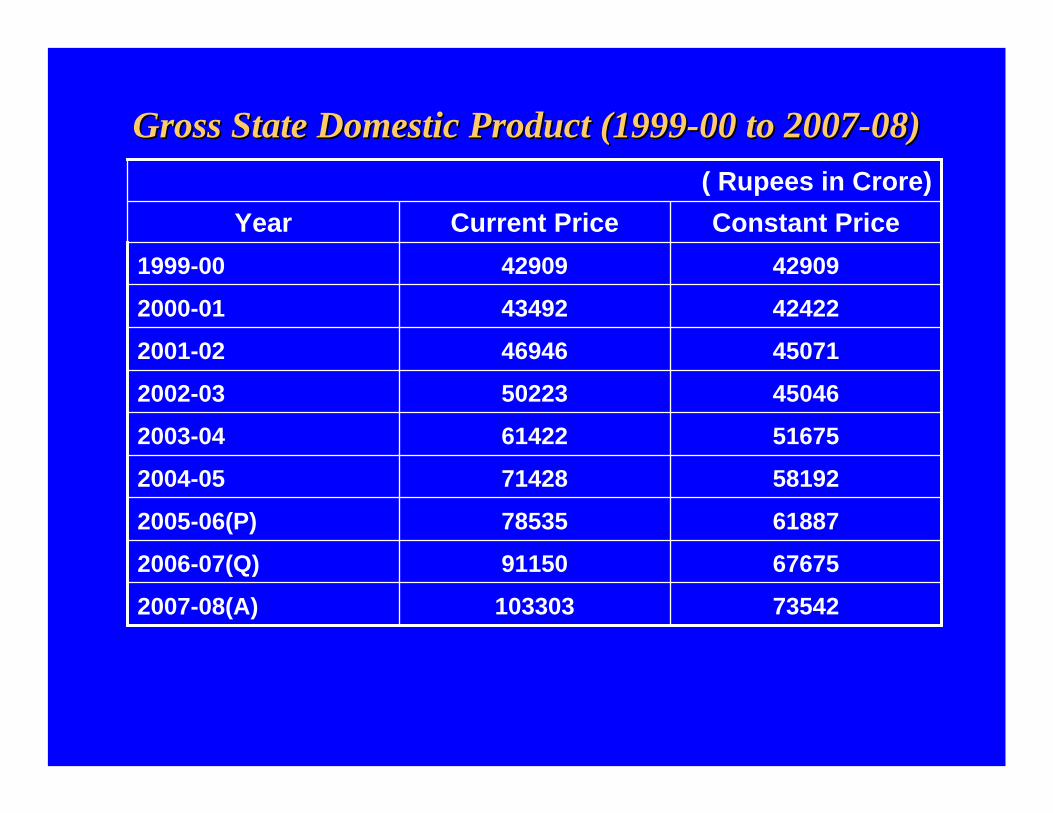
Gross State Domestic Product (1999Gross State Domestic Product (1999--00 to 200700 to 2007--08)08)
67675911502006-07(Q)
61887785352005-06(P)
735421033032007-08(A)
( Rupees in Crore)
58192714282004-05
51675614222003-04
45046502232002-03
45071469462001-02
42422434922000-01
42909429091999-00
Constant PriceCurrent PriceYear
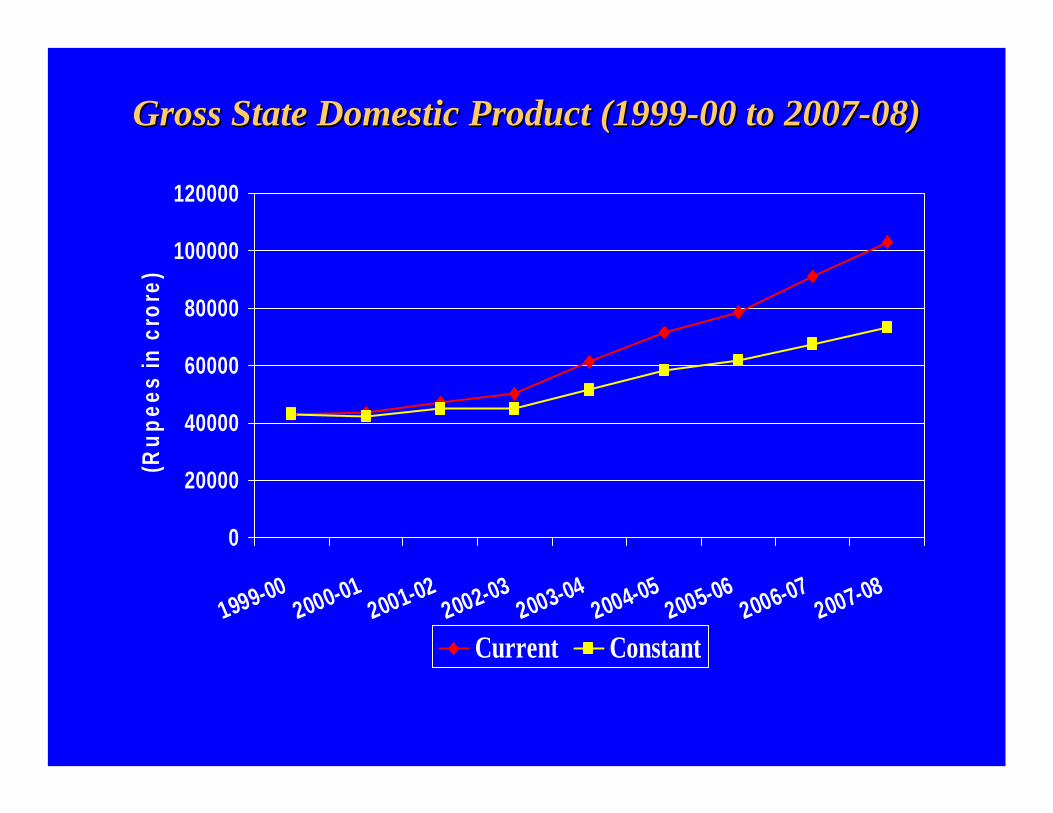
Gross State Domestic Product (1999Gross State Domestic Product (1999--00 to 200700 to 2007--08)08)
0
20000
40000
60000
80000
100000
120000
1999-002000-01
2001-022002-03
2003-042004-05
2005-062006-07
2007-08
(Rup
ees
in c
rore
)
Current Constant
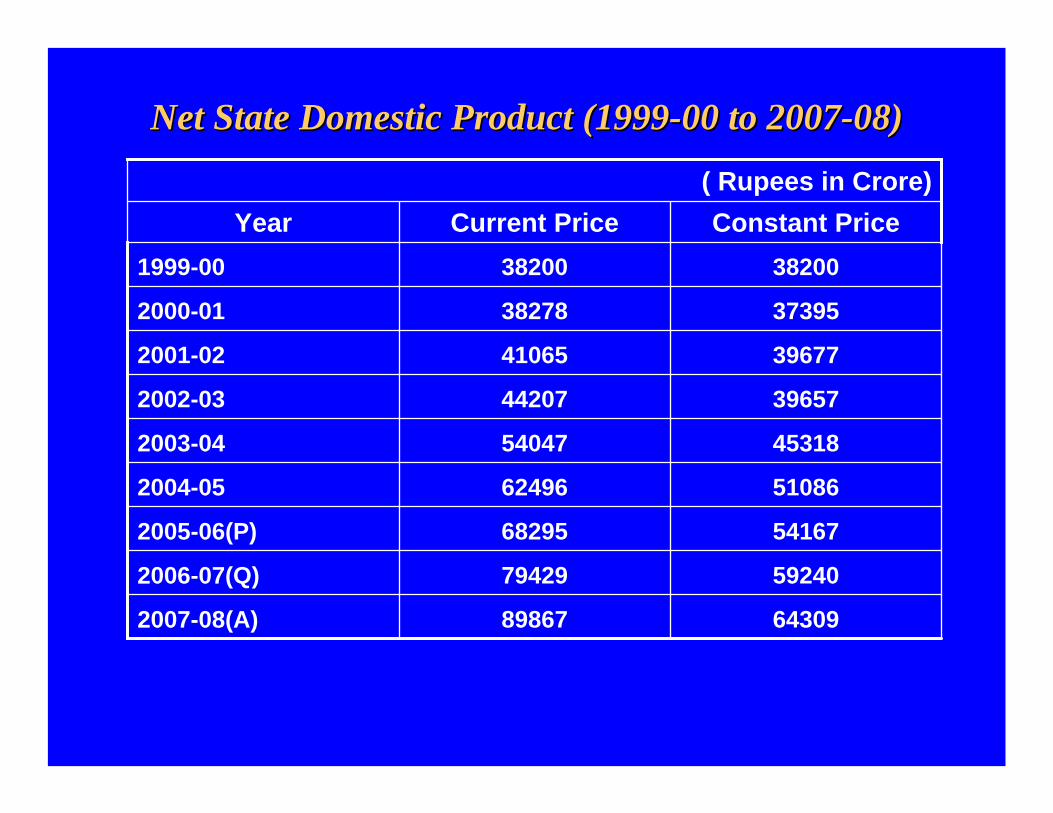
Net State Domestic Product (1999Net State Domestic Product (1999--00 to 200700 to 2007--08)08)
59240794292006-07(Q)
54167682952005-06(P)
64309898672007-08(A)
( Rupees in Crore)
51086624962004-05
45318540472003-04
39657442072002-03
39677410652001-02
37395382782000-01
38200382001999-00
Constant PriceCurrent PriceYear
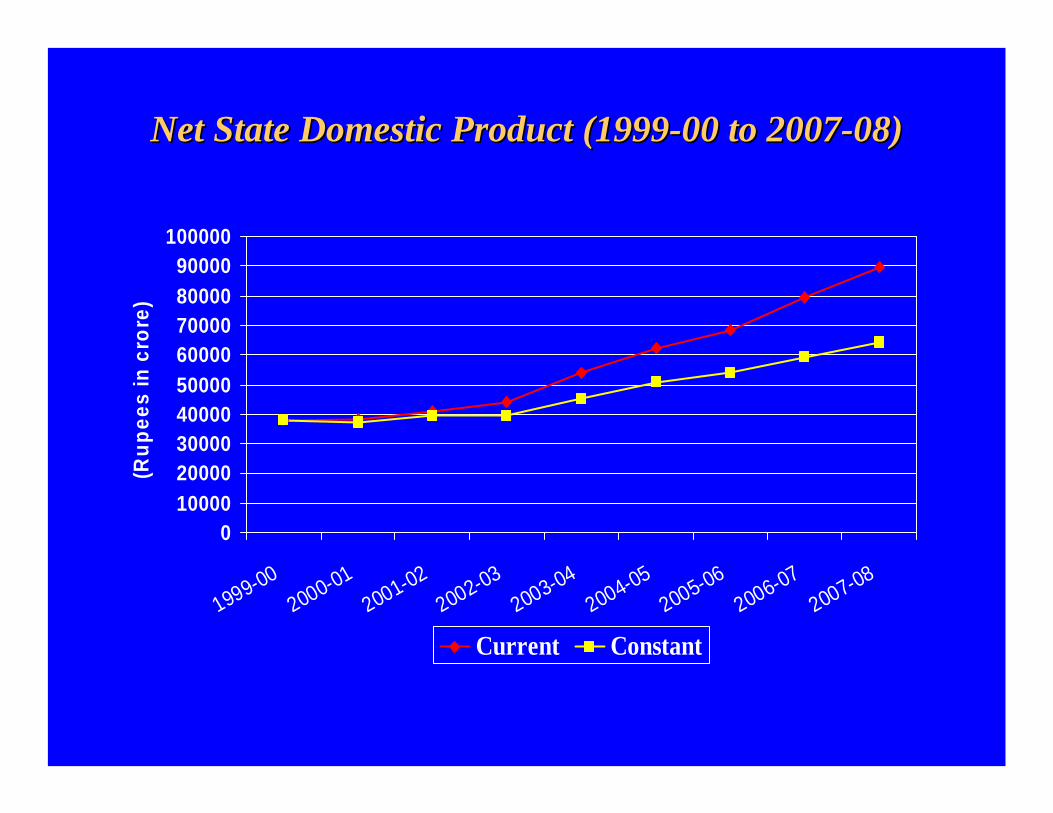
Net State Domestic Product (1999Net State Domestic Product (1999--00 to 200700 to 2007--08)08)
0100002000030000400005000060000700008000090000
100000
1999-002000-01
2001-022002-03
2003-042004-05
2005-062006-07
2007-08
(Rup
ees
in c
rore
)
Current Constant
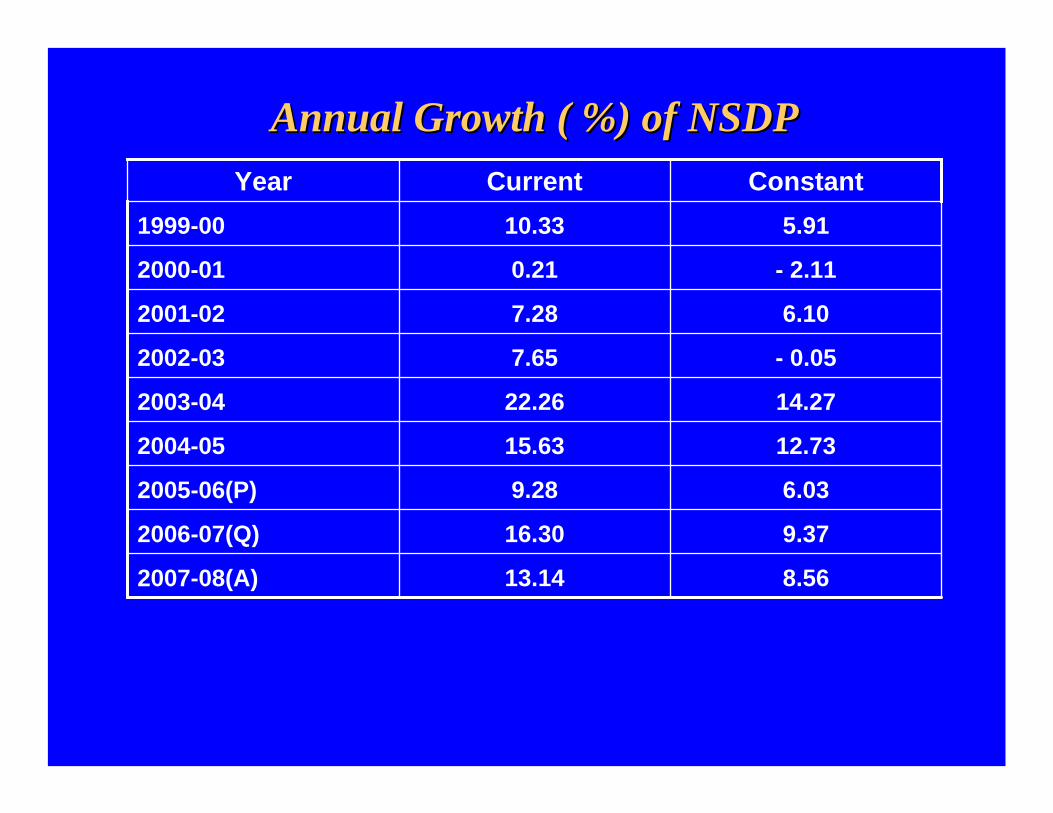
Annual Growth ( %) of NSDPAnnual Growth ( %) of NSDP
9.3716.302006-07(Q)
6.039.282005-06(P)
8.5613.142007-08(A)
12.7315.632004-05
14.2722.262003-04
- 0.057.652002-03
6.107.282001-02
- 2.110.212000-01
5.9110.331999-00
ConstantCurrentYear
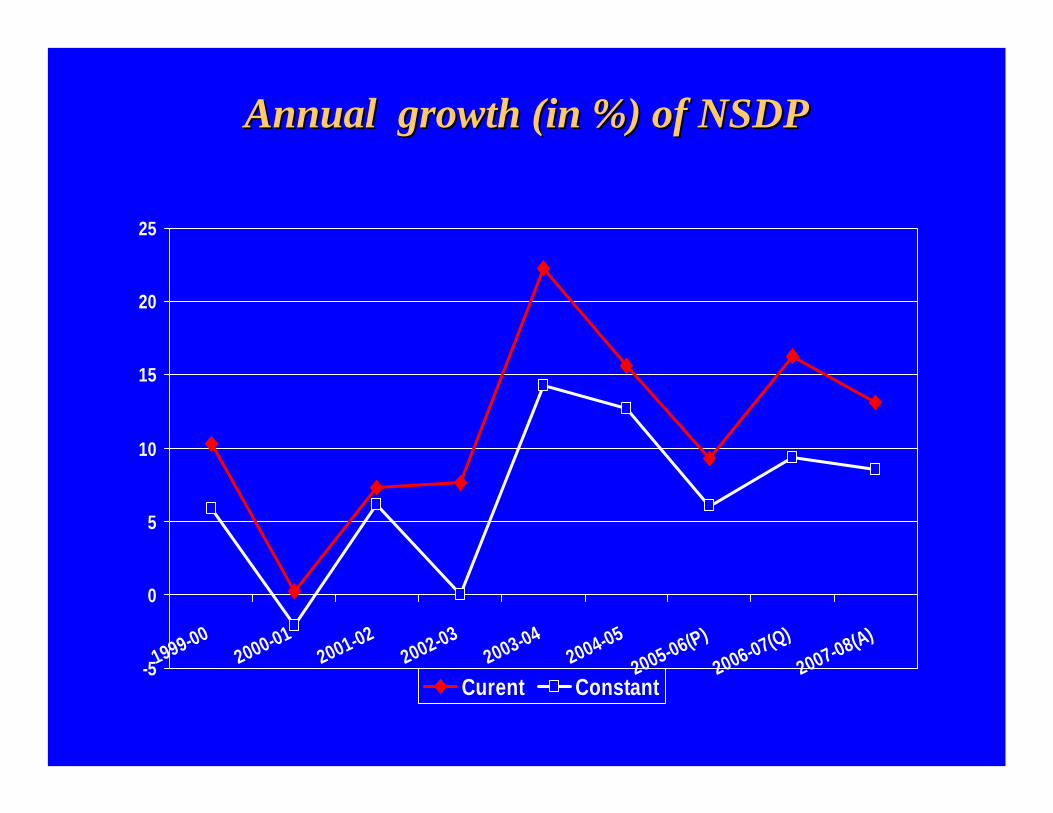
Annual growth (in %) of NSDPAnnual growth (in %) of NSDP
-5
0
5
10
15
20
25
1999-002000-01
2001-022002-03
2003-042004-05
2005-06(P)
2006-07(Q)
2007-08(A)
Curent Constant
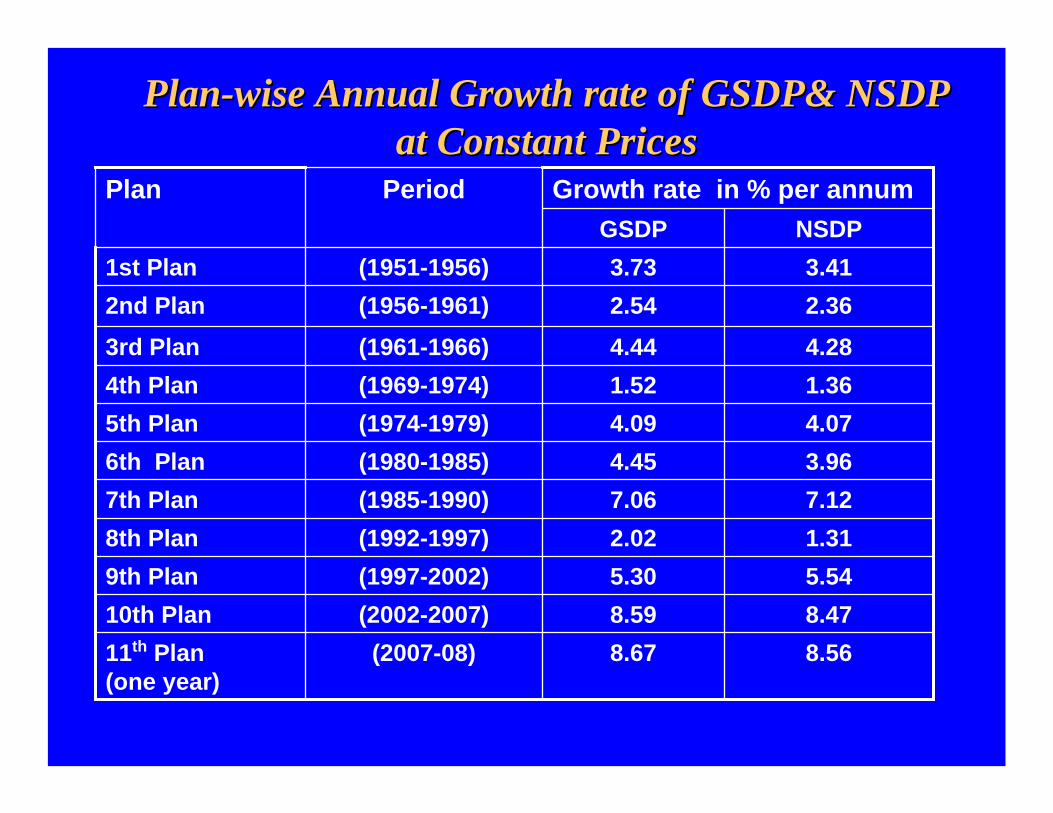
PlanPlan--wise Annual Growth rate of GSDP& NSDP wise Annual Growth rate of GSDP& NSDP at Constant Pricesat Constant Prices
8.478.59(2002-2007)10th Plan 8.568.67(2007-08)11th Plan
(one year)
NSDPGSDP
4.284.44(1961-1966)3rd Plan
5.545.30(1997-2002)9th Plan1.312.02(1992-1997)8th Plan7.127.06(1985-1990)7th Plan3.964.45(1980-1985)6th Plan4.074.09(1974-1979)5th Plan1.361.52(1969-1974)4th Plan
2.362.54(1956-1961)2nd Plan3.413.73(1951-1956)1st Plan
Growth rate in % per annumPeriodPlan
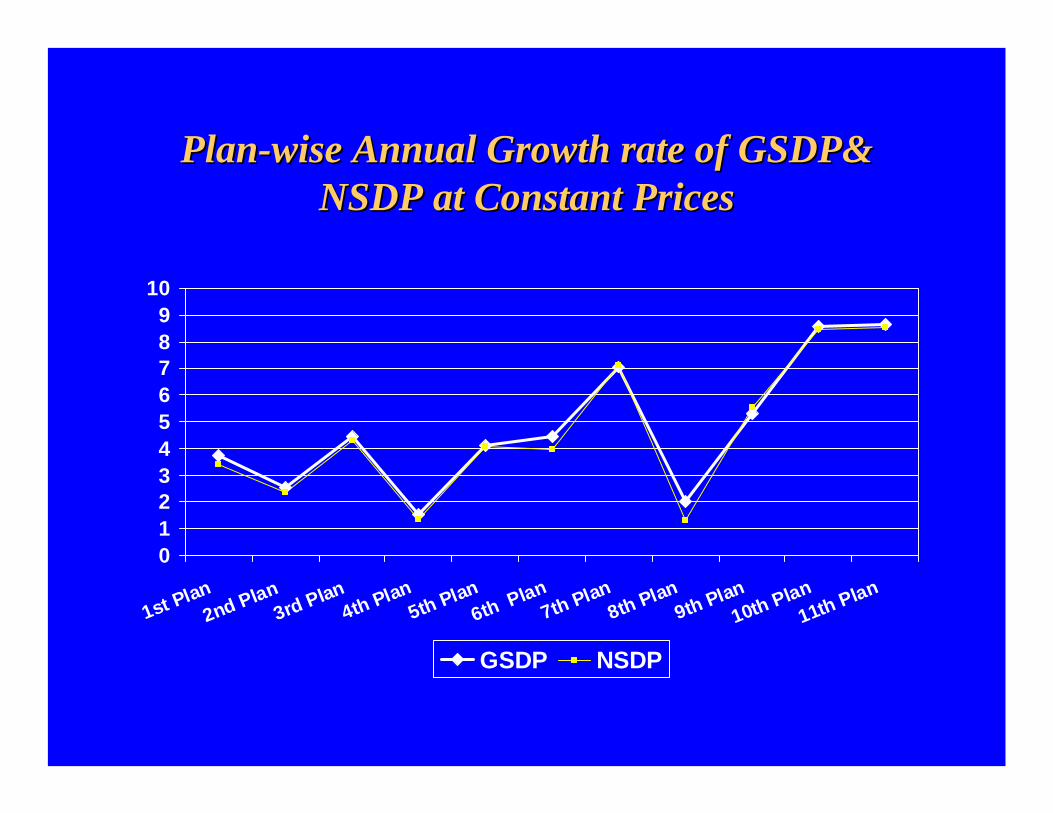
PlanPlan--wise Annual Growth rate of GSDP& wise Annual Growth rate of GSDP& NSDP at Constant PricesNSDP at Constant Prices
0123456789
10
1st Plan 2nd Plan
3rd Plan4th Plan
5th Plan6th Plan
7th Plan8th Plan
9th Plan10th Plan
11th Plan
GSDP NSDP
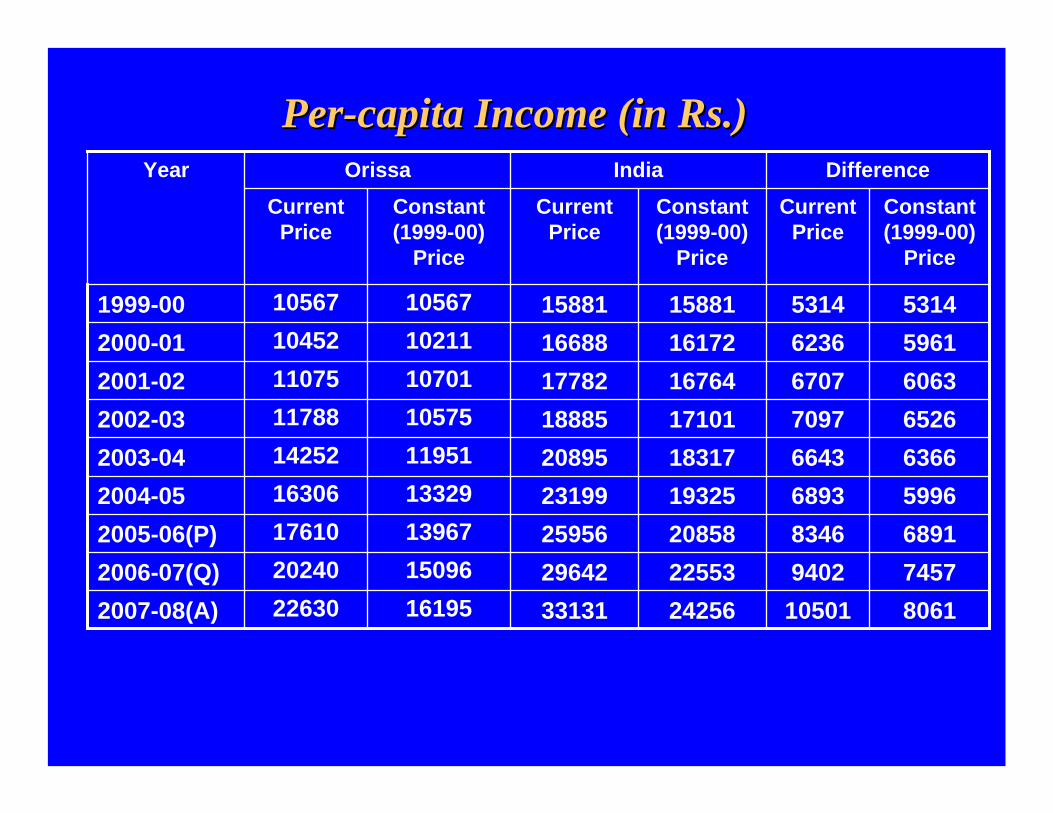
PerPer--capita Income (in Rs.) capita Income (in Rs.)
806174576891599663666526606359615314
Constant (1999-00)
Price
1050194028346689366437097670762365314
Current Price
Difference
242563313116195226302007-08(A)225532964215096202402006-07(Q)208582595613967176102005-06(P)193252319913329163062004-05183172089511951142522003-04171011888510575117882002-03167641778210701110752001-02161721668810211104522000-01158811588110567105671999-00
Constant (1999-00)
Price
Current Price
Constant (1999-00)
Price
Current Price
IndiaOrissaYear
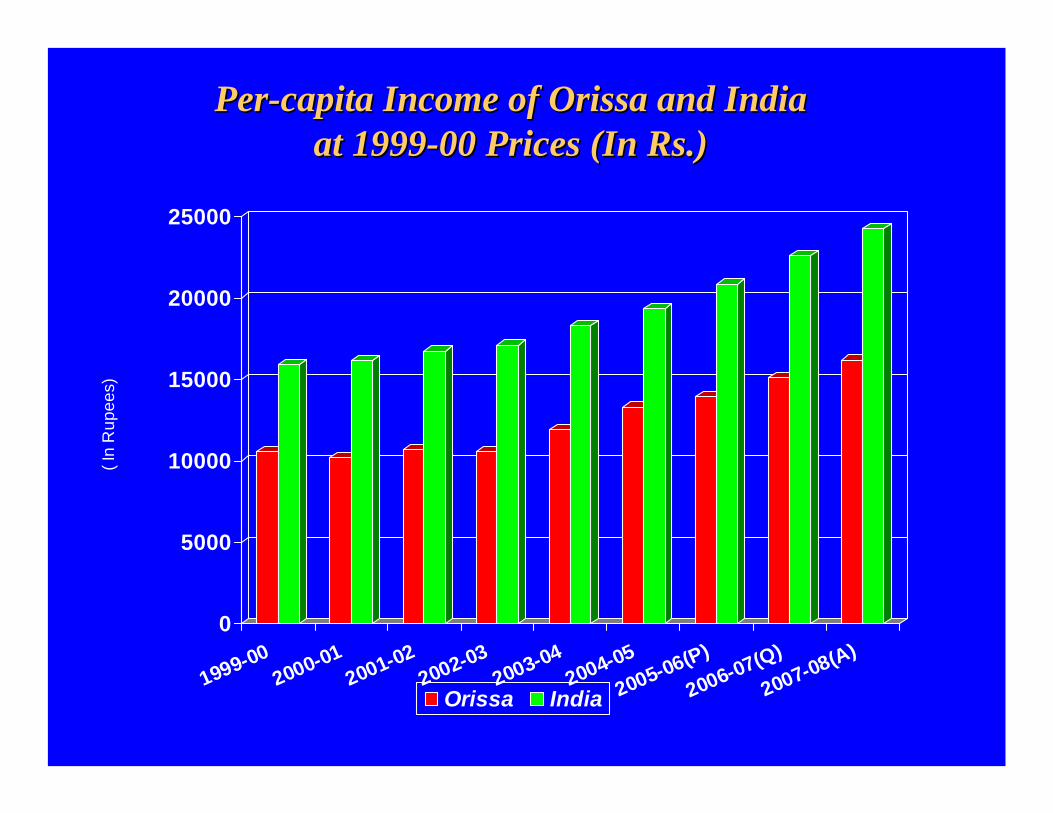
PerPer--capita Income of Orissa and India capita Income of Orissa and India at 1999at 1999--00 Prices (In Rs.)00 Prices (In Rs.)
0
5000
10000
15000
20000
25000
( In
Rup
ees)
1999-002000-01
2001-022002-03
2003-042004-05
2005-06(P)
2006-07(Q)
2007-08(A)
Orissa India
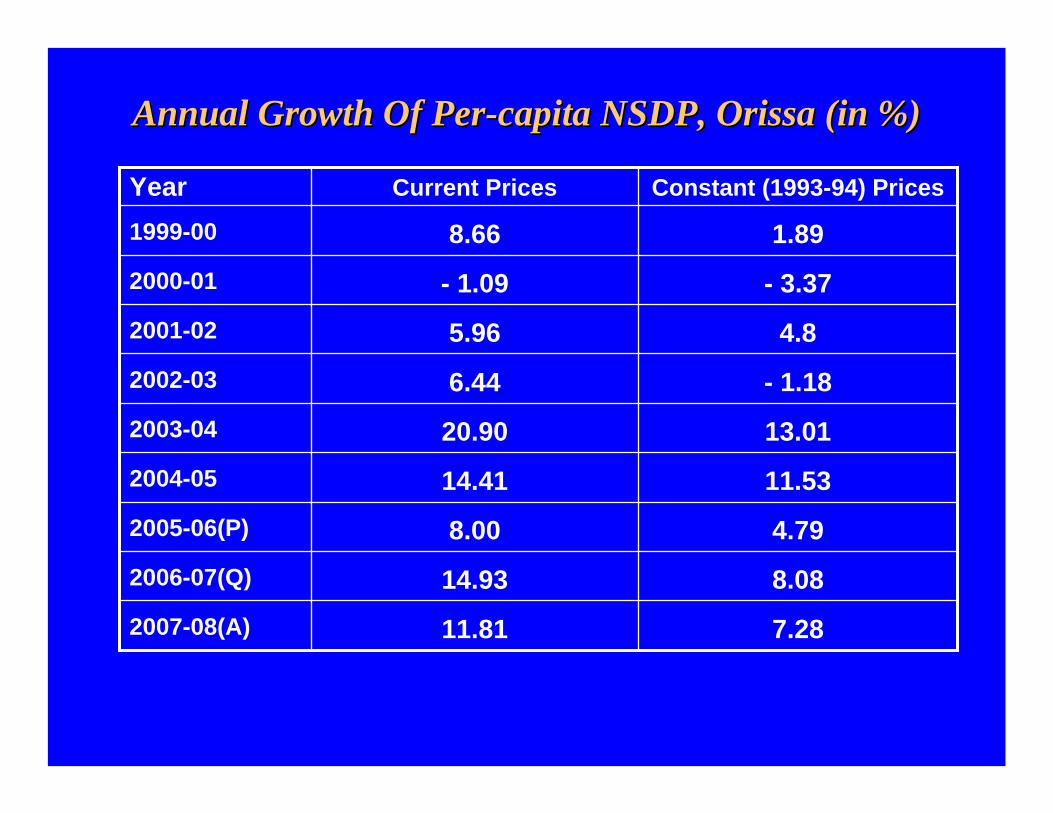
Annual Growth Of PerAnnual Growth Of Per--capita NSDP, Orissa (in %)capita NSDP, Orissa (in %)
Constant (1993-94) PricesCurrent PricesYear
- 3.37- 1.092000-01
7.2811.812007-08(A)
8.0814.932006-07(Q)
4.798.002005-06(P)
11.5314.412004-05
13.0120.902003-04
- 1.186.442002-03
4.85.962001-02
1.898.661999-00
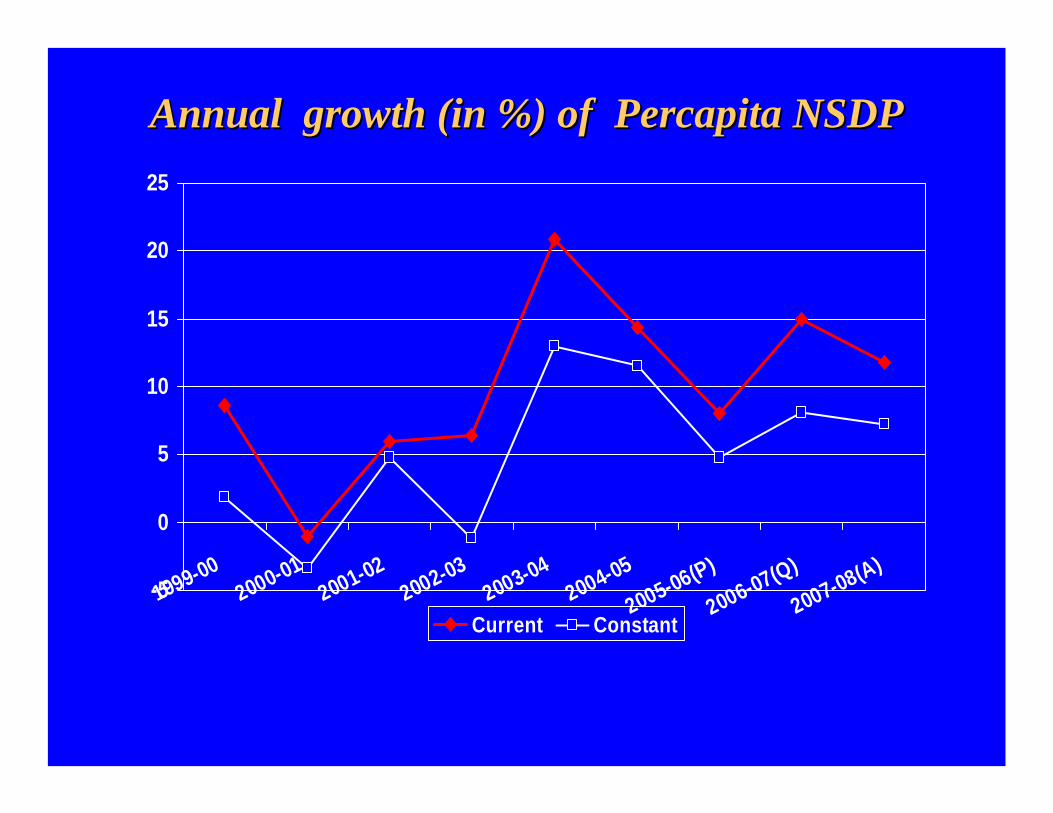
Annual growth (in %) of Annual growth (in %) of PercapitaPercapita NSDPNSDP
-5
0
5
10
15
20
25
1999-002000-01
2001-022002-03
2003-042004-05
2005-06(P)
2006-07(Q)
2007-08(A)
Current Constant
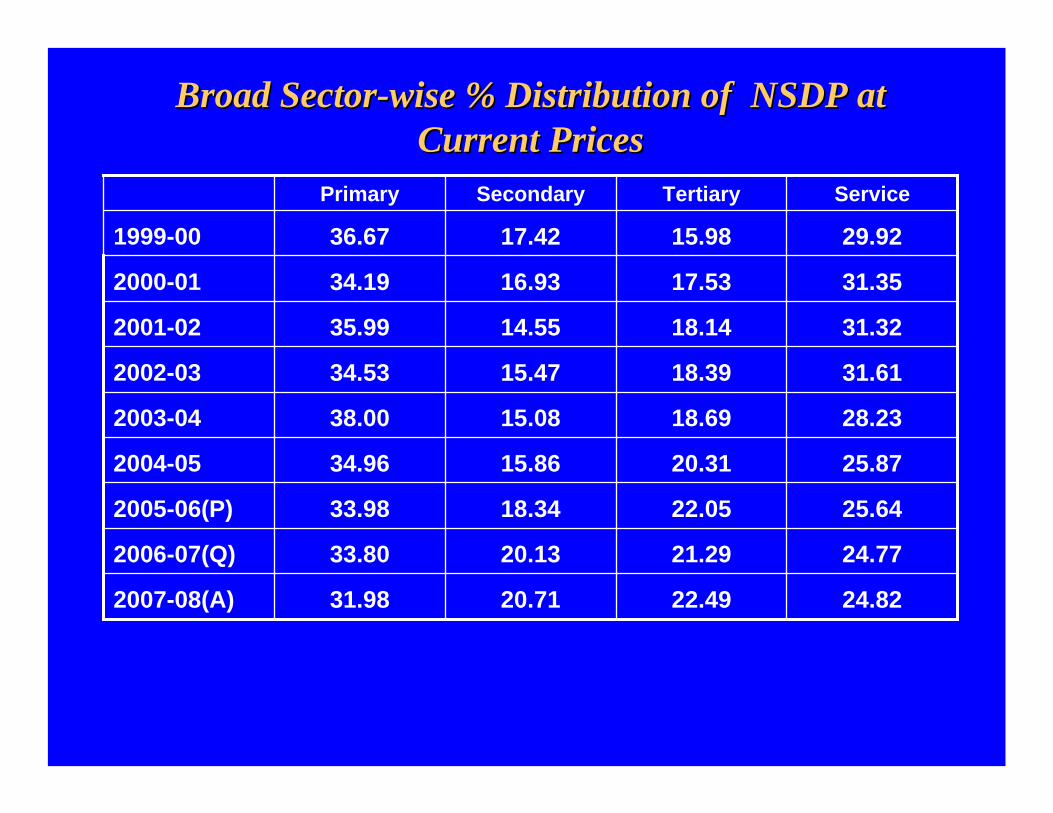
Broad SectorBroad Sector--wise % Distribution of NSDP at wise % Distribution of NSDP at Current PricesCurrent Prices
29.9215.9817.4236.671999-00
24.8222.4920.7131.982007-08(A)
24.7721.2920.1333.802006-07(Q)
25.6422.0518.3433.982005-06(P)
25.8720.3115.8634.962004-05
28.2318.6915.0838.002003-04
31.6118.3915.4734.532002-03
31.3218.1414.5535.992001-02
31.3517.5316.9334.192000-01
ServiceTertiarySecondaryPrimary
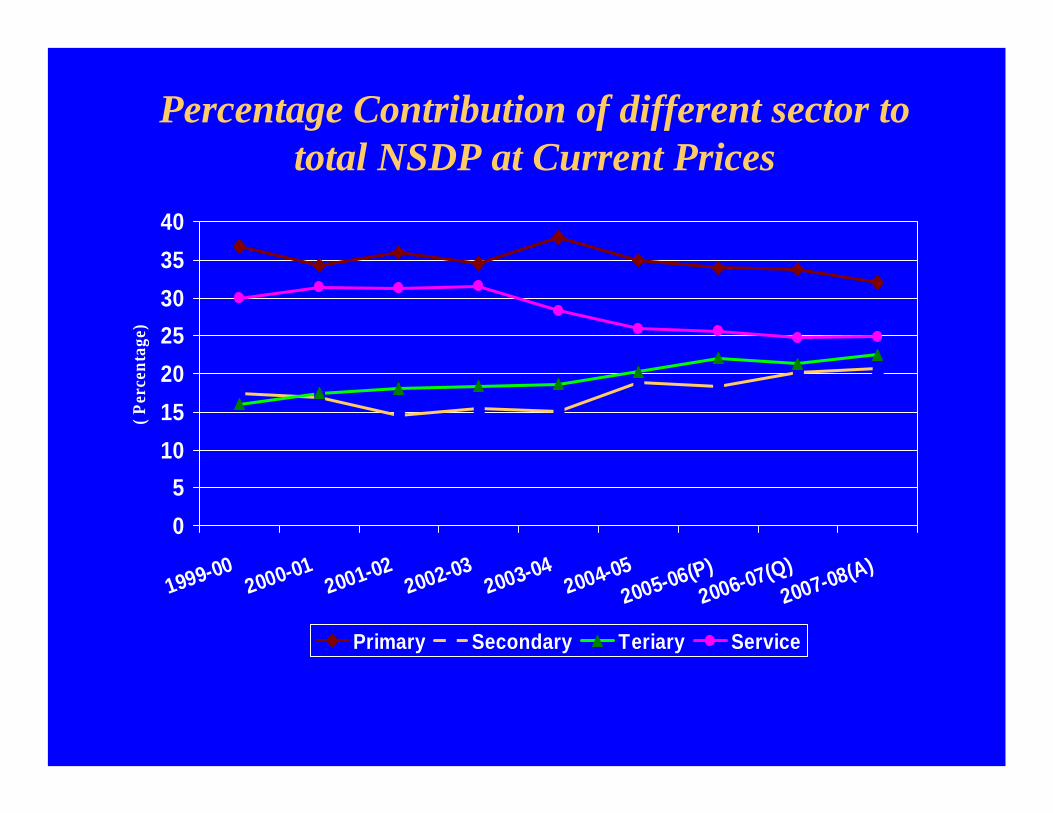
Percentage Contribution of different sector to total NSDP at Current Prices
05
10152025303540
1999-002000-01
2001-022002-03
2003-042004-05
2005-06(P)2006-07(Q)
2007-08(A)
( Per
cent
age)
Primary Secondary Teriary Service
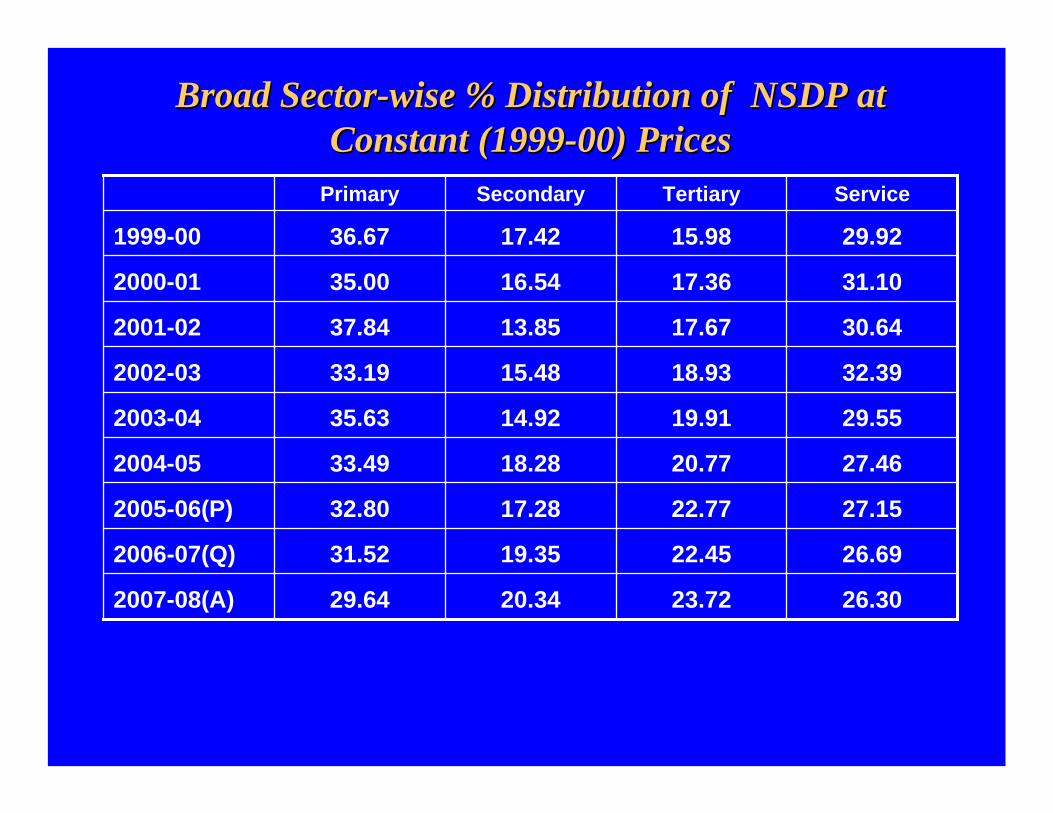
Broad SectorBroad Sector--wise % Distribution of NSDP at wise % Distribution of NSDP at Constant (1999Constant (1999--00) Prices00) Prices
29.9215.9817.4236.671999-00
31.1017.3616.5435.002000-01
30.6417.6713.8537.842001-02
32.3918.9315.4833.192002-03
29.5519.9114.9235.632003-04
27.4620.7718.2833.492004-05
27.1522.7717.2832.802005-06(P)
26.6922.4519.3531.522006-07(Q)
26.3023.7220.3429.642007-08(A)
ServiceTertiarySecondaryPrimary
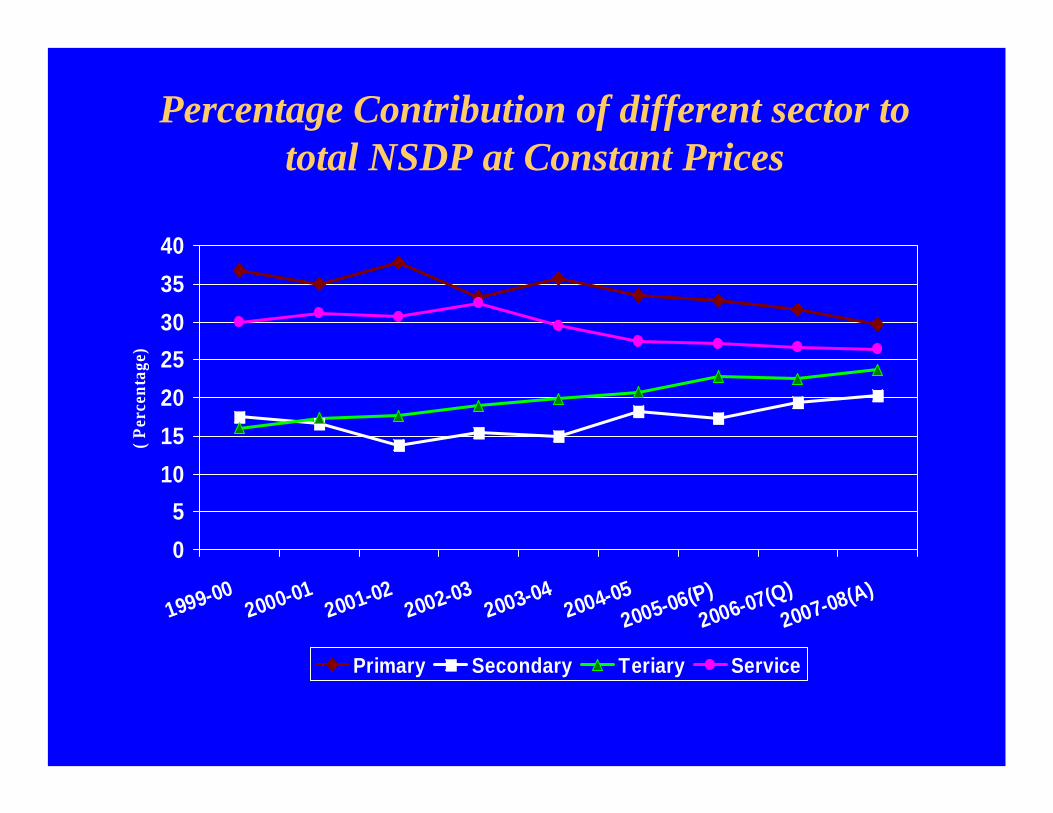
Percentage Contribution of different sector to total NSDP at Constant Prices
05
10152025303540
1999-002000-01
2001-022002-03
2003-042004-05
2005-06(P)2006-07(Q)
2007-08(A)
( Per
cent
age)
Primary Secondary Teriary Service
THANKSTHANKS


![WorldBank FINAL[1]](https://img.pdfslide.us/doc/110x75/577d25db1a28ab4e1e9fbb73/worldbank-final1.jpg)

![Guidelines MIS SocialFunds[WorldBank 1999]](https://img.pdfslide.us/doc/110x75/577d25f81a28ab4e1e9ff63e/guidelines-mis-socialfundsworldbank-1999.jpg)


![[WorldBank] Qualitative Data](https://img.pdfslide.us/doc/110x75/577c7b911a28abe05497f7cb/worldbank-qualitative-data.jpg)