Embed Size (px)
Citation preview
Derived Demand for Cattle Feeding Inputs
Carlos Arnade Kenneth H. Mathews, Jr.
Keithly Jones1
1 The authors are economists in the animal product branch of ERS. April 28, 2005. Selected Paper prepared for presentation at the American Agricultural Economics Association Annual Meeting, Providence, Rhode Island, July 24-27, 2005
1
Derived Demand for Cattle Feeding Inputs
Abstract Derived demand relationships among four weight categories of feeder cattle entering
Texas feedlots and feed were examined using a Generalized McFadden dual cost function
specified as an error correction model. Relationships among own- and cross-price
elasticities provide evidence for at least two cattle feeding enterprises, feeding
lightweight feeder cattle (calves) and feeding heavier cattle. These results indicate
systematic differences in demand relationships among the different weight classes,
providing explanation and insight into mixed results from earlier studies. Seasonality
differed across weight categories, providing additional support for multiple cattle feeding
enterprises. A third step was added to the Engle-Granger two-step estimation procedure
to incorporate information provided in the second step.
Introduction
Feeder cattle are kept on pasture or some other relatively high-roughage sustenance until
they are placed in feedlots. Conventional wisdom characterizes the decision to place
them in feedlots depending on a variety of factors, including relative prices of various
weights of feeder cattle, feed prices, and other factors. While many aspects of feeder
cattle price differentials have been explained, empirical research results on this issue have
been mixed. Generally, feeder cattle models have not been specified in ways amenable to
explaining all of the relationships that underlie reported average placement weights and
price-weight relationships. This paper extends earlier research by explicitly examining
feeder cattle demand by weight category.
2
The research is motivated by three problems: First, many cattle feeding models
consider only one optimal cattle feeding activity. Placement weight is either fixed or the
optimal placement weight is determined for a single feeding activity, given a set of prices
for cattle and/or feed (Anderson and Trapp; Buccola; Dhuyvetter and Schroeder; Lambert
et al.; Mark, Schroeder, and Jones; Marsh). By disallowing solutions with multiple cattle
feeding enterprises, these specifications preclude capturing links between demonstrated
feeding regimes (Brewer et al. and Jordan et al.).
Second, data on which previous research was based often lacked sufficient detail,
or modelers failed to exploit the detail that existed, to discern inter-weight-class
relationships in feeder cattle placements. For example, average feedlot closeout data
obscures details of a number of underlying factors (e.g., Hoelscher in FeedStuffs),
including data on placement weights and days fed. Third, systematic explanation of
weight price relationships is often lacking for the mixed results reported across previous
studies. Prominent in the literature is the logic that higher feed prices favor heavier
weight placements, which will be on feed for shorter periods and, thus, eat less high-
priced feed (Dhuyvetter and Schroeder; Anderson and Trapp). However, some studies
report opposite results (Marsh).
This paper highlights differences in demand relationships among different weight
classes of feeder cattle placements and provides a rationale for the mixed feed/feeder
cattle demand relationships found in previous studies. The objectives of this paper are:
(1) explore the likelihood of multiple cattle feeding enterprises; (2) examine the
implications of multiple feeding enterprises on demand for feed and feeder cattle of
different weights; (3) examine seasonal components of feeder cattle placement by
3
weights. To meet these objectives, a Generalized McFadden cost function is specified
and estimated as an error correction model (ECM).
We introduce several innovations: First, we disaggregate feedlot placements into
four weight subgroups and examine tradeoffs between feed and weight categories.
Second, feed is decomposed and priced as energy and protein, allowing for parsimony in
the model and allowing us to test for fixed proportions between energy and protein.
Third, we add a third step to the Engle-Granger two-step ECM estimation procedure that
allows us to improve our parameter estimates.
Feeder Cattle Demand and Average Weights of Cattle Entering Feedlots
The significance of factors affecting the price-weight relationships of feeder cattle and
calves has been reported in several studies (Anderson and Trapp; Buccola; Dhuyvetter
and Schroeder; Lambert et al.; Schroeder, and Jones; Marsh). The literature
characterizing price-weight relationships for feeder cattle originates from two primary
analytical perspectives. One approach exploits feeder cattle price-weight relationships to
determine an optimal feeder cattle placement weight that maximizes cattle feeding profits
or minimizes cattle feeding costs. The second approach is based on the analysis of
factors that affect price differentials in feeder cattle markets.
While addressing general price-weight relationships in feeder cattle prices, these
studies have not addressed the relationships between weight classes. Reported
relationships between feeder cattle prices and weights appear mixed across studies. For
example, Lambert et al. and Coatney, Menkhaus, and Schmitz report negative
relationships between feeder cattle price and weight. Dhuyvetter and Schroeder report a
4
positive, but declining relationship between price and weight. However they emphasized
that interactions in their model made it difficult to interpret the marginal effects of each
variable. Marsh assumed feeder cattle placement weights were important to the cattle
feeding decision, but found only indirect supportive evidence. Other variables affecting
feed prices have been Fed-cattle futures prices past profits (Kastens and Schroeder) and
seasonality (Dhuyvetter and Schroeder; Anderson and Trapp), cattle cycles (Simpson and
Alderman), recent feeding margins (Dhuyvetter and Schroeder), and sex (Dhuyvetter and
Schroeder; Lambert et al).
Results characterizing the relationship between feed prices and feeder cattle
weights also have been mixed. Some authors report positive relationships between corn
prices and feeder cattle weights (Dhuyvetter and Schroeder; Anderson and Trapp).
Heavier weight placements leave calves on feed for shorter periods, thus, consuming less
high-priced corn (for example, Marsh). Buccola reports that an increase in corn price
caused a decrease in feeder cattle price (an implied positive relationship between feeder
cattle quantity and corn price).
A Cost Function
Treating feeder cattle of different weight categories as distinct inputs into fed-cattle
production is a logical, theoretical construct for examining the derived demand for
distinct weight categories of feeder cattle. A cost function allows one to derive a system
of demand equations for estimation via Shepherd's Lemma (Dewiert; Young et al.). In
the model specified here, feeder cattle of distinct weight categories are treated as distinct
elements of an input vector, x, each with a distinct price per unit in a corresponding input
5
price vector, w. Other inputs, such as feeds, and their prices can be included as elements
in the input and price vectors as well. Output, y, is represented as the total number of
feeder cattle multiplied by the average slaughter weight; ignoring death loss.
While many functional forms are available for specifying a cost function the
Generalized McFadden cost function is notable for its ease of use (Dewiert and Wales).
It automatically satisfies most properties of cost functions including homogenity (see
Varian), but does not satisfy conditions of symmetry and concavity in input prices.
However, these conditions can be easily imposed1. The Generalized McFadden cost
function specified for the cattle feeding application is:
(1) ∑ ∑+∑∑η+λ+∑∑β+∑=i r
rri r
iiriiki j
jiiji
ii YOOwYwwwwwbYwC )/(21),(
where Or = other variable(s) r, and i, j represents feeder cattle four weight classes and two
feed categories which together ensure (i,j = 6).2 The numeraire, wk, is the price of one
weight class of feeder cattle. In the feedlot model Or are seasonal variables, Sr, explicitly
defined below. By this notation and by applying Shephard's Lemma, the first derivative
with respect to input prices yields conditional input demands which can be written as
(2) SYwwbxwYwC
rr
irikjj
ijiii
∑η+λ+∑β+==∂∂ )/(),( .
The numeraire insures input demands are homogenous of degree zero in input prices.
By jointly estimating demands for different weight categories along with demand
for feed, it is possible to obtain own- and cross-price effects on each weight category.
This may reveal whether demands for each category of feeder cattle are complementary
or substitute inputs. In this paper, complementarity is interpreted as support for an
6
alternate hypothesis of multiple classes of cattle feeding enterprises. Including feed
demand allow us to examine category (feed), feed price (category price) relationships.
Empirical Model Estimation and Results
This section presents estimation of, and results from, a version of the Generalized
McFadden cost function specified as an Error Correction Model (ECM) (Friesan; Friesan,
Capalbo, and Denny). The ECM consists of two components, a levels (equilibrium)
component and an unconstrained, differenced (disequilibrium) component. Joint
estimation of both components of a nonlinear ECM model is the preferred estimation
procedure. However, additional nonlinearities in specification of our model led to a
failure to converge.3
Engle and Granger introduced a two-step estimation procedure for ECM's that has
been widely used. A levels model is estimated and then, the lagged errors from the levels
component (first step) are used as explanatory variables in estimating the disequilibrium
component (second step) of the model. Parameter estimates on the lagged errors can be
used to calculate the speed of adjustment to long run equilibrium.4 In accounting for
disequilibrium, the second step accounts for specification errors in the first step. Engle
and Granger demonstrate the consistency of these two-step estimates.
The Engle-Granger two-step procedure is extended here by introducing a third
step in which the adjustment parameter, νi, is set and all remaining parameters of the
ECM model are jointly estimated. This third step addresses two issues. First, it further
reduces specification bias in the first step estimates. Second, it allows information
relevant to long run disequlibrium that is discovered in step two to be incorporated in the
model.
7
Data
All data are monthly, beginning with December 1995 and continuing through July 2003.
Feeder cattle data consist of the number of head in each of four weight categories placed
on feed: under 600 pounds, 600 to 699 pounds, 700 to 799 pounds, and over 800 pounds
(National Agricultural Statistics Service (USDA-NASS)). Price data for feeder cattle are
from Economic Research Service's Red Meats Yearbook, compiled from USDA's
Agricultural Marketing Service publications: Prices per hundredweight (cwt) for
Oklahoma City feeder cattle for Medium, Number 1 steers weighing 500 to 550 pounds
(for the under 600 pound weight class), steers weighing 600 to 650 pounds (600 to 699
pound class), heifers weighing 700 to 750 pounds (700 to 799 pound class), and steers
weighing 750 to 800 pounds (over 800 pound class) are used as proxies for prices for
each weight category. Prices for the 700 to 799 pound feeder cattle are proxied by using
feeder heifer prices because the steer price series was not included in the data source.
The use of these heifer prices is also of little concern because the weight classes include
both steers and heifers. Using this heifer price series as a proxy or instrument also may
reduce some of the collinearity among the price series. Feed prices are monthly from
ERS' "High Plains Cattle Feeding Simulator" (USDA-ERS, Livestock, Dairy, and Poultry
Outlook). ERS compiles these prices from AMS' Grain and Feed Weekly Summary and
Statistics.
The feed variables were reduced from 5 inputs to 2 by decomposing feed data into
two nutrient variables, protein and energy5. Breaking feed into nutrient components
allowed us to specify a parsimonious, five-equation model consisting of two feed demand
8
equations and three equations representing demand for feeder calves of each of three
weight categories. The protein and energy content of two basic feeds, corn (or milo-
which is similar to corn in feeding value) and cottonseed meal were used to derive prices
for protein and energy.
Results From the Empirical Model
Our primary objective was to derive demand elasticities for the various weight categories
and for feed. As such, the equilibrium component of the model is more relevant as it
conforms to economic theory. As noted earlier our third step allows us to improve first-
stage estimates, by using information obtained from estimating the disequilibrium
component of the model, to re-estimate equilibrium relationships.
A general iterative procedure was used to estimate the ECM in three steps. First,
the long run component of the model was estimated; imposing the required economic
restrictions on model parameters. Second, the difference component of the model was
estimated; using lagged error terms from the first step estimation as explanatory
variables. Third, adjustment rates were set to their second stage estimates and the entire
ECM model estimated (Appendix). This third step reduces the level of nonlinearity in
the model, and made it possible for the joint model to converge.
Seasonality
NASS placement-weight data for states exhibits interesting seasonal patterns for each
weight category. In Texas (figure 2), this seasonality is characterized by peak placements
of heavier cattle during the spring (when many feeder cattle are removed from wheat
9
pasture), and peak placements of the lightest-weight cattle during the fall (after weaning).
Trigonometric functions were used to capture seasonal variations, which were tested for
both frequency and location (Anderson and Trapp; Arnade and Pick). The Sr from
equation (2) were specified as
(4) ,)2sin()2cos( ntbntaS rrrrr π+π=
where r=1 for one peak per year, 2 for two peaks per year, t = time proxied by
observation number (integers beginning with 1), n1=12 (months per cycle), and n2=6
(months per cycle).
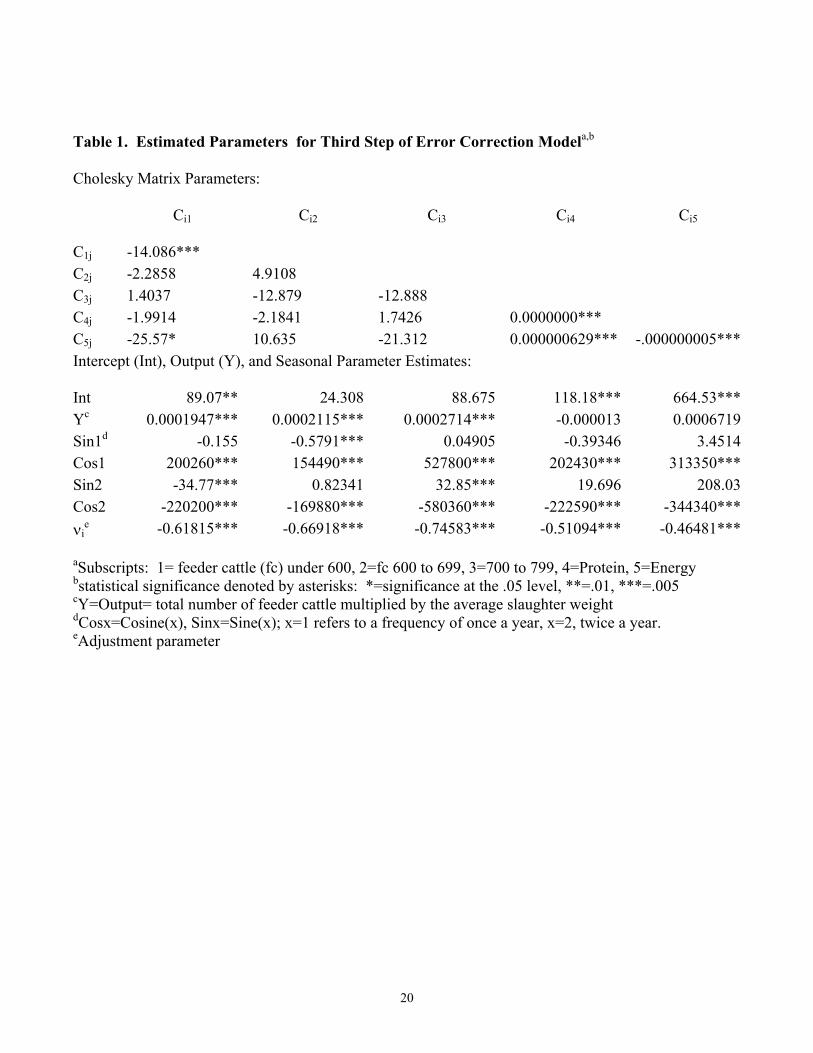
Most trigonometric parameters were significant for seasonal variations in all
feeder cattle equations (table 1) and indicate a consistency with other studies reporting
significant seasonal variation in feeder cattle demand (Anderson and Trapp; Coatney,
Menkhaus, and Schmitz; Dhuyvetter and Schroeder). Anderson and Trapp used both
annual and semiannual trigonometric functions similar to those used in this study to
capture seasonality. However, in contrast to Anderson and Trapp, our results support the
semiannual cycle for feeder cattle. Dhuyvetter and Schroeder also reported significant
interactions between weight and monthly dummy variables. Results in table 1 also
suggest semiannual seasonal, but not annual, patterns for both energy and protein.
Pairwise tests for seasonal location similar to those used by Arnade and Pick, but
between equations and without the time trend, showed significantly different seasonal
patterns between under 600-pound feeder cattle and 600 to 699-pound feeder cattle and
between under 600-pound feeder cattle and energy.
In addition to the statistical test results, patterns calculated, using trigonometric
function parameter estimates of intra-year cyclical behavior, are consistent with observed
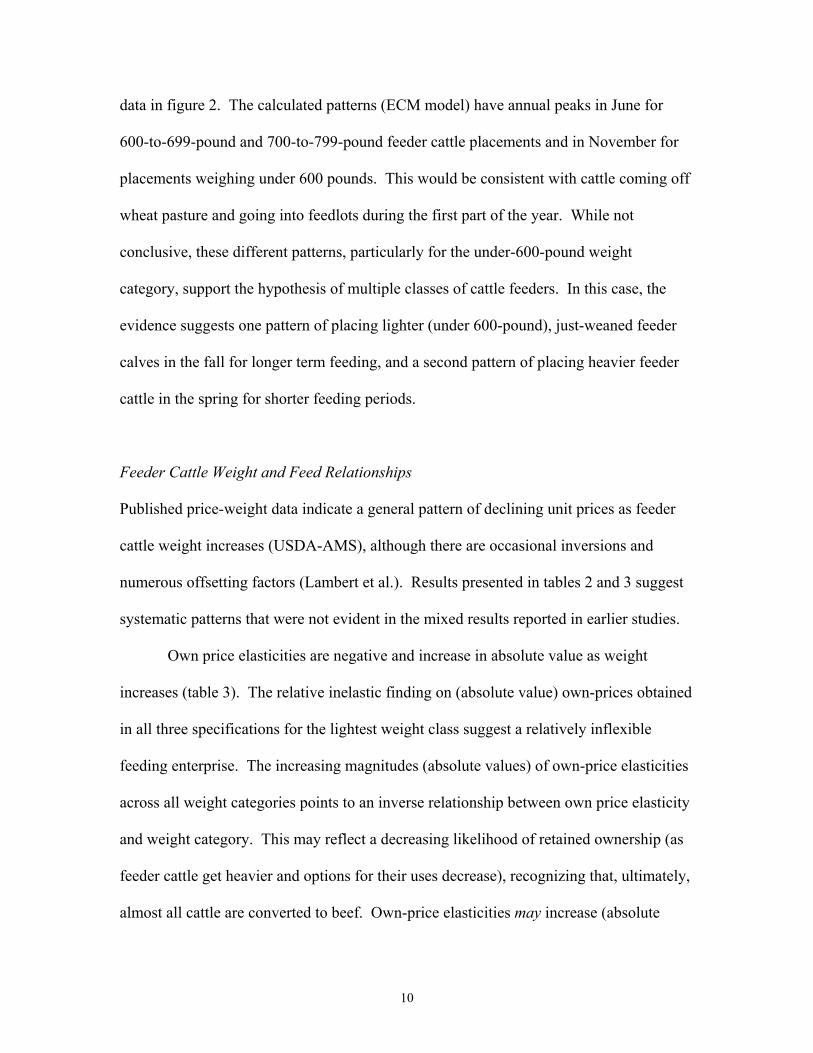
10
data in figure 2. The calculated patterns (ECM model) have annual peaks in June for
600-to-699-pound and 700-to-799-pound feeder cattle placements and in November for
placements weighing under 600 pounds. This would be consistent with cattle coming off
wheat pasture and going into feedlots during the first part of the year. While not
conclusive, these different patterns, particularly for the under-600-pound weight
category, support the hypothesis of multiple classes of cattle feeders. In this case, the
evidence suggests one pattern of placing lighter (under 600-pound), just-weaned feeder
calves in the fall for longer term feeding, and a second pattern of placing heavier feeder
cattle in the spring for shorter feeding periods.
Feeder Cattle Weight and Feed Relationships
Published price-weight data indicate a general pattern of declining unit prices as feeder
cattle weight increases (USDA-AMS), although there are occasional inversions and
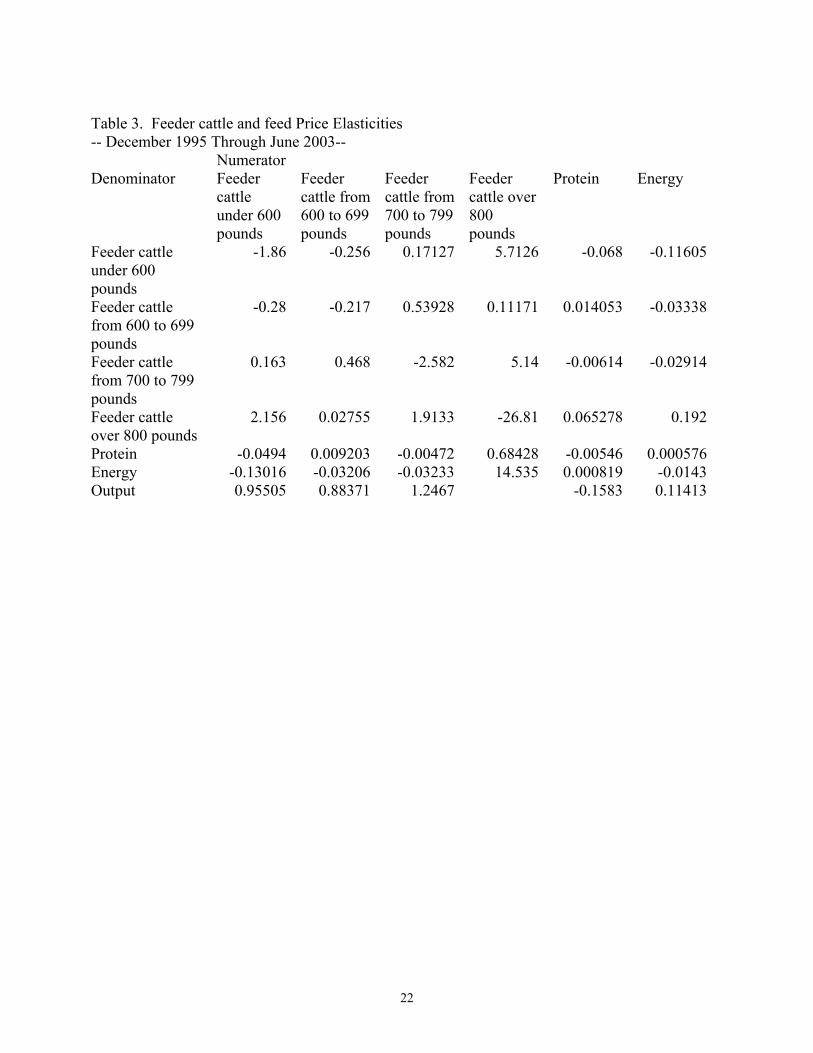
numerous offsetting factors (Lambert et al.). Results presented in tables 2 and 3 suggest
systematic patterns that were not evident in the mixed results reported in earlier studies.
Own price elasticities are negative and increase in absolute value as weight
increases (table 3). The relative inelastic finding on (absolute value) own-prices obtained
in all three specifications for the lightest weight class suggest a relatively inflexible
feeding enterprise. The increasing magnitudes (absolute values) of own-price elasticities
across all weight categories points to an inverse relationship between own price elasticity
and weight category. This may reflect a decreasing likelihood of retained ownership (as
feeder cattle get heavier and options for their uses decrease), recognizing that, ultimately,
almost all cattle are converted to beef. Own-price elasticities may increase (absolute
11
value) with weights because heaviest weight feeder cattle are in relatively shorter supply.
They also have the fewest options available for their use, so large price changes would be
necessary to change quantities demanded.
Symmetry and homogeneity conditions were used to obtain elasticities for the
numeraire. The calculated own-price elasticity for the heaviest (over 800 pounds) class
of feeder cattle is too large to be believable. Likely an artifact of the procedure used in
its calculation, it is probably only useful as an indicator of the continuation of the general
pattern observed in the other elasticities, which were directly derived from estimated
parameters.
If there are multiple weight-based feeding regimes that characterize the cattle
feeding industry, one could expect mixed results from using data in which detail about
weight categories and feeding regimes was missing or obscured. Imagine two
distributions of placement weights, one for light calves skewed to the right and one for
heavy calves skewed to the left. The "average" across both distributions would fall in the
skewed tail regions of both distributions and not reflect either mean.
Cross elasticities between weight groups also are presented in table 3. Generally,
one would expect positive (negative) cross-price elasticities if cattle in each weight class
were substitutes (complements). The positive results in table 3 provide evidence for
substitution between the heaviest weight category and the next two lighter weight
categories. However, the cross elasticities between the lightest weight category and the
next heavier weight categories are negative. Thus, it appears that lightest weight cattle
are not necessarily substitutes for heavier-weights of feeder cattle, again, consistent with
feeding lighter cattle being a different enterprise from feeding heavier cattle.
12
The cattle-feeding literature implies that higher corn prices favor heavier weight
placements that will be on feed for shorter periods and, thus, eat less high-priced corn
(for example, Marsh; Jordan et al). Similar expectations exist for protein feeds—when
protein feed prices are high, it is more efficient to feed heavier cattle whose protein
requirements are slightly lower than lighter cattle, and heavier cattle are on feed less time.
Results from other studies with respect to protein and energy are mixed and lack the
systematic components presented here to explain differences (table 3). For example,
some results (Anderson and Trapp; Dhuyvetter and Schroeder; Buccola) show positive
relationships between energy and protein prices and feeder cattle weight. In the ECM
model presented here, a systematic shift can be observed from negative to positive cross
elasticities over feeder cattle weight class from most negative (lightest cattle) to most
positive (heaviest cattle). One interpretation is that substitution doesn't matter so much
for lighter weight feeder cattle placements, whereas for heavier weight feeder cattle
placements on feed for shorter periods, substitution is more of an issue.
The highly inelastic own price elasticities for energy and protein also suggest that
protein and energy are not substitutes in the same sense that different feedstuffs might be,
but are necessary inputs for each weight category of feeder cattle. The near-zero cross
elasticities between energy and protein further suggest fixed proportions between energy
and protein, as one would expect in cattle feeding rations (see Weichenthal, Rush, and
Van Pelt).
13
Conclusions
Feeder cattle costs constitute the largest cost share of cattle feeding costs. Feed costs are
next, but well below feeder cattle costs. Other costs are relatively minor compared to
these two. As such, energy or protein prices may not be the most important determinants
of placement weights of feeder cattle. Systematic patterns between feed-input prices and
feeder cattle in-weights may have not been captured by earlier studies, which have
produced mixed results.
Our study looks at the demand for feeder cattle by weight category. Results in this
paper provide some rationale for the mixed results observed across previous studies, with
some general patterns emerging. We found negative cross-elasticites between lightest-
weight feeder cattle and other weight categories which suggests cattle feeders placing
lightest-weight feeder cattle constitute a distinct class of cattle feeders. Viewing the
results presented here in the context of multiple classes of cattle feeders, we conclude that
there is substitution between the heaviest weight category and the next two weight
categories. We also conclude that the lightest-weight categories of feeder cattle are less
likely to be viewed as substitutes with heavier weight classes and represent inputs into a
separate class of cattle feeding enterprise.
While we have examined several aspects of the complex relationships between
weight classes of feeder cattle in more detail, others aspects have not been examined.
One such aspect is the pricing and feed cost-weight gain relationships between steers and
heifers, which is left for future research. This extension would introduce additional
multicollinearity in a model which already faces multicollinearity. A basic approach was
used in this study to overcome the severe collinearity in the data series. Perhaps a more
14
sophisticated approach may be required for models which further decompose feedlot
demand. Other issues to be explored in determining feeder calf demand are retained
ownership, pasture expenses, price risk, interest rates, and other supply-related issues.
Several researchers (Jordan et al.; Mark, Schroeder, and Jones; Marsh), note that these
issues and other factors associated with pasturing cattle tend to equalize overall costs.
Future studies also could face problems with obtaining sufficiently detailed and
disaggregated data for all the desired subcategories and well as data required to address
these other issues-which may influence in-weights.
15
References
Albright, M.L., T.C. Shcroeder, and M.R. Langemeier. "Determinants of Cattle Feeding
Cost-of-Gain Variability." Journal of Production Agriculture 7(1994): 206-10.
Arnade, C., and D. Pick. "Seasonality and Unit Roots: the Demand for Fruits."
Agricultural Economics 18(1998): 53-62.
Anderson, J.D., and J.N. Trapp. "The Dynamics of Feeder Cattle Market Responses to
Corn Price Change." Journal of Agricultural and Applied Economics 32(2000): 493-
505.
Brewer, P., C. Calkins, R. Anderson, T. Klopfenstein, and R. Rasby. "Carcass and
Palatability Characteristics of Calf-fed and Yearling Finished Steers." 2003 Nebraska
Beef Report, pp. 68-70. 2003.
Buccola, S.T. "An Approach to the Analysis of Feeder Cattle Price Differentials."
American Journal of Agricultural Economics 62(1980): 575-80.
Coatney, K.T., D.J. Menkhaus, and J.D. Schmitz. "Feeder Cattle Price Determinants: An
Hedonic System of Equations Approach." Review of Agricultural Economics 18(1996):
193-211.
16
Dewiert, W.E. "An Application of the Shephard Duality Theorem: A Generalized
Leontief Production Function." Journal of Political Economy 79(1971): 481-507.
Dewiert, W.E., and T.J. Wales. "Flexible Functional Forms and Global Curvature
Conditions, Econometrica 55(1987): 43-68.
Dhuyvetter, K.C., and T.C. Schroeder. "Price-Weight Relationships for Feeder Cattle."
Canadian Journal of Agricultural Economics 48(2000): 299-310.
Engle, R.F., and C.W.J. Granger. "Co-Integration and Error Correction: Representation,
Estimation, and Testing." Econometrica 55(1987): 251-76.
Friesen, J. "Testing Dynamic Specification of Factor Demand Equations for U.S.
Manufacturing." The Review of Economics and Statistics 74(1992): 240-50.
Friesen, J. S. Capalbo, and M. Denny. "Dynamic factor demands in U.S. and Canadian
agriculture." Agricultural Economics 6(1992): 251-66.
Garoian, L., J.W. Mjelde, and J.R. Conner. "Optimal Strategies for Marketing Calves
and Yearlings from Rangeland." American Journal of Agricultural Economics 72(1990):
604-13.
17
Guyer, P.Q. "Retaining Ownership of Calves or Yearlings." NebGuide G85-766-A, May
1996 (http://ianrpubs.unl.edu/beeef/g766.htm as accessed on 1-13-2004).
Hoelscher, M.A. "[Monthly] Feedyard Analysis." FeedStuffs various issues, 1995-2004.
Jordon, D.J., T. Klopfenstein, T. Milton, R. Cooper, T. Scott, G. Erickson, and R. Clark.
"Economic Analysis of Calf Versus Yearling Finishing." University of Nebraska
Cooperative Extension MP 79, 2002 Beef Cattle Report, 2002.
Kastens, T., and T.C. Schroeder. "Cattle Feeder Behavior and Feeder Cattle Placements."
Journal of Agricultural and Resource Economics 19(1994): 337-48..
Lambert, C.D., M.S. McNulty, O.C. Grunewald, and L.R. Corah. "An Analysis of
Feeder Cattle Price Differentials." Agribusiness 5(1989): 9-23.
Mark, D.R., T.C. Schroeder, and R. Jones. "Identifying Economic Risk in Cattle
Feeding." Journal of Agribusiness 18(2000): 331-44.
Marsh, J.M. "Economic Factors Determining Changes in Dressed Weights of Live Cattle
and Hogs." Journal of Agricultural and Resource Economics 24(1999): 313-26..
18
Simpson, J.R., and R. Alderman. "Estimating Feeder Calf Price Differentials," Staff
Paper 230, Food and Resource Economics Department, University of Florida,
Gainesville, FL, February 1983.
U.S. Department of Agriculture, Agricultural Marketing Service, Cattle, Feeder and
Replacement, Auction reports, (http://www.ams.usda.gov/lsmnpubs/cfauction.htm) as
accessed on October 26, 2004.
U.S. Department of Agriculture, Animal and Plant Health Inspection Service, Veterinary
Services, Part V: Quality Assurance Profile, Beef Cow/Calf Health and Productivity
Audit, August, 1994.
U.S. Department of Agriculture, Economic Research Service, Livestock, Dairy, and
Poultry Outlook, various issues from 1996 through 2003.
U.S. Department of Agriculture, Economic Research Service, Red Meat Yearbook
(http://www.ers.usda.gov/data/sdp/view.asp?f=livestock/94006/), as accessed on October
27, 2004.
Weichenthal, B., I. Rush and B. Van Pelt, "Crude Protein and Energy Combinations for
Finishing Yearling Steers." University of Nebraska Cooperative Extension MP 71, 1999
Beef Cattle Report, 1999.
19
Young, D.L., R.C. Mittelhammer, A. Rostamizadeh, and D.W. Holland. Duality Theory
and Applied Production Economics Research: A Pedagogical Treatise, EB 1473,
Cooperative Extension, College of Agriculture and Home Economics, Washington State
University, Pullman, WA, September 1987.
20
Table 1. Estimated Parameters for Third Step of Error Correction Modela,b
Cholesky Matrix Parameters:
Ci1 Ci2 Ci3 Ci4 Ci5
C1j -14.086*** C2j -2.2858 4.9108 C3j 1.4037 -12.879 -12.888 C4j -1.9914 -2.1841 1.7426 0.0000000*** C5j -25.57* 10.635 -21.312 0.000000629*** -.000000005***Intercept (Int), Output (Y), and Seasonal Parameter Estimates:
Int 89.07** 24.308 88.675 118.18*** 664.53***Yc 0.0001947*** 0.0002115*** 0.0002714*** -0.000013 0.0006719Sin1d -0.155 -0.5791*** 0.04905 -0.39346 3.4514Cos1 200260*** 154490*** 527800*** 202430*** 313350***Sin2 -34.77*** 0.82341 32.85*** 19.696 208.03Cos2 -220200*** -169880*** -580360*** -222590*** -344340***νi
e -0.61815*** -0.66918*** -0.74583*** -0.51094*** -0.46481***
aSubscripts: 1= feeder cattle (fc) under 600, 2=fc 600 to 699, 3=700 to 799, 4=Protein, 5=Energy bstatistical significance denoted by asterisks: *=significance at the .05 level, **=.01, ***=.005 cY=Output= total number of feeder cattle multiplied by the average slaughter weight dCosx=Cosine(x), Sinx=Sine(x); x=1 refers to a frequency of once a year, x=2, twice a year. eAdjustment parameter
21
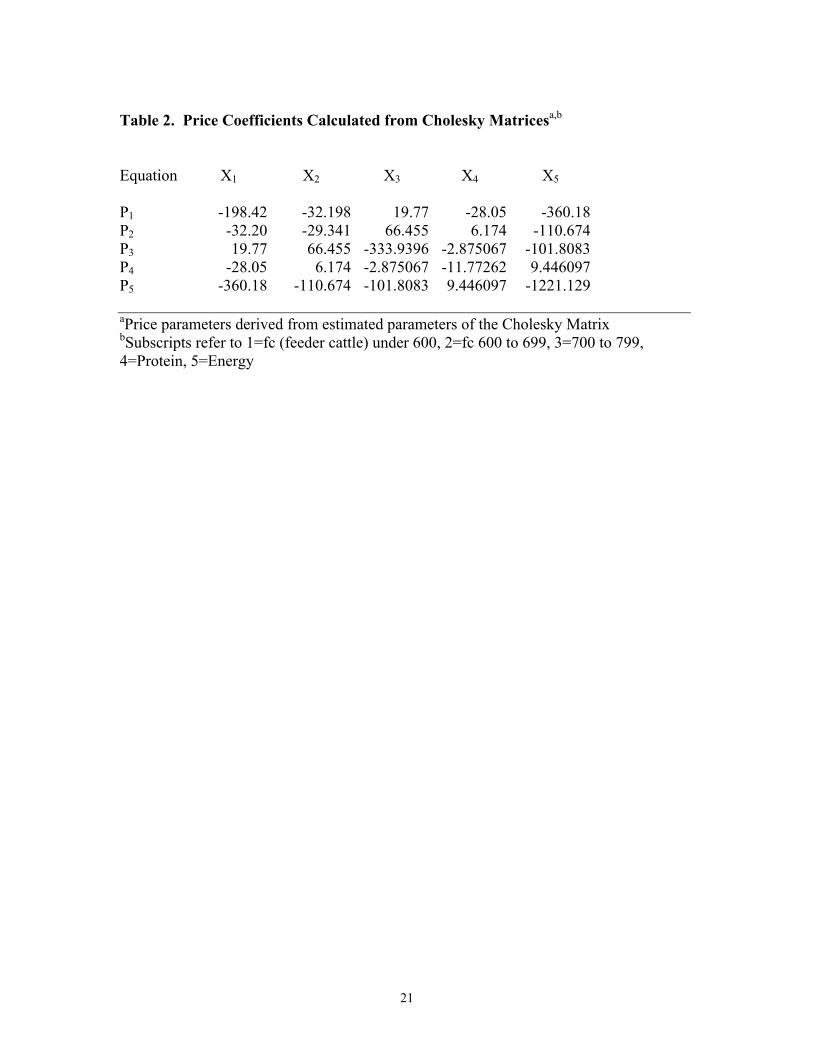
Table 2. Price Coefficients Calculated from Cholesky Matricesa,b
Equation X1 X2 X3 X4 X5 P1 -198.42 -32.198 19.77 -28.05 -360.18 P2 -32.20 -29.341 66.455 6.174 -110.674 P3 19.77 66.455 -333.9396 -2.875067 -101.8083 P4 -28.05 6.174 -2.875067 -11.77262 9.446097 P5 -360.18 -110.674 -101.8083 9.446097 -1221.129 aPrice parameters derived from estimated parameters of the Cholesky Matrix bSubscripts refer to 1=fc (feeder cattle) under 600, 2=fc 600 to 699, 3=700 to 799, 4=Protein, 5=Energy
22
Table 3. Feeder cattle and feed Price Elasticities -- December 1995 Through June 2003-- Numerator Denominator Feeder
cattle under 600 pounds
Feeder cattle from 600 to 699 pounds
Feeder cattle from 700 to 799 pounds
Feeder cattle over 800 pounds
Protein Energy
Feeder cattle under 600 pounds
-1.86 -0.256 0.17127 5.7126 -0.068 -0.11605
Feeder cattle from 600 to 699 pounds
-0.28 -0.217 0.53928 0.11171 0.014053 -0.03338
Feeder cattle from 700 to 799 pounds
0.163 0.468 -2.582 5.14 -0.00614 -0.02914
Feeder cattle over 800 pounds
2.156 0.02755 1.9133 -26.81 0.065278 0.192
Protein -0.0494 0.009203 -0.00472 0.68428 -0.00546 0.000576Energy -0.13016 -0.03206 -0.03233 14.535 0.000819 -0.0143Output 0.95505 0.88371 1.2467 -0.1583 0.11413
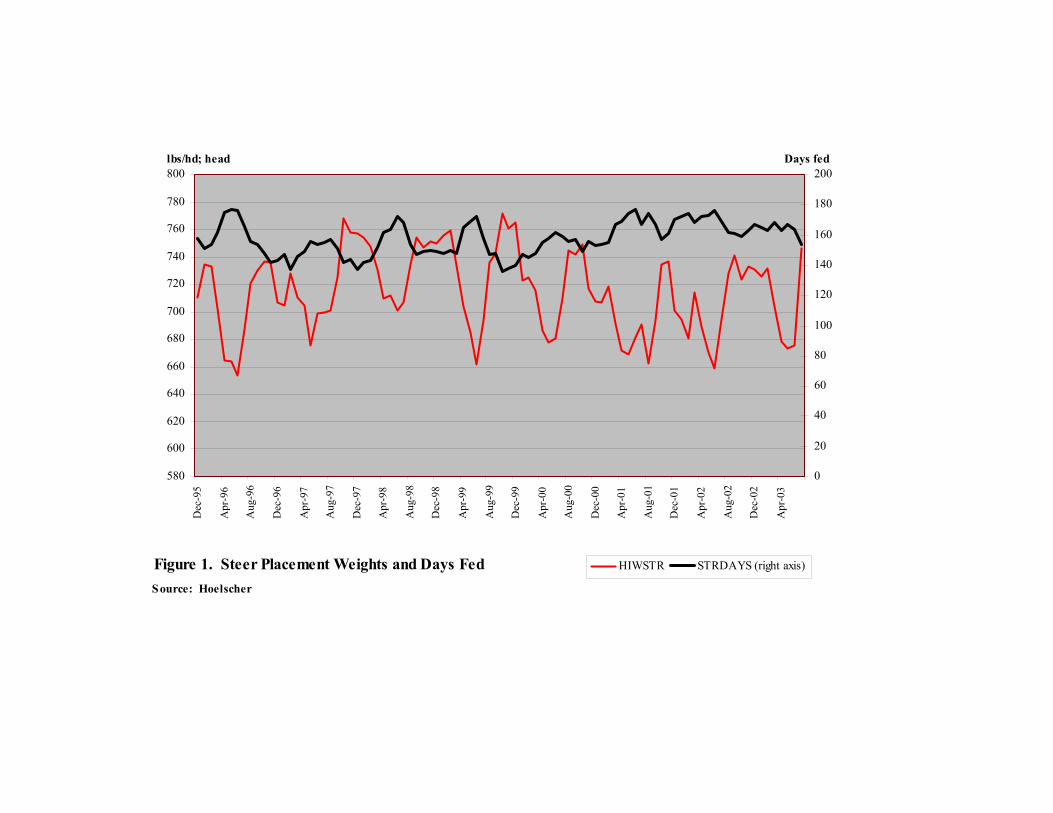
Figure 1. Steer Placement Weights and Days Fed
580
600
620
640
660
680
700
720
740
760
780
800
Dec
-95
Apr
-96
Aug
-96
Dec
-96
Apr
-97
Aug
-97
Dec
-97
Apr
-98
Aug
-98
Dec
-98
Apr
-99
Aug
-99
Dec
-99
Apr
-00
Aug
-00
Dec
-00
Apr
-01
Aug
-01
Dec
-01
Apr
-02
Aug
-02
Dec
-02
Apr
-03
Source: Hoelscher
lbs/hd; head
0
20
40
60
80
100
120
140
160
180
200Days fed
HIWSTR STRDAYS (right axis)
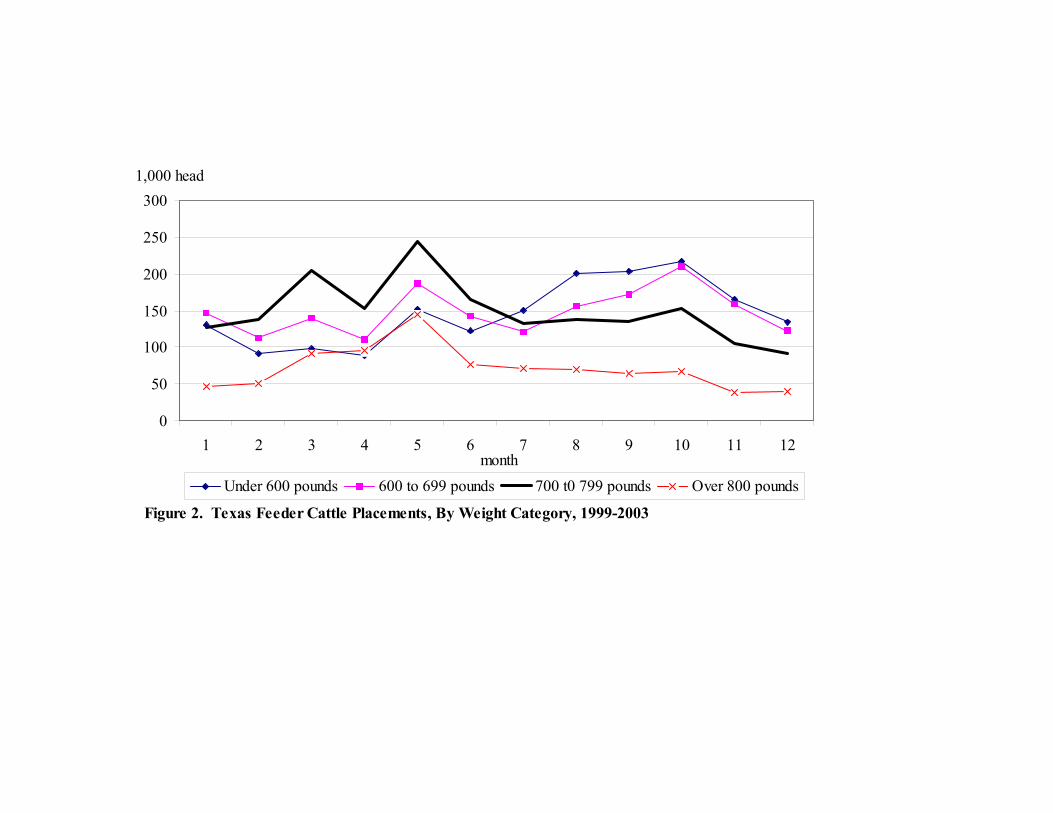
Figure 2. Texas Feeder Cattle Placements, By Weight Category, 1999-2003
0
50
100
150
200
250
300
1 2 3 4 5 6 7 8 9 10 11 12month
1,000 head
Under 600 pounds 600 to 699 pounds 700 t0 799 pounds Over 800 pounds
Endnotes 1 An adequately representative cost function must be concave in the price of the inputs.
That is, the matrix of second derivatives (represented by the βij parameters) of the Cost
function with respect to input prices must be negative definite. Diewert and Wales
collect the βij parameters into a matrix and show that, by representing this matrix as the
product of a lower triangular matrix and its transpose, it is possible to impose concavity
of the cost function at every data point (See Appendix). This procedure also insures that
symmetry conditions hold and that input demands are downward sloping.
2 We have two feed categories, protein and energy derived from five feeds.
3 This was a particular problem since we also imposed concavity restrictions using a
procedure suggested by Diewert and Wales.
4 The two-step estimation strategy is not ideal and constrains the ability to test for various
nested dynamic structures.
5 Several approaches were explored for a feed variable. However, the imposition of
concavity restrictions on a weighted index variable for the original 5 feedstuffs yielded a
highly nonlinear specification, the results from which were not well-behaved. Weights
were not bounded between zero and one and some were negative. A grid search was also
used to explore fixed weights for corn and cottonseed meal, representing energy and
protein. Results from this effort revealed an optimal weighting scheme of 0.2 for corn
1
and 0.8 for cottonseed meal, approximately the reverse of a typical feeding ration
weighting of approximately 16 percent protein. Also, the likelihood values changed by
less than 1/500 across all the parametrically varied weights, indicating that preset feed
weights would have little overall effect on the model.


![Index 1-800-552-0512 [] · Index 1-800-552-0512 All Prices subject to change!! ANHYDROUS EQUIP. Straw Chopper 110 Wright Tools 123 Knives 29 COULTER BLADES 27-28HYDRAULICS 67-69 Shanks](https://img.pdfslide.us/doc/110x75/5acafd877f8b9aa3298dfdf4/index-1-800-552-0512-1-800-552-0512-all-prices-subject-to-change-anhydrous.jpg)