Embed Size (px)
Citation preview
Journal of Agribusiness 26,1 (Spring 2008): 41 60 © 2008 Agricultural Economics Association of Georgia
Derived Demand for Cattle Feeding Inputs
Kenneth H. Mathews, Jr., Carlos Arnade, and Keithly Jones Derived demand relationships among four weight categories of feeder cattle entering Texas feedlots and their feed consumed are examined using a generalized McFadden dual cost function. Results demonstrate systematic differences in demand relation-ships among different weight categories. Positive cross-price elasticities among the three heaviest weight categories are consistent with input substitution among weight categories and consistent with objective functions associated with optimal placement weight. Anomalies in the form of negative cross-price elasticities between weight categories provide evidence for an alternative objective function associated with longer term feeding of light-weight feeder cattle. Results also demonstrate season-ality differences across weight categories. Key Words: cattle feeding, derived demand, elasticity, feeder cattle, generalized McFadden cost function
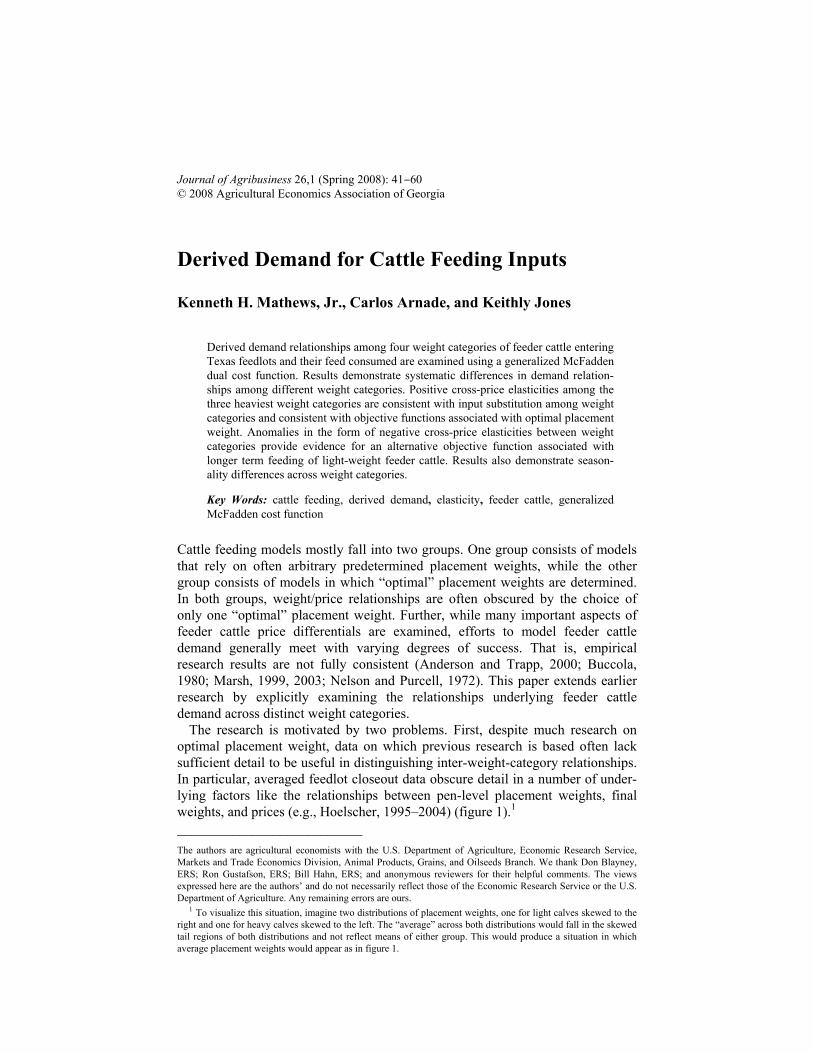
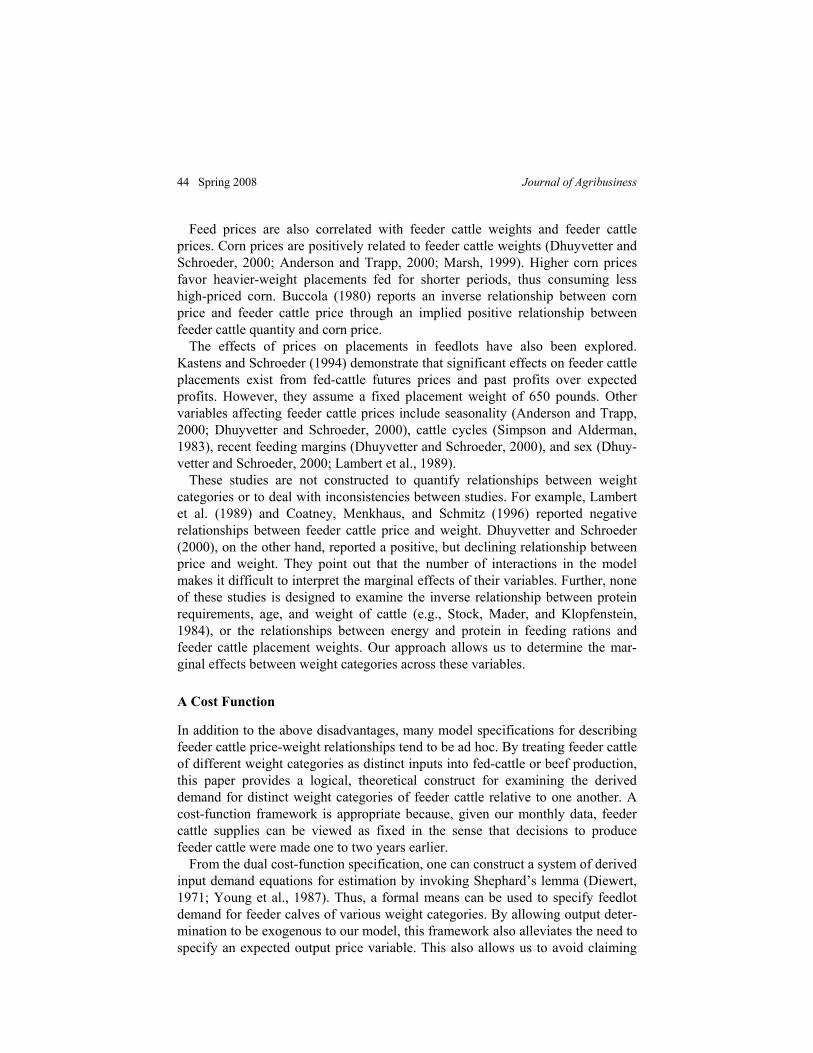
Cattle feeding models mostly fall into two groups. One group consists of models that rely on often arbitrary predetermined placement weights, while the other group consists of models in which “optimal” placement weights are determined. In both groups, weight/price relationships are often obscured by the choice of only one “optimal” placement weight. Further, while many important aspects of feeder cattle price differentials are examined, efforts to model feeder cattle demand generally meet with varying degrees of success. That is, empirical research results are not fully consistent (Anderson and Trapp, 2000; Buccola, 1980; Marsh, 1999, 2003; Nelson and Purcell, 1972). This paper extends earlier research by explicitly examining the relationships underlying feeder cattle demand across distinct weight categories. The research is motivated by two problems. First, despite much research on optimal placement weight, data on which previous research is based often lack sufficient detail to be useful in distinguishing inter-weight-category relationships. In particular, averaged feedlot closeout data obscure detail in a number of under-lying factors like the relationships between pen-level placement weights, final weights, and prices (e.g., Hoelscher, 1995–2004) (figure 1).1 ___________________________
The authors are agricultural economists with the U.S. Department of Agriculture, Economic Research Service, Markets and Trade Economics Division, Animal Products, Grains, and Oilseeds Branch. We thank Don Blayney, ERS; Ron Gustafson, ERS; Bill Hahn, ERS; and anonymous reviewers for their helpful comments. The views expressed here are the authors’ and do not necessarily reflect those of the Economic Research Service or the U.S. Department of Agriculture. Any remaining errors are ours. 1 To visualize this situation, imagine two distributions of placement weights, one for light calves skewed to the right and one for heavy calves skewed to the left. The “average” across both distributions would fall in the skewed tail regions of both distributions and not reflect means of either group. This would produce a situation in which average placement weights would appear as in figure 1.
42 Spring 2008 Journal of Agribusiness
Source: Feedstuffs magazine (various issues).
Figure 1. Steer placement weights, final weights, and days fed
Second, though there are studies concluding that higher feed prices favor heavier weight placements in which less total feed is fed for shorter periods (Dhuyvetter and Schroeder, 2000; Anderson and Trapp, 2000; Marsh, 1999), the explicit response of feeder cattle placement weight to changes in feed prices is not often examined. Moreover, with the exception of studies using least-cost rationing, those that optimize over various feeds (variable proportions) do not address the issue of energy/protein requirements (fixed proportions) across weight categories. These feed-related issues have become even more important since the advent of increased demand for corn as a result of increased ethanol production goals and the subsequent supplies of coproducts available for feeding livestock. In addition to the corn/ethanol issues and because a fundamental trade-off between grain and forage underlies the weight class substitutions analyzed in our study, implications of our results extend into the future where cellulosic ethanol production and its effects on stocker/feeder-calf demand for pasture land and forage production are investigated. This paper provides a systematic rationale for different feeder cattle weight/ feed relationships with respect to feeder cattle demand/price relationships. The specific objectives are: (a) to determine if feeder cattle placement weights, energy, and protein are choice variables in cattle feeding; and (b) to examine seasonal and cyclical components of feeder cattle placement weights and feed. To meet these objectives, a generalized McFadden dual cost function is specified and
0
20
40
60
80
100
120
140
160
180
200
0
200
400
600
800
1,000
1,200
1,400
Days on FeedPounds per Head
Average placement weight
Average final weight
Average number of days on feed (right axis)
Mathews, Arnade, and Jones Derived Demand for Cattle Feeding Inputs 43
feeder calf demand by weight is estimated. We focus on Texas placements because combined data for the four states for which placement data by weight class exist are confounded by somewhat different production technologies—for example, “long” yearling production in Nebraska versus wheat pasture/“short” yearling production in Texas. We also have detailed information specific to Texas cattle feeding, allowing us to examine some feed relationships. Several innovations are introduced in this paper. First, we disaggregate feedlot placements into four weight categories. This allows us to examine two types of tradeoffs: (a) between lighter feeder cattle and heavier feeder cattle placements, and (b) between feed and placement weight. We find that feeder cattle in most weight categories are substitutes, as expected in an optimal feeding framework. The lone exception is the relationship between the lightest and heaviest weight categories. We discuss a rationale for this anomaly. Second, we decompose feed prices into energy and protein rather than pricing individual feed ingredients. This allows for parsimony in the model, reducing feed-related equations from five to two. This approach also sidesteps issues of varying nutrient composition of feedstuffs that have become much more compli-cated with the recent increases in grain prices and in the availability and feeding of coproducts from ethanol production. Although our analysis includes the dramatic price increases of 1996, the issues surrounding coproducts and the associated price changes have come after or at the very end of our study period. Our approach to nutrient representation allows us to focus on the underlying protein-energy choice variables between feeder cattle weight categories. The remainder of the paper is organized as follows. The section below high-lights relevant points from the literature on optimal placement weights and feeder cattle price differentials. This is followed by a section describing the specified cost function. Next, the empirical section is presented in which we describe problems with estimation, construction of feed price variables, and data. A results section then follows in which we interpret the elasticities calculated from estimated parameters and describe tests for seasonality and cyclical behavior. The final two sections are devoted to a discussion of results and conclusions.
Feeder Cattle Demand and Average Weights of Cattle Entering Feedlots
Significant factors affecting the price-weight relationships of feeder cattle and calves are reported in studies that investigate feeder cattle price/weight relation-ships. These models either maximize (minimize) cattle-feeding profits (costs) (Anderson and Trapp, 2000; Marsh, 1999; Nelson and Purcell, 1972) or are based on factors affecting price differentials in feeder cattle markets (Buccola, 1980; Coatney, Menkhaus, and Schmitz, 1996; Dhuyvetter and Schroeder, 2000; Fau-sett, Dhuyvetter, and Lippert, 1998; Lambert et al., 1989; Simpson and Alderman, 1983). Marsh (1999) assumed feeder cattle placement weights were important to the cattle-feeding decision, but found only indirect support.
44 Spring 2008 Journal of Agribusiness
Feed prices are also correlated with feeder cattle weights and feeder cattle prices. Corn prices are positively related to feeder cattle weights (Dhuyvetter and Schroeder, 2000; Anderson and Trapp, 2000; Marsh, 1999). Higher corn prices favor heavier-weight placements fed for shorter periods, thus consuming less high-priced corn. Buccola (1980) reports an inverse relationship between corn price and feeder cattle price through an implied positive relationship between feeder cattle quantity and corn price. The effects of prices on placements in feedlots have also been explored. Kastens and Schroeder (1994) demonstrate that significant effects on feeder cattle placements exist from fed-cattle futures prices and past profits over expected profits. However, they assume a fixed placement weight of 650 pounds. Other variables affecting feeder cattle prices include seasonality (Anderson and Trapp, 2000; Dhuyvetter and Schroeder, 2000), cattle cycles (Simpson and Alderman, 1983), recent feeding margins (Dhuyvetter and Schroeder, 2000), and sex (Dhuy-vetter and Schroeder, 2000; Lambert et al., 1989). These studies are not constructed to quantify relationships between weight categories or to deal with inconsistencies between studies. For example, Lambert et al. (1989) and Coatney, Menkhaus, and Schmitz (1996) reported negative relationships between feeder cattle price and weight. Dhuyvetter and Schroeder (2000), on the other hand, reported a positive, but declining relationship between price and weight. They point out that the number of interactions in the model makes it difficult to interpret the marginal effects of their variables. Further, none of these studies is designed to examine the inverse relationship between protein requirements, age, and weight of cattle (e.g., Stock, Mader, and Klopfenstein, 1984), or the relationships between energy and protein in feeding rations and feeder cattle placement weights. Our approach allows us to determine the mar-ginal effects between weight categories across these variables.
A Cost Function
In addition to the above disadvantages, many model specifications for describing feeder cattle price-weight relationships tend to be ad hoc. By treating feeder cattle of different weight categories as distinct inputs into fed-cattle or beef production, this paper provides a logical, theoretical construct for examining the derived demand for distinct weight categories of feeder cattle relative to one another. A cost-function framework is appropriate because, given our monthly data, feeder cattle supplies can be viewed as fixed in the sense that decisions to produce feeder cattle were made one to two years earlier. From the dual cost-function specification, one can construct a system of derived input demand equations for estimation by invoking Shephard’s lemma (Diewert, 1971; Young et al., 1987). Thus, a formal means can be used to specify feedlot demand for feeder calves of various weight categories. By allowing output deter-mination to be exogenous to our model, this framework also alleviates the need to specify an expected output price variable. This also allows us to avoid claiming
Mathews, Arnade, and Jones Derived Demand for Cattle Feeding Inputs 45
what feedlot objectives are. Cost minimization is not only consistent with profit maximization, but is consistent with most other objectives as well. While many functional forms are well known, the generalized McFadden cost function is notable for its ease of use (Diewert and Wales, 1987). It automatically satisfies most properties of cost functions, including the key property that cost functions are homogeneous of degree one in input prices. It does not satisfy conditions of symmetry and concavity in input prices, but these conditions are easily imposed.2 The generalized McFadden cost function specified for the cattle-feeding application is expressed as:
(1) 1
( , ) ( )2
,
/i i ij i j ki i j
i i ir i r ri i r r
C w Y w w w w
wY w O O Y
where C is the dual cost function with prices (w) and output (Y) as arguments; αi, βij, λi, and ηir are parameters to be estimated; Or represents r other variables; and i, j represent feeder cattle weight categories (i, j = 1, 2, and 3) and feed (i, j = 5 and 6). The numeraire, wk, is the price of one weight category of feeder cattle. In the model specified here, feeder cattle of distinct weight categories are treated as distinct elements, xi, of an input vector, x, each with a distinct price per unit, wi, in a corresponding input price vector, w. Other inputs, such as feeds and feed prices, are included as elements in the input and price vectors as well. This specification assumes input prices are exogenous and is consistent with a perfectly competitive market, which we assume exists between cattle feeders and feeder cattle producers. Output (Y), total pounds of fed cattle produced, and an integral element of the dual cost function framework, is represented by the total number of feeder cattle multiplied by the expected slaughter weight. This proxy for output gives us a measure in which major inputs are effectively reduced to feed and feeder cattle. Our total output variable serves both the key theoretical role assigned to it by theory as an argument in our cost function and a practical role in allowing output to be represented by a single variable. In addition to requiring disaggregated data that would include final weights, modeling final weight for each feeder cattle weight category would be relevant only if we were to model a distinct cost function for each placement-weight category. However, such a model structure would have prevented us from exploring the various substitution relationships between weight categories.
2 An adequately representative cost function must be concave in the price of the inputs. That is, the matrix of second derivatives (represented by the ij parameters) of the cost function with respect to input prices must be negative definite. Diewert and Wales (1987) collect the ij parameters into a Cholesky matrix and show, by representing this matrix as the product of a lower triangular matrix and its transpose, it is possible to impose concavity of the cost function at every data point. This procedure also ensures that symmetry conditions hold and that input demands are downward sloping.
46 Spring 2008 Journal of Agribusiness
By this notation and by applying Shephard’s lemma, the first derivative with respect to input prices yields conditional input demands, which can be written as:
(2) ( , ) / ( ) ./i i i i j j k i ir rj r
C w Y w x w w Y S
Sr in (2) replaces Or in (1) and represents seasonal variables as defined below. Because the numeraire (wk) is an input price, input demands are homogeneous of degree zero in input prices in this specification, as required by theory. By jointly estimating demands for different weight categories along with demand for feed, it is possible to obtain own- and cross-price effects on each weight category. This reveals information about whether demands for weight categories of feeder cattle are substitutes for other categories of feeder calves and feed. Positive cross-elasticities among weight categories imply input substitution. Ordinarily, negative cross-elasticities imply complementarity, which, among our weight categories, is interpreted as an anomaly and is discussed below. Incor-porating feed demand allows us to examine the impact of price changes for each feeder cattle weight category on demand for feed.
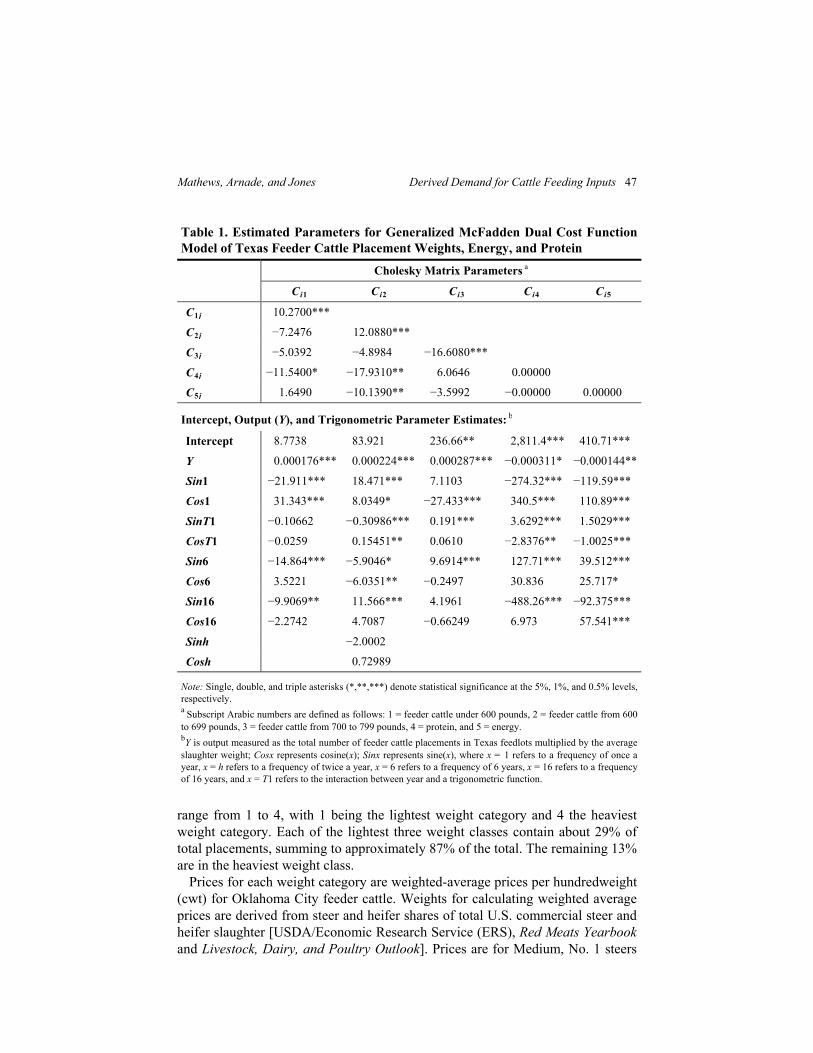
Empirical Model Estimation and Results This section presents estimation of, and results from, a version of the generalized McFadden cost function. The empirical analysis begins with tests for stationarity in variables. Most of the normalized variables are stationary, so the model is estimated in levels. Only protein quantity and protein price are nonstationary. We estimate the system of five input demand equations using seemingly un-related regression (SUR). A Cholesky decomposition of the βij parameter matrix is used to impose concavity on the cost function (Diewert, 1971). Although our system of equations is highly nonlinear in parameters, algorithms used to search for a maximum converged. Starting values were varied to determine whether we obtained a global maximum. Given the consistency of our results, we assume our solution represents a global maximum to the likelihood function. Results are presented in table 1.
Data
All data are monthly, beginning with December 1995 and continuing through October 2006. Output is represented as the total number of feeder cattle place-ments in Texas multiplied by the expected slaughter weight five months ahead [U.S. Department of Agriculture/National Agricultural Statistics Service (USDA/ NASS), Livestock Slaughter], ignoring the approximate 1% industry-wide death loss. Feeder cattle data consist of the number of head in each of four weight categories placed on feed in Texas: under 600 pounds, 600–699 pounds, 700–799 pounds, and over 800 pounds (USDA/NASS, Cattle on Feed). Weight categories
Mathews, Arnade, and Jones Derived Demand for Cattle Feeding Inputs 47
Table 1. Estimated Parameters for Generalized McFadden Dual Cost Function Model of Texas Feeder Cattle Placement Weights, Energy, and Protein
Cholesky Matrix Parameters a
Ci1 Ci2 Ci3 Ci4 Ci5
C1j 10.2700***
C2j −7.2476 12.0880***
C3j −5.0392 −4.8984 −16.6080***
C4j −11.5400* −17.9310** 6.0646 0.00000
C5j 1.6490 −10.1390** −3.5992 −0.00000 0.00000
Intercept, Output (Y), and Trigonometric Parameter Estimates: b
Intercept 8.7738 83.921 236.66** 2,811.4*** 410.71***
Y 0.000176*** 0.000224*** 0.000287*** −0.000311* −0.000144**
Sin1 −21.911*** 18.471*** 7.1103 −274.32*** −119.59***
Cos1 31.343*** 8.0349* −27.433*** 340.5*** 110.89***
SinT1 −0.10662 −0.30986*** 0.191*** 3.6292*** 1.5029***
CosT1 −0.0259 0.15451** 0.0610 −2.8376** −1.0025***
Sin6 −14.864*** −5.9046* 9.6914*** 127.71*** 39.512***
Cos6 3.5221 −6.0351** −0.2497 30.836 25.717*
Sin16 −9.9069** 11.566*** 4.1961 −488.26*** −92.375***
Cos16 −2.2742 4.7087 −0.66249 6.973 57.541***
Sinh −2.0002
Cosh 0.72989
Note: Single, double, and triple asterisks (*,**,***) denote statistical significance at the 5%, 1%, and 0.5% levels, respectively. a Subscript Arabic numbers are defined as follows: 1 = feeder cattle under 600 pounds, 2 = feeder cattle from 600 to 699 pounds, 3 = feeder cattle from 700 to 799 pounds, 4 = protein, and 5 = energy. bY is output measured as the total number of feeder cattle placements in Texas feedlots multiplied by the average slaughter weight; Cosx represents cosine(x); Sinx represents sine(x), where x = 1 refers to a frequency of once a year, x = h refers to a frequency of twice a year, x = 6 refers to a frequency of 6 years, x = 16 refers to a frequency of 16 years, and x = T1 refers to the interaction between year and a trigonometric function.
range from 1 to 4, with 1 being the lightest weight category and 4 the heaviest weight category. Each of the lightest three weight classes contain about 29% of total placements, summing to approximately 87% of the total. The remaining 13% are in the heaviest weight class. Prices for each weight category are weighted-average prices per hundredweight (cwt) for Oklahoma City feeder cattle. Weights for calculating weighted average prices are derived from steer and heifer shares of total U.S. commercial steer and heifer slaughter [USDA/Economic Research Service (ERS), Red Meats Yearbook and Livestock, Dairy, and Poultry Outlook]. Prices are for Medium, No. 1 steers
48 Spring 2008 Journal of Agribusiness
and heifers weighing 500–550 pounds (for the under-600-pound weight category 1), steers and heifers weighing 600–650 pounds (600–699-pound category 2), steers and heifers weighing 700–750 pounds (700–799-pound category 3), and steers and heifers weighing 750–800 pounds (over-800-pound category 4), and are used as proxies for prices for each weight category. It seems a reasonable assumption that feeder cattle placements under 600 pounds are likely to be close to the 600-pound boundary; thus, prices for the 500–550-pound cattle appear to be a reasonable proxy. Prices for the over-800-pound category present a dilemma in that the category is essentially unbounded on the upper side, and, in addition to being somewhat intermittent in a sense, no price series seemed to more adequately proxy this category than the prices we used. Cattle prices are from the USDA/ERS (Red Meats Yearbook and Livestock, Dairy, and Poultry Outlook) and the Livestock Market Information Center database. Feed prices are monthly from ERS’ “High Plains Cattle Feeding Simulator” (USDA/ERS, Livestock, Dairy, and Poultry Outlook). The feed variables are reduced from five inputs to two by using feed data to derive prices for two nutrient variables, protein and energy. Breaking feed into nutrient components allows us to specify a more parsimonious, five-equation model consisting of two feed demand equations3 and three equations representing demand for feeder calves of each of three weight categories. The dependence on corn and soybean meal prices is defensible because corn and soybean meal constitute an overwhelming share (greater than 90%) of total livestock energy and protein sources. This parsimonious approach is attractive because the data series are not as extensive as we would like, and the nonlinearities in our empirical model made convergence a serious issue in early model specifications in which multiple feedstuffs were included as separate variables. It also allows us to evalu-ate whether protein and energy were in fixed proportions for each feeder-cattle weight class (e.g., Weichenthal, Rush, and Van Pelt, 1999). In addition to prices for the feed components, quantity data are also needed. Quantities derived from a least-cost feed ration model (Mathews, 2002) are used to obtain estimates of the feed shares and then to calculate the quantity of energy and protein consumed.
Results: Relationships Among Inputs Published data indicate an inverse relationship between price and weight [USDA/ Agricultural Marketing Service (AMS)], despite occasional inversions and numerous offsetting factors (e.g., Lambert et al., 1989). In this section, we offer
3 The protein and energy content of two basic feeds, corn (or milo—which is similar to corn in feeding value) and cottonseed meal, were used to derive prices for protein and energy. Protein and energy prices were derived via a simple 2 × 2 matrix, A, consisting of coefficient weights of protein and energy in the two feeds. Representing the component prices at time t by a 2 × 1 vector Pct and the feed prices by the 2 × 1 vector Pft , the component prices at observation t were derived. That is: (a) APct = Pft and (b) Pct = A−1Pft .
Mathews, Arnade, and Jones Derived Demand for Cattle Feeding Inputs 49
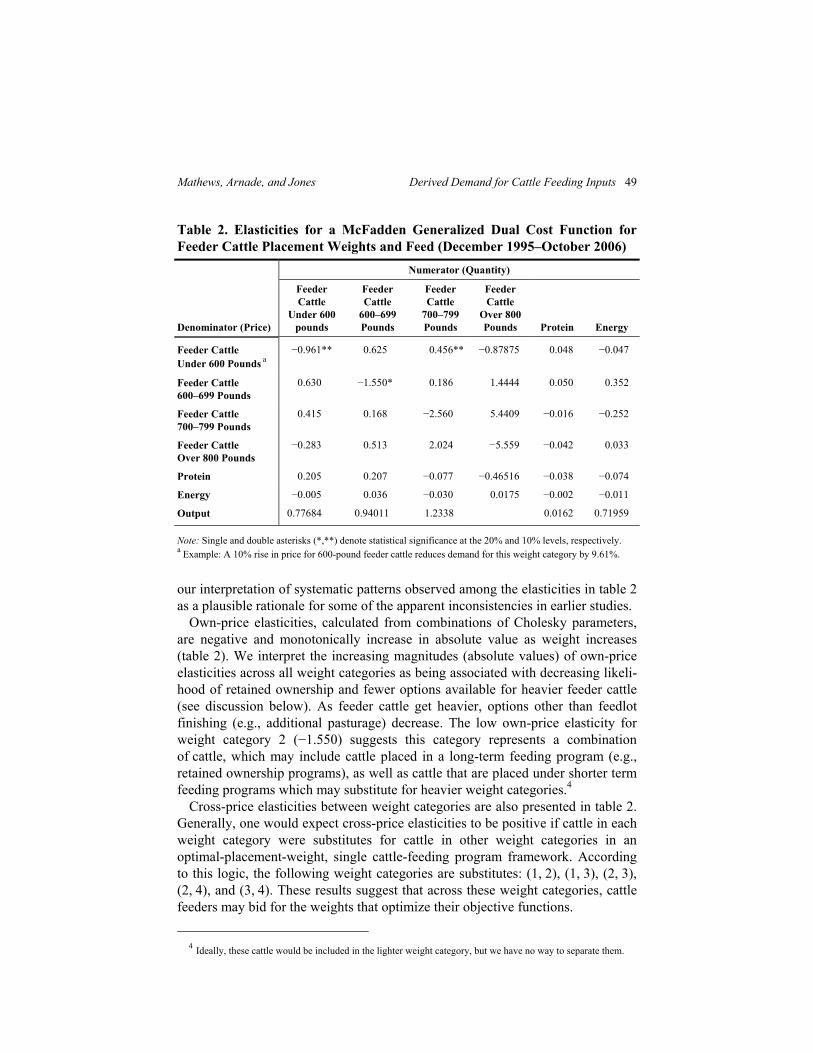
Table 2. Elasticities for a McFadden Generalized Dual Cost Function for Feeder Cattle Placement Weights and Feed (December 1995–October 2006)
Numerator (Quantity)
Denominator (Price)
Feeder Cattle
Under 600 pounds
Feeder Cattle
600–699 Pounds
Feeder Cattle
700–799 Pounds
Feeder Cattle
Over 800 Pounds
Protein
Energy
Feeder Cattle Under 600 Pounds a
−0.961** 0.625 0.456** −0.87875 0.048 −0.047
Feeder Cattle 600–699 Pounds
0.630 −1.550* 0.186 1.4444 0.050 0.352
Feeder Cattle 700–799 Pounds
0.415 0.168 −2.560 5.4409 −0.016 −0.252
Feeder Cattle Over 800 Pounds
−0.283 0.513 2.024 −5.559 −0.042 0.033
Protein 0.205 0.207 −0.077 −0.46516 −0.038 −0.074
Energy −0.005 0.036 −0.030 0.0175 −0.002 −0.011
Output 0.77684 0.94011 1.2338 0.0162 0.71959
Note: Single and double asterisks (*,**) denote statistical significance at the 20% and 10% levels, respectively. a
Example: A 10% rise in price for 600-pound feeder cattle reduces demand for this weight category by 9.61%.
our interpretation of systematic patterns observed among the elasticities in table 2 as a plausible rationale for some of the apparent inconsistencies in earlier studies. Own-price elasticities, calculated from combinations of Cholesky parameters, are negative and monotonically increase in absolute value as weight increases (table 2). We interpret the increasing magnitudes (absolute values) of own-price elasticities across all weight categories as being associated with decreasing likeli-hood of retained ownership and fewer options available for heavier feeder cattle (see discussion below). As feeder cattle get heavier, options other than feedlot finishing (e.g., additional pasturage) decrease. The low own-price elasticity for weight category 2 (−1.550) suggests this category represents a combination of cattle, which may include cattle placed in a long-term feeding program (e.g., retained ownership programs), as well as cattle that are placed under shorter term feeding programs which may substitute for heavier weight categories.4 Cross-price elasticities between weight categories are also presented in table 2. Generally, one would expect cross-price elasticities to be positive if cattle in each weight category were substitutes for cattle in other weight categories in an optimal-placement-weight, single cattle-feeding program framework. According to this logic, the following weight categories are substitutes: (1, 2), (1, 3), (2, 3), (2, 4), and (3, 4). These results suggest that across these weight categories, cattle feeders may bid for the weights that optimize their objective functions.
4 Ideally, these cattle would be included in the lighter weight category, but we have no way to separate them.
50 Spring 2008 Journal of Agribusiness
The cross-elasticities between (1, 4) are negative, implying the heaviest and lightest feeder cattle categories are not substitutes. In the context of optimal cattle-feeding strategies, negative cross-elasticities are anomalies. How does one interpret a negative cross-price elasticity? One interpretation may be that our model does not adequately capture these relationships. However, taking our results at face value, negative cross-price elasticities indicate that feeder cattle in the lightest and heaviest weight classes are not substitutes. This could occur if cattle feeders are not all operating under the same objective function. We discuss rationales in more detail in a separate section below. The interpretation of protein and energy elasticities is more straightforward. The negative cross-elasticities between energy and protein imply an expected complementary relationship between energy and protein. Being near zero, they also imply that protein and energy are necessary inputs for feeding cattle and that near-fixed proportions likely exist between energy and protein, as one might expect in average rations for each placement weight category. The generally small cross-price elasticities between energy and protein and the various feeder cattle weight categories suggest relatively small responses to price changes within each weight category. Demand for protein appears to be more elastic with lighter placement weights. Specifically, as protein prices increase, it is feasible to switch to other feeds because cattle at these lighter weights can either be grown or finished, each activity of which has different protein require-ments, whereas heavier cattle can only be finished. Thus, the protein requirements of heavier cattle are more inelastic. This is also consistent with a reviewer’s comment that urea can constitute a larger share of the protein in heavier-weight cattle rations, and urea prices, in addition to being associated with grain prices, are also associated with fuel energy prices. Cross-elasticities between energy and weight categories are not as clearly related, especially for the two middle weight categories. It seems that within each weight category, energy price does not have much effect on feeder cattle place-ments, as the elasticities are small. This may be because energy constitutes the majority of the ration for any weight class and is necessary for cattle feeding of any weight. It may also be a reflection of what happens between weight classes as corn prices change. If each calf is placed at a heavier or lighter weight, reflecting responses to changes in corn prices, then shifts in the middle two weight cate-gories may only reflect cattle shifting by one weight class. However, these shifts would be observed as changes in the two extreme weight classes. To gain better insight into what is occurring, recall from the data section that each of the lower three weight classes consist of approximately equal shares of cattle, with a smaller share in the heaviest weight class. Suppose cattle are pastured for 60 days longer because corn prices increase. And suppose they gain a pound per day for a total of 60 extra pounds, and that the mean weight for each respective class is 550 pounds, 650 pounds, 750 pounds, and 850 pounds. Just over half of the lightest calves will be shifted to the 600–699-pound class. About the same number of calves will shift from the 600–699-pound class to the
Mathews, Arnade, and Jones Derived Demand for Cattle Feeding Inputs 51
700–799-pound class and from the 700–799-pound class to the over-800-pound class. The number of calves in both the 600–699-pound and the 700–799-pound classes remains nearly unchanged—i.e., these two classes show very little, if any, response to higher corn prices. However, the number of cattle in the lightest weight class shrinks and the number in the heaviest weight class increases—thus, these two classes display large responses to higher corn prices. By considering only the lightest and heaviest weight classes, estimated elastici-ties imply that as energy prices increase, light-weight feeder cattle placements decline and heavy-weight placements increase. This rationale is consistent with conventional wisdom and economic reasoning, and would indicate that, as grain prices increase due to ethanol-driven demand for corn, one would expect to ob-serve greater placements of heavier-weight feeder cattle. Indeed, events occurring just beyond the range of our study period reflect the following: January, February, March, May, and July 2007 placements in the over-800-pound category were relatively greater and placements in the under-600-pound category were lower from October 2006 placements through July 2007 placements than year-earlier numbers as average corn prices rose to near the $4 per bushel level. Events were similar in 1996 near the beginning of our study period as corn prices approached $5 per bushel. The very small cross-elasticity between the lightest feeder cattle weight class and energy may also be interpreted as further evidence that the existence of more than one objective function distorts our results. Our elasticities represent a complex combination of Cholesky parameters. Because of the complexity of the elasticity calculation, standard errors for the elasticities are estimated via bootstrapping (100 times) (table 2). However, others (e.g., Arnade and Kelch, 2007) have demonstrated that these bootstrapped elasticity standard errors have very wide confidence intervals, which limits the usefulness of the information they provide. Several of our elasticities are border-line significant, and, given the problems with standard error calculations, we were pleased our standard errors were as small as they were.
Results: Seasonal and Cyclical Behavior
We used trigonometric functions to capture seasonal and cyclical variations. Seasonality variables allow us to test distinct hypotheses related to both seasonal frequency and seasonal location (Anderson and Trapp, 2000; Arnade and Pick, 1998). The Sr from equation (2) are specified as:
cos(2 / ) sin(2 / ),r r r r rS a t n b t n
where subscripts r = 1 for one seasonal peak per year, h for two seasonal peaks per year, and 16 for a 16-year cattle cycle, while t = time proxied by observation number (integers beginning with 1), n1 = 12 (months per cycle), nh = 6 (months per cycle), and n16 = 192 (months per cycle). A trend component is also added by multiplying the intra-year sine and cosine terms by t, or, equivalently, Sr t.
52 Spring 2008 Journal of Agribusiness
Results for trigonometric parameters exhibit significance for seasonal variations in all equations (a 12-month cycle) and variations associated with a cattle cycle in all except the third weight category for the feeder cattle equations (table 1). The possibility of two cycles in the equation for the second weight category is re-jected. Trend is significant in all equations except the lightest weight feeder cattle equation. Pairwise tests for differences between seasonal location for different feeder-calf weight categories are similar to those used by Arnade and Pick (1998). Our results demonstrate significantly different seasonal patterns between all equations except (1, 3) and (1, protein). Both 6-year and 16-year cycles are significant. The 16-year cycle is consistent with the 1991–2004 cattle cycle for which the liquidation phase—the bulk of our data series—extended for nine years. The 6-year cycle is more of a puzzle, but may have to do with weather patterns extant during the study period. It could also be consistent with the portions of cyclical expansions included at either end of our data series.
Discussion In this section, we discuss several features of our results that stand out, particu-larly the issue of substitution versus “complementarity” relationships among the various weight categories and feeds. We include discussion on retained ownership that lays out a rationale for multiple cattle-feeding objective functions, each of which could be consistent with cost minimizations under different resource sets. We also include some supply-side comments that may have implications for the plausibility of multiple cattle-feeding objectives. Our comments apply to Texas cattle feeding because this represents the data we used for our analysis. Elasticities for weight category 4, the numeraire, were not directly estimated, but were calculated based on theoretical relationships among elasticities. As such, they may be indicative only of actual responses, rather than quantitatively useful. Positive cross-elasticities between weight categories suggest substitution, while the negative cross-elasticity between 1 and 4 suggests a largely separate feeding enterprise. Evidence seems to be stronger for the heavier weight cate-gories to act as substitutes for the lighter categories, but apparently only up to a point.
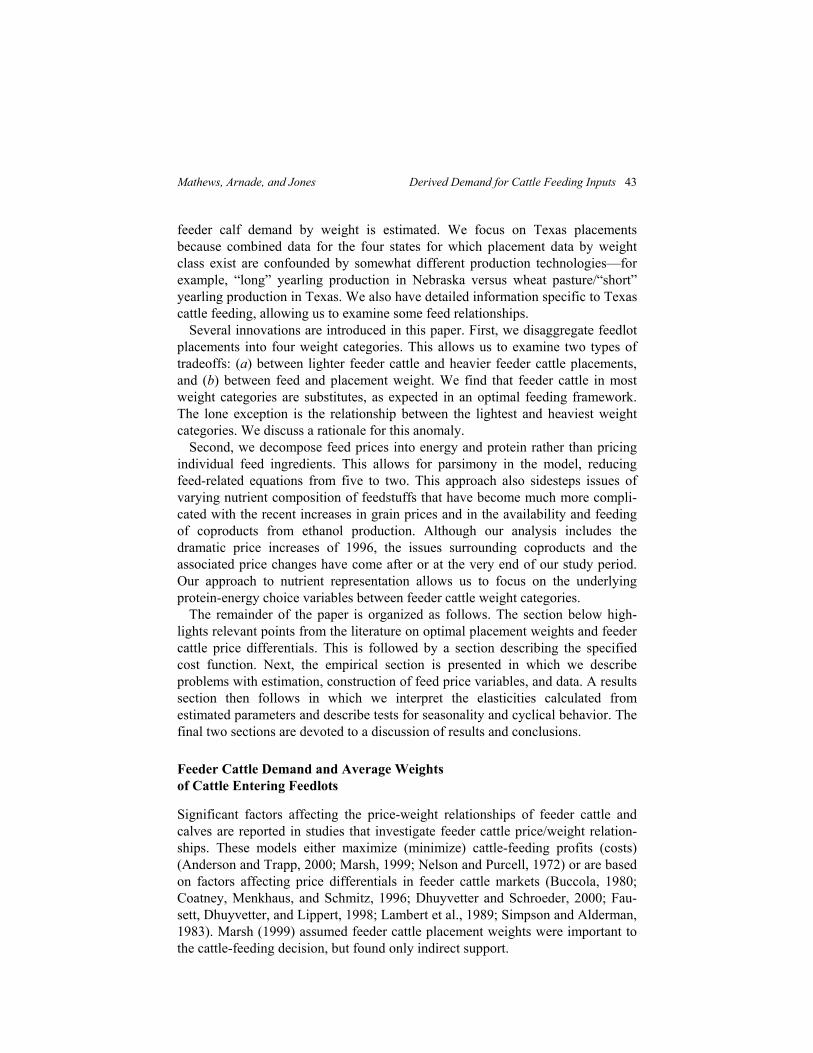
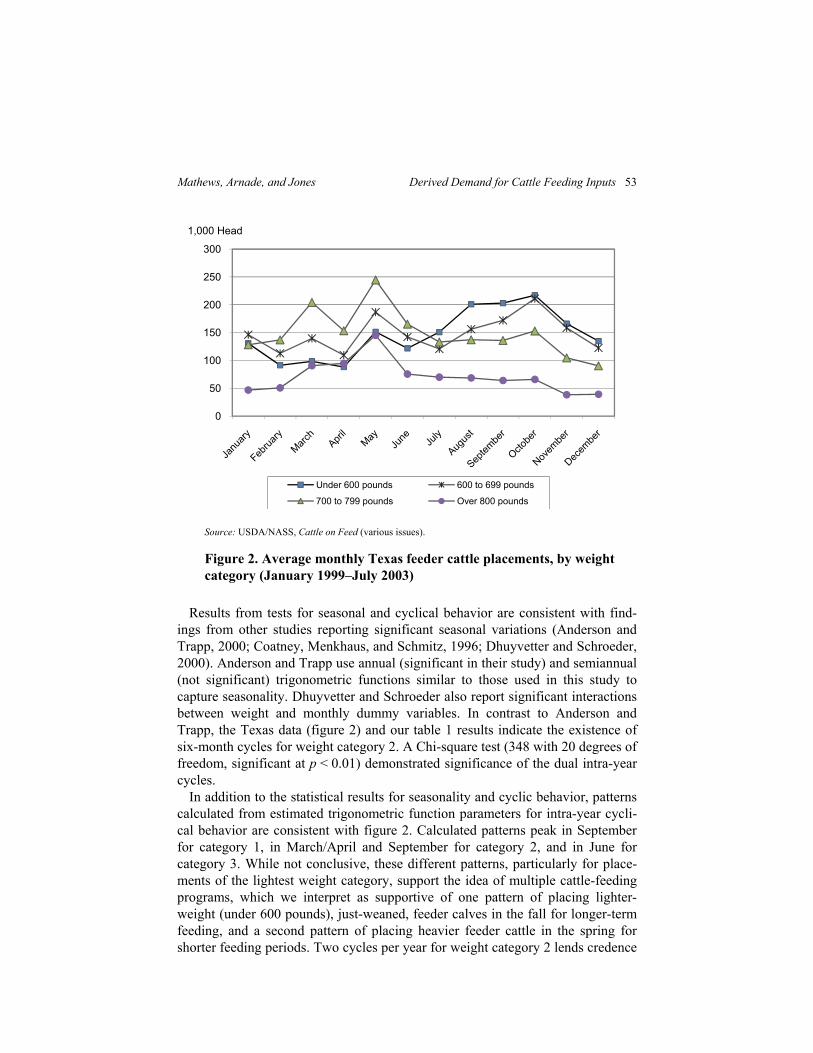
Seasonal and Cyclical Behavior In the Texas data (figure 2), seasonality is characterized by peak placements of heavier cattle during the spring (which coincides with the period when many feeder cattle are removed from wheat pasture), and peak placements of the lightest-weight cattle during the fall (which coincides with the fall weaning period when most of the calves born during the year are weaned) [USDA/Animal and Plant Health Inspection Service (APHIS), 1998].
Mathews, Arnade, and Jones Derived Demand for Cattle Feeding Inputs 53
Source: USDA/NASS, Cattle on Feed (various issues).
Figure 2. Average monthly Texas feeder cattle placements, by weight category (January 1999–July 2003)
Results from tests for seasonal and cyclical behavior are consistent with find-ings from other studies reporting significant seasonal variations (Anderson and Trapp, 2000; Coatney, Menkhaus, and Schmitz, 1996; Dhuyvetter and Schroeder, 2000). Anderson and Trapp use annual (significant in their study) and semiannual (not significant) trigonometric functions similar to those used in this study to capture seasonality. Dhuyvetter and Schroeder also report significant interactions between weight and monthly dummy variables. In contrast to Anderson and Trapp, the Texas data (figure 2) and our table 1 results indicate the existence of six-month cycles for weight category 2. A Chi-square test (348 with 20 degrees of freedom, significant at p < 0.01) demonstrated significance of the dual intra-year cycles. In addition to the statistical results for seasonality and cyclic behavior, patterns calculated from estimated trigonometric function parameters for intra-year cycli-cal behavior are consistent with figure 2. Calculated patterns peak in September for category 1, in March/April and September for category 2, and in June for category 3. While not conclusive, these different patterns, particularly for place-ments of the lightest weight category, support the idea of multiple cattle-feeding programs, which we interpret as supportive of one pattern of placing lighter-weight (under 600 pounds), just-weaned, feeder calves in the fall for longer-term feeding, and a second pattern of placing heavier feeder cattle in the spring for shorter feeding periods. Two cycles per year for weight category 2 lends credence
0
50
100
150
200
250
300
1,000 Head
Under 600 pounds 600 to 699 pounds
700 to 799 pounds Over 800 pounds
54 Spring 2008 Journal of Agribusiness
to our suspicion that this category contains cattle destined for both shorter-term and longer-term feeding programs.
Input Substitution
The cattle-feeding literature implies higher corn prices should favor heavier-weight placements that will be on feed for shorter periods (e.g., Marsh, 1999; Jordan et al., 2002). Similar expectations exist for protein feeds—when protein feed prices are high, it is more efficient to feed heavier cattle with protein requirements that are slightly lower than lighter cattle, since heavier cattle are on feed for a shorter period. Results from other studies with respect to protein and energy are mixed and lack the systematic components presented here to explain differences (table 2). For example, some results (Anderson and Trapp, 2000; Dhuyvetter and Schroeder, 2000; Buccola, 1980) show positive relationships between energy and protein prices and feeder cattle weight. Our results are also mixed, perhaps because we model the energy and protein characteristics of feed, rather than feeds per se. Elasticities for both protein and energy and their cross-elasticities are quite small in our results. We interpret the small cross-elasticities between energy and protein as implying fixed proportions between protein and energy. If these rela-tionships hold across energy sources, then higher corn prices (e.g., due to demand for corn for ethanol production) will induce feeding heavier cattle for shorter periods as a strategy to lower costs. Furthermore, implications from feeding heavier cattle could extend backward to cattle and calf inventories and forward with trade implications. Retaining calves on relatively cheaper pastures for longer periods implies smaller total inventories because of the limited pasture resource, and consequently a smaller national cow herd. Trade implications derive from current maximum age-at-slaughter restric-tions (20 months for U.S. exports of beef to Japan and 30 months for U.S. exports to most other countries) in place because of the discovery of bovine spongiform encephalopathy (BSE) in the United States in 2003. The complementary relationship between lighter weight categories of feeder cattle placements and protein may suggest more protein feeding flexibility with lighter cattle. Given the opportunities to utilize additional feed ingredients because of expanded ethanol production and subsequent supplies of coproducts, our find-ings imply that other nutrients may become important to balancing future rations. For example, distillers’ grains contain higher levels of protein than most grains, but similar levels of energy per unit of feedstuff. The coproducts also contain very different levels of other nutrients such as sulphur, phosphorus, and lysine.
The Potential for Multiple Cattle-Feeding Objective Functions
One objective of this paper was to determine the extent to which feeder cattle placement weights are choice variables in cattle feeding. Our generally positive
Mathews, Arnade, and Jones Derived Demand for Cattle Feeding Inputs 55
cross-elasticities for weight categories are consistent with the view expressed in previous studies that feeder-calf placement weight is a choice variable in an optimization format. However, the negative cross-elasticities between weight categories 1 and 4 are an anomaly. An explanation for the anomaly of a negative cross-elasticity is that different objective functions may motivate behavior incon-sistent with a single optimal placement weight. Such behavior may also be consistent with more than one cattle-feeding objective—for example, a long-term feeding enterprise versus a short-term enterprise. There may be several reasons why different cattle feeders may have different objective functions. Objective functions vary because of differences in resource sets, forms of business organization, individual utility functions, and numerous other factors. Our results confirm (and a reviewer points out) that grains and grass can be substitutes. Keeping calves on pasture longer to capture relatively lower cost gains before placement in feedlots explains much of the observed behavior with respect to placement weights. Still, other real-world complexities exist. For example, a grain producer may attempt to capture rents by feeding owned grain to lighter-weight calves. Placing light calves on feed is a longer-term feeding commitment than placing heavy calves. This is because business practices and objectives can extend from those of multiple owners of feeder cattle between cow-calf and feedlot to full ownership retention of calves by cow-calf producers through the feedlot phase or beyond. Once a business plan is in place, cash flow problems and/or tax-related penalties inherent in switching from long-term to short-term enterprises can discourage switching behavior. Whatever the underlying motivation, variation in length of the production/ planning horizon associated with different objective functions, vertical integra-tion, or retained ownership has the potential to distort weight/price relationships, given the extent, advantages, and costs of adjustment with switching between long- and short-term production programs. To understand why there might be multiple objective functions, it is helpful to consider the number of ways calves proceed from cow-calf operations to slaughter (Brewer et al., 2003; Guyer, 1996; Jordan et al., 2002). In general, an inverse relationship exists between length of feeding period and feeder cattle placement weight (figure 1). Calves may be placed on feed shortly after weaning (calf-feds), at lower placement weights ranging between 500 and 650 pounds per head, for 7–10 months before reaching slaughter weights which are often below 1,250 pounds. At the other end of the spectrum, heavy-weight yearling cattle weighing 800 pounds or more may be placed on feed for periods as short as 3–4 months before slaughter, and can reach slaughter weights in excess of 1,350 pounds. Thus, a cow-calf cattle feeder retaining ownership would have a production period of 14–18 months, whereas a cattle feeder who purchased feeder cattle at 800-plus pounds for feeding could have a production period as short as 3–4 months.
56 Spring 2008 Journal of Agribusiness
Retained ownership offers a number of financial advantages. Given seasonality in prices and a longer production process, retained ownership provides additional opportunities to contract relatively more favorable input and output prices. The advantages demonstrated by Garoian, Mjelde, and Conner (1990) for retained ownership on pasture (allowing decision makers to take advantage of seasonally higher cattle prices) may be extended through the feedlot. In addition, long-term feeding programs provide mixed-enterprise producers (e.g., grain-cattle produ-cers) synergistic opportunities to “market” both grain and cattle. For instance, Albright, Schroeder, and Langemeier (1994) suggest that seasonal variation in average corn prices meshes with seasonal patterns observed in some placement weight categories (e.g., when low harvest prices for corn coincide with peak placements of lighter-weight calves). Thus, marketing grain through cattle could occur at seasonally higher prices for both. There also may be premiums for younger, higher quality carcasses at slaughter (Brewer et al., 2003). Finally, fluctuations in credit requirements, cash flow, and tax liability consid-erations complicate any decision to switch between longer-term production programs characteristic of retained ownership and shorter-term programs where ownership is relinquished as feeder calves are purchased (Guyer, 1996). For example, viewing the entire process of raising and feeding cattle as a single enterprise, like farrow-to-finish hog production, where feed costs for cattle in feedlots are inversely related to placement weights (Jordan et al., 2002.; Mark, Schroeder, and Jones, 2000; Marsh, 1999), there are clearly tradeoffs between feeding costs and pasture expenses, interest rates, and other factors. These can offset one another, particularly over the extended production process from calves to beef. Jordan et al. (2002) suggest that lower corn prices and narrower spreads between weight categories could shift the cost advantage to lower placement weights. These arguments are consistent with the results obtained here. The Animal and Plant Health Inspection Service provides some insight into the extent of retained ownership: Cow-calf producers retain ownership of almost a third of calves for grazing or feeding after weaning (USDA/APHIS, 1994) at an average weight of 515 pounds (USDA/APHIS, 1998). Approximately one-fourth of feeder cattle placements are under 600 pounds (USDA/NASS, Cattle on Feed), which is equivalent to approximately 15% of the annual calf crop.
Conclusions, Implications, and Limitations
Our results provide evidence that cattle feeders substitute among weight categor-ies as the prices of feed and feeder cattle change. Thus, placement weights can serve as a key choice variable for use by feedlots to reduce costs. Our findings reveal an indication of the extent to which these substitutions may occur. Negative cross-price elasticities between the lightest-weight feeder cattle and the heaviest indicate that these categories of feeder cattle are not substitutes, but are possibly inputs into separate cattle-feeding programs. Models of a single optimal placement weight may not appropriately account for more than one cattle-feeding
Mathews, Arnade, and Jones Derived Demand for Cattle Feeding Inputs 57
program in which some classes of inputs (in our case, the heaviest and lightest categories of feeder cattle) do not function as substitutes.5 We suggest that multiple feeding programs might be characterized as short-term and long-term feeding programs motivated by a number of possibilities. These include, but are not necessarily limited to, capture of relatively cheap feed resources (e.g., relatively cheaper pasture gains), feeding one’s own feedstuffs (e.g., corn), or retained ownership. Previous studies were neither designed nor implemented in ways amenable to exploring the possibility of multiple cattle-feeding programs. In addition, data in which details about weight categories and feeding regimes are averaged or aggregated are not generally sufficiently detailed to permit analyses to discern program differences. Our study does disaggregate feeder calf demand by weight category. Many problems occur in empirically implementing such a model. In our data, there is likely overlap between weight categories that interferes with discerning inter-category relationships. For example, there is likely some overlap of the lightest category into the second weight category of calves. Both categories may include feeder calves falling under retained ownership. Retained ownership could extend into the heavier weight categories as well if pasture programs extend production periods. Embedded in this overlap is also the distinction between prices for calves versus yearlings of a given weight in which calves may sell at a discount to yearlings, attributed to the perceived propensity of yearlings to perform better when placed on feed. Symmetry and homogeneity conditions are imposed on our model that allow us to obtain elasticities for the numeraire. Despite the sound theoretical basis, own-price elasticities calculated for numeraire commodities using the homogeneity relationships can appear extreme. In the case of our numeraire commodity, the calculated own-price elasticity for the heaviest (over 800 pounds) category of feeder cattle is somewhat large. While it is likely useful as an indicator of the continuation of the general pattern observed in the other elasticities directly derived from estimated parameters, it may not be useful for explicit price-quantity calculations. We examine several aspects of the complex relationships between weight cate-gories of feeder cattle in more detail, but do not examine other aspects. One such aspect is the relationship between steers and heifers, which we treat by relying on steer- and heifer-weighted average prices and slaughter. More in-depth treatment is left for future research. This extension would no doubt involve a challenge with handling additional multicollinearity between steer and heifer prices in each weight category.
5 The lack of substitutability between the lightest and heaviest weight categories of feeder cattle could become more exaggerated as a result of the agreement between the United States and Japan regarding post-BSE trade in cattle under 21 months of age, particularly if heavier placement cattle become ready for market at ages beyond 20 months.
58 Spring 2008 Journal of Agribusiness
A second aspect to be explored is the demand relationships among various energy feeds and among various protein feeds. While earlier specifications of our model did include a number of separate feedstuffs, insufficient degrees of free-dom and problems with convergence due to nonlinearities in our model motivated a different approach. One tradeoff is that the more parsimonious approach, which allowed us to examine fixed proportions for energy and protein across feeder cattle weight categories, prevented us from exploring the complex relationships within feed categories. Finally, the explosion in ethanol coproducts and their utilization in livestock feeding comes at the end of our data series. Given the importance of these co-products for feed markets and livestock feeding, more data for the period beyond that in our study will be necessary to discern separate effects for these coproducts and their substitution for, or complementarity with, more conventional feedstuffs. We hope to address questions regarding input substitution among the separate feedstuffs more directly through future research.
References Albright, M. L., T. C. Schroeder, and M. R. Langemeier. (1994). “Determinants of
cattle feeding cost-of-gain variability.” Journal of Production Agriculture 7, 206–210.
Anderson, J. D., and J. N. Trapp. (2000). “The dynamics of feeder cattle market re-sponses to corn price change.” Journal of Agricultural and Applied Economics 32, 493–505.
Arnade, C., and D. Kelch. (2007). “Estimation of area elasticities from a standard profit function.” American Journal of Agricultural Economics 89, 727–737.
Arnade, C., and D. Pick. (1998). “Seasonality and unit roots: The demand for fruits.” Agricultural Economics 18, 53–62.
Brewer, P., C. Calkins, R. Anderson, T. Klopfenstein, and R. Rasby. (2003). “Carcass and palatability characteristics of calf-fed and yearling finished steers.” In 2003 Nebraska Beef Report (pp. 68–70), University of Nebraska, Lincoln.
Buccola, S. T. (1980). “An approach to the analysis of feeder cattle price differ-entials.” American Journal of Agricultural Economics 62, 575–580.
Coatney, K. T., D. J. Menkhaus, and J. D. Schmitz. (1996). “Feeder cattle price determinants: An hedonic system of equations approach.” Review of Agricultural Economics 18, 193–211.
Dhuyvetter, K. C., and T. C. Schroeder. (2000). “Price-weight relationships for feeder cattle.” Canadian Journal of Agricultural Economics 48, 299–310.
Diewert, W. E. (1971). “An application of the Shephard duality theorem: A gener-alized Leontief production function.” Journal of Political Economy 79, 481–507.
Diewert, W. E., and T. J. Wales. (1987). “Flexible functional forms and global curvature conditions.” Econometrica 55, 43–68.
Mathews, Arnade, and Jones Derived Demand for Cattle Feeding Inputs 59
Fausett, M. R., K. C. Dhuyvetter, and G. E. Lippert. (1998, November). “Weight-price data as a beef cattle management tool.” Pub. No. MF-2386, Agricultural Experiment Station and Cooperative Extension Service, Kansas State University, Manhattan.
Garoian, L., J. W. Mjelde, and J. R. Conner. (1990). “Optimal strategies for market-ing calves and yearlings from rangeland.” American Journal of Agricultural Eco-nomics 72, 604–613.
Guyer, P. Q. (1996, May). “Retaining ownership of calves or yearlings.” NebGuide No. G85-766-A, University of Nebraska, Lincoln. Online. Available at http:// ianrpubs.unl.edu/beef/g766.htm. [Retrieved January 13, 2004.]
Hoelscher, M. A. (1995–2004). “Feedyard analysis.” FeedStuffs (various issues). Jordan, D. J., T. Klopfenstein, T. Milton, R. Cooper, T. Scott, G. Erickson, and R.
Clark. (2002). “Economic analysis of calf versus yearling finishing.” In 2002 Beef Cattle Report. Pub. No. MP 79, Cooperative Extension Service, University of Nebraska, Lincoln.
Kastens, T., and T. C. Schroeder. (1994, December). “Cattle feeder behavior and feeder cattle placements.” Journal of Agricultural and Resource Economics 19(2), 337–348.
Lambert, C. D., M. S. McNulty, O. C. Grunewald, and L. R. Corah. (1989). “An analysis of feeder cattle price differentials.” Agribusiness: An International Journal 5, 9–23.
Mark, D. R., T. C. Schroeder, and R. Jones. (2000, Fall). “Identifying economic risk in cattle feeding.” Journal of Agribusiness 18(3), 331–344.
Marsh, J. M. (1999, December). “Economic factors determining changes in dressed weights of live cattle and hogs.” Journal of Agricultural and Resource Economics 24(2), 313–326.
———. (2003). “Impacts of declining U.S. retail beef demand on farm-level beef prices and production.” American Journal of Agricultural Economics 85(4), 902–913.
Mathews, K. H., Jr. (2002). “The economic effects of an antimicrobial ban in U.S. beef production.” Journal of Agricultural and Applied Economics 34(3), 513–530.
Nelson, K. E., and W. D. Purcell. (1972). “A quantitative approach to the feedlot replacement decision.” Southern Journal of Agricultural Economics 4, 143–149.
Simpson, J. R., and R. Alderman. (1983, February). “Estimating feeder calf price differentials.” Staff Paper No. 230, Food and Resource Economics Department, University of Florida, Gainesville.
Stock, R., T. Mader, and T. Klopfenstein. (1984, March). “Protein levels for growing and finishing cattle.” NebGuide No. G84-693-A, University of Nebraska, Lincoln.
U.S. Department of Agriculture, Agricultural Marketing Service. (1995–2006). Cattle, Feeder and Replacement, Auction reports (various issues). Online. Avail-able at http://www.ams.usda.gov/lsmnpubs/cfauction.htm. [Retrieved October 26, 2004.]
U.S. Department of Agriculture, Animal and Plant Health Inspection Service, Vet-erinary Services. (1994, August). Beef Cow/Calf Health and Productivity Audit, Part V: Quality Assurance Profile. USDA/APHIS, Ft. Collins, CO.
60 Spring 2008 Journal of Agribusiness
———. (1998, May). Beef Cow/Calf Health and Productivity Audit, Part IV: Changes in the U.S. Beef Cow-Calf Industry, 1993–1997. USDA/APHIS, Ft. Collins, CO.
U.S. Department of Agriculture, Economic Research Service. (1996–2003). Live-stock, Dairy, and Poultry Outlook (various issues). USDA/ERS, Washington, DC.
———. Red Meats Yearbook. Online. Available at http://www.ers.usda.gov/data/ sdp/view.asp?f=livestock/94006/. [Retrieved October 27, 2004.]
U.S. Department of Agriculture, National Agricultural Statistics Service. (1995–2006). Cattle on Feed (various issues). USDA/NASS,Washington, DC.
———. (1995–2006). Livestock Slaughter (various issues). USDA/NASS, Wash-ington, DC.
Weichenthal, B., I. Rush, and B. Van Pelt. (1999). “Crude protein and energy com-binations for finishing yearling steers.” In 1999 Beef Cattle Report. Pub. No. MP 71, Cooperative Extension Service, University of Nebraska, Lincoln.
Young, D. L., R. C. Mittelhammer, A. Rostamizadeh, and D. W. Holland. (1987, September). Duality Theory and Applied Production Economics Research: A Peda-gogical Treatise. Pub. No. EB 1473, Cooperative Extension, College of Agriculture and Home Economics, Washington State University, Pullman.