Embed Size (px)
Citation preview

Helping US Become Knowledge-Able About Student Engagement
Derek Herrmann & Ryan SmithUniversity Assessment Services
Background

Dimensions of Learning & Assessment
Achievement• ACCUMULATION OF LEARNING• Outcomes: GRE, NCLEX, RD exam, etc.
Learning• CHANGE IN BEHAVIOR, THINKING, ETC.• Outcomes: Advanced skills, critical thinking, etc.
Engagement• PROCESSES THAT SUPPORT LEARNING• Processes: Time studying, tutoring, interaction with faculty,
services, etc.
Persistence• CONSEQUENCES OF LEARNING• Outputs: Graduation, retention, satisfaction, utilization, etc.
Direct
Indirect
Background
What is student engagement?◦Amount of time and effort put into academic and co-
curricular activities◦Ways institution allocates resources and organizes
opportunities for students to participate in activities linked to student learning
From the National Survey of Student Engagement (NSSE) website, http://nsse.iub.edu/
Background
What is student engagement?◦Amount of time and effort put into academic and co-
curricular activities◦Ways institution allocates resources and organizes
opportunities for students to participate in activities linked to student learning
How can information on student engagement be used?◦ Identify areas of excellence◦ Identify opportunities for improvement◦Used in discussions related to teaching and learning
From the National Survey of Student Engagement (NSSE) website, http://nsse.iub.edu/

Beginning College Survey of Student Engagement (BCSSE)◦Assesses*
The time and effort entering, first-year students devoted to educationally purposeful activities in high school and expect to devote to during their first year of college
What these entering first-year students expect their institutions to provide them regarding opportunities and emphasis
◦Compliments the National Survey of Student Engagement (NSSE) and the Faculty Survey of Student Engagement (FSSE)
Background
* From the Beginning College Survey of Student Engagement (BCSSE) website, http://bcsse.iub.edu/
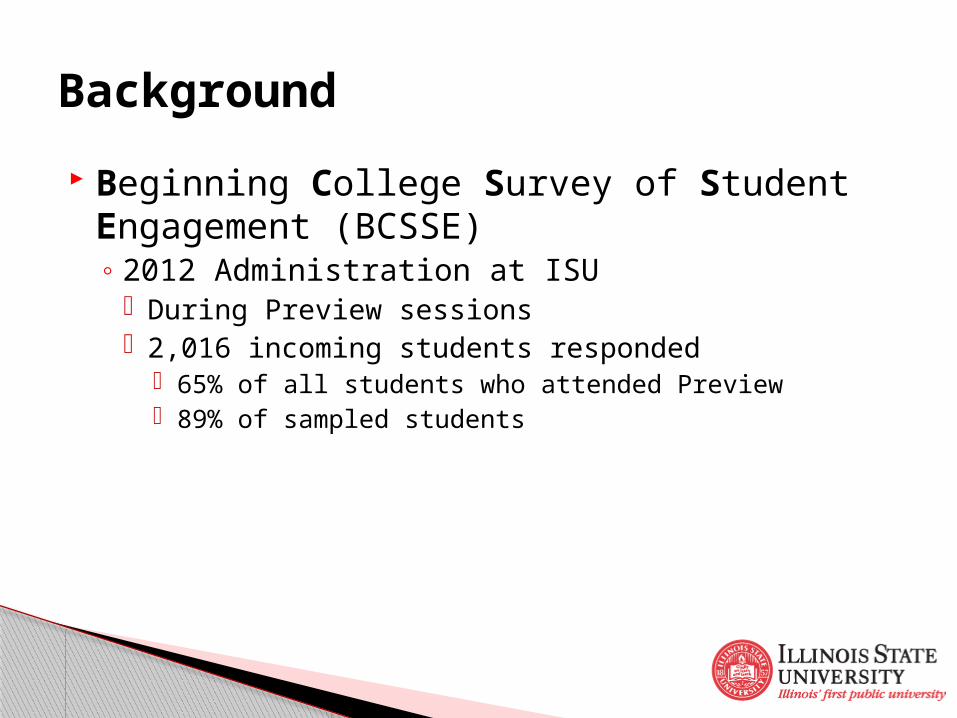
Beginning College Survey of Student Engagement (BCSSE)◦ 2012 Administration at ISU
During Preview sessions 2,016 incoming students responded
65% of all students who attended Preview 89% of sampled students
Background
Background
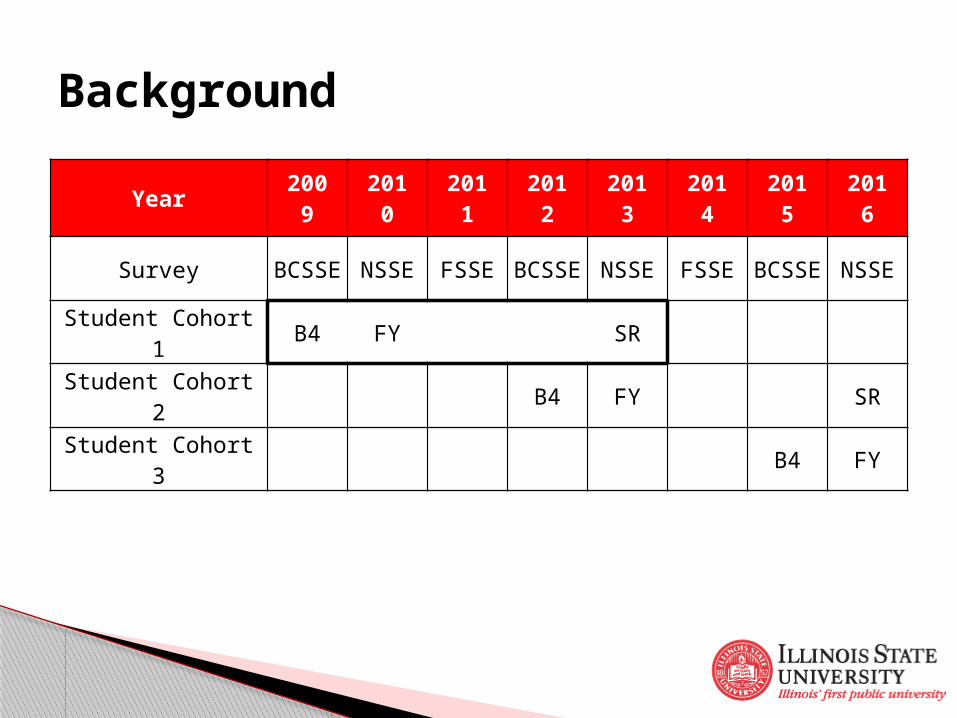
Year 2009 2010 2011 2012 2013 2014 2015 2016
Survey BCSSE NSSE FSSE BCSSE NSSE FSSE BCSSE NSSE
Student Cohort 1 B4 FY SR
Student Cohort 2 B4 FY SR
Student Cohort 3 B4 FY
Background
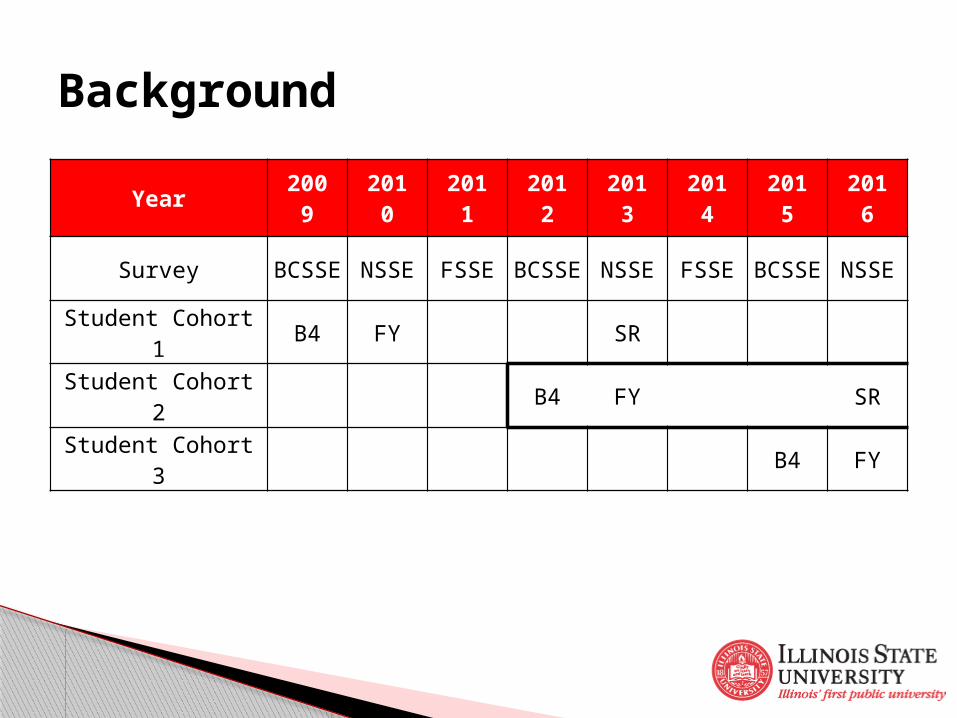
Year 2009 2010 2011 2012 2013 2014 2015 2016
Survey BCSSE NSSE FSSE BCSSE NSSE FSSE BCSSE NSSE
Student Cohort 1 B4 FY SR
Student Cohort 2 B4 FY SR
Student Cohort 3 B4 FY
Background
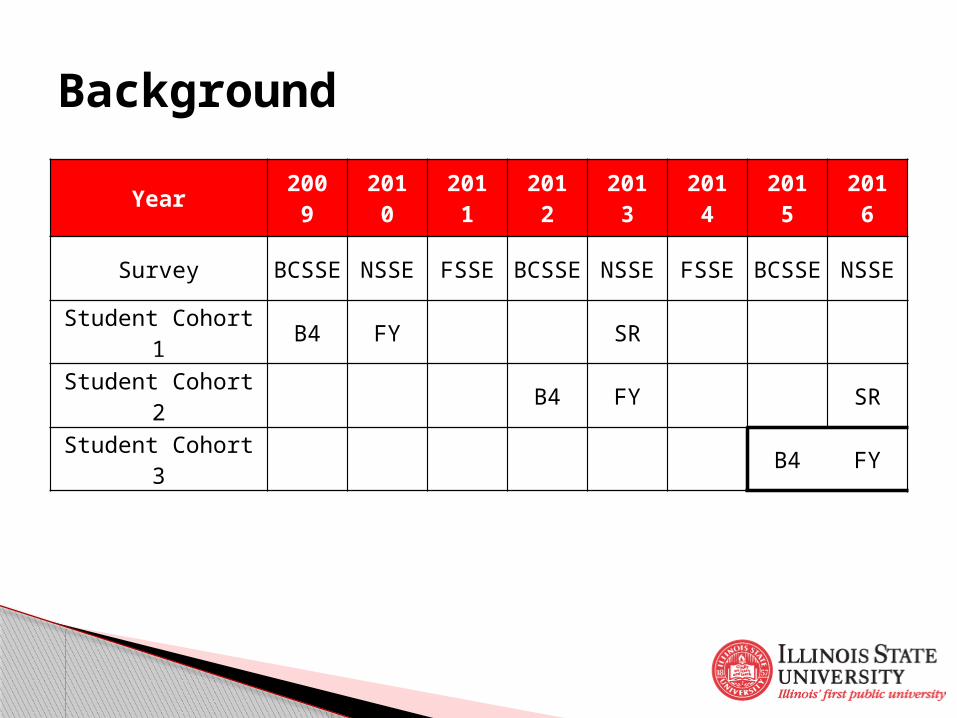
Year 2009 2010 2011 2012 2013 2014 2015 2016
Survey BCSSE NSSE FSSE BCSSE NSSE FSSE BCSSE NSSE
Student Cohort 1 B4 FY SR
Student Cohort 2 B4 FY SR
Student Cohort 3 B4 FY

Findings
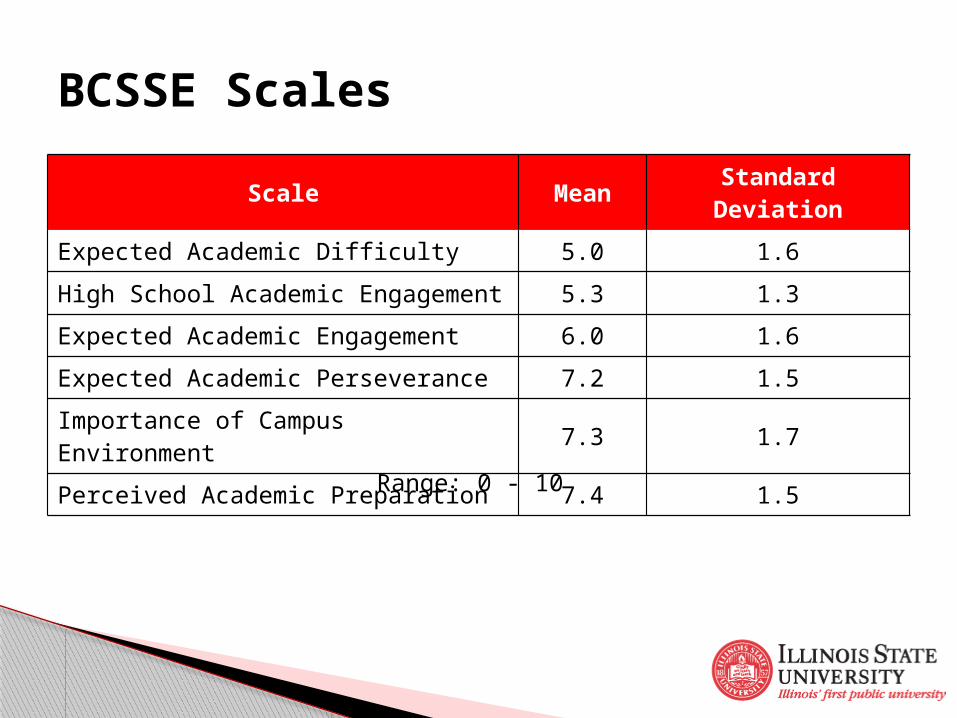
Scale Mean Standard Deviation
Expected Academic Difficulty 5.0 1.6
High School Academic Engagement 5.3 1.3
Expected Academic Engagement 6.0 1.6
Expected Academic Perseverance 7.2 1.5
Importance of Campus Environment 7.3 1.7
Perceived Academic Preparation 7.4 1.5
BCSSE Scales
Range: 0 - 10
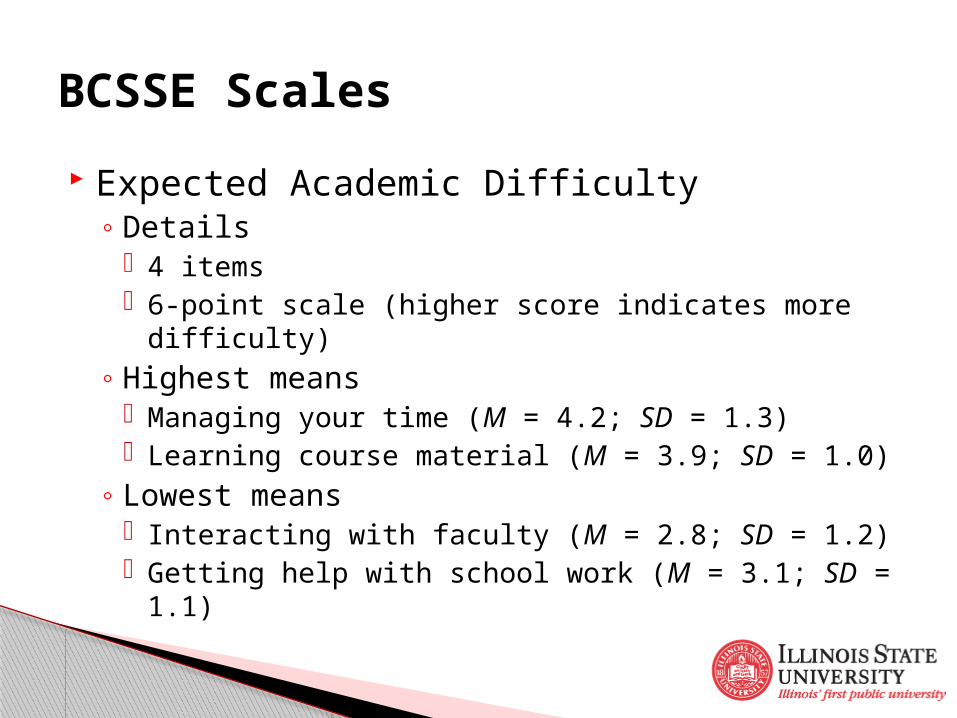
BCSSE Scales
Expected Academic Difficulty ◦Details
4 items 6-point scale (higher score indicates more difficulty)
◦Highest means Managing your time (M = 4.2; SD = 1.3) Learning course material (M = 3.9; SD = 1.0)
◦ Lowest means Interacting with faculty (M = 2.8; SD = 1.2) Getting help with school work (M = 3.1; SD = 1.1)

BCSSE Scales
High School Academic Engagement◦Details
12 items 4-point scale (higher score indicates more often)
◦Highest means Asked questions in class or contributed to class discussions
(M = 3.1; SD = 0.8) Worked with other students on projects during class
(M = 2.9; SD = 0.7)

BCSSE Scales
High School Academic Engagement◦Highest means
Asked questions in class or contributed to class discussions (M = 3.1; SD = 0.8)
Worked with other students on projects during class (M = 2.9; SD = 0.7)
◦ Lowest means Discussed ideas from your readings or classes with teachers
outside of class (M = 2.0; SD = 0.9) Worked with classmates outside of class to prepare class
assignments (M = 2.3; SD = 0.7)

BCSSE Scales
Expected Academic Engagement◦Details
8 items 4-point scale (higher score indicates more often)
◦Highest means Work with classmates outside of class to prepare class
assignments (M = 3.1; SD = 0.7) Ask questions in class or contribute to class discussions
(M = 3.0; SD = 0.7)
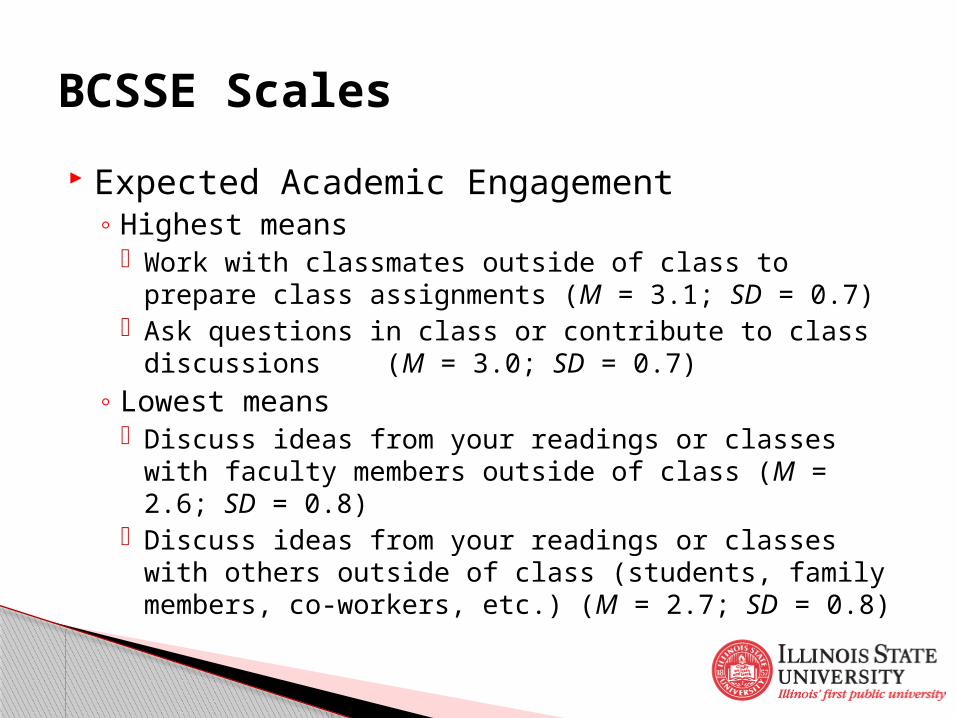
BCSSE Scales
Expected Academic Engagement◦Highest means
Work with classmates outside of class to prepare class assignments (M = 3.1; SD = 0.7)
Ask questions in class or contribute to class discussions (M = 3.0; SD = 0.7)
◦ Lowest means Discuss ideas from your readings or classes with faculty
members outside of class (M = 2.6; SD = 0.8) Discuss ideas from your readings or classes with others
outside of class (students, family members, co-workers, etc.) (M = 2.7; SD = 0.8)
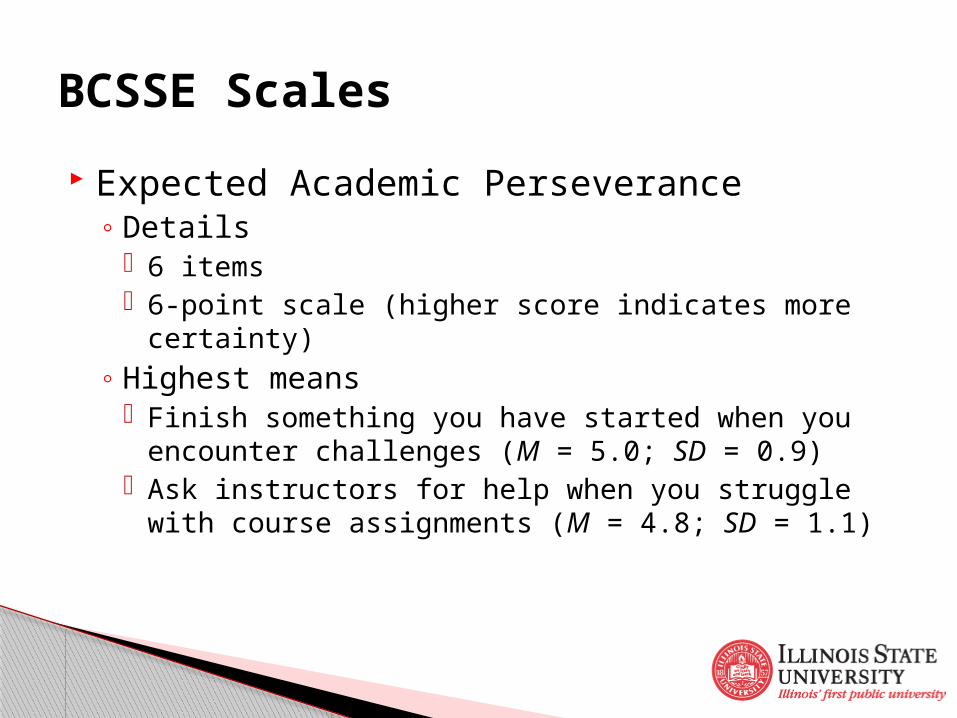
BCSSE Scales
Expected Academic Perseverance◦Details
6 items 6-point scale (higher score indicates more certainty)
◦Highest means Finish something you have started when you encounter
challenges (M = 5.0; SD = 0.9) Ask instructors for help when you struggle with course
assignments (M = 4.8; SD = 1.1)

BCSSE Scales
Expected Academic Perseverance◦Highest means
Finish something you have started when you encounter challenges (M = 5.0; SD = 0.9)
Ask instructors for help when you struggle with course assignments (M = 4.8; SD = 1.1)
◦ Lowest means Participate regularly in course discussions even when you
don’t feel like it (M = 4.1; SD = 1.1) Study when there are other interesting things to do
(M = 4.2; SD = 1.1)
BCSSE Scales
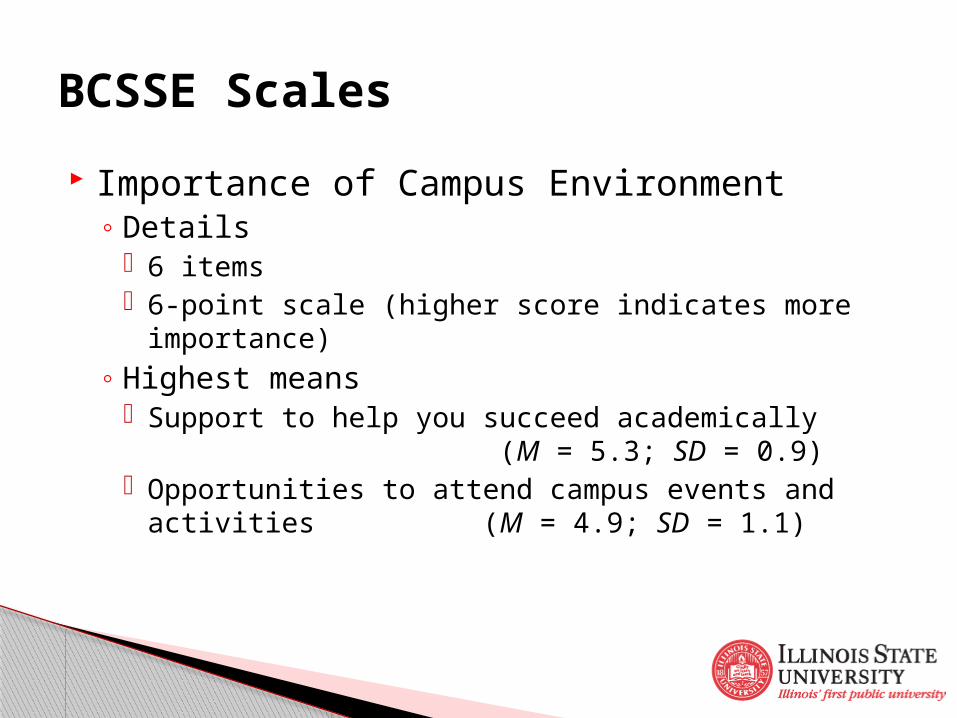
Importance of Campus Environment◦Details
6 items 6-point scale (higher score indicates more importance)
◦Highest means Support to help you succeed academically
(M = 5.3; SD = 0.9) Opportunities to attend campus events and activities
(M = 4.9; SD = 1.1)

BCSSE Scales
Importance of Campus Environment◦Highest means
Support to help you succeed academically (M = 5.3; SD = 0.9)
Opportunities to attend campus events and activities (M = 4.9; SD = 1.1)
◦ Lowest means Assistance coping with your non-academic responsibilities
(work, family, etc.) (M = 4.2; SD = 1.3) Support to help you thrive socially (M = 4.4; SD = 1.3)
BCSSE Scales
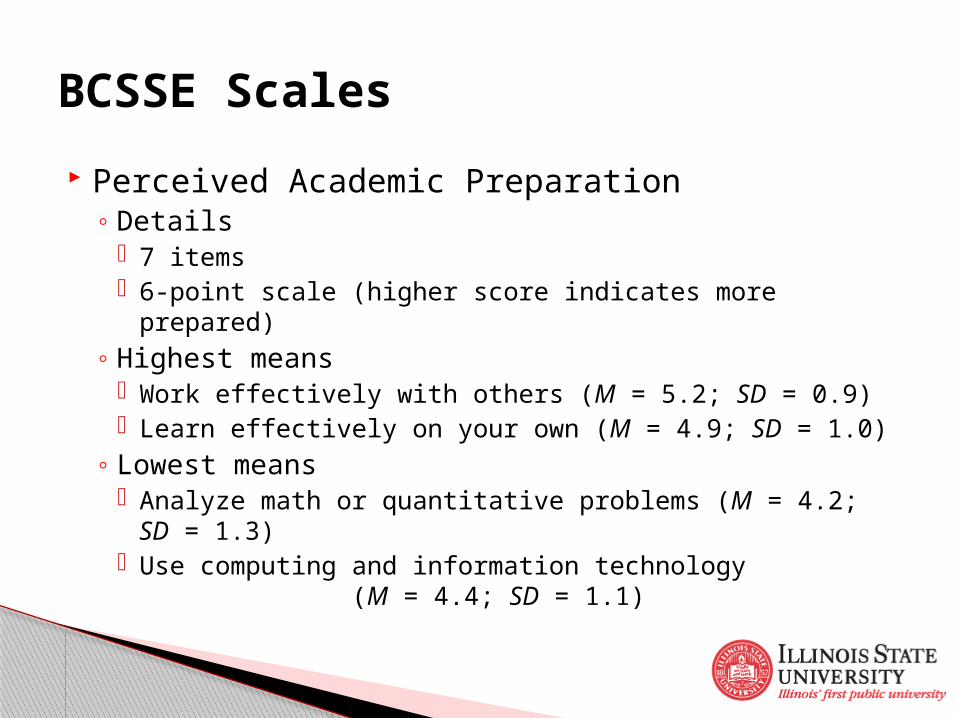
Perceived Academic Preparation◦Details
7 items 6-point scale (higher score indicates more prepared)
◦Highest means Work effectively with others (M = 5.2; SD = 0.9) Learn effectively on your own (M = 4.9; SD = 1.0)
◦ Lowest means Analyze math or quantitative problems (M = 4.2; SD = 1.3) Use computing and information technology
(M = 4.4; SD = 1.1)

Last Year vs. Expected First Year
0 hours per week
1-5 hours per week
6-10 hours per week
11-15 hours per week
16-20 hours per week
21-25 hours per week
26-30 hours per week
More than 30 hours per week
0%
25%
50%
75%
100%
0.9%
37.6%
32.0%
16.5%
7.9%2.9% 1.0% 1.1%
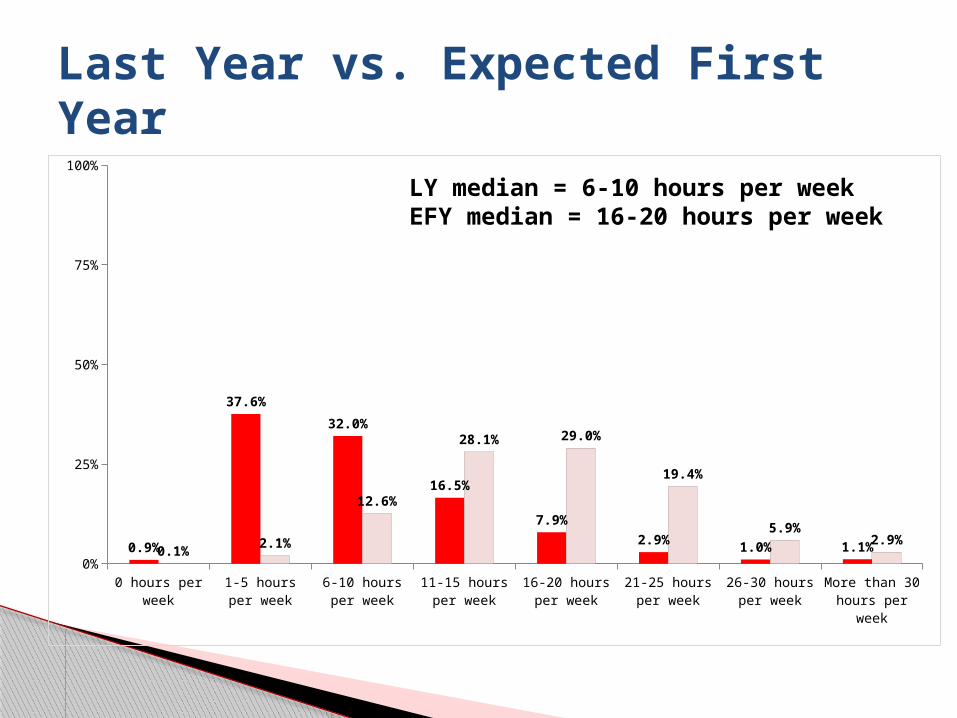
During your last year of high school, about how many hours did you spend in a typical 7-day week preparing for class (studying, doing homework, rehearsing, etc.)?

Last Year vs. Expected First Year
0 hours per week
1-5 hours per week
6-10 hours per week
11-15 hours per week
16-20 hours per week
21-25 hours per week
26-30 hours per week
More than 30 hours per week
0%
25%
50%
75%
100%
0.1% 2.1%
12.6%
28.1% 29.0%
19.4%
5.9%2.9%
During the coming school year, about how many hours do you think you will spend in a typ-ical 7-day week preparing for class (studying, reading, writing, doing homework or lab work,
analyzing data, rehearsing, and other academic activities)?
Last Year vs. Expected First Year
0 hours per week
1-5 hours per week
6-10 hours per week
11-15 hours per week
16-20 hours per week
21-25 hours per week
26-30 hours per week
More than 30 hours per week
0%
25%
50%
75%
100%
0.9%
37.6%
32.0%
16.5%
7.9%
2.9%1.0% 1.1%0.1%
2.1%
12.6%
28.1% 29.0%
19.4%
5.9%2.9%
LY median = 6-10 hours per weekEFY median = 16-20 hours per week

Last Year vs. Expected First Year
0 hours per week
1-5 hours per week
6-10 hours per week
11-15 hours per week
16-20 hours per week
21-25 hours per week
26-30 hours per week
More than 30 hours per week
0%
25%
50%
75%
100%
10.0%
17.5%15.1%
19.2%17.2%
9.6%4.7%
6.9%
During your last year of high school, about how many hours did you spend in a typical 7-day week participating in co-curricular activities (arts, clubs, athletics, etc.)?

Last Year vs. Expected First Year
0 hours per week
1-5 hours per week
6-10 hours per week
11-15 hours per week
16-20 hours per week
21-25 hours per week
26-30 hours per week
More than 30 hours per week
0%
25%
50%
75%
100%
3.5%
19.3%
30.0%
24.5%
14.7%
4.8%1.4% 1.7%
During the coming school year, about how many hours do you think you will spend in a typical 7-day week participating in co-curricular activities (organizations, campus publications, student
government, fraternity or sorority, intercollegiate or intramura

Last Year vs. Expected First Year
0 hours per week
1-5 hours per week
6-10 hours per week
11-15 hours per week
16-20 hours per week
21-25 hours per week
26-30 hours per week
More than 30 hours per week
0%
25%
50%
75%
100%
10.0%
17.5%15.1%
19.2%17.2%
9.6%
4.7%6.9%
3.5%
19.3%
30.0%
24.5%
14.7%
4.8%1.4% 1.7%
LY median = 11-15 hours per weekEFY median = 6-10 hours per week

Last Year vs. Expected First Year
0 hours per week
1-5 hours per week
6-10 hours per week
11-15 hours per week
16-20 hours per week
21-25 hours per week
26-30 hours per week
More than 30 hours per week
0%
25%
50%
75%
100%
29.0%
13.1% 13.8%16.6%
14.0%
8.3%3.8%
1.5%
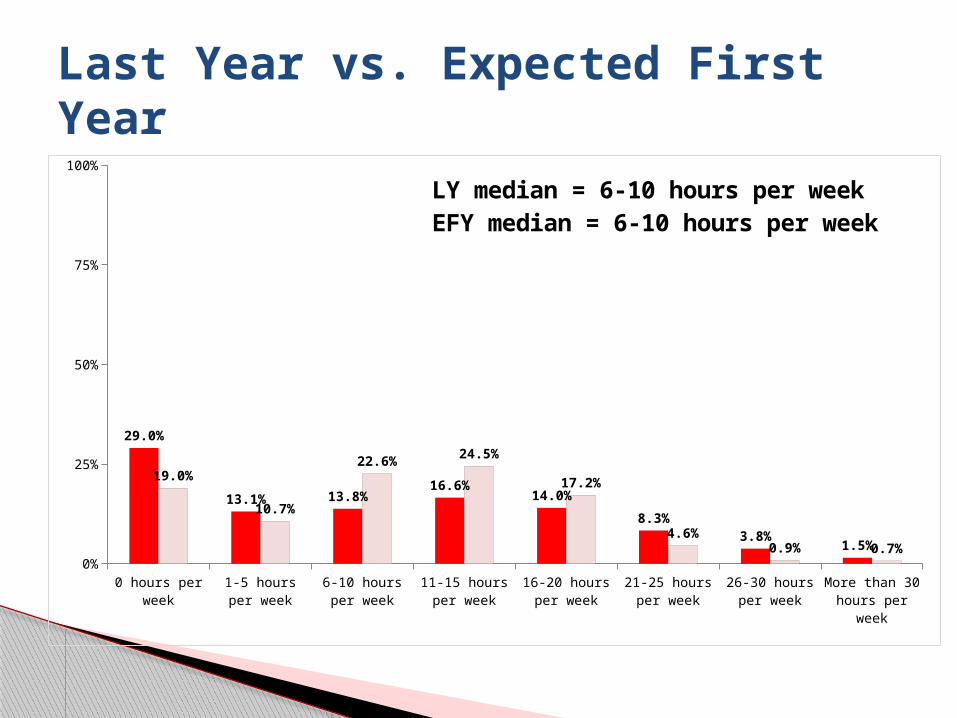
During your last year of high school, about how many hours did you spend in a typical 7-day week working for pay (before or after school, weekends)?

Last Year vs. Expected First Year
0 hours per week
1-5 hours per week
6-10 hours per week
11-15 hours per week
16-20 hours per week
21-25 hours per week
26-30 hours per week
More than 30 hours per week
0%
25%
50%
75%
100%
19.0%
10.7%
22.6% 24.5%
17.2%
4.6%0.9% 0.7%
During the coming school year, about how many hours do you think you will spend in a typ-ical 7-day week working for pay on- or off-campus?
Last Year vs. Expected First Year
0 hours per week
1-5 hours per week
6-10 hours per week
11-15 hours per week
16-20 hours per week
21-25 hours per week
26-30 hours per week
More than 30 hours per week
0%
25%
50%
75%
100%
29.0%
13.1% 13.8%16.6%
14.0%
8.3%
3.8%1.5%
19.0%
10.7%
22.6%24.5%
17.2%
4.6%0.9% 0.7%
LY median = 6-10 hours per weekEFY median = 6-10 hours per week
Last Year vs. Expected First Year
0 hours per week
1-5 hours per week
6-10 hours per week
11-15 hours per week
16-20 hours per week
21-25 hours per week
26-30 hours per week
More than 30 hours per week
0%
25%
50%
75%
100%
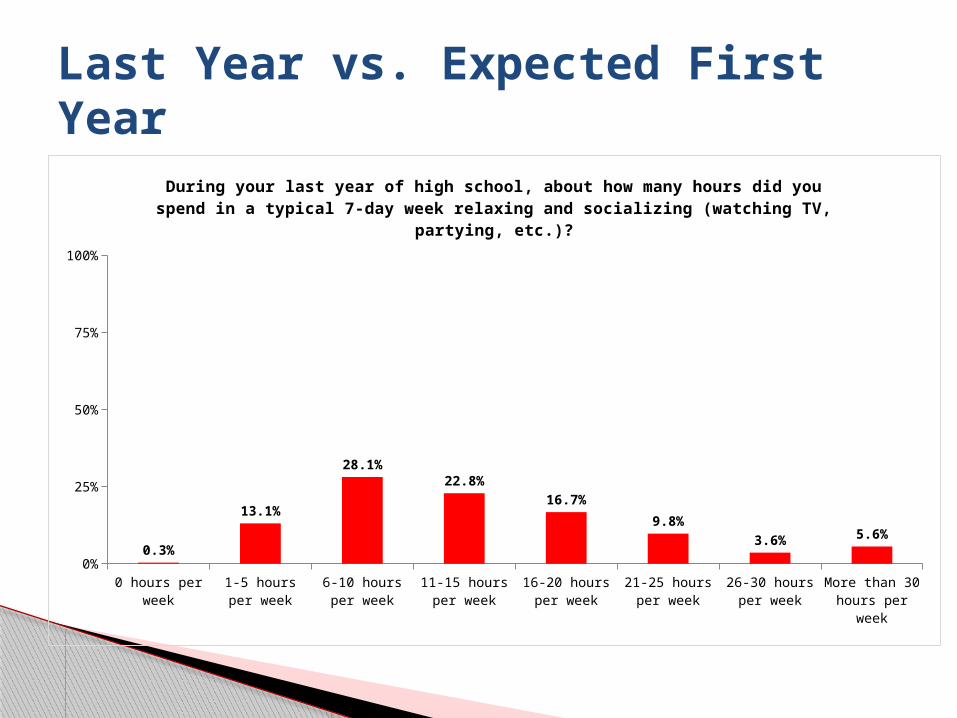
0.3%
13.1%
28.1%
22.8%
16.7%
9.8%
3.6% 5.6%
During your last year of high school, about how many hours did you spend in a typical 7-day week relaxing and socializing (watching TV, partying, etc.)?

Last Year vs. Expected First Year
0 hours per week
1-5 hours per week
6-10 hours per week
11-15 hours per week
16-20 hours per week
21-25 hours per week
26-30 hours per week
More than 30 hours per week
0%
25%
50%
75%
100%
0.2%
11.4%
30.4% 28.7%
18.4%
6.5%2.2% 2.1%
During the coming school year, about how many hours do you think you will spend in a typ-ical 7-day week relaxing and socializing (watching TV, partying, etc.)?

Last Year vs. Expected First Year
0 hours per week
1-5 hours per week
6-10 hours per week
11-15 hours per week
16-20 hours per week
21-25 hours per week
26-30 hours per week
More than 30 hours per week
0%
25%
50%
75%
100%
0.3%
13.1%
28.1%
22.8%
16.7%
9.8%
3.6%5.6%
0.2%
11.4%
30.4% 28.7%
18.4%
6.5%2.2% 2.1%
LY median = 11-15 hours per weekEFY median = 11-15 hours per week

Discussion
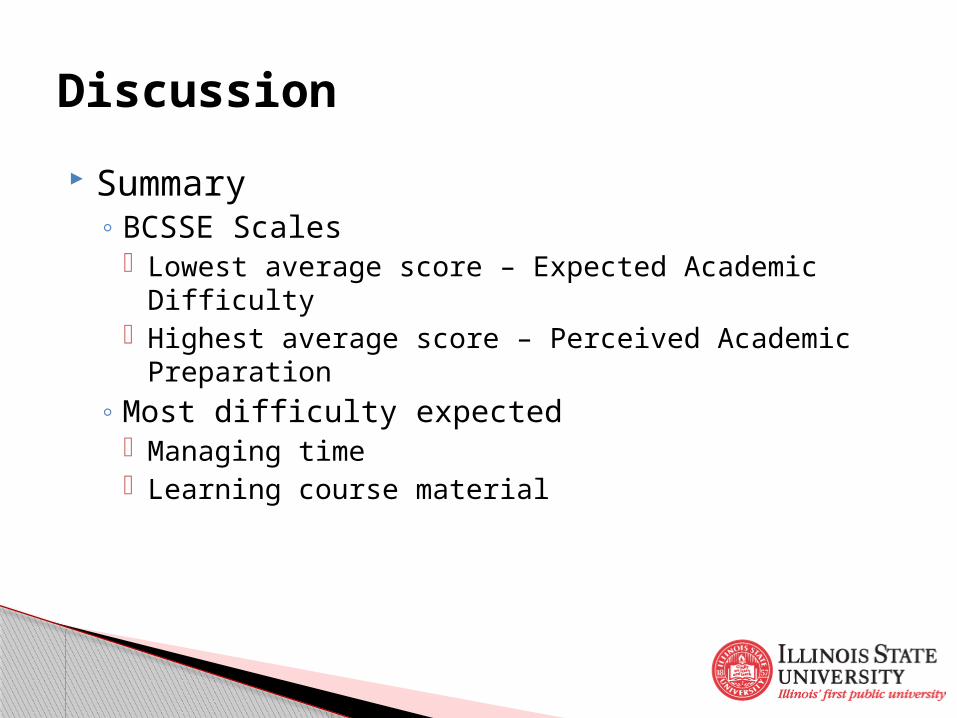
Summary◦BCSSE Scales
Lowest average score – Expected Academic Difficulty Highest average score – Perceived Academic Preparation
◦Most difficulty expected Managing time Learning course material
Discussion

Summary◦Academic engagement
Most often Ask questions in class or contribute to class discussions Work with other students (LY during class; EFY outside of class)
Least often – discussing ideas with others outside of class
Discussion

Summary◦Most certain
Finish something when encounter challenges Ask instructors for help
◦Most important Support to help achieve academic success Opportunities to attend campus events and activities
Discussion

Summary◦Most prepared
Work effectively with others Learn effectively on their own
◦ Last Year vs. Expected First Year Expected to increase – Preparing for class Expected to decrease – Participating in co-curricular
activities No change expected
Working for pay Relaxing and socializing
Discussion
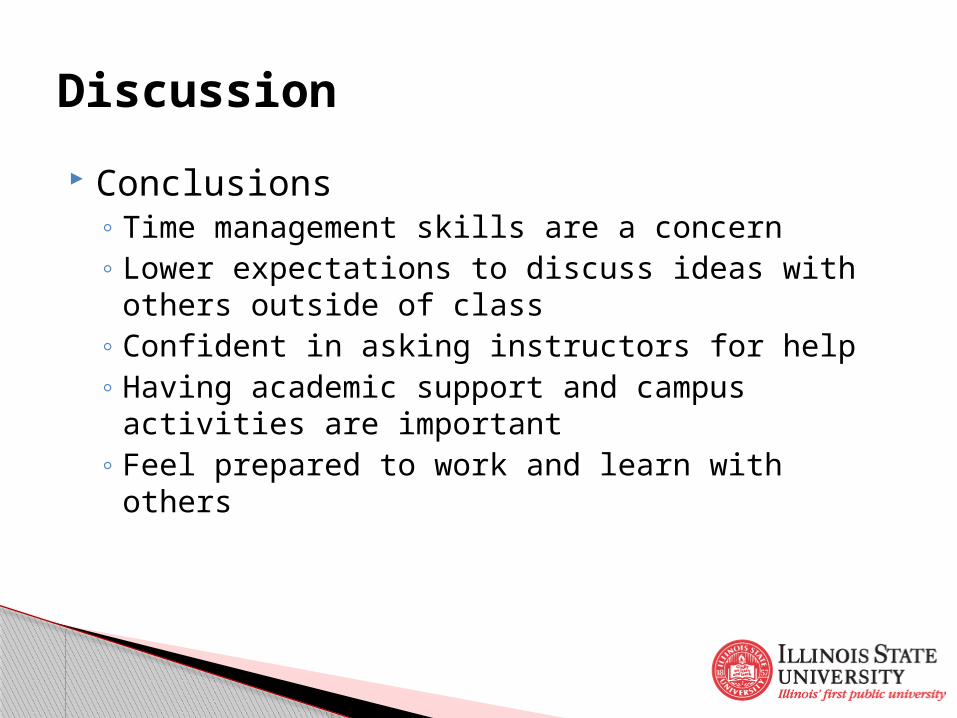
Conclusions◦ Time management skills are a concern◦ Lower expectations to discuss ideas with others outside
of class◦Confident in asking instructors for help◦Having academic support and campus activities are
important◦ Feel prepared to work and learn with others
Discussion
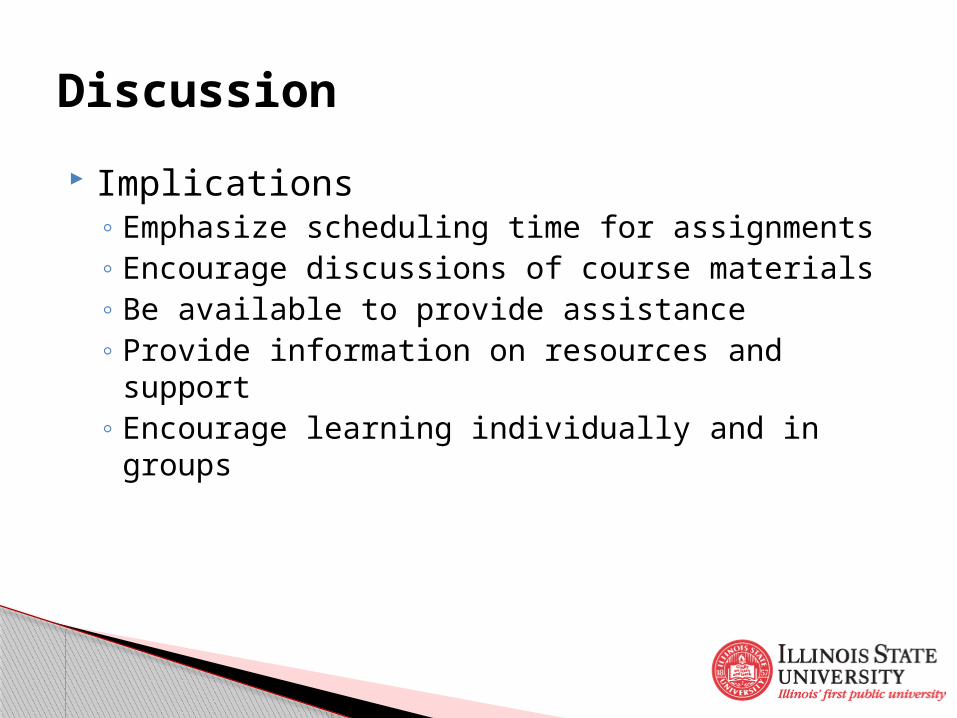
Implications◦Emphasize scheduling time for assignments◦Encourage discussions of course materials◦Be available to provide assistance◦Provide information on resources and support◦Encourage learning individually and in groups
Discussion
Limitations◦Sample size◦Mean differences
Future directions◦Continue to disseminate information◦ Look at student engagement longitudinally with the
NSSE
Discussion

Questions?
Comments?
Concerns?

Mr. Derek Herrmann, UAS Coordinator◦ [email protected]◦ 309.438.7325
Dr. Ryan Smith, UAS Director◦ [email protected]◦ 309.438.2135
http://assessment.illinoisstate.edu/
Want more information?