Embed Size (px)
Citation preview

The evidence on pupils in England, The evidence on pupils in England, Foundation Stage to Key Stage 4 Foundation Stage to Key Stage 4
Deprivation and Education
DEPRIVATION AND EDUCATION The evidence on pupils in England,
Foundation Stage to Key Stage 4
Schools Analysis and Research Division, Department for Children, Schools and Families
March 2009

2

3
1 INTRODUCTION 6
1.1 Deprivation and education: why it matters 6 1.1.1 Effect on life chances 6 1.1.2 Substantial and pervasive impact from an early age 6
1.2 Policy context 7
1.3 Overview of the paper 7
2 DEPRIVATION: DEFINITION AND MEASUREMENT 8
3 WHO AND HOW MANY ARE DEPRIVED 10
3.1 The proportion of pupils from deprived backgrounds 11 3.1.1 Eligibility for free school meals 11 3.1.2 Distribution of FSM pupils 12 3.1.3 Change in pupils’ FSM status 16 3.1.4 Pupil, school and area level deprivation 17
3.2 Characteristics of pupils who experience deprivation 18 3.2.1 Ethnicity 18 3.2.2 Special Educational Needs 21
4 IMPACT ON PUPIL ATTAINMENT AND OTHER OUTCOMES 23
4.1 Attainment 25 4.1.1 Overview of the FSM gap in educational attainment 25 4.1.2 Early years 26 4.1.3 Key Stage 1 to Key Stage 4 7 28 4.1.4 Changes in the FSM gap over time 32 4.1.5 Educational progress 34 4.1.6 Relative impact of FSM eligibility and prior attainment 40 4.1.7 Interaction with ethnicity, gender and other variables 41 4.1.8 An international problem 50
4.2 Attendance and exclusions 52 4.2.1 Attendance 52 4.2.2 Exclusions 56
5 WHY DEPRIVED PUPILS CAN FALL BEHIND 57
5.1 Explaining the association between deprivation and poor outcomes 58 5.1.1 Income and material deprivation 59 5.1.2 Health 60 5.1.3 Family stress 60 5.1.4 Parental education 61 5.1.5 Parental involvement in their children’s education 63

4
5.1.6 Cultural and social capital, and the experience of schooling 64 5.1.7 Low aspirations 65 5.1.8 Exposure to multiple risk factors 65 5.1.9 Literacy 66
5.2 Change over time 66
6 THE SCHOOL EFFECT 67
6.1 The difference schools can make 70
6.2 In the classroom 71 6.2.1 Teaching quality 71 6.2.2 Pupil grouping 71 6.2.3 Assessment for learning 73 6.2.4 Curriculum 74 6.2.5 Homework and study support 75 6.2.6 Intervention for pupils who fall behind 77 6.2.7 Class size 79
6.3 School culture 80 6.3.1 Positive school culture 80 6.3.2 Attitudes, aspirations and expectations 80 6.3.3 Behaviour 81 6.3.4 Pupil voice 84
6.4 Transitions and decisions 85 6.4.1 Transitions between Key Stages 85 6.4.2 Pupil mobility 87 6.4.3 Choice of subject or qualification route 88
6.5 School size and resources 90 6.5.1 School size 90 6.5.2 School resources 91
6.6 Leadership, workforce and governance 93 6.6.1 Effective leadership in deprived contexts 93 6.6.2 Teacher turnover and qualifications 95 6.6.3 Wider workforce 96 6.6.4 Governance 97
6.7 Engaging parents and carers 98
6.8 Supporting pupils with multiple needs 100
6.9 National initiatives 102 6.9.1 Excellence in Cities 102 6.9.2 London Challenge and City Challenge 104 6.9.3 Extended schools 109 6.9.4 Academies 111 6.9.5 Building Schools for the Future 112 6.9.6 National Challenge 113 6.9.7 The Extra Mile 113
5
7 FURTHER QUESTIONS AND EVIDENCE GAPS 115
8 REFERENCES 116
6
1 Introduction
This paper summarises research and statistical evidence on the subject of deprivation and education for pupils in Foundation Stage to Key Stage 4 in England, in maintained mainstream schools.
1.1 Deprivation and education: why it matters
1.1.1 Effect on l ife chances
The relationship between deprivation and education is crucial for understanding the significant impact deprivation has on later outcomes in adulthood. There is a very clear pathway from childhood poverty to reduced employment opportunities, with earnings estimated to be reduced by between 15 and 28% and the probability of being in employment at age 34 reduced by between 4 and 7% (Blanden, Hansen & Machin, 2008). Crucially, those who end up with lower earnings are those with a lack of skills and qualifications: in other words, deprivation has a negative impact on educational attainment, leaving young people with fewer qualifications and skills which in turn affects future employment.
Poor educational attainment has short‐ as well as longer‐term consequences. There are direct effects on health (for example, quality of diet, chances of smoking) and indirect effects (for example, lower skilled people are more likely to find employment in hazardous occupations where they are at greater risk of accidents) (Feinstein et al. 2006). Indeed, education has an impact on life expectancy: one more year of education has been shown to increase life expectancy in the United States by as much as 1.7 years (cited in Feinstein et al., 2008). There is further evidence that lower levels of educational achievement can have a negative impact on an individual’s engagement with society: for example, in the increased likelihood that an individual will engage in criminal activity (Feinstein et al., 2008).
1.1.2 Substantial and pervasive impact from an early age
Deprivation can have a large and pervasive impact on educational attainment. International data from the Programme for International Student Assessment (PISA) study of Organisation for Economic Cooperation and Development countries (OECD, 2006) shows that this is a widespread problem. Data from UK longitudinal studies have found that the impact of deprivation on cognitive and educational measures is apparent from an early age. Using the 1970 Birth Cohort Study, Feinstein (2003) identified cognitive differences between children from different socio‐economic groups at 22 and 42 months, whilst findings from the Millennium Cohort of babies born in 2000 showed differences at age three (George, Hansen, & Schoon, 2007). Not all children from deprived backgrounds will have lower than average attainment but Feinstein (2003) showed that, on average, even those children from lower socio‐economic groups performing well initially (at 22 months) were overtaken by others by the time they started primary school. These early differences were “not appreciably reduced by entry into the schooling system” (p89) and were found to be strongly associated with inequalities in educational outcomes in later life.
The relationship between deprivation and education – although inter‐related with other factors (such as maternal education) – is an independent one. Low income has an independent effect on children’s educational outcomes after controlling for measures of family background and child ability (Blanden and Gregg, 2004).

7
1.2 Policy context
There have been some key recent government and non‐governmental publications on child poverty which recognise the key role of education, examining both the impact that deprivation has on education, and the role that education can play in improving the life chances of those from deprived backgrounds.
In 2008, publication of the report Ending child poverty: everybody's business (HM Treasury, 2008) indicated the continuing focus on this issue and the need for coordinated work across government to take forward the target set in 1999 to halve child poverty by 2010 and eradicate it by 2020. Recent publications by the Joseph Rowntree Foundation (summarised by Hirsch, 2008) demonstrate the multiple impacts of deprivation on individuals, families and society. For example, the cost of child poverty to the UK is estimated to be at least £25 billion a year, including £17 billion that could accrue to the Exchequer if child poverty were eradicated (Hirsch, 2008).
This paper was launched by the Secretary of State for Children, Schools and Families at the Association of School and College Leaders (ASCL) Annual Conference on 13 March 2009, alongside the DCSF publication Breaking the link between disadvantage and low attainment ‐ the way forward.
1.3 Overview of the paper
Chapter 2 of this paper describes how deprivation can be defined and measured.
Chapters 3 and 4 present statistical analyses to illustrate the extent of deprivation, and to describe the relationship between deprivation and educational outcomes.
Chapter 5 explores how the impact of deprivation on education operates: why do pupils from deprived backgrounds fall behind? Key to unpacking the relationship is understanding the extent to which income per se is the causal mechanism or whether the other factors such as parental education, parenting styles, and social and cultural factors play a significant role in this complex relationship.
Chapter 6 synthesises research evidence on the role schools can play in breaking down this relationship: what can schools do for pupils from deprived backgrounds to give them the best opportunities? Here, issues such as school culture and size, teaching approaches (for example, pupil grouping and study support), the importance of school leadership, and how to engage parents effectively in their children’s educational progress are examined.
Chapter 7 highlights some evidence gaps and further questions to be answered.
Note on the data presented in this paper: Wherever possible, the most recent available data (2007/2008) have been reported. However, some analyses conducted using data from previous years have been included where it was not possible to re‐run the analyses in time for publication. The analyses presented should therefore be read as indicative of general patterns, rather than as the most up to date statistics.
All data from the National Pupil Database and Statistical First Releases are for maintained mainstream schools in England, except where otherwise indicated.
8
2 Deprivation: definition and measurement
Deprivation may be defined in many different ways but for the purposes of this paper it refers to adverse economic circumstances in a child's family and/or local area.
Identifying pupils who experience deprivation is not a straightforward task. The main measures used in educational analysis include free school meal (FSM) eligibility and area‐based measures such as the Income Deprivation Affecting Children Index (IDACI).
FREE SCHOOL MEALS
Pupils are recorded as known to be eligible for FSM if their parents or carers are in receipt of certain benefits and have applied to their local authority to claim entitlements to a free school meal. FSM is therefore a binary measure (pupils are either eligible for it, or they are not) and it is an imperfect indicator of deprivation, because it does not pick up all pupils who experience deprivation. Pupils in families which do not claim benefits to which they are entitled, pupils in families which do not apply to receive free school meals for which they are eligible, and pupils in households where the parents are in paid employment are not counted by the FSM measure, even though many of them may experience deprivation.
AREA BASES MEASURES SUCH AS INCOME DEPRIVATION AFFECTING CHILDREN INDEX (IDACI)
The pupil level annual schools census collects the home postcode of each pupil. These postcodes can be linked to local areas called lower layer super output areas1 (LSOAs), which are small areas in England, each with an average population of 1500 people. A number of deprivation indicators are available for LSOAs, such as the Index of Multiple Deprivation (IMD), which is the Government’s official measure of deprivation at local area level.
The Income Deprivation Affecting Children Index (IDACI) is produced alongside the IMD, and measures the proportion of children under 16 in each area that are eligible for certain income‐related benefits. IDACI scores range from zero (least deprived) to one (most deprived). Unlike FSM, the IDACI score for each pupil does not relate directly to their individual family circumstances, but is a proxy measure based on their local area. However it is useful as a broader measure of deprivation since it includes children in working households which are nevertheless income deprived, as well as children in families where the parents are unemployed; and it may consequently be preferable for measuring deprivation in areas where there is high income poverty amongst working families, or low take‐up of free school meal eligibility.
The Department for Children, Schools and Families (DCSF) has also developed another LSOA area deprivation indicator based on tax credits, which is being used to target funding at deprivation, for example through the Dedicated Schools Grant. The tax credit indicator is comparable to IDACI as it is based on very similar underlying data. Although no analysis has as yet been conducted using the tax
1 Lower Layer Super Output Areas are a geographic hierarchy designed to improve the reporting of small area statistics in England and Wales. For more information see http://www.ons.gov.uk/about‐statistics/geography/products/geog‐products‐area/names‐codes/soa/index.html

9
credit indicator, we would expect results to be similar to analysis conducted using IDACI. For more information, see:
http://www.teachernet.gov.uk/management/schoolfunding/schoolfunding2008to11/deprivationfundingreview200811/schoolfundingdeprivationindicator
Care must be taken in interpreting findings from area based measures, since it is not possible to separate out any effects arising from the direct impact of deprivation experienced by families, from any broader impact of area or community deprivation.
MEASURES USED IN THIS PAPER
Despite the acknowledged weaknesses of these measures, FSM and IDACI/IMD remain very useful and common tools for analysing the impact of deprivation on pupils' educational outcomes. This paper consequently focuses on analyses of FSM and IDACI, particularly in the statistics section. However, where important analyses have been conducted using socio‐economic status (SES), these are included. Social class is also referred to below since this is the focus of some interesting and relevant research studies. There are significant overlaps between having a low income, being a member of a lower socioeconomic group (SEG) and being a member of a lower social class since income is a key determinant of membership of the latter two; indeed FSM and IDACI are often used as proxies for SEG or class, which are harder to quantify2. So, when discussing deprivation and, in particular, the reasons behind the observed association with poor educational outcomes described below, this inevitably touches upon broader and more socially defined constructions of what it means to be deprived.
2 See Hobbs and Vignoles (2007) for a discussion of the validity of FSM as a proxy for SES.

10
3 Who and how many are deprived
KEY FINDINGS
• The proportion of pupils eligible for FSM is greater in primary (17%) than secondary school (14%). A small proportion (3%) of pupils are eligible for FSM, attend a school with a high proportion of FSM pupils and live in a deprived area as measured by IDACI.
• Individual pupils' FSM status is not a fixed quality: it can vary throughout their school life. Evidence suggests that in each year around 5 to 7% of pupils change from FSM to non‐FSM or vice versa, whilst around 14% remain eligible for FSM.
• About half of all secondary school age FSM pupils are distributed across three quarters of schools with the other half concentrated in a quarter of schools. In primaries, around 40% of FSM pupils are concentrated in just 13% of schools. Academies have a notably higher proportion of FSM pupils compared to other school types. Grammar schools, by contrast, have a very low rate of FSM pupils.
• The proportion of pupils eligible for free school meals varies by ethnic group. Groups with higher than average FSM eligibility are Traveller of Irish Heritage and Gypsy Roma, Black African, Black Caribbean, White and Black African, White and Black Caribbean, Pakistani, and Bangladeshi pupils. The percentage of Indian and Chinese pupils who are eligible for FSM is below the average.
• Pupils with special educational needs (SEN) in mainstream education are disproportionately eligible for FSM: pupils with a statement of SEN are twice as likely to be eligible for FSM compared to pupils with no SEN, whilst almost a third of pupils categorised as School Action Plus are eligible for FSM.
• Eligibility for FSM is particularly high for three types of SEN: (1) behavioural, emotional and social difficulty (BESD); (2) moderate learning difficulty (MLD) and (3) severe learning difficulty (SLD). Approximately a third of the pupils identified with each of these three types of SEN are also eligible for FSM.
11
3.1 The proportion of pupils from deprived backgrounds
3.1.1 Eligibility for free school meals
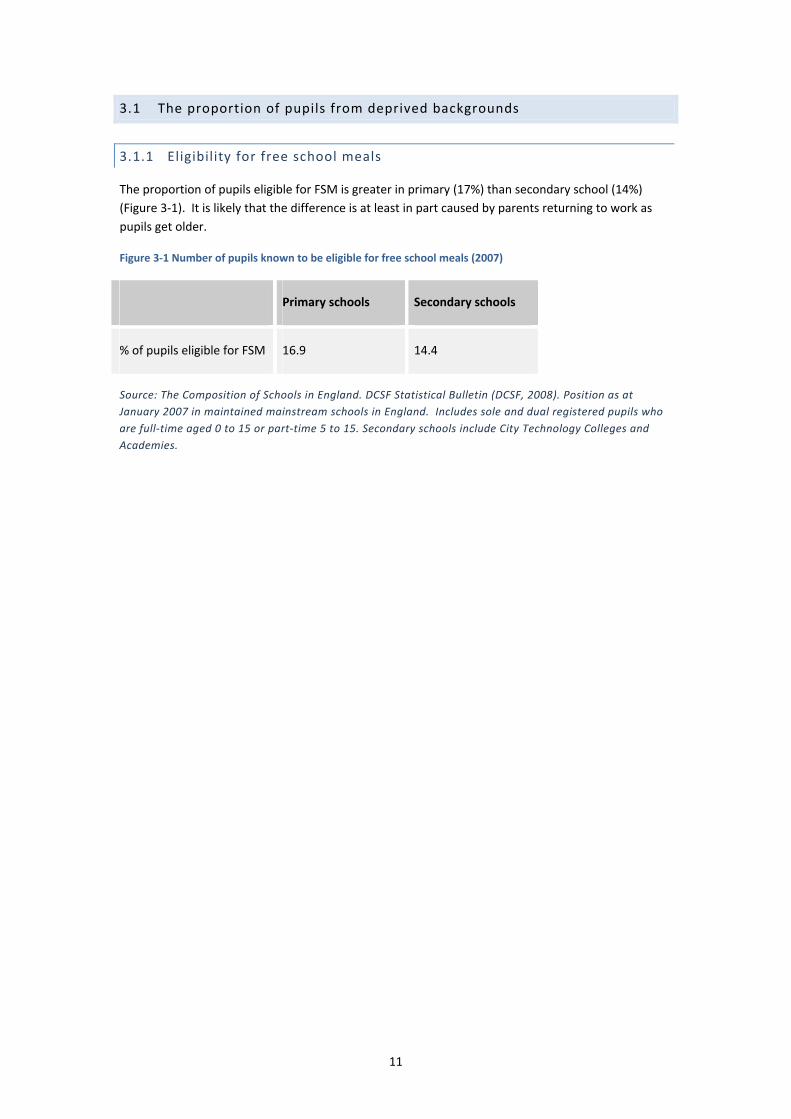
The proportion of pupils eligible for FSM is greater in primary (17%) than secondary school (14%) (Figure 3‐1). It is likely that the difference is at least in part caused by parents returning to work as pupils get older.
Figure 3‐1 Number of pupils known to be eligible for free school meals (2007)
Primary schools Secondary schools
% of pupils eligible for FSM 16.9 14.4
Source: The Composition of Schools in England. DCSF Statistical Bulletin (DCSF, 2008). Position as at January 2007 in maintained mainstream schools in England. Includes sole and dual registered pupils who are full‐time aged 0 to 15 or part‐time 5 to 15. Secondary schools include City Technology Colleges and Academies.
12
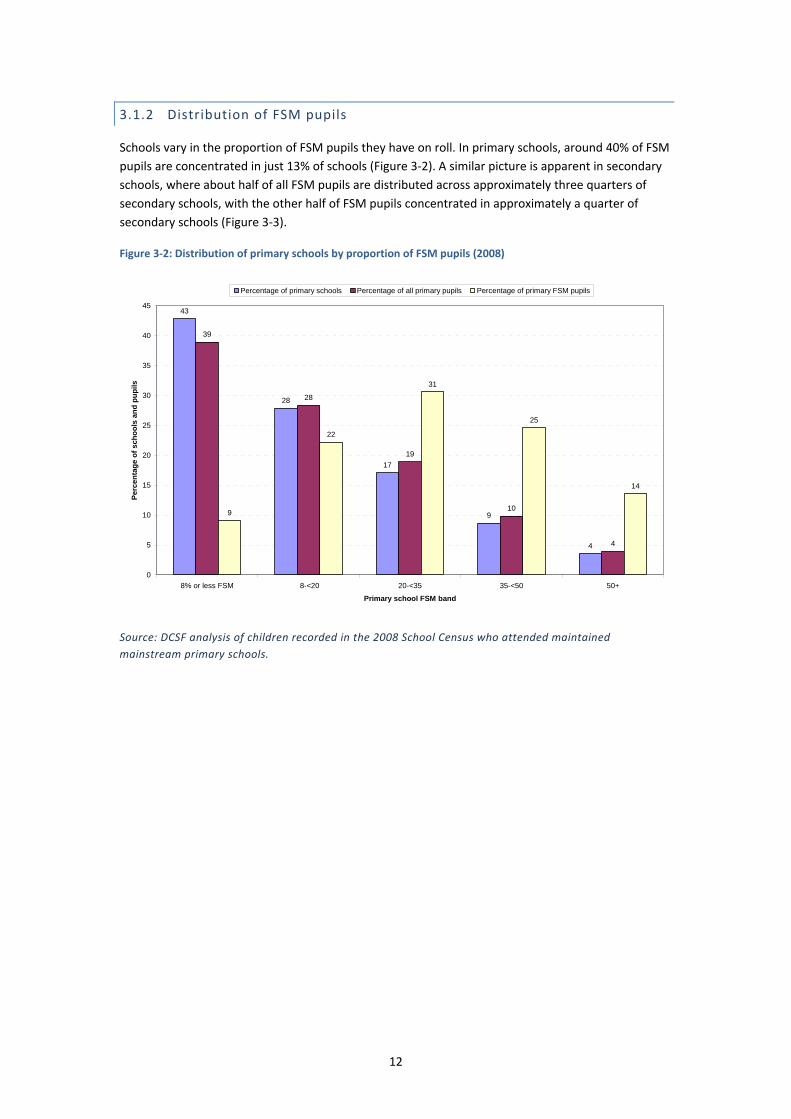
3.1.2 Distribution of FSM pupils
Schools vary in the proportion of FSM pupils they have on roll. In primary schools, around 40% of FSM pupils are concentrated in just 13% of schools (Figure 3‐2). A similar picture is apparent in secondary schools, where about half of all FSM pupils are distributed across approximately three quarters of secondary schools, with the other half of FSM pupils concentrated in approximately a quarter of secondary schools (Figure 3‐3).
Figure 3‐2: Distribution of primary schools by proportion of FSM pupils (2008)
43
28
17
9
4
39
28
19
10
4
9
22
31
25
14
0
5
10
15
20
25
30
35
40
45
8% or less FSM 8-<20 20-<35 35-<50 50+
Primary school FSM band
Perc
enta
ge o
f sch
ools
and
pup
ils
Percentage of primary schools Percentage of all primary pupils Percentage of primary FSM pupils
Source: DCSF analysis of children recorded in the 2008 School Census who attended maintained mainstream primary schools.

13
Figure 3‐3: Distribution of secondary schools by proportion of FSM pupils (2008)
2122
15
17
15
6
2
21
23
1617
15
6
2
5
1112
20
28
16
8
0
5
10
15
20
25
30
0-5% 5-9% 9-13% 13-21% 21-35% 35-50% 50+%
Secondary school FSM band
Perc
enta
ge o
f sch
ools
and
pup
ils
Percentage of secondary schools Percentage of all secondary pupils Percentage of secondary FSM pupils
Source: DCSF analysis of children recorded in the 2008 School Census who attended maintained mainstream secondary schools, Academies and CTCs.
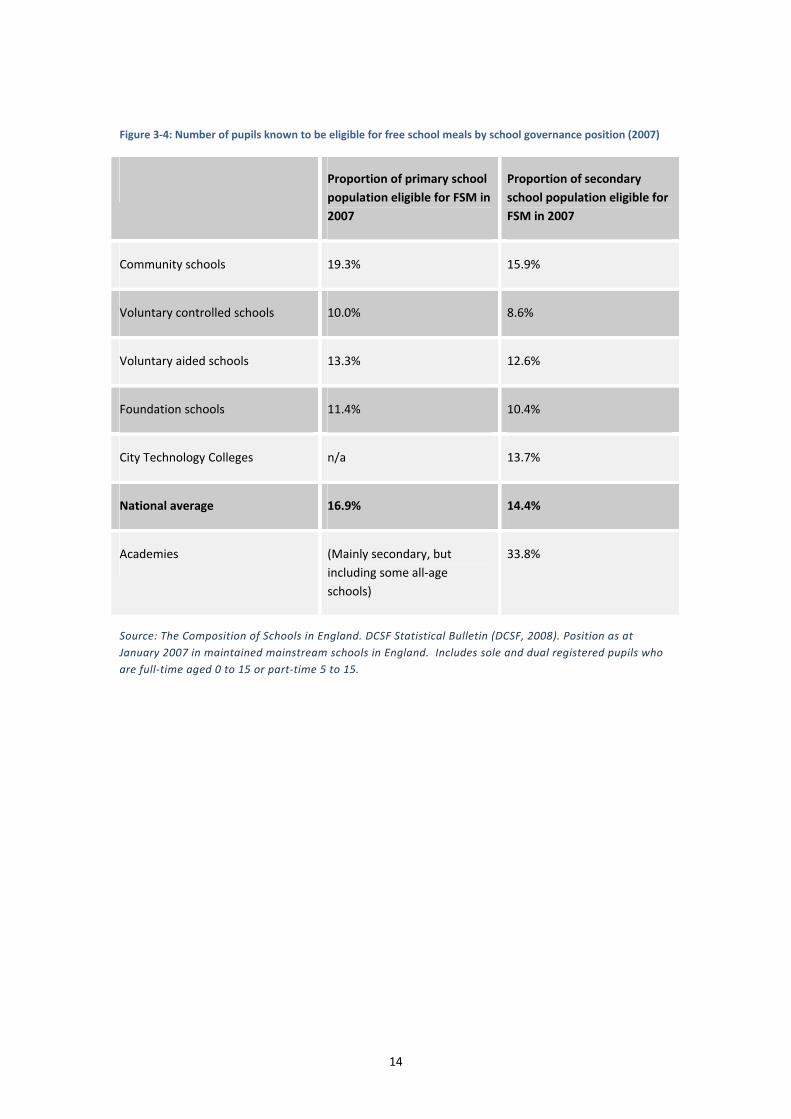
FSM rates vary by school type, with Academies having a notably higher proportion of FSM pupils compared to other school types (34% compared to 16% for Community schools) (Figure 3‐4). Grammar schools, by contrast, have a very low rate of FSM pupils (just 2%) (Figure 3‐5).
14
Figure 3‐4: Number of pupils known to be eligible for free school meals by school governance position (2007)
Proportion of primary school population eligible for FSM in 2007
Proportion of secondary school population eligible for FSM in 2007
Community schools 19.3% 15.9%
Voluntary controlled schools 10.0% 8.6%
Voluntary aided schools 13.3% 12.6%
Foundation schools 11.4% 10.4%
City Technology Colleges n/a 13.7%
National average 16.9% 14.4%
Academies (Mainly secondary, but including some all‐age schools)
33.8%
Source: The Composition of Schools in England. DCSF Statistical Bulletin (DCSF, 2008). Position as at January 2007 in maintained mainstream schools in England. Includes sole and dual registered pupils who are full‐time aged 0 to 15 or part‐time 5 to 15.
15
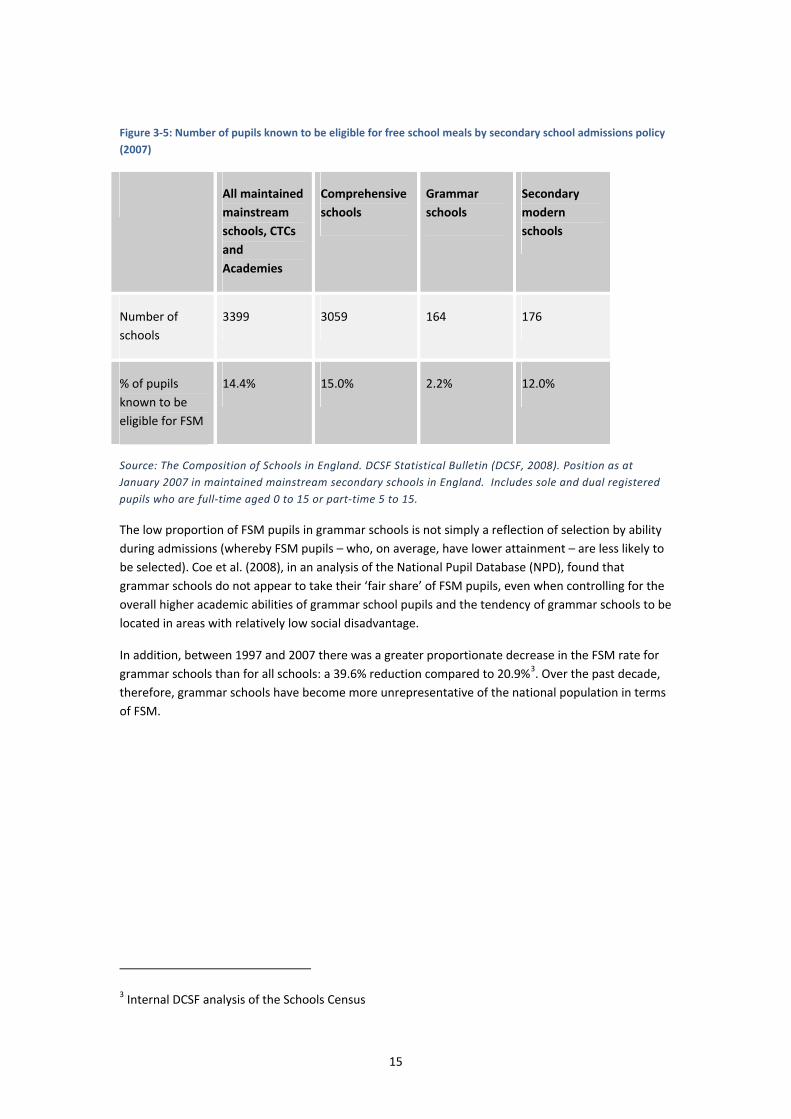
Figure 3‐5: Number of pupils known to be eligible for free school meals by secondary school admissions policy (2007)
All maintained mainstream schools, CTCs and Academies
Comprehensive schools
Grammar schools
Secondary modern schools
Number of schools
3399 3059 164 176
% of pupils known to be eligible for FSM
14.4% 15.0% 2.2% 12.0%
Source: The Composition of Schools in England. DCSF Statistical Bulletin (DCSF, 2008). Position as at January 2007 in maintained mainstream secondary schools in England. Includes sole and dual registered pupils who are full‐time aged 0 to 15 or part‐time 5 to 15.
The low proportion of FSM pupils in grammar schools is not simply a reflection of selection by ability during admissions (whereby FSM pupils – who, on average, have lower attainment – are less likely to be selected). Coe et al. (2008), in an analysis of the National Pupil Database (NPD), found that grammar schools do not appear to take their ‘fair share’ of FSM pupils, even when controlling for the overall higher academic abilities of grammar school pupils and the tendency of grammar schools to be located in areas with relatively low social disadvantage.
In addition, between 1997 and 2007 there was a greater proportionate decrease in the FSM rate for grammar schools than for all schools: a 39.6% reduction compared to 20.9%3. Over the past decade, therefore, grammar schools have become more unrepresentative of the national population in terms of FSM.
3 Internal DCSF analysis of the Schools Census
16
3.1.3 Change in pupils’ FSM status
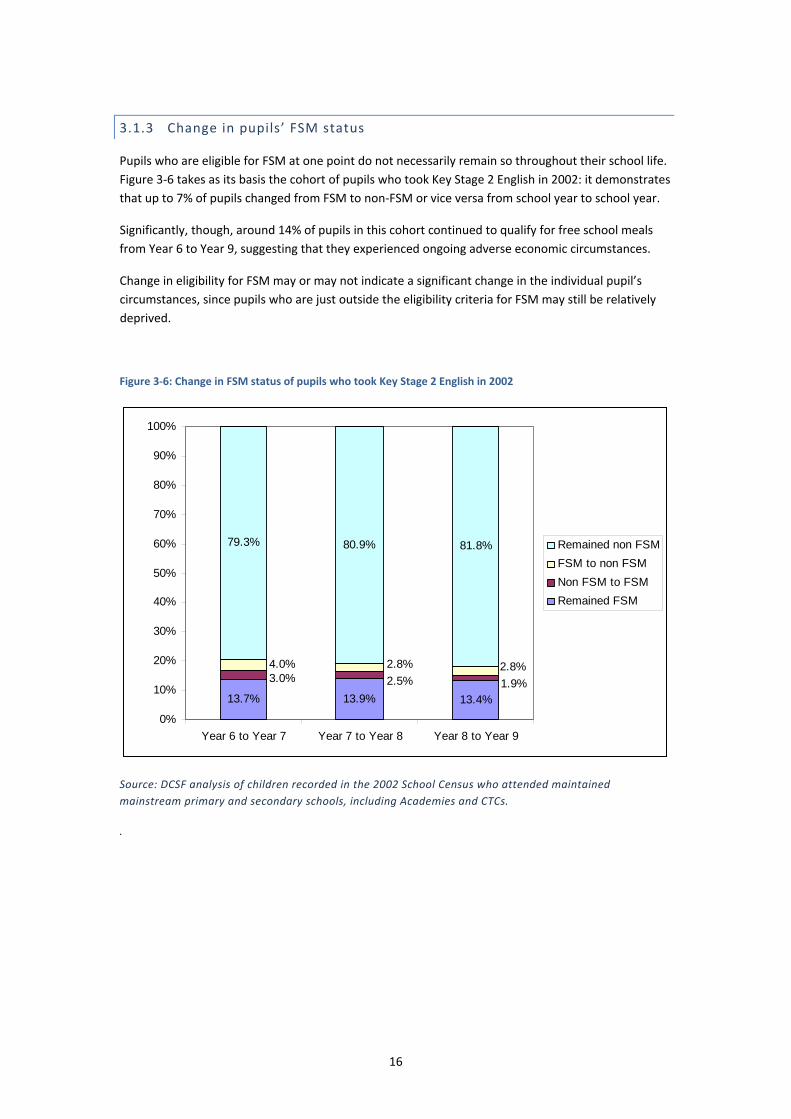
Pupils who are eligible for FSM at one point do not necessarily remain so throughout their school life. Figure 3‐6 takes as its basis the cohort of pupils who took Key Stage 2 English in 2002: it demonstrates that up to 7% of pupils changed from FSM to non‐FSM or vice versa from school year to school year.
Significantly, though, around 14% of pupils in this cohort continued to qualify for free school meals from Year 6 to Year 9, suggesting that they experienced ongoing adverse economic circumstances.
Change in eligibility for FSM may or may not indicate a significant change in the individual pupil’s circumstances, since pupils who are just outside the eligibility criteria for FSM may still be relatively deprived.
Figure 3‐6: Change in FSM status of pupils who took Key Stage 2 English in 2002
13.7% 13.9% 13.4%
79.3% 80.9% 81.8%
1.9%2.5%3.0%2.8%2.8%4.0%
0%
10%
20%
30%
40%
50%
60%
70%
80%
90%
100%
Year 6 to Year 7 Year 7 to Year 8 Year 8 to Year 9
Remained non FSMFSM to non FSMNon FSM to FSMRemained FSM
Source: DCSF analysis of children recorded in the 2002 School Census who attended maintained mainstream primary and secondary schools, including Academies and CTCs.
.
17
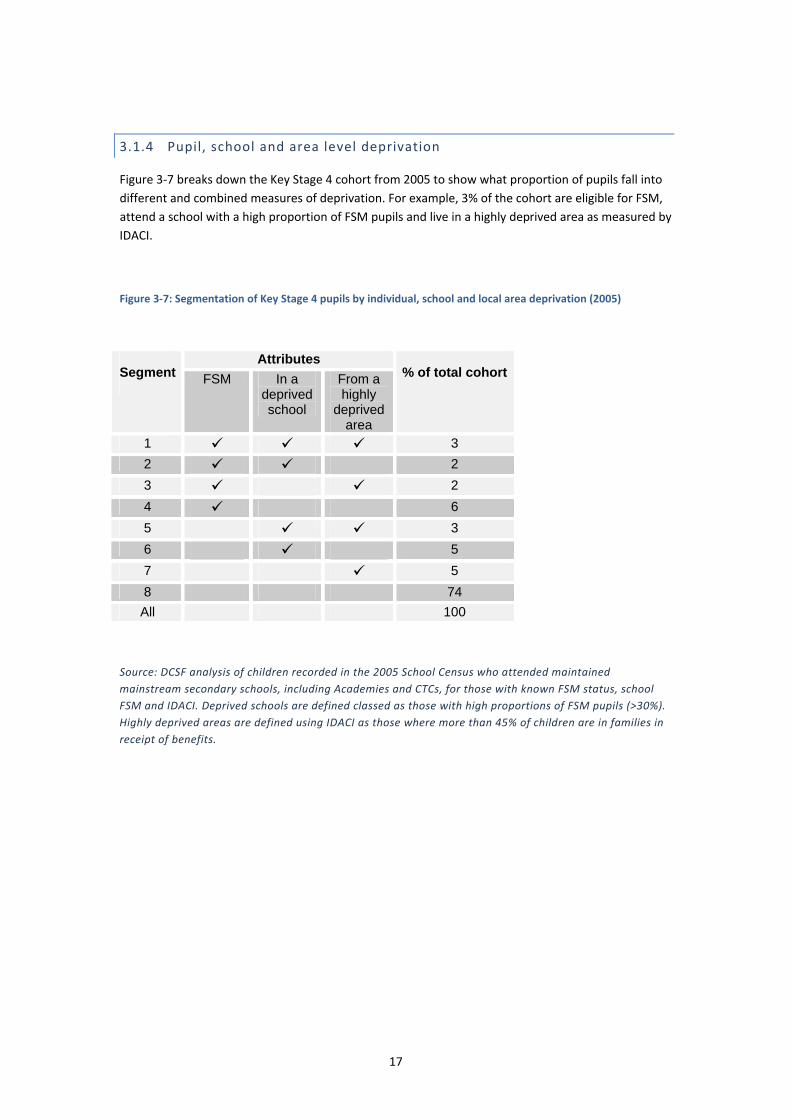
3.1.4 Pupil, school and area level deprivation
Figure 3‐7 breaks down the Key Stage 4 cohort from 2005 to show what proportion of pupils fall into different and combined measures of deprivation. For example, 3% of the cohort are eligible for FSM, attend a school with a high proportion of FSM pupils and live in a highly deprived area as measured by IDACI.
Figure 3‐7: Segmentation of Key Stage 4 pupils by individual, school and local area deprivation (2005)
Attributes Segment FSM In a
deprived school
From a highly
deprived area
% of total cohort
1 3 2 2 3 2 4 6 5 3 6 5 7 5 8 74 All 100
Source: DCSF analysis of children recorded in the 2005 School Census who attended maintained mainstream secondary schools, including Academies and CTCs, for those with known FSM status, school FSM and IDACI. Deprived schools are defined classed as those with high proportions of FSM pupils (>30%). Highly deprived areas are defined using IDACI as those where more than 45% of children are in families in receipt of benefits.

18
3.2 Characteristics of pupils who experience deprivation
3.2.1 Ethnicity
The proportion of pupils eligible for free school meals varies by ethnic group (Figure 3‐8). Compared to the average, high proportions of Traveller of Irish Heritage and Gypsy Roma pupils are eligible for FSM. There are also higher than average proportions of Black African, Black Caribbean, White and Black African, White and Black Caribbean, Pakistani, and Bangladeshi pupils eligible for FSM, across both phases of education. The percentage of Indian and Chinese pupils who are eligible for FSM is below the average for all pupils.
Figure 3‐8: Percentage of pupils eligible for FSM by ethnic group (2008)
14
18
58
40
16
32
27
18
23
9
25
35
15
30
43
35
10
32
17 17
11
15
54
42
15
26
22
15
19
9
30
43
16
23
35
28
9
32
13 14
0
10
20
30
40
50
60
70
Whi
te B
ritis
h
Irish
Trav
elle
r of I
rish
herit
age
Gyp
sy/ R
oma
Any
othe
r Whi
teba
ckgr
ound
Whi
te a
nd B
lack
Car
ibbe
an
Whi
te a
nd B
lack
Afric
an
Whi
te a
nd A
sian
Any
othe
r Mix
edba
ckgr
ound Indi
an
Paki
stan
i
Ban
glad
eshi
Any
othe
r Asi
anba
ckgr
ound
Blac
k C
arib
bean
Bla
ck A
frica
n
Any
othe
r Bla
ckba
ckgr
ound
Chi
nese
Any
othe
r eth
nic
grou
p
Cla
ssifi
ed
Unc
lass
ified
Perc
enta
ge o
f pup
ils e
ligib
le fo
r FSM
Primary Secondary
Source: DCSF analysis of children recorded in the 2008 School Census who attended maintained mainstream primary and secondary schools, including Academies and CTCs.

19
Lindsay, Pather and Strand (2006) looked at the relationship between FSM eligibility and IDACI scores for different ethnic groups. Figure 3‐9 shows that for both FSM and non‐FSM pupils, there is significant variation in each group’s mean IDACI score.
First, this indicates that non‐FSM pupils are not a homogenous group and that within this group some pupils may experience a significant degree of deprivation. In particular, non‐FSM Bangladeshi, Pakistani and Black pupils appear, on average, to live in areas of higher disadvantage than non‐FSM White British, Mixed White & Asian and Chinese pupils. Second, there is variation in IDACI scores for FSM pupils: for example, Bangladeshi FSM pupils are more likely to live in an area of higher deprivation than White British FSM pupils.
Figure 3‐9: Mean IDACI score by ethnic group and entitlement to FSM
Source: Lindsay, Pather & Strand (2006)
20
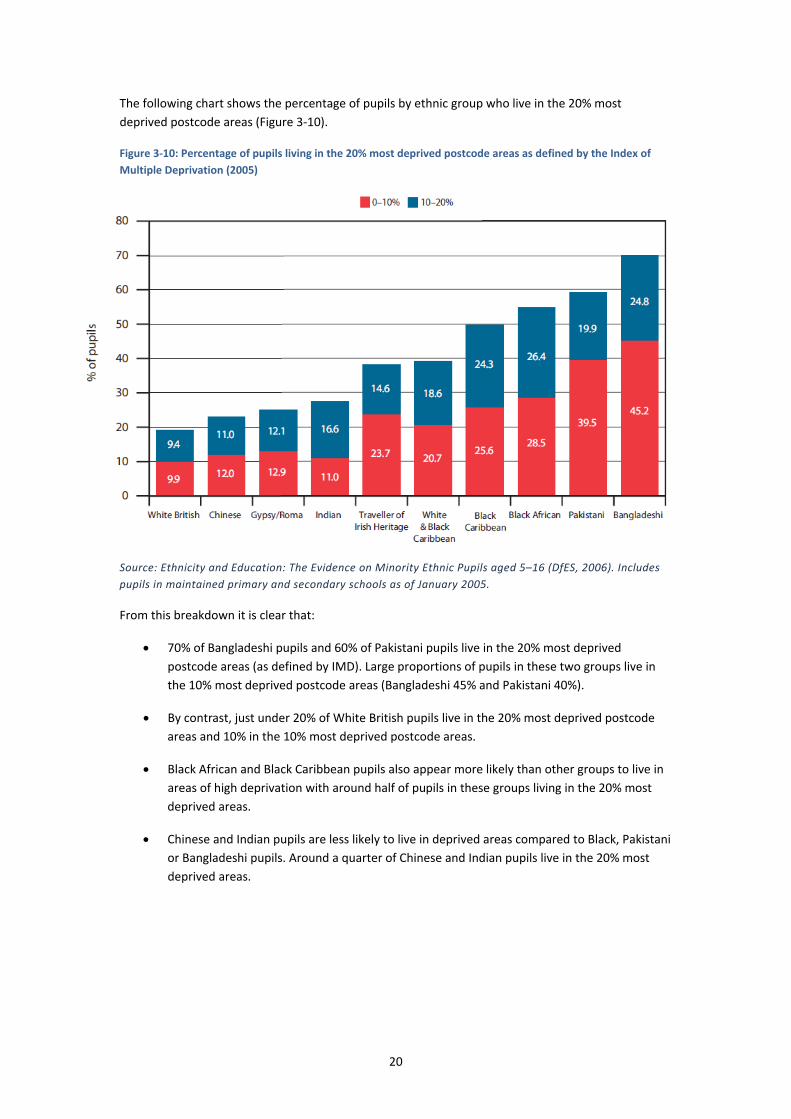
The following chart shows the percentage of pupils by ethnic group who live in the 20% most deprived postcode areas (Figure 3‐10).
Figure 3‐10: Percentage of pupils living in the 20% most deprived postcode areas as defined by the Index of Multiple Deprivation (2005)
Source: Ethnicity and Education: The Evidence on Minority Ethnic Pupils aged 5–16 (DfES, 2006). Includes pupils in maintained primary and secondary schools as of January 2005.
From this breakdown it is clear that:
• 70% of Bangladeshi pupils and 60% of Pakistani pupils live in the 20% most deprived postcode areas (as defined by IMD). Large proportions of pupils in these two groups live in the 10% most deprived postcode areas (Bangladeshi 45% and Pakistani 40%).
• By contrast, just under 20% of White British pupils live in the 20% most deprived postcode areas and 10% in the 10% most deprived postcode areas.
• Black African and Black Caribbean pupils also appear more likely than other groups to live in areas of high deprivation with around half of pupils in these groups living in the 20% most deprived areas.
• Chinese and Indian pupils are less likely to live in deprived areas compared to Black, Pakistani or Bangladeshi pupils. Around a quarter of Chinese and Indian pupils live in the 20% most deprived areas.
21
• A quarter of Gypsy/Roma pupils live in the 20% most deprived postcode areas compared to nearly 40% of Traveller of Irish Heritage pupils4.
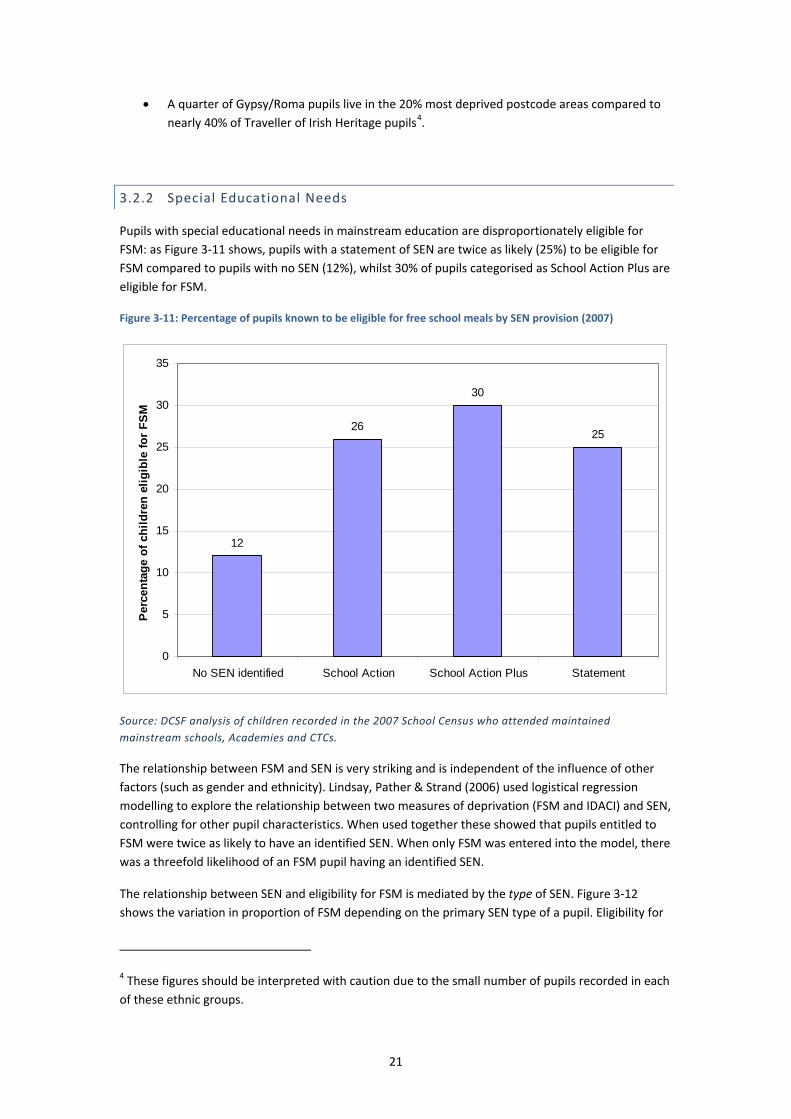
3.2.2 Special Educational Needs
Pupils with special educational needs in mainstream education are disproportionately eligible for FSM: as Figure 3‐11 shows, pupils with a statement of SEN are twice as likely (25%) to be eligible for FSM compared to pupils with no SEN (12%), whilst 30% of pupils categorised as School Action Plus are eligible for FSM.
Figure 3‐11: Percentage of pupils known to be eligible for free school meals by SEN provision (2007)
12
26
30
25
0
5
10
15
20
25
30
35
No SEN identified School Action School Action Plus Statement
Perc
enta
ge o
f chi
ldre
n el
igib
le fo
r FS
M
Source: DCSF analysis of children recorded in the 2007 School Census who attended maintained mainstream schools, Academies and CTCs.
The relationship between FSM and SEN is very striking and is independent of the influence of other factors (such as gender and ethnicity). Lindsay, Pather & Strand (2006) used logistical regression modelling to explore the relationship between two measures of deprivation (FSM and IDACI) and SEN, controlling for other pupil characteristics. When used together these showed that pupils entitled to FSM were twice as likely to have an identified SEN. When only FSM was entered into the model, there was a threefold likelihood of an FSM pupil having an identified SEN.
The relationship between SEN and eligibility for FSM is mediated by the type of SEN. Figure 3‐12 shows the variation in proportion of FSM depending on the primary SEN type of a pupil. Eligibility for
4 These figures should be interpreted with caution due to the small number of pupils recorded in each of these ethnic groups.

22
FSM is particularly high for three types of SEN: (1) behavioural, emotional and social difficulty (BESD); (2) moderate learning difficulty (MLD) and (3) severe learning difficulty (SLD). Approximately a third of the pupils identified with each of these three types of SEN are also eligible for FSM. The proportions are lower in the other SEN types but it should be noted that these proportions are all still higher than the proportion of pupils with FSM who have no identified SEN. Lindsay et al. (2006) also found a similarly strong relationship between FSM and these three types (especially BESD and MLD) in their regression model.
Figure 3‐12 Percentage of pupils known to be eligible for free school meals by SEN type (2007)
Autistic Spectrum Disorder
Autistic Spectrum Disorder
Hearing Impairment
Hearing Impairment
Physical Disabilty
Physical Disabilty
Visual Impairment
Visual Impairment
Specific Learning Difficulty
Specific Learning Difficulty
Multi-Sensory Impairment
Multi-Sensory Impairment
Other Difficulty/Disability
Other Difficulty/Disability
Speech Language & C o mmunicat io n
Speech Language & C o mmunicat io n
Profound & Multiple Learning
Profound & Multiple Learning
B ehavio ur, Emo t io nal and So cial D if f iculty
B ehavio ur, Emo tio nal and So cial D if f iculty
Moderate Learning Difficulty
Moderate Learning Difficulty
Severe Learning Difficulty
Severe Learning Difficulty
0 5 10 15 20 25 30 35
Stat
emen
tSc
hool
Act
ion
Plus
Percentage of children receiving FSM
25% of children with a statement receive FSM
30% of children with School Action Plus receive FSM
27
26
23
21
2015
29
33
33
23
21
22
18
20
15
21
21
28
34
35
35
21
21
21
Source: DCSF analysis of children recorded in the 2007 School Census who attended maintained mainstream schools, Academies and CTCs. N.b. primary SEN type is not recorded for children categorised as School Action.
Lindsay et al. (2006) note that there is a clear pattern with FSM pupils disproportionately identified with SEN types with a “social definition” (where the problem is often defined first in the school context) compared to other types which are more constitutional or organic.
23
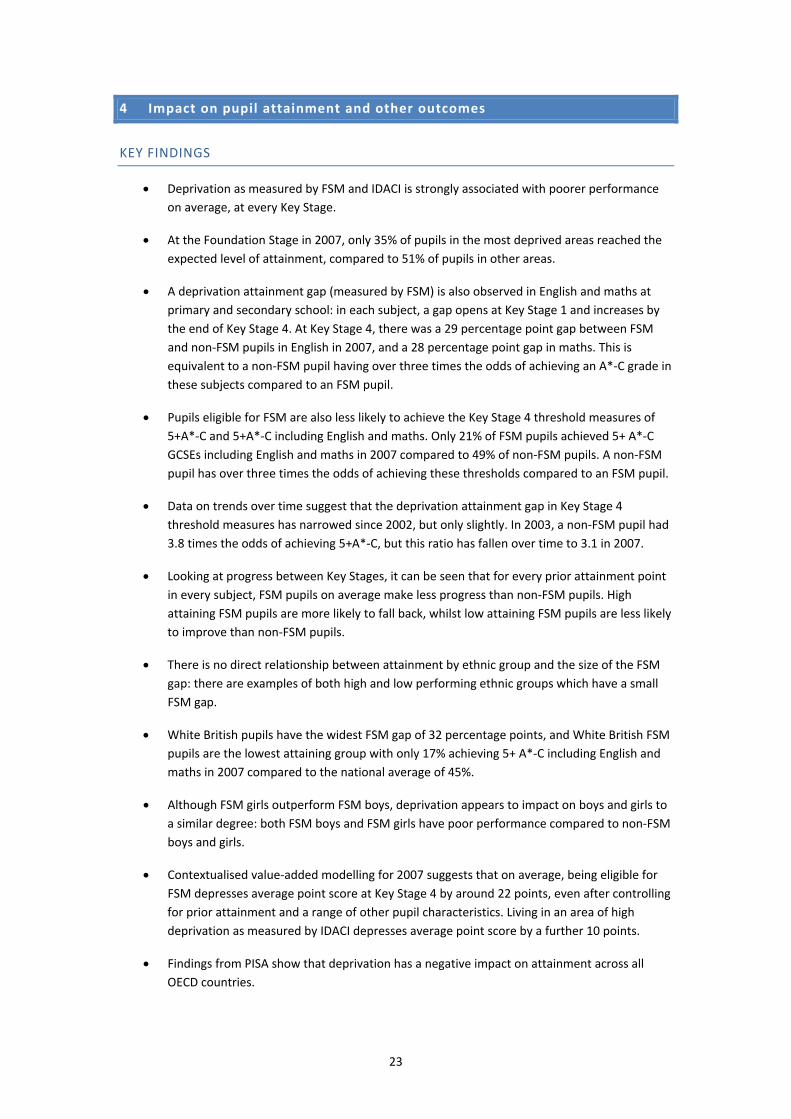
4 Impact on pupil attainment and other outcomes
KEY FINDINGS
• Deprivation as measured by FSM and IDACI is strongly associated with poorer performance on average, at every Key Stage.
• At the Foundation Stage in 2007, only 35% of pupils in the most deprived areas reached the expected level of attainment, compared to 51% of pupils in other areas.
• A deprivation attainment gap (measured by FSM) is also observed in English and maths at primary and secondary school: in each subject, a gap opens at Key Stage 1 and increases by the end of Key Stage 4. At Key Stage 4, there was a 29 percentage point gap between FSM and non‐FSM pupils in English in 2007, and a 28 percentage point gap in maths. This is equivalent to a non‐FSM pupil having over three times the odds of achieving an A*‐C grade in these subjects compared to an FSM pupil.
• Pupils eligible for FSM are also less likely to achieve the Key Stage 4 threshold measures of 5+A*‐C and 5+A*‐C including English and maths. Only 21% of FSM pupils achieved 5+ A*‐C GCSEs including English and maths in 2007 compared to 49% of non‐FSM pupils. A non‐FSM pupil has over three times the odds of achieving these thresholds compared to an FSM pupil.
• Data on trends over time suggest that the deprivation attainment gap in Key Stage 4 threshold measures has narrowed since 2002, but only slightly. In 2003, a non‐FSM pupil had 3.8 times the odds of achieving 5+A*‐C, but this ratio has fallen over time to 3.1 in 2007.
• Looking at progress between Key Stages, it can be seen that for every prior attainment point in every subject, FSM pupils on average make less progress than non‐FSM pupils. High attaining FSM pupils are more likely to fall back, whilst low attaining FSM pupils are less likely to improve than non‐FSM pupils.
• There is no direct relationship between attainment by ethnic group and the size of the FSM gap: there are examples of both high and low performing ethnic groups which have a small FSM gap.
• White British pupils have the widest FSM gap of 32 percentage points, and White British FSM pupils are the lowest attaining group with only 17% achieving 5+ A*‐C including English and maths in 2007 compared to the national average of 45%.
• Although FSM girls outperform FSM boys, deprivation appears to impact on boys and girls to a similar degree: both FSM boys and FSM girls have poor performance compared to non‐FSM boys and girls.
• Contextualised value‐added modelling for 2007 suggests that on average, being eligible for FSM depresses average point score at Key Stage 4 by around 22 points, even after controlling for prior attainment and a range of other pupil characteristics. Living in an area of high deprivation as measured by IDACI depresses average point score by a further 10 points.
• Findings from PISA show that deprivation has a negative impact on attainment across all OECD countries.

24
• FSM pupils are more likely to be absent from school than non‐FSM pupils, particularly in secondary school. FSM pupils are three times more likely to have unauthorised absence and to be persistent absentees.
• FSM pupils are seven times as likely to be permanently excluded from primary school, and three and a half times as likely to be permanently excluded from secondary. FSM pupils are three to four times as likely to have a fixed term exclusion.

25
4.1 Attainment
4.1.1 Overview of the FSM gap in educational attainment
Throughout the education system, pupils eligible for FSM have, on average, lower attainment than other pupils, as illustrated in Figure 4‐1.
Figure 4‐1 FSM attainment gap from early years to higher education
Sources:
Key Stage 2 & 4: National Indicator Set
FSP, Key Stage 1 & 3: DCSF analysis of children recorded in the 2007 School Census who attended maintained mainstream primary and secondary schools, including Academies and CTCs.
Entry to Higher Education: HESA 2004/05 and 2005/06 matched to data from 2002 Schools Census

26
4.1.2 Early years
Feinstein (2003) identified significant gaps in developmental tasks at the age of 22 months using data from the 1970 British Cohort Study. He found lower scores in children from low socio‐economic backgrounds in cube stacking, language use, drawing and personal development compared to children from higher socio‐economic groups.
Findings from more recent longitudinal datasets have found similar differences. Findings from the Millennium Cohort Study (of over 15,000 children born in 2000 and their families) show:
• At age three, children from lower income households have lower vocabulary scores (a mean score of 46.2 for those in households below 60% median income compared to a mean score of 52.2 for those in households above 60%) (George et al., 2007).
• At age three, children from lower income households scored less well (nearly 11 points lower) on the Bracken School Readiness test (which examines basic concepts such as colours, letters, numbers/counting, sizes, comparisons and shapes) compared to higher income households (George et al., 2007).
• At age five, children from lower income households had lower standardised scores on cognitive ability tests (eight points lower than those from higher income households) and on measures of naming vocabulary, picture similarities and pattern construction (Jones & Schoon, 2008).
At the end of the Reception Year, pupils are assessed on the Foundation Stage Profile (FSP) which assesses pupils’ development and learning needs. The Foundation Stage Profile includes assessment on three personal, social and emotional development scales and four communication, language and literacy scales.
Figure 4‐2 illustrates the national findings of the FSP and compares pupils who live in the 30% most deprived areas in England (based on the Index of Multiple Deprivation) with pupils in other areas.
In 2007, 45% of pupils were judged to be "working securely" in each area of learning across all these seven scales. This figure was 35% for pupils in the most deprived areas, and 51% for pupils in other areas. Thus, a gap in attainment can be seen at this early stage between pupils according to their economic circumstances. This gap has been stable at around 17 percentage points for the past three years.

27
Figure 4‐2: Percentage of pupils working securely in each area of learning at the Foundation Stage (2007)
Source: SFR 32/2007 Foundation Stage Profile 2006/2007: National Results
Percentage of children working securely in each area of learning
45
35
51
0
10
20
30
40
50
60
All children Children in 30% mostdeprived areas
Children in other areas

28
4.1.3 Key Stage 1 to Key Stage 4 7
Figure 4‐3 presents data on the FSM gap in attainment from Key Stage 1 to Key Stage 4 for key subjects, including the percentage point gap and the odds ratio between FSM and non‐FSM pupils. Odds ratios are a useful way of comparing gaps across a range of different threshold measures.
ENGLISH
A non‐FSM pupil has three times the odds of achieving the expected level in reading and writing at Key Stage 1 and English at Key Stage 2, compared to an FSM pupil (odds ratio of 3.0 and 3.1). At Key Stage 3 and Key Stage 4, the odds ratio rises slightly to 3.3, with only 33% of FSM pupils achieving an A*‐C grade in English compared to 62% of non‐FSM pupils.
MATHS
A similar pattern is evident in maths. By Key Stage 4, a non‐FSM pupil has 3.2 times the odds of achieving an A*‐C grade in maths compared to an FSM pupil. Only 29% of FSM pupils achieving an A*‐C grade in Maths compared to 57% of non‐FSM pupils.
SCIENCE
The gap measured in terms of the odds ratio is particularly high at Key Stage 3, when a non‐FSM pupil has 3.5 times the odds of achieving the expected level in science compared to an FSM pupil.
KEY STAGE 4 THRESHOLD MEASURES
A non‐FSM pupil has three times the odds of achieving 5+ A*‐C grades at Key Stage 4, and 3.6 times the odds of achieving 5+ A*‐C including English and maths, compared to an FSM pupil.
Only 21% of FSM pupils achieve 5 good GCSEs including English and maths compared to 49% of non‐FSM pupils.
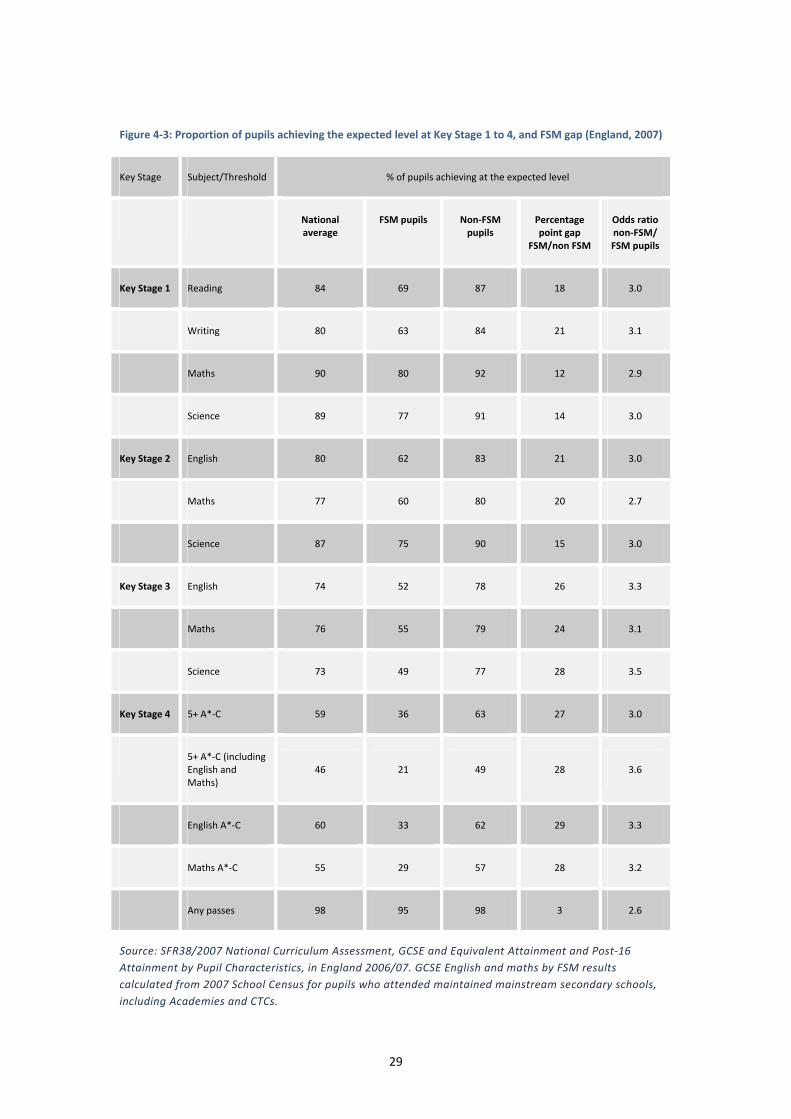
29
Figure 4‐3: Proportion of pupils achieving the expected level at Key Stage 1 to 4, and FSM gap (England, 2007)
Key Stage Subject/Threshold % of pupils achieving at the expected level
National average
FSM pupils Non‐FSM pupils
Percentage point gap
FSM/non FSM
Odds ratio non‐FSM/ FSM pupils
Key Stage 1 Reading 84 69 87 18 3.0
Writing 80 63 84 21 3.1
Maths 90 80 92 12 2.9
Science 89 77 91 14 3.0
Key Stage 2 English 80 62 83 21 3.0
Maths 77 60 80 20 2.7
Science 87 75 90 15 3.0
Key Stage 3 English 74 52 78 26 3.3
Maths 76 55 79 24 3.1
Science 73 49 77 28 3.5
Key Stage 4 5+ A*‐C 59 36 63 27 3.0
5+ A*‐C (including English and Maths)
46 21 49 28 3.6
English A*‐C 60 33 62 29 3.3
Maths A*‐C 55 29 57 28 3.2
Any passes 98 95 98 3 2.6
Source: SFR38/2007 National Curriculum Assessment, GCSE and Equivalent Attainment and Post‐16 Attainment by Pupil Characteristics, in England 2006/07. GCSE English and maths by FSM results calculated from 2007 School Census for pupils who attended maintained mainstream secondary schools, including Academies and CTCs.

30
Figure 4‐4 presents attainment at the expected level from Key Stage 1 to Key Stage 4 by IDACI decile, and shows the percentage point gap and odds ratio for the most and least deprived deciles.

31
Figure 4‐4: Proportion of pupils achieving expected level by IDACI decile of pupil residence (England, 2007)
Key Stage 1 Key Stage 2 Key Stage 3 Key Stage 4 % achieving level 2 or above % achieving level 4 or above % achieving level 5 or above % of pupils at the end of Key Stage 4
achieving IDACI decile Reading Writing Mathematics Science English Mathematics Science English Mathematics Science 5+ A*-C 5+ A*-C incl English
and Mathematics Any Passes
England 0 - 10 % most deprived 73 68 83 80 68 66 79 57 60 54 42.3 25.3 95.0 10 - 20 % 77 72 85 83 71 68 81 62 64 59 45.2 29.9 96.1 20 - 30 % 79 75 87 85 74 71 83 66 69 65 49.1 34.2 96.8 30 - 40 % 82 79 89 88 77 73 86 71 73 70 53.9 39.2 97.5 40 - 50 % 85 81 91 90 80 77 88 75 77 74 58.8 44.7 98.1 50 - 60 % 87 84 92 92 83 79 90 78 80 78 63.0 49.5 98.4 60 - 70 % 89 86 93 93 85 81 91 81 82 81 67.1 53.8 98.7 70 - 80 % 90 88 94 94 87 83 92 84 85 83 70.3 57.8 99.0 80 - 90 % 91 89 95 95 89 85 94 86 87 85 73.7 61.9 99.1 90 - 100 % least deprived 93 91 96 96 91 88 95 89 89 89 78.6 68.4 99.3 Percentage point gap between most and least deprived
20 23 13 16 23 22 16 32 29 35 36.3 43.1 4.3
Odds ratio between least and most deprived 4.9 4.8 4.9 6.0 4.8 3.8 5.1 6.1 5.4 6.9 5.0 6.4 7.5
Source: SFR38/2007 National Curriculum Assessment, GCSE and Equivalent Attainment and Post‐16 Attainment by Pupil Characteristics, in England 2006/07

32
4.1.4 Changes in the FSM gap over time
Between 2003 and 2007, there has been an improvement of 11.1 percentage points in the average attainment of FSM pupils at GCSE (5+ A*‐C). This compares favourably to the improvement of 7.6 percentage points for non‐FSM pupils. In other words, there has been a decrease in the FSM gap at GCSE on this measure of 3.5 percentage points between 2003 and 2007. However, the average attainment of FSM pupils remains low: in 2003, just under a quarter of FSM pupils reached the threshold; in 2007, just over a third reached the threshold.
Comparing the odds ratios over time, it can be seen that the odds of FSM pupils achieving the threshold are improving in relation to the odds of non‐FSM pupils. In 2003, a non‐FSM pupil had 3.8 times the odds of achieving 5+A*‐C, but this ratio has fallen over time to 3.1 in 2007.
Figure 4‐5 Trends in percentage of pupils achieving 5+A*‐C at GCSE and equivalents (2003‐2007)
24.4
26.1 29
.9 33.0 35.5
55.2
56.1 58.9
61.0
62.8
3.13.23.4
3.63.8
0
10
20
30
40
50
60
70
2003 2004 2005 2006 20070.0
0.5
1.0
1.5
2.0
2.5
3.0
3.5
4.0
4.5
% FSM pupils achieving5+A*-C% Non-FSM pupils achieving5+A*-COdds ratio
Source: DCSF analysis of children recorded in the School Census for 2003‐2007, who attended maintained mainstream secondary schools, including Academies and CTCs.
33
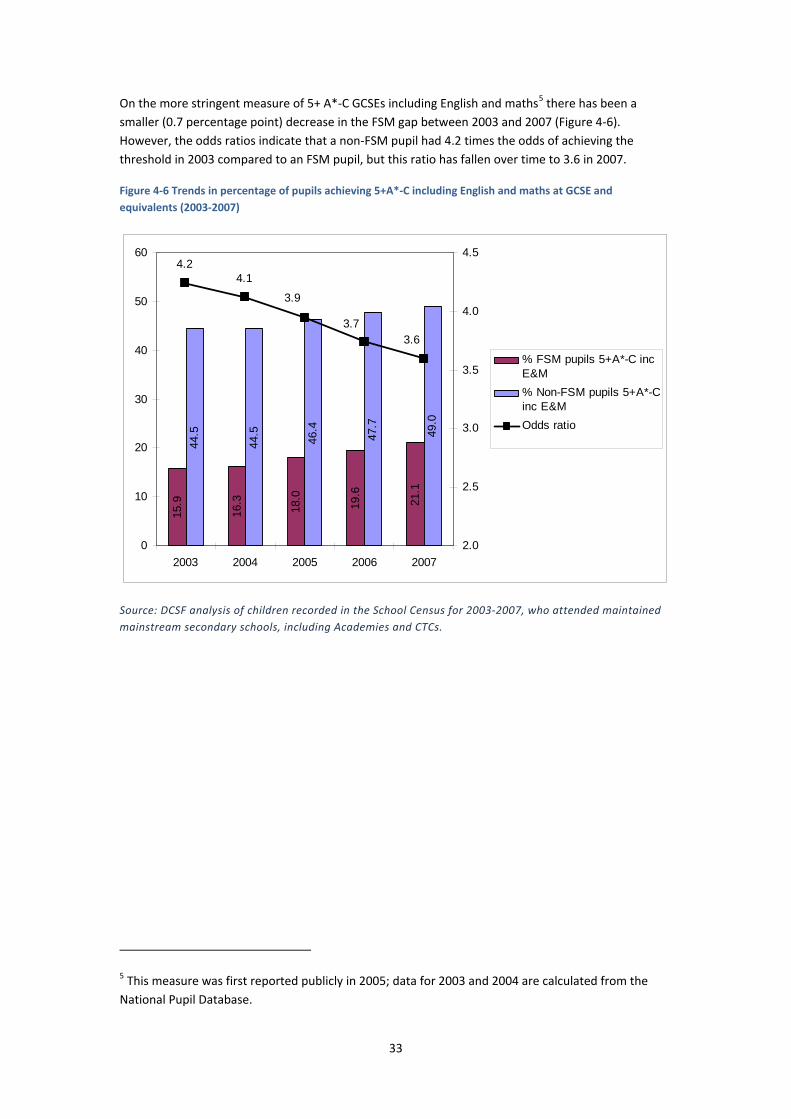
On the more stringent measure of 5+ A*‐C GCSEs including English and maths5 there has been a smaller (0.7 percentage point) decrease in the FSM gap between 2003 and 2007 (Figure 4‐6). However, the odds ratios indicate that a non‐FSM pupil had 4.2 times the odds of achieving the threshold in 2003 compared to an FSM pupil, but this ratio has fallen over time to 3.6 in 2007.
Figure 4‐6 Trends in percentage of pupils achieving 5+A*‐C including English and maths at GCSE and equivalents (2003‐2007)
15.9
16.3
18.0
19.6
21.1
44.5
44.5
46.4
47.7
49.0
4.24.1
3.9
3.73.6
0
10
20
30
40
50
60
2003 2004 2005 2006 20072.0
2.5
3.0
3.5
4.0
4.5
% FSM pupils 5+A*-C incE&M% Non-FSM pupils 5+A*-Cinc E&MOdds ratio
Source: DCSF analysis of children recorded in the School Census for 2003‐2007, who attended maintained mainstream secondary schools, including Academies and CTCs.
5 This measure was first reported publicly in 2005; data for 2003 and 2004 are calculated from the National Pupil Database.

34
4.1.5 Educational progress
PREDICTING PROGRESS FROM EARLY COGNITIVE MARKERS
Not all children from deprived backgrounds will have lower than average attainment, but those from deprived backgrounds who initially appear to be doing well find it harder to sustain progress as they get older.
For most children, early cognitive assessments can be highly predictive of later attainment. For example, the ability to copy shapes and simple patterns (such as diamonds, crosses and circles) at aged five (and development of these skills between 42 months and five), is highly predictive of attainment in reading and maths at aged 10, and of life success at aged 30 (Feinstein et al., 2008). However, the relationship between early cognitive skills and later academic achievement operates in a different way for children from lower socio‐economic groups: children from these groups with good early copying skills do not sustain progress as measured at aged 10 or 30 compared to children from other socio‐economic groups.
Other evidence also shows different trajectories for children with initially good scores on developmental tests. Feinstein (2003) showed that even those children from lower socio‐economic groups performing well initially on tasks such as cube stacking and language use (at 22 months) were, on average, overtaken by others from higher socio‐economic groups by the time they started primary school.
Figure 4‐7 Differential trajectory of children by socio‐economic group from 22 to 118 months
Source: Feinstein (2003)
These different patterns by socio‐economic group are replicated when looking at Key Stage data. FSM pupils’ attainment trajectories from Key Stage to Key Stage are, on average, noticeably different from non‐FSM pupils’. The charts below look at the top and bottom quintiles (20%) of pupil attainment at each Key Stage and plot what proportion of pupils were no longer in those quintiles at the end of the next Key Stage, by FSM status; that is, the proportion of high attainers at one Key Stage who are no longer high attainers at the next, and the proportion of low attainers at one Key Stage who improved by the next. Also presented are data on progression rates for different prior attainment points.
35
Overall, what can be seen is an increasing polarisation as FSM pupils move down the attainment spectrum, even if they demonstrate good early attainment, and non‐FSM pupils on average move up.
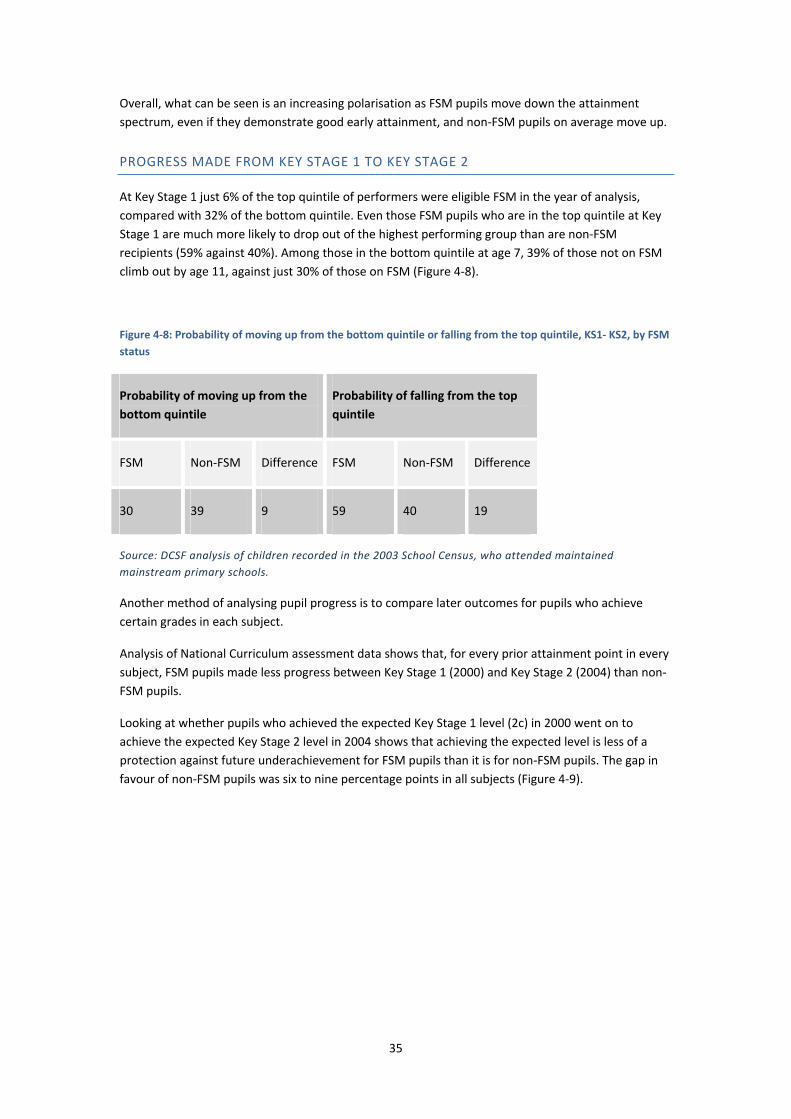
PROGRESS MADE FROM KEY STAGE 1 TO KEY STAGE 2
At Key Stage 1 just 6% of the top quintile of performers were eligible FSM in the year of analysis, compared with 32% of the bottom quintile. Even those FSM pupils who are in the top quintile at Key Stage 1 are much more likely to drop out of the highest performing group than are non‐FSM recipients (59% against 40%). Among those in the bottom quintile at age 7, 39% of those not on FSM climb out by age 11, against just 30% of those on FSM (Figure 4‐8).
Figure 4‐8: Probability of moving up from the bottom quintile or falling from the top quintile, KS1‐ KS2, by FSM status
Probability of moving up from the bottom quintile
Probability of falling from the top quintile
FSM Non‐FSM Difference FSM Non‐FSM Difference
30 39 9 59 40 19
Source: DCSF analysis of children recorded in the 2003 School Census, who attended maintained mainstream primary schools.
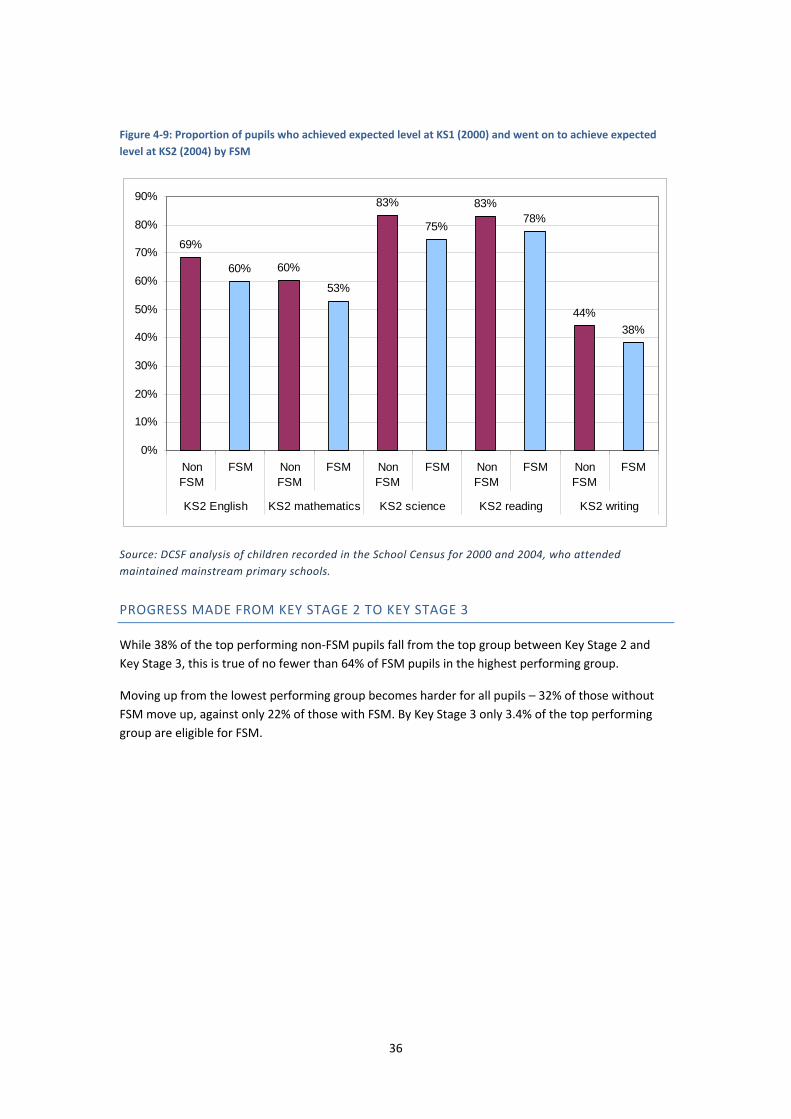
Another method of analysing pupil progress is to compare later outcomes for pupils who achieve certain grades in each subject.
Analysis of National Curriculum assessment data shows that, for every prior attainment point in every subject, FSM pupils made less progress between Key Stage 1 (2000) and Key Stage 2 (2004) than non‐FSM pupils.
Looking at whether pupils who achieved the expected Key Stage 1 level (2c) in 2000 went on to achieve the expected Key Stage 2 level in 2004 shows that achieving the expected level is less of a protection against future underachievement for FSM pupils than it is for non‐FSM pupils. The gap in favour of non‐FSM pupils was six to nine percentage points in all subjects (Figure 4‐9).
36
Figure 4‐9: Proportion of pupils who achieved expected level at KS1 (2000) and went on to achieve expected level at KS2 (2004) by FSM
69%
60% 60%
53%
83%
75%
83%78%
44%38%
0%
10%
20%
30%
40%
50%
60%
70%
80%
90%
NonFSM
FSM NonFSM
FSM NonFSM
FSM NonFSM
FSM NonFSM
FSM
KS2 English KS2 mathematics KS2 science KS2 reading KS2 writing
Source: DCSF analysis of children recorded in the School Census for 2000 and 2004, who attended maintained mainstream primary schools.
PROGRESS MADE FROM KEY STAGE 2 TO KEY STAGE 3
While 38% of the top performing non‐FSM pupils fall from the top group between Key Stage 2 and Key Stage 3, this is true of no fewer than 64% of FSM pupils in the highest performing group.
Moving up from the lowest performing group becomes harder for all pupils – 32% of those without FSM move up, against only 22% of those with FSM. By Key Stage 3 only 3.4% of the top performing group are eligible for FSM.

37
Figure 4‐10: Probability of moving up from the bottom quintile or falling from the top quintile, KS2‐ KS3, by FSM status
Probability of moving up from the bottom quintile
Probability of falling from the top quintile
FSM Non‐FSM Difference FSM Non‐FSM Difference
22 32 10 64 38 26
Source: DCSF analysis of children recorded in the 2003 School Census, who attended maintained mainstream secondary schools, including Academies and CTCs.
As with Key Stage 1 to Key Stage 2, analysis of progression from Key Stage 2 (2001) to Key Stage 3 (2004) shows that for every prior attainment point in every subject, non‐FSM pupils progress more than FSM pupils.
For those pupils who achieved the Key Stage 2 expected level of 4, the gap in favour of non‐FSM pupils at Key Stage 3 was greatest in science (21 percentage points), followed by English (18 percentage points) and mathematics (14 percentage points) (Figure 4‐11).
Figure 4‐11: Proportion of pupils who achieved expected level at KS2 (2001) and went on to achieve expected level at KS3 (2004) by FSM
81%
63%
85%
71%
76%
55%
0%
10%
20%
30%
40%
50%
60%
70%
80%
90%
Non FSM FSM Non FSM FSM Non FSM FSM
KS3 English KS3 Mathematics KS3 Science
Source: DCSF analysis of children recorded in the School Census for 2001 and 2004, who attended maintained mainstream secondary schools, including Academies and CTCs.

38
PROGRESS MADE FROM KEY STAGE 3 TO KEY STAGE 4
At GCSE the probabilities of moving up from the bottom quintile are similar to those at Key Stage 3. The chances of dropping out of the top quintile are lower, although the figure for FSM pupils is still nearly half (46%).
Figure 4‐12: Probability of moving up from the bottom quintile or falling from the top quintile, KS3‐ KS4, by FSM status
Probability of moving up from the bottom quintile
Probability of falling from the top quintile
FSM Non‐FSM Difference FSM Non‐FSM Difference
24 34 10 46 28 18
Source: DCSF analysis of children recorded in the 2003 School Census, who attended maintained mainstream secondary schools, including Academies and CTCs.
Between Key Stage 3 and GCSE, the gender difference is larger than the differences between FSM and non‐FSM pupils: the probabilities of getting 5 A*‐C from a starting point of Level 5 at Key Stage 3 were 59% for girls and 48% for boys (an 11 percentage points difference) – compared to a 7 percentage point difference between FSM and non‐FSM pupils, at 48% and 54% respectively).
Figure 4‐13: Percentage of pupils gaining 5+ A*‐C GCSEs from a starting point of Level 5 at Key Stage 3 by FSM Status and Gender (2007)
Gender FSM Non‐FSM FSM Gap
FSM Status 48% 54% 6%
Girls 59% 53% 60% 7%
Boys 48% 42% 49% 7%
Gender Gap 11% 11% 11%
Source: DCSF analysis of children recorded in the 2007 School Census, who attended maintained mainstream secondary schools, including Academies and CTCs.
39
MAKING TWO LEVELS’ PROGRESS PER KEY STAGE
Figure 4‐14 shows that, from each starting level, FSM pupils are less likely to make two levels of progress from Key Stage 3 to Key Stage 4 than non‐FSM pupils with the same starting level. The sizes of these gaps differ by prior attainment band. This analysis demonstrates that low attaining FSM pupils typically find it slightly harder to catch up if they fall behind; and that high attaining FSM pupils typically find it much harder to excel.
Figure 4‐14: Making two levels’ progress ‐ FSM gaps in progress from Key Stage 3 to Key Stage 4 in maths by prior attainment level
1315
23 22
29
39
1618
27 28
38
52
0
10
20
30
40
50
60
<=3 4 5 6 7 8
KS3 Maths Level
% m
akin
g tw
o le
vels
pro
gres
s by
end
of K
S4
%FSM %Non-FSM
Source: DCSF analysis of children recorded in the 2007 School Census, who took GCSE maths and who attended maintained mainstream secondary schools, including Academies and CTCs.
40
4.1.6 Relative impact of FSM eligibility and prior attainment
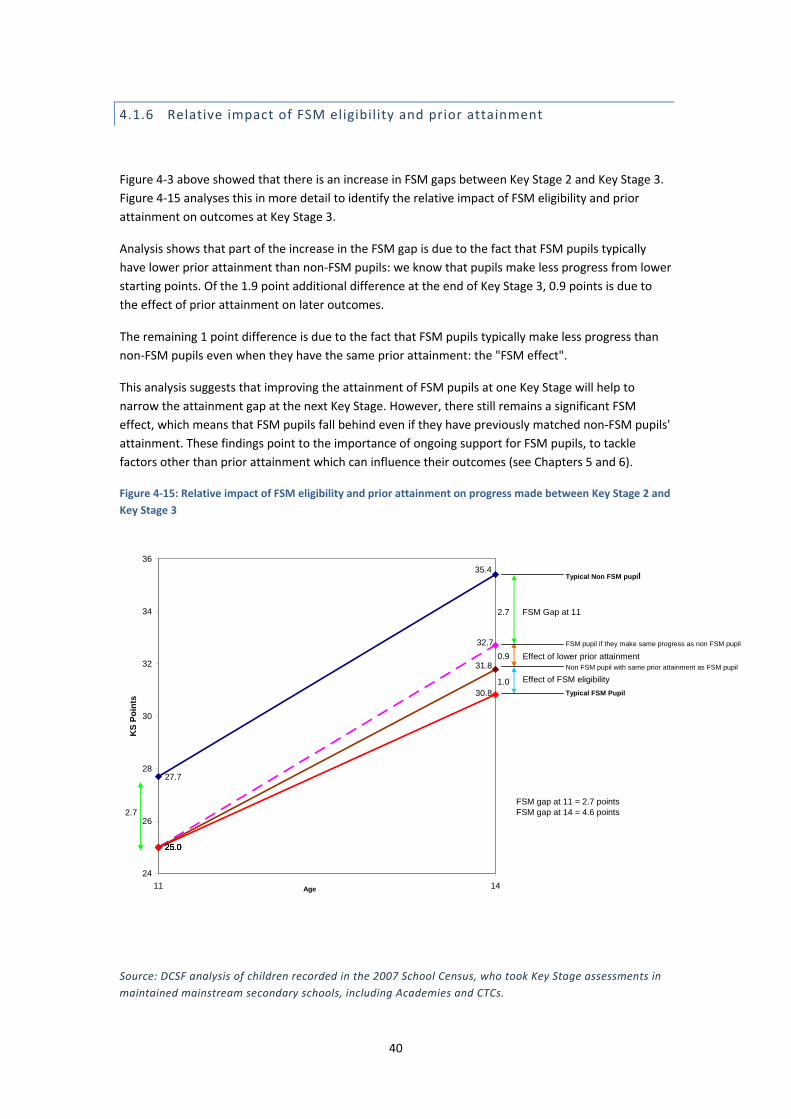
Figure 4‐3 above showed that there is an increase in FSM gaps between Key Stage 2 and Key Stage 3. Figure 4‐15 analyses this in more detail to identify the relative impact of FSM eligibility and prior attainment on outcomes at Key Stage 3.
Analysis shows that part of the increase in the FSM gap is due to the fact that FSM pupils typically have lower prior attainment than non‐FSM pupils: we know that pupils make less progress from lower starting points. Of the 1.9 point additional difference at the end of Key Stage 3, 0.9 points is due to the effect of prior attainment on later outcomes.
The remaining 1 point difference is due to the fact that FSM pupils typically make less progress than non‐FSM pupils even when they have the same prior attainment: the "FSM effect".
This analysis suggests that improving the attainment of FSM pupils at one Key Stage will help to narrow the attainment gap at the next Key Stage. However, there still remains a significant FSM effect, which means that FSM pupils fall behind even if they have previously matched non‐FSM pupils' attainment. These findings point to the importance of ongoing support for FSM pupils, to tackle factors other than prior attainment which can influence their outcomes (see Chapters 5 and 6).
Figure 4‐15: Relative impact of FSM eligibility and prior attainment on progress made between Key Stage 2 and Key Stage 3
27.7
25.025.025.0
35.4
32.7
31.8
30.8
24
26
28
30
32
34
36
11 14Age
KS
Poin
ts
Typical Non FSM pupil
FSM pupil if they make same progress as non FSM pupil
Effect of lower prior attainment
Effect of FSM eligibility
0.9
1.0
FSM Gap at 11
Typical FSM Pupil
2.7
Non FSM pupil with same prior attainment as FSM pupil
2.7FSM gap at 11 = 2.7 pointsFSM gap at 14 = 4.6 points
Source: DCSF analysis of children recorded in the 2007 School Census, who took Key Stage assessments in maintained mainstream secondary schools, including Academies and CTCs.
41
4.1.7 Interaction with ethnicity, gender and other variables
ETHNICITY
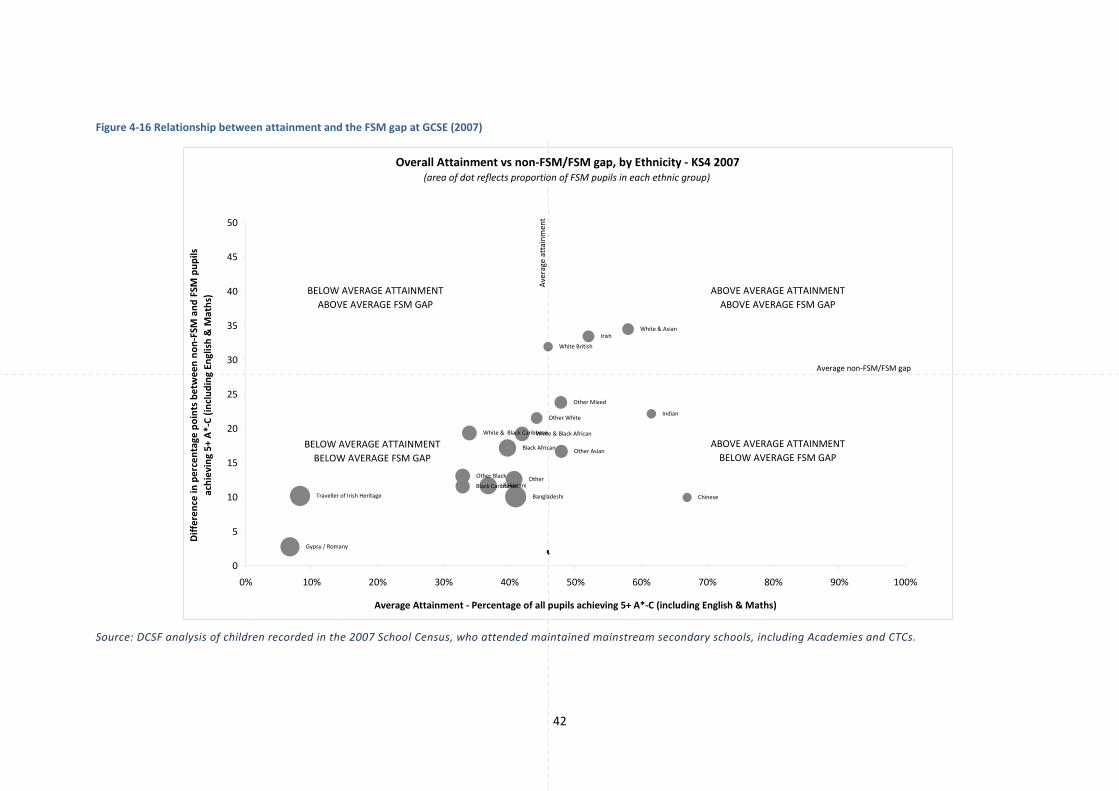
There is no direct relationship between attainment by ethnic group and the size of the FSM gap. For many minority ethnic groups with low attainment, the size of the FSM gap is smaller than average. However, other minority ethnic groups with higher attainment (i.e. Chinese and Indian) also have a smaller than average FSM gap. This is illustrated in Figure 4‐16 which plots attainment of each ethnic group at GCSE in relation to the extent of the FSM gap (it also illustrates the relative size of the FSM population within each ethnic group).
In contrast, the relationship between deprivation and attainment is much stronger for White British pupils than for other ethnic groups. Not only do White British pupils have the widest FSM gap of 32 percentage points (apart from the relatively small Irish and White/Asian groups), White British FSM pupils are the lowest attaining group (after the Gypsy/Roma and Traveller groups) with only 17% achieving 5+ A*‐C (including English and maths) compared to the national average of 45% (Figure 4‐17).
42
Figure 4‐16 Relationship between attainment and the FSM gap at GCSE (2007)
Source: DCSF analysis of children recorded in the 2007 School Census, who attended maintained mainstream secondary schools, including Academies and CTCs.
Overall Attainment vs non‐FSM/FSM gap, by Ethnicity ‐ KS4 2007(area of dot reflects proportion of FSM pupils in each ethnic group)
Black African Other Asian
Other Black Other
Other Mixed
Other White
Bangladeshi
Black Caribbean
Chinese
Gypsy / Romany
Indian
Irish
Pakistani
Traveller of Irish Heritage
White & Asian
White & Black AfricanWhite & Black Caribbean
White British
0
5
10
15
20
25
30
35
40
45
50
0% 10% 20% 30% 40% 50% 60% 70% 80% 90% 100%
Average Attainment ‐ Percentage of all pupils achieving 5+ A*‐C (including English & Maths)
Differen
ce in
percentage po
ints between no
n‐FSM and
FSM
pup
ils
achieving 5+
A*‐C (in
clud
ing En
glish & M
aths) BELOW AVERAGE ATTAINMENT
ABOVE AVERAGE FSM GAPABOVE AVERAGE ATTAINMENTABOVE AVERAGE FSM GAP
ABOVE AVERAGE ATTAINMENTBELOW AVERAGE FSM GAP
BELOW AVERAGE ATTAINMENTBELOW AVERAGE FSM GAP
Average non‐FSM/FSM gap
Average attainm
ent
43
Figure 4‐17: GCSE attainment of non‐FSM and FSM pupils by ethnic group (2007)
Source: SFR38/2007 National Curriculum Assessment, GCSE and Equivalent Attainment and Post‐16 Attainment by Pupil Characteristics, in England 2006/07
Attainment of non‐FSM and FSM pupils, by Ethnicity ‐ KS4 2007
0%
10%
20%
30%
40%
50%
60%
70%
80%
90%
100%Gypsy / Rom
any
Traveller Of Irish Herita
ge
Any
Other Black Backgroun
d
Black Caribb
ean
White and
Black Caribbe
an
Pakistan
i
Black African
Any
Other Ethnic Group
Banglade
shi
White and
Black African
Any
Other W
hite Backgroun
d
White British
Any
Other M
ixed
Backgroun
d
Any
Other Asian
Backgroun
d
Irish
White and
Asian
Indian
Chinese
Percen
tage of n
on‐FSM
and
FSM
pup
ilsachieving 5+
A*‐C (in
clud
ing En
glish & M
aths)
FSM
non‐FSM
non‐FSM/FSM gap
Average attainment

44
GENDER
FSM girls perform better than FSM boys (40% achieved 5+ A*‐C at GCSE in 2007 compared to 31% of FSM boys). Although FSM boys have lower attainment, deprivation appears to impact on boys and girls to a similar degree: both groups underperform their non‐FSM counterparts. The attainment of both FSM girls and FSM boys has improved to a similar extent since 2002: by 12.7 and 12.2 percentage points respectively.
Figure 4‐18: GCSE performance by gender and FSM eligibility (2002 and 2007)
18.8%
27.3%
48.2%
59.3%
31.0%
40.0%
58.3%
67.5%
0.0%
10.0%
20.0%
30.0%
40.0%
50.0%
60.0%
70.0%
80.0%
FSM boys FSM girls Non FSM boys Non FSM girls
20022007
Source: SFR38/2007 National Curriculum Assessment, GCSE and Equivalent Attainment and Post‐16 Attainment by Pupil Characteristics, in England 2006/07 and SFR 04/2004 National Curriculum Assessment and GCSE/GNVQ Attainment by Pupil Characteristics, in England, 2002 (final)
Figure 4‐19 illustrates how the gender gap is consistant across different occupational classes. Data from the Youth Cohort Study collected in 2004 shows that, using occupational class as the measure of deprivation, there is no clear evidence of any relationship between deprivation and the size of the gender gap.

45
Figure 4‐19: Percentage of pupils gaining 5+ A*‐C GCSEs by gender and occupational class (2004)
Source: Youth Cohort Study, reproduced from DfES (2007)
46
INTERACTION OF FSM WITH ETHNICITY AND GENDER
Including gender in the breakdown of deprivation and ethnicity effects shows that there are some differences by gender within ethnic groups, although as noted above on average no significant gender effect can be seen.
Figure 4‐20 and Figure 4‐21 show trends in the GCSE attainment of FSM boys and girls in each ethnic group from 2003 to 2007.
Figure 4‐20: Percentage of FSM boys achieving 5+A*‐C at GCSE and equivalent in 2003‐2007 by ethnicity
Source: DCSF analysis of children recorded in the School Census for 2003‐2007, who attended maintained mainstream secondary schools, including Academies and CTCs.
0
10
20
30
40
50
60
70
80
Whi
te B
ritis
h
Irish
Trav
elle
r of I
rish
Her
itage
Gyp
sy /
Rom
a
Any
oth
er W
hite
back
grou
nd
Whi
te a
nd B
lack
Car
ibbe
an
Whi
te a
nd B
lack
Afri
can
Whi
te a
nd A
sian
Any
oth
er m
ixed
back
grou
nd
Indi
an
Pak
ista
ni
Ban
glad
eshi
Any
oth
er A
sian
back
grou
nd
Bla
ck C
arib
bean
Bla
ck A
frica
n
Any
oth
er B
lack
back
grou
nd
Chi
nese
Any
oth
er o
ther
ethn
icgr
oup A
ll P
upils
% o
f FSM
boy
s ac
hiev
ing
5+ A
*-C
2003 2004 2005 2006 2007
47
Figure 4‐21: Percentage of FSM girls achieving 5+A*‐C at GCSE and equivalent in 2003‐2007 by ethnicity
Source: DCSF analysis of children recorded in the School Census for 2003‐2007, who attended maintained mainstream secondary schools, including Academies and CTCs.
This analysis demonstrates that:
BOYS
• Apart from the Gypsy/Roma and Traveller of Irish Heritage groups, White British FSM boys are the lowest attaining group of FSM boys in every year from 2003 to 2007.
• Indian, Bangladeshi and Pakistani FSM boys are among the highest attaining groups of FSM boys, although still well below the levels of performance of Chinese FSM boys. In 2007, nearly three quarters of Chinese FSM boys (73.8%) achieved 5+A*‐C, compared to fewer than a third of Black Caribbean FSM boys (32%) and about a quarter of White British FSM boys (26.6%).
• For every ethnic group (apart from the Gypsy/Roma group), the proportion of FSM boys achieving 5+ A*‐C at GCSE has increased since 2003. The increase for White British FSM boys was lower than average.
0
10
20
30
40
50
60
70
80
90
Whi
te B
ritis
h
Irish
Trav
elle
r of I
rish
Her
itage
Gyp
sy /
Rom
a
Any
othe
r Whi
teba
ckgr
ound
Whi
te a
nd B
lack
Car
ibbe
an
Whi
te a
nd B
lack
Afric
an
Whi
te a
nd A
sian
Any
othe
r mix
edba
ckgr
ound Indi
an
Paki
stan
i
Bang
lade
shi
Any
othe
r Asi
anba
ckgr
ound
Blac
k C
arib
bean
Blac
k Af
rican
Any
othe
r Bla
ckba
ckgr
ound
Chi
nese
Any
othe
r oth
er e
thni
cgr
oup Al
l Pup
ils
% o
f FSM
girl
s ac
hiev
ing
5+ A
*-C
2003 2004 2005 2006 2007
48
GIRLS
• With the exception of the two Traveller groups, the lowest performing group of FSM girls is the White British group, followed by the White & Black Caribbean group. In 2007, only 34.5% of White British FSM girls and 40.1% of White & Black Caribbean FSM girls achieved 5+A*‐C at GCSE in 2007, compared to 84.3% of Chinese FSM girls. The performance of FSM Black Caribbean girls is relatively high: 48% achieved 5+ A*‐C at GCSE in 2007.
• For every ethnic group (apart from the Gypsy/Roma group), the proportion of FSM girls achieving 5+A*‐C at GCSE has increased since 2003, by 11.5 percentage points on average. The increase for White British FSM girls was slightly lower than average, at 10.5 percentage points. Black Caribbean FSM girls showed a large improvement over time (by 19 percentage points).
RELATIVE IMPACT OF DEPRIVATION
It is important to place the deprivation effects noted above in the context of other influences on attainment.
Coe et al. (2008) examined the GCSE attainment of FSM and non‐FSM pupils taking account of prior attainment and other characteristics and found that being eligible for FSM is associated with just under half a GCSE grade poorer performance than non‐FSM pupils with the same Key Stage 2 attainment and other characteristics.
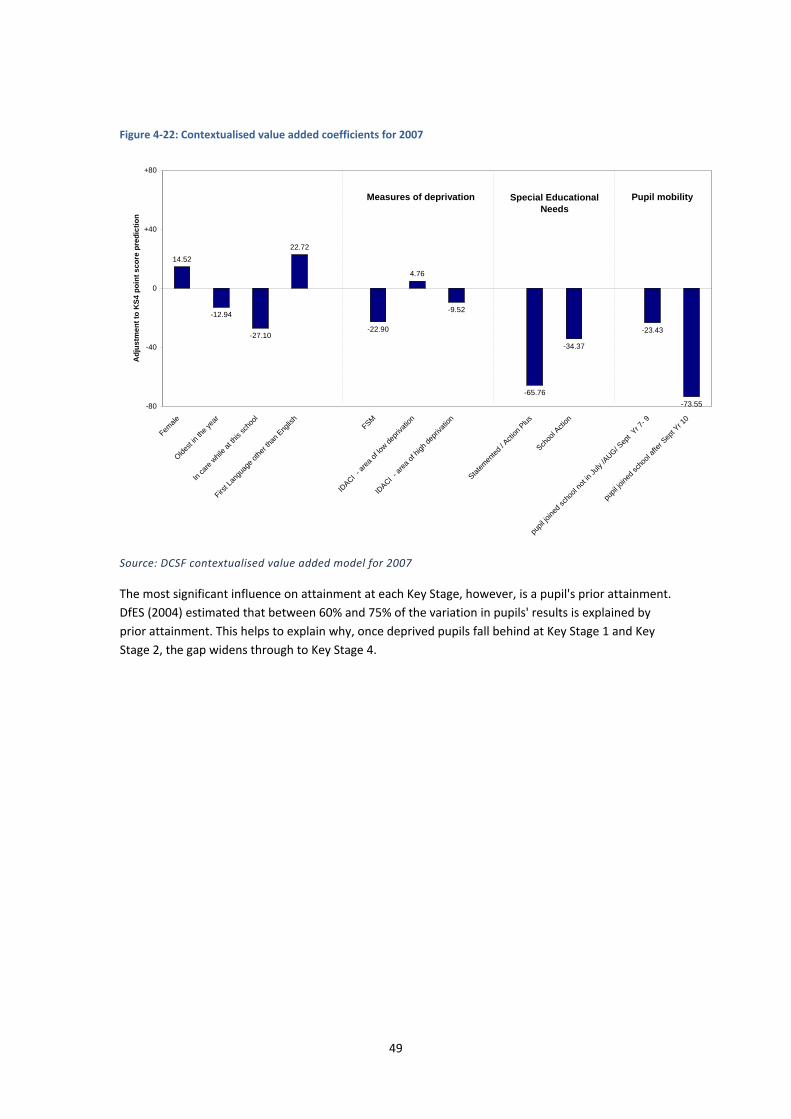
Data from contextualised value‐added (CVA) modelling offers a way of comparing the size of the effects of different variables, including deprivation measures on attainment. As Figure 4‐22 demonstrates, the most significant variable for Key Stage 4 average point score (APS) is a measure of mobility (whether a pupil joined the school after September in Year 10 ‐ this depresses the APS by more than 70 points, compared to similar pupils who are not mobile), followed by whether a pupil has a statement of special educational needs or is categorised as School Action Plus (which depresses the APS by more than 60 points). FSM has a negative effect of almost 23 points, whilst living in an area of high deprivation as measured by IDACI has a negative effect of almost 10 points. These seem small in comparison to the larger effects, but it should be noted that the CVA model represents estimates of the independent effect of each variable: for example, pupils who are FSM and who have a statement of special educational needs will experience double negative impact on their APS. It is therefore important to consider the prevalence of factors such as special educational needs and pupil mobility amongst the FSM group as additional risk factors for their attainment and progress.
49
Figure 4‐22: Contextualised value added coefficients for 2007
14.52
-12.94
-27.10
22.72
-22.90
4.76
-9.52
-65.76
-34.37
-23.43
-73.55-80
-40
0
+40
+80
Female
Oldest
in the
year
In ca
re whil
e at th
is sc
hool
First L
angu
age o
ther th
an E
nglis
hFSM
IDACI -
area
of lo
w depri
vatio
n
IDACI -
area
of hi
gh de
priva
tion
Statem
ented
/ Acti
on P
lus
Schoo
l Acti
on
pupil
joine
d sch
ool n
ot in
July
/AUG/ Sep
t Yr 7
- 9
pupil
joine
d sch
ool a
fter S
ept Y
r 10
Adj
ustm
ent t
o K
S4 p
oint
sco
re p
redi
ctio
n
Measures of deprivation Special Educational Needs
Pupil mobility
Source: DCSF contextualised value added model for 2007
The most significant influence on attainment at each Key Stage, however, is a pupil's prior attainment. DfES (2004) estimated that between 60% and 75% of the variation in pupils' results is explained by prior attainment. This helps to explain why, once deprived pupils fall behind at Key Stage 1 and Key Stage 2, the gap widens through to Key Stage 4.

50
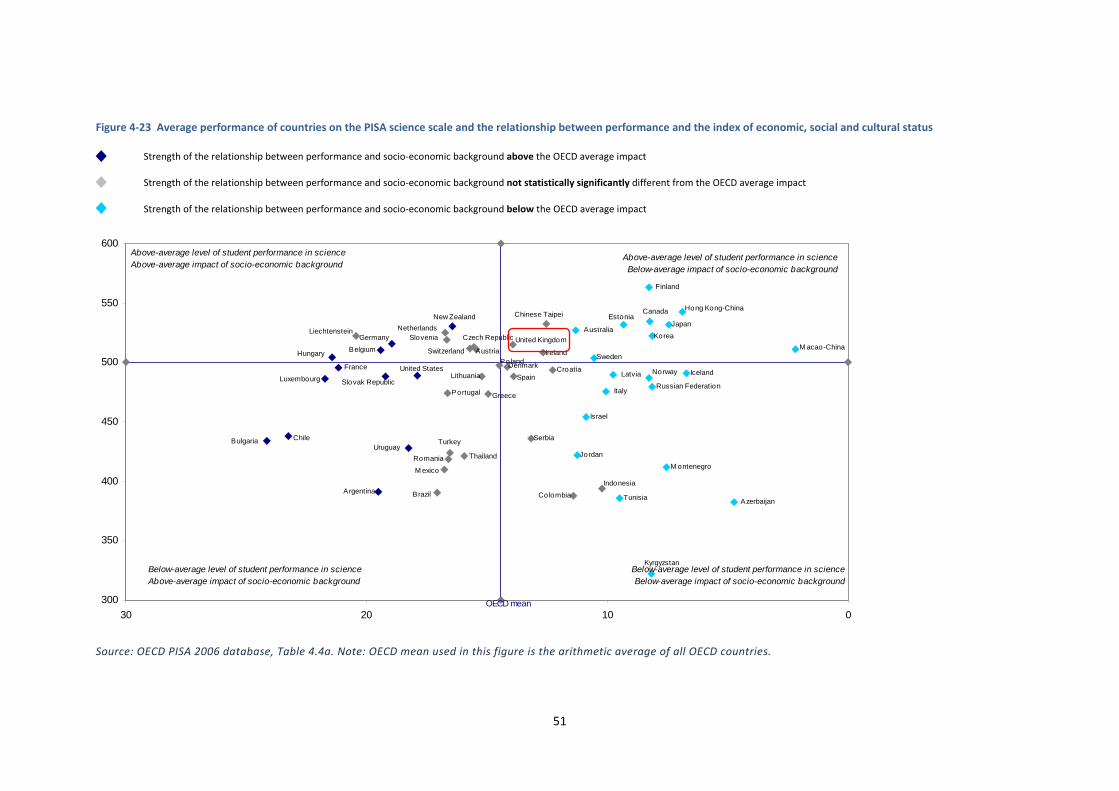
4.1.8 An international problem The negative effect of deprivation on educational attainment is a problem found in the majority of countries. Findings from PISA (2006)6 show the extent of the problem. In all countries, pupils from less advantaged home backgrounds tend to have lower PISA scores. However, a comparison of the relationship between pupil performance and different aspects of socio‐economic background shows that some countries demonstrate high average performance together with a narrow gap between pupils from different socio‐economic backgrounds.
Figure 4‐23 illustrates this by contrasting average performance in science7 (as shown on the vertical axis) with the strength of the relationship between socio‐economic background and science performance, used as a proxy for equity in the distribution of learning opportunities (as shown on the horizontal axis). The UK is not significantly different from the OECD average.
6 The Programme for International Student Assessment (PISA) is a project of the Organisation for Economic Co‐operation and Development (OECD), designed to provide policy‐oriented international indicators of the skills and knowledge of 15‐year‐old students. Three literacy domains are being assessed in PISA: reading, mathematics, and science.
7 Science was the subject of focus in the latest PISA (2006) findings.
51
Figure 4‐23 Average performance of countries on the PISA science scale and the relationship between performance and the index of economic, social and cultural status
Strength of the relationship between performance and socio‐economic background above the OECD average impact
Strength of the relationship between performance and socio‐economic background not statistically significantly different from the OECD average impact
Strength of the relationship between performance and socio‐economic background below the OECD average impact
Source: OECD PISA 2006 database, Table 4.4a. Note: OECD mean used in this figure is the arithmetic average of all OECD countries.
Sweden
Portugal
Bulgaria
Czech Republic
Japan
Hong Kong-China
M ontenegro
Greece
Chinese Taipei
Thailand
Azerbaijan
Estonia
UruguayChile
Indonesia
Spain
Brazil
Romania
Argentina
Russian Federation
Liechtenstein
Belgium
Lithuania
Austria
Canada
Latvia
New Zealand
M exico
Jordan
Croatia
Ireland
Colombia
United KingdomAustralia
United States
Finland
Iceland
Tunisia
Israel
Kyrgyzstan
Norway
Slovenia
HungaryM acao-China
Poland
Turkey
Netherlands
Serbia
ItalyLuxembourg
Denmark
Slovak Republic
Korea
France
Switzerland
Germany
300
350
400
450
500
550
600
0102030
Below-average level of student performance in scienceBelow-average impact of socio-economic background
Below-average level of student performance in scienceAbove-average impact of socio-economic background
Above-average level of student performance in scienceAbove-average impact of socio-economic background
Above-average level of student performance in scienceBelow-average impact of socio-economic background
OECD mean

52
4.2 Attendance and exclusions
4.2.1 Attendance
FSM pupils are more likely to be absent from school than non‐FSM pupils, particularly in secondary school. As Figure 3.24 shows, the authorised absence rate for FSM pupils in primary schools was around one third higher than for non‐FSM pupils, whilst the unauthorised absence rate was over three times higher. At secondary school, absence rates rise overall but the same pattern emerges. Similarly, FSM pupils are nearly three times more likely to have persistent absence (as shown in Figure 4‐25). The close relationship between deprivation and school attendance is also illustrated in Figure 4‐26 using IDACI data.
Figure 4‐24 Pupil absence by FSM eligibility (2006/07)
Primary Secondary
FSM 5.96 8.50 Percentage of half days missed ‐ Authorised Absence
Non FSM 4.39 6.00
FSM 1.28 3.39 Percentage of half days missed ‐ Unauthorised Absence
Non FSM 0.37 1.20
Source: SFR05/2008 Pupil Absence in Schools in England, including Pupil Characteristics: 2006/07. Includes primary, secondary and special schools.

53
Figure 4‐25 Persistent absentees by FSM eligibility (2006/07)
Persistent absentees
Percentage of half days missed
% Authorised absence
Unauthorised absence Overall absence
FSM 9.3 21.04 14.04 35.08
Non FSM 3.2 23.44 11.62 35.07
Source: SFR05/2008 Pupil Absence in Schools in England, including Pupil Characteristics: 2006/07 Persistent Absentees are defined as having more than 63 sessions of absence (authorised and unauthorised) during the year, typically over 20% overall absence rate. Includes primary, secondary and special schools.

54
Figure 4‐26: Pupil absence by IDACI decile of pupil residence (2006/07)
Percentage of half days missed
Authorised absence Unauthorised absence
Overall absence Percentage of Persistent Absentees
0 ‐ 10 % most deprived
6.33 1.93 8.26 7.4
10 ‐ 20 % 6.21 1.58 7.79 6.4
20 ‐ 30 % 6.04 1.32 7.36 5.6
30 ‐ 40 % 5.82 1.09 6.91 4.7
40 ‐ 50 % 5.53 0.86 6.39 3.9
50 ‐ 60 % 5.27 0.70 5.96 3.2
60 ‐ 70 % 5.02 0.57 5.59 2.7
70 ‐ 80 % 4.81 0.47 5.28 2.3
80 ‐ 90 % 4.58 0.40 4.98 1.8
90 ‐ 100 % least deprived
4.31 0.33 4.64 1.5
Source: SFR05/2008 Pupil Absence in Schools in England, including Pupil Characteristics: 2006/07. The number of sessions missed due to authorised/unauthorised/overall absence expressed as a percentage of the total number of possible sessions. Number of Persistent Absentees is expressed as a percentage of the total number of enrolments. Includes primary, secondary and special schools.
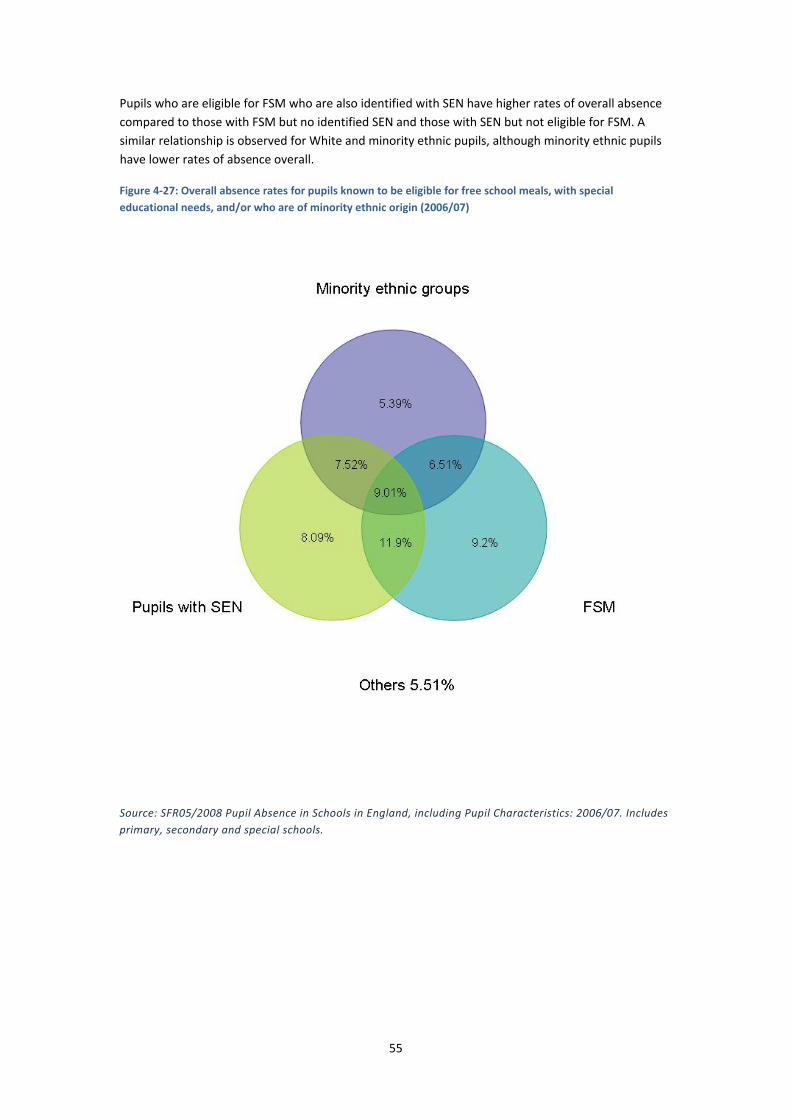
55
Pupils who are eligible for FSM who are also identified with SEN have higher rates of overall absence compared to those with FSM but no identified SEN and those with SEN but not eligible for FSM. A similar relationship is observed for White and minority ethnic pupils, although minority ethnic pupils have lower rates of absence overall.
Figure 4‐27: Overall absence rates for pupils known to be eligible for free school meals, with special educational needs, and/or who are of minority ethnic origin (2006/07)
Source: SFR05/2008 Pupil Absence in Schools in England, including Pupil Characteristics: 2006/07. Includes primary, secondary and special schools.
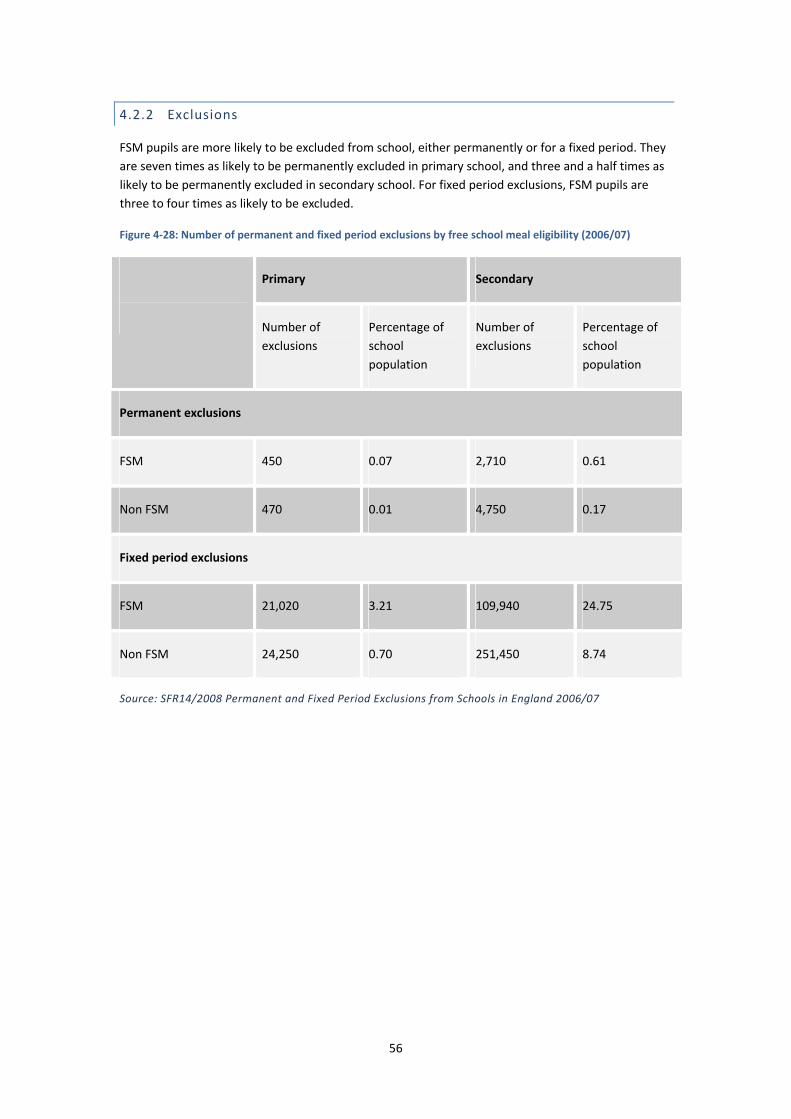
56
4.2.2 Exclusions
FSM pupils are more likely to be excluded from school, either permanently or for a fixed period. They are seven times as likely to be permanently excluded in primary school, and three and a half times as likely to be permanently excluded in secondary school. For fixed period exclusions, FSM pupils are three to four times as likely to be excluded.
Figure 4‐28: Number of permanent and fixed period exclusions by free school meal eligibility (2006/07)
Primary Secondary
Number of exclusions
Percentage of school population
Number of exclusions
Percentage of school population
Permanent exclusions
FSM 450 0.07 2,710 0.61
Non FSM 470 0.01 4,750 0.17
Fixed period exclusions
FSM 21,020 3.21 109,940 24.75
Non FSM 24,250 0.70 251,450 8.74
Source: SFR14/2008 Permanent and Fixed Period Exclusions from Schools in England 2006/07

57
5 Why deprived pupils can fall behind
KEY FINDINGS
• Income and material deprivation are in themselves important influences on educational outcomes, particularly for very deprived families who experience poverty in the long term. Material deprivation can influence educational outcomes in a number of ways, including by reducing the number of educational resources that families can provide for their children, and by adversely affecting the home environment.
• There are also indirect effects. Deprivation is commonly associated with a range of other factors which can influence children’s outcomes. These include: ill health; family stress; low levels of parental education and parental involvement in their children’s education; low levels of cultural and social capital; and low aspirations.
• Children from deprived families are at greater risk of low birthweight, which influences their cognitive and physical development, and are more likely to suffer from ill health.
• Having a low income can have an adverse effect on parents’ well‐being, which in turn affects the quality of their parenting. This "family stress" can lead to problems with children’s educational and emotional development.
• Higher levels of parental education can act as a protective factor against the effects of deprivation, but parents in deprived families are less likely to have educational qualifications. Parents in deprived families are also less likely to be involved in their children's education. Of particular importance is the provision of a stimulating home learning environment, which is found less often in deprived contexts.
• Cultural and social factors are implicated in the association between deprivation and poor educational outcomes. For example, children from lower socioeconomic groups may have different background knowledge, skills and interests which are not reflected in the school curriculum; and are less likely to have the kinds of social connections which offer inspiration and opportunities.
• Low aspirations amongst parents and children from deprived backgrounds also have a negative influence on children’s outcomes.
• Exposure to multiple risk factors is prevalent amongst deprived children. Living in a low income household or a deprived area is associated with a higher chance of experiencing one or more risk factors such as depression, domestic violence, worklessness and overcrowding.
• Literacy is also an important factor. Children from deprived backgrounds are likely to fall behind in literacy at an early age, and this has a knock‐on effect throughout and across their education.

58
5.1 Explaining the association between deprivation and poor outcomes
Chapter 3 demonstrated that the relationship between deprivation and low educational attainment/poor progress is sustained and persistent, regardless of the measure of deprivation or at which age educational attainment is measured. In this chapter, evidence on what lies behind this relationship is examined.
Researchers have used quantitative and qualitative methods to investigate the reasons behind the close association observed between deprivation and poor educational outcomes, and answer questions such as:
• Is it material deprivation itself which directly influences children's learning, and if so to what extent?
• What other factors may be implicated in the patterns of attainment observed above?
For example, Blanden and Gregg (2004) used large‐scale datasets8 to quantify the specific effect of income on educational outcomes, in order to identify the mediating factors which can either protect against or increase the impact of deprivation; whilst qualitative work such as that conducted by Sutton et al. (2007) has explored the lived experience of children from low income families and lower socio‐economic groups, highlighting the barriers to learning they can face.
Although there is strong evidence in some areas, the evidence base is weaker in others, and occasionally contradictory. There is, however, evidence that the following factors are to a greater or lesser extent implicated in the association between deprivation and poor educational outcomes:
• Income and material deprivation.
• Health.
• Family stress.
• Parental education.
• Parental involvement in their children’s education.
• Cultural and social capital, and the experience of schooling.
• Low aspirations.
• Exposure to multiple risk factors.
• Literacy.
Each factor is discussed in turn below.
8 British Cohort Study and British Household Panel Study

59
5.1.1 Income and material deprivation
The direct effect of income and material deprivation on children's opportunities for learning can be important and wide ranging. Hobbs (2003) reported that in most statistical models of the influences on educational achievement, income effects remain statistically significant even when other factors are controlled for, and also cited evidence from longitudinal studies in the US which found that:
• income has a greater effect on cognitive development and educational attainment in early and middle childhood than in adolescence;
• increases in income for families who are below or near the poverty line have a larger impact on cognitive development and educational attainment than increases for more affluent families; and
• the effects of long‐term poverty are much more significant than short‐term poverty.
Blanden and Gregg (2004) confirmed using data from the UK that the relationship between income and educational attainment is a causal one: they calculated that a one third reduction in income from the mean (a reduction of around £140 per week) increases the probability of a child getting no A*‐C grades at GCSE by around 3‐4 percentage points, and reduces the chances of achieving a degree by a similar magnitude.
Feinstein et al. (2004) reported that the specific effect of income on children's attainment is substantial but not linear. "Below a threshold of income the effects of poverty on children's attainments and behaviour are large and long‐term. Above this threshold additional increments to income have less substantial effects although where resources are spent on educational provision for children these continue to have wide‐ranging benefits” (p70).
Income can influence education directly in a number of ways. Families in adverse financial circumstances may struggle to provide their children with appropriate educational resources. For example, a study of the social effects of lack of internet access amongst children (Ofcom, 2007) reported that although parents and children felt there were educational advantages to having internet access at home, the required financial outlay (particularly for those who do not have a computer to begin with) was a significant barrier. Similarly, Clark and Akerman (2006) reported that eligibility for FSM was associated with having fewer books in the home, and less access to newspapers and magazines. FSM pupils were also less likely to have desks of their own, or a computer at home.
Income also acts indirectly to hinder the educational chances of children who experience deprivation, for example by affecting the quality of the home environment and the neighbourhoods which families can afford to live in.
Homes which are overcrowded, cold, and generally in poor condition can affect education through lack of a quiet room for homework, disturbed sleep, and a general negative influence on emotional well‐being (Hobbs, 2003; Kempson, 1996). Overcrowding in particular has been linked with delinquency, psychiatric disorder, and family disorganisation (Rutter and Madge, 1976). Families living in deprivation may fail to provide an adequate diet for their children, who may also miss out on meals due to family pressures (Feinstein and Sorhaindo, 2006): the resulting poor nutrition can make children susceptible to metabolic changes that impact upon cognitive ability and performance of the brain.
Although the direct influence of neighbourhoods on attainment over and above what can be explained by individual, family and school attributes is likely to be small (Gibbons, 2002; Hobbs, 2003),
60
concerns about high poverty neighbourhood characteristics such as crime, peer pressure, safety, lack of facilities and drugs are often highlighted by parents and carers (Kempson, 1996) and there is some evidence from the US that moving away from high poverty neighbourhoods can result in a range of positive outcomes (Hobbs, 2003).
5.1.2 Health
Physical health can affect the educational outcomes of children from a very early age, particularly those in lower socio‐economic groups who are more prone to poor health.
For example, low birth weight is more prevalent amongst children born to families in lower socioeconomic groups (JRF, 2008), and is associated with a greater risk to cognitive and physical development throughout childhood (UNICEF, 2007). Children born underweight also tend to have a lower IQ, affecting their performance in school and their job opportunities as adults (UNICEF, 2008).
A review of statistics on health for children living in poverty by CPAG (2000) reported that:
• Children in manual classes are twice as likely to suffer from chronic sickness than children in non‐manual classes (although the difference appears to be decreasing over time).
• Children living in social housing are more likely to consult their GP, particularly for a serious condition, than those living in owner‐occupied housing.
• Socio‐economic disadvantage is a significant risk factor in the probability of a child developing a mental health problem.
Similarly, Raffo et al. (2007) concluded that children living in poverty are more likely to experience health problems which, together with other disadvantages, can have an important cumulative effect on their educational chances.
5.1.3 Family stress
Deprivation also exerts an indirect effect on children's outcomes via the impact that it has on parenting practices and family stress. For example, Feinstein et al. (2004) describe the process by which low income creates economic hardship for families, which in turn has a negative effect on parents’ well‐being, leading to less warm and supportive parenting (i.e. being less likely to interact with, socialise with and teach their children). This can lead to problems with children’s emotional development, self‐esteem and educational achievement.

61
5.1.4 Parental education
The level of education achieved by parents is strongly associated with their children’s outcomes (Hobbs, 2003).
Feinstein et al. (2004) hypothesised that parental education is transmitted intergenerationally through six pathways:
• by impacting on key distal9 factors such as income and poverty;
• by moderating the effect of each distal factor, i.e. acting protectively and providing resilience in the family;
• by impacting on the characteristics of contexts and hence on proximal processes;
• by supporting individuals and families in managing a set of characteristics and hence moderating the effect of characteristics;
• by impacting on proximal processes such as learning behaviours in the home;
• by moderating the effects of proximal processes, changing the nature of their influence.
Feinstein et al. represented these processes graphically as shown in Figure 5‐1: parental education directly influences (mediates) the factors which impact on child development but also moderates the effect of these factors on each other (Figure 5‐2).
9 Proximal and distal factors: proximal factors are defined as the mediating elements which explain the correlation between distal factors and the outcome. For example, we observe a strong relationship between social class (a distal factor, i.e. at a distance from the outcome) but hypothesise that parenting style (a proximal factor, i.e. closer to the child’s experience) is one of the mechanisms by which social class impacts on child development.

62
Figure 5‐1: Conceptual model for the mediating effects of parental education on child development
Source: Feinstein et al. (2004)
Figure 5‐2: Conceptual model for the moderating influences of parental education
Source: Feinstein et al. (2004)

63
Taking income as an example, the model indicates that parents’ education has a direct effect on family income which in turn impacts on family characteristics and processes. However, parental education also has a moderating effect on the degree to which income will impact on family characteristics and processes: for example, parents with higher levels of education may spend the same income differently to those with lower education “and so be better able to protect children against the effects of poverty or derive greater developmental advantages from high income” (Feinstein et al. 2004;10).
5.1.5 Parental involvement in their children’s education
Desforges and Abouchaar (2003) reported that parental involvement in education is a significant positive influence on children’s educational outcomes, and noted that it takes many forms, including:
• the provision of a secure and stable environment,
• intellectual stimulation,
• parent‐child discussion,
• good models of constructive social and educational values,
• high aspirations relating to personal fulfilment and good citizenship,
• contact with schools to share information,
• participation in school events,
• participation in the work of the school, and
• participation in school governance.
However, they argued that the extent and form parental involvement takes is strongly influenced by socioeconomic background and material deprivation.
Evidence shows that pupils from deprived backgrounds are more likely to have parents and carers who had bad experiences of school themselves (e.g. Harris and Goodall, 2007), who have low levels of education (e.g. Feinstein et al., 2004; Hobcraft, 1998 and 2000), and who have less familiarity and confidence in dealing with the educational system (e.g. Platt, 2005; Gewirtz et al., 1995; Nechyba et al., 1999).
This means that if parents and carers want to help, they may not know how best to go about supporting their children, or may face barriers to becoming more involved; but more significantly, many parents and carers will not see the value of becoming involved in their children's education at all. Harris and Goodall (2007) describe this as a ‘fatalistic’ attitude to the opportunities offered by education, whilst Lupton (2006) similarly notes that their expectations of social mobility through education are small.
Nevertheless, a recent study has shown that parental interest remains high regardless of socioeconomic background. Peters, Seeds et al. (2008) found that regardless of socioeconomic group, the vast majority of parents express positive attitudes about education and hold positive views about the value of education for their children. In addition, most parents want to be more involved in their
64
children’s school life, with the desire to be more involved more strongly apparent among those from lower socioeconomic groups. Similarly, evidence suggests that despite the strong associations observed on average, ineffective parenting and educational practices in the home are not an inevitable consequence of deprivation: “For all children, the quality of the home learning environment is more important for intellectual and social development than parental occupation, education or income. What parents do is more important than who parents are” (Sylva et al., 2004:ii).
5.1.6 Cultural and social capital, and the experience of schooling
"Cultural capital" refers to the capacity for individuals to understand and operate within the dominant culture of society, and in particular to understand and be able to operate within norms of language and behaviour (e.g. Bourdieu, 1986). Similarly, "social capital" refers to social networks, group membership, contacts, and access to support and other resources (e.g. Ball, 2003).
Together, these factors are thought to explain some of the association between low attainment and deprivation. For example, Cohen (2000) argued that children from lower socioeconomic groups have a different repertoire of pre‐literacy and pre‐numeracy skills and attributes for learning, which are less well suited to the classroom than those of children from higher socioeconomic groups. This difference is driven by the tendency for parents from lower socioeconomic groups to have had less formal education themselves. Similarly, Mortimore and Blackstone (1982) reviewed papers which suggested that children from lower socioeconomic groups have different background knowledge, skills and interests that are not reflected in the school curriculum, which is only accessible to those with sufficient "cultural capital"; whilst Dunne and Gazeley (2008:453) commented that "social class constructs parents' relationships with teachers in ways that favour middle‐class parents and pupils".
The Social Exclusion Task Force (SETF) (2008) quoted Putnam’s (1995) categorisation of two main types of social capital: bonding social capital, which is characterised by strong bonds between group members; and bridging social capital, which is characterised by weaker but more cross‐cutting social ties, for example with business associates, friends from different backgrounds, and acquaintances/friends of friends. The SETF report noted deprived communities with high concentrations of low aspirations tend to have high levels of bonding social capital but lower levels of bridging social capital than other areas. This means that young people can "lack access to valuable sources of inspiration, information and opportunity". Furthermore, where young people from deprived communities had relatively high aspirations they often lacked awareness about the steps needed to achieve them, which made them less likely to work towards short‐term goals and seek specific and relevant experiences.
Hirsch (2007) reported evidence that children from deprived backgrounds have different experiences of schooling than their peers. They see schooling as "controlling and coercive", and do not experience cooperative relationships with teachers and other adults. They feel less in control at school than other pupils, through being put under pressure to perform tasks in which they lack confidence. In Reay’s study of working class pupils, “the vast majority […] talked about a sense of educational worthlessness and feelings that they were not really valued and respected within education” (Reay, 2006:297).

65
5.1.7 Low aspirations
Aspirations and expectations vary according to pupils’ socioeconomic backgrounds, with pupils from deprived backgrounds being less likely to hold high aspirations for their futures (Schoon and Parsons, 2002). Although children from deprived and non‐deprived backgrounds are equally likely to believe in the importance of education, those from deprived backgrounds are more likely to feel that they lack the "ability to thrive within the system" (Hirsch, 2007).
Evidence from the Longitudinal Study of Young People in England (Strand, 2007) suggested that both parents’ and pupils' aspirations (specifically, expectations of staying on in full‐time education after 16) explain part of the variation observed in Key Stage 3 results, with high aspirations on the part of both parent and child leading to a 1.2 Key Stage point boost once other pupil characteristics including prior attainment are controlled for.
Additional analysis of Key Stage 4 attainment using the same dataset (Strand, 2008) found that parental and pupil aspirations continued to have an influence, and that the size of the effect varied across ethnic groups. Notably, Strand concluded that a large part of the low attainment of White British pupils from low socioeconomic status families could be explained through the particularly low educational aspirations of these pupils and their parents.
The Social Exclusion Task Force (2008) reported evidence that the strongest factors predicting children's aspirations were:
• the value they attach to school
• belief in their own ability
• prior attainment
• mother's aspirations for their child to go to university
• family socioeconomic status.
5.1.8 Exposure to multiple risk factors
Feinstein and Sabates (2006) used the Millennium Cohort Study to assess the prevalence and co‐occurrence of multiple risks to children in families in England, specifically depression, illness, smoking during pregnancy, alcohol abuse, domestic violence, financial stress, worklessness, teenage parenthood, lack of basic skills, and overcrowding. They found that the odds of co‐occurrence of risks are higher than one in almost all cases, indicating that children living in families with one risk factor are likely to be affected by others. The study also found that living in a low‐income household or in a deprived area was associated with a higher chance of experiencing one or more risk factors.
66
5.1.9 Literacy
It is worth highlighting the particular role of literacy in the development and perpetuation of the deprivation attainment gap. Children from deprived backgrounds typically have poorer literacy skills from an early age (see section 4.1.2), and fewer opportunities to develop their literacy outside of school. For example, research by the National Literacy Trust (Clark and Akerman, 2006) found that FSM pupils were less likely to read outside school; had fewer books at home than their peers; and reported that their parents read at home less and gave them less encouragement to read.
The literacy deficit goes on to affect their later outcomes. As Cohen (2000) notes, good literacy skills are a prerequisite for accessing the school curriculum and much of the poor performance observed amongst children from deprived backgrounds could be said to result from early failure to develop appropriate reading, writing, speaking and listening skills. Data from Cassen and Kingdon (2007) confirmed that poor reading and writing achievement in primary school is strongly associated with low achievement at Key Stage 4, particularly for White British and Black Caribbean pupils.
5.2 Change over time
Have there been any changes over time in the extent to which a child’s background influences their outcomes?
Gregg and Macmillan (2008) analysed longitudinal datasets to determine whether the degree to which family background influences children's attainment and therefore likely future income has changed over time ‐‐ that is, whether social mobility has increased or decreased. They compared the outcomes of cohorts of children born in 1958, 1970 and 1990 and found that social mobility was lower for those born in 1970 than for those born in 1958. However, comparing the 1990 cohort with the 1970 cohort showed that children born in 1990 are, as far as we can predict from their GCSE attainment, likely to experience higher social mobility.
This is tentative evidence that the impact of family background on children's outcomes is declining somewhat, leading to greater social mobility. However, due to the difficulties inherent in measuring social mobility across generations, it is impossible to say for certain whether this trend has continued to the present day.
67
6 The school effect
KEY FINDINGS
• There is strong evidence to suggest schools are independently important for deprived pupils’ outcomes, although effectiveness can vary considerably between schools. Explicit attention therefore needs to be paid to practices within schools and how these can best support the attainment and progress of pupils who experience deprivation.
In the classroom
• The quality of teaching experienced by deprived pupils has been shown to be poorer on average than that experienced by others, despite the fact that high quality teaching is a critical factor in supporting their attainment.
• Pupil grouping practices in schools can impact negatively on deprived pupils, if care is not taken to ensure fair and effective practice.
• Assessment for learning is a teaching approach which has the potential to help narrow the deprivation attainment gap, because it has been shown to help low attainers more than others.
• Pupils from deprived backgrounds typically have less access to a good, broad curriculum and related extension activities, and may find their curriculum irrelevant to their future and/or unchallenging and unengaging. However, extra‐curricular learning programmes can have benefits for pupils from disadvantaged backgrounds who become disaffected with school.
• Pupils from deprived backgrounds may lack the educational resources and parental support to complete homework. Homework clubs run by the school may help to fill this gap.
• Early intervention is required to tackle the inadequate progress in literacy and numeracy commonly observed amongst pupils from deprived backgrounds, although schools may experience challenges in delivering effective intervention.
• Reducing class sizes for reception classes and low ability groups supports low attainers' attainment and progress, and thus has the potential to help narrow the deprivation attainment gap.
School culture
• The creation of a positive school culture is a key factor in the improvement of schools in socio‐economically disadvantaged areas.
• Pupils’ aspirations are predictors of educational attainment, although pupils from deprived backgrounds are less likely to hold high aspirations for their futures. A school ethos which promotes positive aspirations and expectations is important to supporting their achievement and progress.
• Teachers’ attitudes, assumptions and behaviours may be influenced by pupils’ socioeconomic background, and this may disadvantage pupils from deprived backgrounds.

68
• Poor behaviour is more prevalent in schools with higher proportions of deprived pupils, and impacts negatively on learning in the classroom. There is, however, a range of evaluation evidence to show that poor behaviour can be tackled successfully.
• Pupil voice is an important means of engaging learners from deprived backgrounds, and can have a range of positive effects in areas including self esteem, social, personal and emotional confidence, and sense of responsibility, efficacy and skills.
Transitions and decisions
• Deprived pupils are less likely to make successful transitions between Key Stages and schools, and are at risk of falling behind as a result. There are a variety of ways in which schools can improve their practice in relation to transitions.
• Pupils from deprived backgrounds are more likely than others to change school during a school year or Key Stage, and this can have a significant impact on their attainment. There is a need for effective support from schools to help them adjust to the change and make progress.
• Deprived pupils are less likely to make informed decisions about subject choices and qualification routes. However, the school can be a very important source of advice for these pupils, through effective careers education and guidance.
School size and resources
• Evidence on school size is mixed, and there may be advantages and disadvantages for deprived pupils of both large and small schools. There is no evidence that any disadvantages are an inevitable consequence of the size of the school.
• Increased resources can have a specific effect on outcomes for pupils eligible for FSM, but the effects are relatively small and not universal across subjects or Key Stages. In particular, the impact of resources appears strongest for younger pupils. Careful targeting of additional funding seems to be an important factor in maximising the impact on outcomes.
Leadership, workforce and governance
• Evidence shows that school leadership is highly significant for pupil outcomes in deprived contexts. The most successful school leaders in challenging circumstances have certain qualities in common which enable them to constantly strive for improvement, such as being open‐minded, ready to learn from others, flexible, resilient and optimistic. They place educational concerns over management concerns despite facing ongoing tensions and problems relating to their school's circumstances.
• Schools with higher proportions of FSM pupils typically experience greater staff turnover, and have lower proportion of teachers with relevant post A‐Level qualifications.
• Members of the wider workforce (including those who work directly with pupils to support their learning, those who focus on their welfare, and those who manage school systems) have been shown to be an important element of school support for deprived pupils, where used effectively.

69
• Evidence suggests that school governance is an important influence on attainment, but that schools in deprived areas may struggle to recruit governors who are representative of the local area and who have the skills required to fulfil their duties.
Parents and carers
• Parents and carers from deprived backgrounds are typically less involved in their children's education and are considered "harder to reach" by schools. However, where schools make an effort to engage with these parents, it has a positive impact on children's behaviour and learning.
• Strong evidence on how schools can best do this is limited, but there are indications from research that important factors include strategic planning which embeds parental involvement into whole school development planning; sustained support, resourcing and training; community involvement at all levels of management; and acknowledgement of, respect for and sensitivity towards the needs of families from different backgrounds.
Multi‐agency working
• Holistic, coherent interventions and support systems which involve multiple agencies are needed to support the multiple needs of children and families living with deprivation.
• Key success factors include: sensitivity to local communities and flexibility in responding to changing priorities; a single multiagency action plan, and joined up approaches to workforce development and training; a named lead professional or key worker allocated to each client, who is responsible for coordinating a package of support across agencies; joint assessments of need, mapping of service provision and gaps, and joint target setting; effective systems for datasharing; joint commissioning of services; and streamlined referral processes.
National initiatives
• Large‐scale initiatives to improve the outcomes of pupils from deprived backgrounds which have been recently evaluated include Excellence in Cities, London Challenge and extended schools.
• There is some evidence that Excellence in Cities had a positive impact on outcomes for deprived pupils, but it is hard to identify clear, direct effects of such a diverse programme amongst other factors which can influence outcomes.
• Similarly, London Challenge has been associated with significant improvements in London schools, although a direct link is hard to establish. Ofsted concluded that the London Challenge model was effective. (London Challenge has now been superceded by City Challenge, which operates in London, Manchester and the Black County. There is as yet no evidence available on the effectiveness of City Challenge.)
• There is good evidence of how extended schools can make a difference at the individual level, particularly for the most challenging pupils, and also that becoming an extended school is compatible with maintaining standards of attainment. However, it is once again hard to identify a clear extended schools effect on attainment at school or national level.

70
6.1 The difference schools can make
Evidence suggests that the family characteristics and home environment of children who experience deprivation have a strong and persistent effect on their life chances, through the influence these factors exert on children's opportunities for learning (Chapter 5).
There are many interventions and initiatives which aim to target directly families to help improve the chances of children from deprived backgrounds, by tackling the causes and symptoms of deprivation. There has also been large‐scale investment in early years education to help boost the quality, availability and take‐up of pre‐school places amongst families from deprived areas. However, despite the critical importance of programmes such as these to target the roots of the problem and to intervene early when children begin to fall behind, many children from deprived backgrounds still begin compulsory schooling having demonstrated unsatisfactory attainment in the Foundation Stage (section 4.1.2), and rarely make up ground as time goes on (section 4.1.5). There are also eleven cohorts of compulsory school age children from Key Stage 1 to Key Stage 4 currently in the system who will not benefit from current or future investment and innovation in the early years. It is therefore important to look at the role that schools can play in helping to improve outcomes for children from deprived backgrounds.
In their discussion of the intergenerational transmission of educational success, Feinstein et al. (2004) investigated the role of the school and concluded that there is strong and robust evidence to suggest schools are independently important for children’s outcomes. There is also evidence to suggest that the effect differs across schools, with some being more effective than others, or effective in different ways. Indeed research has shown that the size of the outcome differences between schools identified as statistically more or less effective is ‘not trivial and can be striking’ (Sammons et al., 1995, p6).
Mortimore et al. (1988) examined pupil progress in inner London primary schools and found that the school attended made a significant contribution to explaining the difference between pupils’ attainment and progress over three years in reading, writing, mathematics, attitudes, self‐concept and behaviour.
Similarly, Sammons et al. (1997, cited in Sammons, 2006) found that difference between the most and least effective secondary schools in London was around 10 GCSE points (equivalent to 5 grade Bs rather than 5 grade Ds). The authors argued that the difference in effectiveness had significant implications for pupils’ future education and employment opportunities.
Overall, this indicates that what schools do is important, and that if all schools could achieve the same success for pupils from deprived backgrounds as the best schools, we might expect to see significant change.

71
6.2 In the classroom
This section reviews evidence on classroom‐level factors which have been shown to be relevant to the outcomes of deprived pupils.
6.2.1 Teaching quality
Teaching quality is a critical factor in supporting pupil outcomes. In a study of practices in primary schools, for example, Sammons et al. (2008) reported that the influence of overall teaching quality on reading and mathematics was stronger than the net influence of some background factors, including being eligible for FSM. Muijs et al. (2004) argued that a strong focus on teaching and learning is a key characteristic of successful schools in socio‐economically disadvantaged areas.
Overall, there is no evidence to suggest that effective pedagogy for pupils from deprived backgrounds is qualitatively different to effective pedagogy for other pupils. There is, however, evidence to suggest that pupils from deprived backgrounds may be less likely to experience good quality teaching. Sammons et al. (2006), in an analysis of teaching practice in 125 Year 5 classes, found that the quality of teaching tended to be poorer in schools with higher levels of pupils eligible for FSM. Differences were apparent in areas such as basic skills development, depth of subject knowledge, social support for learning, pupil engagement, and classroom routines. Cabinet Office (2008) cited evidence that teachers in schools with more than 20% FSM eligibility were more likely to be rated worse in their teaching, and less likely to have come from an outstanding teacher training institution. Furthermore, Thrupp and Lupton (2006) reported that unchallenging work was evident amongst schools with deprived intakes.
Even in schools with a broader social mix, pupils from deprived backgrounds may be less likely than their peers to experience good quality teaching. For example, as described below, grouping practices may exclude pupils from deprived backgrounds from the best teaching even in schools which are otherwise successful.
6.2.2 Pupil grouping
Because of the greater likelihood of low attainment amongst pupils from deprived backgrounds, grouping pupils by ability inevitably results in overrepresentation of these pupils in the bottom groups. However, it is not just attainment which influences group allocation. For example, Sukhnandan and Lee (1998) found evidence that allocation of pupils to different ability groups is often done on an inconsistent and subjective basis, with little provision for moving pupils between groups, whilst Boaler (1997) found that pupil background influenced group allocation even when prior attainment was controlled for, with pupils from lower socioeconomic groups more likely to be allocated to low groups than pupils with a similar level of attainment but from higher socioeconomic groups.
Although grouping is often assumed to be an effective way of providing pupils with an appropriately tailored learning experience, research has shown (Hobbs, 2003) that the quality of teaching and learning in the bottom groups is often poor, resulting in low achievement, low expectations and low motivation for pupils in those groups (Ireson and Hallam, 2001; Boaler, 1997). Pupils from deprived backgrounds have been found to express negative opinions about ability grouping: Hallam and Ireson (2006 and 2007) surveyed 5000 Year 9 pupils in 45 schools (with either ability grouping or mixed ability, or both) and found that FSM pupils preferred mixed ability teaching.

72
Wood and Caulier‐Grice (2006) reported that if disadvantaged pupils are to benefit from ability grouping, then it is important that:
• they are taught primarily in a mixed‐ability class, but are grouped by ability for subjects where there is a clear benefit to reducing the spread of attainment (e.g. literacy and numeracy); this helps to reduce the social stigma attached to being in a low ability group;
• decisions about ability grouping are based on the specific skill being taught, not on general ability or intelligence, or ability grouping will not succeed in reducing variation within groups;
• movement between ability groups is commonplace; and
• lower ability groups are not underestimated.
Dunne et al. (2007) investigated the ways in which schools and teachers can maximise the advantages and minimise the disadvantages of ability grouping. Three main successful approaches were identified:
• Concentration of resources. Lower attainment groups were smaller, allowing greater personal learning support and attention. Teachers of lower ability groups were well qualified and experienced, and were supported by teaching assistants, learning mentors and sometimes more senior pupils.
• Customisation to specific learning needs. Curriculum materials were drawn from multiple sources and customised to meet the learning needs of low attaining pupils. Materials incorporated a range of cognitive demands to allow pupils to select the level of challenge. Test level entry decisions were delayed to reduce demotivation and vocational pathways, including college attendance and work placements, were provided.
• Creation of a positive learning environment. Teachers constructed a positive environment in which pupils took more responsibility for their own learning and could make mistakes without any ridicule or disruption by peers. The school ethos promoted mutual respect and value for the contribution of all pupils irrespective of attainment group. A more relaxed disciplinary regime in class was offered, with an emphasis on participation and teamwork. Praise and positive affirmation were used to encourage and motivate active pupil participation and engagement in learning. Pupils’ views were solicited and used to provide a more conducive and comfortable environment. The support of parent/carers, the community and local businesses were important contributors to a positive and motivating learning environment.
73
6.2.3 Assessment for learning
Black and Wiliam’s (1998) review of the evidence on formative assessment (or assessment for learning) concluded that it helps low attaining pupils more than others, thus reducing the spread of attainment whilst also raising attainment overall. Because low attainment is so prevalent amongst pupils from deprived backgrounds, formative assessment may therefore help to reduce the gap in attainment.
Formative assessment is defined by Black and Wiliam as the use of evidence from assessment to adapt teaching to meet the needs of the learners. Assessment may be carried out by teachers or by pupils themselves. The authors concluded that effective formative assessment involves the following:
• Feedback that focuses on the particular qualities of a pupil’s work, with advice on what they can do to improve, and that avoids comparisons with other pupils.
• Training of pupils in self‐assessment techniques, so that they can understand the main purposes of their learning and thereby understand what they need to do to progress.
• Opportunities for pupils to express their understanding built in to every aspect of teaching.
• Dialogue between pupils and teachers that is thoughtful, reflective, focused to evoke and explore understanding, and conducted so that all pupils have a chance to think and to express their ideas.
• Tests and exercises that are clear and relevant to learning aims.

74
6.2.4 Curriculum
A broad and appropriately challenging curriculum is a key element in promoting and sustaining educational achievement (Ellis et al., 1996). However, studies of pupils' attitudes cite the curriculum as a major cause of disaffection, disengagement and truancy (Smith et al., 2005), suggesting that there are significant problems in this area.
As with high quality teaching, pupils from deprived backgrounds may have less access to a good, broad curriculum. For example, Whitby et al. (2008) reported that primary schools with high proportions of pupils eligible for FSM were less likely to offer opportunities to learning foreign language at Key Stage 2. Similarly, in a survey of “education outside the classroom”10 in England, O’Donnell et al. (2006) reported that pupils in secondary schools with higher levels of deprivation were less likely to be offered opportunities for educational trips and other kinds of learning away from the traditional classroom environment; whilst in a survey of parents on the costs of schooling, Peters, Carpenter et al. (2009) reported that some pupils did not go on school trips because their parents could not afford to pay. This means that pupils from deprived backgrounds may miss out on valuable and inspiring experiences which add breadth and variety to the curriculum. For instance, Ofsted (2008a) reported that good quality education outside the classroom led to improved outcomes, including better achievement, standards, motivation, personal development and behaviour. Ofsted also found that schools often relied heavily on parental contributions to fund day and residential trips, which could be problematic for low income families and schools in deprived areas.
It has been argued too that the curriculum can lack relevance to those from deprived backgrounds (White, 2008), although a large review of evidence by Lord and Jones (2006) found that the evidence base is currently limited on how perceptions of the curriculum vary by pupils’ socioeconomic circumstances, so it is hard to draw firm conclusions. There are, however, some indications from research on lower ability pupils, who are disproportionately eligible for FSM as a group. Lord and Jones found that lower ability pupils:
• tend to question the vocational relevance of the curriculum and their preparedness for employment;
• tend to have lower levels of engagement and enjoyment of the curriculum;
• may perceive the curriculum they experience as not challenging enough; and
• are at risk of demotivation if they are entered for lower examination tiers where C grades and above are unachievable.
An example of a policy that already attempts to provide an alternative provision to those who are seriously disengaged and at risk of exclusion is the Key Stage 4 Engagement Programme, which provides vocational based learning for disengaged pupils. Although the scheme is not targeted solely at pupils from deprived backgrounds, as explained before, in practice there is likely to be a large overlap. An interim report (Cowen and Burgess, 2007) on the initial take up shows broadly positive
10 That is, structured learning experiences that take place outside a classroom environment, such as cultural trips, science and geography fieldwork, environmental and countryside education, outdoor and adventurous group activities, learning through outdoor play, and visits to museums and heritage sites.

75
impacts, but the results of a forthcoming more comprehensive evaluation should be able to provide a more detailed evidence base here.
A recent major study of international primary level curricula (Ruddock and Sainsbury, 2008) compared the curricula of several high performing countries, where high performance was defined in part by the presence of narrower gaps between those who do well and those who do less well, including gaps observed between pupils from different socioeconomic backgrounds. The researchers attempted to identify any structural elements of curricula that leant themselves to being appropriate to a wide range of ability, but overall did not find any evidence that the curriculum itself (in terms of content, breadth, depth, structure, ordering, etc) could explain a lack of engagement for those from deprived backgrounds on its own.
Kendall et al. (2008) reported evidence that extra‐curricular learning programmes can have benefits for pupils from disadvantaged backgrounds who become disaffected with school. Key features of effective extra‐curricular learning programmes included:
• small groups with individual attention;
• programme content which is flexible and which reflects pupils' interests and needs;
• activities which feel distinct from classroom‐based, compulsory learning and which are structured and run in a different way; and
• staff who are skilled at communicating and negotiating.
6.2.5 Homework and study support
Although evidence is mixed on the educational benefits of homework, there is a consensus that well‐planned, good quality homework is an important contribution to pupils’ education, both in terms of extending the amount of curriculum time, and developing independent study skills (e.g. Sharp et al., 2001; Hallam, 2004; Ofsted, 1995).
Pupils from deprived backgrounds may, however, find it harder than their peers to complete their homework due to lack of educational resources in the home (as discussed previously) and/or lack of an environment conducive to work (i.e. one that is quiet and has appropriate equipment, such as a desk) (ODPM, 2004). This may be caused by material deprivation (resulting in families being unable to afford educational resources or living in overcrowded conditions).
Even where basic conditions for completing homework are met, pupils from deprived backgrounds may be disadvantaged compared to their peers due to lower levels of parental involvement and interest in their education. For example, Hallam (2004) reported that parental expectations, support and monitoring of homework are extremely important in determining time spent on homework. However, it is important to remember that there is significant variation within the group of families who experience deprivation, and that as well as some very negative attitudes there are also some very positive attitudes. For example, parents from lower socioeconomic backgrounds and parents who left full‐time education at an earlier age are, on average, more likely to think that it is extremely important to help their child with homework (Peters, Seeds et al., 2008) and for their child to attend a supplementary homework club. However, these groups are also less likely to feel confident about helping with homework, citing reasons including changes in teaching methods (39%), not understanding the work (38%), not having been taught the subject themselves at school (10%) and

76
having difficulty with numeracy (6%)11. Similarly, Sharp et al. (2001) reported that even where parents would like to help their children, they are not always sure how best to do this, and may be reluctant to approach the school for advice. In these cases, the obstacle is not motivation but confidence and ability.
The challenges faced by some pupils from deprived backgrounds have implications for schools and teachers when setting homework and planning support activities, such as homework clubs and other forms of study support.
For example:
• Homework clubs are an important means of supporting pupils from deprived backgrounds. Evidence from MacBeath (1993) and Train et al. (2000) on the value of homework centres at school or in public libraries suggests that they have a range of benefits, including access to a social environment conducive to learning, and access to learning resources which might not be available at home. Participating pupils felt that the centres had made homework more enjoyable, and had given them a better chance of passing their exams. Wood and Caulier‐Grice (2006) report that extra‐curricular support is particularly beneficial to deprived pupils.
• As evidence from Sharp et al. (2001) suggests, it may be advisable for schools to give guidance to parents on how best to support their children when they have homework to complete, and to encourage and support parental engagement in education (section 6.7).
• When it comes to setting individual homework activities, teachers should bear in mind that not all pupils have access to the same resources (section 5.1.1), and should ensure that there are sufficient school‐based resources (such as relevant books, or computers with internet access) to enable all pupils to complete the homework on time.
11 These figures refer to all parents who were not confident helping with homework, not specifically those who were also from lower social grades or who left full‐time education at an earlier age, although there is likely to be significant overlap.

77
6.2.6 Intervention for pupils who fall behind
Low levels of literacy and numeracy skills are a significant problem in themselves. They can also prevent pupils from succeeding in, or even accessing, other areas of the curriculum, and have a knock on effect throughout a child’s schooling: low attainers at one Key Stage are very unlikely to catch up by the next. Even good quality teaching approaches and a broad curriculum (‘Wave 1’12) described above are rarely sufficient to enable low attainers at any Key Stage to catch up with their peers (Brooks, 2002): catch‐up interventions (‘Wave 2’) are required.
As the statistics presented in Chapter 4 make clear, pupils from deprived backgrounds are disproportionately at risk of falling behind age‐related expectations for their attainment at each Key Stage. Additional support in the form of catch‐up interventions should therefore be a critical component of measures to reduce attainment gap between pupils from deprived and non‐deprived backgrounds, and the effectiveness of such intervention is well evidenced. For example, the evaluation of the Primary National Strategy’s Further Literacy Support programme (Beard et al., 2005), which targets Year 5 pupils who have fallen behind in English, found that 84% of pupils who took part achieved Level 4 by the end of Key Stage 2 against expectations; whilst Brooks (2002) concluded that despite their expense, large‐scale intervention programmes to target low attainment can offer value for money in the long term.
The benefits of targeting low attainment can also be seen more widely, as demonstrated by Burroughs‐Lange (2006) who found that the benefits of the Reading Recovery literacy intervention programme included improved oral communication, ability to follow directions, work habits, social interaction with adults and peers, and self confidence.
Reviews of evidence on effective teaching approaches for low attainers in literacy (Brooks, 2002) and numeracy (Dowker, 2004) have consistently advocated certain key elements of good practice in intervention for low attainers, including:
• Early intervention to help pupils to catch up before they have fallen too far behind, with consequent benefits for their ability to access the primary curriculum, and in the prevention of early disengagement from learning. In mathematics, early intervention also helps to reduce the likelihood of pupils developing anxiety about the subject, which can be distressing in itself, and inhibit further progress.
• One to one and/or small group support to provide plenty of direct instruction by the teacher or other suitably trained adult.
12 The Primary National Strategy (PNS) suggests a model of intervention at different levels of need, based on three 'waves':
Wave 1: The effective inclusion of all pupils in a high quality primary experience incorporating the literacy hour and a daily mathematics lesson.
Wave 2: Small group intervention for pupils who can be expected to catch up with their peers as a result of the intervention.
Wave 3: Specific targeted approaches for pupils identified as requiring SEN intervention.
78
• Personalisation of the intervention based on individualised diagnosis of learning needs.
Although there is a strong evidence base on the effectiveness of interventions for pupils who have fallen behind, the implementation of interventions in practice may pose more of a challenge than the actual development or choice of intervention in the first place. For example, Ofsted (2005a) evaluated the impact of the Primary National Strategy (PNS) in 2004/2005 and found that the three waves of PNS intervention to support low attaining pupils frequently did not lead to sustained success in the long term, and that schools did not manage the interventions well. Similarly, evaluations of the Key Stage 3 Strategy and Secondary National Strategy (Ofsted, 2004; Ofsted, 2005b) found that the organisation and teaching of catch‐up programmes was a recurrent concern, and led to less than half of pupils who needed catch‐up interventions in mathematics progressing to the expected Level 4 during Year 7.
Key challenges to the successful delivery of interventions in a school context include:
• Integration of the intervention with ordinary classroom teaching. Ofsted (2004) reported that there was a lack of integration of literacy interventions with classroom teaching in English and other subjects, which meant that the skills pupils learned were not built upon outside of the intervention, and they struggled to apply what they had learned.
• Timetabling, staffing and accommodation. These can prove practical obstacles to delivering interventions effectively, and there may be knock‐on effects across the curriculum. For example, Ofsted (2004) reported that difficulties can arise when the length of the intervention session does not match that of subject lessons and pupils consequently miss important parts of the subject lessons to which they return.
• Sustaining commitment to the intervention. Feedback from the pilot phase of the Every Child Counts programme found that despite guidance to schools to prioritise the daily intervention, there was variation between schools in terms of how strictly the guidance was adhered to, resulting in some pupils missing intervention sessions.
• Funding. Providing intensive one‐to‐one support by qualified teachers over a period of weeks or months requires a significant injection of resources.
In December 2008, DCSF announced that one‐to‐one tuition for pupils aged 7 to 14 who are falling behind would be rolled out nationally from September 2009.
79
6.2.7 Class size
The effect of class size on attainment has long been contested, and does not provide clear UK‐based evidence on any particular association between class size and outcomes for deprived pupils, although Wilson (2001) reported that US research appears to show a positive effect of smaller class sizes for pupils from disadvantaged groups.
Quantitative evidence from the UK on the impact of class size during reception and Key Stage 1 is provided by Blatchford et al. (2002), who found very little correlation between class size and pupils' outcomes. In the reception year only, whilst all pupils benefited from decreases in class size to about 25 pupils, a decrease to 15 pupils this only benefited lower attainers, who demonstrated large gains in literacy progress.
Since deprivation is associated with low attainment, it can be hypothesised from this evidence that a reduction in class size in reception from 25 to 15 would have positive benefits for pupils from deprived backgrounds in terms of their early literacy outcomes, which are a strong predictor of future academic and social outcomes (Snow et al., 1998; Werner et al., 1992).
Blatchford et al. (2004) investigated the impact of class size in Year 4, 5 and 6 and found no relationship with pupil outcomes other than a positive relationship between increasing class size and progress in literacy for pupils in Year 6. No variation by prior attainment or deprivation indicators was observed. However, class size was found to influence classroom processes. Pupils in smaller classes were more likely to be the focus of the teacher's attention, and to interact in an active rather than a passive way with teachers.
Evidence on the impact of class size in secondary schools is much more limited. Wilson (2001) reviewed evidence which showed that teachers, headteachers and parents believe smaller classes are more effective, but there is no robust empirical work to support or contradict this claim.
Two studies on estimating the relationship between school resources and pupil attainment (Jenkins, et al., 2007; Levačić et al., 2006) found that a lower pupil: teacher ratio was associated with higher attainment in mathematics and science at Key Stage 3, and with higher attainment in science and on the capped GCSE point score at GCSE. However, the measure used in these studies was expenditure per pupil on teachers in general, not number of pupils per class. Increased per‐pupil expenditure on teachers could be used to decrease class sizes or to give teachers more non‐contact time or more training (etc). The studies did not investigate which approach was more common or more effective.
Although teachers commonly believe that class size is a factor in their teaching and that smaller classes enable them to get to know their pupils and tailor their teaching to the individual (Wilson, 2001), it has not been established whether class size in secondary schools does have a significant effect on the prevalence of effective within‐class practices. Indeed, Wilson’s review suggests that when class sizes are reduced, teachers do not necessarily change their practice; and that more and better training might negate any effect of class size. Nevertheless, Dunne et al. (2007) recommended that the size of low ability groups (which contain disproportionate numbers of pupils from deprived backgrounds) should be minimised in order to enable teachers to focus on meeting the needs of individual learners.
80
6.3 School culture
This section highlights evidence on aspects of school culture of relevance to the education of pupils from deprived backgrounds.
6.3.1 Positive school culture
Muijs et al. (2004) argued that the creation of a positive school culture is a key factor in the improvement of schools in socio‐economically disadvantaged areas. This includes:
• developing a blame‐free culture;
• continuity in approach;
• setting high expectations;
• developing coherence and open communication; and
• enhancing teachers' belief in the effectiveness of proposed interventions.
Kendall et al. (2008) reviewed evidence which suggested that a school culture which enables pupils to build good relationships with adults is an important element in supporting vulnerable groups. This could be both in school (for example through pastoral systems) or out of school (for example through contact with youth workers).
6.3.2 Attitudes, aspirations and expectations
Evidence highlights the importance of a school ethos which promotes positive aspirations and expectations. For example, the Social Exclusion Task Force (2008) demonstrated that school characteristics are significant mediating factor in the relationship between deprivation and aspiration, which indicates that the school plays an important role in maintaining and raising pupils’ aspirations.
How schools can best encourage the development of these attributes in their pupils is, however, currently not well evidenced. Gutman and Akerman (2008) reviewed evidence which suggested that the following factors influence pupils’ aspirations:
• A strong sense of self‐efficacy: that is, pupils who believe that they can make a difference to their lives, even when faced by adversities, have higher aspirations for their future.
• High academic self‐concept: pupils who believe they can achieve academically have higher aspirations.
• Attributions for success and failure: pupils who attribute success to effort, and failure to lack of effort, have higher aspirations.
The authors suggest that accessible, high quality information, advice and guidance services are likely to be important, as well as good extra curricular activities to broaden pupils’ horizons.
Key processes and relationships in schools have been identified by Ofsted as crucial in countering disadvantage through forming and reinforcing pupils’ attitudes to, and success in, learning. Inspections underline the importance of three factors in particular (Ofsted, 2007):
81
• an overall ethos that expects and promotes high standards and insists on good behaviour;
• effective management of lessons that draws on accurate assessment of learning, sets clear objectives, engages pupils and uses a variety of activities at a good pace to achieve challenging targets; and
• the capacity of staff to engage with, and respond to, pupils and parents in order to meet pupils’ needs.
Evidence indicates that a whole school approach which addresses teachers' attitudes and expectations as well as pupils' is advised. Teachers’ expectations for their pupils have been found to be positively associated with the effort pupils put into their learning (Smith et al., 2005), but teachers’ behaviours and expectations may be biased by pupils’ backgrounds, thus helping to reinforce social inequities. For example, Dunne and Gazeley (2008), in a small‐scale qualitative study, reported that teachers' judgements about the educational and occupational futures of underachieving pupils were influenced by implicit assumptions about social class. When asked about their strategies for addressing underachievement, the teachers in the study were more likely to classify working‐class underachievement as a result of home background, but middle‐class underachievement as the failure of the school, and were thus less likely to focus on ways in which their classroom practice could affect the outcomes of working‐class pupils. Working‐class pupils, in contrast, felt strongly that what the teachers did was critical to their achievement, and saw what happened in classrooms as central to their achievement. Similarly, Feinstein et al. (2004) reviewed evidence which suggests that teachers’ behaviours can be influenced by their attitudes and assumptions about pupils’ socioeconomic backgrounds, although Hobbs (2003) judged that available evidence in this area is mixed and offers no clear conclusions.
6.3.3 Behaviour
Analysis of data from Ofsted inspections of primary and secondary schools from September 2005 until July 200613 showed a correlation between standards of behaviour observed in inspected schools, and standards of attainment: where behaviour was good, attainment also tended to be good. Schools serving greater proportions of pupils from deprived backgrounds tend to have pupils with poorer behaviour (Sammons et al., 2006). However, identifying the nature of the links between behaviour, attainment and deprivation is not straightforward.
Despite problems in defining and measuring ‘behaviour’, research suggests that negative classroom behaviours do have an impact on pupils’ learning. For example:
• Disruption is a prevalent problem in both primary and secondary schools with two thirds of younger and six out of ten older pupils saying that it interferes with their school work (DfES 2003).
• Eighty‐six percent of over 7,000 15 year olds surveyed in England and Northern Ireland in 2000 reported their learning was hindered to some extent by the disruption of classes by other pupils, whilst 28% suggested that noise and disruption occur in most or all of their lessons (OECD 2000).
13 Inspection data available online at http://www.ofsted.gov.uk/Ofsted‐home/Publications‐and‐research/Browse‐all‐by/Annual‐Report/2006‐07/Inspection‐judgements‐2006‐07

82
• Low‐level bad behaviour wastes teachers’ time, hinders teaching and learning, disrupts lessons and slows the learning process (Scottish Executive, 2006).
The following programmes designed to improve behaviour have recently been evaluated and have demonstrated some positive effects.
BEHAVIOUR AND EDUCATION SUPPORT TEAMS
Behaviour and Education Support Teams (BESTs) are multi‐agency teams, which bring together a range of professionals, working to support schools, families and children (aged 5 to 18) who present or are at risk of developing emotional, behavioural and/or attendance problems. Teams include professionals from the fields of education, social care, health and other. The focus of BEST work is identification, prevention and early intervention, to promote emotional well‐being, positive behaviour and school attendance.
An evaluation (Halsey et al., 2006) collected perception data and self‐evaluation data from BESTs. There was indicative evidence that BESTs had a positive impact on pupils’ attainment, attendance, behaviour and well‐being. Respondents felt that impact on attainment was only possible once attendance and behaviour had been improved, which in turn required intervention to improve child and family well‐being.
There was also indicative evidence that the initiative had improved parenting skills, parents' access to services, and links between the home and school, particularly where this relationship had broken down.
BEHAVIOUR IMPROVEMENT PROGRAMME
The then Department for Education and Skills (DfES) funded 34 local authorities to support measures to improve pupil behaviour and attendance in selected secondary schools and their feeder primary schools. The objectives of the Behaviour Improvement Programme (BIP) were:
• to improve standards of behaviour overall;
• to reduce unauthorised absence;
• to secure lower levels of exclusions than in comparable schools;
• to ensure that there is a key named worker for every child at risk of truancy, exclusion or criminal behaviour; and
• to build on the achievement of full‐time education for all permanently excluded pupils.
There was indicative evidence (Hallam et al., 2006) that the programme had improved behaviour, with respondents reporting perceived positive changes in: the status of behaviour and pastoral issues in school; school policies and practices; school ethos; the way that schools could support families; pupils’ behaviour, well being and learning; relationships with parents; staff stress; and a reduction in time managing poor behaviour. Statistically significant reductions in absence and exclusions were observed, but no impact on attainment was identified (although the researchers noted that such impact may take time to be felt).

83
PRIMARY BEHAVIOUR AND ATTENDANCE STRATEGY
The Primary Behaviour and Attendance Strategy pilot took place from 2003‐05 and involved 25 Local Authorities. The LAs selected to participate in the programme had above‐average levels of social deprivation.
The programme include a whole school approach to improving behaviour in schools where this was the major school improvement issue. The evaluation (Hallam et al., 2008) found a perceived positive impact on pupils’ behaviour, the working climate in the school, and pupils’ well‐being, confidence, communication skills, social skills and control of emotions. Some impact was reported on learning and home‐school relationships. Respondents felt that the key elements which supported the success of the programme included: the commitment of the senior management team; a whole school approach with the participation of all teachers; and sufficient time being available for trust to develop and feedback to be given.
SOCIAL AND EMOTIONAL ASPECTS OF LEARNING
The Primary Behaviour and Attendance Strategy also implemented Social and Emotional Aspects of Learning (SEAL)14 in pilot schools, and this was perceived to have had a positive impact on teachers including enhanced confidence in their interactions with pupils, and a more thoughtful approach to behaviour incidents; and also a positive impact on pupils’ behaviour and well‐being, including, classrooms and playgrounds, and improved confidence, social, communication, negotiating skills, attitudes, listening skills and concentration.
Evaluation of the small group work element of SEAL (Wave 2) (Humphrey et al., 2008) found small but statistically significant impact of the programme on pupils’ social and emotional outcomes, and the impact was maintained seven weeks after the intervention.
14 Around 80% of primary schools are currently engaged to some extent with Social and Emotional Aspects of Learning (SEAL) activities (Humphrey et al., 2008). The SEAL programme is grounded in theories of the importance of emotional intelligence to many aspects of a child’s development and experience (e.g. Goleman, 1996). SEAL is a whole‐curricular approach to developing children’s social and emotional skills, intended to engender positive behaviour, and to enhance learning and attendance. It is embedded in the curriculum of participating schools. SEAL is delivered in three ‘waves of intervention’. Wave 1 centres on whole‐school development work designed to create the ethos and climate within which social and emotional skills can be most effectively promoted. Wave 2 involves small group interventions for children who are thought to require additional support to develop their social and emotional skills. Wave 3 involves 1:1 intervention with children who have not benefited from the whole school and small group provision in a given school.
84
6.3.4 Pupil voice
In their review of theory, policy and practice on education and poverty, Raffo et al. (2007) highlighted the importance of participatory or emancipatory approaches within education, i.e. those which enable learners and their communities to play a more active role in shaping education. Pupil voice is one such approach.
Evidence suggests that pupil voice is an important means of engaging learners from deprived backgrounds, and that it can have a range of positive effects. Hudson (2007), in a review of research on pupil voice, noted that it can be defined in many ways, ranging from pupil representation on a school council to active involvement in decision making. Halsey et al. (2007) reported that when used effectively pupil voice approaches in schools can have positive impacts including improvements in:
• confidence and self esteem;
• social, personal and emotional confidence;
• sense of responsibility, efficacy and skills;
• new knowledge and skills;
• communication and collaborative skills;
• civic and political competence;
• attendance;
• achievement; and
• behaviour.
Similarly, Davies et al. (2006) reviewed evidence which suggested that:
• pupils in democratic schools were happier and felt more in control of their learning; and
• if pupils gave feedback on teaching, this improved teachers' practice and improved pupils' awareness of the learning process.
However, Hudson (2007) concluded that a key challenge is to ensure equality, so that all voices are heard, not just the voices of school council members or those who are comfortable expressing their views.
85
6.4 Transitions and decisions
This section highlights evidence on how pupils from deprived backgrounds experience key transition and decision points as they progress through their education, and how they can best be supported.
6.4.1 Transitions between Key Stages
Transitions between Key Stages and transfer between schools have been highlighted by researchers as key moments at which pupils may experience difficulties, both socially and academically; and there is also evidence that pupils from deprived backgrounds experience a more significant impact on their progress and motivation at the transition and transfer than their peers (Galton et al., 1999; Galton et al., 2003).
Evidence suggests that most pupils experience successful transitions and transfers, in which they make new friends, get used to new routines, cope well with school work, and are generally happy and confident (Evangelou et al., 2008; Brown et al., 2004; Ridley et al., 2005). However, Evangelou et al. (2008) and Galton, Morrison and Pell (2000) found that pupils from lower socioeconomic status backgrounds were less like to experience a positive transitions, whilst the data on attainment reviewed above demonstrates that FSM pupils made less progress from Key Stage to Key Stage compared to similar pupils who are not eligible for FSM.
Some of the factors identified by research as contributing to less successful transitions include:
• Foundation Stage to Key Stage 1: Abrupt transitions to more formal teaching approaches, with less time for child‐initiated activities, choice and play (Ofsted 2004; Sanders et al. 2005). Staff in Year 1 may have less support from teaching assistants than their colleagues in Reception, and may not sufficiently recognise the anxieties of pupils and their parents/carers at this time (Sanders et al. 2005).
• Key Stage 1 to Key Stage 2: different and heightened expectations on pupils, particularly regarding independent work; increased pressure to cover curriculum content; new and unfamiliar ways of working; less parental involvement; the allocation of ‘weaker’ teachers to Year 3; and poor transition planning, which does not identify underperforming pupils (Doddington et al., 2001).
• Primary to secondary / Key Stage 2 to Key Stage 3: the social upheaval of transferring to secondary school can distract pupils from focusing on their learning. In addition, some primary schools may focus on ‘neglected’ curriculum subjects such as art and drama in the aftermath of the Year 6 tests, which means some pupils may experience a gap of up to three months between the Year 6 tests and starting Year 7 during which they have had little opportunity to consolidate or extend their core skills – resulting in a dip in progress at Key Stage 3 (Galton et al., 1999). Primary and secondary teachers may lack proper knowledge about ‘what goes on in the other school’ in terms of teaching approaches and levels of attainment. This can lead secondary teachers to either overestimate the sophistication of Year 7 pupils after transfer, or underestimate the demands placed on them in Year 6 (Schagen and Kerr, 1999; Galton et al. 1999).
Overall, evidence suggests that pupils from deprived backgrounds are at particular risk of experiencing dips in progress and motivation at transition or transfer. Improving general practice in the area of transfer and transition should, therefore, benefit these pupils, but there is also evidence

86
that schools may need to focus particularly on pupils from deprived backgrounds in order to ensure they do not fall through the net. For example:
• Burgess at al (2007) found that pupils originating from a primary school with a high proportion of pupils eligible for FSM were more widely dispersed than pupils from other schools on transfer to secondary school. This suggests that the peer groups of FSM pupils are more fractured on entering secondary schools, which may impact on how they settle in.
• Evidence suggests that transitions and transfers are more effective where there is good home‐school liaison (Ofsted, 2004; Sanders et al., 2005), but pupils from deprived backgrounds are less likely to have parents who are involved in their education (section 5.1.5).
• Pupils from deprived backgrounds are more likely to be low attainers, which is a risk factor in itself for falling behind at transitional or transfer (Galton et al., 2000; Sanders et al., 2005).
• The tendency for pupils from deprived backgrounds to exhibit poorer behaviour (section 6.3.3) and to have less "social capital" (section 5.1.6) may make it particularly hard for them to settle in to their new school and make a good impression.

87
6.4.2 Pupil mobility
Pupils who are eligible for FSM are more likely to be “mobile” than pupils who are not: that is, pupils who are eligible for FSM are more likely to change schools at times other than the usual primary to secondary transfer.
Analysis of the National Pupil Database for the cohort completing Key Stage 2 in 2003 shows that 29% of pupils who were mobile during Year 5 were eligible for FSM, whilst 22% of pupils who were mobile at the start of Year 6 were eligible for FSM. This compares to just 16% of all other pupils. At Key Stage 4 in the same year, 22% of pupils who were mobile during Year 11 were eligible for FSM, compared to 14% of all other pupils.
As Figure 4‐22 above shows, being mobile at times other than the usual primary to secondary transfer has a significant impact on Key Stage 4 attainment, even when taking pupil characteristics into account. The average point score is depressed by more than 20 points for pupils who are mobile during Years 7, 8 or 9, and by more than 70 points for those pupils who join the school after September in Year 10. The former effect is similar in magnitude to that of being eligible for FSM, whilst the latter effect is greater than the effect of having a statement of special educational needs/being identified as School Action Plus. Contextualised value‐added modelling for Key Stage 2 also indicates a negative, albeit smaller, effect of mobility.
Therefore, although only a minority of pupils are mobile, for those who are there is a significant detrimental impact on their Key Stage 4 attainment, and FSM pupils are more likely to be mobile than non‐FSM pupils. Mobility is consequently something which needs to be borne in mind when considering how schools can best support pupils from deprived backgrounds. The financial impact on schools with high levels of pupil mobility also needs to be borne in mind. London Councils (2007) reported that the average estimated cost of supporting a typical mobile pupil at primary school was £400 or 14.5 hours of staff time, rising to £800 at secondary school, and that these figures were likely to be an underestimate.
Ofsted (2002) found that systems used by schools to manage mobility varied and that they had varying degrees of success in reducing the negative effects of high mobility levels. However, they found the following features of success:
• Relationships with parents and carers were forged quickly.
• Issues of immediate concern, such as medical conditions, systems of contact, school uniform, arrangements for free school meals, and homework, were dealt with efficiently.
• Pupils received information packs, prompt induction to the school and personal support systems.
• Information on attainment, including previous coursework, was obtained as quickly as possible from the pupils’ previous schools. This, together with the results of assessments of new pupils on arrival, was disseminated to class and subject teachers promptly.
• New pupils were placed in appropriate teaching groups. Existing pupils in these groups were prepared for new arrivals.
• Staff discussed schemes of work with new pupils to establish their familiarity with the work and what needed to be done to fill any gaps.
88
6.4.3 Choice of subject or qualification route
At secondary school, pupils are required to make decisions about their educational future for the first time. They must choose between different subjects at Key Stage 4, and also between different qualification routes (including academic and vocational options). Pupils who make the wrong decision, for example by choosing to drop a subject they may later find is required for entrance to further or higher education or training, may consequently be unable to follow their preferred options at 18 or their desired careers.
Foskett et al. (2004) reported that pupils from deprived backgrounds appear to make fewer connections between their post‐16 aspirations and the careers they want to pursue in later life, thus increasing their chance of making decisions which limit their future options. However, the same study also noted that for these pupils, the school can be a very important source of advice, more so than for pupils from other backgrounds.
Research indicates that decision making varies between individuals, and that some pupils may lack the necessary decision making skills to make informed choices about their educational pathways (SHM, 2005). Blenkinsop et al. (2006) similarly found that pupils make decisions in different ways: the quality of their decisions seemed to vary according to context, the ways in which information and advice was mediated to them, and their own individual approach to and skills of decision making. Pupils' decisions were found to fluctuate over time, even among pupils who had at first appeared very decided about their choices. Overall, the researchers suggested that pupils may not always have the necessary skills to make good decisions, and recommended that schools should emphasise the process of decision making rather than the decision itself.
Careers education and guidance (CEG) has been identified by several studies as a key factor in pupils’ decision making, giving pupils an insight into the choices available to them and equip them with the knowledge and skills to prepare for decision making and the implications of the choices they make. (Moon et al., 2004; Moon et al., 2005; McCrone et al., 2005; Payne, 2003; Morris et al., 1999). Blenkinsop et al. (2006) reported an association between schools with effective CEG, and pupils who make rational choices, weigh up all the information they receive, and are more influenced by internal school factors than external factors such as family and friends. In contrast, pupils and schools which do not have effective CEG in place are more likely to have varied approaches to decision‐making, to change their minds about decisions over time, and to have mindsets that reflect a “comfort seeking” or "defeatist" approach to decision‐making.
The same studies referenced above suggest that effective CEG to support pupils’ decision making is:
• integrated into a school's ethos and culture, rather than being perceived as separate from the rest of the curriculum;
• comprehensive and impartial;
• delivered by trained staff within the school with the support of external professionals (e.g. Connexions advisers);
• delivered in dedicated curriculum time of around 50 minutes per week in Years 9, 10 and 11;
• delivered some time in advance of when pupils have to make subject choices;
• flexibly designed to meet the needs of individual pupils;

89
• explicitly linked to subject choice at Key Stage 4 and 5; and
• planned in a coherent way across the Key Stages.
As part of CEG, work experience is viewed by pupils as an important influence on decisions about their educational future (Foskett et al., 2004). However, as Hatcher and Le Gallais (2008) reported, schools in deprived contexts may struggle to provide appropriate, high quality work experience placements, due in part to limited opportunities available in the local economy, and/or employer preference for schools in more advantaged contexts, especially grammar schools. Pupils from deprived backgrounds were also found to be more likely to be allocated placements of limited educational value.

90
6.5 School size and resources
This section highlights evidence on deprivation as it relates to school size and school resources.
6.5.1 School size
Despite quantitative evidence15 which suggests that school size in itself is not a significant influence on pupil outcomes, there is a popular movement in favour of small schools16 which is supported by evidence from qualitative research (see, for example, ERIC, 1996; 1999), which suggests that smaller schools have a better ethos, build better relationships with parents and carers and the community, promote better academic outcomes, and encourage a greater sense of belonging amongst pupils. It is also often claimed that smaller schools are better for pupils from disadvantaged backgrounds17 and there is some research evidence to support these claims (ERIC, 2000). However, since a lot of school size research has been undertaken in the US, which typically has bigger schools than the UK, there are significant problems with generalisability to this country (since schools we consider to be large may be equivalent in size to schools considered to be small in the US).
Evidence from the UK on the question of school size and deprivation is mixed. Ofsted (2000) reported that small schools on average demonstrate good attainment, but that they are likely to have very low proportions of FSM pupils; and where the proportion of FSM pupils in a small school increases, the same pattern of declining attainment is observed. Spielhofer et al. (2002) conducted analysis by secondary school FSM levels which showed that in schools with low proportions of FSM eligibility, pupils tended to show better performance in smaller schools, whereas in schools with high proportions of FSM eligibility, pupils tended to show better performance in larger schools. The optimum size of Year 11 cohort for a school with 50% FSM was 227, compared to an optimum size of 183 for a school with 16% FSM, and 162 for a school with extremely low levels of FSM. However, this analysis was based on actual performance data, and may not therefore represent the true "ideal scenario". It could also be biased by the failure to control for urban or rural location of school, which could affect pupil outcomes through mechanisms such as targeted funding for inner‐city areas.
Overall, it seems that school size is unlikely to significantly affect the education on offer, at least directly or unavoidably. However, it would be worth paying attention to some of the criticisms of small and large schools, to ensure that schools provide the best opportunities for all pupils, included those from disadvantaged backgrounds. For example, a common criticism of large schools is that they can be depersonalising, thus allowing pupils at risk to be overlooked, and that they can be intimidating to both pupils and their parents and carers. Those from deprived backgrounds may be most affected by this, since there is evidence that they are less confident in educational settings
15 Spielhofer et al. (2002), in the biggest UK‐based study of the impact of school size of pupil outcomes, found no significant effect of school size on pupil outcomes at Key Stage 2. At Key Stage 4, a curvilinear relationship was identified: pupil attainment improved up to a certain school size (cohort of 175‐200 pupils) and deteriorated when the school size increased beyond that. After controlling for prior attainment and other factors, the difference attributable to school size, while statistically significant, was quite small (approximately 0.15 points in terms of average GCSE score).
16 For example, Human Scale Education (http://www.hse.org.uk/)
17 For example, the National Association for Small Schools (http://www.smallschools.org.uk/)

91
(section 6.7). On the other hand, small schools may struggle to provide a broad curriculum (Spielhofer et al., 2002) and have higher unit costs (Ofsted, 2000), which may impact on the resources available for intensive intervention for pupils who fall behind. It would therefore seem advisable for schools to actively consider whether their size has affected the quality of their offer to pupils from deprived backgrounds, and how this could be mitigated.
6.5.2 School resources
A series of studies of the impact of school resources on attainment at Key Stage 2, Key Stage 3 and Key Stage 4 (Holmlund et al., 2008; Levačić et al., 2006; Jenkins et al., 2007) have been conducted. The analyses took into account the fact that pupils eligible for FSM attract higher funding, as well as a range of pupil‐ and school‐level variables, in order to extrapolate the specific effect of funding from all the factors which influence attainment.
The results indicate that there are identifiable effects of increasing school resources in terms of Key Stage attainment, and that there are some differential effects by FSM eligibility. In summary:
Key Stage 2 (Holmlund et al., 2008)
• At Key Stage 2, there is a positive and statistically significant effect of school expenditure on attainment in English, mathematics and science.
• In Key Stage 2 English, expenditure increases seem to translate more easily into improvement in schools with higher proportions of FSM pupils, whereas the opposite is true for science.
• For mathematics, the effect of expenditure is higher in schools with lower proportions of FSM pupils.
• Pupils eligible for FSM seem to benefit more on average from increases in expenditure when compared to their peers, in terms of attainment in English and mathematics. There is less of a differential for science.
Key Stage 3 (Levačić et al., 2006)
• Resources appear to have a small but significant impact on pupil attainment in Key Stage 3 mathematics and science, but little impact on attainment in English.
• The gain in attainment from additional resources appears to be greater for pupils eligible for FSM.
• High ability pupils eligible for FSM also benefit more from higher resourcing, particularly in science. This group was also the only one to have positive and significant resource effects for English.
• The authors concluded that it would be more cost effective in terms of Key Stage 3 attainment to target additional resources at mathematics and science and at pupils who are of average ability or from poorer backgrounds, particularly if they have high ability.
92
Key Stage 4 (Jenkins et al., 2007)
• Increases in resources improved overall GCSE attainment for all pupils, but particularly for pupils from the bottom 60% of the prior achievement distribution. Specifically, higher levels of per pupil expenditure were associated with significantly higher levels of attainment at GCSE as measured by the capped GCSE point score, and in GCSE science.
Overall, these studies confirm that increased resources can have a specific effect on outcomes for pupils eligible for FSM, but the identifiable effects are relatively small and not universal across subjects or Key Stages. In particular, the impact of resources appears strongest for younger pupils. Careful targeting of additional funding seems to be an important factor in maximising the impact on outcomes, although this may be hard to achieve in practice: for instance, Thrupp and Lupton (2006) cited evidence that deprivation funding is not “accurately and consistently targeted towards schools in deprived areas and that its impact [is] not being maximised” (p316) (although since this study was conducted, there have been changes to local funding formulae to improve the targeting of funding at deprived pupils).
Sibieta et al. (2008) investigated school funding mechanisms and found that on average, pupils who are eligible for FSM attract over 70% more funding to their school than those who are not eligible, and that this funding ‘premium’ has grown over time. However, the study also found that local authorities only allocate around 40–50% of the extra funding they receive for FSM pupils towards the schools these pupils attend. It should be noted, though, that DCSF has recently placed an expectation on all local authorities that this proportion should increase to a minimum of 80%.
93
6.6 Leadership, workforce and governance
This section reviews evidence on issues to do with leadership, workforce and governance in relation to deprivation.
6.6.1 Effective leadership in deprived contexts
Evidence suggests that school leadership is second only to classroom teaching as an influence on pupil learning (Leithwood et al. 2006). Almost all successful leaders draw on the same repertoire of basic leadership practices regardless of context, although the ways in which leaders apply these basic leadership practices demonstrate responsiveness to, rather than dictation by, the contexts in which they work. School leaders improve teaching and learning indirectly and most powerfully through their influence on staff motivation, commitment and working conditions. School leadership has a greater influence on schools and pupils when it is widely distributed, but some patterns of distribution are more effective than others (Leithwood et al. 2006).
Effective leadership in school facing challenging circumstances, such as those with high levels of deprivation, therefore does not seem to be qualitatively different from effective leadership in other schools. Nevertheless, Day et al. (2007) reported that headteachers in more disadvantaged contexts made greater efforts than headteachers in more advantaged contexts to:
• engage parents in the school’s improvements efforts;
• restructure their schools to facilitate the work of staff;
• help clarify the reasons for the school’s improvement efforts; and
• ensure wide participation in decisions about school improvement.
The authors also reported that although effective leadership is similar across contexts, a great number of effective leadership practices were required to effect change in more disadvantaged schools. Effective headteachers in challenging circumstances have to be more responsive to school culture and policy contexts in order to improve pupil outcomes, and make greater efforts to effect improvement in a range of ways.
Leithwood et al. (2006) argue that the most successful school leaders in challenging circumstances have traits that enable them to strive for improvement even when there is little reason to expect progress. They are:
• open‐minded;
• ready to learn from others;
• flexible rather than dogmatic in their thinking within a system of core values;
• persistent;
• resilient; and
• optimistic.

94
Small scale research for the National College of School Leadership (Harris and Chapman 2002) looked at schools facing challenging circumstances, defined as schools in which 25% of pupils, or less, achieved 5+ A*‐C and/or over 35% of their pupils were eligible for FSM. The three main findings from the research were that effective leaders are:
• constantly managing tensions and problems directly related to the particular circumstances and context of the school. The main leadership task facing them is one of coping with unpredictability, conflict and dissent on a daily basis without discarding core values.
• above all, people‐centred. The leadership practice of head teachers in the study was underpinned by a set of personal and professional values that placed human needs before organisational needs.
• able to combine a moral purpose with a willingness to be collaborative and to promote collaboration amongst colleagues, whether through teamwork or extending the boundaries of participation in leadership and decision making.
The authors concluded that effective leaders in schools facing challenging circumstances:
• believe that all pupils can learn and succeed;
• offer leadership that is value‐driven with a strong moral purpose;
• build community and shape culture;
• are strategic;
• have the confidence to be contentious and to deal with conflict;
• have no singular leadership style, but have emphasis upon forms of leadership that are people‐orientated, transformational and empowering;
• use a range of leadership approaches and are adept at selecting the approach to match or fit the growth‐state or developmental stage of the school;
• are highly pragmatic, resilient and determined individuals who work towards changing negative attitudes towards or within their school;
• establish coherent communities within their schools as well as a sense of a responsible community beyond and around the school;
• place educational concerns over management concerns;
• are primarily concerned with helping people understand the problems they face rather than solve them;
• take advantage of external opportunities (e.g. Ofsted, Education Action Zones or Excellence in Cities) to generate change and to encourage staff to innovate;
• place emphasis upon models of professional development that impact directly on classroom practice; and
• invest in the learning of staff and pupils.
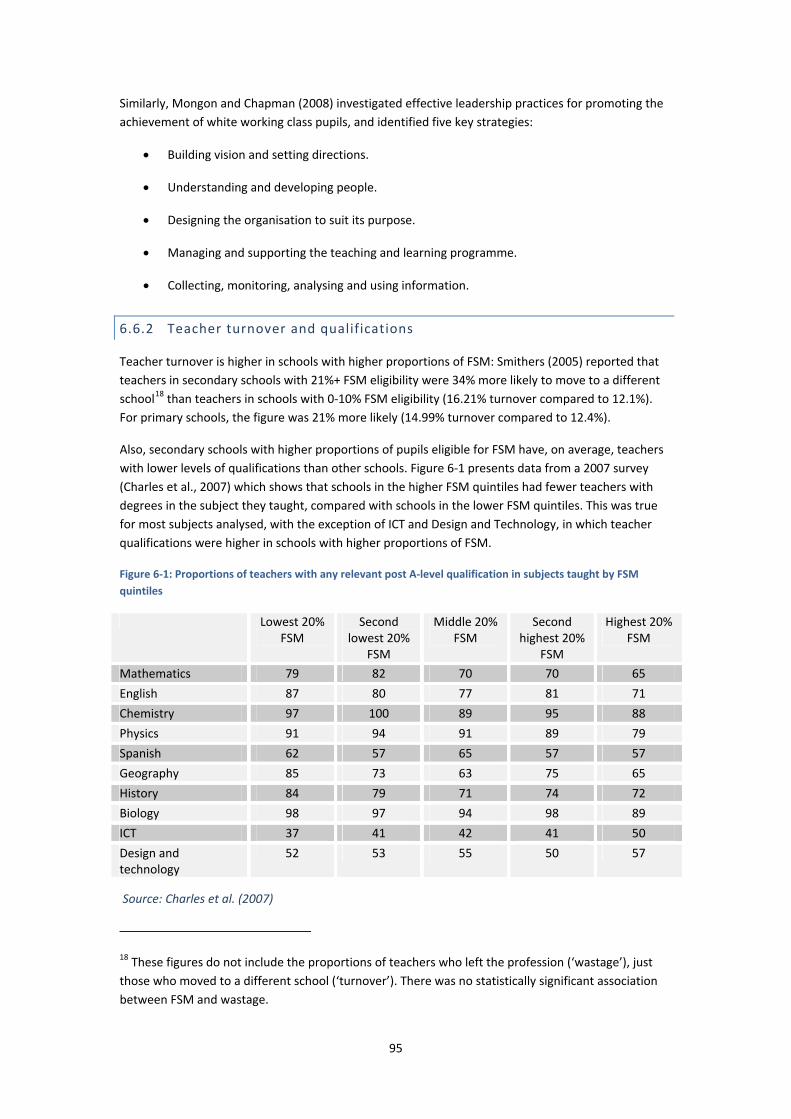
95
Similarly, Mongon and Chapman (2008) investigated effective leadership practices for promoting the achievement of white working class pupils, and identified five key strategies:
• Building vision and setting directions.
• Understanding and developing people.
• Designing the organisation to suit its purpose.
• Managing and supporting the teaching and learning programme.
• Collecting, monitoring, analysing and using information.
6.6.2 Teacher turnover and qualifications
Teacher turnover is higher in schools with higher proportions of FSM: Smithers (2005) reported that teachers in secondary schools with 21%+ FSM eligibility were 34% more likely to move to a different school18 than teachers in schools with 0‐10% FSM eligibility (16.21% turnover compared to 12.1%). For primary schools, the figure was 21% more likely (14.99% turnover compared to 12.4%).
Also, secondary schools with higher proportions of pupils eligible for FSM have, on average, teachers with lower levels of qualifications than other schools. Figure 6‐1 presents data from a 2007 survey (Charles et al., 2007) which shows that schools in the higher FSM quintiles had fewer teachers with degrees in the subject they taught, compared with schools in the lower FSM quintiles. This was true for most subjects analysed, with the exception of ICT and Design and Technology, in which teacher qualifications were higher in schools with higher proportions of FSM.
Figure 6‐1: Proportions of teachers with any relevant post A‐level qualification in subjects taught by FSM quintiles
Lowest 20% FSM
Second lowest 20%
FSM
Middle 20% FSM
Second highest 20%
FSM
Highest 20% FSM
Mathematics 79 82 70 70 65
English 87 80 77 81 71
Chemistry 97 100 89 95 88
Physics 91 94 91 89 79
Spanish 62 57 65 57 57
Geography 85 73 63 75 65
History 84 79 71 74 72
Biology 98 97 94 98 89
ICT 37 41 42 41 50
Design and technology
52 53 55 50 57
Source: Charles et al. (2007)
18 These figures do not include the proportions of teachers who left the profession (‘wastage’), just those who moved to a different school (‘turnover’). There was no statistically significant association between FSM and wastage.

96
6.6.3 Wider workforce
A small‐scale study by inspectors of practices in 13 primary and 10 secondary schools between September 2007 and March 2008 (Ofsted, 2008b) reported that members of the wider workforce were particularly successful in engaging pupils at risk of underachievement or permanent exclusion, in developing links with the community, and in reengaging parents and carers in education so that they were in a better position to support their pupils’ learning. Furthermore:
• Members of the wider workforce who focused on managing school systems were able to ensure that senior managers and teachers were better informed about pupils' learning needs.
• Members of the wider workforce who worked directly with pupils (for example, teaching assistants, learning support assistants, mentors and cover supervisors) contributed to providing one‐to‐one support and monitoring pupil progress.
• Members of the wider workforce who focused on pupils' welfare (for example, attendance officers, pastoral leaders, behaviour mentors, counsellors and inclusion co‐ordinators) were able to plan changes to the curriculum to meet the needs of underachieving pupils and to establish links with families and other agencies to support their social and emotional needs within and outside school.
This points to the importance of effective use of the wider workforce in supporting outcomes for deprived pupils.

97
6.6.4 Governance
An internal Ofsted report on the work of governors from 2002 which drew together evidence from inspections, reports and visits to schools in 1999‐2001 found that where governance was good, standards of attainment were likely to be higher than in other schools. The behaviour of pupils, the quality of teaching and the leadership and management of schools were also more likely to be good. However, quality of governance was found to decline as the proportion of pupils eligible for FSM in a school rose.
A school's governing body has three main roles: a general managerial role, a ‘localising’ role (providing local knowledge) and a ‘democratising’ role, through the governing body representing local people in decisions about the local delivery of education (Dean et al. 2007). However, governing bodies in disadvantaged areas may not always fulfil these roles, for reasons including:
• Unrepresentative membership. Dean et al. (2007) reported that governing bodies in disadvantaged areas were likely to be unrepresentative of their local communities, even more so amongst the core of active members. Ellis (2003) reported that in general, people with low incomes, those who are unemployed, those from black and other minority ethnic groups, disabled people, young people, lone parents and business people tend to be underrepresented on governing bodies.
• Lack of capacity to offer managerial support (or not seeing this as their primary purpose).
• Difficulties with recruiting and retaining governors with the time and expertise for the complex tasks involved.
• Failure to link with local activist groups and local policy partnerships.
People on low incomes or who are unemployed may be excluded from becoming governors if they are not fully or quickly reimbursed for expenses. They may also be put off from applying because of continuing stereotypes about the composition of governing bodies (dominated by white, middle‐class and middle‐aged members of the community). Lack of confidence and self‐esteem, lack of awareness of opportunity for involvement, and alienation from the education system are also contributory factors (Ellis, 2003).

98
6.7 Engaging parents and carers
As Desforges and Abouchaar (2003) state, parental involvement in education has a large and positive effect on pupils’ outcomes, indeed an effect which is larger than the effect of schooling itself. Furthermore, the authors propose that
"if the parenting involvement practices of most working class parents could be raised to the level of the best working class parents [...] very significant advances in school achievement might reasonably be expected. [...] Additionally, models of how parental involvement works suggest that every element in the process is, at least in principle, open to the influences of teaching and learning".
(Desforges and Abouchaar, 2003:87‐88)
They conclude that the challenge is for all schools to raise the level of their engagement with parents to that of the very best schools, and that this, if achieved, will have a notable effect on outcomes. Indeed, Harris and Goodall (2007) demonstrated that where schools make an effort to engage with ‘hard to reach’ parents and carers, it has a positive impact on pupils’ behaviour and learning.
It should be acknowledged, though, the school is only one element in a web of potential support for families living in deprivation, and one which, may not have the strongest transformative influence, especially if working on its own to solve problems caused by multiple factors. Income support, employment, childcare, adult education, and community regeneration are also necessary pieces of the jigsaw; indeed, using evidence on parenting programmes in the US, Raffaele and Knoff (1999) and Epstein (2001) have demonstrated that a whole community, strategic approach which is embedded in schools' teaching and learning strategies and development plans is the only approach which is likely to see a quantifiable return. It is not, however, within the scope of this paper to look more broadly at the mechanisms by which families and communities can best be supported to develop their educational involvement, achievement and aspirations; the focus will remain on school‐based practices.
Evidence from a large‐scale survey of parents and carers (Peters, Seeds et al., 2008) found that although parents and carers from all social grades (using the A/B/C1/C2/D/E classification) generally reported a similar level of involvement in their children's education, parents and carers in the lower social grades were more likely than those in higher social grades to want to be more involved in their child's education. The same survey found that those who wanted to be more involved were also more likely to say that they had no specific barriers to being more involved19, which suggests that there is significant potential for schools to engage more with these parents.
Harris and Goodall (2007) reported on a developmental project in around 100 schools, which trialled new ways of engaging parents and carers, particularly those seen as “hard to reach”. Each school focused on one or more of the following strands:
• Supporting parents and carers to help their children learn.
• Personalising provision for parents and carers themselves as learners.
19 This is not broken down specifically by social grade or income.

99
• “Intelligent reporting” (using new technologies to inform parents and carers about, and engage them in, their children’s learning, progress and behaviour).
• Enhancing pastoral care.
As the authors of the evaluation noted, there is an important difference between parental involvement in schools (for example, dealing with administration, responding to letters, membership of the parent teacher association, etc) and parental engagement in learning (i.e. activities which promote their children’s learning outcomes): evidence shows that the former has little to no demonstrable impact on individual attainment, although it may be valuable in terms of community relations (e.g. Okpala et al., 2001; Ho Sui‐Chu and Willms, 1996). So, whilst in the case of some extremely disengaged parents and carers simply getting them involved in basic interaction with the school may be a necessary beginning, in order for their involvement to have an identifiable impact on pupils’ outcomes schools need to focus on which forms of engagement will best promote learning, and how.
Harris and Goodall (2007:31) concluded that although evidence on how schools can best promote parental engagement in education is not extensive, it is clear that schools that "succeed in engaging families from very diverse backgrounds share certain key practices. They focus on building trusting collaborative relationships amongst teachers, families and community members; [and] they recognise, respect, and address families' needs, as well as class and cultural difference".
The authors highlighted certain conditions which have to be in place to ensure that a sustainable difference is made for pupils from deprived backgrounds:
• Strategic planning which embeds parental involvement in whole school development planning.
• Sustained support, resourcing and training.
• Community involvement at all levels of management.
• A commitment to a continuous system of review.
• A supportive network system that promotes objectivity and shared experiences.
• An acknowledgement of the differences amongst groups of parents and carers, and strategies which reflect these differences.

100
6.8 Supporting pupils with multiple needs
London Councils (2007) highlighted the importance of supporting the complex multiple needs of some very deprived pupils. The report cited evidence (echoed in section 5.1.8) that the more deprived a child is, the more likely it is that they will experience multiple risk factors which will interact to increase the impact of deprivation on their outcomes.
As acknowledged above, although evidence suggests the school is of central importance in improving outcomes for pupils from deprived backgrounds, a significant body of research on education and poverty highlights the necessity of holistic, coherent interventions and support systems which involve multiple agencies in supporting the multiple needs of pupils and their families living with deprivation.
A recent review of theory, policy and practice on education and poverty by Raffo et al. (2007) summarises evidence on schooling and multi‐agency working. They argue that, historically, the delivery of public sector services has failed to recognise the joined up nature of the complex and multifaceted problems that communities and families can experience. There is, consequently, the need for new forms of multi‐agency working. Critical success factors for multi‐agency working highlighted by existing research include:
• ensuring managers have clear and unambiguous ideas of the kind of programme to be established;
• an acceptance of the need for bottom‐up approaches which help to empower disadvantaged communities; and
• non‐hierarchical management structures based on mutual respect.
Challenges to multi‐agency working highlighted by Raffo et al. include:
• tensions between collaborative and competitive approaches, and consequent pressures for organisations to act in their own interests; and
• the demands on practitioners to operate at a more sophisticated level that is beyond their traditional professional role.
Similarly, Kendall et al. (2008) reviewed evidence which suggested that effective multiagency working in the area of early intervention and prevention can narrow the gap in outcomes for vulnerable pupils. Key features of effective multiagency working were found to include the following:
• sensitivity to local communities and flexibility in responding to changing priorities;
• a single multiagency action plan, and joined up approaches to workforce development and training;
• a named lead professional or key worker allocated to each client, who is responsible for coordinating a package of support across agencies;
• joint assessments of need, mapping of service provision and gaps, and joint target setting;
• effective systems for datasharing;
• joint commissioning of services; and

101
• streamlined referral processes.
As an example of the impact of multi‐agency working, the authors reported evidence that the behaviour of some vulnerable groups had been significantly improved when schools worked with other children's services partners, for example to deliver therapy based interventions or school‐based family social work services.

102
6.9 National initiatives
Various large‐scale initiatives have been implemented to try to improve the outcomes of pupils from deprived backgrounds. Available evidence from evaluations of these initiatives is summarised here.
6.9.1 Excellence in Cities
The Excellence in Cities (EiC) Programme provided additional resources and guidance for schools in the most disadvantaged20 communities between September 1999 and March 2006. The programme comprised several strands and sub‐strands including:
• Gifted and Talented;
• Learning Mentors;
• Learning Support Units;
• City Learning Centres;
• Beacon schools;
• Specialist schools;
• EIC Action Zones;
• Study Support;
• Leadership Incentive Grant; and
• Behaviour Improvement Programme.
Since April 2006 EiC funding has been mainstreamed and now forms part of the School Development Grant.
NFER (2007) conducted multi‐level modelling to identify what impact the EiC programme had on a range of attainment measures. In summary:
• Pupils in EiC schools made, on average, more progress than similar pupils in non‐EiC schools. This was true for all five outcomes examined: capped GCSE score, English GCSE, mathematics GCSE, 5+ A*‐C, and 5+ A*‐C including English and maths.
• The impact of EiC was found to be greater in schools with the highest levels of FSM.
• FSM pupils in EiC areas benefited from the programme, but no greater extent than non‐FSM pupils in EiC areas. This means that, on average, the FSM gap was not narrowed in EiC areas, although overall attainment went up.
20 EiC areas were chosen on the basis that they were in cities or conurbations and in the light of free school meals (FSM) percentages (no urban authority with 24% or more FSM in 1999 to 2000 was excluded).

103
Kendall et al. (2005) studied the impact of EiC between 2000 and 2003 and reported that:
• Cost‐benefit analysis suggested that EiC was cost‐effective, under certain assumptions about the returns to education.
• There was an identifiable positive impact on attendance of approximately one day per pupil per year.
• There was no evidence to suggest that pupils' attitudes were affected by EiC.
• Teachers reported positive effects of EiC, including more opportunities to try new teaching and learning approaches and a wider range of teaching activities, additional and/or more appropriate resources, and more opportunities to exchange ideas with colleagues.
• There was a notable increase in the proportion of schools offering additional study opportunities such as homework clubs and summer schools, which many schools attributed to EiC.
• There was mixed evidence on the impact of EiC on public perceptions of schools.
Evidence on the impact of individual strands included:
• The Gifted and Talented strand helped to create a school ethos of high expectations.
• The Learning Mentor strand helped to improve levels of self‐esteem, behaviour and motivation amongst pupils supported by a learning mentor, and also contributed to a reduction in levels of disruption in the classroom.
• The Learning Support Unit strand provided effective support for disaffected pupils, many of whom were successfully integrated into mainstream classes.
Challenges identified by the evaluation in relation to the strands included:
• A perception that the Gifted and Talented strand was elitist and divisive.
• Initially negative perceptions about the Learning Mentors amongst teachers, although these were ultimately resolved.
• Difficulties in recruiting and retaining appropriate staff for Learning Support Units.
An overarching challenge was the difficulty of implementing a complex initiative within a short time frame, with the resulting increase in teachers' workloads.
Summarising research on EiC, Raffo et al. (2007:51) concluded that there is some evidence of ameliorative impacts and positive outcomes, but overall “the evaluations do not provide a strong endorsement for the success of EiC in making a major difference to the education and poverty link”.

104
6.9.2 London Challenge and City Challenge
The London Challenge programme was introduced in 2003, as a five year programme to help improve educational standards across London secondary schools. Its goals were to rapidly improve underperforming schools, particularly focusing on achievements in English and maths; to increase the number of outstanding schools; and to narrow the attainment gap between disadvantaged pupils and their peers. Support was targeted in particular at five key boroughs (Hackney, Haringey, Islington, Lambeth and Southwark) and “Key to Success” schools (the most challenging schools in London).
London Challenge had various strands, including:
• The London Leadership Strategy to develop leaders of the London education system.
• Chartered London Teacher status which recognised and rewarded the skills and expertise of London teachers.
• Key Worker Living Scheme to help London teachers with the cost of buying a home in the capital.
• Teach First, which encouraged and supported graduates, who might not otherwise consider teaching, to work in challenging London schools for two years before starting a business career.
• Continuing Professional Development networks and resources.
• London Student Pledge, which aimed to widen young people’s experience and aspirations by giving them access to cultural and other activities.
• A Gifted and Talented programme to extend learning opportunities for able pupils.
• Investment in ICT.
• Extended Schools: London Challenge funded The Extended Schools Support Service to offer focused support to London schools, local authorities and others involved in providing extended services.
• The Business Challenge, which supported school‐business partnerships.
• Specialist Schools: support for London schools wishing to apply for specialist status.
• Academies: brokering academy projects in London.
• Families of Schools: a data tool for London schools grouped into ‘families’, designed to help schools identify other London schools with very similar characteristics so they can share practice.
There has been no formal overarching evaluation of the London Challenge programme, but various studies have shed some light on the programme’s impact.

105
OFSTED ANALYSIS OF IMPROVEMENTS IN LONDON SCHOOLS
Ofsted (2006b) reported that standards at Key Stage 3 and Key Stage 4 had risen faster in London than in schools nationally, and that fewer London secondary schools were in the lowest of 25% of all schools (Figure 6‐2). Primary schools in inner London also improved faster than primary schools nationally (Figure 6‐3).
Inspection evidence showed that the proportion of London schools graded as good or better was higher than nationally, and that leadership, management and quality of teaching had improved significantly. Attendance in Inner London had improved by 2.2%, almost double the improvement in all schools nationally.
Figure 6‐2 Percentage of secondary schools below 30% 5A*–C GCSE in 2003 which have improved or declined between 2001 and 2005
Source: Ofsted (2006b)
92
85
73
65
64
79
85
89
8
11
13
12
4
16
23
21
14
3
4
10
15
7
7
0% 20% 40% 60% 80% 100%
Other London
London Challenge Key toSuccess
All schools
County
Unitary authority
Metropolitian
Outer London
Inner London
Improved No change Declined
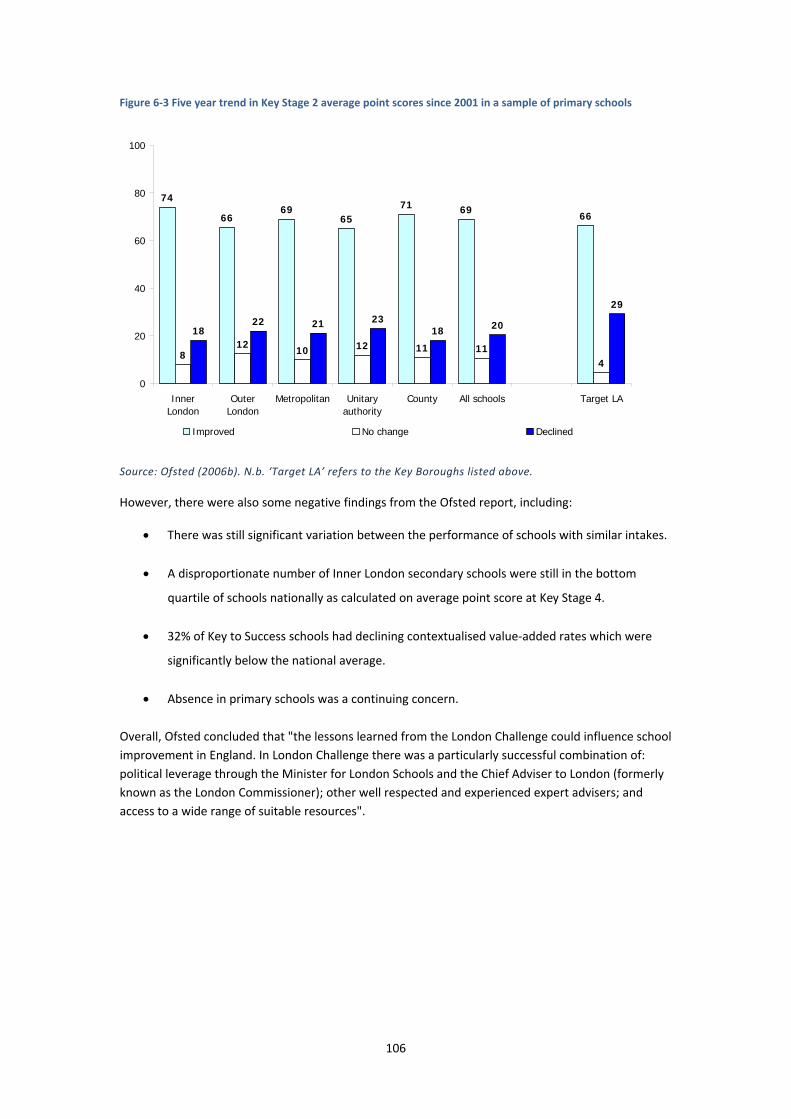
106
Figure 6‐3 Five year trend in Key Stage 2 average point scores since 2001 in a sample of primary schools
Source: Ofsted (2006b). N.b. ‘Target LA’ refers to the Key Boroughs listed above.
However, there were also some negative findings from the Ofsted report, including:
• There was still significant variation between the performance of schools with similar intakes.
• A disproportionate number of Inner London secondary schools were still in the bottom
quartile of schools nationally as calculated on average point score at Key Stage 4.
• 32% of Key to Success schools had declining contextualised value‐added rates which were
significantly below the national average.
• Absence in primary schools was a continuing concern.
Overall, Ofsted concluded that "the lessons learned from the London Challenge could influence school improvement in England. In London Challenge there was a particularly successful combination of: political leverage through the Minister for London Schools and the Chief Adviser to London (formerly known as the London Commissioner); other well respected and experienced expert advisers; and access to a wide range of suitable resources".
74
6669
6571 69
66
812 10 12 11 11
4
1822 21 23
18 20
29
0
20
40
60
80
100
InnerLondon
OuterLondon
Metropolitan Unitaryauthority
County All schools Target LA
Improved No change Declined
107
LONDON CHALLENGE STUDENT PLEDGE
An evaluation of the London Challenge Student Pledge (Hoggart et al., 2008) found anecdotal evidence of a positive impact. All stakeholders thought that the funding had increased the enrichment opportunities available for London pupils, and that this had had a “significant and diverse” range of benefits for pupils and schools, including in the areas of curriculum based skills, confidence, teacher‐pupil relations, and behaviour and attitudes to learning. There was some evidence that exposure to new experiences “nurtured” pupils’ aspirations and that the effect was sustained beyond the end of the Pledge activity.
However, the evaluation also identified implementation challenges including: limited teacher time; staff turnover; behaviour problems; lack of support from senior staff for extra‐curricular activities; and “tensions with the attainment agenda”. Some providers of Pledge related activities reported that some disadvantaged schools faced “too many barriers to participate at all”.
LONDON CHALLENGE: PARENTS’ AND CARERS’ ATTITUDES
A longitudinal survey of parents and carers (Wiseman and Dent, 2007) investigated whether any improvements to London schools delivered under the London Challenge programme were reflected in parents' and carers’ perceptions of maintained school provision in the capital. The findings were generally inconclusive. A higher proportion of parents and carers whose child attended school in one of the five key boroughs where London Challenge support was targeted perceived an improvement (58%) compared to parents and carers whose child attended school in other boroughs (45%), but overall, very little change in parents' and carers' attitudes was observed from 2003 to 2006. This may be because parents’ and carers’ attitudes can be influenced by a wide range of factors, many not related to actual school improvement or decline.
LONDON CHALLENGE: PUPILS’ AND TEACHERS’ ATTITUDES
A longitudinal survey of pupils and teachers (Wilson et al., 2007) was similarly inconclusive. Very few notable changes over time in pupils’ and teachers’ attitudes were observed, and there were also few important differences between the views of pupils and teachers in London and those in other metropolitan areas. Some positive findings included:
• In 2006, teachers were more likely to recommend London as a place to work than in 2004 (up from 52% in 2004 to 58% in 2005 and 68% in 2006).
• There was a year on year increase in the percentage of Year 7 pupils from Inner London who strongly agreed that their school was giving them a good education (up from 31% in 2004 to 38% in 2005 and 42% in 2006).
• The proportion of Year 7 pupils from Greater London who reported that their parents attended parents’ evenings increased from 81% in 2004 to 91% in 2005 and 2006.
• The proportion of classroom teachers in other metropolitan areas reporting high staff morale had decreased since 2005 (from 50% to 43% in 2006). However, the level of morale reported by teachers in London had remained relatively constant (47% in 2005, 48% in 2006).

108
These are, however, countered by some negative findings:
• There was a 13% drop in Inner London teachers reporting that the quality was ‘much’ or ‘slightly’ improved (from 48% in 2004 and in 2005 to 35% in 2006).
• In 2006, a greater proportion of teachers in Inner London did not think that their school was committed to working collaboratively with other schools to support for pupils’ learning (an increase from 9% in 2005 to 14% in 2006).
• Pupils in London schools were slightly more likely to admit to missing school without permission than similar pupils in other metropolitan areas (3% compared to 2% of Year 7 pupils, 4% compared to 3% in Year 10), and more likely to admit to being badly behaved in class.
• Less than half the pupils in London agreed that teachers were good at keeping control in the classroom (47% of pupils in Year 7 and 38% of pupils in Year 10).
CITY CHALLENGE
Following sustained improvements in schools in London and the positive Ofsted findings, it was confirmed that the London Challenge programme would be extended for a further three years to 2011, and that from April 2008 similar Challenges would be initiated in Greater Manchester and the Black Country. These three City Challenges aim to raise school standards, and to break the link between deprivation and educational under‐achievement. The Department for Children, Schools and Families will monitor the impact of the City Challenge programme through its lifetime and will explore the potential to conduct another Ofsted thematic study.

109
6.9.3 Extended schools
Extended schools work with their local authority, other schools and private and voluntary providers to provide access to a core offer of extended services, such as:
• a varied range of activities, including study support, play/recreation, sport, music, arts and crafts and other special interest clubs, volunteering and business and enterprise activities;
• childcare 8am to 6pm, 48 weeks a year for primary schools;
• parenting support including family learning;
• access to targeted and specialist services such as speech and language therapy;
• community access to facilities including adult learning, ICT and sports facilities.
These services are often provided beyond the school day but not necessarily by teachers or on the school site.
Evidence from evaluation of extended services suggests that they are having a positive impact for children and local communities. Although there is limited evidence of particular effects for deprived children as measured by FSM, evidence suggested that extended schools do have a range of benefits for children from the most challenging backgrounds, although these are hard to quantify.
Ofsted (2006a) reported on extended services in schools and children’s centres, concluding that:
• Almost all provision visited was effective in meeting the range of needs of children, young people and adults in the local community.
• In half the settings visited, the impact of extended services on most outcomes for participants was good or better. Children, young people and adults experienced benefits in terms of self‐confidence, improved relationships, more positive attitudes to learning, and higher aspirations. Impact on Every Child Matters outcomes, such as promoting healthy eating and exercise, was also evident.
• Leadership and management of the provision were at least good in over half the settings visited.
• Extended services providers focused well on tailoring provision for the differing needs and abilities within the community.
Similarly, Cummings et al. (2007) evaluated full service extended schools, an initiative which aimed to support every local authority to develop a comprehensive range of services in one or more schools, most of which were located in disadvantaged areas. The evaluation suggested that full service extended schools had a range of identifiable positive benefits, in the following areas.
Attainment: individual case studies of pupils showed that the full service extended schools were able to put in place support for those with the greatest needs and enable them to achieve. However, no identifiable impact on whole school attainment was observed. Although there is evidence from individual schools that this approach was impacting positively on pupils' attainment, this could not be demonstrated to be linked to the initiative itself, since there were many overlapping factors in play.

110
Personal and social outcomes: the range of support available within a full service extended school enabled pupils with the greatest needs to be effectively targeted, resulting in increased prosocial behaviour and engagement in learning. The evaluators noted that ongoing rather than one‐off interventions are likely to be required to support pupils with longstanding problems.
Health outcomes: self report by full service extended schools provided anecdotal evidence that the initiative promoted positive health‐related outcomes through the integration of health care services with the educational setting. A small number of case study schools reported a reduction in teenage pregnancy, sexually transmitted diseases, alcohol and drug abuse, and smoking.
Families: the evaluation found that full service extended schools were effective at identifying problems in the family, and providing or accessing relevant support. There was evidence that families were consequently able to manage problems which had previously been overwhelming.
School ethos: parents of pupils in full service extended schools were more likely than other parents to feel that the school make them welcome, and that it offered help to parents and local people. Similarly, pupils in full service extended schools were more likely than other pupils to feel that their school tried to help them with their problems.
The evaluators reported that both the costs and benefits of the initiative were high, and overall that it represented a good investment.
111
6.9.4 Academies
Academies are all‐ability state‐funded schools which can be established by a wide range of sponsors, including educational foundations, universities, businesses, private school trusts and faith communities, typically to replace existing poorly performing schools, although some are new schools in areas of low educational achievement.
An evaluation by PriceWaterhouseCoopers (2007a) reported that the proportion of pupils eligible for FSM was significantly higher in Academies when compared to the national average and other schools in similar circumstances. Between 2002 and 2006, the absolute number of FSM pupils in Academies increased due to expansion of the programme, although in some individual schools the proportion of FSM pupils declined as improved performance attracted a broader profile of pupils to the school.
It is hard to assess the overall impact of Academies, because of the diversity and complexity of the pupil profile and the different starting points of individual schools. However, the evaluation pointed to a general picture of improvement against a range of indicators at Key Stage 3, Key Stage 4 and post‐16 levels, and a faster closing of the gap between Academies and other schools, compared to non‐Academy schools in similar circumstances. There is also strong evidence from the evaluation that Academies are focused on raising pupils' aspirations as a key driver of improvement.

112
6.9.5 Building Schools for the Future
Building Schools for the Future (BSF) is a large capital investment programme which began in 2005/06 and which aims to rebuild or refurbish 3500 secondary schools in England. The programme will see the total capital investment in schools in England increase to £8.2 billion by 2010/11.
Although not specifically an initiative to target deprivation, when selecting schools for the first phase of BSF areas with higher proportions of FSM pupils were given priority.
The first annual report on BSF by PriceWaterhouseCoopers (2007b) reviewed the literature on the links between school buildings and learning outcomes and concluded that new and better school buildings have a positive effect on attainment. The second annual report (PriceWaterhouseCoopers, 2008) investigated the impact of BSF in four completed schools and reported that 70% or more of teachers surveyed in the schools believed that the new or refurbished school buildings had a positive impact on pupils' aspirations and pride in their school. Pupils reported that they thought the quality of lesson delivery had improved.
Although this evaluation evidence is currently preliminary and based on a small number of schools, it does indicate that the BSF programme has the potential to improve the learning experience and outcomes of deprived pupils. It has so far, however, not been possible to quantify the extent of any effect.

113
6.9.6 National Challenge
The National Challenge was launched by the Secretary of State on 10 June 2008. It is a £400 million programme of support which aims to secure higher standards in all secondary schools so that, by 2011, at least 30% of pupils in every school will gain five or more GCSEs at A*‐C, including both English and mathematics. According to the 2008 performance tables, there are 440 secondary schools in England below this floor target, compared with 631 last year.
Through the National Challenge, the Department for Children, Schools and Families will provide bespoke support for schools below, and at risk of being below, the 30% threshold, including a Challenge Adviser for each one. Schools and their local authorities have produced school improvement plans for each school that identifies the most appropriate package of support to meet each school’s needs.
There is already good progress towards meeting the National Challenge, with a net reduction of 191 schools below the floor target this year. We expect the number of schools below the floor target to decrease year on year as National Challenge support helps to accelerate and consolidate school improvement.
There is as yet no impact data on the National Challenge, but DCSF is commissioning an evaluation of school improvement strategies, including National Challenge.
6.9.7 The Extra Mile
The Extra Mile project was launched in July 2008 and is looking at ways to raise aspirations in deprived communities. It aims to spread good practice identified in 50 schools with high proportions of FSM pupils which have nevertheless achieved good results. Extra Mile schools focus on developing their practice in four main areas:
Securing attention, engagement and mutual respect
• Increasing interactive and participatory learning.
• Developing a listening campaign which responds to pupil and parent perceptions.
• Promoting a culture of respect for local people, local culture and local values.
Raising aspirations
• Broadening pupils' horizons by offering experiences and opportunities they would not otherwise get.
• Developing a culture of achievement and 'belonging' in school.
• Offering a more relevant curriculum.
Equipping pupils with skills for the future
• Building pupils' repertoire of spoken and written language.
• Developing pupils' social, emotional and behavioural skills.

114
Holding them to it; no one fails
• Cultivating traditional values of respect, good behaviour and caring.
• Tracking pupil progress and intervening promptly if they fall off trajectory.
• Developing effective rewards and incentive schemes.
• Supporting pupils at important moments in their lives, especially transition points.
Results of the pilot initiative will be reported in summer 2009, and, if successful, the Extra Mile approach will be rolled out more widely.
115
7 Further questions and evidence gaps
Although the evidence base on deprivation and education is extensive in many areas, there are some questions of relevance to education in the twenty first century which, as yet, have not been fully answered by research. These include:
URBAN AND RURAL DEPRIVATION. Cassen and Kingdon (2007) note that deprivation is mainly
an urban problem, with the greatest disadvantage concentrated in relatively few urban areas. However, FSM eligibility can be found in almost all schools in the country, whilst rural and coastal areas may also be relatively deprived (although as DEFRA (2004) notes, rural deprivation is more widely dispersed). Such areas can face challenges such as long distances between schools, high cost of transport and/or poor transport links, high unemployment, and poor access to services such as healthcare (DEFRA, 2004; Davies, 2005; Glanville, 1999). This raises various questions, such as: Are there different challenges inherent to addressing poor attainment amongst deprived pupils in different contexts, for example rural compared to urban deprivation, or a majority deprived area compared to isolated pockets of deprivation in an affluent community?
NON‐COGNITIVE SKILLS. The phrase ‘non‐cognitive skills’ refers to a range of skills, attributes and dispositions which can contribute to a range of educational and life outcomes. These can include, for example, perseverance, conflict resolution, emotional intelligence, self management, self respect, teamwork, locus of control, time management, and managing stress. Carneiro and Heckman (2003) reported that pupils from disadvantaged backgrounds are more likely to be socially maladjusted than pupils from more advantaged backgrounds, i.e. to lack the necessary non‐cognitive skills to succeed in life, which suggests that schools should target non‐cognitive skills as well as cognitive skills such as reading, writing and mathematics. Indeed, Carneiro et al. (2007) examined data from the National Child Development Survey for pupils aged 7 and 11, and concluded that non‐cognitive skills may be more open to influence than cognitive skills between these ages. However, exactly how schools can help to develop their pupils’ non‐cognitive skills and what the impact on outcomes would be is not yet well evidenced by research.
MULTI‐AGENCY WORKING. Although there is some evidence on multi‐agency working (section
6.8), the policy context is evolving rapidly (e.g. Children’s Trusts) and there are greater demands upon schools and other organisations to work effectively and indeed innovatively to provide wrap‐around support to children and families with a range of different needs. There is a need for research and evaluation to keep up to date and play a role in developing new models of multi‐agency working for the twenty first century.
ACCOUNTABILITY. As schools and other organisations develop new and more integrated ways of
working together, the challenge will be to ensure that accountability systems respond to and support new ways of working. However, most available research and evaluation on accountability in the education system in England dates back to before changes to the inspection system, or is from other countries or other sectors, and is therefore limited in how useful it can be in helping to guide developments. This is a significant evidence gap.
ENGAGING PARENTS AND CARERS. Kendall et al (2008) noted that there is a lack of evidence on interventions to teach parents and carers how to help their pupils achieve in school, and how to target hard to reach parents.

116
8 References
Ball (2003). Class Strategies and the Education Market: The middle classes and social advantage. London: RoutledgeFalmer.
Beard, R., Pell, G., Shorrocks‐Taylor, D and Swinnerton, B. (2005) National evaluation of the National Literacy Strategy Further Literacy Support (FLS) programme: follow‐up study 2003–04. http://www.standards.dfes.gov.uk/primary/features/resources/literacy/nls_0405fls_report.doc
Black, P. and Wiliam, D. (1998) Inside the Black Box: Raising standards through classroom assessment. London: King’s College.
Blanden, J. and Gregg, P. (2004) Family income and educational attainment: a review of approaches and evidence for Britain. Oxford Review of Economic Policy, 20 (2). pp. 245‐263.
Blanden, J. Hansen, K. & Machin, S. (2008). The GDP cost of the lost earning potential of adults who grew up in poverty. Joseph Rowntree Foundation. http://www.jrf.org.uk/bookshop/eBooks/2300‐poverty‐employment‐earnings.pdf
Blatchford, P., Martin, C., Moriarty, V., Bassett, P. & Goldstein, H. (2002). Pupil adult ratio differences and educational progress over Reception and Key Stage 1. DfES Research Report 335. http://www.dcsf.gov.uk/research/data/uploadfiles/RR335.pdf
Blatchford, P., Bassett, P., Brown, P., Martin, C., and Russell, A (2004) The effects of class size on attainment and classroom processes in English Primary Schools (Years 4 to 6) 2000‐2003. DfES Research Brief RBX13‐04. http://www.dcsf.gov.uk/research/data/uploadfiles/RBX13‐04.pdf
Blenkinsop, S., McCrone, M., Morris, M. and Wade, P. (2006) How do young people make choices at age 14 and 16? DfES Research Report 773. http://www.dcsf.gov.uk/research/data/uploadfiles/RR773.pdf
Boaler (1997) Setting, Social Class and Survival of the Quickest. British Educational Research Journal. 23 (5) 575‐595.
Bourdieu, P. (1986) The forms of capital, in: J.G. Richardson (ed.) Handbook for Theory and Research for the Sociology of Education, pp 241 – 258
Brooks, G. (2002) What works for children with literacy difficulties? Effectiveness of intervention schemes. DfES Research Report 380. http://www.dcsf.gov.uk/research/data/uploadfiles/RR380.pdf
Brown, E., Kendall, L., Teeman, D. and Ridley, K. (2004) Evaluation of Excellence in Cities Primary Extension: A report of the transition strand study. Slough: NFER. http://www.nfer.ac.uk/publications/other‐publications/downloadable‐reports/pdf_docs/transitionreportfinal.PDF
Burgess, S., Johnston, R., Key, T., Propper, C. and Wilson, D. (2007) The Formation of School Peer Groups: Pupils' Transition from Primary to Secondary School in England. CMPO Working Paper 07/172. University of Bristol.
Burroughs‐Lange, S. (2006) Evaluation of Reading Recovery in London Schools: Every Child a Reader 2005‐2006. London: Institute of Education. http://www.everychildareader.org/pubs/ECAR_London_Evaluation_Report.pdf

117
Cabinet Office (2008) Getting on, getting ahead. A discussion paper: analysing the trends and drivers of social mobility. http://www.cabinetoffice.gov.uk/media/66447/gettingon.pdf
Carneiro, P and Heckman, J. (2003) ‘Human Capital Policy’. IZA DP No. 821 (July). Published in: J. Heckman and A. Krueger, Inequality in America: What Role for Human Capital Policy?, MIT Press, 2003
Carneiro, P., Crawford, C. and Goodman, A. (2007) The Impact of Early Cognitive and Non‐Cognitive Skills on Later Outcomes. Centre for the Economics of Education. http://cee.lse.ac.uk/cee%20dps/ceedp92.pdf
Cassen and Kingdon (2007) Tackling Low Educational Achievement. Joseph Rowntree Foundation report. London: LSE. http://www.jrf.org.uk/bookshop/eBooks/2063‐education‐schools‐achievement.pdf
Charles, M., Marsh, A. Milne, A., Morris, C., Scott, E. and Shamsan, Y. (2007) Secondary School Curriculum and Staffing Survey 2007. DCSF Research Report RR026 http://www.dcsf.gov.uk/research/data/uploadfiles/DCSF‐RR026.pdf
Clark and Akerman (2006) Social Inclusion and Reading: An Exploration. London: National Literacy Trust. http://www.literacytrust.org.uk/research/SocInc.pdf
Coe, R., Jones, K., Searle, J., Kokotsaki, D., Mohd Kosnin, A. & Skinner P. (2008). Evidence on the effects of selective educational systems. A report for the Sutton Trust. CEM Centre, Durham University. http://www.cemcentre.org/documents/News/Sutton%20Trust%20full%20report%20final.pdf
Cohen (2000). Equitable Classrooms in a Changing Society. In Hallinan (ed.) Handbook of the Sociology of Education, New York: Kluwer Academic/Plenum Publishers.
Cowen, G. and Burgess, M. (2007) Evaluation of the Key Stage 4 Engagement Programme: Key Messages from the First Annual Report. http://www.qca.org.uk/libraryAssets/media/rpt‐KS4EP_Annual_Report_key_messages_(3).pdf
CPAG (2000) Health and Poverty. February 2000. http://www.cpag.org.uk/
Cummings, C., Dyson, D., Muijs, D., Papps, I., Pearson, D., Raffo, C., Tiplady, L., Todd, L. and Crowther, D. (2007) Evaluation of the Full Service Extended Schools Initiative: Final Report. DfES Research Report 852. http://www.dcsf.gov.uk/research/data/uploadfiles/RR852.pdf
Davies, B. (2005) The challenge of leading schools in coastal communities. NCSL. http://www.ncsl.org.uk/media‐A76‐90‐randd‐coastal‐thinkpiece‐brent‐davies.pdf
Davies, L., Williams, C., Yamashita, H. and Ko Man‐Hing. A (2006) Inspiring Schools: Impact and Outcomes. Carnegie Young People Initiative/Esmee Fairbairn Foundation. http://www.esmeefairbairn.org.uk/pdf/InspiringSchools_P11.pdf
Day, C., Sammons, P., Hopkins, D., Harris, A., Leithwood, K., Gu, Q., Penlington, C., Mehta, P. and Kington, A. (2007) The Impact of School Leadership on Pupil Outcomes: interim report. DCSF Research Report RR018 http://www.dcsf.gov.uk/research/data/uploadfiles/DCSF‐RR018.pdf
DCSF (2008) The Composition of Schools in England. Statistical Bulletin http://www.dcsf.gov.uk/rsgateway/DB/SBU/b000796/TheCompositionOfSchoolsInEnglandFinal.pdf
118
Dean, C., Dyson, A., Gallannaugh, F., Howes, C and Raffo, C. (2007) Schools governors and disadvantage. York: Joseph Rowntree Foundation. http://www.jrf.org.uk/bookshop/eBooks/1994‐schools‐governors‐disadvantage.pdf
DEFRA (2004) The Rural Strategy 2004. http://www.defra.gov.uk/rural/strategy/default.htm
Demie, F. (2002) Pupil mobility and educational achievement in schools: an empirical analysis. Educational Research, 44:2, pp. 197‐215
Desforges and Abouchaar (2003) The Impact of Parental Involvement, Parental Support and Family Education on Pupil Achievements and Adjustment: Literature Review. DfES Research Report 443 http://www.dcsf.gov.uk/research/data/uploadfiles/RR433.pdf
DfES (2003) Children & Young People Survey.
DfES (2004) Variations in Pupil Progress 2003. Statistical Bulletin. http://www.dcsf.gov.uk/rsgateway/DB/SBU/b000481/BUL02‐2004textv1.pdf
DfES (2006) Ethnicity and Education: the Evidence on Minority Ethnic Pupils aged 5‐16. http://www.dcsf.gov.uk/research/data/uploadfiles/0208‐2006DOM‐EN.pdf
DfES (2007) Gender and Education: The evidence on pupils in England. London: DfES. http://www.dcsf.gov.uk/research/data/uploadfiles/RTP01‐07.pdf
Doddington, C., Flutter, J., Bearne, E. and Demetriou, H. (2001) Sustaining Pupils’ Progress at Year 3: Research Report, Cambridge: University of Cambridge Faculty of Education
Dowker, A. (2004) What works for children with mathematical difficulties? DfES Research Report 554. http://www.dcsf.gov.uk/research/data/uploadfiles/RR554.pdf
Dunne and Gazeley (2008) Teachers, social class and underachievement. British Journal of Sociology of Education, 29:5, 451‐463
Dunne, M., Humphreys, S., Sebba, J., Dyson, A., Gallannaugh, F. and Muijs, D. (2007) Effective Teaching and Learning for Pupils in Low Attaining Groups. DCSF Research Report RR011. http://www.dcsf.gov.uk/research/data/uploadfiles/DCSF‐RR011.pdf
Ellis, A. (2003) Barriers to Participation for Underrepresented Groups in School Governance. DfES Research Report 500. http://www.dcsf.gov.uk/research/data/uploadfiles/barrierstoparticipation.pdf
Ellis, E.S., Worthington., L. A. and Larkin, M.J. (1996) Research synthesis on effective teaching principles and the design of quality tools. Worthington National Center to Improve the Tools of Educators
Epstein, J. (2001) School, family and community partnerships: preparing educators and improving schools, Boulder, CO: Westview Press
ERIC (1996) Affective and Social Benefits of Small‐Scale Schooling. ERIC Digest ED401088 1996‐12‐00
ERIC (1999) Current Literature on Small Schools. ERIC Digest ED425049 1999‐01‐00
ERIC (2000) Research about School Size and School Performance in Impoverished Communities. ERIC Digest ED448968 2000‐12‐00.

119
Evangelou, M., Taggart, B., Sylva, K., Melhuish, E., Sammons, P. and Siraj‐Blatchford, I. (2008) What makes a successful transition from primary to secondary school? DCSF Research Report 019. http://www.dcsf.gov.uk/research/data/uploadfiles/DCSF‐RR019.pdf
Feinstein, L. (2003) ‘Inequality in the Early Cognitive Development of British Children in the 1970 Cohort’, Economica 70, pp. 73‐97
Feinstein, L. Duckworth, K, and Sabates, R (2004) A Model of the Intergenerational Transmission of Educational Success. Wider Benefits of Learning Research Report 10. London: Institute of Education. http://www.learningbenefits.net/Publications/ResReps/ResRep10.pdf
Feinstein and Sorhaindo (2006) What is the relationship between child nutrition and school outcomes? Centre for Research on the Wider Benefits of Learning. WBL Report 18. http://www.learningbenefits.net/Publications/ResReps/ResRep18.pdf
Feinstein, L. and Sabates, R. (2006) The prevalence of multiple deprivation for children in the UK: analysis of the Millennium Cohort and Longitudinal Survey of Young People in England. Report for HMT. Centre for Research on the Wider Benefits of Learning.
Feinstein, L., Sabates, R., Anderson, T.M., Sorhaindo, A. & Hammond, C. (2006). What are the effects of education on health? From Measuring the Effects of Education on Health and Civic Engagement: Proceedings of the Copenhagen Syposium, OECD http://www.oecd.org/dataoecd/15/18/37425753.pdf
Feinstein, L., Budge, D., Vorhaus, J. & Duckworth, K. (2008). The social and personal benefits of learning: A summary of key research findings. Centre for Research on the Wider Benefits of Learning. http://www.learningbenefits.net/Publications/FlagshipPublications.htm
Foskett, N., Dyke, M. and Maringe, F. (2004) The influence of the school in the decision to participate in learning post‐16. DfES Research Report 538. http://www.dcsf.gov.uk/research/data/uploadfiles/RR538.pdf
Galton, M., Gray, J. and Ruddock, J. (1999) Impact of School Transitions and Transfers on Pupil Progress and Attainment. DfES Research Report 131. http://www.dcsf.gov.uk/research/data/uploadfiles/RR131.doc
Galton, M., Gray, J., Ruddock, J., Berry, M., Demetriou, H., Edwards, J., Goalen, P., Hargreaves, L., Hussey, S., Pell, T., Schagen, I. and Charles, M. (2003) Transfer and Transitions in the Middle Years of Schooling (7‐14): Continuities and Discontinuities in Learning. DfES Research Report 443. http://www.dcsf.gov.uk/research/data/uploadfiles/RR443.pdf
Galton, Morrison and Pell (2000) ‘Transfer and transition in English schools: reviewing the evidence.’ In: International Journal of Educational Research, 33, pp341‐363.
George, A., Hansen, K., and Schoon, I. (2007). Child Development. In K. Hansen & H. Joshi (Eds.), Millennium Cohort Study. Second Survey. A User's Guide to Initial Findings. London: Institute of Education, Centre for Longitudinal Studies. http://image.guardian.co.uk/sys‐files/Society/documents/2007/06/11/MCS2.pdf
Gewirtz, Ball and Bowe (1995). Markets, Choice and Equity in Education. Open University, Buckingham.

120
Gibbons (2002) Neighbourhood Effects on Educational Achievement: Evidence from the Census and National Child Development Study. London: Centre for the Economics of Education, London School of Economics and Political Science. http://eprints.lse.ac.uk/19534/1/Neighbourhood_Effects_on_Educational_Achievement.pdf
Glanville, K. (1999) A comparison of post‐compulsory student choice and experience in Cornwall and London. Paper presented at the BERA conference, September 2‐5, 1999.
Goleman, D. (1996) Emotional Intelligence. London: Bloomsbury Publishing.
Gregg, P. and Macmillan, L. (2008) Intergenerational Mobility and Education in the Next Generation: Forecasting Intergenerational Mobility for Current Cohorts of Youths. Paper presented at the Intergenerational Mobility Conference, Monday, June 23rd 2008, LSE.
Gutman, L.M. and Akerman, R. (2008). Determinants of Aspirations. Centre for Research on the Wider Benefits of Learning Research Report 27. London. Institute of Education. http://www.learningbenefits.net/Publications/ResReps/ResRep27.pdf
Hallam, S. (2004) Homework: The evidence. London: Institute of Education Bedford Way Papers.
Hallam, S., Castle, F., Rogers, L., Creech, A., Rhamie, J. and Kokotsaki, D. (2006) Research and Evaluation of the Behaviour Improvement Programme. DfES Research Report 702. http://www.dcsf.gov.uk/research/data/uploadfiles/RR702.pdf
Hallam, S., Rhamie, J. and Shaw, J. (2008) Evaluation of the Primary Behaviour and Attendance Pilot. DfES Research Report 717. http://www.dcsf.gov.uk/research/data/uploadfiles/RR717.pdf
Hallam, S. and Ireson, J. (2006) Secondary school pupils’ preferences for different types of structured grouping practices. British Educational Research Journal, volume 32, number 4.
Hallam, S. and Ireson, J. (2007) Secondary school pupils' satisfaction with their ability grouping placements’, British Educational Research Journal, February 2007, Vol. 33 No. 1, pp27‐45.
Halsey, K., Gulliver, C., Johnson, A., Martin, K. and Kinder, K. (2006) Evaluation of Behaviour and Education Support Teams. DfES Research Report 706 http://www.dcsf.gov.uk/research/data/uploadfiles/RR706.pdf
Halsey, K., Murfield, J., Harland, J. and Lord, P. (2007) The voice of young people: an engine for improvement. National Foundation for Educational Research. http://www.cfbt.com/evidenceforeducation/PDF/91151_VoiceOfYoungPeople.pdf
Harris and Chapman (2002) Effective Leadership in Schools Facing Challenging Circumstances. Nottingham: NCSL. http://ncsl.org.uk/media‐416‐6b‐effective‐leadership‐in‐schools‐facing‐challenging‐circumstances‐summary.pdf
Harris and Goodall (2007) Engaging parents in raising achievement: Do parents know they matter? DCSF Research Report RW004 http://www.dcsf.gov.uk/research/data/uploadfiles/DCSF‐RW004.pdf
Hatcher and Le Gallais (2008) The work experience placements of secondary school students: widening horizons or reproducing social inequality? Paper presented at the British Educational Research Association Conference, 3‐6 September 2008.
Hirsch, D. (2007). Experiences of poverty and educational disadvantage. Joseph Rowntree Foundation. http://www.jrf.org.uk/knowledge/findings/socialpolicy/pdf/2123.pdf

121
Hirsch, D. (2008). Estimating the costs of child poverty. Joseph Rowntree Foundation. http://www.jrf.org.uk/knowledge/findings/socialpolicy/2313.asp
HM Treasury (2008). Ending child poverty: everybody's business http://www.hm‐treasury.gov.uk/d/bud08_childpoverty_1310.pdf
Ho Sui‐Chu, E. and Willms, J. D. (1996). "Effects of parental involvement on eighth‐grade achievement." Sociology of Education 69(2): 126 ‐ 141.
Hobbs (2003) Understanding socioeconomic group differences in educational achievement: a literature review. Background paper for the Department for Education and Skills/HM Treasury seminar on child poverty and education outcomes, 24 November 2003.
Hobbs, G. and Vignoles, A. (2007) Is free school meal status a valid proxy for socioeconomic status (in schools research)? Centre for the Economics of Education. http://cee.lse.ac.uk/cee%20dps/ceedp84.pdf
Hobcraft, J. (1998). Intergenerational and Life‐Course Transmission of Social Exclusion: Influences of Child Poverty, Family Disruption, and Contact with the Police. CASEpaper 15, London School of Economics: ESRC Centre for the Analysis of Social Exclusion.
Hobcraft., J. (2000) The Roles of Schooling and Educational Qualifications in the Emergence of Adult Social Exclusion. CASEpaper 43, Centre for Analysis of Social Exclusion, LSE.
Hoggart, L., Mackinnon, K. Ray, K., Taylor, R., Vegeris, S and Parsons, C. (2008) London Student Pledge Evaluation. DCSF Research Report RW074 http://www.dcsf.gov.uk/research/data/uploadfiles/DCSF‐RW074.pdf
Holmlund, H., McNally, S. and Viarengo, M. (2008) Impact of School Resources on Attainment at Key Stage 2. DCSF Research Report RR043 http://www.dcsf.gov.uk/research/data/uploadfiles/DCSF‐RR043.pdf
Hudson, A. (2007) The voice, role and participation of children and young people: summary of existing research. General Teaching Council for England. http://www.gtce.org.uk/shared/contentlibs/126815/211152/Pupil_voice_research.pdf
Humphrey, N., Kalambouka, A., Bolton, J., Lendrum, A., Wigelsworth, M., Lennie, C. and Farrell, P. (2008) Primary Social and Emotional Aspects of Learning (SEAL): Evaluation of Small Group Work. DCSF Research Report DCSF‐RR064. http://www.dcsf.gov.uk/research/data/uploadfiles/DCSF‐RR064.pdf
Ireson and Hallam (2001) Ability Grouping in Education. London: Sage Publications
Jenkins, A., Levačić, R. and Vignoles, A. (2007) Estimating the Relationship between School Resources and Pupil Attainment at GCSE. DfES Research Report 727 http://www.dcsf.gov.uk/research/data/uploadfiles/RR727.pdf
Jones, E. & Schoon, I. (2008) Child behaviour and cognitive development. In K. Hansen & H. Joshi (Eds.), Millennium Cohort Study. Third Survey. A User's Guide to Initial Findings. London: Institute of Education, Centre for Longitudinal Studies. http://www.cls.ioe.ac.uk/core/documents/download.asp?id=1083&log_sta t=1
JRF (2008) The Poverty Site: statistics on low birth weight. http://www.poverty.org.uk/index.htm

122
Kempson (1996). Life on a Low Income. York: Joseph Rowntree Foundation. http://www.jrf.org.uk/knowledge/findings/socialpolicy/sp97.asp
Kendall, L., O’Donnell, L., Golden, S., Ridley, K., Machin, S., Rutt, S., McNally, S., Schagen, I., Meghir, C., Stoney, S., Morris, M., West, A. and Noden, P. (2005) Excellence in Cities: The National Evaluation of a Policy to Raise Standards in Urban Schools 2000‐2003. DfES Research Report 675A. http://www.dcsf.gov.uk/research/data/uploadfiles/RR675A.pdf
Kendall, S., Straw, S., Jones, M., Springate, I. and Grayson, H. (2008) Narrowing the Gap in Outcomes for Vulnerable Groups. Slough: NFER
Leithwood, K., Day, C., Sammons, P., Harris, A., & Hopkins, D. (2006) Seven strong claims about successful school leadership. School Leadership & Management, Volume 28, Issue 1 February 2008, pages 27 ‐ 42
Levačić, R., Jenkins, A., Vignoles, A., Steele, F. and Allen, R. (2006) Estimating the Relationship Between School Resources and Pupil Attainment at Key Stage 3. DfES Research Report 679. http://www.dcsf.gov.uk/research/data/uploadfiles/RR679.pdf
Lindsay, G., Pather, S.. & Strand, S. (2006). Special Educational Needs and Ethnicity: Issues of Over‐Representation and Under‐Representation. DfES Research Report 757 http://www.dcsf.gov.uk/research/data/uploadfiles/RR757.pdf
London Councils (2007) Smarter Funding for Schools with Deprived Pupils. http://www.londoncouncils.gov.uk/London%20Councils/Schoolsfundingdeprivedpupilsfinal.pdf
Lord and Jones (2006) Pupils’ Experiences and Perspectives of the National Curriculum and Assessment: Final Report for the Research Review. http://www.nfer.ac.uk/publications/pdfs/downloadable/NCAe‐report.pdf
Lupton, R. (2006). How does place affect education? London, Institute for Public Policy Research.
Macbeath, J. (1993) Learning for yourself: Supported study in Strathclyde schools. Glasgow: University of Strathclyde.
McCrone, T., Morris, M. and Walker, M. (2005) Pupil Choices at Key Stage 3 – Literature review. Slough: NFER http://www.dcsf.gov.uk/research/data/uploadfiles/RW68.pdf
Mongon, D. and Chapman, C. (2008) Successful leadership for promoting the achievement of white working class pupils. University of Manchester/NUT and NCSL http://www.ncsl.org.uk/successful‐leadership‐for‐promoting‐full‐report‐2.pdf
Moon, S., Lilley, R., Morgan, S., Gray, S. and Krechowiecka, I. (2004). A Systematic Review of Recent Research (1988‐2003) into the Impact of Careers Education and Guidance on Transitions from Key Stage 3 to Key Stage 4. In: Research Evidence in Education Library.
Moon, S. et al. (2005). A Systematic Review of Recent Research (1988‐2004) into the Impact of Careers Education and Guidance during Key Stage 4 on Young People’ Transitions into Post16 Opportunities. In: Research Evidence in Education Library.
Morris, M., Lines, A. and Golden, S. (1999). The Impact of Careers Education and Guidance on Young People in Years 9 and 10: a Follow Up Study (RD20). Sheffield: DfEE.

123
Mortimore and Blackstone (1982). Disadvantage and Education. London: SSRC/DHSS Studies in Deprivation and Disadvantage 4, Heinemann.
Mortimore, P., Sammons, P., Stoll, L., Lewis, D. and Ecob, R. (1988). The effects of school membership on pupils’ educational outcomes, Research Papers in Education, 3 (1): 3‐26
Muijs, D., Harris, A., Chapman, C., Stoll, L. and Russ, J. (2004) ‘Improving schools in socioeconomically disadvantaged areas – a review of research evidence’, School Effectiveness and School Improvement, Vol. 15, No. 2, pp. 149–75
Myers, K. and Paige, A. (2006) London Challenge: attempting to engage the system in system‐wide reform. Presentation at the 19th International Congress for School Effectiveness and Improvement, Fort Lauderdale, Florida, 3rd – 6th January, 2006.
Nechyba, T., Mcewan, P. J. and Older‐Aguilar, D. (1999). The impact of family and community resource on student outcomes: An assessment of the international literature with implications for New Zealand.
NFER (2007) National Evaluation of Excellence in Cities: 2002‐2006. DCSF Research Report RR017. http://www.dcsf.gov.uk/research/data/uploadfiles/DCSF‐RR017.pdf
O’Donnell et al. (2006) Education Outside the Classroom: An Assessment of Activity and Practice in Schools and Local Authorities. DfES Research Report 803. http://www.dcsf.gov.uk/research/data/uploadfiles/RR803.pdf
ODPM (2004) The Impact of Overcrowding on Health and Education: A Review of the Evidence and Literature. Research Summary 210. http://www.communities.gov.uk/documents/housing/pdf/140627.pdf
OECD (2000) Programme for International Student Assessment (PISA)
Ofcom (2007) Children and the Internet.
Ofsted (1995) Homework in primary and secondary schools. London: HMSO
Ofsted (2000) Small schools: how well are they doing? A report by OFSTED based on the data from inspections and national test results. London: Ofsted
Ofsted (2002). Managing pupil mobility. HMI 403.
Ofsted (2004) The Key Stage 3 Strategy: Evaluation of the third year. London: Ofsted
Ofsted (2005a) Primary National Strategy: An evaluation of its impact in primary schools 2004/05. London: Ofsted
Ofsted (2005b) The Secondary National Strategy: An evaluation of the fifth year. London: Ofsted
Ofsted (2006a) Extended services in schools and children's centres. London: Ofsted
Ofsted (2006b) Improvements in London Schools 2000‐2006. London: Ofsted.
Ofsted (2007) The Annual Report of Her Majesty's Chief Inspector 2006/07 HMI 20070035
Ofsted (2008a) Learning Outside the Classroom: How far should you go? London: Ofsted
124
Ofsted (2008b) The deployment, training and development of the wider school workforce. London: Ofsted
Okpala, C. O., Okpala, A. O. and Smith, F. E. (2001). "Parental involvement, instructional expenditures, family socioeconomic attributes, and student achievement." Journal of Educational Research 95 (2): 110‐115.
Payne, J. (2003) Choice at the end of compulsory schooling: a research review. DfES Research Report 414. http://www.dcsf.gov.uk/research/data/uploadfiles/RR414.pdf
Peters, M., Seeds, K., Goldstein, A. and Coleman, N. (2008) Parental Involvement in their Children’s Education. DCSF Research Report RR034. http://www.dcsf.gov.uk/research/data/uploadfiles/DCSF‐RR034.pdf
Peters, M., Carpenter, H., Edwards, G and Coleman, N. (2009) Cost of Schooling 2007. DCSF Research Report RR060. http://www.dcsf.gov.uk/research/data/uploadfiles/DCSF‐RR0601.pdf
PISA (2006) Science Competencies for Tomorrow’s World Volume 1: Analysis, Organisation for Economic Co‐Operation and Development, 2007
Platt, K. (2005). Migration and Social Mobility. Joseph Rowntree Foundation. http://www.jrf.org.uk/bookshop/eBooks/1861348223.pdf
PriceWaterhouseCoopers (2007a) Academies evaluation – Fourth Annual Report. DCSF Research Report RW005. http://www.dcsf.gov.uk/research/data/uploadfiles/DCSF‐RW005.pdf
PriceWaterhouseCoopers (2007b) Evaluation of Building Schools for the Future – First Annual Report. London: DCSF http://www.teachernet.gov.uk/_doc/12318/BSF%20Final%20Report%20December.pdf
PriceWaterhouseCoopers (2008) Evaluation of Building Schools for the Future – Second Annual Report. London: DCSF http://www.teachernet.gov.uk/_doc/13240/2ndannualreport.pdf
Putnam, R.D. (1995) Bowling Alone: America's Declining Social Capital. Journal of Democracy, 6 (65‐78)
Raffaele, L.M., and Knoff, H.M. (1999). Improving home‐school collaboration with disadvantaged families: Organisational principles, perspectives, and approaches, School Psychology Review, 28 (3), 448‐466.
Raffo, C., Dyson, A., Gunter, H., Hall, D., Jones, L. and Kalambouka, A. (2007) Education and Poverty: a critical review of theory, policy and practice. Joseph Rowntree Foundation. http://www.jrf.org.uk/bookshop/eBooks/2028‐education‐poverty‐theory.pdf
Reay, D. (2006) The zombie stalking English schools: social class and educational inequality. British Journal of Educational Studies, 54:3, 288‐307.
Ridley, K., Knight, S., Scott, E., Benton, T. and Woodthorpe, A. (2005) London Challenge: Survey of Pupils and Teachers 2005. DfES Research Report 718. http://www.dcsf.gov.uk/research/data/uploadfiles/RR718.pdf
Ruddock, G. and Sainsbury, M. (2008) A comparison of the English core primary curriculum to those of other high performing countries. DCSF Research Report RW048 http://www.dcsf.gov.uk/research/data/uploadfiles/DCSF‐RW048v2.pdf
125
Rutter and Madge (1976). Cycles of disadvantage: a review of research. London: Heinemann.
Sammons, P. (2006). Embracing Diversity: New Challenges for School Improvement in a Global Learning Society. International Congress for School Effectiveness and Improvement Conference.
Sammons, P., Hillman, J. & Mortimore, P. (1995). Key Characteristics of Effective Schools: A review of school effectiveness research. London: Ofsted
Sammons, P., Thomas, S. & Mortimore, P. (1997). Forging links: effective schools and effective departments. London: Paul Chapman
Sammons, P., Taggart, B., Siraj‐Blatchford, I., Sylva, K., Melhuish, E., Barreau, S. and Manni, L. (2006) Effective Pre‐school and Primary Education 3‐11 Project (EPPE 3‐11) Summary Report: Variations in Teacher and Pupil Behaviours in Year 5 Classes. DfES Research Report 817. http://www.dcsf.gov.uk/research/data/uploadfiles/RR817.pdf
Sammons, P., Sylva, K., Melhuish, E., Siraj‐Blatchford, I., Taggart, B., Barreau, S. and Grabbe, Y. (2008) Effective Pre‐school and Primary Education 3‐11 Project (EPPE 3‐11) The Influence of School and Teaching Quality on Children’s Progress in Primary School. DCSF Research Report RR028 http://www.dcsf.gov.uk/research/data/uploadfiles/DCSF‐RR028.pdf
Sanders, D., White, G., Burge, B., Sharp, C., Eames, A., McEune, R. and Grayson, H. (2005). A Study of the Transition from the Foundation Stage to Key Stage 1. London: DfES
Schagen, S. and Kerr, D. (1999) Bridging the Gap? The National Curriculum and Progression from Primary to Secondary School. NFER.
Schoon, I., and Parsons, S. (2002). Teenage aspirations for future careers and occupational outcomes. Journal of Vocational Behavior, 60, 262‐288.
Scottish Executive (2006) Behaviour in Scottish Schools.
Sharp, C., Keys, W. & Benefield, P. (2001) Homework: A review of recent research. Slough: NFER
SHM (2005) Mindset profiles: segmenting decision‐makers at 14 and 16. Findings from exploratory research. London: SHM
Sibieta, L., Chowdry, H. and Muriel, A. (2008) Level playing field? The implications of school funding. CFBT. http://www.ifs.org.uk/docs/level_playing.pdf
Smith, C., Dakers, J., Dow, W., Head, G., Sutherland, M. and Irwin, R. (2005) A systematic review of what pupils, aged 11–16, believe impacts on their motivation to learn in the classroom. In: Research Evidence in Education Library. London: EPPI‐Centre, Social Science Research Unit, Institute of Education, University of London.
Smithers (2005) Teacher Turnover, Wastage and Destinations. DfES Research Report 553. http://www.dcsf.gov.uk/research/data/uploadfiles/RR553.pdf
Snow, Catherine E.; Burns, M. Susan; & Griffin, Peg (Eds.). (1998). Preventing reading difficulties in young children. Washington, DC: National Academy Press.
Social Exclusion Task Force (2008) Aspirations and Attainment among Young People in Deprived Communities. Analysis Report, November 2008. Cabinet Office.
126
Spielhofer, T., O’Donnell, L., Benton, T., l., Schagen, S and Schagen, I (2002) The impact of school size and single sex education on performance. LGA Research Report 33. Slough: NFER.
Strand, S. (2007) Minority Ethnic Pupils in the Longitudinal Study of Young People in England (LSYPE). DCSF Research Report RR002 http://www.dcsf.gov.uk/research/data/uploadfiles/DCSF‐RR002.pdf
Strand, S. (2008) Minority Ethnic Pupils in the Longitudinal Study of Young People in England: Extension Report on Performance in Public Examinations at Age 16. DCSF Research Report RR029 http://www.dcsf.gov.uk/research/data/uploadfiles/DCSF‐RR002.pdf
Sukhnandan, L. and Lee, B. (1998). Streaming, Setting and Grouping by Ability. Slough: NFER.
Sutton, L., Smith, N., Dearden, C. & Middleton, S. (2007.) A child’s‐eye view of social difference. Joseph Rowntree Foundation
Sylva, K., Melhuish, E., Sammons, P., Siraj‐Blatchford, I. & Taggart, B. (2004) The Effective Provision of Pre‐School Education (EPPE) Project: Final Report. http://www.dcsf.gov.uk/research/data/uploadfiles/SSU_FR_2004_01.pdf
Sylva, K., Melhuish, E., Sammons, P., Siraj‐Blatchford, I. & Taggart, B. (2007) Promoting Equality in the Early Years: Report to the Equalities Review.
Thrupp, M. and Lupton, R. (2006) Taking school contexts more seriously: the social justice challenge. British Journal of Educational Studies, 54:3, 308‐328.
Train, B., Nankivell, C., Shoolbred, M. and Denham, D. (2000) The value and impact of homework clubs in public libraries. Library and Information Commission Research Report 32.
UNICEF (2007) An overview of child well‐being in rich countries. UNICEF Innocenti Research Centre Report Card 7. http://www.unicef‐irc.org/publications/pdf/rc7_eng.pdf
UNICEF (2008) Statistics on low birthweight from ChildInfo. Available at http://www.childinfo.org/low_birthweight.html
Werner, Emmy E., & Smith, Ruth S. (1992). Overcoming the odds: High risk children from birth to adulthood. Ithaca, NY: Cornell University Press.
Whitby et al. (2008) Language Learning Provision at Key Stage 2: Findings from the 2007 Survey. DCSF Research Brief RBX‐09‐08. http://www.dcsf.gov.uk/research/data/uploadfiles/DCSF‐RBX‐09‐08.pdf
White, J. (2008). Institute of Education Conference paper on the 20th Anniversary of the National Curriculum.
Wilson, S., Benton, T., Scott, E. and Kendall, L. (2007) London Challenge: Survey of Pupils and Teachers 2006. DfES Research Report 823. http://www.dcsf.gov.uk/research/data/uploadfiles/RR823.pdf
Wilson, V. (2001) Does Small Really Make a Difference? A review of the literature on the effects of class size on teaching practice and pupils’ behaviour and attainment. SCRE.
Wiseman, J. and Dent, R. (2007) London Challenge: Survey of Parents and Carers 2006. DfES Research Report 822. http://www.dcsf.gov.uk/research/data/uploadfiles/RR822.pdf

127
Wood and Caulier‐Grice (2006) Fade or Flourish: How primary schools can build on children's early progress. London: Social Market Foundation. http://www.smf.co.uk/assets/files/publications/Fade%20or%20Flourish.pdf
128
You can download this publication at:
www.dcsf.gov.uk/research
For further information, please contact 0870 000 2288 or [email protected]
© Crown copyright 2009
Published by the Department for Children, Schools and Families
Extracts from this document may be reproduced for non‐commercial research, education or training purposes on the condition that the source is acknowledged. For any other use please contact HMSO licensing@cabinet‐office.x.gsi.gov.uk