Embed Size (px)
Citation preview
UNIVERSITE NICE SOPHIA ANTIPOLIS
DOCTORAL SCHOOL STICSCIENCES ET TECHNOLOGIES DE L’INFORMATION
ET DE LA COMMUNICATION
Memoire d’Habilitation a Diriger des Recherches
Defended byAdrien BOUSSEAU
Depicting shape, materials and lighting: observation,formulation and implementation of artistic principles
Inria Sophia Antipolisdefended on September 3rd, 2015
Jury :
Reviewers : Kavita BALA - Professor, Cornell UniversityMarie-Paule CANI - Professor, Institut Polytechnique de GrenobleAriel SHAMIR - Professor, Interdisciplinary Center Herzliya
President : George DRETTAKIS - Research Director, InriaExaminer : David SALESIN - Professor, University of Washington

2
Abstract
The appearance of a scene results from complex interactions between the geometry, materials and lights thatcompose that scene. While Computer Graphics algorithms are now capable of simulating these interactions, itcomes at the cost of tedious 3D modeling of a virtual scene, which only well-trained artists can do. In contrast,photographs allow the instantaneous capture of a scene, but shape, materials and lighting are difficult to manipulatedirectly in the image. Drawings can also suggest real or imaginary scenes with a few lines but creating convincingillustrations requires significant artistic skills.
The goal of my research is to facilitate the creation and manipulation of shape, materials and lighting indrawings and photographs, for laymen and professional artists alike. This document first presents my work oncomputer-assisted drawing where I proposed algorithms to automate the depiction of materials in line drawingsas well as to estimate a 3D model from design sketches. I also worked on user interfaces to assist beginners inlearning traditional drawing techniques. Through the development of these projects I have formalized a generalmethodology to observe how artists work, deduce artistic principles from these observations, and implement theseprinciples as algorithms.
In the second part of this document I present my work on relighting multiple photographs of a scene, for whichwe first need to estimate the materials and lighting that compose that scene. The main novelty of our approach is tocombine image analysis and lighting simulation in order to reason about the scene despite the lack of an accurate3D model.
1

2
Acknowledgments
While part of the exercise of defending an Habilitation is to provide an overview of one’s work, the researchpresented in this document should be understood as the result of a collaborative work with a number of students,postdocs and researchers. Each collaborator gave me new insights and new perspectives on the problems wetackled, and the overall methodology I advocate was greatly influenced by exchanges with others. It is also thanksto fruitful collaborations that I opened my research interests to new fields, such as geometry processing, computervision and HCI.
First of all, I would like to thank the great mentors who taught me to do research in the first place. Joelle Thollotwho always found the delicate balance between guidance and freedom to help me gain self-confidence during myPh.D; Francois Sillion who led the group where I did my Ph.D; David Salesin who hosted me at Adobe andguided me through my first SIGGRAPH submissions; Fredo Durand and Sylvain Paris who made me part of MITCSAIL for a few months; Maneesh Agrawala and Ravi Ramamoorthi who provided me with very complementaryguidance during my postdoc at UC Berkeley, and who had a significant influence on the methodology I describeto formalize and automate artistic principles; and finally George Drettakis who continuously advises and supportsme since I joined his group.
I am also grateful to Marie-Paule Cani, Kavita Bala and Ariel Shamir for accepting to review the presentmanuscript, and for taking the time to travel to my defense. Thanks also to David Salesin for attending both myPh.D defense and my Habilitation defense.
I am now trying to be a good advisor for the PhD students and postdocs I work with. Several of them madelarge contributions to the research presented here: Pierre-Yves Laffont, Sylvain Duchene, Emmanuel Iarussi,Jean-Dominique Favreau, Jorge Lopez-Moreno, Christian Richardt, Fumio Okura.
I also want to thank all my other recent collaborators: Emmanuelle Chapoulie, Pierre Benard, Pascal Barla,Cloud Shao, Alla Sheffer, Karan Singh, James P. O Shea, Stefan Popov, Theophanis Tsandilas, Adrian Jarabo,Belen Masia, Fabio Pellacini, Diego Gutierrez, Baoxuan Xu, William Chang, James McCrae, Kenneth Vanhoey,Florent Lafarge, Clement Riant, Gaurav Chaurasia, David Bommes, Wilmot Li, Lora Oehlberg, Wendy Mackay.Many thanks also to Sophie Honnorat for her every day support.
Finally, many thanks to my sisters and parents for their encouragements, and to Alex for her love and trust thatbalances my professional life with an equally fulfilling personal one.
3

4
Contents
1 Introduction 71.1 Computer-Assisted Drawing . . . . . . . . . . . . . . . . . . . . . . . . . . . . . . . . . . . . . 7
1.1.1 Context and Challenges . . . . . . . . . . . . . . . . . . . . . . . . . . . . . . . . . . . 71.1.2 Methodology and Contributions . . . . . . . . . . . . . . . . . . . . . . . . . . . . . . . 8
1.2 Multi-View Intrinsic Images and Relighting . . . . . . . . . . . . . . . . . . . . . . . . . . . . . 101.2.1 Context and Challenges . . . . . . . . . . . . . . . . . . . . . . . . . . . . . . . . . . . 101.2.2 Methodology and Contributions . . . . . . . . . . . . . . . . . . . . . . . . . . . . . . . 11
2 Computer-Assisted Drawing 132.1 Overview and Related Work . . . . . . . . . . . . . . . . . . . . . . . . . . . . . . . . . . . . . 13
2.1.1 Drawing Assistance . . . . . . . . . . . . . . . . . . . . . . . . . . . . . . . . . . . . . 132.1.2 Sketch-Based Modeling . . . . . . . . . . . . . . . . . . . . . . . . . . . . . . . . . . . 142.1.3 Material Depiction . . . . . . . . . . . . . . . . . . . . . . . . . . . . . . . . . . . . . . 162.1.4 Lighting Design . . . . . . . . . . . . . . . . . . . . . . . . . . . . . . . . . . . . . . . 17
2.2 Observing How Artists Work . . . . . . . . . . . . . . . . . . . . . . . . . . . . . . . . . . . . . 182.2.1 Observational Studies . . . . . . . . . . . . . . . . . . . . . . . . . . . . . . . . . . . . 182.2.2 Studying the Design Literature . . . . . . . . . . . . . . . . . . . . . . . . . . . . . . . . 19
2.3 Formulating Artistic Principles . . . . . . . . . . . . . . . . . . . . . . . . . . . . . . . . . . . . 202.3.1 Collecting Principles . . . . . . . . . . . . . . . . . . . . . . . . . . . . . . . . . . . . . 202.3.2 Conducting Perceptual Studies . . . . . . . . . . . . . . . . . . . . . . . . . . . . . . . . 23
2.4 Automating Artistic Principles . . . . . . . . . . . . . . . . . . . . . . . . . . . . . . . . . . . . 242.4.1 Direct Automation . . . . . . . . . . . . . . . . . . . . . . . . . . . . . . . . . . . . . . 242.4.2 Optimization . . . . . . . . . . . . . . . . . . . . . . . . . . . . . . . . . . . . . . . . . 27
2.5 Evaluation . . . . . . . . . . . . . . . . . . . . . . . . . . . . . . . . . . . . . . . . . . . . . . . 302.5.1 User Studies . . . . . . . . . . . . . . . . . . . . . . . . . . . . . . . . . . . . . . . . . 302.5.2 Comparisons to Ground Truth and Existing Imagery . . . . . . . . . . . . . . . . . . . . 34
3 Multi-View Intrinsic Images and Relighting 373.1 Overview and Related Work . . . . . . . . . . . . . . . . . . . . . . . . . . . . . . . . . . . . . 37
3.1.1 Inverse rendering and Relighting . . . . . . . . . . . . . . . . . . . . . . . . . . . . . . . 383.1.2 Intrinsic images . . . . . . . . . . . . . . . . . . . . . . . . . . . . . . . . . . . . . . . . 393.1.3 Shadow detection . . . . . . . . . . . . . . . . . . . . . . . . . . . . . . . . . . . . . . . 39
3.2 Image Formation Model . . . . . . . . . . . . . . . . . . . . . . . . . . . . . . . . . . . . . . . 393.3 Intrinsic Images under Fixed Lighting . . . . . . . . . . . . . . . . . . . . . . . . . . . . . . . . 403.4 Intrinsic Images under Varying Lighting . . . . . . . . . . . . . . . . . . . . . . . . . . . . . . . 423.5 Relighting Images . . . . . . . . . . . . . . . . . . . . . . . . . . . . . . . . . . . . . . . . . . . 44
4 Conclusion and Future Work 47
5

6 CONTENTS
References 49
Chapter 1
Introduction
The appearance of a scene results from complex interactions between the geometry, materials and lights thatcompose that scene. With the progress of Computer Graphics, rendering algorithms are now capable of efficientlyand accurately simulating these interactions to produce realistic images from a virtual description of a scene.However, creating a virtual scene is a tedious and time-consuming task as it involves modeling 3D objects andlights, positioning them in a 3D world, specifying material properties, adjusting camera position, all of whichnecessitates careful adjustment of numerous parameters through dedicated user interfaces. For these reasons, 3Drendering is reserved to a well-trained elite.
In contrast, photographs and drawings are much more accessible and as such remain very popular ways ofcreating images. People capture and share millions of photographs everyday, and children are able to representimaginary worlds through drawings before knowing how to write. However, photographs and drawings also havetheir limitations. A photograph captures the conflated interactions of light and matter, and modifying its contentafter capture often requires solving the inverse problem of recovering the geometry, materials and lights of thecaptured scene. Similarly, while anybody can draw abstract doodles, conveying the appearance of a scene througha few lines and brush strokes requires advanced artistic skills.
The long term goal of my research is to lift the restrictions of drawings and photographs in order to ease thecreation and manipulation of images for professional artists and laymen alike. Specifically, my work on computer-assisted drawing aims at assisting the drawing of shape, materials and lighting, as well as interpreting drawings toconvert them into 3D models. My work on photograph manipulation aims at recovering the material and lightinginformation of a scene in order to allow the independent editing of these two ingredients, for instance to visualizea scene at a different time than the time of capture. I next describe these two research directions in more detail.
1.1 Computer-Assisted DrawingMy work on computer-assisted drawing is primarily motivated by applications in product and graphic design,where sketches are an integral part of the creation process. While studying the work of professional artists, I alsoidentify techniques that can be automated or assisted to make them accessible to amateurs.
1.1.1 Context and ChallengesProduct design, from the inception of an idea to its realization as a 3D concept, is extensively guided byfreehand sketches. Sketching is visceral and quick, providing a direct connection between an idea and its visualrepresentation. However, while concept sketches facilitate viewer understanding of 3D shapes, they requirea mental leap to imagine the appearance of the drawn object, imbued with specific material properties and lighting.
7
8 CHAPTER 1. INTRODUCTION
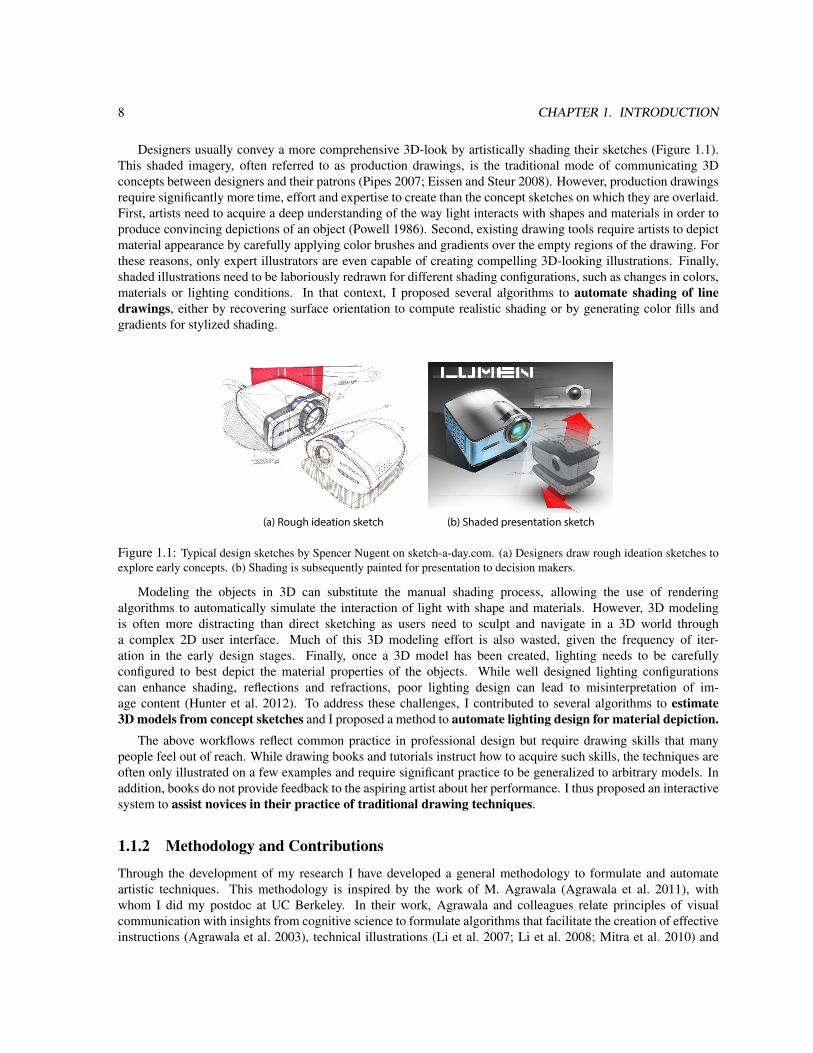
Designers usually convey a more comprehensive 3D-look by artistically shading their sketches (Figure 1.1).This shaded imagery, often referred to as production drawings, is the traditional mode of communicating 3Dconcepts between designers and their patrons (Pipes 2007; Eissen and Steur 2008). However, production drawingsrequire significantly more time, effort and expertise to create than the concept sketches on which they are overlaid.First, artists need to acquire a deep understanding of the way light interacts with shapes and materials in order toproduce convincing depictions of an object (Powell 1986). Second, existing drawing tools require artists to depictmaterial appearance by carefully applying color brushes and gradients over the empty regions of the drawing. Forthese reasons, only expert illustrators are even capable of creating compelling 3D-looking illustrations. Finally,shaded illustrations need to be laboriously redrawn for different shading configurations, such as changes in colors,materials or lighting conditions. In that context, I proposed several algorithms to automate shading of linedrawings, either by recovering surface orientation to compute realistic shading or by generating color fills andgradients for stylized shading.
(a) Rough ideation sketch (b) Shaded presentation sketch
Figure 1.1: Typical design sketches by Spencer Nugent on sketch-a-day.com. (a) Designers draw rough ideation sketches toexplore early concepts. (b) Shading is subsequently painted for presentation to decision makers.
Modeling the objects in 3D can substitute the manual shading process, allowing the use of renderingalgorithms to automatically simulate the interaction of light with shape and materials. However, 3D modelingis often more distracting than direct sketching as users need to sculpt and navigate in a 3D world througha complex 2D user interface. Much of this 3D modeling effort is also wasted, given the frequency of iter-ation in the early design stages. Finally, once a 3D model has been created, lighting needs to be carefullyconfigured to best depict the material properties of the objects. While well designed lighting configurationscan enhance shading, reflections and refractions, poor lighting design can lead to misinterpretation of im-age content (Hunter et al. 2012). To address these challenges, I contributed to several algorithms to estimate3D models from concept sketches and I proposed a method to automate lighting design for material depiction.
The above workflows reflect common practice in professional design but require drawing skills that manypeople feel out of reach. While drawing books and tutorials instruct how to acquire such skills, the techniques areoften only illustrated on a few examples and require significant practice to be generalized to arbitrary models. Inaddition, books do not provide feedback to the aspiring artist about her performance. I thus proposed an interactivesystem to assist novices in their practice of traditional drawing techniques.
1.1.2 Methodology and ContributionsThrough the development of my research I have developed a general methodology to formulate and automateartistic techniques. This methodology is inspired by the work of M. Agrawala (Agrawala et al. 2011), withwhom I did my postdoc at UC Berkeley. In their work, Agrawala and colleagues relate principles of visualcommunication with insights from cognitive science to formulate algorithms that facilitate the creation of effectiveinstructions (Agrawala et al. 2003), technical illustrations (Li et al. 2007; Li et al. 2008; Mitra et al. 2010) and
1.1. COMPUTER-ASSISTED DRAWING 9
maps (Agrawala and Stolte 2001; Grabler et al. 2008). We have extended this approach to encompass principlesof geometry, material and lighting depiction. The resulting methodology is composed of four main steps:
1. First, we observe the techniques of novice and professional artists, either through design books and tutorialsor by performing field studies and interviews.
2. The second step of our approach consists in distilling our observations in a coherent set of principles. Themain challenge in this task comes from the fact that design techniques are often described by different artistsin their own vocabulary and illustrated on specific examples. We formalize and generalize these techniquesby relating them to findings in other scientific fields. In particular, the way artists draw shape, material andlighting is strongly related to the way shape, material and lighting interact in reality – as studied in geometry,computer vision and rendering – and how we perceive these interactions – as studied in visual perception.
3. From the design principles, we then derive algorithms to facilitate the artistic tasks. To do so, we commonlyexpress the principles as energy terms in an optimization, balancing the sparse and often inaccurate userinputs with the automatic generation of virtual content.
4. Finally, we validate our results by comparing them to traditional illustrations or by running user studies toevaluate the effectiveness of our tools.
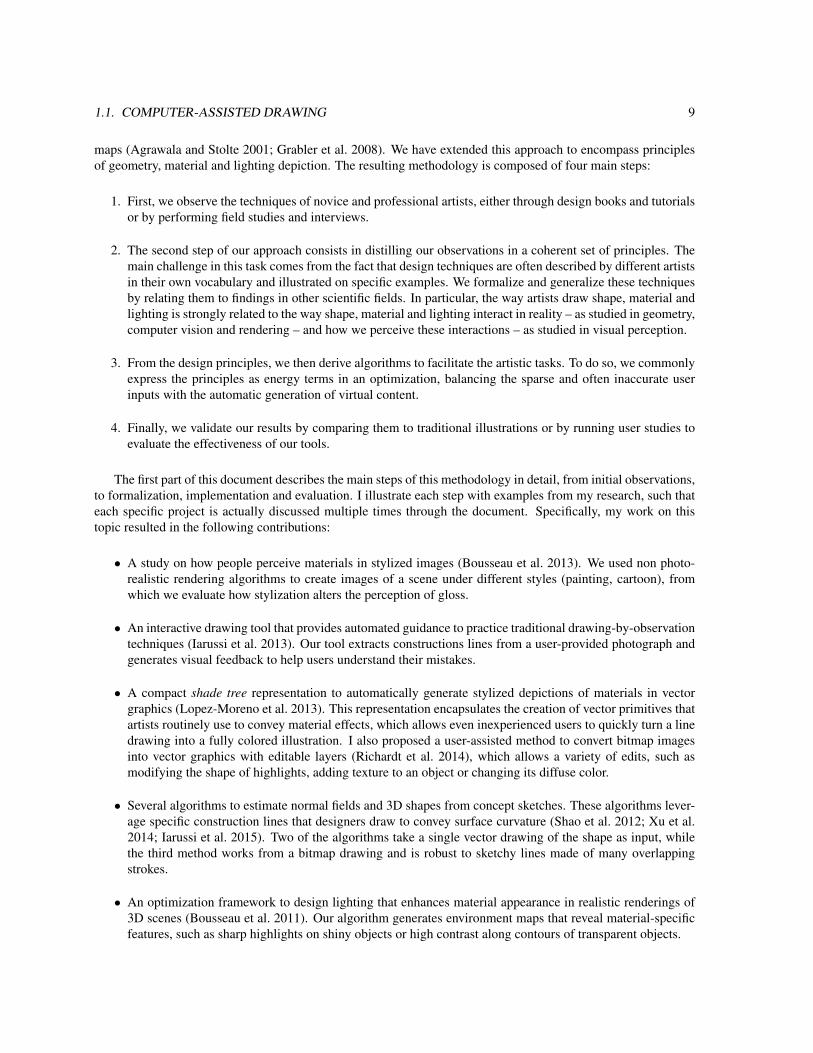
The first part of this document describes the main steps of this methodology in detail, from initial observations,to formalization, implementation and evaluation. I illustrate each step with examples from my research, such thateach specific project is actually discussed multiple times through the document. Specifically, my work on thistopic resulted in the following contributions:
• A study on how people perceive materials in stylized images (Bousseau et al. 2013). We used non photo-realistic rendering algorithms to create images of a scene under different styles (painting, cartoon), fromwhich we evaluate how stylization alters the perception of gloss.
• An interactive drawing tool that provides automated guidance to practice traditional drawing-by-observationtechniques (Iarussi et al. 2013). Our tool extracts constructions lines from a user-provided photograph andgenerates visual feedback to help users understand their mistakes.
• A compact shade tree representation to automatically generate stylized depictions of materials in vectorgraphics (Lopez-Moreno et al. 2013). This representation encapsulates the creation of vector primitives thatartists routinely use to convey material effects, which allows even inexperienced users to quickly turn a linedrawing into a fully colored illustration. I also proposed a user-assisted method to convert bitmap imagesinto vector graphics with editable layers (Richardt et al. 2014), which allows a variety of edits, such asmodifying the shape of highlights, adding texture to an object or changing its diffuse color.
• Several algorithms to estimate normal fields and 3D shapes from concept sketches. These algorithms lever-age specific construction lines that designers draw to convey surface curvature (Shao et al. 2012; Xu et al.2014; Iarussi et al. 2015). Two of the algorithms take a single vector drawing of the shape as input, whilethe third method works from a bitmap drawing and is robust to sketchy lines made of many overlappingstrokes.
• An optimization framework to design lighting that enhances material appearance in realistic renderings of3D scenes (Bousseau et al. 2011). Our algorithm generates environment maps that reveal material-specificfeatures, such as sharp highlights on shiny objects or high contrast along contours of transparent objects.
10 CHAPTER 1. INTRODUCTION
1.2 Multi-View Intrinsic Images and RelightingMy work on photograph manipulation also aims at allowing users to obtain the material and lighting they wishto convey in an image. However, in contrast to drawings where I leveraged artistic techniques to create plausiblematerial and lighting effects, photographs require the inversion of the image formation model in order to recoverthe geometry, material and lighting components that explain the captured image. I proposed several algorithms toperform this inversion in the context of image-based-rendering, where we take as input multiple images of a scene.
1.2.1 Context and ChallengesRecent progress on automatic multi-view 3D reconstruction (Snavely et al. 2006; Furukawa and Ponce 2010) andimage-based-rendering (Chaurasia et al. 2013) greatly facilitate the production of realistic virtual walkthroughsfrom a small number of photographs of a scene. However, while existing algorithms can render the scene fromnovel viewpoints, lighting remains fixed to the conditions at the time of capture. Fixed lighting is a majorlimitation of image-based rendering, preventing its use for traditional applications of image synthesis such asvideo games and special effects.
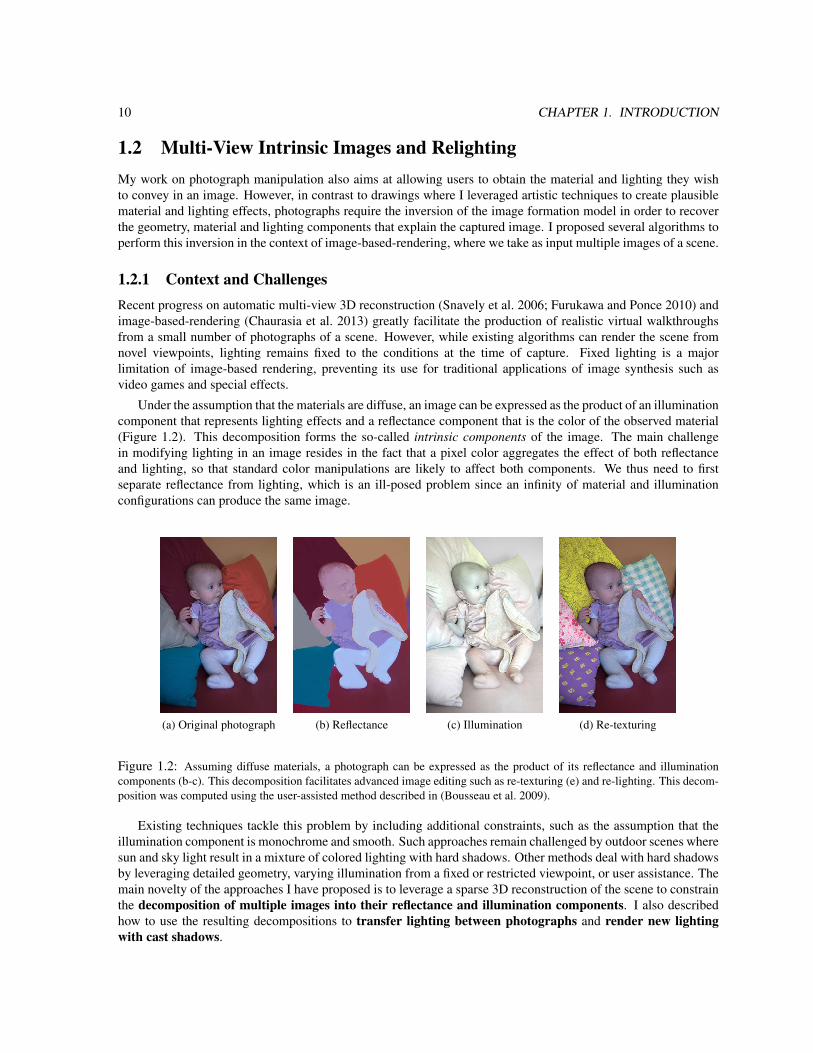
Under the assumption that the materials are diffuse, an image can be expressed as the product of an illuminationcomponent that represents lighting effects and a reflectance component that is the color of the observed material(Figure 1.2). This decomposition forms the so-called intrinsic components of the image. The main challengein modifying lighting in an image resides in the fact that a pixel color aggregates the effect of both reflectanceand lighting, so that standard color manipulations are likely to affect both components. We thus need to firstseparate reflectance from lighting, which is an ill-posed problem since an infinity of material and illuminationconfigurations can produce the same image.
(a) Original photograph (b) Reflectance (c) Illumination (d) Re-texturing
Figure 1.2: Assuming diffuse materials, a photograph can be expressed as the product of its reflectance and illuminationcomponents (b-c). This decomposition facilitates advanced image editing such as re-texturing (e) and re-lighting. This decom-position was computed using the user-assisted method described in (Bousseau et al. 2009).
Existing techniques tackle this problem by including additional constraints, such as the assumption that theillumination component is monochrome and smooth. Such approaches remain challenged by outdoor scenes wheresun and sky light result in a mixture of colored lighting with hard shadows. Other methods deal with hard shadowsby leveraging detailed geometry, varying illumination from a fixed or restricted viewpoint, or user assistance. Themain novelty of the approaches I have proposed is to leverage a sparse 3D reconstruction of the scene to constrainthe decomposition of multiple images into their reflectance and illumination components. I also describedhow to use the resulting decompositions to transfer lighting between photographs and render new lightingwith cast shadows.
1.2. MULTI-VIEW INTRINSIC IMAGES AND RELIGHTING 11
1.2.2 Methodology and ContributionsThe main idea behind our methods is to combine approximate geometric reconstruction with image processing,thus leveraging their respective strengths. We exploit the geometric reconstruction to compute lighting informa-tion for a sparse set of pixels, and use image-guided propagation and segmentation to decompose all pixels of thephotographs into their intrinsic components.
In this context, we proposed two alternative approaches that differ in the data they take as input:
• The first family of algorithms we proposed estimates lighting and reflectance in outdoor scenes from imagescaptured at the same time of day, i.e. under the same lighting condition (Laffont et al. 2013; Duchene et al.2015). We use the geometric reconstruction to compute smooth shading due to sky and inter-reflections,while we use image analysis and processing to locate accurate shadow boundaries.
• The second approach we proposed focuses on photocollections of well-known touristic landmarks for whichwe can easily collect multiple photographs under varying lighting conditions (Laffont et al. 2012). Thegeometric reconstruction provides us with sparse correspondences between images, on which we factor outthe varying lighting from the constant reflectance. We then propagate the lighting information to all pixelsusing image processing.
We demonstrate the benefits of our intrinsic decompositions for image relighting. In the first case, we ap-proximately reconstruct shadow casters which we use to render new shadows in the images. In the second case,we transfer illumination between images of the same scene taken from different viewpoints and under differentlighting conditions.

12 CHAPTER 1. INTRODUCTION
Chapter 2
Computer-Assisted Drawing
This chapter covers my research on computer-assisted drawing. I first provide a brief description of the maintools and algorithms I have proposed in order to position them with respect to related work. I then describe themain steps of the methodology that underpins my work: observation of artistic practice, formulation of artisticprinciples, implementation of these principles as algorithms and evaluation.
2.1 Overview and Related WorkI discuss in this section existing work that is most related to my research on assisting drawing for novices, onestimating 3D models from sketches and on depicting materials and lighting in stylized and realistic rendering. Irefer the interested reader to the individual papers for extended discussions.
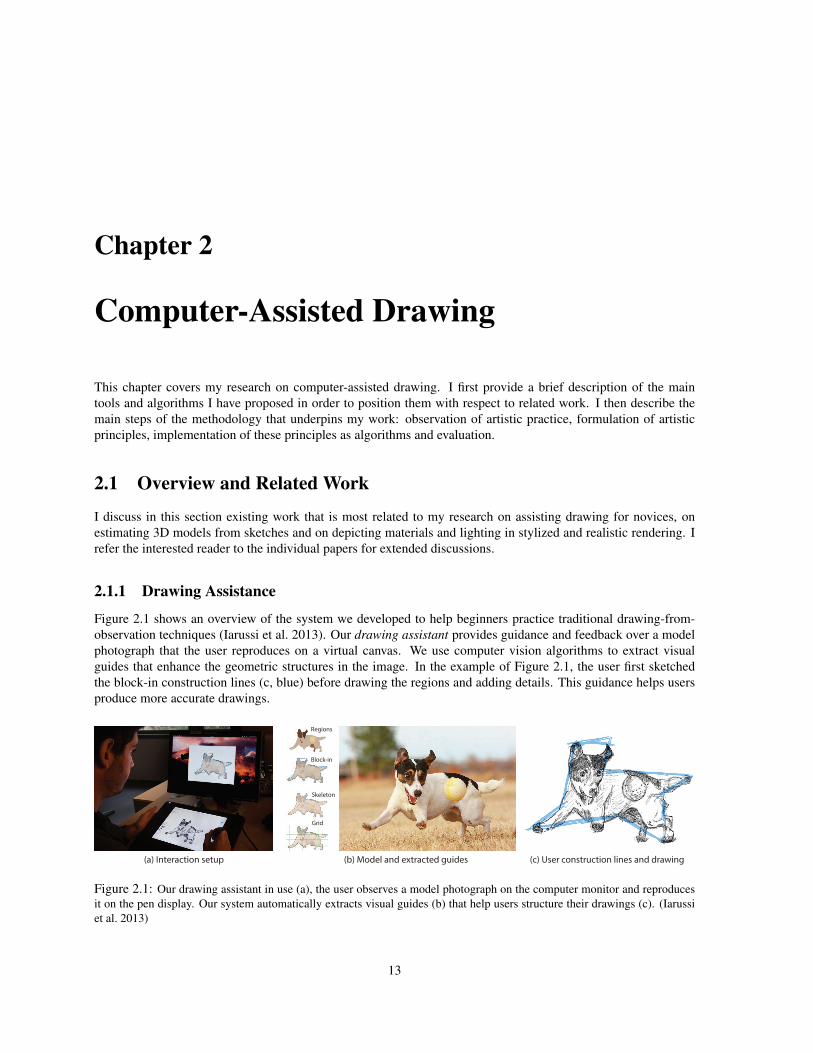
2.1.1 Drawing AssistanceFigure 2.1 shows an overview of the system we developed to help beginners practice traditional drawing-from-observation techniques (Iarussi et al. 2013). Our drawing assistant provides guidance and feedback over a modelphotograph that the user reproduces on a virtual canvas. We use computer vision algorithms to extract visualguides that enhance the geometric structures in the image. In the example of Figure 2.1, the user first sketchedthe block-in construction lines (c, blue) before drawing the regions and adding details. This guidance helps usersproduce more accurate drawings.
Regions
Block-in
Skeleton
Grid
(a) Interaction setup (b) Model and extracted guides (c) User construction lines and drawing
Figure 2.1: Our drawing assistant in use (a), the user observes a model photograph on the computer monitor and reproducesit on the pen display. Our system automatically extracts visual guides (b) that help users structure their drawings (c). (Iarussiet al. 2013)
13
14 CHAPTER 2. COMPUTER-ASSISTED DRAWING
Several existing systems assist the process of drawing by displaying guidance on the drawing surface usingprojectors (Flagg and Rehg 2006; Laviole and Hachet 2012) or pen tablets (Lee et al. 2011). All these methodsare reminiscent of the traditional “paint-by-number” and “connect the dots” drawing books that guide people inplacing individual strokes until completing complex artworks. While these approaches can give people confidencein their ability to draw, they do not help them observe and understand the underlying shapes, relationships andproportions of the drawn models. In contrast, we designed our drawing assistant to offer guidance and feedbackon the model photograph, which encourages users to observe the subject they want to draw before reproducing iton the drawing surface.
A complex drawing can be easier to achieve if it is decomposed into a succession of simple steps. Sketch-Sketch Revolution (Fernquist et al. 2011) allows expert users of sketching software to generate step-by-step tuto-rials for novice users. However, such tutorials illustrate drawing techniques on pre-recorded examples rather thanimages of the user’s choice. Closer to our work is the iCanDraw? system (Dixon et al. 2010) that assists usersin drawing faces thanks to face recognition algorithms. We draw inspiration from this approach, incorporatingsome of its design principles. However, our drawing assistant implements a different set of guides to draw arbi-trary models rather than faces. We also provide visual feedback that highlights alignments and proportions on themodel photograph, helping users to see and correct the relationships between different parts of a shape.
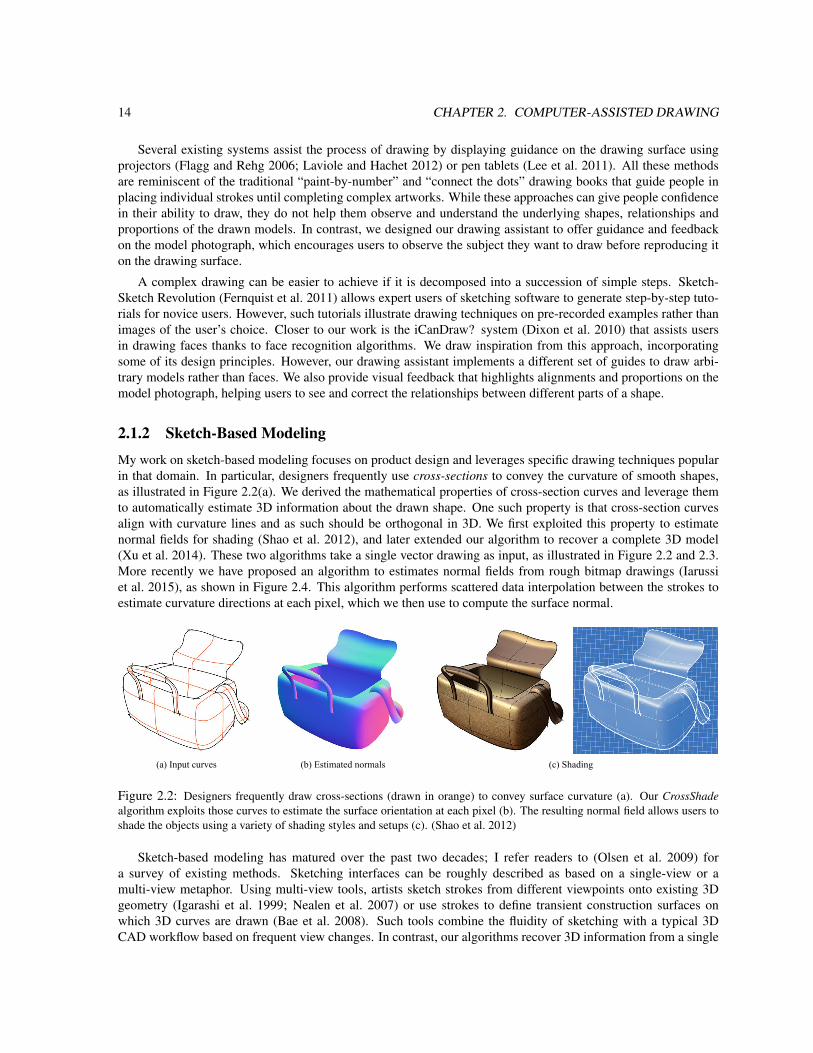
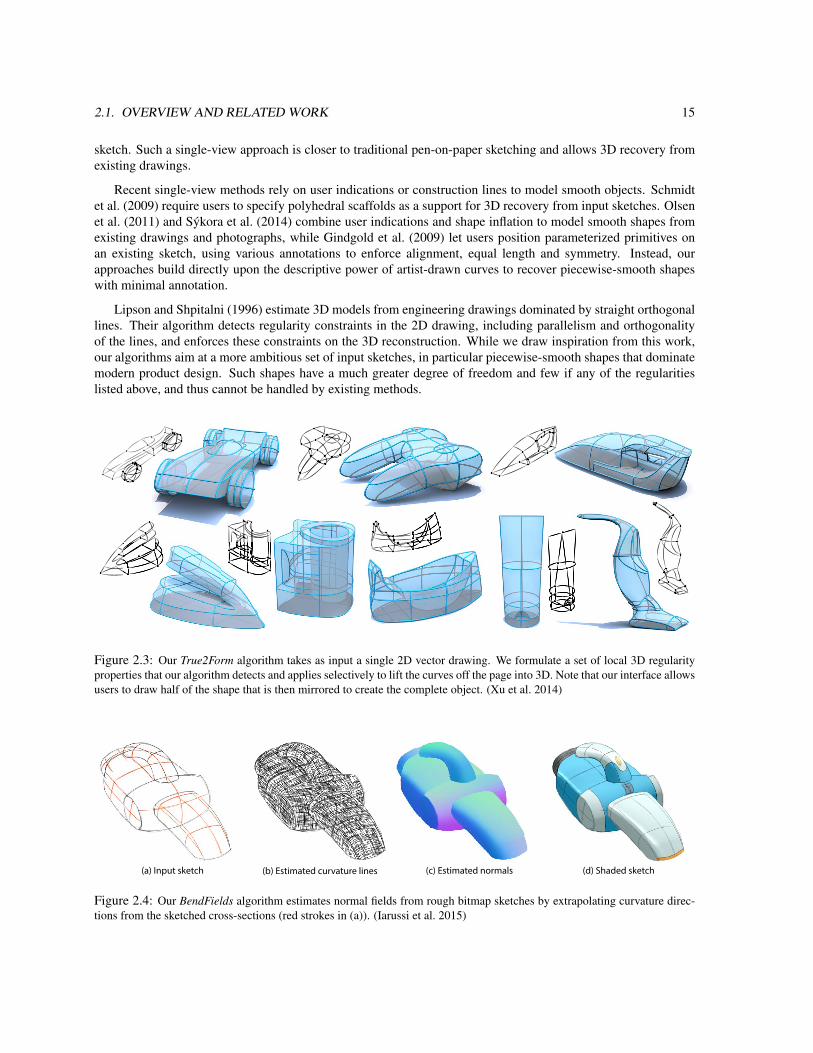
2.1.2 Sketch-Based ModelingMy work on sketch-based modeling focuses on product design and leverages specific drawing techniques popularin that domain. In particular, designers frequently use cross-sections to convey the curvature of smooth shapes,as illustrated in Figure 2.2(a). We derived the mathematical properties of cross-section curves and leverage themto automatically estimate 3D information about the drawn shape. One such property is that cross-section curvesalign with curvature lines and as such should be orthogonal in 3D. We first exploited this property to estimatenormal fields for shading (Shao et al. 2012), and later extended our algorithm to recover a complete 3D model(Xu et al. 2014). These two algorithms take a single vector drawing as input, as illustrated in Figure 2.2 and 2.3.More recently we have proposed an algorithm to estimates normal fields from rough bitmap drawings (Iarussiet al. 2015), as shown in Figure 2.4. This algorithm performs scattered data interpolation between the strokes toestimate curvature directions at each pixel, which we then use to compute the surface normal.
(a) Input curves (b) Estimated normals (c) Shading
Figure 2.2: Designers frequently draw cross-sections (drawn in orange) to convey surface curvature (a). Our CrossShadealgorithm exploits those curves to estimate the surface orientation at each pixel (b). The resulting normal field allows users toshade the objects using a variety of shading styles and setups (c). (Shao et al. 2012)
Sketch-based modeling has matured over the past two decades; I refer readers to (Olsen et al. 2009) fora survey of existing methods. Sketching interfaces can be roughly described as based on a single-view or amulti-view metaphor. Using multi-view tools, artists sketch strokes from different viewpoints onto existing 3Dgeometry (Igarashi et al. 1999; Nealen et al. 2007) or use strokes to define transient construction surfaces onwhich 3D curves are drawn (Bae et al. 2008). Such tools combine the fluidity of sketching with a typical 3DCAD workflow based on frequent view changes. In contrast, our algorithms recover 3D information from a single
2.1. OVERVIEW AND RELATED WORK 15
sketch. Such a single-view approach is closer to traditional pen-on-paper sketching and allows 3D recovery fromexisting drawings.
Recent single-view methods rely on user indications or construction lines to model smooth objects. Schmidtet al. (2009) require users to specify polyhedral scaffolds as a support for 3D recovery from input sketches. Olsenet al. (2011) and Sykora et al. (2014) combine user indications and shape inflation to model smooth shapes fromexisting drawings and photographs, while Gindgold et al. (2009) let users position parameterized primitives onan existing sketch, using various annotations to enforce alignment, equal length and symmetry. Instead, ourapproaches build directly upon the descriptive power of artist-drawn curves to recover piecewise-smooth shapeswith minimal annotation.
Lipson and Shpitalni (1996) estimate 3D models from engineering drawings dominated by straight orthogonallines. Their algorithm detects regularity constraints in the 2D drawing, including parallelism and orthogonalityof the lines, and enforces these constraints on the 3D reconstruction. While we draw inspiration from this work,our algorithms aim at a more ambitious set of input sketches, in particular piecewise-smooth shapes that dominatemodern product design. Such shapes have a much greater degree of freedom and few if any of the regularitieslisted above, and thus cannot be handled by existing methods.
Figure 2.3: Our True2Form algorithm takes as input a single 2D vector drawing. We formulate a set of local 3D regularityproperties that our algorithm detects and applies selectively to lift the curves off the page into 3D. Note that our interface allowsusers to draw half of the shape that is then mirrored to create the complete object. (Xu et al. 2014)
(d) Shaded sketch(b) Estimated curvature lines(a) Input sketch (c) Estimated normals
Figure 2.4: Our BendFields algorithm estimates normal fields from rough bitmap sketches by extrapolating curvature direc-tions from the sketched cross-sections (red strokes in (a)). (Iarussi et al. 2015)
16 CHAPTER 2. COMPUTER-ASSISTED DRAWING
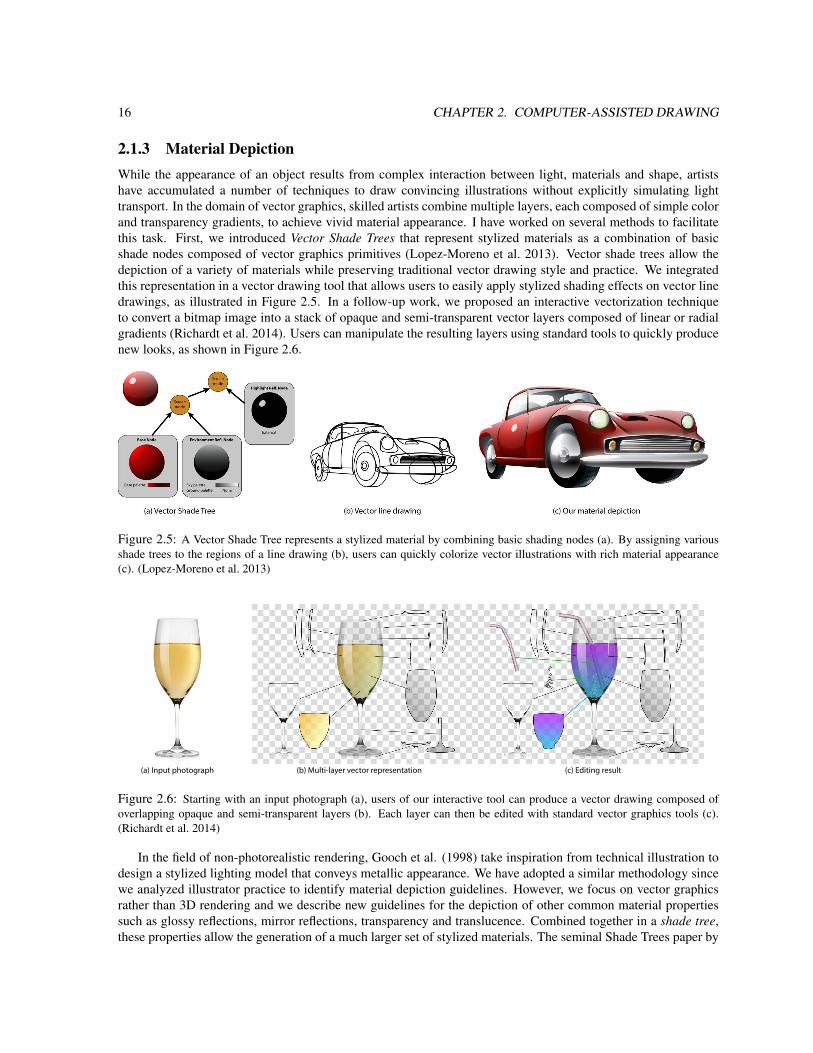
2.1.3 Material DepictionWhile the appearance of an object results from complex interaction between light, materials and shape, artistshave accumulated a number of techniques to draw convincing illustrations without explicitly simulating lighttransport. In the domain of vector graphics, skilled artists combine multiple layers, each composed of simple colorand transparency gradients, to achieve vivid material appearance. I have worked on several methods to facilitatethis task. First, we introduced Vector Shade Trees that represent stylized materials as a combination of basicshade nodes composed of vector graphics primitives (Lopez-Moreno et al. 2013). Vector shade trees allow thedepiction of a variety of materials while preserving traditional vector drawing style and practice. We integratedthis representation in a vector drawing tool that allows users to easily apply stylized shading effects on vector linedrawings, as illustrated in Figure 2.5. In a follow-up work, we proposed an interactive vectorization techniqueto convert a bitmap image into a stack of opaque and semi-transparent vector layers composed of linear or radialgradients (Richardt et al. 2014). Users can manipulate the resulting layers using standard tools to quickly producenew looks, as shown in Figure 2.6.
Figure 2.5: A Vector Shade Tree represents a stylized material by combining basic shading nodes (a). By assigning variousshade trees to the regions of a line drawing (b), users can quickly colorize vector illustrations with rich material appearance(c). (Lopez-Moreno et al. 2013)
(c) Editing result(b) Multi-layer vector representation(a) Input photograph
Figure 2.6: Starting with an input photograph (a), users of our interactive tool can produce a vector drawing composed ofoverlapping opaque and semi-transparent layers (b). Each layer can then be edited with standard vector graphics tools (c).(Richardt et al. 2014)
In the field of non-photorealistic rendering, Gooch et al. (1998) take inspiration from technical illustration todesign a stylized lighting model that conveys metallic appearance. We have adopted a similar methodology sincewe analyzed illustrator practice to identify material depiction guidelines. However, we focus on vector graphicsrather than 3D rendering and we describe new guidelines for the depiction of other common material propertiessuch as glossy reflections, mirror reflections, transparency and translucence. Combined together in a shade tree,these properties allow the generation of a much larger set of stylized materials. The seminal Shade Trees paper by
2.1. OVERVIEW AND RELATED WORK 17
Cook (1984) also introduced the concept of shading languages to the realistic rendering community; this approachwas a rich source of inspiration for our work. Grabli et al. (2010) adapt this concept to the stylization of strokes inline drawings and describe programmable shaders to control style attributes such as color, texture and thickness.We adopt a complementary approach by focusing on the stylized depiction of materials in vector graphics, givingcontrol to material attributes like shading and reflections.
Most existing vectorization methods segment the input image into smooth color regions that are then repre-sented by vector gradients. Lecot and Levy (2006) fit linear and radial gradients to generate vector images in ArtDeco style. Gradient meshes represent complex gradients by interpolating colors over the faces of a quad mesh,making them a powerful primitive to capture the smooth color variations of natural images (Sun et al. 2007). Fi-nally, Diffusion Curves (Orzan et al. 2008) vectorize images by storing colors on each side of strong edges whilecomputing smooth color variations in-between the edges using a diffusion process. All of these algorithms aredesigned to vectorize opaque objects into a single layer. Our approach complements these techniques by decom-positing the image into multiple transparent and opaque layers, each layer being simpler than the composed image.Our approach is also related to alpha matting (Smith and Blinn 1996), although existing matting algorithms esti-mate bitmap layers rather than vector gradients and therefore do not provide a small set of parameters suitable forediting the matted layers. Instead, our decompositing algorithm exploits the parametric nature of vector gradientsto jointly separate and vectorize semi-transparent layers.
2.1.4 Lighting Design
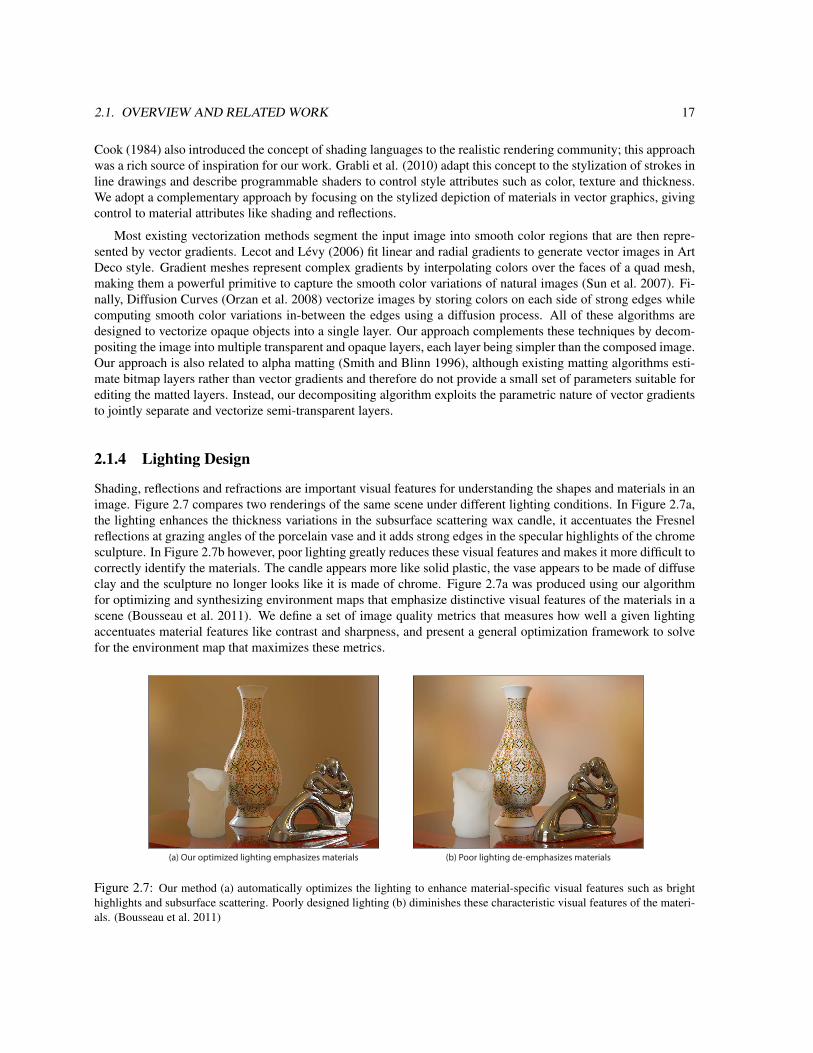
Shading, reflections and refractions are important visual features for understanding the shapes and materials in animage. Figure 2.7 compares two renderings of the same scene under different lighting conditions. In Figure 2.7a,the lighting enhances the thickness variations in the subsurface scattering wax candle, it accentuates the Fresnelreflections at grazing angles of the porcelain vase and it adds strong edges in the specular highlights of the chromesculpture. In Figure 2.7b however, poor lighting greatly reduces these visual features and makes it more difficult tocorrectly identify the materials. The candle appears more like solid plastic, the vase appears to be made of diffuseclay and the sculpture no longer looks like it is made of chrome. Figure 2.7a was produced using our algorithmfor optimizing and synthesizing environment maps that emphasize distinctive visual features of the materials in ascene (Bousseau et al. 2011). We define a set of image quality metrics that measures how well a given lightingaccentuates material features like contrast and sharpness, and present a general optimization framework to solvefor the environment map that maximizes these metrics.
(a) Our optimized lighting emphasizes materials (b) Poor lighting de-emphasizes materials
Figure 2.7: Our method (a) automatically optimizes the lighting to enhance material-specific visual features such as brighthighlights and subsurface scattering. Poorly designed lighting (b) diminishes these characteristic visual features of the materi-als. (Bousseau et al. 2011)
18 CHAPTER 2. COMPUTER-ASSISTED DRAWING
Researchers have developed a variety of techniques for optimizing lighting to enhance shape (Shacked andLischinski 2001; Gumhold 2002; Lee et al. 2006). In contrast, we focus on enhancing the visual features thatemphasize materials rather than shape. In addition, our system generates complex environment lighting ratherthan a small set of point lights. Kerr and Pellacini (2009) present an excellent survey and evaluation of lightingdesign interfaces. However, these interfaces do not incorporate the guidelines expert photographers and lightingdesigners commonly use to enhance the appearance of materials. Users must rely on their own training andexperience to set up the lighting. In contrast, our automated system optimizes the lighting based on designprinciples for material depiction.
Our work on material depiction and lighting design is also strongly inspired by research on material perceptionin realistic rendering. Fleming et al. (2003) show that the recognition of surface reflectance is improved whenobjects are illuminated under natural environments. These results suggest that natural image statistics such as colorand derivative histograms provide strong cues for material perception. Ramanarayanan et al. (Ramanarayananet al. 2007) evaluate if transformations of the lighting environment such as blurring and warping are perceivablegiven various geometries and materials. They observed that blurring the illumination is harder to perceive fordiffuse materials, and that warping is harder to perceive for bumpy surfaces. We made similar observations in thecontext of stylized rendering, where brush strokes and cartoon quantization can be seen as forms of blurring andwarping (Bousseau et al. 2013).
2.2 Observing How Artists WorkMost of the work presented in this chapter has been motivated by observations on how artists perform specifictasks. While I conducted a few interviews and field studies to better understand how artists work, I found thatstudying art books is often a more effective way to collect relevant guidelines suitable for implementation in acomputer-assisted tool. I describe the advantages and drawbacks of the two approaches in this section.
2.2.1 Observational StudiesIn the domain of Human Computer Interaction (HCI), field observations and interviews are common ways ofunderstanding how a class of users perform specific tasks. In particular, observational studies allow researchersto obtain first-hand information about practices that have not yet been well documented. However, conductingmeaningful observational studies in our context requires specific care.
A first challenge is to recruit artists with representative skills in order to draw conclusions that can generalizeto other users. Unfortunately, skilled artists are rare and often have little time to participate in extensive interviews.Confidentiality may also prevent the observation of professional designers in their working environment. As anexample, we had the chance to conduct a few interviews at Toyota ED2 design studio, located in Sophia Antipolis.In the absence of an official collaboration, we could only interview four designers for one hour each, in an isolatedroom. While these interviews provided us with valuable insights on design practices, longer interviews and fieldobservations with more participants would be needed to formulate well-grounded findings.
A second challenge stems from the fact that design is a complex, collaborative process that often takesplace over a long period of time. I am currently collaborating with HCI experts to acquire a greater expertise inconducting observational studies of designers at work (Bousseau et al. In Progress). Previous studies of designbehavior have set up time-constrained laboratory observations of a specific, focused design task (Brereton andMcGarry 2000), or taken an longitudinal ethnographic field study approach (Henderson 1998) to look at theevolution of design behavior over time. We combine these approaches to observe how novices perform designtasks during a one-day design charette. This approach offers a middle-ground between an open field observationand a tightly-controlled lab experiment. On the one hand, the study follows a well-defined structure that wedesigned to stimulate the creativity of the participants. The structure of the study also facilitates data collectionand comparison. On the other hand, participants perform ecologically-valid tasks that are close to the ones theywould perform when solving a real design problem. The goal of this structured approach is to generate novel
2.2. OBSERVING HOW ARTISTS WORK 19
(a) Ideation (b) Presentation (c) Fabrication (d) Prototype
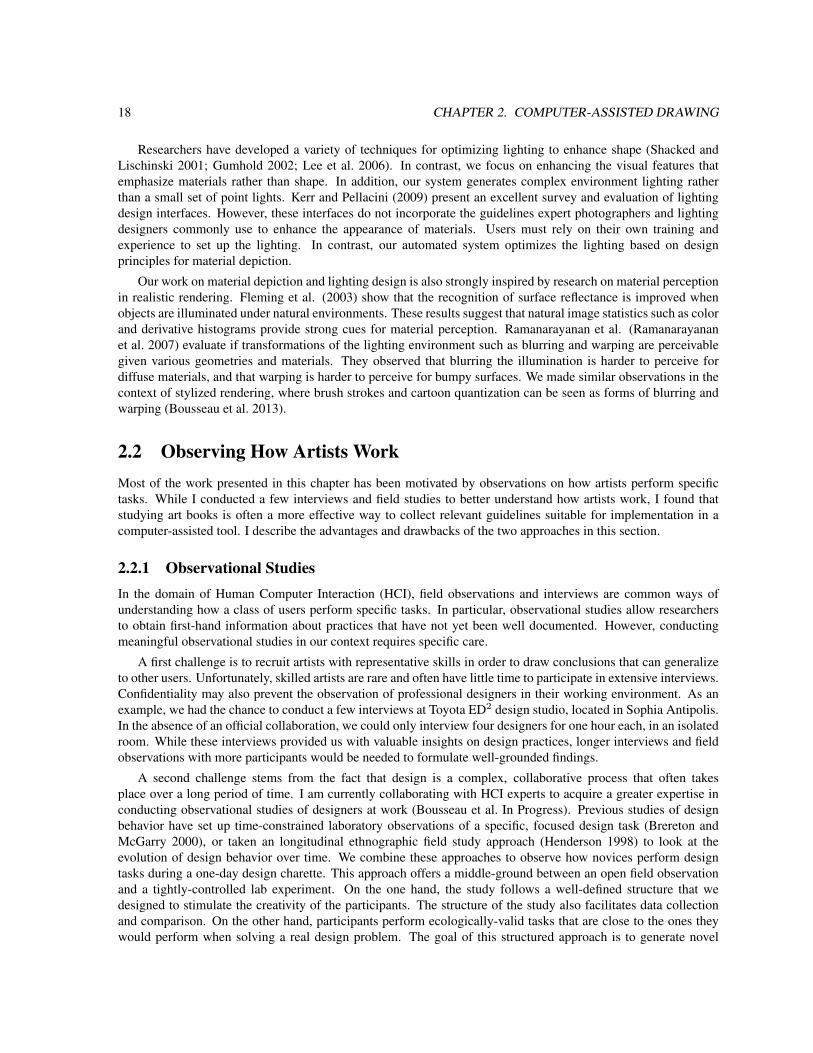
Figure 2.8: Representative sketches and physical prototypes produced by novices during a costume design task. We instructedthe participants to brainstorm about a concept (a), present the concept to a jury (b), describe how to fabricate the concept (c)and finally build a prototype in collaboration with another participant (d).
hypothesis that could later be tested with more constrained experiments.
Figure 2.8 shows sketches and physical prototypes produced by our participants when performing a costume-design task. Our initial analysis of this data reveals that while participants had no or little training in design, theytended to adopt similar strategies as professional designers. In particular, they used small and simple drawingsto generate ideas (Figure 2.8a), big and detailed drawings for presentation (Figure 2.8b) and multiple drawingswith annotations to document fabrication (Figure 2.8c). We also observed the use of common drawing techniques,such as focus+context and close-ups on important parts, step-by-step assembly instructions, transparency to showinner parts, 2D cutout of unfolded 3D shape, front/top/side views of 3D shapes. Finally, to our surprise, partici-pants used very little sketching when discussing how to fabricate a concept. Instead, participants favored gestureand manipulation of physical materials, for example by grabbing a piece of foam and showing how it could fiton a mannequin. Based on these observations, we are now in the process of formulating recommendations forcomputer-aided design tools adapted to the needs and skills of novices.
2.2.2 Studying the Design LiteratureThe challenges of observational studies outlined in the previous section can be partly addressed by studying theart literature. Good art books and tutorials are written by professional artists with years of experience, and as suchare representative of standard practices of their discipline. Well-known books are also likely to influence futuregenerations of practitioners. In addition, art books compile numerous long-standing techniques that would behard to discover solely from field observations. These techniques are described from the artists’ perspective andas such do not suffer from the experimenter biases. Finally, the art literature offers many examples of what artistsand designers aim at producing. In addition to motivating novel computer-assisted tools, these examples can beused to validate the performance and pertinence of the algorithms we propose.
20 CHAPTER 2. COMPUTER-ASSISTED DRAWING
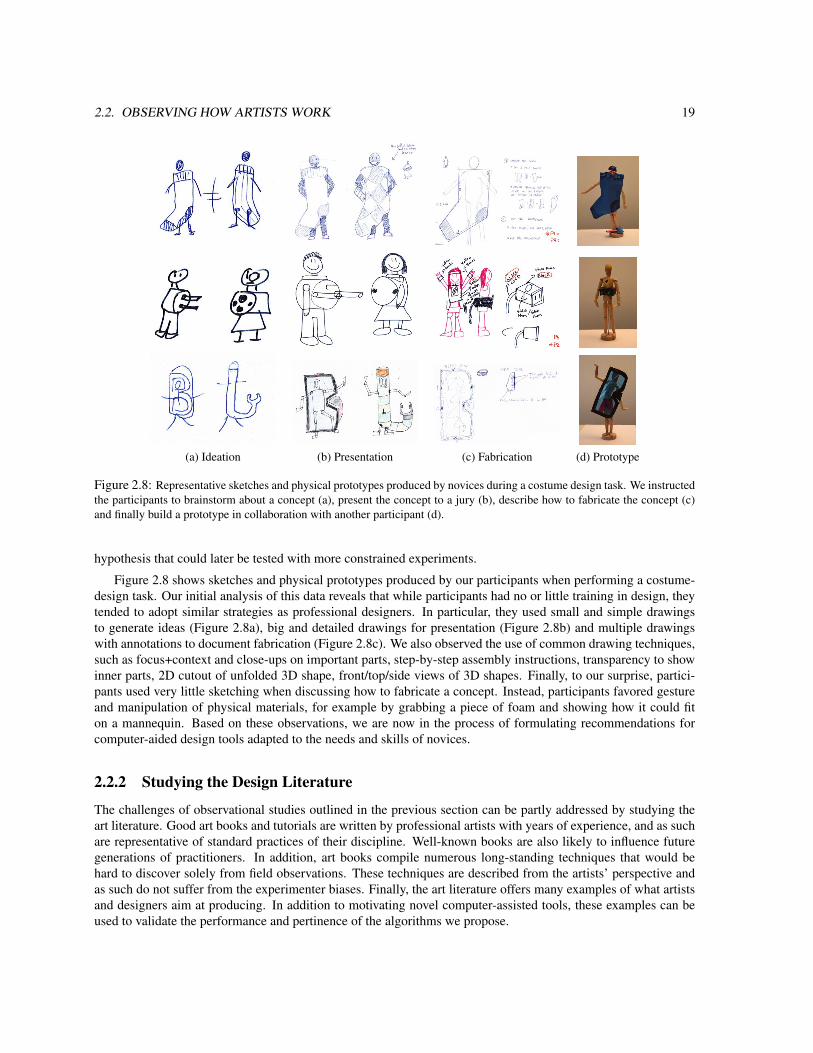
Figure 2.9: Some of the books that inspired my research on drawing shape (Dodson 1985; Eissen and Steur 2008), materials(Powell 1986) and lighting (Hunter et al. 2012).
Figure 2.9 shows some of the books that inspired my research. Most of these books have been highly popularand re-edited, which indicates their relevance and impact in their respective domains. A number of ComputerGraphics papers have similarly been directly inspired by design and art books, such as early work on pen-and-inkrendering (Winkenbach and Salesin 1994), watercolor rendering (Curtis et al. 1997), illustrative rendering (Goochet al. 1998), sketch-based modeling with construction lines and annotations (Schmidt et al. 2009; Gingold et al.2009), illustration of mechanical assembly (Li et al. 2007; Li et al. 2008; Mitra et al. 2010), character posing andanimation (Guay et al. 2013) and many more. Each of these papers implies the formulation and implementationof design principles. I detail the challenges of such an approach in the next section.
2.3 Formulating Artistic Principles
Part of the difficulty in formulating general artistic principles stems from the fact that the techniques artists useare based on accumulated artistic knowledge. The description of these techniques are spread across a varietyof books and tutorials, and are often illustrated with specific examples where information on how to perform ageneral task is intertwined with information specific to the subject at hand. Many of the techniques also sharecommon principles implemented in different variations. Finally, art books and tutorials often describe drawingtechniques from the artist’s perspective, without necessarily justifying these techniques from a scientific point ofview.
To build a tool facilitating an artistic task we first need to select, classify and generalize a coherent set ofguidelines that artists combine together to achieve their goals. Our guidelines describe artists’ current workflows(the tools they use, their vocabulary), and decompose these workflows into components suitable for integration intofunctional systems. We often reinforce these guidelines by relating artistic principles with perceptual principles.This approach is based on the premise that the principles guiding artists in their choices are the same principlesthat aid viewers in understanding an illustration.
2.3.1 Collecting Principles
During my past years of research, my colleagues and I have collected and formalized artistic principles on howto depict shape (Shao et al. 2012; Xu et al. 2014; Iarussi et al. 2013; Iarussi et al. 2015), materials and lighting(Bousseau et al. 2011; Lopez-Moreno et al. 2013; Richardt et al. 2014). Figure 2.10 illustrates some of theguidelines we have identified, which the next paragraphs explain in more detail.
2.3. FORMULATING ARTISTIC PRINCIPLES 21
(a) Block-in (b) Skeleton (d) Sighting(c) Regions
Dra
win
g fro
m o
bser
vatio
nD
raw
ing
3D sh
apes
Dra
win
g m
ater
ials
Ligh
ting
mat
eria
ls
(e) Curvature lines - orthogonality (f ) Geodesic curves - symmetry (g) Minimal foreshorteningToo foreshortened Informative viewpoint
(h) Re!ections
Light direction
Brightening(k) Translucency
Symmetricalexternal and internal
highlightsTotal internalre!ections
Colored background
(j) Transparency(i) Fresnel
(l) Re!ections (o) Translucency(n) Transparency(m) Fresnel
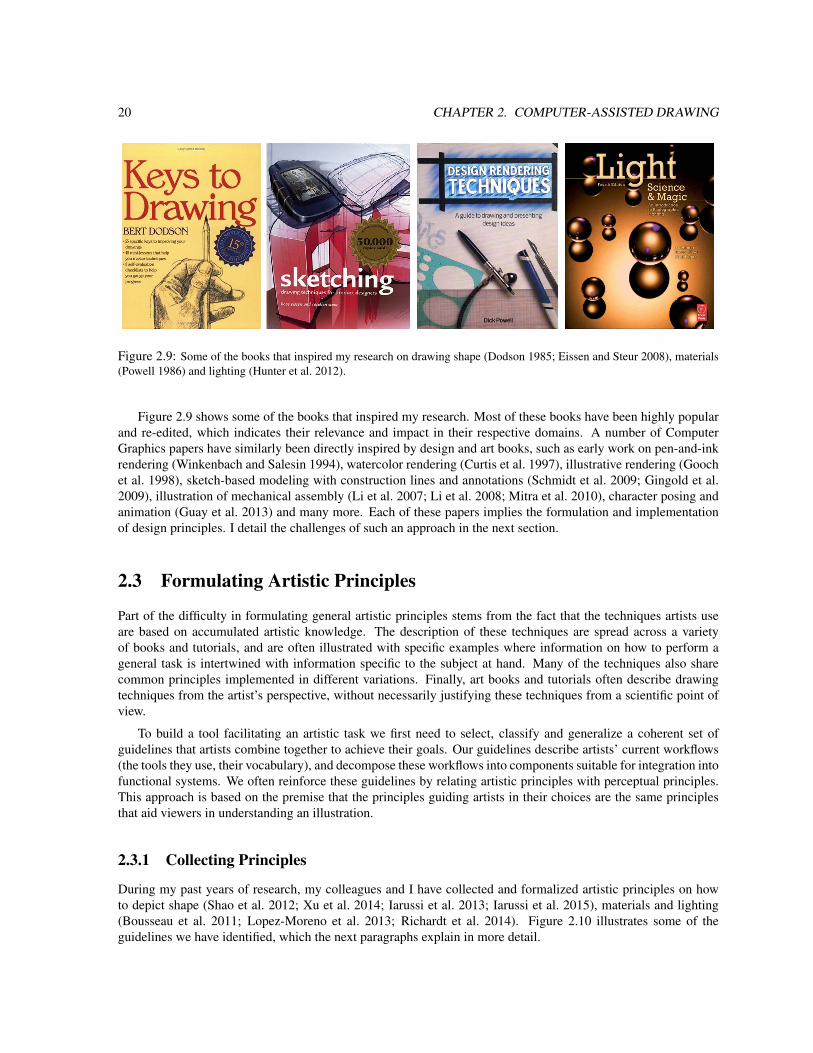
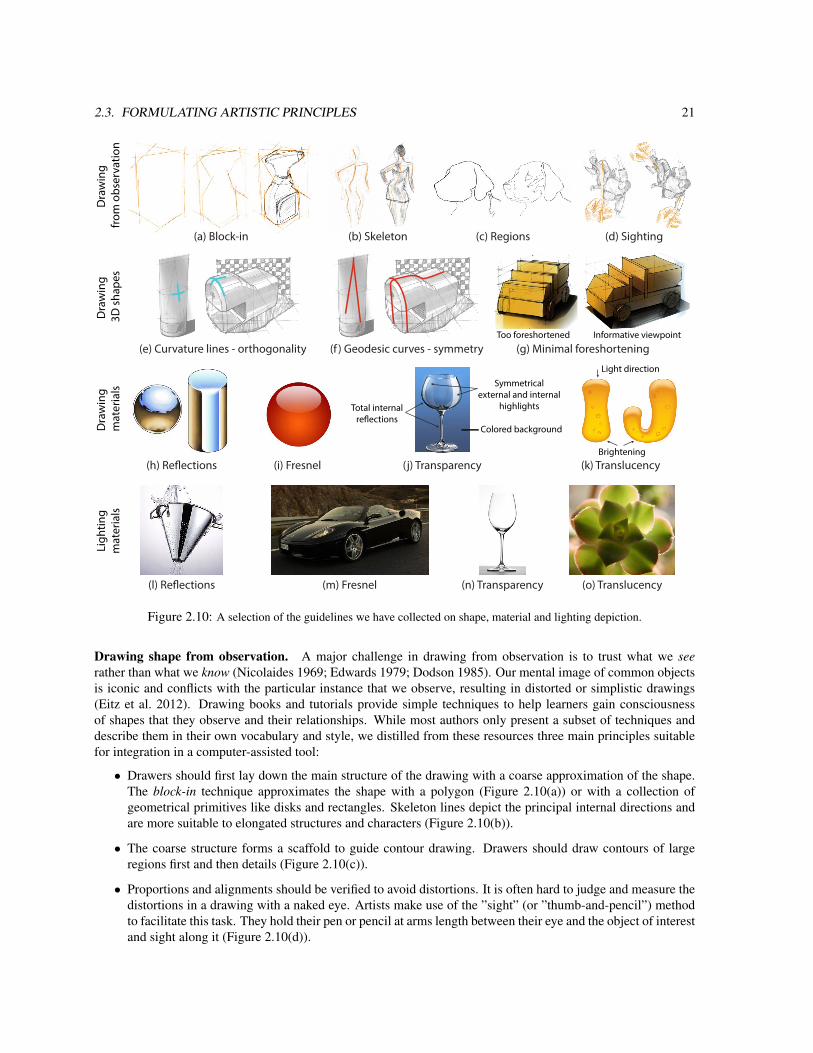
Figure 2.10: A selection of the guidelines we have collected on shape, material and lighting depiction.
Drawing shape from observation. A major challenge in drawing from observation is to trust what we seerather than what we know (Nicolaides 1969; Edwards 1979; Dodson 1985). Our mental image of common objectsis iconic and conflicts with the particular instance that we observe, resulting in distorted or simplistic drawings(Eitz et al. 2012). Drawing books and tutorials provide simple techniques to help learners gain consciousnessof shapes that they observe and their relationships. While most authors only present a subset of techniques anddescribe them in their own vocabulary and style, we distilled from these resources three main principles suitablefor integration in a computer-assisted tool:
• Drawers should first lay down the main structure of the drawing with a coarse approximation of the shape.The block-in technique approximates the shape with a polygon (Figure 2.10(a)) or with a collection ofgeometrical primitives like disks and rectangles. Skeleton lines depict the principal internal directions andare more suitable to elongated structures and characters (Figure 2.10(b)).
• The coarse structure forms a scaffold to guide contour drawing. Drawers should draw contours of largeregions first and then details (Figure 2.10(c)).
• Proportions and alignments should be verified to avoid distortions. It is often hard to judge and measure thedistortions in a drawing with a naked eye. Artists make use of the ”sight” (or ”thumb-and-pencil”) methodto facilitate this task. They hold their pen or pencil at arms length between their eye and the object of interestand sight along it (Figure 2.10(d)).
22 CHAPTER 2. COMPUTER-ASSISTED DRAWING
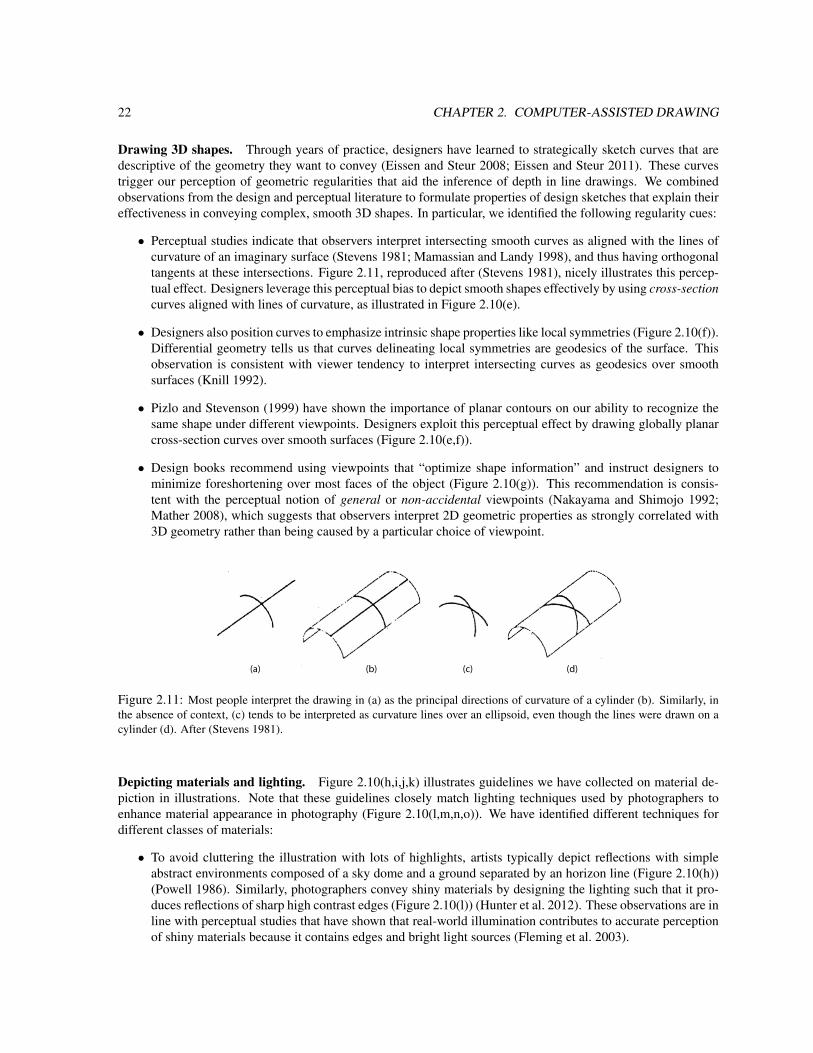
Drawing 3D shapes. Through years of practice, designers have learned to strategically sketch curves that aredescriptive of the geometry they want to convey (Eissen and Steur 2008; Eissen and Steur 2011). These curvestrigger our perception of geometric regularities that aid the inference of depth in line drawings. We combinedobservations from the design and perceptual literature to formulate properties of design sketches that explain theireffectiveness in conveying complex, smooth 3D shapes. In particular, we identified the following regularity cues:
• Perceptual studies indicate that observers interpret intersecting smooth curves as aligned with the lines ofcurvature of an imaginary surface (Stevens 1981; Mamassian and Landy 1998), and thus having orthogonaltangents at these intersections. Figure 2.11, reproduced after (Stevens 1981), nicely illustrates this percep-tual effect. Designers leverage this perceptual bias to depict smooth shapes effectively by using cross-sectioncurves aligned with lines of curvature, as illustrated in Figure 2.10(e).
• Designers also position curves to emphasize intrinsic shape properties like local symmetries (Figure 2.10(f)).Differential geometry tells us that curves delineating local symmetries are geodesics of the surface. Thisobservation is consistent with viewer tendency to interpret intersecting curves as geodesics over smoothsurfaces (Knill 1992).
• Pizlo and Stevenson (1999) have shown the importance of planar contours on our ability to recognize thesame shape under different viewpoints. Designers exploit this perceptual effect by drawing globally planarcross-section curves over smooth surfaces (Figure 2.10(e,f)).
• Design books recommend using viewpoints that “optimize shape information” and instruct designers tominimize foreshortening over most faces of the object (Figure 2.10(g)). This recommendation is consis-tent with the perceptual notion of general or non-accidental viewpoints (Nakayama and Shimojo 1992;Mather 2008), which suggests that observers interpret 2D geometric properties as strongly correlated with3D geometry rather than being caused by a particular choice of viewpoint.
(a) (b) (c) (d)
Figure 2.11: Most people interpret the drawing in (a) as the principal directions of curvature of a cylinder (b). Similarly, inthe absence of context, (c) tends to be interpreted as curvature lines over an ellipsoid, even though the lines were drawn on acylinder (d). After (Stevens 1981).
Depicting materials and lighting. Figure 2.10(h,i,j,k) illustrates guidelines we have collected on material de-piction in illustrations. Note that these guidelines closely match lighting techniques used by photographers toenhance material appearance in photography (Figure 2.10(l,m,n,o)). We have identified different techniques fordifferent classes of materials:
• To avoid cluttering the illustration with lots of highlights, artists typically depict reflections with simpleabstract environments composed of a sky dome and a ground separated by an horizon line (Figure 2.10(h))(Powell 1986). Similarly, photographers convey shiny materials by designing the lighting such that it pro-duces reflections of sharp high contrast edges (Figure 2.10(l)) (Hunter et al. 2012). These observations are inline with perceptual studies that have shown that real-world illumination contributes to accurate perceptionof shiny materials because it contains edges and bright light sources (Fleming et al. 2003).
2.3. FORMULATING ARTISTIC PRINCIPLES 23
• For glossy materials such as plastic, artists only depict the reflection of the strongest light sources in the en-vironment such as the sky dome or the rectangular shape of a window (Martin 1989a). Artists and photogra-phers also exaggerate the strength of the reflections at grazing angle to convey the Fresnel effect (Robertson2003) (Figure 2.10(i,m)).
• Artists depict transparent materials like glass and ice by drawing highlights in multiple locations due tomultiple scattering within the object (Martin 1989b). For simple shapes, these internal highlights are oftenplaced symmetrically to the external highlights with respect to the center of the shape (Figure 2.10(j)).In addition to bright internal highlights, artists often draw dark bands near the silhouette of transparentobjects to depict total internal reflections. These bands delineate the contours of the object with a strongcontrasting edge and the width of the bands suggest the thickness of the material. To obtain a similar effect,studio photographers place the object in front of a bright background and position dark plates (called gobos)around the object, outside the field of view, to produce dark reflections and refraction along contours (Hunteret al. 2012). Figure 2.10(n) illustrates this technique called bright-field lighting.
• A distinctive visual feature of translucent objects is their ability to scatter light through multiple internalreflections. Artists convey light exiting the object after internal scattering by brightening the parts of theobject that are directly opposite from the point at which the light strikes the surface (Figure 2.10(k)). Pho-tographers also enhance the appearance of translucent materials by illuminating the object from behind(Figure 2.10(o)). Fleming et al. (2004) show that subsurface scattering is better perceived when objects areilluminated from behind, since backlighting provides more visual cues of light scattered through the thinparts of the object.
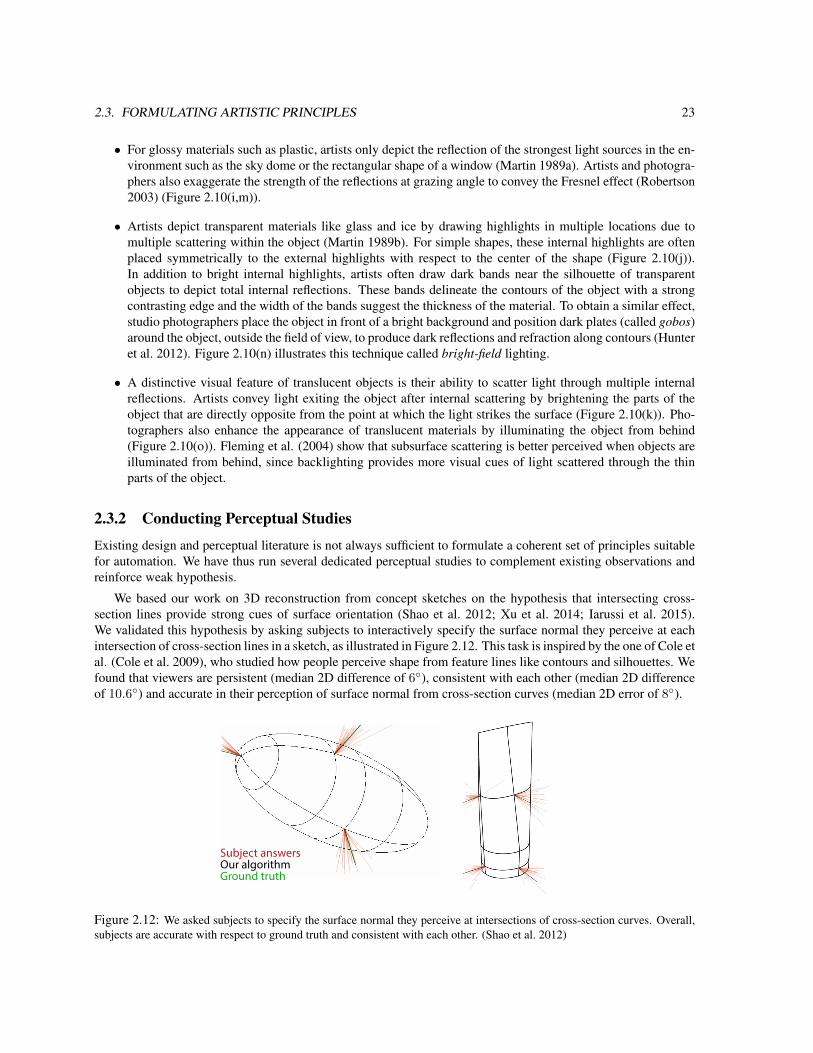
2.3.2 Conducting Perceptual StudiesExisting design and perceptual literature is not always sufficient to formulate a coherent set of principles suitablefor automation. We have thus run several dedicated perceptual studies to complement existing observations andreinforce weak hypothesis.
We based our work on 3D reconstruction from concept sketches on the hypothesis that intersecting cross-section lines provide strong cues of surface orientation (Shao et al. 2012; Xu et al. 2014; Iarussi et al. 2015).We validated this hypothesis by asking subjects to interactively specify the surface normal they perceive at eachintersection of cross-section lines in a sketch, as illustrated in Figure 2.12. This task is inspired by the one of Cole etal. (Cole et al. 2009), who studied how people perceive shape from feature lines like contours and silhouettes. Wefound that viewers are persistent (median 2D difference of 6), consistent with each other (median 2D differenceof 10.6) and accurate in their perception of surface normal from cross-section curves (median 2D error of 8).
Subject answersOur algorithmGround truth
Figure 2.12: We asked subjects to specify the surface normal they perceive at intersections of cross-section curves. Overall,subjects are accurate with respect to ground truth and consistent with each other. (Shao et al. 2012)
24 CHAPTER 2. COMPUTER-ASSISTED DRAWING
Another of our studies aimed at understanding the perception of materials in illustrations (Bousseau et al.2013). Artists often rely on their experience of their media to depict materials in different styles. However, thisartistic knowledge is often implicit and while high-level rules exist to depict light and shade in a given style,no guidelines exist to vary low-level material properties such as the amount of gloss. We focused on painterlyand cartoon images and used non-photorealistic rendering as a tool to systematically study the effects of styleparameters on gloss perception. Specifically, we used a matching task to measure how brush size, brush opacity,brush texture and cartoon quantization softness alter the perception of materials ranging from very shiny to almostdiffuse. Our study reveals a compression of the range of representable gloss in stylized images so that shinymaterials appear more diffuse in painterly rendering, while diffuse materials appear shinier in cartoon images.From our measurements we estimated the function that maps realistic gloss parameters to their perception in astylized rendering. This mapping allows users of non-photorealistic rendering algorithms to predict the perceptionof gloss in their images. The inverse of this function exaggerates gloss properties to make the contrast betweenmaterials in a stylized image more faithful.
2.4 Automating Artistic PrinciplesOur analysis of design principles informs the implementation of algorithms and user interfaces to facilitate designtasks. The main challenge we face is to automate tedious aspects of the artistic workflow while preserving thestrength of the tools that artists are familiar with. While some artistic principles can directly be automated, othersneed to offer a balance between automation and user control.
2.4.1 Direct AutomationDrawing from observation. In an ideal scenario, the design principles can directly be automated to assist usersin their tasks. We have achieved such an automation in the interface we proposed for assisting the practice ofdrawing-from-observation techniques (Iarussi et al. 2013). Inspired by our survey of the drawing literature, we setthe following design goals for our user interface:
• Encourage users to focus their attention on the model they need to observe, rather than their drawing.
• Help users to practice observation techniques proposed by the drawing literature. These techniques shouldallow users to identify the shapes and their relationships on a model and to structure their drawings.
• Support corrective feedback to help users understand their errors and refine their drawings.
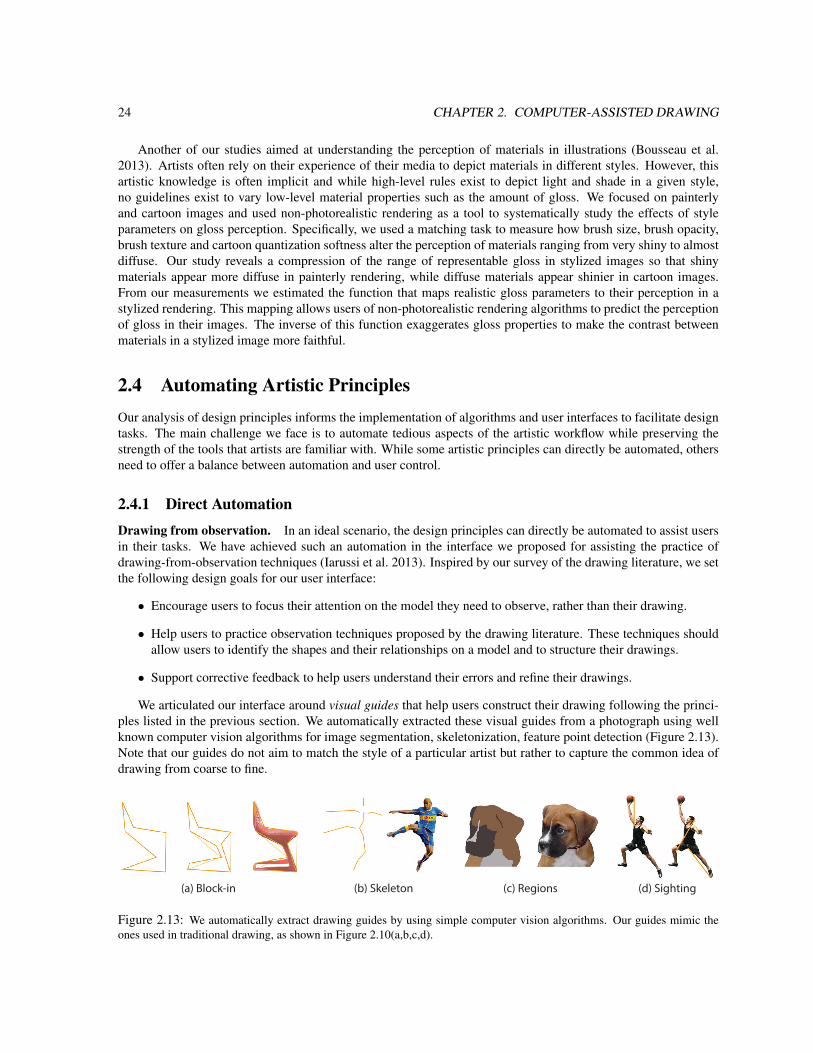
We articulated our interface around visual guides that help users construct their drawing following the princi-ples listed in the previous section. We automatically extracted these visual guides from a photograph using wellknown computer vision algorithms for image segmentation, skeletonization, feature point detection (Figure 2.13).Note that our guides do not aim to match the style of a particular artist but rather to capture the common idea ofdrawing from coarse to fine.
(a) Block-in (b) Skeleton (d) Sighting(c) Regions
Figure 2.13: We automatically extract drawing guides by using simple computer vision algorithms. Our guides mimic theones used in traditional drawing, as shown in Figure 2.10(a,b,c,d).
2.4. AUTOMATING ARTISTIC PRINCIPLES 25
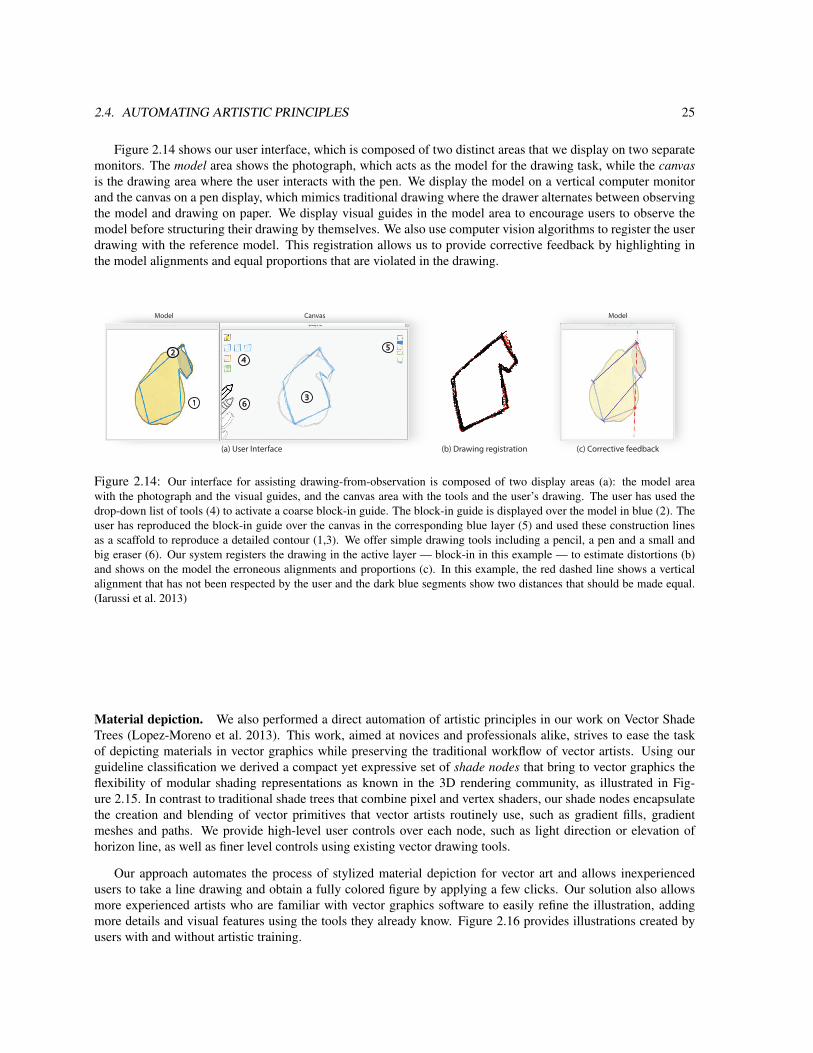
Figure 2.14 shows our user interface, which is composed of two distinct areas that we display on two separatemonitors. The model area shows the photograph, which acts as the model for the drawing task, while the canvasis the drawing area where the user interacts with the pen. We display the model on a vertical computer monitorand the canvas on a pen display, which mimics traditional drawing where the drawer alternates between observingthe model and drawing on paper. We display visual guides in the model area to encourage users to observe themodel before structuring their drawing by themselves. We also use computer vision algorithms to register the userdrawing with the reference model. This registration allows us to provide corrective feedback by highlighting inthe model alignments and equal proportions that are violated in the drawing.
(b) Drawing registration
1
2
3
45
6
Model Canvas
(a) User Interface (c) Corrective feedback
Model
Figure 2.14: Our interface for assisting drawing-from-observation is composed of two display areas (a): the model areawith the photograph and the visual guides, and the canvas area with the tools and the user’s drawing. The user has used thedrop-down list of tools (4) to activate a coarse block-in guide. The block-in guide is displayed over the model in blue (2). Theuser has reproduced the block-in guide over the canvas in the corresponding blue layer (5) and used these construction linesas a scaffold to reproduce a detailed contour (1,3). We offer simple drawing tools including a pencil, a pen and a small andbig eraser (6). Our system registers the drawing in the active layer — block-in in this example — to estimate distortions (b)and shows on the model the erroneous alignments and proportions (c). In this example, the red dashed line shows a verticalalignment that has not been respected by the user and the dark blue segments show two distances that should be made equal.(Iarussi et al. 2013)
Material depiction. We also performed a direct automation of artistic principles in our work on Vector ShadeTrees (Lopez-Moreno et al. 2013). This work, aimed at novices and professionals alike, strives to ease the taskof depicting materials in vector graphics while preserving the traditional workflow of vector artists. Using ourguideline classification we derived a compact yet expressive set of shade nodes that bring to vector graphics theflexibility of modular shading representations as known in the 3D rendering community, as illustrated in Fig-ure 2.15. In contrast to traditional shade trees that combine pixel and vertex shaders, our shade nodes encapsulatethe creation and blending of vector primitives that vector artists routinely use, such as gradient fills, gradientmeshes and paths. We provide high-level user controls over each node, such as light direction or elevation ofhorizon line, as well as finer level controls using existing vector drawing tools.
Our approach automates the process of stylized material depiction for vector art and allows inexperiencedusers to take a line drawing and obtain a fully colored figure by applying a few clicks. Our solution also allowsmore experienced artists who are familiar with vector graphics software to easily refine the illustration, addingmore details and visual features using the tools they already know. Figure 2.16 provides illustrations created byusers with and without artistic training.
26 CHAPTER 2. COMPUTER-ASSISTED DRAWING
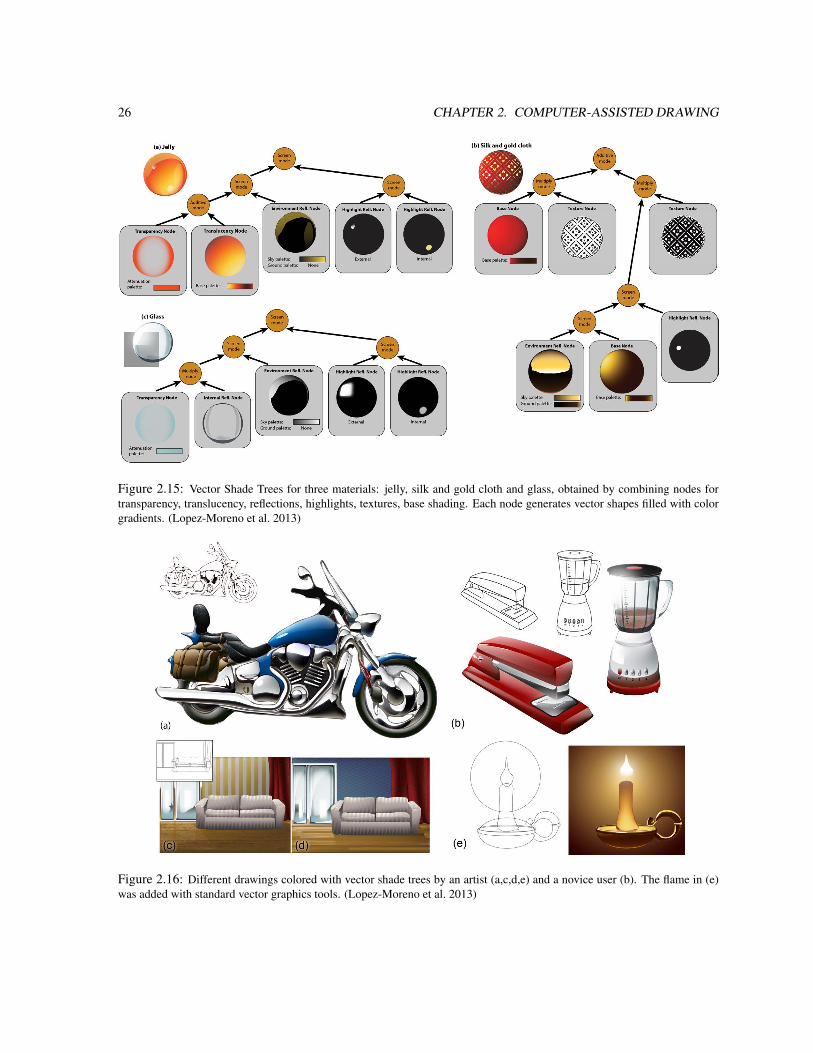
Figure 2.15: Vector Shade Trees for three materials: jelly, silk and gold cloth and glass, obtained by combining nodes fortransparency, translucency, reflections, highlights, textures, base shading. Each node generates vector shapes filled with colorgradients. (Lopez-Moreno et al. 2013)
Figure 2.16: Different drawings colored with vector shade trees by an artist (a,c,d,e) and a novice user (b). The flame in (e)was added with standard vector graphics tools. (Lopez-Moreno et al. 2013)
2.4. AUTOMATING ARTISTIC PRINCIPLES 27
2.4.2 OptimizationIn many cases, the design principles translate in multiple, possibly concurrent goals. We typically express thesegoals as objectives in an optimization, which can also incorporate user input for guidance.
Lighting design. Lighting designers strategically position lights to delineate the outline of objects and revealtheir gloss, transparency or translucency. Since shading, shadows and highlights concurrently affect thesedifferent objectives, we expressed the problem of lighting design as an optimization, aiming for the lightingenvironment that best distributes light and shade in the image according to shape and material-specific energyterms (Bousseau et al. 2011).
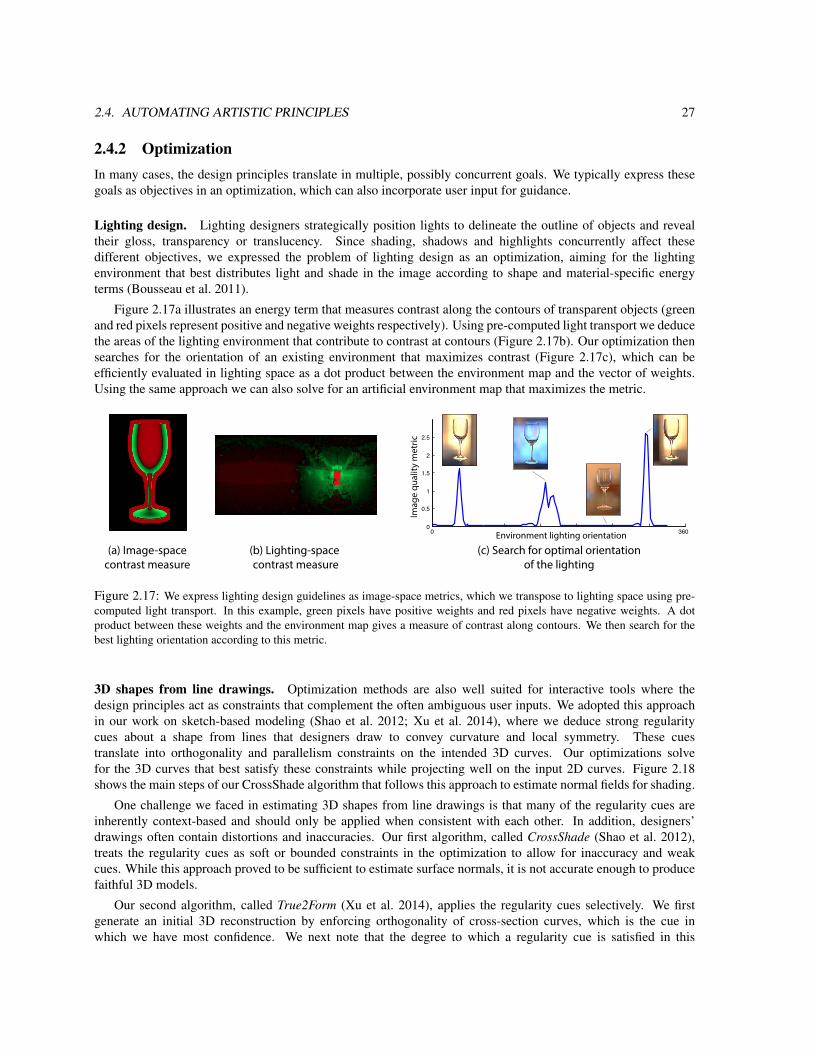
Figure 2.17a illustrates an energy term that measures contrast along the contours of transparent objects (greenand red pixels represent positive and negative weights respectively). Using pre-computed light transport we deducethe areas of the lighting environment that contribute to contrast at contours (Figure 2.17b). Our optimization thensearches for the orientation of an existing environment that maximizes contrast (Figure 2.17c), which can beefficiently evaluated in lighting space as a dot product between the environment map and the vector of weights.Using the same approach we can also solve for an artificial environment map that maximizes the metric.
0 3600
0.5
1
1.5
2
2.5
Environment lighting orientation
Imag
e qu
ality
met
ric
(a) Image-spacecontrast measure
(b) Lighting-space contrast measure
(c) Search for optimal orientationof the lighting
Figure 2.17: We express lighting design guidelines as image-space metrics, which we transpose to lighting space using pre-computed light transport. In this example, green pixels have positive weights and red pixels have negative weights. A dotproduct between these weights and the environment map gives a measure of contrast along contours. We then search for thebest lighting orientation according to this metric.
3D shapes from line drawings. Optimization methods are also well suited for interactive tools where thedesign principles act as constraints that complement the often ambiguous user inputs. We adopted this approachin our work on sketch-based modeling (Shao et al. 2012; Xu et al. 2014), where we deduce strong regularitycues about a shape from lines that designers draw to convey curvature and local symmetry. These cuestranslate into orthogonality and parallelism constraints on the intended 3D curves. Our optimizations solvefor the 3D curves that best satisfy these constraints while projecting well on the input 2D curves. Figure 2.18shows the main steps of our CrossShade algorithm that follows this approach to estimate normal fields for shading.
One challenge we faced in estimating 3D shapes from line drawings is that many of the regularity cues areinherently context-based and should only be applied when consistent with each other. In addition, designers’drawings often contain distortions and inaccuracies. Our first algorithm, called CrossShade (Shao et al. 2012),treats the regularity cues as soft or bounded constraints in the optimization to allow for inaccuracy and weakcues. While this approach proved to be sufficient to estimate surface normals, it is not accurate enough to producefaithful 3D models.
Our second algorithm, called True2Form (Xu et al. 2014), applies the regularity cues selectively. We firstgenerate an initial 3D reconstruction by enforcing orthogonality of cross-section curves, which is the cue inwhich we have most confidence. We next note that the degree to which a regularity cue is satisfied in this
28 CHAPTER 2. COMPUTER-ASSISTED DRAWING
(a) Input curves (b) Estimated (c) Normals (d) Normals (e) Resulting shadingcurve planes along curves over the sketch
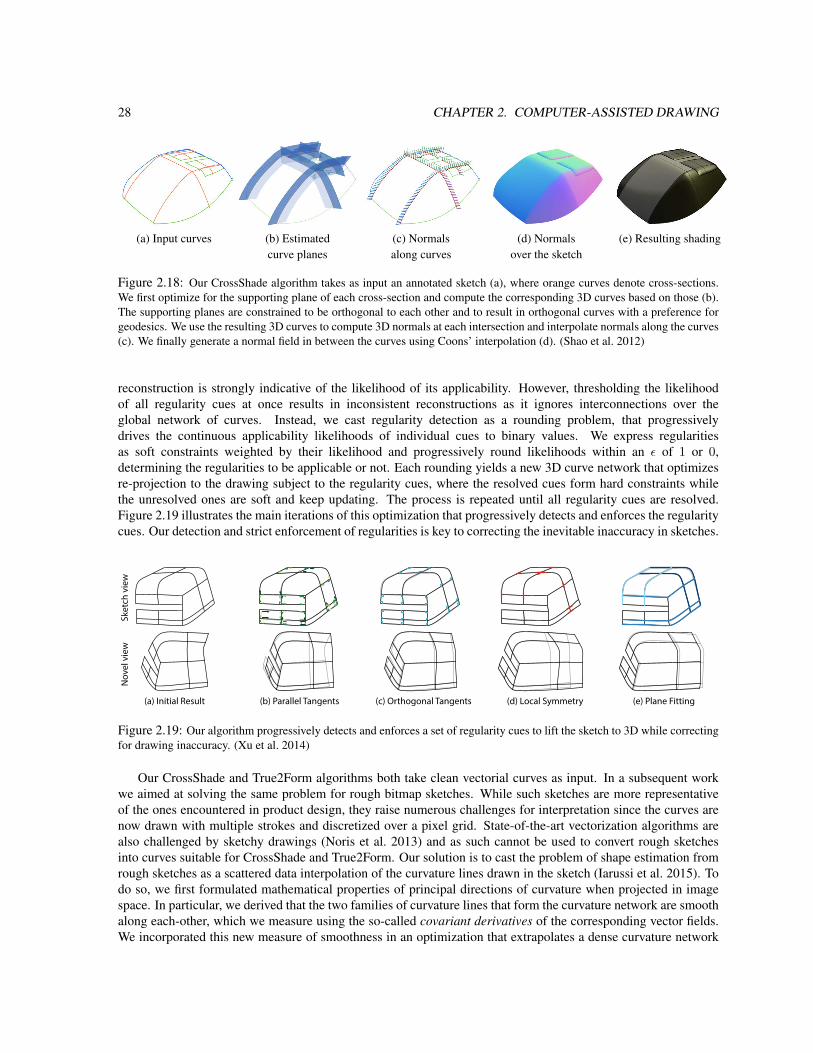
Figure 2.18: Our CrossShade algorithm takes as input an annotated sketch (a), where orange curves denote cross-sections.We first optimize for the supporting plane of each cross-section and compute the corresponding 3D curves based on those (b).The supporting planes are constrained to be orthogonal to each other and to result in orthogonal curves with a preference forgeodesics. We use the resulting 3D curves to compute 3D normals at each intersection and interpolate normals along the curves(c). We finally generate a normal field in between the curves using Coons’ interpolation (d). (Shao et al. 2012)
reconstruction is strongly indicative of the likelihood of its applicability. However, thresholding the likelihoodof all regularity cues at once results in inconsistent reconstructions as it ignores interconnections over theglobal network of curves. Instead, we cast regularity detection as a rounding problem, that progressivelydrives the continuous applicability likelihoods of individual cues to binary values. We express regularitiesas soft constraints weighted by their likelihood and progressively round likelihoods within an of 1 or 0,determining the regularities to be applicable or not. Each rounding yields a new 3D curve network that optimizesre-projection to the drawing subject to the regularity cues, where the resolved cues form hard constraints whilethe unresolved ones are soft and keep updating. The process is repeated until all regularity cues are resolved.Figure 2.19 illustrates the main iterations of this optimization that progressively detects and enforces the regularitycues. Our detection and strict enforcement of regularities is key to correcting the inevitable inaccuracy in sketches.
(a) Initial Result (b) Parallel Tangents (c) Orthogonal Tangents (d) Local Symmetry (e) Plane Fitting
Sket
ch v
iew
Nov
el v
iew
Figure 2.19: Our algorithm progressively detects and enforces a set of regularity cues to lift the sketch to 3D while correctingfor drawing inaccuracy. (Xu et al. 2014)
Our CrossShade and True2Form algorithms both take clean vectorial curves as input. In a subsequent workwe aimed at solving the same problem for rough bitmap sketches. While such sketches are more representativeof the ones encountered in product design, they raise numerous challenges for interpretation since the curves arenow drawn with multiple strokes and discretized over a pixel grid. State-of-the-art vectorization algorithms arealso challenged by sketchy drawings (Noris et al. 2013) and as such cannot be used to convert rough sketchesinto curves suitable for CrossShade and True2Form. Our solution is to cast the problem of shape estimation fromrough sketches as a scattered data interpolation of the curvature lines drawn in the sketch (Iarussi et al. 2015). Todo so, we first formulated mathematical properties of principal directions of curvature when projected in imagespace. In particular, we derived that the two families of curvature lines that form the curvature network are smoothalong each-other, which we measure using the so-called covariant derivatives of the corresponding vector fields.We incorporated this new measure of smoothness in an optimization that extrapolates a dense curvature network
2.4. AUTOMATING ARTISTIC PRINCIPLES 29
from the sparse curvature lines of a sketch, as illustrated in Figure 2.20. This geometric information allows us toestimate normals and texture coordinates from a single rough sketch. The main strength of this algorithm is that itis very robust to various levels of sketchiness of the sketch, as illustrated in Figure 2.21. However, this robustnesscomes at the cost of an expensive optimization, which takes several minutes with our current implementation.
(a) Input sketch (b) Local orientation (b) Extrapolatedcurvature lines
(b) Normals (c) Texture coordinates
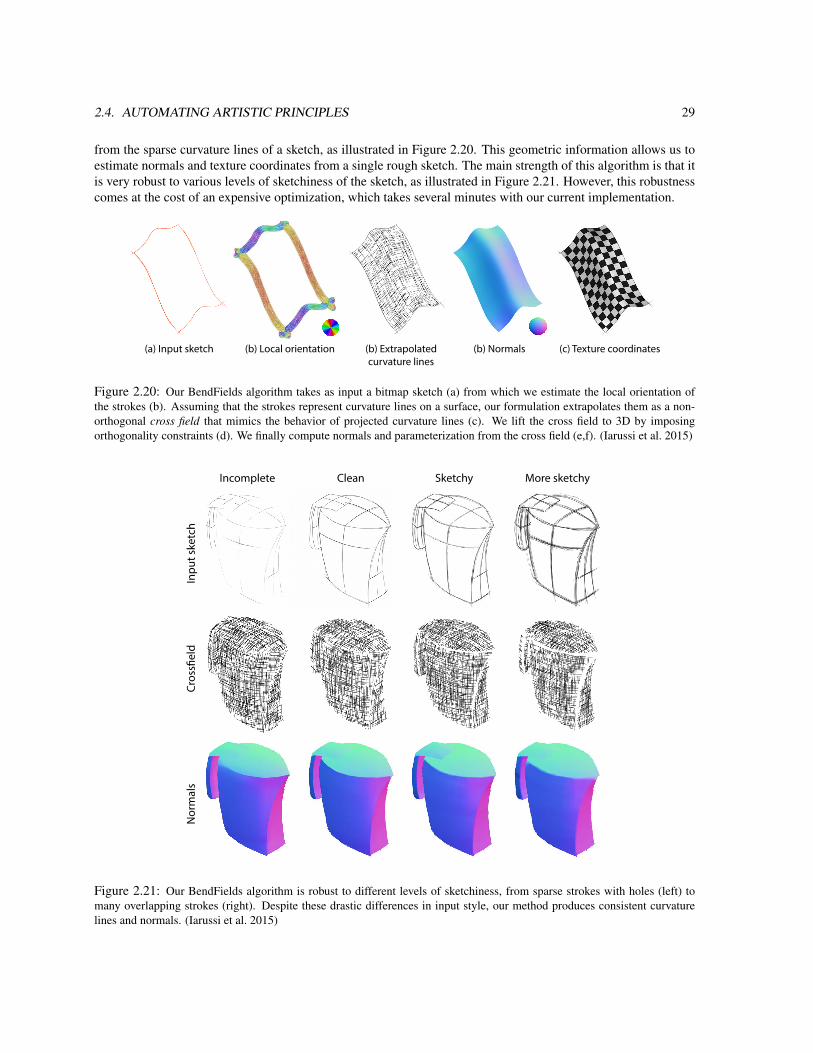
Figure 2.20: Our BendFields algorithm takes as input a bitmap sketch (a) from which we estimate the local orientation ofthe strokes (b). Assuming that the strokes represent curvature lines on a surface, our formulation extrapolates them as a non-orthogonal cross field that mimics the behavior of projected curvature lines (c). We lift the cross field to 3D by imposingorthogonality constraints (d). We finally compute normals and parameterization from the cross field (e,f). (Iarussi et al. 2015)
Incomplete Clean Sketchy More sketchy
Inpu
t ske
tch
Cros
s!el
dN
orm
als
Figure 2.21: Our BendFields algorithm is robust to different levels of sketchiness, from sparse strokes with holes (left) tomany overlapping strokes (right). Despite these drastic differences in input style, our method produces consistent curvaturelines and normals. (Iarussi et al. 2015)
30 CHAPTER 2. COMPUTER-ASSISTED DRAWING
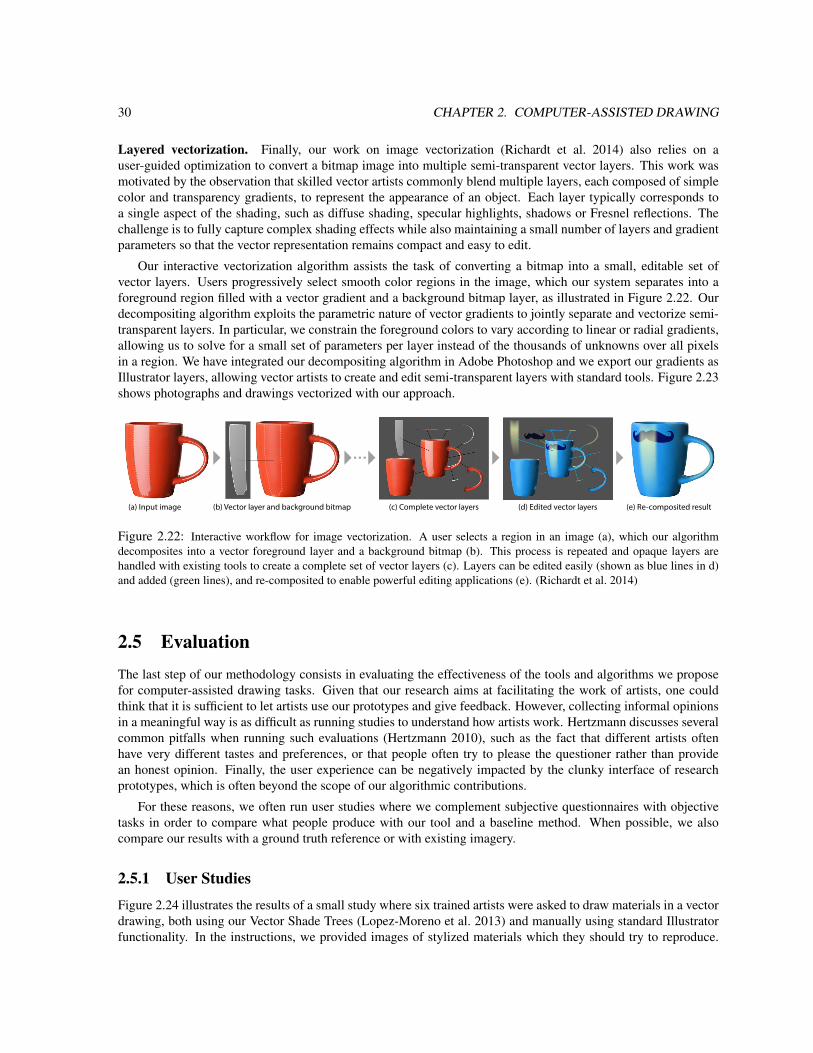
Layered vectorization. Finally, our work on image vectorization (Richardt et al. 2014) also relies on auser-guided optimization to convert a bitmap image into multiple semi-transparent vector layers. This work wasmotivated by the observation that skilled vector artists commonly blend multiple layers, each composed of simplecolor and transparency gradients, to represent the appearance of an object. Each layer typically corresponds toa single aspect of the shading, such as diffuse shading, specular highlights, shadows or Fresnel reflections. Thechallenge is to fully capture complex shading effects while also maintaining a small number of layers and gradientparameters so that the vector representation remains compact and easy to edit.
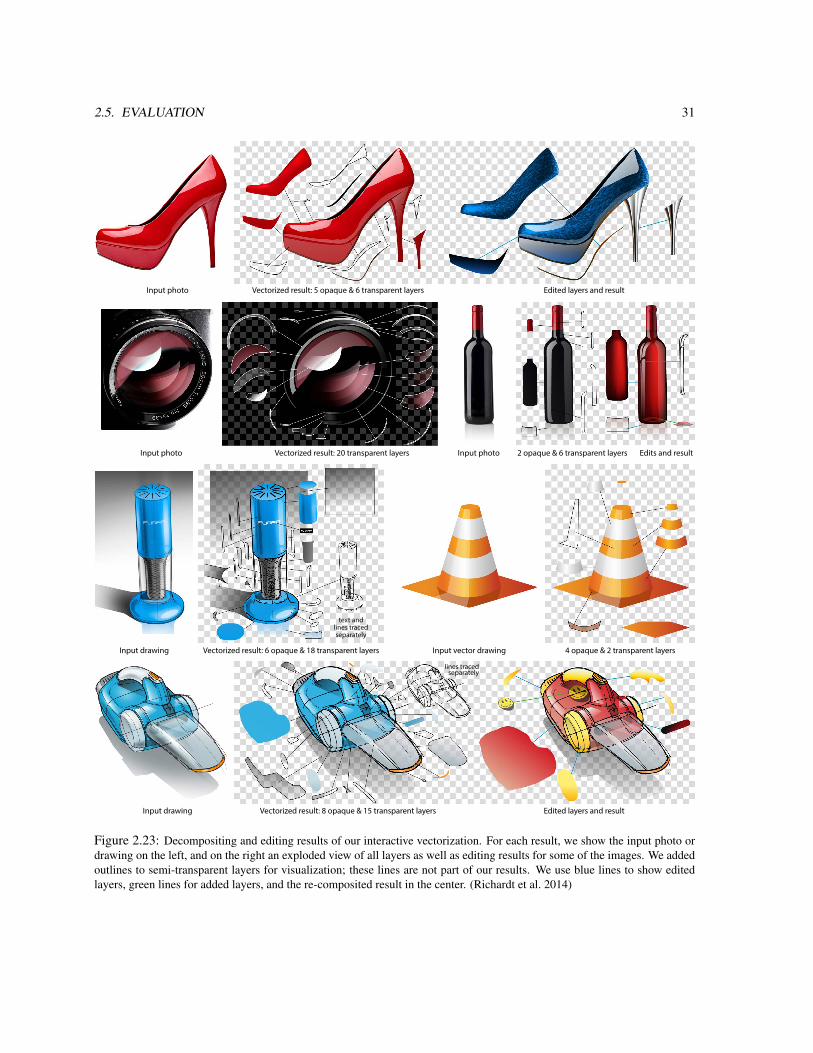
Our interactive vectorization algorithm assists the task of converting a bitmap into a small, editable set ofvector layers. Users progressively select smooth color regions in the image, which our system separates into aforeground region filled with a vector gradient and a background bitmap layer, as illustrated in Figure 2.22. Ourdecompositing algorithm exploits the parametric nature of vector gradients to jointly separate and vectorize semi-transparent layers. In particular, we constrain the foreground colors to vary according to linear or radial gradients,allowing us to solve for a small set of parameters per layer instead of the thousands of unknowns over all pixelsin a region. We have integrated our decompositing algorithm in Adobe Photoshop and we export our gradients asIllustrator layers, allowing vector artists to create and edit semi-transparent layers with standard tools. Figure 2.23shows photographs and drawings vectorized with our approach.
(e) Re-composited result(d) Edited vector layers(c) Complete vector layers(b) Vector layer and background bitmap(a) Input image
Figure 2.22: Interactive workflow for image vectorization. A user selects a region in an image (a), which our algorithmdecomposites into a vector foreground layer and a background bitmap (b). This process is repeated and opaque layers arehandled with existing tools to create a complete set of vector layers (c). Layers can be edited easily (shown as blue lines in d)and added (green lines), and re-composited to enable powerful editing applications (e). (Richardt et al. 2014)
2.5 EvaluationThe last step of our methodology consists in evaluating the effectiveness of the tools and algorithms we proposefor computer-assisted drawing tasks. Given that our research aims at facilitating the work of artists, one couldthink that it is sufficient to let artists use our prototypes and give feedback. However, collecting informal opinionsin a meaningful way is as difficult as running studies to understand how artists work. Hertzmann discusses severalcommon pitfalls when running such evaluations (Hertzmann 2010), such as the fact that different artists oftenhave very different tastes and preferences, or that people often try to please the questioner rather than providean honest opinion. Finally, the user experience can be negatively impacted by the clunky interface of researchprototypes, which is often beyond the scope of our algorithmic contributions.
For these reasons, we often run user studies where we complement subjective questionnaires with objectivetasks in order to compare what people produce with our tool and a baseline method. When possible, we alsocompare our results with a ground truth reference or with existing imagery.
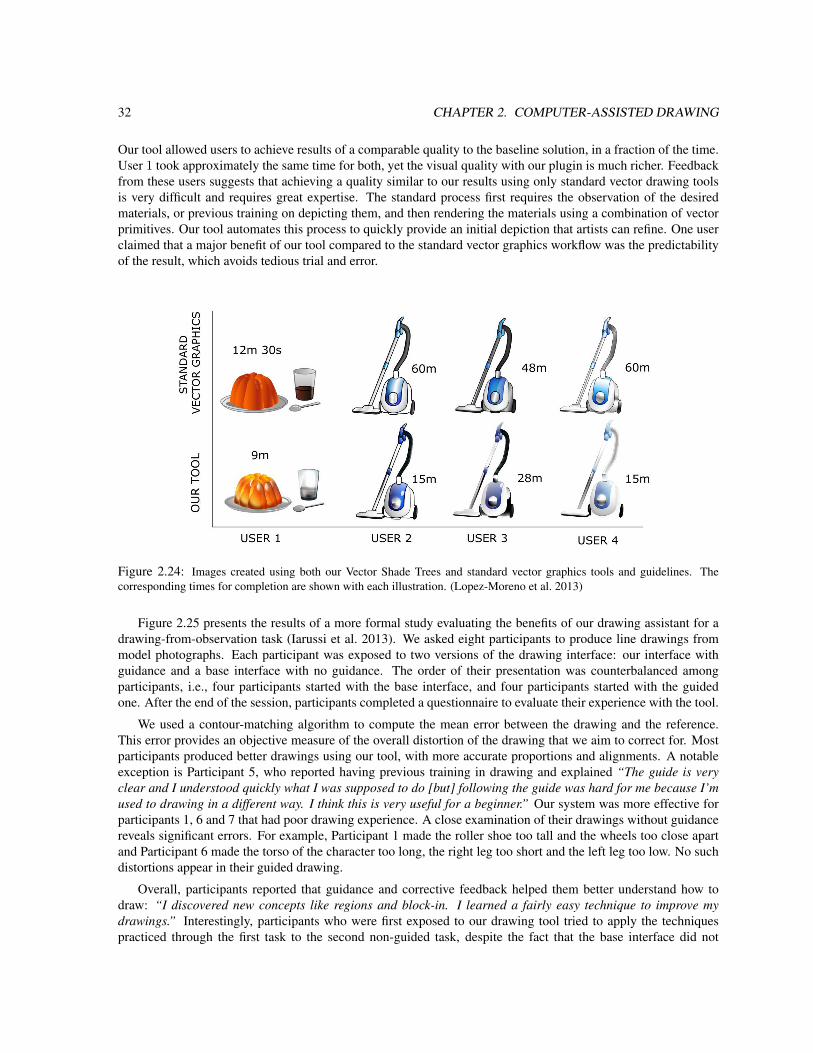
2.5.1 User StudiesFigure 2.24 illustrates the results of a small study where six trained artists were asked to draw materials in a vectordrawing, both using our Vector Shade Trees (Lopez-Moreno et al. 2013) and manually using standard Illustratorfunctionality. In the instructions, we provided images of stylized materials which they should try to reproduce.
2.5. EVALUATION 31
lines tracedseparately
Vectorized result: 8 opaque & 15 transparent layers Edited layers and resultInput drawing
4 opaque & 2 transparent layersInput vector drawing
text andlines tracedseparately
Vectorized result: 6 opaque & 18 transparent layersInput drawing
Edits and result2 opaque & 6 transparent layersInput photoVectorized result: 20 transparent layersInput photo
Edited layers and resultVectorized result: 5 opaque & 6 transparent layersInput photo
Figure 2.23: Decompositing and editing results of our interactive vectorization. For each result, we show the input photo ordrawing on the left, and on the right an exploded view of all layers as well as editing results for some of the images. We addedoutlines to semi-transparent layers for visualization; these lines are not part of our results. We use blue lines to show editedlayers, green lines for added layers, and the re-composited result in the center. (Richardt et al. 2014)
32 CHAPTER 2. COMPUTER-ASSISTED DRAWING
Our tool allowed users to achieve results of a comparable quality to the baseline solution, in a fraction of the time.User 1 took approximately the same time for both, yet the visual quality with our plugin is much richer. Feedbackfrom these users suggests that achieving a quality similar to our results using only standard vector drawing toolsis very difficult and requires great expertise. The standard process first requires the observation of the desiredmaterials, or previous training on depicting them, and then rendering the materials using a combination of vectorprimitives. Our tool automates this process to quickly provide an initial depiction that artists can refine. One userclaimed that a major benefit of our tool compared to the standard vector graphics workflow was the predictabilityof the result, which avoids tedious trial and error.
Figure 2.24: Images created using both our Vector Shade Trees and standard vector graphics tools and guidelines. Thecorresponding times for completion are shown with each illustration. (Lopez-Moreno et al. 2013)
Figure 2.25 presents the results of a more formal study evaluating the benefits of our drawing assistant for adrawing-from-observation task (Iarussi et al. 2013). We asked eight participants to produce line drawings frommodel photographs. Each participant was exposed to two versions of the drawing interface: our interface withguidance and a base interface with no guidance. The order of their presentation was counterbalanced amongparticipants, i.e., four participants started with the base interface, and four participants started with the guidedone. After the end of the session, participants completed a questionnaire to evaluate their experience with the tool.
We used a contour-matching algorithm to compute the mean error between the drawing and the reference.This error provides an objective measure of the overall distortion of the drawing that we aim to correct for. Mostparticipants produced better drawings using our tool, with more accurate proportions and alignments. A notableexception is Participant 5, who reported having previous training in drawing and explained “The guide is veryclear and I understood quickly what I was supposed to do [but] following the guide was hard for me because I’mused to drawing in a different way. I think this is very useful for a beginner.” Our system was more effective forparticipants 1, 6 and 7 that had poor drawing experience. A close examination of their drawings without guidancereveals significant errors. For example, Participant 1 made the roller shoe too tall and the wheels too close apartand Participant 6 made the torso of the character too long, the right leg too short and the left leg too low. No suchdistortions appear in their guided drawing.
Overall, participants reported that guidance and corrective feedback helped them better understand how todraw: “I discovered new concepts like regions and block-in. I learned a fairly easy technique to improve mydrawings.” Interestingly, participants who were first exposed to our drawing tool tried to apply the techniquespracticed through the first task to the second non-guided task, despite the fact that the base interface did not
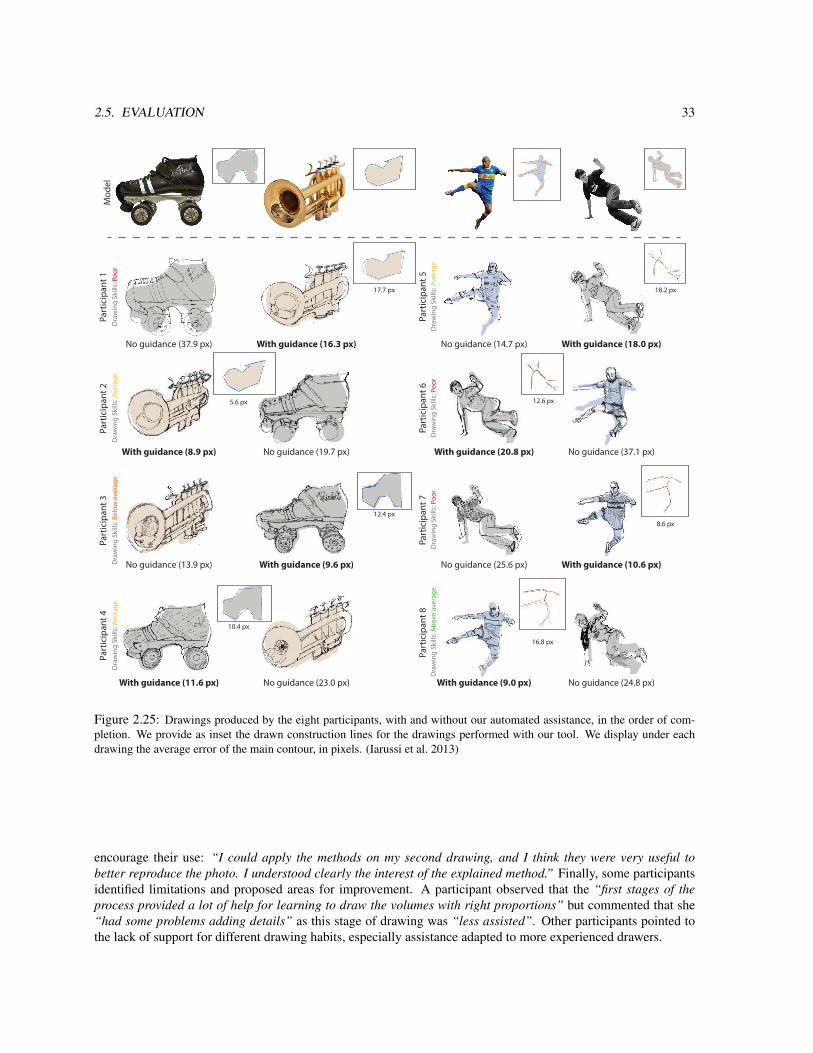
2.5. EVALUATION 33M
odel
With guidance (16.3 px)
With guidance (8.9 px) No guidance (19.7 px)
No guidance (13.9 px)
17.7 px
12.4 px
No guidance (14.7 px) With guidance (18.0 px)
No guidance (37.1 px)
18.2 px
With guidance (9.6 px)
No guidance (37.9 px)
5.6 px
With guidance (11.6 px) No guidance (23.0 px)
10.4 px
With guidance (20.8 px)
12.6 px
No guidance (25.6 px) With guidance (10.6 px)
8.6 px
With guidance (9.0 px) No guidance (24.8 px)
16.8 px
Part
icip
ant 1
Part
icip
ant 2
Part
icip
ant 3
Part
icip
ant 4
Part
icip
ant 5
Part
icip
ant 6
Part
icip
ant 7
Part
icip
ant 8
Dra
win
g Sk
ills:
Poor
Dra
win
g Sk
ills:
Aver
age
Dra
win
g Sk
ills:
Belo
w a
vera
geD
raw
ing
Skill
s: Av
erag
e
Dra
win
g Sk
ills:
Aver
age
Dra
win
g Sk
ills:
Poor
Dra
win
g Sk
ills:
Poor
Dra
win
g Sk
ills:
Abov
e av
erag
e
Figure 2.25: Drawings produced by the eight participants, with and without our automated assistance, in the order of com-pletion. We provide as inset the drawn construction lines for the drawings performed with our tool. We display under eachdrawing the average error of the main contour, in pixels. (Iarussi et al. 2013)
encourage their use: “I could apply the methods on my second drawing, and I think they were very useful tobetter reproduce the photo. I understood clearly the interest of the explained method.” Finally, some participantsidentified limitations and proposed areas for improvement. A participant observed that the “first stages of theprocess provided a lot of help for learning to draw the volumes with right proportions” but commented that she“had some problems adding details” as this stage of drawing was “less assisted”. Other participants pointed tothe lack of support for different drawing habits, especially assistance adapted to more experienced drawers.
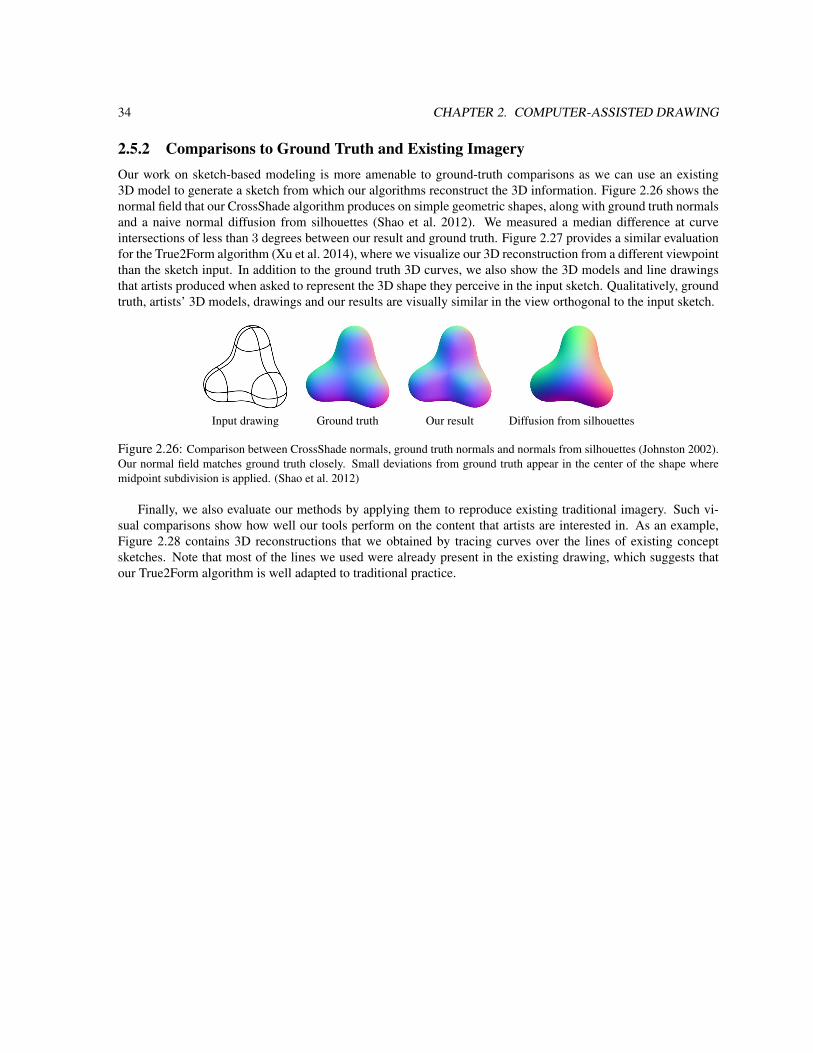
34 CHAPTER 2. COMPUTER-ASSISTED DRAWING
2.5.2 Comparisons to Ground Truth and Existing ImageryOur work on sketch-based modeling is more amenable to ground-truth comparisons as we can use an existing3D model to generate a sketch from which our algorithms reconstruct the 3D information. Figure 2.26 shows thenormal field that our CrossShade algorithm produces on simple geometric shapes, along with ground truth normalsand a naive normal diffusion from silhouettes (Shao et al. 2012). We measured a median difference at curveintersections of less than 3 degrees between our result and ground truth. Figure 2.27 provides a similar evaluationfor the True2Form algorithm (Xu et al. 2014), where we visualize our 3D reconstruction from a different viewpointthan the sketch input. In addition to the ground truth 3D curves, we also show the 3D models and line drawingsthat artists produced when asked to represent the 3D shape they perceive in the input sketch. Qualitatively, groundtruth, artists’ 3D models, drawings and our results are visually similar in the view orthogonal to the input sketch.
Input drawing Ground truth Our result Diffusion from silhouettes
Figure 2.26: Comparison between CrossShade normals, ground truth normals and normals from silhouettes (Johnston 2002).Our normal field matches ground truth closely. Small deviations from ground truth appear in the center of the shape wheremidpoint subdivision is applied. (Shao et al. 2012)
Finally, we also evaluate our methods by applying them to reproduce existing traditional imagery. Such vi-sual comparisons show how well our tools perform on the content that artists are interested in. As an example,Figure 2.28 contains 3D reconstructions that we obtained by tracing curves over the lines of existing conceptsketches. Note that most of the lines we used were already present in the existing drawing, which suggests thatour True2Form algorithm is well adapted to traditional practice.
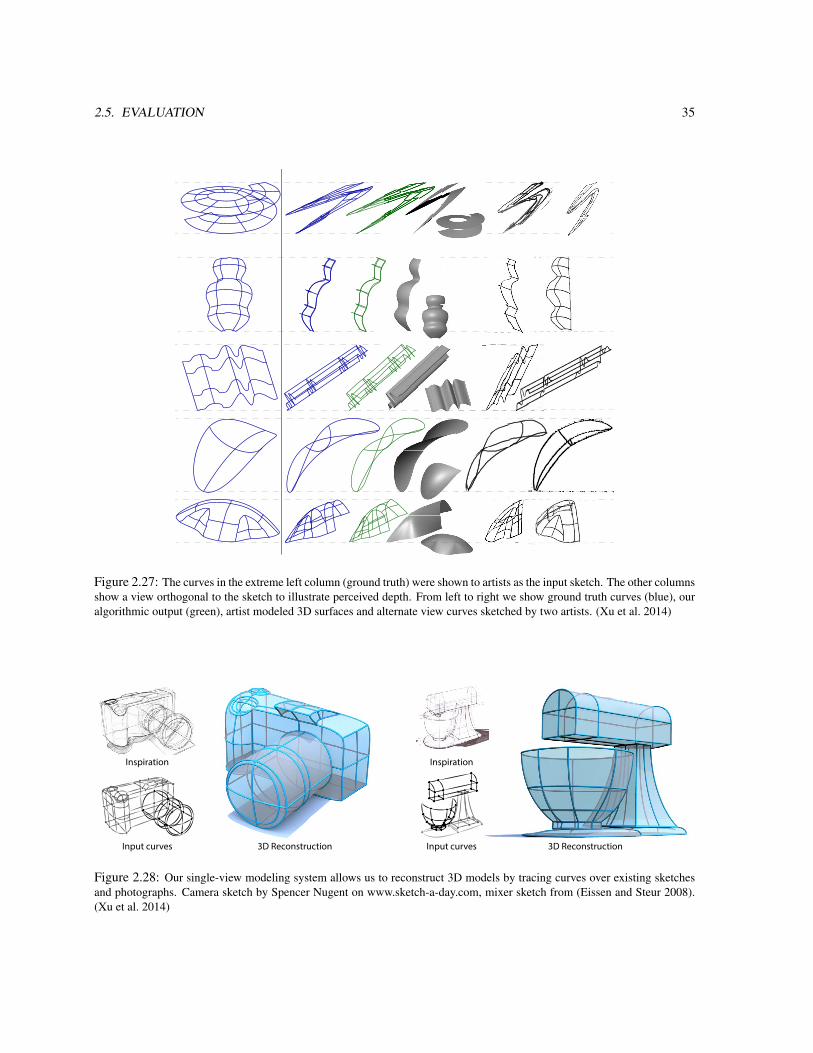
2.5. EVALUATION 35
Figure 2.27: The curves in the extreme left column (ground truth) were shown to artists as the input sketch. The other columnsshow a view orthogonal to the sketch to illustrate perceived depth. From left to right we show ground truth curves (blue), ouralgorithmic output (green), artist modeled 3D surfaces and alternate view curves sketched by two artists. (Xu et al. 2014)
Inspiration
Input curves 3D Reconstruction
Inspiration
Input curves 3D Reconstruction
Figure 2.28: Our single-view modeling system allows us to reconstruct 3D models by tracing curves over existing sketchesand photographs. Camera sketch by Spencer Nugent on www.sketch-a-day.com, mixer sketch from (Eissen and Steur 2008).(Xu et al. 2014)

36 CHAPTER 2. COMPUTER-ASSISTED DRAWING
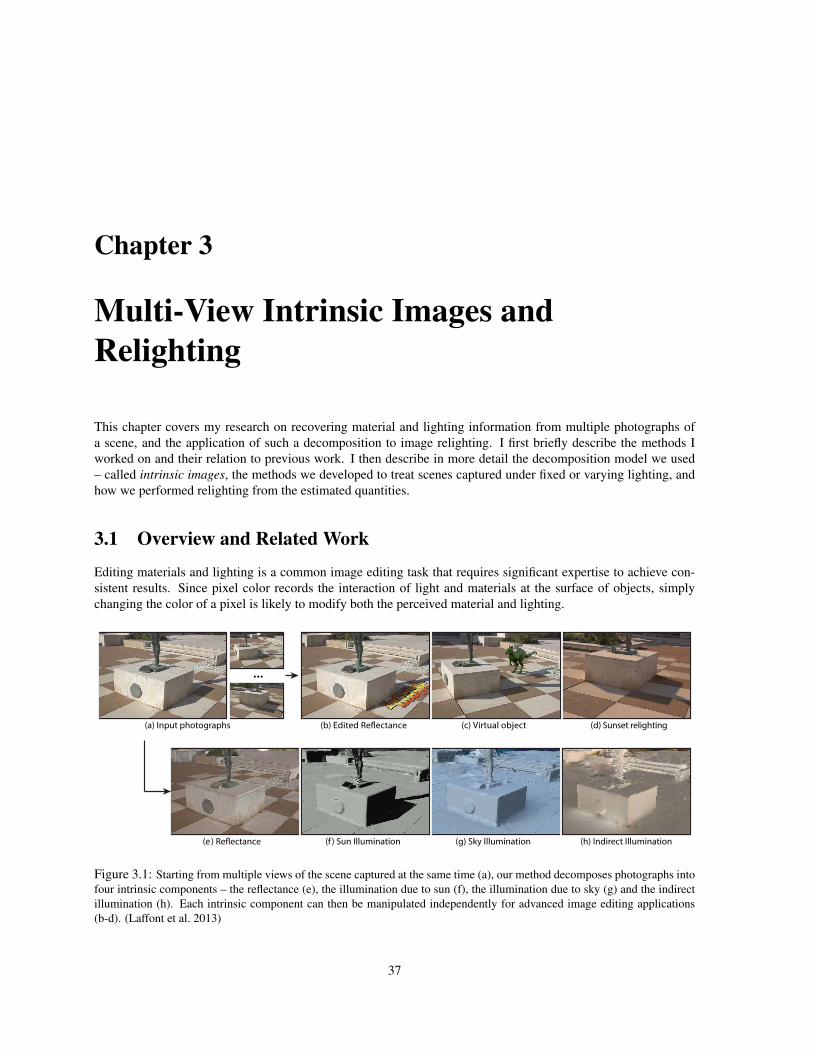
Chapter 3
Multi-View Intrinsic Images andRelighting
This chapter covers my research on recovering material and lighting information from multiple photographs ofa scene, and the application of such a decomposition to image relighting. I first briefly describe the methods Iworked on and their relation to previous work. I then describe in more detail the decomposition model we used– called intrinsic images, the methods we developed to treat scenes captured under fixed or varying lighting, andhow we performed relighting from the estimated quantities.
3.1 Overview and Related WorkEditing materials and lighting is a common image editing task that requires significant expertise to achieve con-sistent results. Since pixel color records the interaction of light and materials at the surface of objects, simplychanging the color of a pixel is likely to modify both the perceived material and lighting.
(a) Input photographs (b) (d) Sunset relighting
(f ) Sun Illumination (h) Indirect Illumination(g) Sky Illumination
...
(c) Virtual object
(e
Figure 3.1: Starting from multiple views of the scene captured at the same time (a), our method decomposes photographs intofour intrinsic components – the reflectance (e), the illumination due to sun (f), the illumination due to sky (g) and the indirectillumination (h). Each intrinsic component can then be manipulated independently for advanced image editing applications(b-d). (Laffont et al. 2013)
37
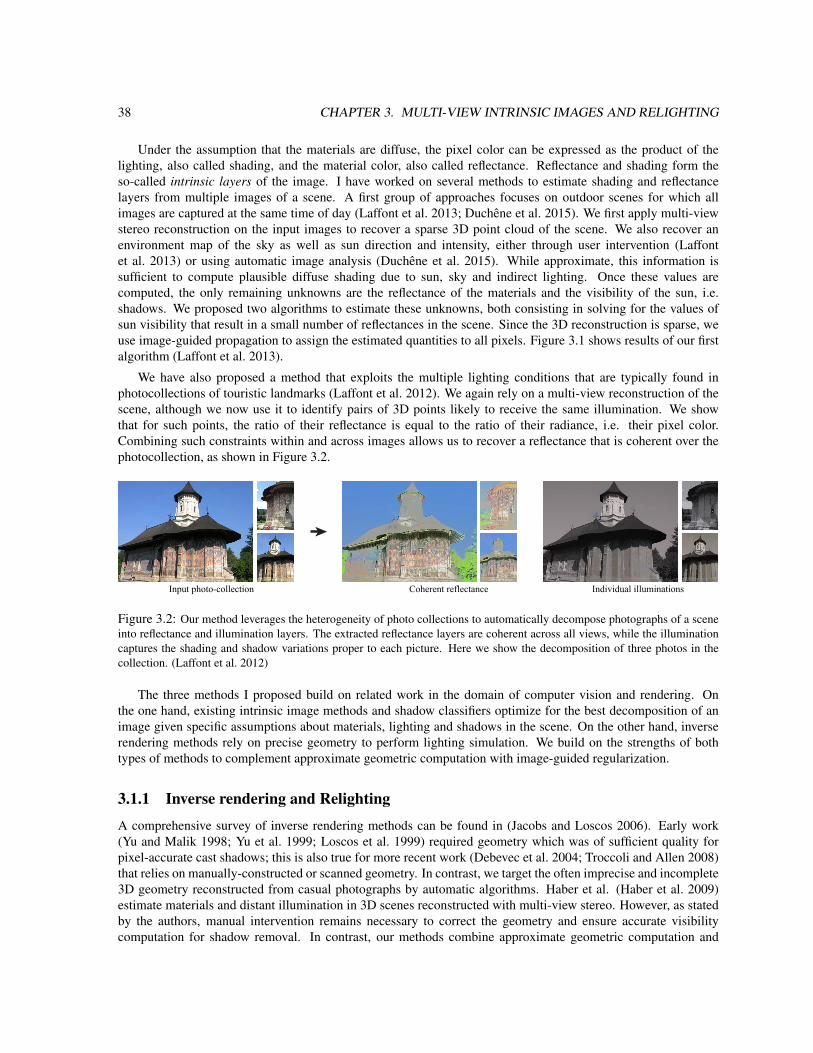
38 CHAPTER 3. MULTI-VIEW INTRINSIC IMAGES AND RELIGHTING
Under the assumption that the materials are diffuse, the pixel color can be expressed as the product of thelighting, also called shading, and the material color, also called reflectance. Reflectance and shading form theso-called intrinsic layers of the image. I have worked on several methods to estimate shading and reflectancelayers from multiple images of a scene. A first group of approaches focuses on outdoor scenes for which allimages are captured at the same time of day (Laffont et al. 2013; Duchene et al. 2015). We first apply multi-viewstereo reconstruction on the input images to recover a sparse 3D point cloud of the scene. We also recover anenvironment map of the sky as well as sun direction and intensity, either through user intervention (Laffontet al. 2013) or using automatic image analysis (Duchene et al. 2015). While approximate, this information issufficient to compute plausible diffuse shading due to sun, sky and indirect lighting. Once these values arecomputed, the only remaining unknowns are the reflectance of the materials and the visibility of the sun, i.e.shadows. We proposed two algorithms to estimate these unknowns, both consisting in solving for the values ofsun visibility that result in a small number of reflectances in the scene. Since the 3D reconstruction is sparse, weuse image-guided propagation to assign the estimated quantities to all pixels. Figure 3.1 shows results of our firstalgorithm (Laffont et al. 2013).
We have also proposed a method that exploits the multiple lighting conditions that are typically found inphotocollections of touristic landmarks (Laffont et al. 2012). We again rely on a multi-view reconstruction of thescene, although we now use it to identify pairs of 3D points likely to receive the same illumination. We showthat for such points, the ratio of their reflectance is equal to the ratio of their radiance, i.e. their pixel color.Combining such constraints within and across images allows us to recover a reflectance that is coherent over thephotocollection, as shown in Figure 3.2.
Input photo-collection Coherent reflectance Individual illuminations
Figure 3.2: Our method leverages the heterogeneity of photo collections to automatically decompose photographs of a sceneinto reflectance and illumination layers. The extracted reflectance layers are coherent across all views, while the illuminationcaptures the shading and shadow variations proper to each picture. Here we show the decomposition of three photos in thecollection. (Laffont et al. 2012)
The three methods I proposed build on related work in the domain of computer vision and rendering. Onthe one hand, existing intrinsic image methods and shadow classifiers optimize for the best decomposition of animage given specific assumptions about materials, lighting and shadows in the scene. On the other hand, inverserendering methods rely on precise geometry to perform lighting simulation. We build on the strengths of bothtypes of methods to complement approximate geometric computation with image-guided regularization.
3.1.1 Inverse rendering and RelightingA comprehensive survey of inverse rendering methods can be found in (Jacobs and Loscos 2006). Early work(Yu and Malik 1998; Yu et al. 1999; Loscos et al. 1999) required geometry which was of sufficient quality forpixel-accurate cast shadows; this is also true for more recent work (Debevec et al. 2004; Troccoli and Allen 2008)that relies on manually-constructed or scanned geometry. In contrast, we target the often imprecise and incomplete3D geometry reconstructed from casual photographs by automatic algorithms. Haber et al. (Haber et al. 2009)estimate materials and distant illumination in 3D scenes reconstructed with multi-view stereo. However, as statedby the authors, manual intervention remains necessary to correct the geometry and ensure accurate visibilitycomputation for shadow removal. In contrast, our methods combine approximate geometric computation and
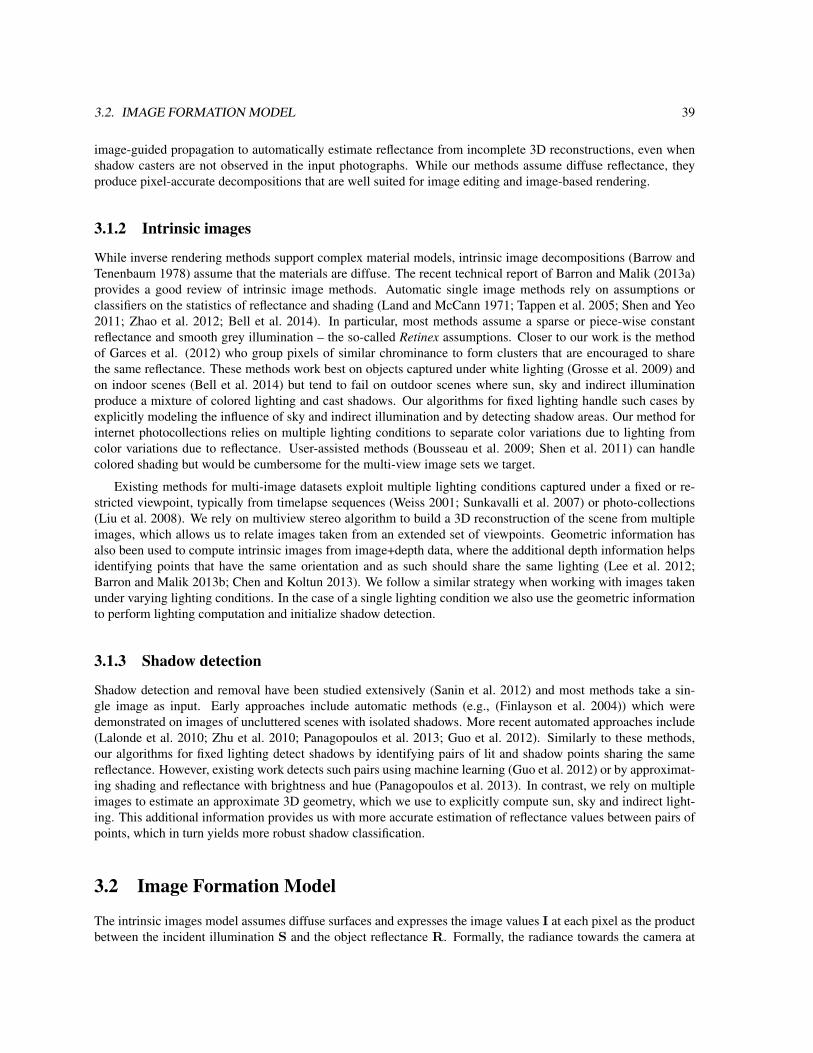
3.2. IMAGE FORMATION MODEL 39
image-guided propagation to automatically estimate reflectance from incomplete 3D reconstructions, even whenshadow casters are not observed in the input photographs. While our methods assume diffuse reflectance, theyproduce pixel-accurate decompositions that are well suited for image editing and image-based rendering.
3.1.2 Intrinsic images
While inverse rendering methods support complex material models, intrinsic image decompositions (Barrow andTenenbaum 1978) assume that the materials are diffuse. The recent technical report of Barron and Malik (2013a)provides a good review of intrinsic image methods. Automatic single image methods rely on assumptions orclassifiers on the statistics of reflectance and shading (Land and McCann 1971; Tappen et al. 2005; Shen and Yeo2011; Zhao et al. 2012; Bell et al. 2014). In particular, most methods assume a sparse or piece-wise constantreflectance and smooth grey illumination – the so-called Retinex assumptions. Closer to our work is the methodof Garces et al. (2012) who group pixels of similar chrominance to form clusters that are encouraged to sharethe same reflectance. These methods work best on objects captured under white lighting (Grosse et al. 2009) andon indoor scenes (Bell et al. 2014) but tend to fail on outdoor scenes where sun, sky and indirect illuminationproduce a mixture of colored lighting and cast shadows. Our algorithms for fixed lighting handle such cases byexplicitly modeling the influence of sky and indirect illumination and by detecting shadow areas. Our method forinternet photocollections relies on multiple lighting conditions to separate color variations due to lighting fromcolor variations due to reflectance. User-assisted methods (Bousseau et al. 2009; Shen et al. 2011) can handlecolored shading but would be cumbersome for the multi-view image sets we target.
Existing methods for multi-image datasets exploit multiple lighting conditions captured under a fixed or re-stricted viewpoint, typically from timelapse sequences (Weiss 2001; Sunkavalli et al. 2007) or photo-collections(Liu et al. 2008). We rely on multiview stereo algorithm to build a 3D reconstruction of the scene from multipleimages, which allows us to relate images taken from an extended set of viewpoints. Geometric information hasalso been used to compute intrinsic images from image+depth data, where the additional depth information helpsidentifying points that have the same orientation and as such should share the same lighting (Lee et al. 2012;Barron and Malik 2013b; Chen and Koltun 2013). We follow a similar strategy when working with images takenunder varying lighting conditions. In the case of a single lighting condition we also use the geometric informationto perform lighting computation and initialize shadow detection.
3.1.3 Shadow detection
Shadow detection and removal have been studied extensively (Sanin et al. 2012) and most methods take a sin-gle image as input. Early approaches include automatic methods (e.g., (Finlayson et al. 2004)) which weredemonstrated on images of uncluttered scenes with isolated shadows. More recent automated approaches include(Lalonde et al. 2010; Zhu et al. 2010; Panagopoulos et al. 2013; Guo et al. 2012). Similarly to these methods,our algorithms for fixed lighting detect shadows by identifying pairs of lit and shadow points sharing the samereflectance. However, existing work detects such pairs using machine learning (Guo et al. 2012) or by approximat-ing shading and reflectance with brightness and hue (Panagopoulos et al. 2013). In contrast, we rely on multipleimages to estimate an approximate 3D geometry, which we use to explicitly compute sun, sky and indirect light-ing. This additional information provides us with more accurate estimation of reflectance values between pairs ofpoints, which in turn yields more robust shadow classification.
3.2 Image Formation Model
The intrinsic images model assumes diffuse surfaces and expresses the image values I at each pixel as the productbetween the incident illumination S and the object reflectance R. Formally, the radiance towards the camera at
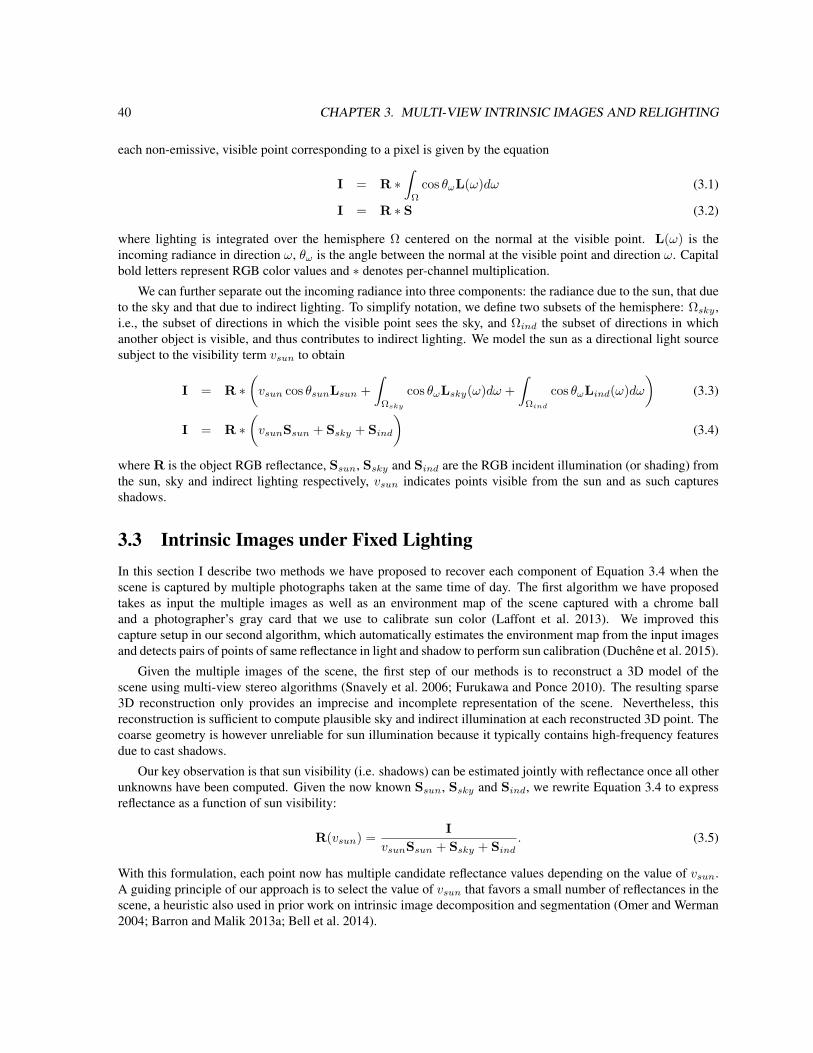
40 CHAPTER 3. MULTI-VIEW INTRINSIC IMAGES AND RELIGHTING
each non-emissive, visible point corresponding to a pixel is given by the equation
I = R ∗
Ωcos θωL(ω)dω (3.1)
I = R ∗ S (3.2)
where lighting is integrated over the hemisphere Ω centered on the normal at the visible point. L(ω) is theincoming radiance in direction ω, θω is the angle between the normal at the visible point and direction ω. Capitalbold letters represent RGB color values and ∗ denotes per-channel multiplication.
We can further separate out the incoming radiance into three components: the radiance due to the sun, that dueto the sky and that due to indirect lighting. To simplify notation, we define two subsets of the hemisphere: Ωsky ,i.e., the subset of directions in which the visible point sees the sky, and Ωind the subset of directions in whichanother object is visible, and thus contributes to indirect lighting. We model the sun as a directional light sourcesubject to the visibility term vsun to obtain
I = R ∗
vsun cos θsunLsun +
Ωsky
cos θωLsky(ω)dω +
Ωind
cos θωLind(ω)dω
(3.3)
I = R ∗
vsunSsun + Ssky + Sind
(3.4)
where R is the object RGB reflectance, Ssun, Ssky and Sind are the RGB incident illumination (or shading) fromthe sun, sky and indirect lighting respectively, vsun indicates points visible from the sun and as such capturesshadows.
3.3 Intrinsic Images under Fixed LightingIn this section I describe two methods we have proposed to recover each component of Equation 3.4 when thescene is captured by multiple photographs taken at the same time of day. The first algorithm we have proposedtakes as input the multiple images as well as an environment map of the scene captured with a chrome balland a photographer’s gray card that we use to calibrate sun color (Laffont et al. 2013). We improved thiscapture setup in our second algorithm, which automatically estimates the environment map from the input imagesand detects pairs of points of same reflectance in light and shadow to perform sun calibration (Duchene et al. 2015).
Given the multiple images of the scene, the first step of our methods is to reconstruct a 3D model of thescene using multi-view stereo algorithms (Snavely et al. 2006; Furukawa and Ponce 2010). The resulting sparse3D reconstruction only provides an imprecise and incomplete representation of the scene. Nevertheless, thisreconstruction is sufficient to compute plausible sky and indirect illumination at each reconstructed 3D point. Thecoarse geometry is however unreliable for sun illumination because it typically contains high-frequency featuresdue to cast shadows.
Our key observation is that sun visibility (i.e. shadows) can be estimated jointly with reflectance once all otherunknowns have been computed. Given the now known Ssun, Ssky and Sind, we rewrite Equation 3.4 to expressreflectance as a function of sun visibility:
R(vsun) =I
vsunSsun + Ssky + Sind. (3.5)
With this formulation, each point now has multiple candidate reflectance values depending on the value of vsun.A guiding principle of our approach is to select the value of vsun that favors a small number of reflectances in thescene, a heuristic also used in prior work on intrinsic image decomposition and segmentation (Omer and Werman2004; Barron and Malik 2013a; Bell et al. 2014).
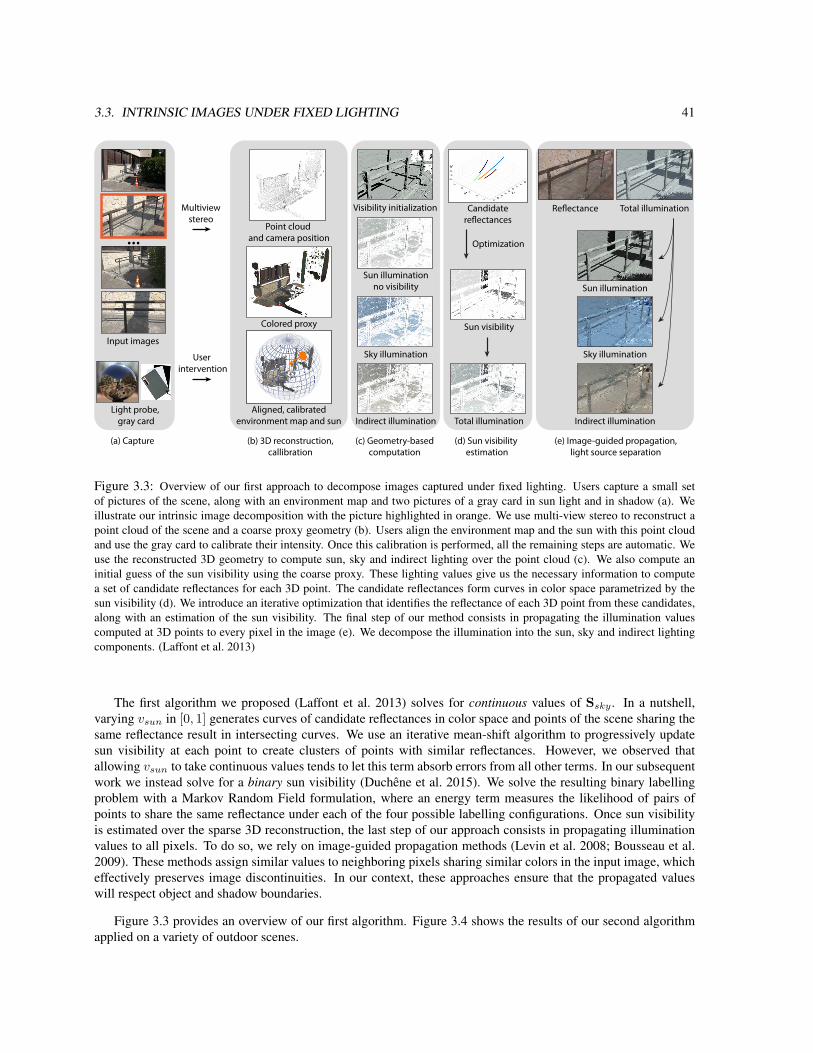
3.3. INTRINSIC IMAGES UNDER FIXED LIGHTING 41
...
Input images
Light probe, gray card
Point cloud and camera position
Multiviewstereo
User intervention
Aligned, calibratedenvironment map and sun
Sun illuminationno visibility
Sky illumination
Indirect illumination
Visibility initialization Candidate
Sun visibility
Optimization
Total illumination
Sun illumination
Sky illumination
Indirect illumination
(a) Capture (b) 3D reconstruction,callibration
(c) Geometry-basedcomputation
(d) Sun visibility estimation
(e) Image-guided propagation,light source separation
Colored proxy
Total illumination
Figure 3.3: Overview of our first approach to decompose images captured under fixed lighting. Users capture a small setof pictures of the scene, along with an environment map and two pictures of a gray card in sun light and in shadow (a). Weillustrate our intrinsic image decomposition with the picture highlighted in orange. We use multi-view stereo to reconstruct apoint cloud of the scene and a coarse proxy geometry (b). Users align the environment map and the sun with this point cloudand use the gray card to calibrate their intensity. Once this calibration is performed, all the remaining steps are automatic. Weuse the reconstructed 3D geometry to compute sun, sky and indirect lighting over the point cloud (c). We also compute aninitial guess of the sun visibility using the coarse proxy. These lighting values give us the necessary information to computea set of candidate reflectances for each 3D point. The candidate reflectances form curves in color space parametrized by thesun visibility (d). We introduce an iterative optimization that identifies the reflectance of each 3D point from these candidates,along with an estimation of the sun visibility. The final step of our method consists in propagating the illumination valuescomputed at 3D points to every pixel in the image (e). We decompose the illumination into the sun, sky and indirect lightingcomponents. (Laffont et al. 2013)
The first algorithm we proposed (Laffont et al. 2013) solves for continuous values of Ssky . In a nutshell,varying vsun in [0, 1] generates curves of candidate reflectances in color space and points of the scene sharing thesame reflectance result in intersecting curves. We use an iterative mean-shift algorithm to progressively updatesun visibility at each point to create clusters of points with similar reflectances. However, we observed thatallowing vsun to take continuous values tends to let this term absorb errors from all other terms. In our subsequentwork we instead solve for a binary sun visibility (Duchene et al. 2015). We solve the resulting binary labellingproblem with a Markov Random Field formulation, where an energy term measures the likelihood of pairs ofpoints to share the same reflectance under each of the four possible labelling configurations. Once sun visibilityis estimated over the sparse 3D reconstruction, the last step of our approach consists in propagating illuminationvalues to all pixels. To do so, we rely on image-guided propagation methods (Levin et al. 2008; Bousseau et al.2009). These methods assign similar values to neighboring pixels sharing similar colors in the input image, whicheffectively preserves image discontinuities. In our context, these approaches ensure that the propagated valueswill respect object and shadow boundaries.
Figure 3.3 provides an overview of our first algorithm. Figure 3.4 shows the results of our second algorithmapplied on a variety of outdoor scenes.
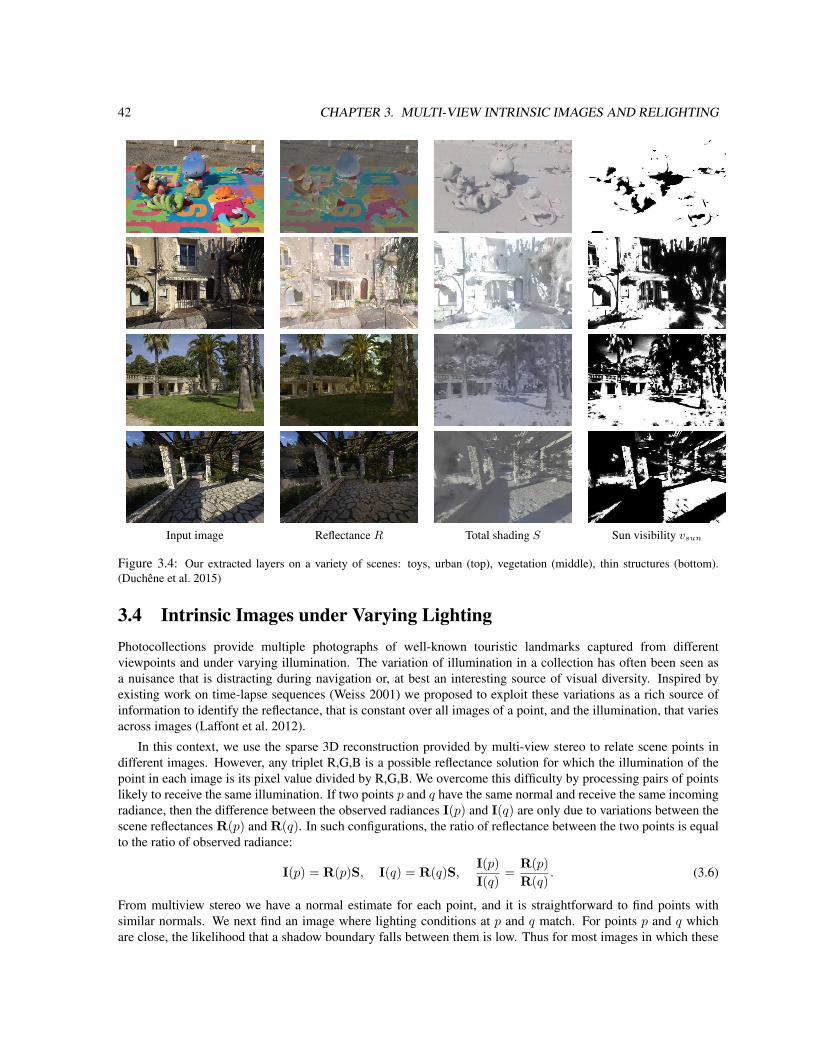
42 CHAPTER 3. MULTI-VIEW INTRINSIC IMAGES AND RELIGHTING
Input image Reflectance R Total shading S Sun visibility vsun
Figure 3.4: Our extracted layers on a variety of scenes: toys, urban (top), vegetation (middle), thin structures (bottom).(Duchene et al. 2015)
3.4 Intrinsic Images under Varying LightingPhotocollections provide multiple photographs of well-known touristic landmarks captured from differentviewpoints and under varying illumination. The variation of illumination in a collection has often been seen asa nuisance that is distracting during navigation or, at best an interesting source of visual diversity. Inspired byexisting work on time-lapse sequences (Weiss 2001) we proposed to exploit these variations as a rich source ofinformation to identify the reflectance, that is constant over all images of a point, and the illumination, that variesacross images (Laffont et al. 2012).
In this context, we use the sparse 3D reconstruction provided by multi-view stereo to relate scene points indifferent images. However, any triplet R,G,B is a possible reflectance solution for which the illumination of thepoint in each image is its pixel value divided by R,G,B. We overcome this difficulty by processing pairs of pointslikely to receive the same illumination. If two points p and q have the same normal and receive the same incomingradiance, then the difference between the observed radiances I(p) and I(q) are only due to variations between thescene reflectances R(p) and R(q). In such configurations, the ratio of reflectance between the two points is equalto the ratio of observed radiance:
I(p) = R(p)S, I(q) = R(q)S,I(p)I(q)
=R(p)R(q)
. (3.6)
From multiview stereo we have a normal estimate for each point, and it is straightforward to find points withsimilar normals. We next find an image where lighting conditions at p and q match. For points p and q whichare close, the likelihood that a shadow boundary falls between them is low. Thus for most images in which these
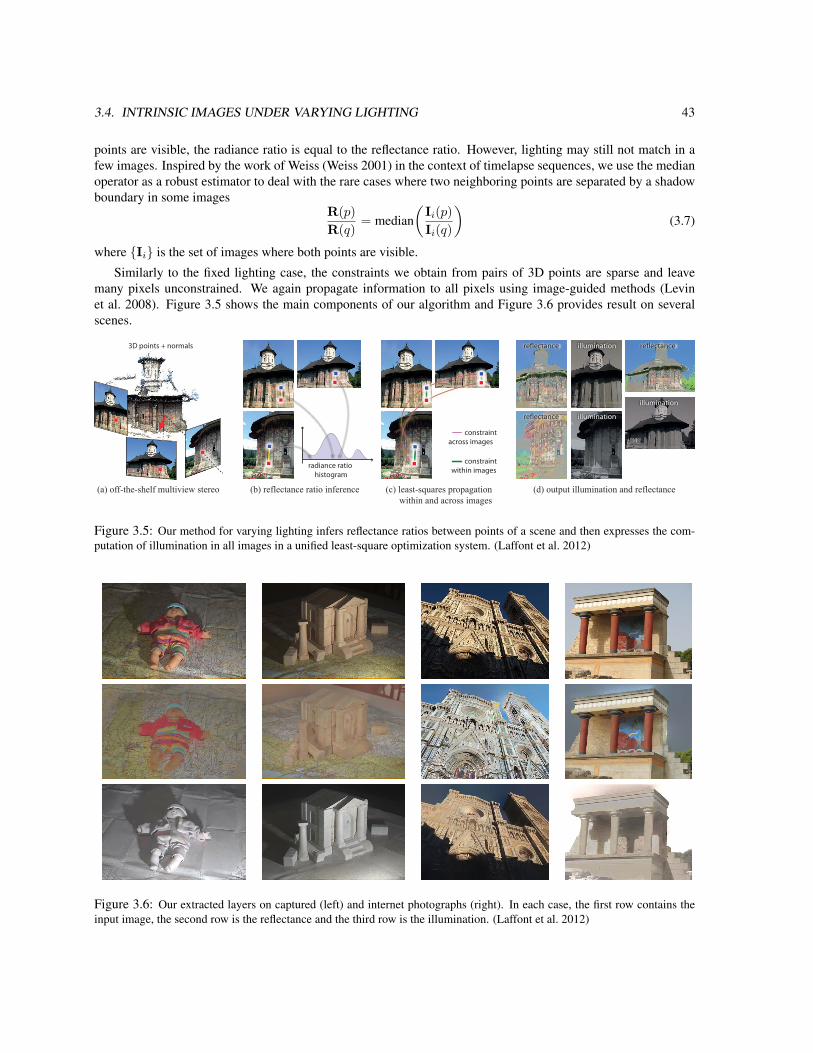
3.4. INTRINSIC IMAGES UNDER VARYING LIGHTING 43
points are visible, the radiance ratio is equal to the reflectance ratio. However, lighting may still not match in afew images. Inspired by the work of Weiss (Weiss 2001) in the context of timelapse sequences, we use the medianoperator as a robust estimator to deal with the rare cases where two neighboring points are separated by a shadowboundary in some images
R(p)R(q)
= median
Ii(p)Ii(q)
(3.7)
where Ii is the set of images where both points are visible.Similarly to the fixed lighting case, the constraints we obtain from pairs of 3D points are sparse and leave
many pixels unconstrained. We again propagate information to all pixels using image-guided methods (Levinet al. 2008). Figure 3.5 shows the main components of our algorithm and Figure 3.6 provides result on severalscenes.
(a) off-the-shelf multiview stereo (b) reflectance ratio inference (c) least-squares propagationwithin and across images
(d) output illumination and reflectance
3D points + normals
constraintacross images
constraintwithin images
radiance ratiohistogram
re!ectance re!ectance
illuminationre!ectance
illumination
illumination
Figure 3.5: Our method for varying lighting infers reflectance ratios between points of a scene and then expresses the com-putation of illumination in all images in a unified least-square optimization system. (Laffont et al. 2012)
Figure 3.6: Our extracted layers on captured (left) and internet photographs (right). In each case, the first row contains theinput image, the second row is the reflectance and the third row is the illumination. (Laffont et al. 2012)
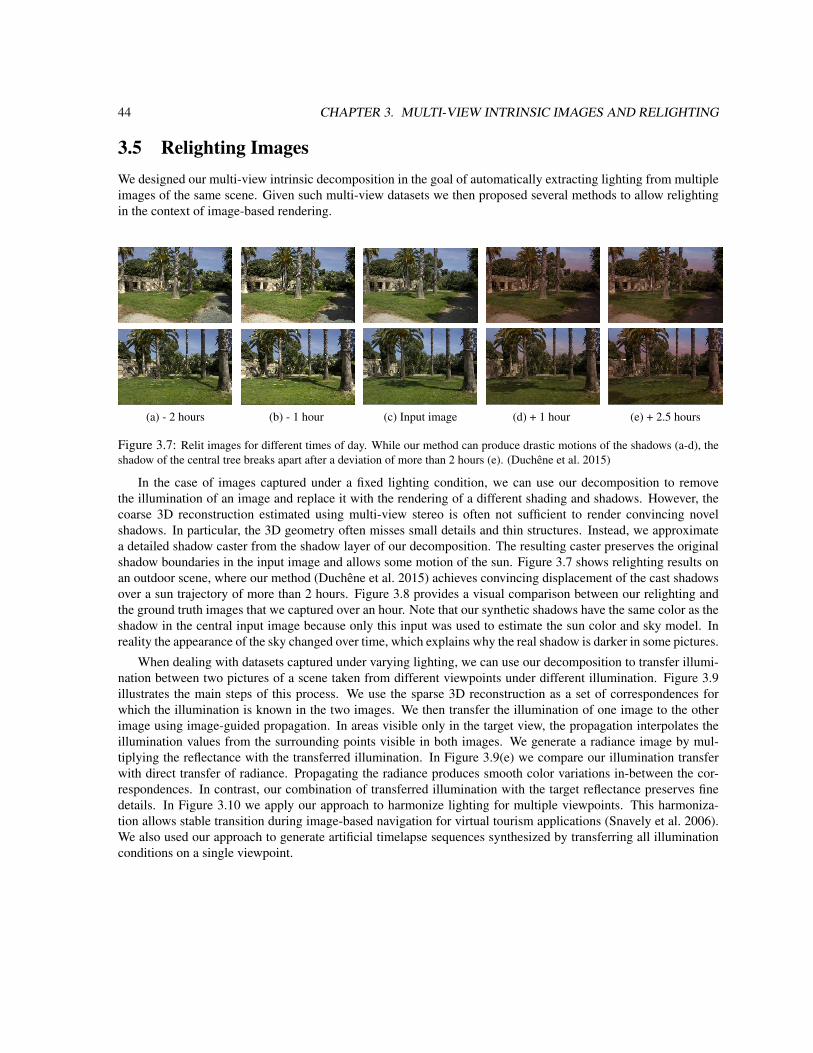
44 CHAPTER 3. MULTI-VIEW INTRINSIC IMAGES AND RELIGHTING
3.5 Relighting ImagesWe designed our multi-view intrinsic decomposition in the goal of automatically extracting lighting from multipleimages of the same scene. Given such multi-view datasets we then proposed several methods to allow relightingin the context of image-based rendering.
(a) - 2 hours (b) - 1 hour (c) Input image (d) + 1 hour (e) + 2.5 hours
Figure 3.7: Relit images for different times of day. While our method can produce drastic motions of the shadows (a-d), theshadow of the central tree breaks apart after a deviation of more than 2 hours (e). (Duchene et al. 2015)
In the case of images captured under a fixed lighting condition, we can use our decomposition to removethe illumination of an image and replace it with the rendering of a different shading and shadows. However, thecoarse 3D reconstruction estimated using multi-view stereo is often not sufficient to render convincing novelshadows. In particular, the 3D geometry often misses small details and thin structures. Instead, we approximatea detailed shadow caster from the shadow layer of our decomposition. The resulting caster preserves the originalshadow boundaries in the input image and allows some motion of the sun. Figure 3.7 shows relighting results onan outdoor scene, where our method (Duchene et al. 2015) achieves convincing displacement of the cast shadowsover a sun trajectory of more than 2 hours. Figure 3.8 provides a visual comparison between our relighting andthe ground truth images that we captured over an hour. Note that our synthetic shadows have the same color as theshadow in the central input image because only this input was used to estimate the sun color and sky model. Inreality the appearance of the sky changed over time, which explains why the real shadow is darker in some pictures.
When dealing with datasets captured under varying lighting, we can use our decomposition to transfer illumi-nation between two pictures of a scene taken from different viewpoints under different illumination. Figure 3.9illustrates the main steps of this process. We use the sparse 3D reconstruction as a set of correspondences forwhich the illumination is known in the two images. We then transfer the illumination of one image to the otherimage using image-guided propagation. In areas visible only in the target view, the propagation interpolates theillumination values from the surrounding points visible in both images. We generate a radiance image by mul-tiplying the reflectance with the transferred illumination. In Figure 3.9(e) we compare our illumination transferwith direct transfer of radiance. Propagating the radiance produces smooth color variations in-between the cor-respondences. In contrast, our combination of transferred illumination with the target reflectance preserves finedetails. In Figure 3.10 we apply our approach to harmonize lighting for multiple viewpoints. This harmoniza-tion allows stable transition during image-based navigation for virtual tourism applications (Snavely et al. 2006).We also used our approach to generate artificial timelapse sequences synthesized by transferring all illuminationconditions on a single viewpoint.
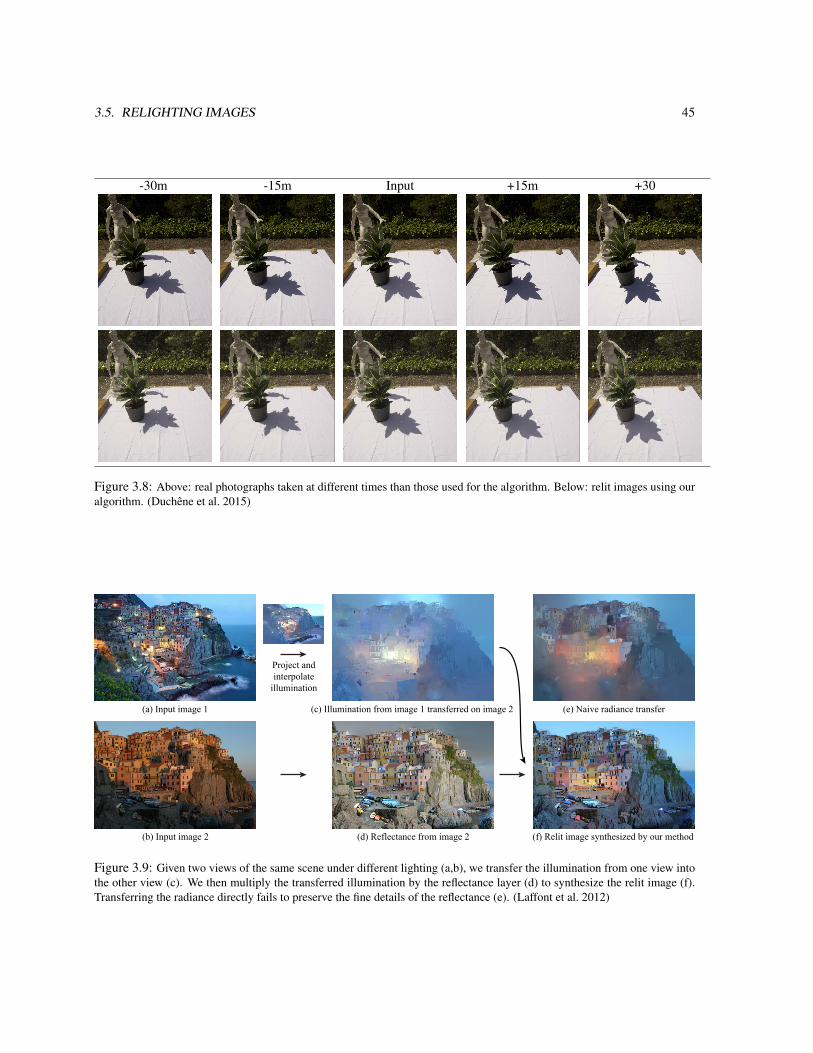
3.5. RELIGHTING IMAGES 45
-30m -15m Input +15m +30
Figure 3.8: Above: real photographs taken at different times than those used for the algorithm. Below: relit images using ouralgorithm. (Duchene et al. 2015)
(a) Input image 1
(b) Input image 2
Project andinterpolateillumination
(c) Illumination from image 1 transferred on image 2 (e) Naive radiance transfer
(d) Reflectance from image 2 (f) Relit image synthesized by our method
Figure 3.9: Given two views of the same scene under different lighting (a,b), we transfer the illumination from one view intothe other view (c). We then multiply the transferred illumination by the reflectance layer (d) to synthesize the relit image (f).Transferring the radiance directly fails to preserve the fine details of the reflectance (e). (Laffont et al. 2012)
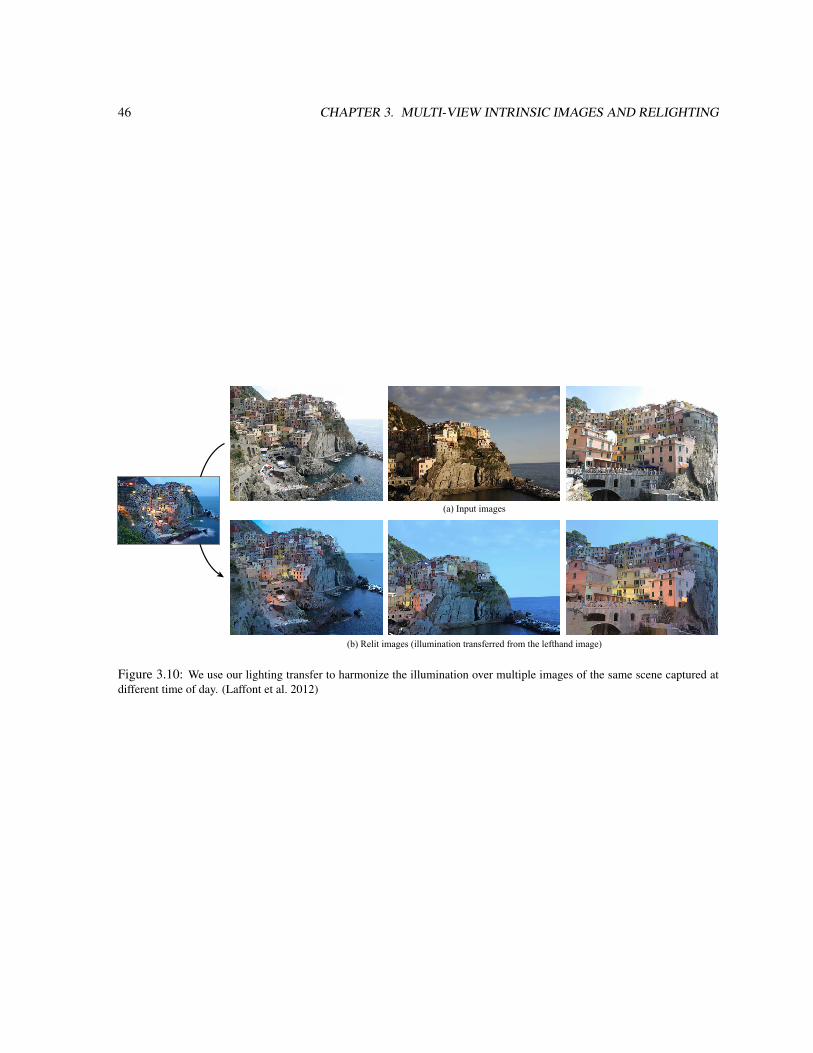
46 CHAPTER 3. MULTI-VIEW INTRINSIC IMAGES AND RELIGHTING
(a) Input images
(b) Relit images (illumination transferred from the lefthand image)
Figure 3.10: We use our lighting transfer to harmonize the illumination over multiple images of the same scene captured atdifferent time of day. (Laffont et al. 2012)
Chapter 4
Conclusion and Future Work
I have presented my research on computer-assisted drawing and on image relighting. A significant part of thisresearch has been motivated by observations on how people create images, from which I distilled and formalizedcommon artistic techniques about shape, material and lighting depiction. Complementing these observations withknowledge in perception, graphics, vision and geometry allowed me to propose algorithms capable of assistingor automating tedious aspects of image creation. I strongly believe that the methodology I have described in thisdocument can apply to other problems in content creation. In particular, I am interested in exploring the followingresearch directions:
Physical prototyping. The advent of rapid prototyping technology such as 3D printers and laser cuttersallows designers to quickly test the form and functionality of a concept in the physical world. However, thesemanufacturing technologies impose various restrictions on the type of shapes that can be created. In addition,designers often favor prototyping materials that are easy to manipulate but complex to assemble automatically,such as paper, cardboard, foam, metal wire and clay (Hallgrimsson 2012). Such rough prototypes form “physicalsketches” that currently need to be converted into 3D models by hand. Inspired by my research on sketch-basedmodeling for product design, I plan to develop 3D reconstruction and modeling algorithms dedicated to thecapture and editing of such physical prototypes. Traditional sculpture techniques, such as intermediate scaffoldsand jigs, could also be automated to facilitate fabrication and assembly of prototypes.
Designers also often create new objects by considering the real context in which the object will be used.Such an application scenario suggests that context should be accounted for when interpreting design sketches. Werecently proposed an algorithm in that spirit, which interprets architectural line drawings by exploiting informationabout the real 3D scene in which the building should integrate (Favreau et al. 2015).
Personal style. I have presented several sketch-based modeling algorithms that exploit the cross-section linesthat designers draw to convey surface curvature. Similarly, other systems have been proposed to exploit scaffolds(Schmidt et al. 2009) and other forms of annotations (Gingold et al. 2009). While effective, these algorithmsimpose a specific drawing technique on users, at a stage where artists rather want to draw freely without externaldistraction. Instead of constraining users, I envision sketch-based modeling as a tool capable of conforming to thedrawing techniques specific to each artist. I plan to explore the use of machine learning to predict the techniquesused by a designer and adapt the 3D reconstruction algorithm accordingly. Similarly to speech recognitionsystems that require a training phase to adapt to the accent of an individual, users of such an approach would firsttrain the system by drawing known shapes using their own techniques.
A major difficulty in developing a sketch-based modeling tool based on machine learning is to collect sufficientdata to train the algorithms. Crowdsourcing is a common strategy to collect large training sets. While popularcrowdsourcing websites like Amazon Mechanical Turk provide access to users with no training, dedicated websitessuch as Odesk, DesignCrowd and 99Designs could facilitate access to professionals.
47
48 CHAPTER 4. CONCLUSION AND FUTURE WORK
Modeling variability. I have presented the True2Form algorithm (Xu et al. 2014) as a way to reconstruct a 3Dmodel from a concept sketch. Similarly to prior work, our algorithm estimates the 3D model that best explains thedrawing. However, designers often draw several sketches to convey multiple alternatives of a common concept.Each drawing can also be ambiguous and allow multiple interpretations. Because of the cost of 3D modeling,many of these alternatives are rejected as the concept undergoes further development. I wish to propose a sketch-based modeling tool capable of generating distributions of objects rather than solving for a unique solution. Sucha probabilistic representation should allow designers to preserve multiple alternatives along all steps of the designprocess rather than committing to early decisions that impact all subsequent steps.
Manipulating appearance. We have presented initial solutions to the challenging problem of image relighting.However, our current solutions focus on outdoor scenes dominated by diffuse materials and are limited to a fewhours of sun motion (Duchene et al. 2015) or to the transfer of an existing lighting captured in another photograph(Laffont et al. 2012). Many challenges remain to be solved to handle a greater variety of material models andricher lighting setups as common in indoor scenes. In addition, while lighting greatly affects the mood of a scene,more dramatic temporal changes such as weather or seasons require modifying color and structure in an image.As a first step, we recently proposed to combine color and texture transfer to allow the synthesis of large temporalchanges in photographs, such as converting a winter picture to summer or synthesizing the effects of snow stormsand flooding (Okura et al. 2015).
References
AGRAWALA, M., AND STOLTE, C. 2001. Rendering effective route maps: Improving usability through general-ization. SIGGRAPH, 241–249.
AGRAWALA, M., PHAN, D., HEISER, J., HAYMAKER, J., KLINGNER, J., HANRAHAN, P., AND TVERSKY,B. 2003. Designing effective step-by-step assembly instructions. ACM Transactions on Graphics (Proc.SIGGRAPH) 22, 3 (July), 828–837.
AGRAWALA, M., LI, W., AND BERTHOUZOZ, F. 2011. Design principles for visual communication. Communi-cations of the ACM 54, 4 (Apr.), 60–69.
BAE, S., BALAKRISHNAN, R., AND SINGH, K. 2008. ILoveSketch: as-natural-as-possible sketching system forcreating 3d curve models. In Proc. User Interface Software and Technology.
BARRON, J., AND MALIK, J. 2013. Shape, illumination, and reflectance from shading. Tech. rep., Berkeley TechReport.
BARRON, J. T., AND MALIK, J. 2013. Intrinsic scene properties from a single RGB-D image. CVPR.
BARROW, H. G., AND TENENBAUM, J. M. 1978. Recovering intrinsic scene characteristics from images.Computer Vision Systems 3, 3–26.
BELL, S., BALA, K., AND SNAVELY, N. 2014. Intrinsic images in the wild. ACM Transactions on Graphics(Proc. SIGGRAPH) 33, 4.
BOUSSEAU, A., PARIS, S., AND DURAND, F. 2009. User assisted intrinsic images. ACM Transactions onGraphics (Proceedings of SIGGRAPH Asia 2009) 28, 5.
BOUSSEAU, A., CHAPOULIE, E., RAMAMOORTHI, R., AND AGRAWALA, M. 2011. Optimizing environmentmaps for material depiction. Computer Graphics Forum (Proc. Eurographics Symposium on Rendering) 30,4 (07).
BOUSSEAU, A., O SHEA, J. P., DURAND, F., RAMAMOORTHI, R., AND AGRAWALA, M. 2013. Gloss percep-tion in painterly and cartoon rendering. ACM Transactions on Graphics 32, 2 (April).
BOUSSEAU, A., TSANDILAS, T., OEHLBERG, L., AND MACKAY, W. In Progress. Fabsketch: Studying hownovices sketch, prototype and collaborate.
BRERETON, M., AND MCGARRY, B. 2000. An observational study of how objects support engineering designthinking and communication: Implications for the design of tangible media. In Proceedings of the SIGCHIConference on Human Factors in Computing Systems, ACM, New York, NY, USA, CHI ’00, 217–224.
CHAURASIA, G., DUCHENE, S., SORKINE-HORNUNG, O., AND DRETTAKIS, G. 2013. Depth synthesis andlocal warps for plausible image-based navigation. ACM Transactions on Graphics 32. to be presented atSIGGRAPH 2013.
49
50 REFERENCES
CHEN, Q., AND KOLTUN, V. 2013. A simple model for intrinsic image decomposition with depth cues. In ICCV,IEEE.
COLE, F., SANIK, K., DECARLO, D., FINKELSTEIN, A., FUNKHOUSER, T., RUSINKIEWICZ, S., AND SINGH,M. 2009. How well do line drawings depict shape? In ACM Transactions on Graphics (Proc. SIGGRAPH),vol. 28.
COOK, R. L. 1984. Shade trees. SIGGRAPH, 223–231.
CURTIS, C. J., ANDERSON, S. E., SEIMS, J. E., FLEISCHER, K. W., AND SALESIN, D. H. 1997. Computer-generated watercolor. SIGGRAPH, 421–430.
DEBEVEC, P., TCHOU, C., GARDNER, A., HAWKINS, T., POULLIS, C., STUMPFEL, J., JONES, A., YUN, N.,EINARSSON, P., LUNDGREN, T., FAJARDO, M., AND MARTINEZ, P. 2004. Estimating surface reflectanceproperties of a complex scene under captured natural illumination. Tech. rep., USC Institute for CreativeTechnologies.
DIXON, D., PRASAD, M., AND HAMMOND, T. 2010. iCanDraw: Using sketch recognition and correctivefeedback to assist a user in drawing human faces. In Proc. of the International Conference on Human Factorsin Computing Systems (CHI), ACM.
DODSON, B. 1985. Keys to drawing. North Light Books.
DUCHENE, S., RIANT, C., CHAURASIA, G., LOPEZ-MORENO, J., LAFFONT, P.-Y., POPOV, S., BOUSSEAU,A., AND DRETTAKIS, G. 2015. Multi-view intrinsic images of outdoors scenes with an application torelighting. ACM Transactions on Graphics.
EDWARDS, B. 1979. Drawing on the right side of the brain. Tarcher.
EISSEN, K., AND STEUR, R. 2008. Sketching (5th Printing): Drawing Techniques for Product Designers. Artand Design Series. Bis.
EISSEN, K., AND STEUR, R. 2011. Sketching: The Basics. Bis Publishers.
EITZ, M., HAYS, J., AND ALEXA, M. 2012. How do humans sketch objects? ACM Transactions on Graphics(Proc. SIGGRAPH) 31, 4, 44.
FAVREAU, J.-D., LAFARGE, F., AND BOUSSEAU, A. 2015. Line drawing interpretation in a multi-view context.In Proc. of the Conference on Computer Vision and Pattern Recognition (CVPR), IEEE.
FERNQUIST, J., GROSSMAN, T., AND FITZMAURICE, G. 2011. Sketch-sketch revolution: an engaging tuto-rial system for guided sketching and application learning. In ACM Symp. on User Interface Software andTechnology (UIST), 373–382.
FINLAYSON, G. D., DREW, M. S., AND LU, C. 2004. Intrinsic images by entropy minimization. In ECCV,582–595.
FLAGG, M., AND REHG, J. 2006. Projector-guided painting. In ACM Symp. on User Interface Software andTechnology (UIST), 235–244.
FLEMING, R. W., DROR, R. O., AND ADELSON, E. H. 2003. Real-world illumination and the perception ofsurface reflectance properties. Journal of Vision 3, 5.
FLEMING, R. W., JENSEN, H. W., AND BULTHOFF, H. H. 2004. Perceiving translucent materials. In APGV’04.
REFERENCES 51
FURUKAWA, Y., AND PONCE, J. 2010. Accurate, dense, and robust multi-view stereopsis. IEEE Trans. onPattern Analysis and Machine Intelligence 32, 8, 1362–1376.
GARCES, E., MUNOZ, A., LOPEZ-MORENO, J., AND GUTIERREZ, D. 2012. Intrinsic images by clustering.Computer Graphics Forum (Proc. EGSR) 31, 4.
GINGOLD, Y., IGARASHI, T., AND ZORIN, D. 2009. Structured annotations for 2D-to-3D modeling. ACMTransactions on Graphics (Proc. SIGGRAPH Asia) 28, 5.
GOOCH, A. A., GOOCH, B., SHIRLEY, P., AND COHEN, E. 1998. A non-photorealistic lighting model forautomatic technical illustration. SIGGRAPH, 447–452.
GRABLER, F., AGRAWALA, M., SUMNER, R. W., AND PAULY, M. 2008. Automatic generation of tourist maps.ACM Transactions on Graphics (Proc. SIGGRAPH) 27, 3 (Aug.), 100:1–100:11.
GRABLI, S., TURQUIN, E., DURAND, F., AND SILLION, F. X. 2010. Programmable rendering of line drawingfrom 3d scenes. ACM Transactions on Graphics 29, 2 (Apr.), 18:1–18:20.
GROSSE, R., JOHNSON, M. K., ADELSON, E. H., AND FREEMAN, W. T. 2009. Ground-truth dataset andbaseline evaluations for intrinsic image algorithms. In ICCV.
GUAY, M., CANI, M.-P., AND RONFARD, R. 2013. The Line of Action: an Intuitive Interface for ExpressiveCharacter Posing. ACM Transactions on Graphics (Proc. SIGGRAPH Asia 32, 6.
GUMHOLD, S. 2002. Maximum entropy light source placement. In Proc. IEEE Visualization.
GUO, R., DAI, Q., AND HOIEM, D. 2012. Paired regions for shadow detection and removal. IEEE Transactionson Pattern Analysis and Machine Intelligence 99.
HABER, T., FUCHS, C., BEKAER, P., SEIDEL, H.-P., GOESELE, M., AND LENSCH, H. 2009. Relightingobjects from image collections. In CVPR, 627–634.
HALLGRIMSSON, B. 2012. Prototyping and Modelmaking for Product Design. Portfolio skills. Laurence KingPublishers.
HENDERSON, K. 1998. On Line and on Paper: Visual Representations, Visual Culture, and Computer Graphicsin Design Engineering. MIT Press, Cambridge, MA, USA.
HERTZMANN, A. 2010. Non-photorealistic rendering and the science of art. In Proc. International Symposiumon Non-Photorealistic Animation and Rendering (NPAR).
HUNTER, F., BIVER, S., AND FUQUA, P. 2012. Light Science and Magic, fourth edition ed. Focal Press.
IARUSSI, E., BOUSSEAU, A., AND TSANDILAS, T. 2013. The drawing assistant: Automated drawing guidanceand feedback from photographs. In ACM Symposium on User Interface Software and Technology (UIST),ACM.
IARUSSI, E., BOMMES, D., AND BOUSSEAU, A. 2015. Bendfields: Regularized curvature fields from roughconcept sketches.
IGARASHI, T., MATSUOKA, S., AND TANAKA, H. 1999. Teddy: a sketching interface for 3D freeform design.Proc. SIGGRAPH.
JACOBS, K., AND LOSCOS, C. 2006. Classification of illumination methods for mixed reality. In ComputerGraphics Forum, vol. 25, Wiley Online Library, 29–51.
52 REFERENCES
JOHNSTON, S. F. 2002. Lumo: illumination for cel animation. In Proc. Symp. on Non-Photorealistic Animationand Rendering.
KERR, W. B., AND PELLACINI, F. 2009. Toward evaluating lighting design interface paradigms for novice users.ACM TOG (Proc. of SIGGRAPH) 28.
KNILL, D. C. 1992. Perception of surface contours and surface shape: from computation to psychophysics.Journal of Optical Society of America 9, 9, 1449–1464.
LAFFONT, P.-Y., BOUSSEAU, A., PARIS, S., DURAND, F., AND DRETTAKIS, G. 2012. Coherent intrinsicimages from photo collections. ACM Transactions on Graphics (SIGGRAPH Asia Conference Proceedings)31.
LAFFONT, P.-Y., BOUSSEAU, A., AND DRETTAKIS, G. 2013. Rich intrinsic image decomposition of outdoorscenes from multiple views. IEEE Transactions on Visualization and Computer Graphics 19, 2 (February),210 – 224.
LALONDE, J.-F., EFROS, A. A., AND NARASIMHAN, S. G. 2010. Detecting ground shadows in outdoorconsumer photographs. In European Conference on Computer Vision.
LAND, E. H., AND MCCANN, J. J. 1971. Lightness and retinex theory. Journal of the optical society of America61, 1.
LAVIOLE, J., AND HACHET, M. 2012. Papart: interactive 3d graphics and multi-touch augmented paper forartistic creaton. In 3DUI - IEEE Virtual Reality Conference.
LECOT, G., AND LEVY, B. 2006. Ardeco: automatic region detection and conversion. In Eurographics Sympo-sium on Rendering.
LEE, C. H., HAO, X., AND VARSHNEY, A. 2006. Geometry-dependent lighting. IEEE Trans. on Visualizationand Computer Graphics 12.
LEE, Y., ZITNICK, C., AND COHEN, M. 2011. Shadowdraw: real-time user guidance for freehand drawing.ACM Trans. on Graphics (Proc. SIGGRAPH) 30, 4, 27.
LEE, K. J., ZHAO, Q., TONG, X., GONG, M., IZADI, S., LEE, S. U., TAN, P., AND LIN, S. 2012. Estimationof intrinsic image sequences from image+depth video. In Proceedings of European Conference on ComputerVision (ECCV), 327–340.
LEVIN, A., LISCHINSKI, D., AND WEISS, Y. 2008. A closed-form solution to natural image matting. PatternAnalysis and Machine Intelligence, IEEE Transactions on 30, 2, 228–242.
LI, W., RITTER, L., AGRAWALA, M., CURLESS, B., AND SALESIN, D. 2007. Interactive cutaway illustrationsof complex 3d models. ACM Transactions on Graphics (Proc. SIGGRAPH) 26, 3 (July).
LI, W., AGRAWALA, M., CURLESS, B., AND SALESIN, D. 2008. Automated generation of interactive 3dexploded view diagrams. ACM Transactions on Graphics (Proc. SIGGRAPH) 27, 3 (Aug.), 101:1–101:7.
LIPSON, H., AND SHPITALNI, M. 1996. Optimization-based reconstruction of a 3d object from a single freehandline drawing. Computer-Aided Design 28, 651–663.
LIU, X., WAN, L., QU, Y., WONG, T.-T., LIN, S., LEUNG, C.-S., AND HENG, P.-A. 2008. Intrinsic coloriza-tion. ACM Transactions on Graphics (proc. of SIGGRAPH Asia) 27, 152:1–152:9.
LOPEZ-MORENO, J., POPOV, S., BOUSSEAU, A., AGRAWALA, M., AND DRETTAKIS, G. 2013. Depictingstylized materials with vector shade trees. ACM Transactions on Graphics (Proc. SIGGRAPH) 32, 4.
REFERENCES 53
LOSCOS, C., FRASSON, M.-C., DRETTAKIS, G., WALTER, B., GRANIER, X., AND POULIN, P. 1999. Interac-tive virtual relighting and remodeling of real scenes. In Proceedings of the 10th Eurographics conference onRendering, 329–340.
MAMASSIAN, P., AND LANDY, M. S. 1998. Observer biases in the 3D interpretation of line drawings. Visionresearch 38, 18, 2817–2832.
MARTIN, J. 1989. Rendering Highlights. Airbrush Artist’s Library. North Light Books.
MARTIN, J. 1989. Rendering Transparency. Airbrush Artist’s Library. North Light Books.
MATHER, G. 2008. Foundations of sensation and perception. Taylor and Francis.
MITRA, N. J., YANG, Y.-L., YAN, D.-M., LI, W., AND AGRAWALA, M. 2010. Illustrating how mechanicalassemblies work. ACM Transactions on Graphics (Proc. SIGGRAPH) 29, 4 (July), 58:1–58:12.
NAKAYAMA, K., AND SHIMOJO, S. 1992. Experiencing and Perceiving Visual Surfaces. Science 257, 1357–1363.
NEALEN, A., IGARASHI, T., SORKINE, O., AND ALEXA, M. 2007. Fibermesh: designing freeform surfaceswith 3d curves. ACM Trans. Graph. 26.
NICOLAIDES, K. 1969. The Natural Way to Draw: A Working Plan for Art Study. Houghton Mifflin Co.
NORIS, G., HORNUNG, A., SUMNER, R. W., SIMMONS, M., AND GROSS, M. 2013. Topology-driven vector-ization of clean line drawings. ACM Transactions on Graphics (TOG) 32, 1, 4.
OKURA, F., VANHOEY, K., BOUSSEAU, A., EFROS, A. A., AND DRETTAKIS, G. 2015. Unifying color and tex-ture transfer for predictive appearance manipulation. Computer Graphics Forum (Proc. of the EurographicsSymposium on Rendering).
OLSEN, L., SAMAVATI, F., SOUSA, M., AND JORGE, J. 2009. Sketch-based modeling: A survey. Computers &Graphics 33.
OLSEN, L., SAMAVATI, F., AND JORGE, J. A. 2011. Naturasketch: Modeling from images and natural sketches.IEEE Computer Graphics and Applications 31, 6, 24–34.
OMER, I., AND WERMAN, M. 2004. Color lines: Image specific color representation. In Proc. IEEE ComputerVision and Pattern Recognition, IEEE Computer Society, Washington, DC, USA, 946–953.
ORZAN, A., BOUSSEAU, A., WINNEMOLLER, H., BARLA, P., THOLLOT, J., AND SALESIN, D. 2008. Dif-fusion curves: a vector representation for smooth-shaded images. ACM Transactions on Graphics (Proc.SIGGRAPH) 27, 3, 92:1–8.
PANAGOPOULOS, A., WANG, C., SAMARAS, D., AND PARAGIOS, N. 2013. Simultaneous cast shadows,illumination and geometry inference using hypergraphs. IEEE, vol. 35, 437–449.
PIPES, A. 2007. Drawing for designers. Laurence King.
PIZLO, Z., AND STEVENSON, A. 1999. Shape constancy from novel views. Perception & Psychophysics 61, 7,1299–1307.
POWELL, D. 1986. Design rendering techniques: a guide to drawing and presenting design ideas. North Light.
RAMANARAYANAN, G., FERWERDA, J., WALTER, B., AND BALA, K. 2007. Visual equivalence: Towards anew standard for image fidelity. ACM Transactions on Graphics (Proc. SIGGRAPH) 26, 3.
54 REFERENCES
RICHARDT, C., LOPEZ-MORENO, J., BOUSSEAU, A., AGRAWALA, M., AND DRETTAKIS, G. 2014. Vectoris-ing bitmaps into semi-transparent gradient layers. Computer Graphics Forum (Proc. Eurographics Sympo-sium on Rendering) 33, 4.
ROBERTSON, S. 2003. How to Draw Cars the Hot Wheels Way. MBI.
SANIN, A., SANDERSON, C., AND LOVELL, B. C. 2012. Shadow detection: A survey and comparative evalua-tion of recent methods. Pattern recognition 45, 4, 1684–1695.
SCHMIDT, R., KHAN, A., SINGH, K., AND KURTENBACH, G. 2009. Analytic drawing of 3d scaffolds. ACMTransactions on Graphics (Proc. SIGGRAPH Asia) 28, 5.
SHACKED, R., AND LISCHINSKI, D. 2001. Automatic lighting design using a perceptual quality metric. Com-puter Graphics Forum 20.
SHAO, C., BOUSSEAU, A., SHEFFER, A., AND SINGH, K. 2012. Crossshade: Shading concept sketches usingcross-section curves. ACM Transactions on Graphics (Proc. SIGGRAPH) 31, 4.
SHEN, L., AND YEO, C. 2011. Intrinsic images decomposition using a local and global sparse representation ofreflectance. In CVPR, 697–704.
SHEN, J., YANG, X., JIA, Y., AND LI, X. 2011. Intrinsic images using optimization. In CVPR.
SMITH, A. R., AND BLINN, J. F. 1996. Blue screen matting. 259–268.
SNAVELY, N., SEITZ, S. M., AND SZELISKI, R. 2006. Photo tourism: Exploring photo collections in 3d. InSIGGRAPH Conference Proceedings, ACM Press, New York, NY, USA, 835–846.
STEVENS, K. A. 1981. The visual interpretation of surface contours. Artificial Intelligence 17.
SUN, J., LIANG, L., WEN, F., AND SHUM, H.-Y. 2007. Image vectorization using optimized gradient meshes.ACM Transactions on Graphics (Proc. SIGGRAPH) 26, 3, 11.
SUNKAVALLI, K., MATUSIK, W., PFISTER, H., AND RUSINKIEWICZ, S. 2007. Factored time-lapse video. ACMTransactions on Graphics (proc. of SIGGRAPH) 26, 3.
SYKORA, D., KAVAN, L., CADIK, M., JAMRISKA, O., JACOBSON, A., WHITED, B., SIMMONS, M., ANDSORKINE-HORNUNG, O. 2014. Ink-and-ray: Bas-relief meshes for adding global illumination effects tohand-drawn characters. ACM Trans. Graphics 33.
TAPPEN, M. F., FREEMAN, W. T., AND ADELSON, E. H. 2005. Recovering intrinsic images from a singleimage. IEEE Trans. PAMI 27, 9.
TROCCOLI, A., AND ALLEN, P. 2008. Building illumination coherent 3d models of large-scale outdoor scenes.International Journal of Computer Vision 78, 2-3, 261–280.
WEISS, Y. 2001. Deriving intrinsic images from image sequences. In ICCV, 68–75.
WINKENBACH, G., AND SALESIN, D. H. 1994. Computer-generated pen-and-ink illustration. SIGGRAPH,91–100.
XU, B., CHANG, W., SHEFFER, A., BOUSSEAU, A., MCCRAE, J., AND SINGH, K. 2014. True2form: 3d curvenetworks from 2d sketches via selective regularization. Transactions on Graphics (Proc. SIGGRAPH) 33, 4.
YU, Y., AND MALIK, J. 1998. Recovering photometric properties of architectural scenes from photographs. InSIGGRAPH, 207–217.

REFERENCES 55
YU, Y., DEBEVEC, P., MALIK, J., AND HAWKINS, T. 1999. Inverse global illumination: recovering reflectancemodels of real scenes from photographs. In SIGGRAPH, 215–224.
ZHAO, Q., TAN, P., DAI, Q., SHEN, L., WU, E., AND LIN, S. 2012. A closed-form solution to retinex withnonlocal texture constraints. IEEE Trans. PAMI 34, 1437–1444.
ZHU, J., SAMUEL, K. G. G., MASOOD, S., AND TAPPEN, M. F. 2010. Learning to recognize shadows inmonochromatic natural images. In Proceedings of the IEEE Computer Society Conference on ComputerVision and Pattern Recognition (CVPR 2010).