Embed Size (px)
Citation preview
Department ofTransport
Annual Report2019-20
Department of Transport


Annual Report2019-20
Department of Transport
Acknowledgment of CountryThe Department of Transport acknowledges the traditional custodians of the land throughout Western Australia and pays our respects to Elders both past and present. DoT acknowledges the members of all Aboriginal communities, their cultures and continuing connection to Country throughout the State.
Within Western Australia, the term Aboriginal is used in preference to Aboriginal and Torres Strait Islander, in recognition that Aboriginal people are the original inhabitants of Western Australia. Aboriginal and Torres Strait Islander may be referred to in the national context.
© Department of Transport 2020Use of this report in part or as a whole is permitted provided there is acknowledgement of any material quoted or reproduced.
This report was published by the Department of Transport, September 2020.
DisclaimerThe Department of Transport makes the information in this report available on the understanding that users exercise their own skill and care with respect to its use and interpretation. Changes in circumstances after this document is made available may impact on the accuracy of the information.
Alternative formatsThis publication is available in alternative formats upon request. Contact us to request a copy or submit an enquiry.
Contact usDepartment of Transport Communications Branch Office of the Director General GPO Box C102, PERTH WA 6839
Email: [email protected] Website: www.transport.wa.gov.au
Page 4 Department of Transport
Contents
Our Purpose 7Our Outcomes 7Our Values 7
Overview 11
Director General’s Foreword 12Managing Director’s Foreword 14Highlights 16DoT’s response to COVID-19 20Financial Summary 24Operational Structure 26Transport Portfolio 28Department of Transport 29
Corporate Executive 30
Administered Legislation 33
Outcome Based Management Framework 34
Shared Responsibilities 36
Agency Performance 45
Report on Operations 46Actual Financial Results Versus Budget Targets 80
Disclosures and Legal Compliance 81
Certification of Financial Statements 87Certification of Key Performance Indicators 167
Ministerial Directives 187
Other Financial Disclosures 187
Governance Disclosures 195Other Legal Requirements 196Government Policy Requirements 202
Annual Report 2019-20 Page 5

Page 6 Department of Transport
Our OutcomesPositive Customer ExperienceSafe and Effective TransportContemporary Transport SolutionsIdentity Management
Our Purpose We plan and deliver transport solutions for the prosperity of Western Australians.
Our Values Clear Direction: We set clear direction and have the courage to follow through.Fresh Thinking: We welcome fresh thinking and better ways of working.Excellent Service: We work together to deliver excellent service.Great People: We make things happen through our great people.
Department of Transport We connect people with goods and services through an intricate system of roads, railways, airports, ports, paths and waterways, and educate and regulate to keep them safe within those networks. We coordinate and prioritise the transport-related infrastructure that allows our economy to grow.
Annual Report 2019-20 Page 7
Statement of Compliance with the Financial Management Act 2006 For the year ended 30 June 2020
To the Minister
Hon. Rita Saffioti MLA
Minister for Transport
In accordance with Section 63 of the Financial Management Act 2006, I hereby submit for your information and presentation to Parliament, the Annual Report of the Department of Transport for the financial year ended 30 June 2020.
The Annual Report has been prepared in accordance with the provisions of the Financial Management Act 2006 and fulfils DoT’s reporting obligations under the Public Sector Management Act 1994, the Disability Services Act 1993 and the Electoral Act 1907.
Peter Woronzow
Acting Director General – Transport
Page 8 Department of Transport
Annual Report 2019-20 Page 9

Page 10 Department of Transport

Overview
Overview
Annual Report 2019-20 Page 11
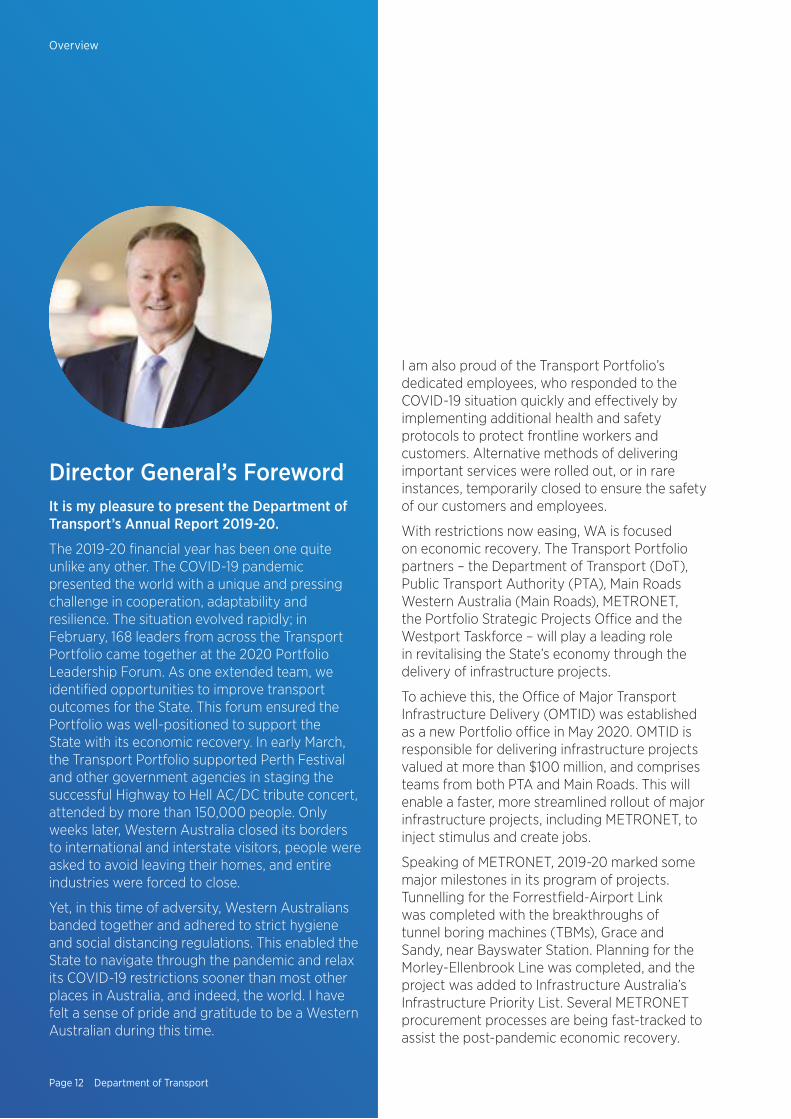
Director General’s ForewordIt is my pleasure to present the Department of Transport’s Annual Report 2019-20.
The 2019-20 financial year has been one quite unlike any other. The COVID-19 pandemic presented the world with a unique and pressing challenge in cooperation, adaptability and resilience. The situation evolved rapidly; in February, 168 leaders from across the Transport Portfolio came together at the 2020 Portfolio Leadership Forum. As one extended team, we identified opportunities to improve transport outcomes for the State. This forum ensured the Portfolio was well-positioned to support the State with its economic recovery. In early March, the Transport Portfolio supported Perth Festival and other government agencies in staging the successful Highway to Hell AC/DC tribute concert, attended by more than 150,000 people. Only weeks later, Western Australia closed its borders to international and interstate visitors, people were asked to avoid leaving their homes, and entire industries were forced to close.
Yet, in this time of adversity, Western Australians banded together and adhered to strict hygiene and social distancing regulations. This enabled the State to navigate through the pandemic and relax its COVID-19 restrictions sooner than most other places in Australia, and indeed, the world. I have felt a sense of pride and gratitude to be a Western Australian during this time.
I am also proud of the Transport Portfolio’s dedicated employees, who responded to the COVID-19 situation quickly and effectively by implementing additional health and safety protocols to protect frontline workers and customers. Alternative methods of delivering important services were rolled out, or in rare instances, temporarily closed to ensure the safety of our customers and employees.
With restrictions now easing, WA is focused on economic recovery. The Transport Portfolio partners – the Department of Transport (DoT), Public Transport Authority (PTA), Main Roads Western Australia (Main Roads), METRONET, the Portfolio Strategic Projects Office and the Westport Taskforce – will play a leading role in revitalising the State’s economy through the delivery of infrastructure projects.
To achieve this, the Office of Major Transport Infrastructure Delivery (OMTID) was established as a new Portfolio office in May 2020. OMTID is responsible for delivering infrastructure projects valued at more than $100 million, and comprises teams from both PTA and Main Roads. This will enable a faster, more streamlined rollout of major infrastructure projects, including METRONET, to inject stimulus and create jobs.
Speaking of METRONET, 2019-20 marked some major milestones in its program of projects. Tunnelling for the Forrestfield-Airport Link was completed with the breakthroughs of tunnel boring machines (TBMs), Grace and Sandy, near Bayswater Station. Planning for the Morley-Ellenbrook Line was completed, and the project was added to Infrastructure Australia’s Infrastructure Priority List. Several METRONET procurement processes are being fast-tracked to assist the post-pandemic economic recovery.
Page 12 Department of Transport
Overview
On behalf of the Government and the Transport Portfolio, I would like to acknowledge Richard Sellers for his leadership as the Director General – Transport until his secondment to the role of Director General for the Department of Jobs, Tourism, Science and Innovation for 12 months in March this year.
I am proud of the achievements of the Transport Portfolio in 2019-20. More now than ever, connected and efficient transport networks and supply chains are critically important. I am honoured to be leading the Transport Portfolio at this time, and I thank all employees for their hard work and commitment in delivering the best transport outcomes for our customers and the State.
For more examples of collaboration in action, you may be interested in reading our Transport Portfolio companion publication, Connecting People and Places 2019-20.
Given the way we have responded to the challenges of such an unusual year, I have confidence looking forward to 2020-21. I believe that it will be a positive and exciting year for the Transport Portfolio and Western Australia more broadly.
Sincerely,
Peter Woronzow Acting Director General – Transport
Transport has been, and continues to be, a major focus of the State Government, with more than $8 billion of funding allocated to transport projects over the next four years. Furthermore, 24 road and maritime projects worth $140 million are being expedited to support the COVID-19 economic recovery through a new State-wide Construction Panel Contract. These projects are predicted to support more than 1,000 local jobs. Additionally, Main Roads is fast-tracking the tendering process for 11 major road projects worth $2.37 billion, estimated to support a further 13,000 jobs. Long-awaited projects such as the Bunbury Outer Ring Road, Fremantle Traffic Bridge, Tonkin Highway Gap project and Mitchell Freeway extension will vastly improve connectivity and travel times.
The Westport Taskforce is also looking to support long-term economic development by investigating the port and supply chain infrastructure required to meet freight demand for the next 50 years and beyond. Westport submitted its Stage 2 Report to Government in early 2020 for consideration, which contained the Taskforce’s recommended future container port and supply chain options for Perth.
The new independent body, Infrastructure Western Australia (IWA), launched in July 2019, is also advising the Government on strategic, long-term infrastructure planning. Future transport initiatives to support flourishing communities and industries are a major feature in IWA’s inaugural discussion paper released in June 2020.
There has truly never been a better opportunity for the Transport Portfolio to influence the future of our State and play a major role in our economic and social prosperity.
I am proud of the achievements of the Transport Portfolio in 2019-20. More now than ever, connected and efficient transport networks and supply chains are critically important.
Annual Report 2019-20 Page 13
Overview
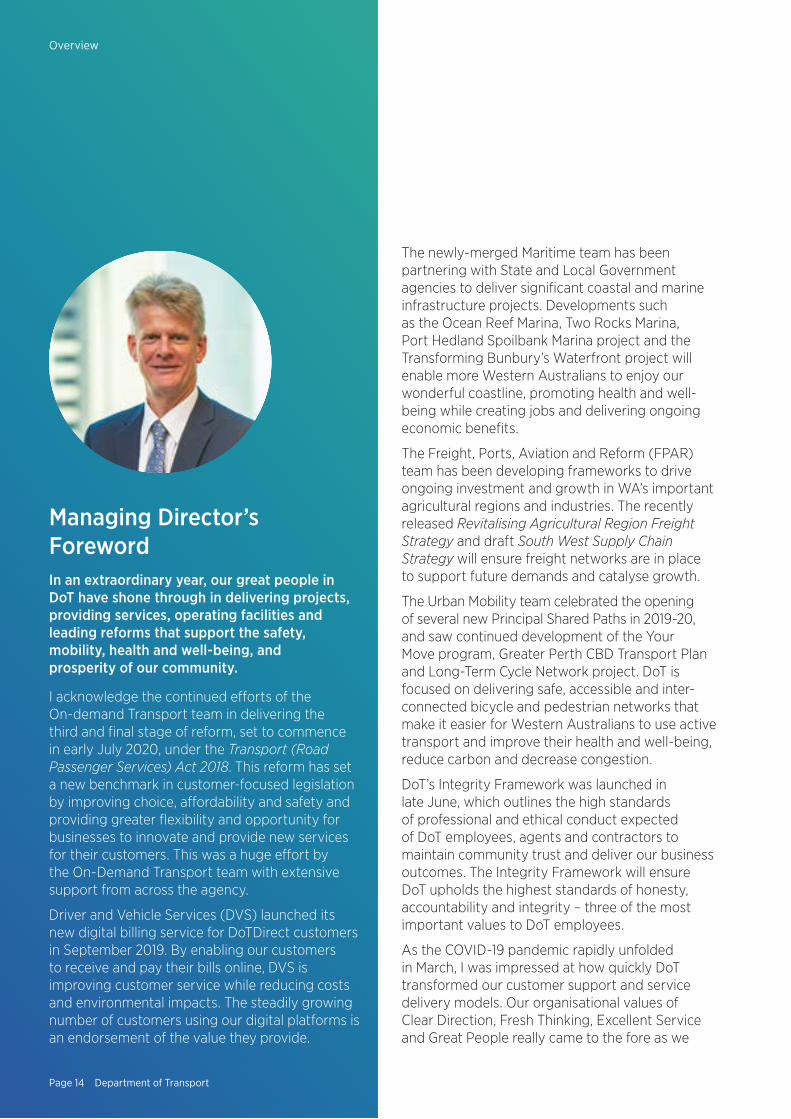
Managing Director’s ForewordIn an extraordinary year, our great people in DoT have shone through in delivering projects, providing services, operating facilities and leading reforms that support the safety, mobility, health and well-being, and prosperity of our community.
I acknowledge the continued efforts of the On-demand Transport team in delivering the third and final stage of reform, set to commence in early July 2020, under the Transport (Road Passenger Services) Act 2018. This reform has set a new benchmark in customer-focused legislation by improving choice, affordability and safety and providing greater flexibility and opportunity for businesses to innovate and provide new services for their customers. This was a huge effort by the On-Demand Transport team with extensive support from across the agency.
Driver and Vehicle Services (DVS) launched its new digital billing service for DoTDirect customers in September 2019. By enabling our customers to receive and pay their bills online, DVS is improving customer service while reducing costs and environmental impacts. The steadily growing number of customers using our digital platforms is an endorsement of the value they provide.
The newly-merged Maritime team has been partnering with State and Local Government agencies to deliver significant coastal and marine infrastructure projects. Developments such as the Ocean Reef Marina, Two Rocks Marina, Port Hedland Spoilbank Marina project and the Transforming Bunbury’s Waterfront project will enable more Western Australians to enjoy our wonderful coastline, promoting health and well-being while creating jobs and delivering ongoing economic benefits.
The Freight, Ports, Aviation and Reform (FPAR) team has been developing frameworks to drive ongoing investment and growth in WA’s important agricultural regions and industries. The recently released Revitalising Agricultural Region Freight Strategy and draft South West Supply Chain Strategy will ensure freight networks are in place to support future demands and catalyse growth.
The Urban Mobility team celebrated the opening of several new Principal Shared Paths in 2019-20, and saw continued development of the Your Move program, Greater Perth CBD Transport Plan and Long-Term Cycle Network project. DoT is focused on delivering safe, accessible and inter-connected bicycle and pedestrian networks that make it easier for Western Australians to use active transport and improve their health and well-being, reduce carbon and decrease congestion.
DoT’s Integrity Framework was launched in late June, which outlines the high standards of professional and ethical conduct expected of DoT employees, agents and contractors to maintain community trust and deliver our business outcomes. The Integrity Framework will ensure DoT upholds the highest standards of honesty, accountability and integrity – three of the most important values to DoT employees.
As the COVID-19 pandemic rapidly unfolded in March, I was impressed at how quickly DoT transformed our customer support and service delivery models. Our organisational values of Clear Direction, Fresh Thinking, Excellent Service and Great People really came to the fore as we
Page 14 Department of Transport
Overview
• the Finance team, who organised the COVID-19 relief package in a short turnaround time;
• the People and Organisational Development team, for supporting the health and well-being of our people, enabling changes to working and providing advice and support services for staff and managers; and
• the Legal and Legislative Services Team, who produced important COVID-19-related legislation.
DoT is now focused on delivering projects to support the State’s economic recovery. Grant schemes such as the Coastal Adaptation Protection grants and Regional Airports Development Scheme will inject important stimulus into the local economy. FPAR will continue supporting the aviation industry, which has been severely impacted by COVID-19, by regularly engaging with airlines, airports and other aviation stakeholders.
COVID-19 also presented opportunities. There has been a significant growth in the number of people riding bikes throughout the pandemic, which the Urban Mobility team is now looking to maintain. Other positive outcomes, such as flexible working and online meetings, will continue.
DoT is a diverse and progressive agency committed to delivering outcomes that support our community and State.
These challenging times have enabled our people to show what they can do best to support our community. I am proud of the efforts of our employees with our partners and stakeholders in 2019-20 and thank everyone for their hard work and contributions.
Sincerely,
Iain Cameron Managing Director Department of Transport
supported each other in shifting our ways of working. At the height of the pandemic in May, 80 per cent of DoT staff said they were confident in our ability to continue supporting and servicing our customers throughout the COVID-19 crisis.
While every team in DoT continued working throughout the pandemic, I want to acknowledge the special efforts of the following teams:
• the Business Information Systems team, for providing additional IT and technical support to the 65 per cent of our workforce who were working remotely;
• the DVS team, who established the 13COVID hotline within one week, and supported the Western Australian Police Force and the Department of Primary Industries and Regional Development in developing the G2G PASS app and assessing thousands of applications to manage border restrictions;
• The DVS and Regional Services staff members who kept DoT’s customer services operating throughout the State during the pandemic;
• DoT’s Corporate Executive leadership team (and their dedicated Assistants), who were meeting daily during the pandemic to discuss and share the latest instructions, messaging and information from the State and Federal Government, and the Department of the Premier and Cabinet;
• the FPAR team, who partnered with industry to keep vital freight and aviation routes open across the State, ensuring supermarkets, pharmacies and hospitals remained stocked;
• the teams within the Office of the Director General, who handled a 56 per cent increase in Ministerial documents from March to May 2020, and prepared Pandemic Business Continuity Action Plans; and especially the Communications team, who kept all staff, customers, partners and stakeholders informed about what we were doing to support the community;
Annual Report 2019-20 Page 15
Overview
Highlights
Highlights
The passage of the Transport (Road Passenger Services) Amendment (COVID-19 Response and Regional Assistance) Act 2020, which was drafted, debated in Parliament, passed and assented to within one week.
COVID-19 The Department of Transport staff showed tremendous commitment to our values by responding quickly and effectively to the COVID-19 pandemic. In most instances, important services for our customers and stakeholders were maintained throughout the pandemic.
Keeping WA safe
DVS assisted WA Police and DPIRD by designing the system underpinning the innovative G2G PASS app, which enabled more than 135,000 applications for people needing to enter WA or cross regional borders for essential purposes to be processed virtually.
Some 6,500 C Class Practical Driving Assessments (PDAs) that were postponed between March and May 2020 due to the COVID-19 social distancing restrictions had been rebooked by early June 2020.
70,000 13COVID calls
DVS’s 13COVID hotline, manned by staff working from home, responded to more than 70,000 calls between 7.00am and 10.00pm, seven days a week, over the course of the pandemic. This hotline was still operating at the end of June.
Page 16 Department of Transport
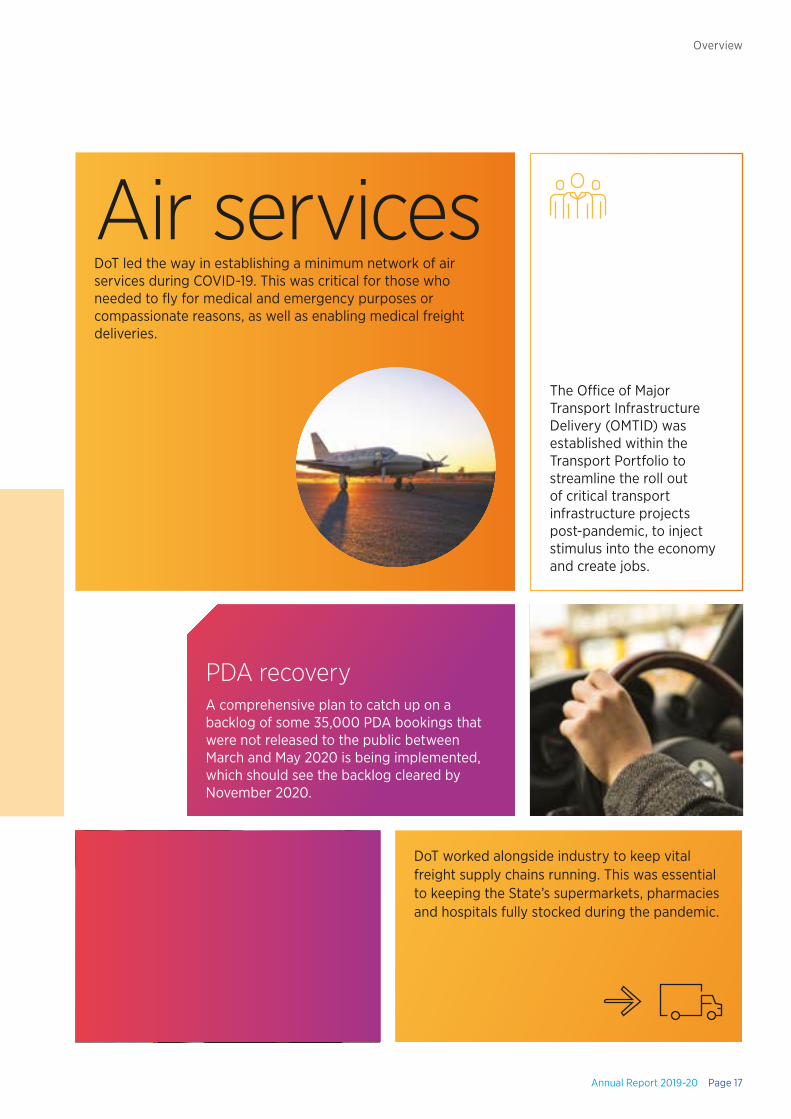
PDA recovery A comprehensive plan to catch up on a backlog of some 35,000 PDA bookings that were not released to the public between March and May 2020 is being implemented, which should see the backlog cleared by November 2020.
DoT worked alongside industry to keep vital freight supply chains running. This was essential to keeping the State’s supermarkets, pharmacies and hospitals fully stocked during the pandemic.
Air servicesDoT led the way in establishing a minimum network of air services during COVID-19. This was critical for those who needed to fly for medical and emergency purposes or compassionate reasons, as well as enabling medical freight deliveries.
The Office of Major Transport Infrastructure Delivery (OMTID) was established within the Transport Portfolio to streamline the roll out of critical transport infrastructure projects post-pandemic, to inject stimulus into the economy and create jobs.
Annual Report 2019-20 Page 17
Overview
Westport’s Stage 2 Report, highlighting its recommended port and supply chain options for Perth’s long-term trade, industry and freight requirements, was finalised and submitted to Cabinet.
600,000 DoTDirect achieved two significant milestones in passing 600,000 registered customers and introducing digital billing, which improves access and convenience for customers. This initiative was recognised by being awarded the IPAA/Office of Digital Government ‘Excellence in the Public Sector’ 2019 Award for Best Practice in Digital Transformation.
Stage 2 of the on-demand transport reforms commenced in July 2019, with Stage 3 set to launch on 1 July 2020. These reforms represent a transformational change in transport regulations, delivering improved safety, choice and flexibility for both customers and industry.
The final Revitalising Agricultural Region Freight Strategy was released by the Minister for Transport.
The draft South West Supply Chain Strategy was released for public comment.
Work on important Principal Shared Paths (PSP) is progressing, with a $19 million upgrade to the Mitchell Freeway PSP representing the biggest investment in WA’s PSP network to date.
Membership of the Your Move Schools program increased by almost 50 per cent in 2019-20 to 137 schools. Some 70 schools achieved bronze accreditation or better, with 19 achieving gold accreditation or better, resulting in double the number of schools being awarded Connecting Schools Grants.
Highlights
Page 18 Department of Transport
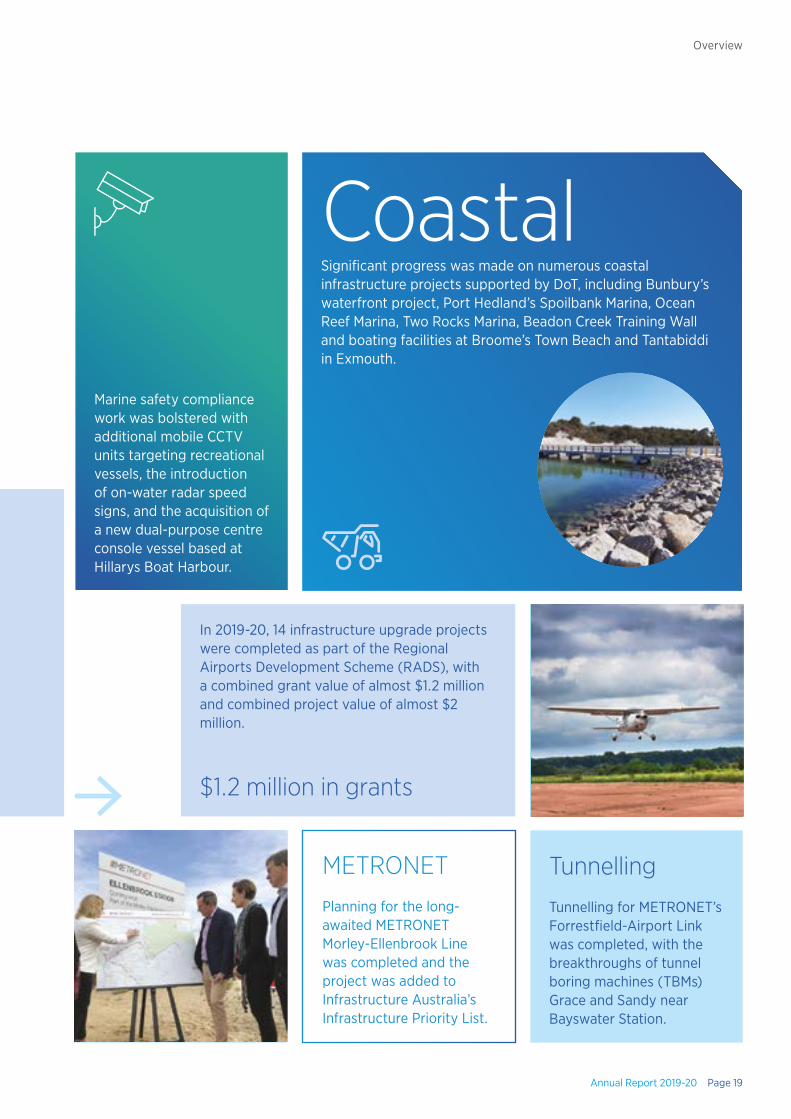
In 2019-20, 14 infrastructure upgrade projects were completed as part of the Regional Airports Development Scheme (RADS), with a combined grant value of almost $1.2 million and combined project value of almost $2 million.
$1.2 million in grants
CoastalSignificant progress was made on numerous coastal infrastructure projects supported by DoT, including Bunbury’s waterfront project, Port Hedland’s Spoilbank Marina, Ocean Reef Marina, Two Rocks Marina, Beadon Creek Training Wall and boating facilities at Broome’s Town Beach and Tantabiddi in Exmouth.
Marine safety compliance work was bolstered with additional mobile CCTV units targeting recreational vessels, the introduction of on-water radar speed signs, and the acquisition of a new dual-purpose centre console vessel based at Hillarys Boat Harbour.
METRONET
Planning for the long-awaited METRONET Morley-Ellenbrook Line was completed and the project was added to Infrastructure Australia’s Infrastructure Priority List.
Tunnelling Tunnelling for METRONET’s Forrestfield-Airport Link was completed, with the breakthroughs of tunnel boring machines (TBMs) Grace and Sandy near Bayswater Station.
Annual Report 2019-20 Page 19
Overview
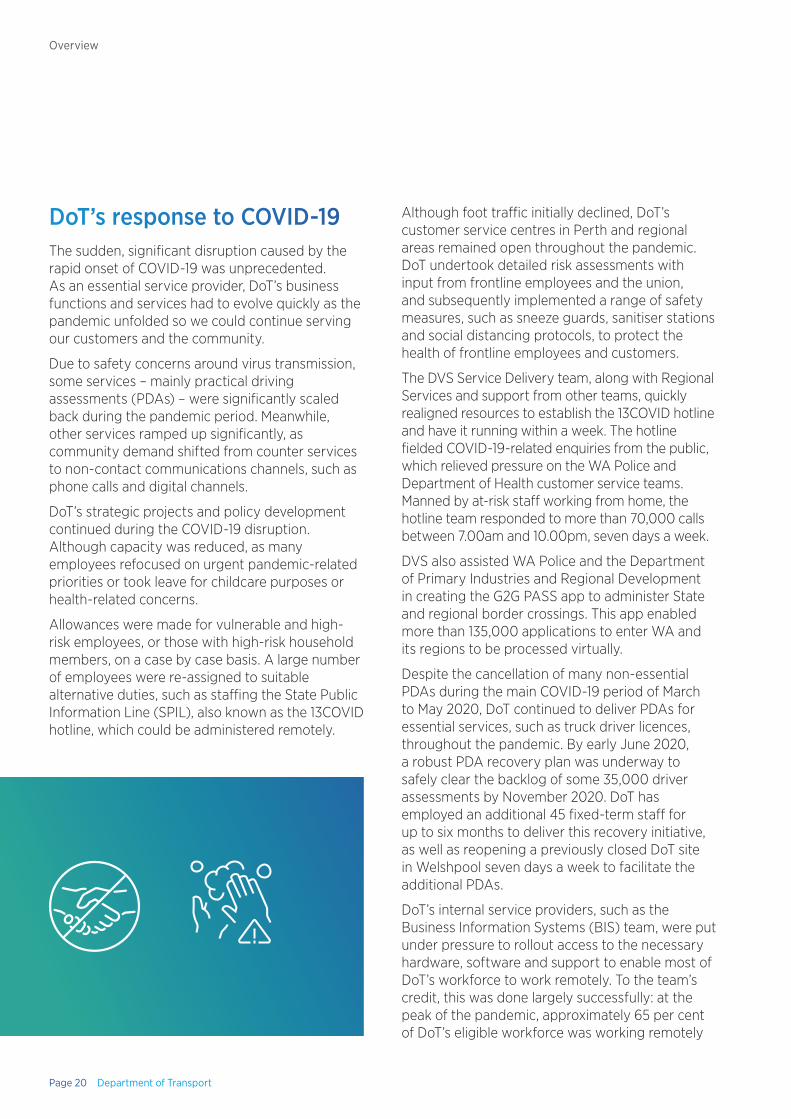
DoT’s response to COVID-19The sudden, significant disruption caused by the rapid onset of COVID-19 was unprecedented. As an essential service provider, DoT’s business functions and services had to evolve quickly as the pandemic unfolded so we could continue serving our customers and the community.
Due to safety concerns around virus transmission, some services – mainly practical driving assessments (PDAs) – were significantly scaled back during the pandemic period. Meanwhile, other services ramped up significantly, as community demand shifted from counter services to non-contact communications channels, such as phone calls and digital channels.
DoT’s strategic projects and policy development continued during the COVID-19 disruption. Although capacity was reduced, as many employees refocused on urgent pandemic-related priorities or took leave for childcare purposes or health-related concerns.
Allowances were made for vulnerable and high-risk employees, or those with high-risk household members, on a case by case basis. A large number of employees were re-assigned to suitable alternative duties, such as staffing the State Public Information Line (SPIL), also known as the 13COVID hotline, which could be administered remotely.
Although foot traffic initially declined, DoT’s customer service centres in Perth and regional areas remained open throughout the pandemic. DoT undertook detailed risk assessments with input from frontline employees and the union, and subsequently implemented a range of safety measures, such as sneeze guards, sanitiser stations and social distancing protocols, to protect the health of frontline employees and customers.
The DVS Service Delivery team, along with Regional Services and support from other teams, quickly realigned resources to establish the 13COVID hotline and have it running within a week. The hotline fielded COVID-19-related enquiries from the public, which relieved pressure on the WA Police and Department of Health customer service teams. Manned by at-risk staff working from home, the hotline team responded to more than 70,000 calls between 7.00am and 10.00pm, seven days a week.
DVS also assisted WA Police and the Department of Primary Industries and Regional Development in creating the G2G PASS app to administer State and regional border crossings. This app enabled more than 135,000 applications to enter WA and its regions to be processed virtually.
Despite the cancellation of many non-essential PDAs during the main COVID-19 period of March to May 2020, DoT continued to deliver PDAs for essential services, such as truck driver licences, throughout the pandemic. By early June 2020, a robust PDA recovery plan was underway to safely clear the backlog of some 35,000 driver assessments by November 2020. DoT has employed an additional 45 fixed-term staff for up to six months to deliver this recovery initiative, as well as reopening a previously closed DoT site in Welshpool seven days a week to facilitate the additional PDAs.
DoT’s internal service providers, such as the Business Information Systems (BIS) team, were put under pressure to rollout access to the necessary hardware, software and support to enable most of DoT’s workforce to work remotely. To the team’s credit, this was done largely successfully: at the peak of the pandemic, approximately 65 per cent of DoT’s eligible workforce was working remotely
Page 20 Department of Transport
Overview
(this figure did not account for around 400 employees who opted to take leave, or a further 400 frontline staff in positions that are not possible to do remotely). At the same time, 80 per cent of DoT staff said they were confident in the agency’s ability to continue supporting and servicing our customers throughout the COVID-19 crisis. Most teams maintained their productivity, with some teams even improving their productivity during the March to May lockdown period.
In the Office of the Director General, the number of Ministerial documents handled increased by 56 per cent; Pandemic Business Continuity Action Plans were quickly established to ensure the ongoing operation of the agency in the event of internal COVID-19 outbreaks; and the Communications team was responding to increased enquiries from the media and community, while ensuring our customers and stakeholders were kept updated through timely, accurate communications.
The People and Organisational Development (POD) team were instrumental in ensuring staff had access to important support services, including emotional support through the Employee Assistance Program and a purpose-built webpage on DoT’s intranet, Transporta. POD were also advising managers on how and when to implement workforce changes, such as enabling their teams to work remotely.
DoT’s On-demand Transport and Legal and Legislative Services team combined forces to
devise the Transport (Road Passenger Services) Amendment (COVID-19 Response and Regional Assistance) Act 2020 to guide the on-demand transport industry through the pandemic. This Act was drafted, debated in Parliament, passed and assented to within one week.
The pandemic saw government agencies collaborate for the benefit of the State. Taking guidance from the Public Sector Commission and the Department of the Premier and Cabinet, DoT and other agencies followed instructions, set clear directions and maintained consistent messaging to minimise confusion. Agencies including DoT also volunteered employees to support the State Emergency Response Centre, being run by the WA Police Commissioner.
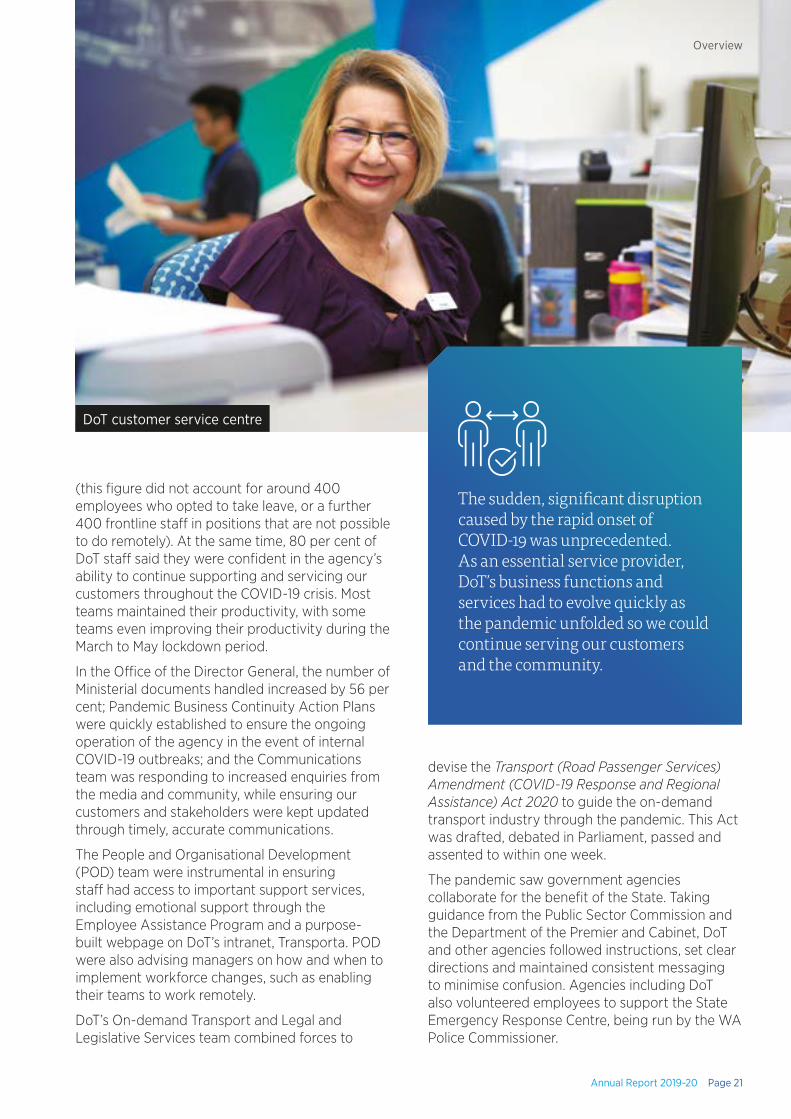
The sudden, significant disruption caused by the rapid onset of COVID-19 was unprecedented. As an essential service provider, DoT’s business functions and services had to evolve quickly as the pandemic unfolded so we could continue serving our customers and the community.
DoT customer service centre
Annual Report 2019-20 Page 21
Overview
Page 22 Department of Transport
Overview
The eagerness to collaborate extended beyond government to industry. The Freight, Ports, Aviation and Reform (FPAR) team partnered with industry groups such as the Freight and Logistics Council of WA to keep vital freight and aviation routes open across the State. This enabled supermarkets, pharmacies and hospitals to source important supplies such as personal protective equipment, medication and food, as well as allowing people to travel for emergency or compassionate reasons.
Given the sense of urgency when COVID-19 first unfolded, DoT acted quickly without having much time to document the processes. Once the threat of COVID-19 eased, this presented an opportunity for DoT to capture the lessons learned from the COVID-19 response. These could assist in the event of future COVID-19 or similar pandemic outbreaks, other emergency response situations and, importantly, continue with changes that employees felt were working well.
In May 2020, DoT ran a COVID-19 staff pulse check consisting of a digital survey to capture quantitative results and an online portal, Fresh Think Tank, for qualitative feedback and
suggestions. 637 DoT employees, which equates to 44.39 per cent of the workforce, responded to the survey, while 17 ideas and more than 40 comments were submitted to Fresh Think Tank.
Some very clear themes emerged in the analysis of the survey results:
1. Overall, employees were supportive of the steps taken by DoT in response to the pandemic, and felt they personally, as well as their managers and teams, adapted well to the changes.
2. Employees without customer-facing roles felt more positively about DoT’s handling of the pandemic than frontline staff.
3. There was a very strong mandate from staff to continue enabling flexible working arrangements. Nearly 85 per cent of respondents wanted to continue working from other locations post-pandemic.
The results of the pulse check were provided to DoT’s Corporate Executive team, who are considering some of the recommendations, including how to continue enabling flexible working arrangements.
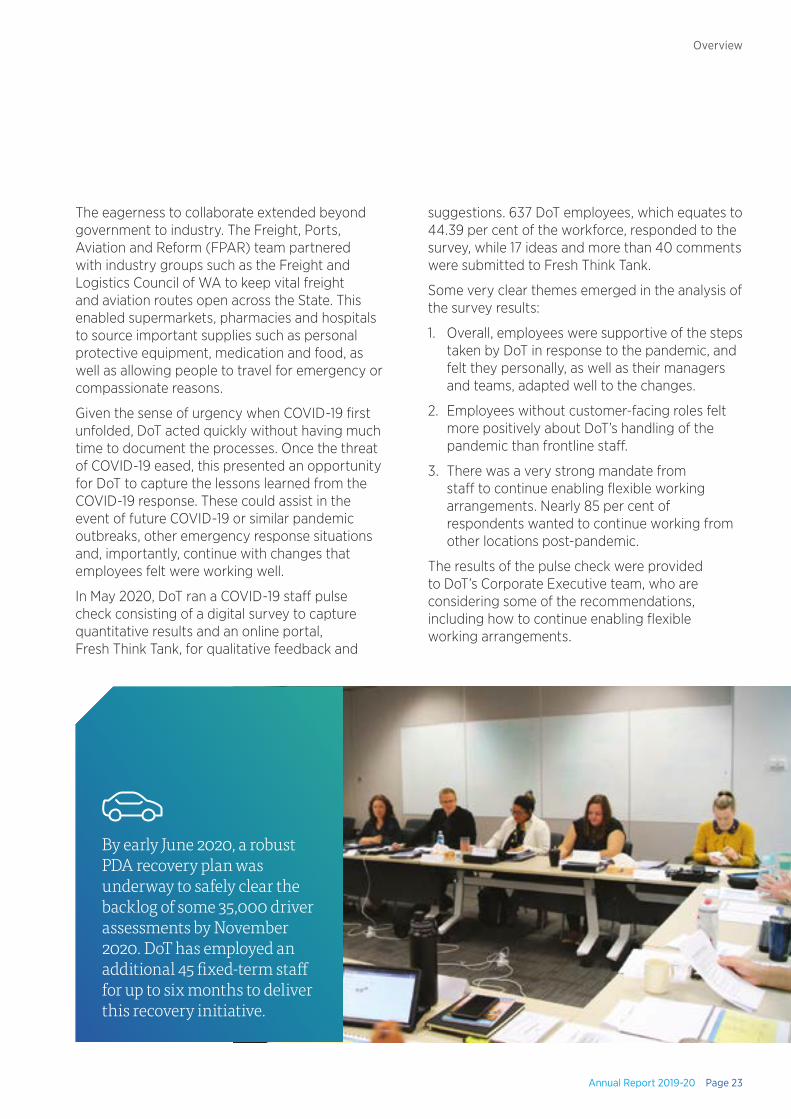
By early June 2020, a robust PDA recovery plan was underway to safely clear the backlog of some 35,000 driver assessments by November 2020. DoT has employed an additional 45 fixed-term staff for up to six months to deliver this recovery initiative.
Annual Report 2019-20 Page 23
Overview
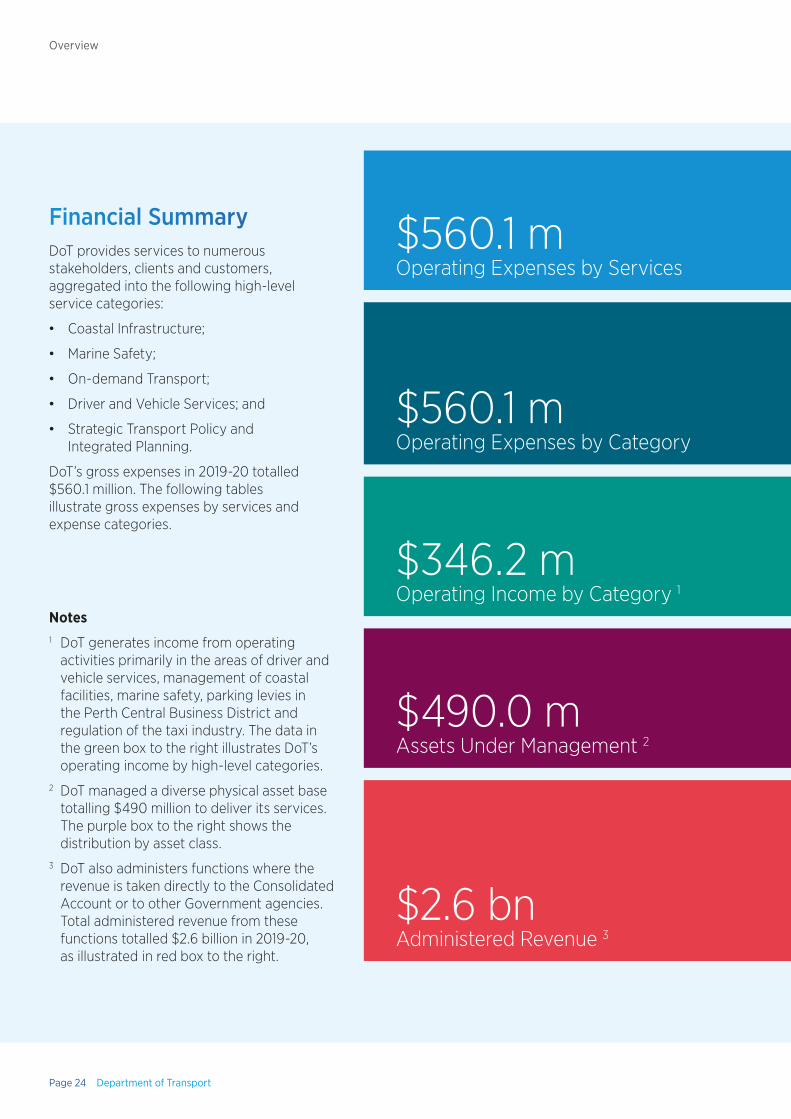
Financial Summary DoT provides services to numerous stakeholders, clients and customers, aggregated into the following high-level service categories:
• Coastal Infrastructure;
• Marine Safety;
• On-demand Transport;
• Driver and Vehicle Services; and
• Strategic Transport Policy and Integrated Planning.
DoT’s gross expenses in 2019-20 totalled $560.1 million. The following tables illustrate gross expenses by services and expense categories.
Notes1 DoT generates income from operating
activities primarily in the areas of driver and vehicle services, management of coastal facilities, marine safety, parking levies in the Perth Central Business District and regulation of the taxi industry. The data in the green box to the right illustrates DoT’s operating income by high-level categories.
2 DoT managed a diverse physical asset base totalling $490 million to deliver its services. The purple box to the right shows the distribution by asset class.
3 DoT also administers functions where the revenue is taken directly to the Consolidated Account or to other Government agencies. Total administered revenue from these functions totalled $2.6 billion in 2019-20, as illustrated in red box to the right.
$560.1 mOperating Expenses by Services
$560.1 mOperating Expenses by Category
$346.2 mOperating Income by Category 1
$490.0 mAssets Under Management 2
$2.6 bnAdministered Revenue 3
Page 24 Department of Transport
Overview
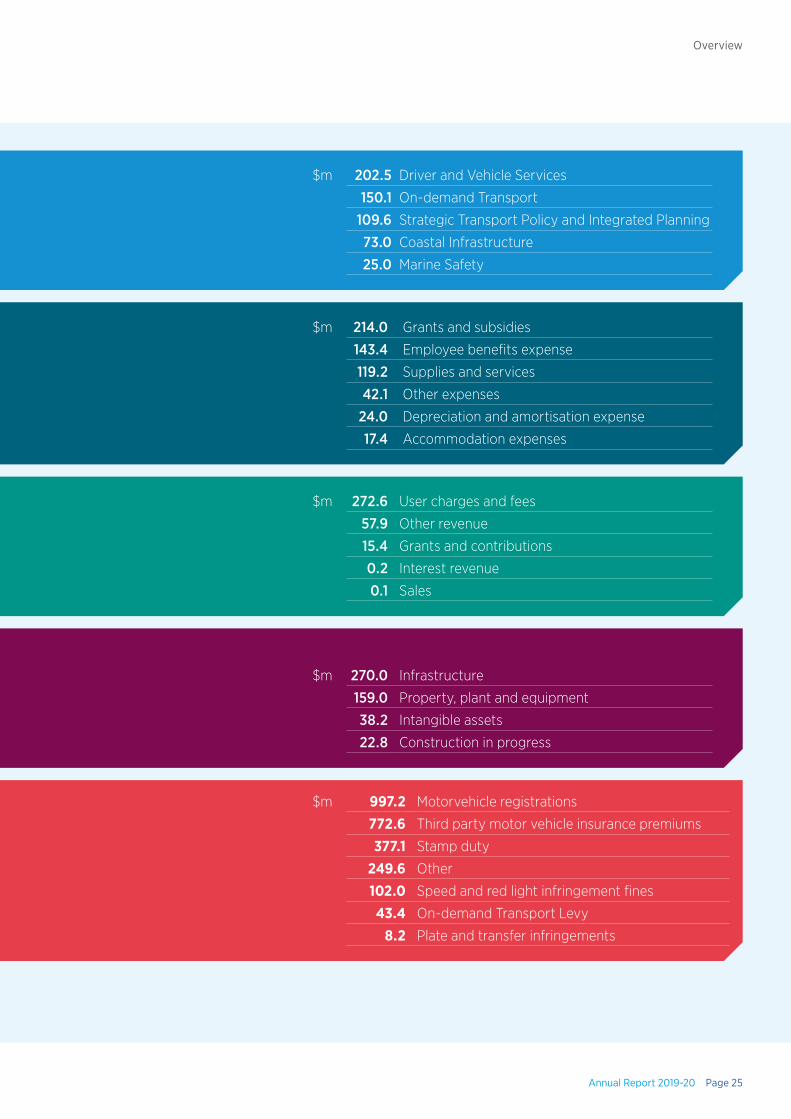
$m 202.5 Driver and Vehicle Services
150.1 On-demand Transport
109.6 Strategic Transport Policy and Integrated Planning
73.0 Coastal Infrastructure
25.0 Marine Safety
$m 214.0 Grants and subsidies
143.4 Employee benefits expense
119.2 Supplies and services
42.1 Other expenses
24.0 Depreciation and amortisation expense
17.4 Accommodation expenses
$m 272.6 User charges and fees
57.9 Other revenue
15.4 Grants and contributions
0.2 Interest revenue
0.1 Sales
$m 270.0 Infrastructure
159.0 Property, plant and equipment
38.2 Intangible assets
22.8 Construction in progress
$m 997.2 Motorvehicle registrations
772.6 Third party motor vehicle insurance premiums
377.1 Stamp duty
249.6 Other
102.0 Speed and red light infringement fines
43.4 On-demand Transport Levy
8.2 Plate and transfer infringements
Annual Report 2019-20 Page 25
Overview
Operational Structure
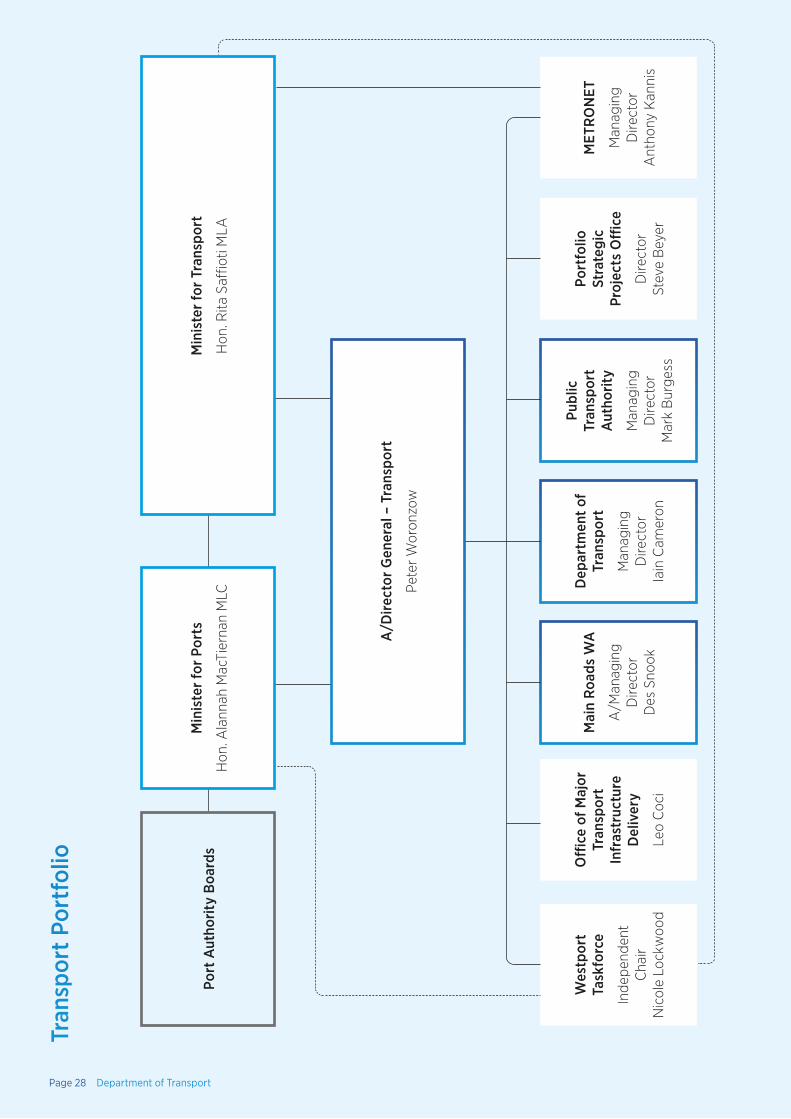
The Transport PortfolioDoT is a member of the State Government’s Transport Portfolio, which also comprises the PTA, Main Roads, METRONET, the Portfolio Strategic Projects Office and the Westport Taskforce. The establishment of OMTID in May 2020 marks a new addition to the Transport Portfolio.
Through our diverse and highly skilled teams, DoT takes a leading role in integrating and enhancing coordination of the State’s transport operations, regulatory functions and planning and policy development processes.
In March 2020, Peter Woronzow was appointed to the position of Acting Director General – Transport, which also sees him hold the concurrent roles of Acting Chief Executive Officer of PTA and Acting Commissioner of Main Roads.
Until March 2020, Mr Richard Sellers, held these positions before being seconded to the role of Acting Director General of the Department of Jobs, Tourism, Science and Innovation. The Transport Portfolio thanks Mr Sellers for his dedication and leadership shown during this financial year.
The structure of the Transport Portfolio is shown on page 28.
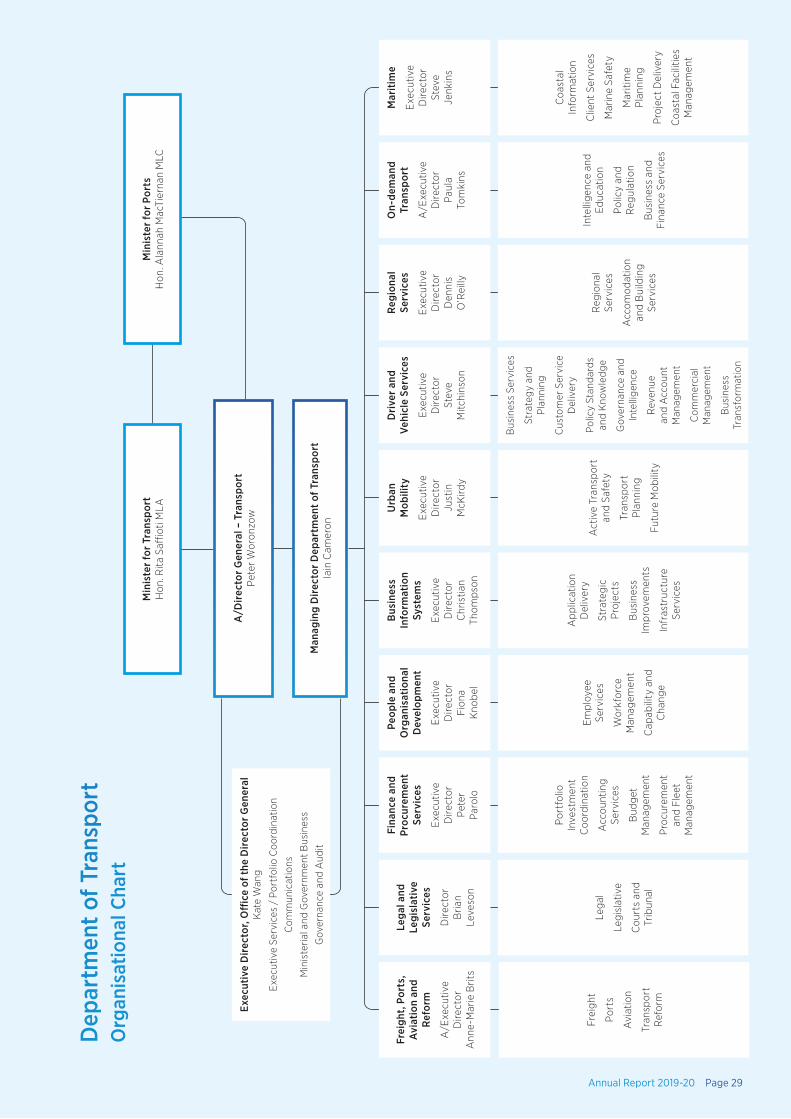
The Department of TransportDoT delivers a diverse range of specialist transport services to support WA’s social and economic prosperity. Our strategic transport planning and policy services, designed with our customers and stakeholders top-of-mind, are delivered through 11 Directorates, overseen by DoT’s Managing Director.
The priorities and core functions of DoT’s Directorates are outlined in the organisational chart on page 29.
Changes to the Portfolio and the DepartmentOffice of Major Transport Infrastructure Delivery created
In May 2020, OMTID was established to take over control and management of the construction of major road and rail projects. Project delivery teams from PTA and Main Roads were relocated to a combined location on Stirling Street in Perth under the leadership of Mr Leo Coci, the Executive Director of Infrastructure Delivery at Main Roads.
OMTID reflects the continuing progression to addressing challenges and opportunities presented to the Transport Portfolio. The formulation of this strategic Office will be a key driver in rebooting WA’s economy following the COVID-19 disruption by allowing work on major road and rail projects to get moving as quickly as possible.
Projects with a budget of more than $100 million will be delivered by OMTID, as well as smaller projects with high levels of complexity or synergies. This scope encompasses most of METRONET’s program of projects, including the Thornlie-Cockburn Link, Yanchep Rail Extension, Morley-Ellenbrook Line, Bayswater Station Upgrade and Byford Rail Extension. Main Roads projects transitioned to OMTID included the Hester-Romeo extension of the Mitchell Freeway, the Bunbury Outer Ring Road, Albany Ring Road, Stephenson Avenue, the Fremantle Traffic-Rail Bridge replacement and Karratha-Tom Price Stage Four.
Merger establishes Maritime Business Unit
As part of DoT’s agency-wide realignment, the Coastal Infrastructure and Marine Safety Business Units were merged into a single Maritime Business Unit, based in Fremantle. The merger came into effect on 1 July 2019.
Former General Manager of Coastal Infrastructure, Steve Jenkins, assumed the role of Executive Director Maritime, while former General Manager of Marine Safety, Ray Buchholz, took on the role of Deputy Executive Director Maritime.
Page 26 Department of Transport
Overview
New headquarters for the Maritime Business Unit
The Maritime Business Unit bid farewell to its home of more than 30 years, Marine House, and moved into its new headquarters on the top floor of the Kings Square development in Fremantle on 5 June 2020. Thanks to a great deal of advanced planning by many dedicated team members, the transition to Kings Square occurred quickly and smoothly.
As well as adjusting to a new location, the Maritime team also moved to an activity-based way of working at Kings Square. This allows team members to work flexibly in different settings or with different teams, depending on the type of work or projects they are completing.
DoT collaborates with Transport Portfolio partners on project investment
In early June 2020, DoT’s Portfolio Investment Coordination Branch combined with the Main Roads’ Budget and Program Management Branch to streamline budgeting and investment decisions. This progressive decision allows DoT to provide the Government with the most timely and accurate financial information to support the COVID-19 economic recovery.
Enabling LegislationDoT was established on 1 July 2009, under the Public Sector Management Act 1994.
Responsible MinistersHon. Rita Saffioti MLA, Minister for Transport
Hon. Alannah MacTiernan MLC, Minister for Ports
Through our diverse and highly skilled teams, DoT takes a leading role in integrating and enhancing coordination of the State’s transport operations, regulatory functions and planning and policy development processes.
Annual Report 2019-20 Page 27
Overview
Tran
spor
t Por
tfol
io
Dep
artm
ent o
f Tr
ansp
ort
Man
agin
g D
irect
or
Iain
Cam
eron
Wes
tpor
t Ta
skfo
rce
Inde
pend
ent
Cha
ir
Nic
ole
Lock
woo
d
Offi
ce o
f Maj
or
Tran
spor
t In
fras
truc
ture
D
eliv
ery
Leo
Coc
i
Mai
n R
oads
WA
A/M
anag
ing
Dire
ctor
D
es S
nook
Publ
ic
Tran
spor
t A
utho
rity
Man
agin
g D
irect
or
Mar
k B
urge
ss
Port
folio
St
rate
gic
Proj
ects
Offi
ce
Dire
ctor
St
eve
Bey
er
MET
RO
NET
Man
agin
g D
irect
or
Ant
hony
Kan
nis
Port
Aut
horit
y B
oard
sM
inis
ter f
or T
rans
port
Hon
. Rita
Saffi
oti M
LA
A/D
irect
or G
ener
al –
Tra
nspo
rt
Pete
r Wor
onzo
w
Min
iste
r for
Por
ts
Hon
. Ala
nnah
Mac
Tier
nan
MLC
Page 28 Department of Transport
Dep
artm
ent o
f Tra
nspo
rtO
rgan
isat
iona
l Cha
rt
Lega
l
Legi
slat
ive
Cou
rts
and
Trib
unal
Act
ive
Tran
spor
t an
d Sa
fety
Tran
spor
t Pl
anni
ng
Futu
re M
obili
ty
Port
folio
In
vest
men
t C
oord
inat
ion
Acc
ount
ing
Serv
ices
Bud
get
Man
agem
ent
Pro
cure
men
t an
d Fl
eet
Man
agem
ent
Empl
oyee
Se
rvic
es
Wor
kfor
ce
Man
agem
ent
Cap
abili
ty a
nd
Cha
nge
Bus
ines
s Se
rvic
es
Stra
tegy
and
Pl
anni
ng
Cus
tom
er S
ervi
ce
Del
iver
y
Polic
y St
anda
rds
and
Kno
wle
dge
Gov
erna
nce
and
Inte
llige
nce
Rev
enue
an
d A
ccou
nt
Man
agem
ent
Com
mer
cial
M
anag
emen
t
Bus
ines
s Tr
ansf
orm
atio
n
App
licat
ion
Del
iver
y
Stra
tegi
c P
roje
cts
Bus
ines
s Im
prov
emen
ts
Infr
astr
uctu
re
Serv
ices
Reg
iona
l Se
rvic
es
Acc
omod
atio
n an
d B
uild
ing
Serv
ices
Coa
stal
In
form
atio
n
Clie
nt S
ervi
ces
Mar
ine
Safe
ty
Mar
itim
e Pl
anni
ng
Pro
ject
Del
iver
y
Coa
stal
Fac
ilitie
s M
anag
emen
t
Inte
llige
nce
and
Educ
atio
n
Polic
y an
d R
egul
atio
n
Bus
ines
s an
d Fi
nanc
e Se
rvic
es
Frei
ght
Port
s
Avi
atio
n
Tran
spor
t R
efor
m
Lega
l and
Le
gisl
ativ
e Se
rvic
es
Dire
ctor
B
rian
Leve
son
Frei
ght,
Por
ts,
Avi
atio
n an
d R
efor
m
A/E
xecu
tive
Dire
ctor
A
nne-
Mar
ie B
rits
Urb
an
Mob
ility
Exe
cutiv
e D
irect
or
Just
in
McK
irdy
Fina
nce
and
Proc
urem
ent
Serv
ices
Exe
cutiv
e D
irect
or
Pete
r P
arol
o
Peop
le a
nd
Org
anis
atio
nal
Dev
elop
men
t
Exe
cutiv
e D
irect
or
Fion
a K
nobe
l
Bus
ines
s In
form
atio
n Sy
stem
s
Exe
cutiv
e D
irect
or
Chr
istia
n Th
omps
on
Dri
ver a
nd
Vehi
cle
Serv
ices
Exe
cutiv
e D
irect
or
Stev
e M
itchi
nson
Reg
iona
l Se
rvic
es
Exe
cutiv
e D
irect
or
Den
nis
O’R
eilly
Mar
itim
e
Exe
cutiv
e D
irect
or
Stev
e Je
nkin
s
On-
dem
and
Tran
spor
t
A/E
xecu
tive
Dire
ctor
P
aula
To
mki
ns
Min
iste
r for
Tra
nspo
rt
Hon
. Rita
Saffi
oti M
LA
Exec
utiv
e D
irec
tor,
Offi
ce o
f the
Dir
ecto
r Gen
eral
K
ate
Wan
g
Exe
cutiv
e Se
rvic
es /
Por
tfol
io C
oord
inat
ion
Com
mun
icat
ions
Min
iste
rial a
nd G
over
nmen
t Bus
ines
s
Gov
erna
nce
and
Aud
it
A/D
irec
tor G
ener
al –
Tra
nspo
rt
Pete
r Wor
onzo
w
Man
agin
g D
irec
tor D
epar
tmen
t of T
rans
port
Ia
in C
amer
on
Min
iste
r for
Por
ts
Hon
. Ala
nnah
Mac
Tier
nan
MLC
Annual Report 2019-20 Page 29
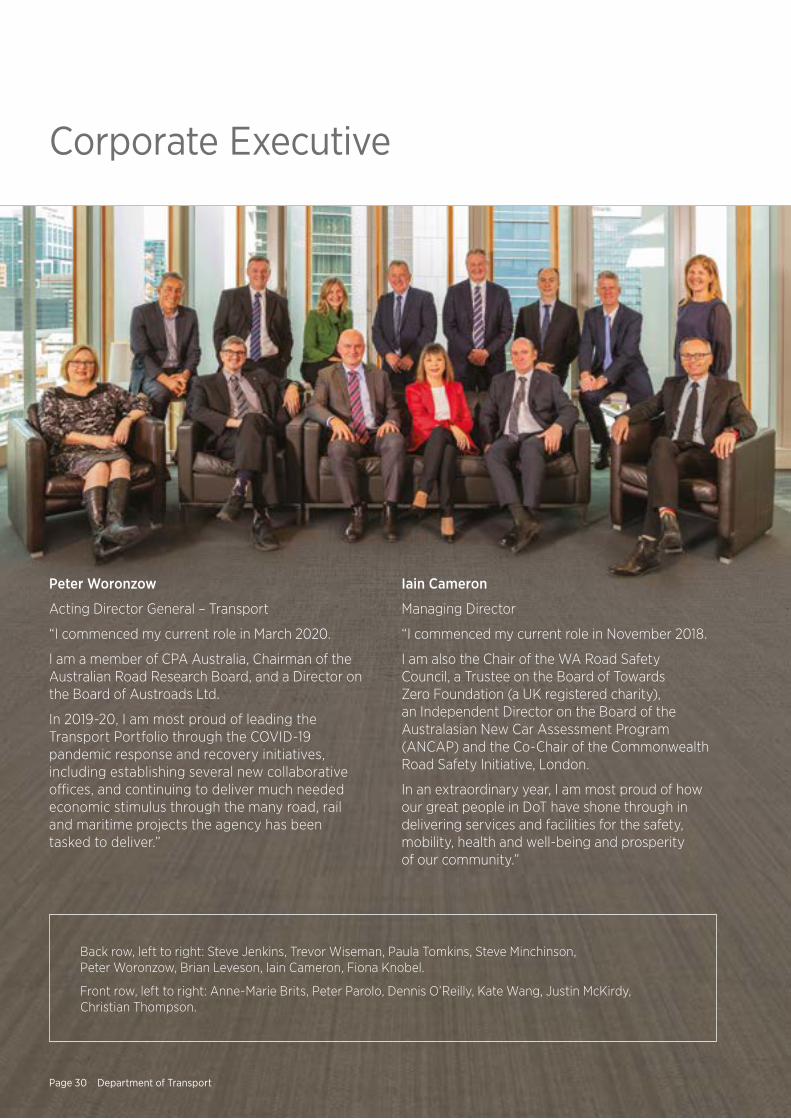
Peter Woronzow
Acting Director General – Transport
“I commenced my current role in March 2020.
I am a member of CPA Australia, Chairman of the Australian Road Research Board, and a Director on the Board of Austroads Ltd.
In 2019-20, I am most proud of leading the Transport Portfolio through the COVID-19 pandemic response and recovery initiatives, including establishing several new collaborative offices, and continuing to deliver much needed economic stimulus through the many road, rail and maritime projects the agency has been tasked to deliver.”
Iain Cameron
Managing Director
“I commenced my current role in November 2018.
I am also the Chair of the WA Road Safety Council, a Trustee on the Board of Towards Zero Foundation (a UK registered charity), an Independent Director on the Board of the Australasian New Car Assessment Program (ANCAP) and the Co-Chair of the Commonwealth Road Safety Initiative, London.
In an extraordinary year, I am most proud of how our great people in DoT have shone through in delivering services and facilities for the safety, mobility, health and well-being and prosperity of our community.”
Corporate Executive
Back row, left to right: Steve Jenkins, Trevor Wiseman, Paula Tomkins, Steve Minchinson, Peter Woronzow, Brian Leveson, Iain Cameron, Fiona Knobel.
Front row, left to right: Anne-Marie Brits, Peter Parolo, Dennis O’Reilly, Kate Wang, Justin McKirdy, Christian Thompson.
Page 30 Department of Transport
Kate Wang
Executive Director Office of the Director General
“I commenced my current role in November 2014.
In 2019-20, I am proud of collaborating with colleagues across DoT and the Portfolio to deliver the 2020 Transport Portfolio Leadership Forum in February; and working with my ODG teams during the pandemic to continue serving our customers and key stakeholders.”
Anne-Marie Brits
Acting Executive Director Freight, Ports, Aviation and Reform
“I commenced my current role in October 2019.
I am very proud of the way our staff rose to the challenges presented by COVID-19, and worked with other agencies and industry stakeholders to achieve the best possible outcomes for the WA community. Our staff have been responsive, adaptable and pragmatic while remaining outcomes focused. I am very thankful for how my team and the other members of CorpEx have supported me in my role.”
Justin McKirdy
Executive Director Urban Mobility
“I commenced my current role in September 2019.
In 2019-20, I am most proud of how I have been welcomed by the team into DoT. The team have pulled together and achieved many significant outcomes including: increased Your Move participation; continuation of PSP funding program, Long Term Cycle Network planning and strengthening relationship with Main Roads WA; Greater Perth CBD Transport Plan stakeholder engagement, planning and negotiations; Perth Parking management and administration – especially through COVID restriction period; modelling for METRONET; progressing the Movement and Place Framework; and contributing to future mobility discussions.”
Peter Parolo
Executive Director Finance and Procurement Services
“I commenced my current role in July 2011.
As well as being a CPA Fellow, I am a volunteer Director and Treasurer for a retirement village.
In 2019-20, I am most proud of the fact that throughout the challenges of COVID-19, we continued to fully deliver for our customers.”
Fiona Knobel
Executive Director People and Organisational Development
“I commenced my current role in July 2011, but was on secondment elsewhere from May 2019 to June 2020.
I am a Fellow of the Australian Human Resources Institute and graduate of the Australian Institute of Company Directors.
My biggest achievement in 2019-20 was, as a member of the State Pandemic Coordination Centre from March to June 2020, setting up a successful, collaborative working group (across government and non-government) to address the issues of food supply and security throughout regional WA caused by COVID-19.”
Trevor Wiseman
Acting Executive Director People and Organisational Development
“I was in this position from May 2019 until June 2020.
My biggest achievement in 2019-20 was helping DoT to benchmark its current values standards, and developing a program to define the behaviours, mindset and capabilities that will take DoT to a new level of being a values-driven organisation.”
Annual Report 2019-20 Page 31
Corporate Executive
Brian Leveson
Legal and Legislative Services Director
“I commenced my current role in 2012.
My biggest achievement in 2019-20 was the passage of the Transport (Road Passenger Services) Amendment (COVID-19 Response and Regional Assistance) Act 2020. This Act was drafted, debated in Parliament, passed and assented to within one week.”
Christian Thompson
Executive Director Business Information Systems
“I commenced my current role in March 2015.
My greatest achievements in 2019-20 were establishing ServiceWA, building remote working capability for DOT during the COVID-19 pandemic, and implementing the on-demand transport systems solution.”
Steve Mitchinson
Executive Director Driver and Vehicle Services
“I commenced my current role in February 2017.
My biggest achievements in 2019-20 were: the introduction of e-billing and passing 600,000 DoTDirect customers, which improves access and convenience for customers; and supporting the WA community with our response to the COVID-19 pandemic by establishing the 13COVID hotline and the G2G PASS app.”
Dennis O’Reilly
Executive Director Regional Services
“I commenced my current role in July 2017, after having previously led Regional Services from 2002 to 2005.
In 2019-20, I am most proud of leading and supporting the Regional Services team through the COVID-19 response and recovery phases. Focusing on the health and wellbeing of our staff as well as delivering essential services to our regional customers through these unprecedented times.”
Paula Tomkins
Acting Executive Director On-demand Transport
“I commenced my current role in July 2017.
In 2019-20, I am proud of working across DoT to finalise the on-demand transport reforms, which commenced in 2015 with the green paper.”
Steve Jenkins
Executive Director Maritime
“I commenced my current role in April 2008.
In 2019-20, there were many achievements, but the highlights to me are:
• working together as a team to deliver government initiatives and Maritime business outcomes;
• bringing two business areas together into one Maritime team, and the strong engagement by all;
• the way our people smoothly transitioned into the new Kings Square building; and adopted our new ways of working; and
• the way our people adapted, worked through and were engaged in the recovery initiatives from the COVID-19 pandemic.”
DoT delivers a diverse range of specialist transport services to support WA’s social and economic prosperity.
Page 32 Department of Transport
Corporate Executive
On behalf of the Minister for Transport, DoT administers the following Acts:
Air Navigation Act 1937
Civil Aviation (Carriers’ Liability) Act 1961
Damage by Aircraft Act 1964
Harbours and Jetties Act 1928
Jetties Act 1926
Lights (Navigation Protection) Act 1938
Marine and Harbours Act 1981
Marine Navigational Aids Act 1973
Maritime Fees and Charges (Taxing) Act 1999
Motor Vehicle Drivers Instructors Act 1963
Owner-Drivers (Contracts and Disputes) Act 2007
Perth Parking Management Act 1999
Perth Parking Management (Consequential Provisions) Act 1999
Perth Parking Management (Taxing) Act 1999
Pilots’ Limitation of Liability Act 1962
Pollution of Waters by Oil and Noxious Substances Act 1987
Rail Safety National Law (WA) Act 2015
Road Traffic (Administration) Act 2008
Road Traffic (Authorisation to Drive) Act 2008
Road Traffic (Vehicles) Act 2012
Road Traffic (Vehicles) (Taxing) Act 2008
Sea-Carriage of Goods Act 1909
Shipping and Pilotage Act 1967
Trans-Continental Railway Act 1911
Transport Co-ordination Act 1966
Transport (Road Passenger Services) Act 2018
Western Australian Coastal Shipping Commission Act 1965
Administered Legislation
Western Australian Marine Act 1982
Western Australian Photo Card Act 2014
Wire and Wire Netting Act 1926
On behalf of the Minister for Ports, DoT administers the following Act:
Port Authorities Act 1999
Other legislation affecting the functions and operation of DoT include:
Criminal Code Act Compilation Act 1913
Disability Services Act 1993
Electronic Transactions Act 2011
Equal Opportunity Act 1984
Evidence Act 1906
Financial Management Act 2006
Freedom of Information Act 1992
Industrial Relations Act 1979
Interpretation Act 1984
Library Board of Western Australia Act 1951
Limitation Act 2005
Minimum Conditions of Employment Act 1993
Native Title Act 1993 (Commonwealth)
Occupational Safety and Health Act 1984
Public Sector Management Act 1994
Road Traffic Act 1974
Royal Commission (Custody of Records) Act 1992
State Records Act 2000
State Supply Commission Act 1991
State Trading Concerns Act 1916
Taxation Administration Act 2003
Annual Report 2019-20 Page 33
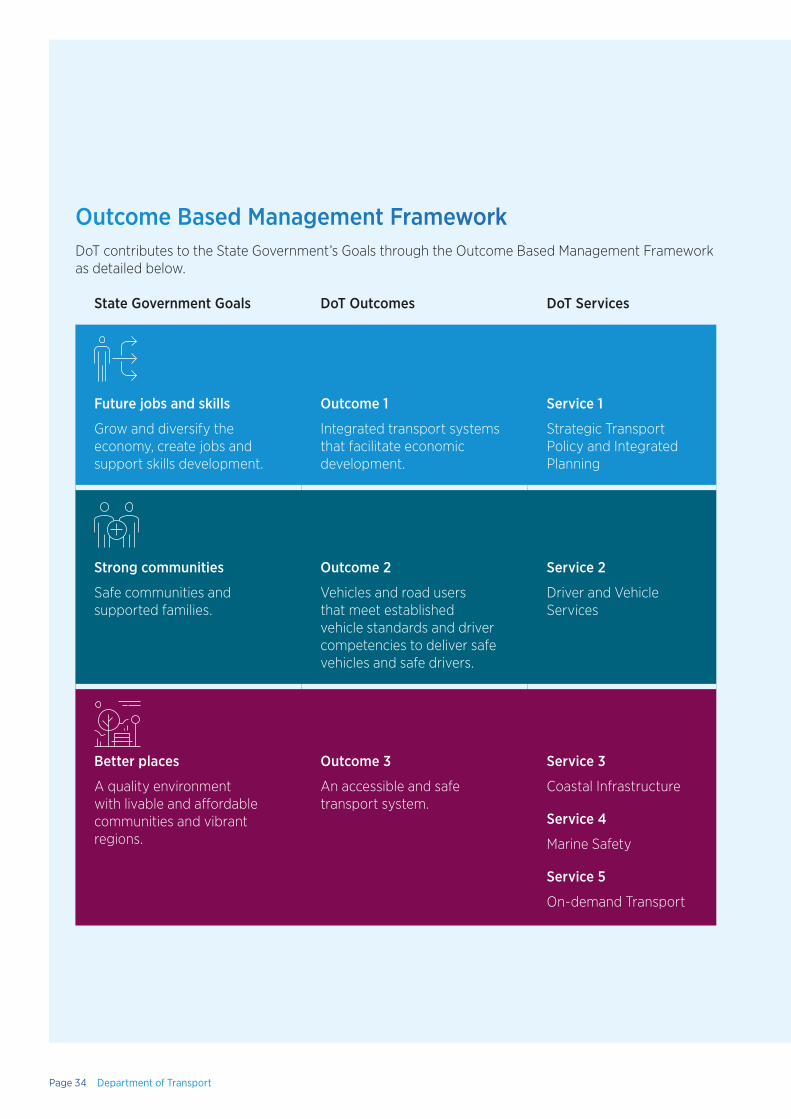
Outcome Based Management FrameworkDoT contributes to the State Government’s Goals through the Outcome Based Management Framework as detailed below.
State Government Goals DoT Outcomes DoT Services
Future jobs and skills
Grow and diversify the economy, create jobs and support skills development.
Outcome 1
Integrated transport systems that facilitate economic development.
Service 1
Strategic Transport Policy and Integrated Planning
Strong communities
Safe communities and supported families.
Outcome 2
Vehicles and road users that meet established vehicle standards and driver competencies to deliver safe vehicles and safe drivers.
Service 2
Driver and Vehicle Services
Better places
A quality environment with livable and affordable communities and vibrant regions.
Outcome 3
An accessible and safe transport system.
Service 3
Coastal Infrastructure
Service 4
Marine Safety
Service 5
On-demand Transport
Page 34 Department of Transport
• Key Efficiency Indicators under ‘Service 5: On-demand Transport’:
- discontinued “Cost of Regulation per Taxi Plate Administered”; and
- introduced new indicator, “Cost per On-demand Transport Authorisation”.
• The former efficiency indicator became obsolete after the reforms were introduced as it only measured DoT’s performance against the taxi sector of the on-demand transport industry. With the emergence of more varied passenger transport service types, the new indicator, “Cost per On-demand Transport Authorisation”, is more reflective of the current and emerging industry. It is therefore a more accurate gauge of the performance of On-demand Transport in conducting on-demand authorisation transactions.
Changes to the Outcome Based Management FrameworkWith the passing of the On-demand Transport Reform, DoT undertook a review of On-demand Transport’s Key Performance Indicators and received approval for the following changes to its outcome based management framework in 2019-20:
• Key Effectiveness Indicators under ‘Outcome 3: An accessible and safe transport system’:
- discontinued “Percentage by which, the waiting time standard, for metropolitan area taxis, is met”; and
- introduced new indicator, “Percentage of multi-purpose taxi journeys carrying passengers in wheelchairs which meet the waiting time standard”.
• These amendments aim to measure the accessibility of on-demand transport services for people with disability, which remains an important social justice dimension under the regulatory remit of On-demand Transport.
Annual Report 2019-20 Page 35
Outcome Based Management Framework

State Public Information Line (or 13COVID hotline) established
Following the declaration of a State of Emergency in WA due to the COVID-19 pandemic, the Police Commissioner, in his role as State Emergency Coordinator, took the opportunity to utilise the ongoing arrangement between DoT and WA Police to operationalise the State Public Information Line (SPIL).
The intent of the SPIL is to provide the WA community with one central point of contact for questions and information relating to COVID-19. This included queries around border controls, travel restrictions (including G2G PASS application questions), general health-related questions, emergency declarations and restrictions, and the phases of COVID-19 restriction easing.
DoT, WA Police and the Department of the Premier and Cabinet (DPC) worked together for four days to establish a Cloud-based telephony solution for the SPIL. The 13COVID hotline went live on Wednesday, 1 April 2020.
The hotline initially operated from Monday to Sunday, 7.00am to 10.00pm. The 13COVID team, resourced with 113 employees from across DoT (primarily DVS and Regional Services), were appropriately trained and enabled to work from home. More than 70,000 enquiries from the public had been responded to.
As at 30 June 2020, the 13COVID line was operating Monday to Sunday from 8.00am to 6.00pm. The hotline will continue operating until the Police Commissioner deems that it is no longer required.
Shared Responsibilities
Page 36 Department of Transport
G2G PASS developed
When WA declared a State of Emergency in response to the COVID-19 pandemic, a number of directions restricting the ability of non-essential workers to travel into and within WA were given by the State Emergency Coordinator (SEC). The G2G PASS was an initiative proposed by WA Police in response to those Directions, which would allow essential travellers, such as freight truck drivers and medical practitioners, to continue moving throughout the State upon receiving authorisation.
DoT assisted WA Police and DPIRD in developing the app. The G2G PASS team was then established to assume responsibility for assessing and processing travel exemption applications in accordance with the SEC’s Directions regulating interstate, intrastate and biosecurity travel.
The G2G PASS team contributed to processing more than 135,000 travel applications over a five-week period. This enabled WA Police to manage and enforce the Directions while minimising any impacts to essential services and the WA economy.
ServiceWA pilot progresses
ServiceWA is a State Government initiative to streamline the delivery of 85 face-to-face services provided by DoT, DPIRD, Department of Justice, Department of Communities and WA Police through a single shopfront. ServiceWA may deliver a more integrated approach to the delivery of government services, offering a more convenient and efficient experience for both agencies and customers.
The project is jointly managed by the Department of Finance, DoT and the Office of Digital Government. DoT is leading the physical delivery mode and the Office of Digital Government is leading the online components.
In May 2018, funding was secured to establish a ServiceWA pilot site in Bunbury, utilising the existing DoT site. DoT has developed the basic systems and infrastructure, as well as delivering training and change management sessions for the employees who will work at the new ServiceWA centre. Sites works to make the necessary adjustments to the DoT building were completed in 2019-20.
The initial launch day of 1 July 2020 was postponed due to the impacts of the COVID-19 pandemic. The project is now anticipated to go live in October 2020, delivering improved convenience to community members in the Bunbury area.
Connected Portfolio – unifying the IT environment
The Transport Portfolio agencies historically operated as separate units, which resulted in replicated internal services and systems, including IT.
The Portfolio was granted exemption from going through the 2017 Western Australian machinery of government changes based on the understanding that the agencies would proactively collaborate to increase efficiencies and reduce replication. Unifying our IT environments through the provision of shared software services, particularly the Microsoft Office 365 product suite, is one such efficiency initiative.
The initial project commenced with DoT and Main Roads, as PTA were waiting on other software upgrades, utilising Main Roads’ existing Microsoft Cloud instance. The first phase of the project, completed in September 2019, resulted in DoT Microsoft software licences and Office 365 applications transferred to Main Roads tenancy. The log-on process for DoT users was streamlined to avoid confusion.
The next phase of the IT unification project involves migrating the DoT email system to the shared Cloud with Main Roads. This is being done in stages to ensure any impact on business operations is minimised. Work is complete for most business units, with completion scheduled by December 2020. As of 30 June 2020, 65 per cent of DoT’s 5,316 mailboxes had been migrated.
Main Roads and DoT are continuing to work together to identify further opportunities for collaboration and efficiency between the two agencies, plus options for PTA collaboration.
Annual Report 2019-20 Page 37
Shared Responsibilities
Port Hedland Spoilbank Marina progresses
Working with the Pilbara Development Commission, DoT continued to progress the development of the marine components of the Spoilbank Marina project throughout 2019-20. This project is being designed to meet the recreational boating needs of the Port Hedland community and provide much-needed amenity for locals and tourists.
DoT has been collaborating closely with Pilbara Development Commission, Town of Port Hedland, Pilbara Ports Authority, DevelopmentWA and the Department of Treasury on the project. DoT Maritime is responsible for delivering the detailed marine design and seeking relevant maritime approvals for the project.
In October 2018, Cabinet endorsed a $94 million scope of works for the preferred concept design, which includes boat pens, boat launching facilities, two breakwaters and internal revetment walls, and an access channel separating the marina traffic from shipping activity. The concept also features new public open spaces and improved public access, parking, toilet facilities and areas for pop-up retail stalls.
Following the Cabinet endorsement, DoT was engaged to provide time and cost estimates for the coastal risk mapping for the Spoilbank site, as well as undertake the detailed design for the marina. Work is progressing well and will continue in 2020-21.
Planning improved marine facilities in Broome
In 2019-20, DoT worked closely with the Shire of Broome to progress its planning for a new Broome boating facility, as well as improving existing boating facilities at Broome’s Town Beach.
To progress the planning for Broome’s new boating facility, DoT participated in the Broome Boat Harbour Advisory Group. This Group is chaired by the Shire of Broome and also includes representatives from DoT, Nyamba Buru Yawuru Ltd, Kimberley Development Commission, Kimberley Ports Authority and the local community. DoT is providing technical advice, as well as coordinating several engineering and environmental consultancies to progress the planning and concept design development. DoT is also administering the $1 million in State Government funding for the planning program that will inform a business case for the new facility.
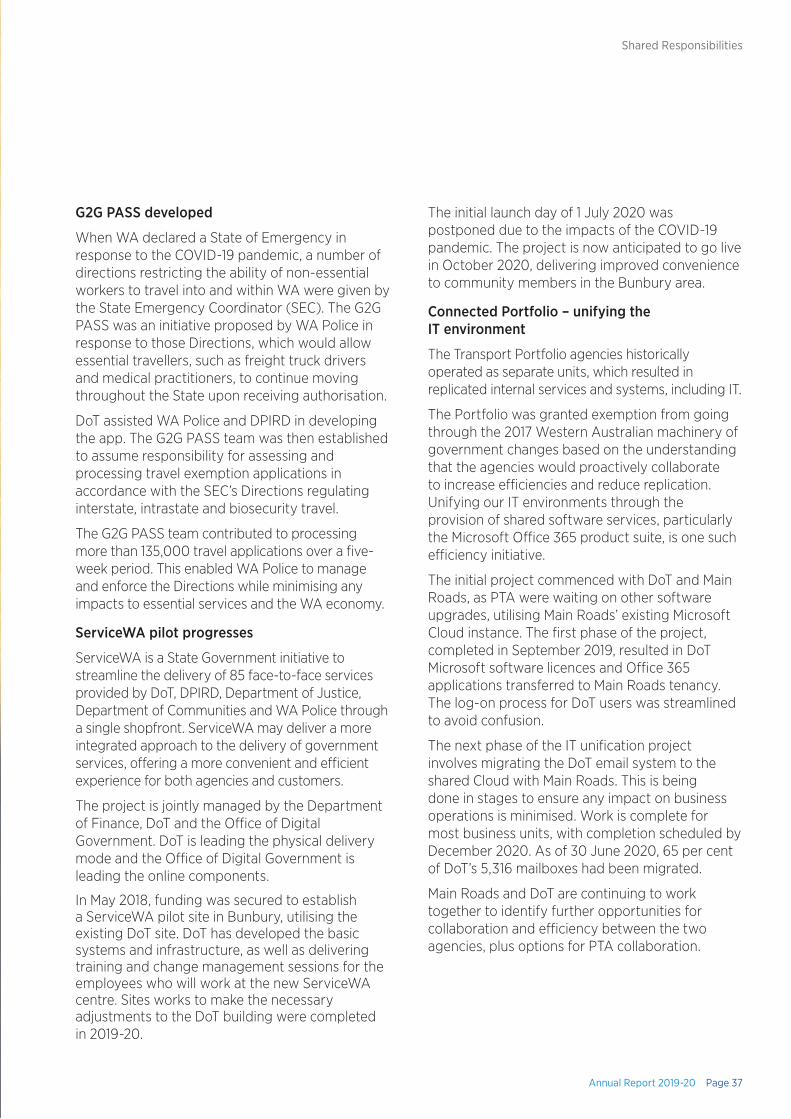
DoT administered the $6.74 million in State Government funding allocated to the Shire of Broome for upgrading the Town Beach boating facilities. This funding, secured to improve boat access and safety, facilitated the construction of the Town Beach revetment wall with coastal access stairs, a boat trailer carpark, ablution facility and road works. These projects were completed in 2019-20. The Shire, in partnership with LotteryWest, also funded the development of a park and landscaping, as well as upgrading the existing groyne to facilitate the construction of the Town Beach Jetty, which will occur in the next financial year.
Broome Town Beach redevelopment
Page 38 Department of Transport
Shared Responsibilities
Page 38 Department of Transport
Tantabiddi boating facilities
The Tantabiddi boat launching facility within the Shire of Exmouth serves as a gateway to the northern end of the Ningaloo Marine Park. It is a vital asset for tourism and recreational purposes, with a recent study indicating growing demand for the facility.
During 2019-20, DoT worked with the Shire of Exmouth and the Department of Biodiversity, Conservation and Attractions (DBCA) to progress plans and options for the development of the Tantabiddi boat launching facility. A taskforce chaired by the Director General – Transport has now been established to investigate options to address current issues and meet future expected needs.
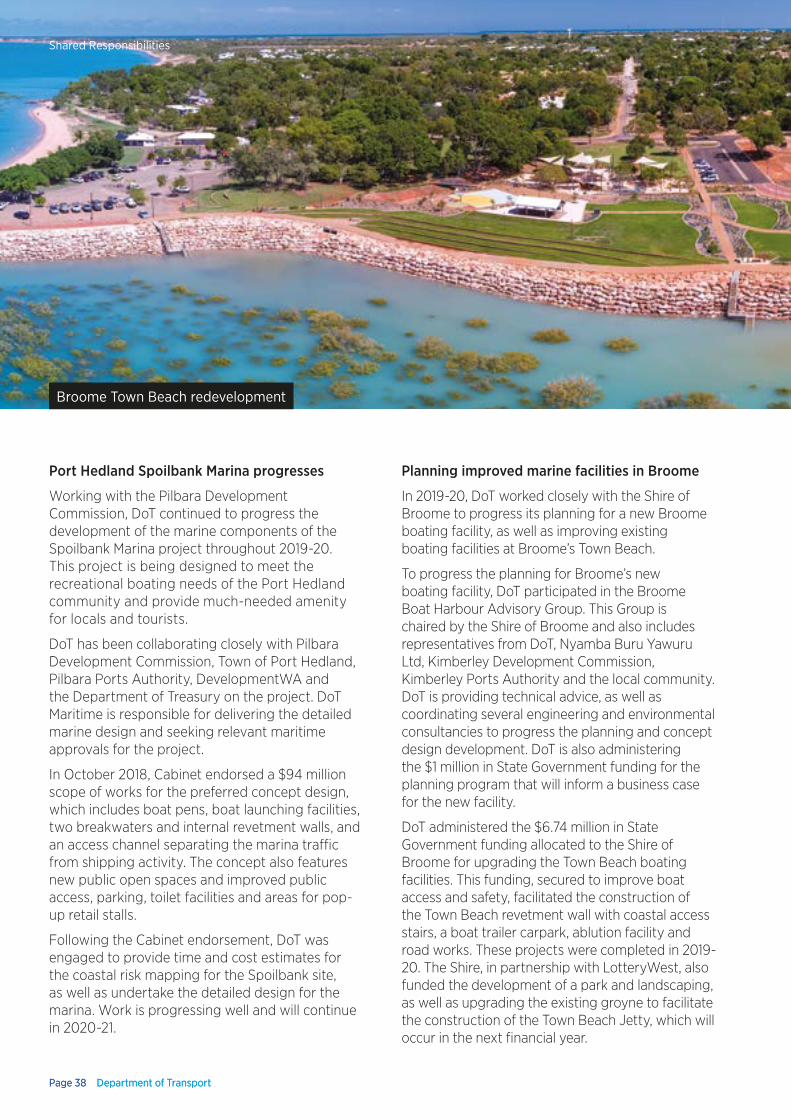
Broome Town Beach redevelopment
DoT administered the $6.74 million in State Government funding allocated to the Shire of Broome for upgrading the Town Beach boating facilities.
Annual Report 2019-20 Page 39
Shared Responsibilities
Annual Report 2019-20 Page 39
Transforming Bunbury’s Waterfront project
DoT continued to work closely with the South West Development Commission, DevelopmentWA and the City of Bunbury to deliver the Transforming Bunbury’s Waterfront (TBW) project. The project, overseen by the Bunbury Development Committee, aims to create vibrant shorelines for the local community and deliver infrastructure to stimulate thriving marine and tourism industries.
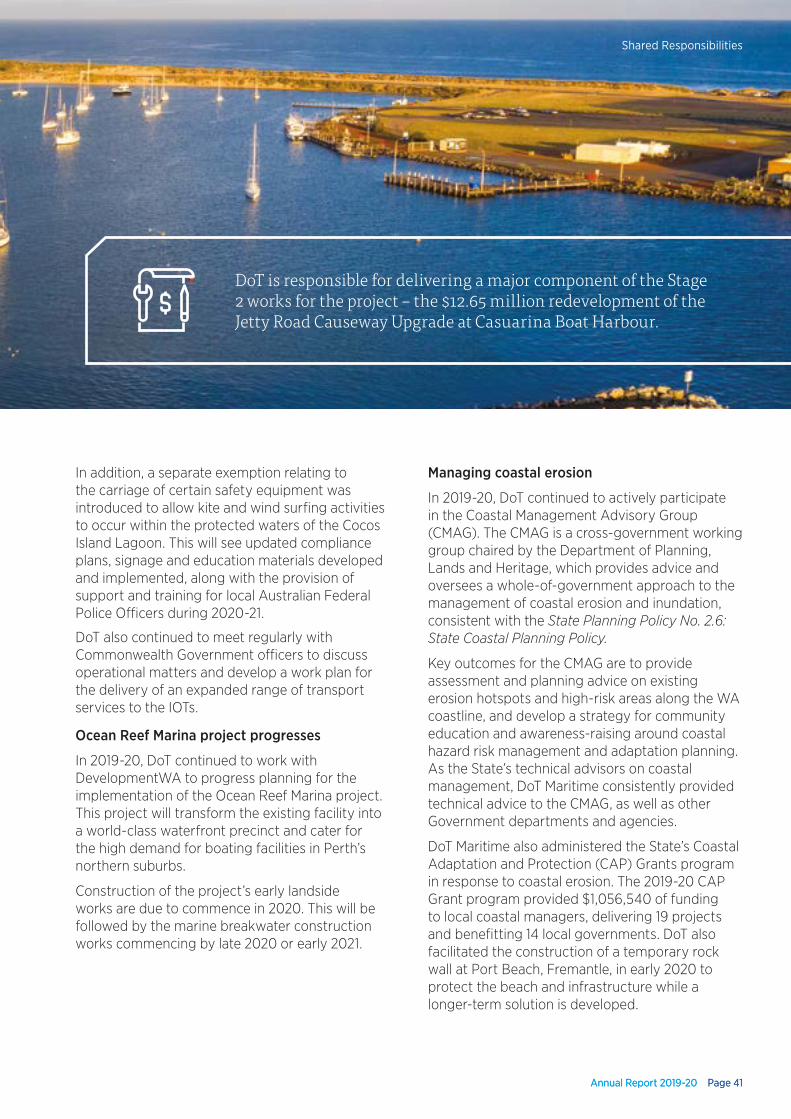
DoT is responsible for delivering a major component of the Stage 2 works for the project – the $12.65 million redevelopment of the Jetty Road Causeway Upgrade at Casuarina Boat Harbour. Phase 1 of the works addressed structural upgrades to the rock causeway; Phase 2 is currently delivering improved amenity and services for the community and penholders, beautification of the causeway, construction of a multipurpose building incorporating public toilets, and improved accessibility.
DevelopmentWA has secured $4.8 million in State Government funding to develop the business case for Stage 3 of the TBW project. In 2019-20, DoT oversaw the delivery of related maritime consultancy works, including dredging and project staging plans and detailed cost estimates, to support Stage 3.
DoT also continues to support planning for new maritime facilities in Bunbury’s Koombana Bay.
Supporting a safe and efficient transport system in the Indian Ocean Territories
DoT continued to provide transport services to the Indian Ocean Territories (IOTs) under a Service Delivery Arrangement between the Minister for Transport and the Commonwealth Government. Through this agreement, DoT supports the delivery of a safe, efficient, effective and equitable transport system in the IOTs of Christmas Island and the Cocos (Keeling) Islands, with the costs of providing these services being covered by the Commonwealth.
The Minister for Transport renewed the Service Delivery Arrangement with the Commonwealth in July 2019. Under the new Arrangement, DoT will continue to provide transport services to the IOTs until the end of June 2024.
DoT signed a two-year agreement for Phosphate Resources Limited to provide vehicle inspection services to the Christmas Island community. Services commenced in late November 2019. This is the first formal agreement to provide these services on the Island, and ensures continuity of services previously provided by the Shire of Christmas Island.
In 2019-20, DoT officers worked with local stakeholders to develop some practical exemptions to improve maritime safety outcomes for the IOT communities, in recognition of limitations in accessing basic marine safety equipment such as flares (pyro techniques).
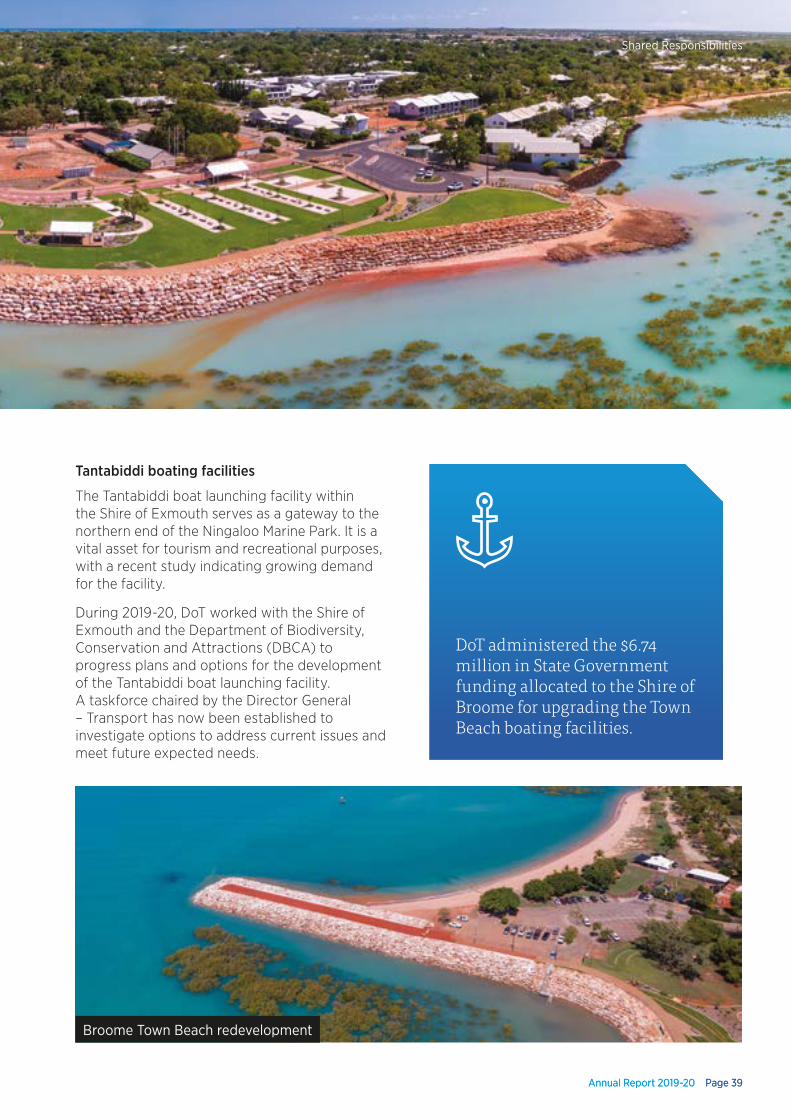
Casuarina Harbour redevelopment, Bunbury
Page 40 Department of TransportPage 40 Department of Transport
Shared Responsibilities
In addition, a separate exemption relating to the carriage of certain safety equipment was introduced to allow kite and wind surfing activities to occur within the protected waters of the Cocos Island Lagoon. This will see updated compliance plans, signage and education materials developed and implemented, along with the provision of support and training for local Australian Federal Police Officers during 2020-21.
DoT also continued to meet regularly with Commonwealth Government officers to discuss operational matters and develop a work plan for the delivery of an expanded range of transport services to the IOTs.
Ocean Reef Marina project progresses
In 2019-20, DoT continued to work with DevelopmentWA to progress planning for the implementation of the Ocean Reef Marina project. This project will transform the existing facility into a world-class waterfront precinct and cater for the high demand for boating facilities in Perth’s northern suburbs.
Construction of the project’s early landside works are due to commence in 2020. This will be followed by the marine breakwater construction works commencing by late 2020 or early 2021.
Managing coastal erosion
In 2019-20, DoT continued to actively participate in the Coastal Management Advisory Group (CMAG). The CMAG is a cross-government working group chaired by the Department of Planning, Lands and Heritage, which provides advice and oversees a whole-of-government approach to the management of coastal erosion and inundation, consistent with the State Planning Policy No. 2.6: State Coastal Planning Policy.
Key outcomes for the CMAG are to provide assessment and planning advice on existing erosion hotspots and high-risk areas along the WA coastline, and develop a strategy for community education and awareness-raising around coastal hazard risk management and adaptation planning. As the State’s technical advisors on coastal management, DoT Maritime consistently provided technical advice to the CMAG, as well as other Government departments and agencies.
DoT Maritime also administered the State’s Coastal Adaptation and Protection (CAP) Grants program in response to coastal erosion. The 2019-20 CAP Grant program provided $1,056,540 of funding to local coastal managers, delivering 19 projects and benefitting 14 local governments. DoT also facilitated the construction of a temporary rock wall at Port Beach, Fremantle, in early 2020 to protect the beach and infrastructure while a longer-term solution is developed.
DoT is responsible for delivering a major component of the Stage 2 works for the project – the $12.65 million redevelopment of the Jetty Road Causeway Upgrade at Casuarina Boat Harbour.
Annual Report 2019-20 Page 41Annual Report 2019-20 Page 41
Shared Responsibilities
Effectively managing maritime environmental emergencies
DoT is the appointed Hazard Management Agency (HMA) for maritime transport emergencies and marine oil pollution incidents (collectively referred to as maritime environmental emergencies) in WA under the State Emergency Management Act 2005.
In 2019-20, DoT continued to collaborate with many agencies to prepare responses to, and recover from, potential maritime environmental emergencies. Partner agencies included the Australian Maritime Safety Authority, local port authorities, the Department of Fire and Emergency Services, the Department of Biodiversity, Conservation and Attractions and petroleum titleholders.
DoT also significantly progressed initiatives aimed at enhancing its readiness and capability to respond to a maritime environmental emergency.
Maritime project collaboration with Main Roads
DoT’s Maritime Business Unit continues to collaborate with Transport Portfolio partner, Main Roads, across a number of areas, including: technical support on pavements and materials engineering; contract management and standards; and knowledge-sharing in relation to project/program management systems.
Regular meetings are being held between DoT Maritime and Main Roads to share knowledge regarding relevant procurement and works, such as delivering the proposed trucking route to the planned Port Hedland Spoilbank Marina.
West Pilbara Plan
DoT has been delivering its commitments within the West Pilbara Plan in partnership with the Ngarliyarndu Bindirri Aboriginal Corporation, Red Dirt Driving Academy and the local Sheriff’s office under the Department of Justice. The West Pilbara Plan sees DoT regularly take its mobile driver licensing and vehicle registration service offerings to the community of Roebourne to increase people’s access to these important services.
DoT has also been assisting community members with addressing fines and enforcement issues, in collaboration with the Sherriff’s office.
The West Pilbara Plan delivers the following outcomes:
• providing safe and comfortable access to an important government service in the local community location, particularly as many residents are unable to travel to government service centres;
• increasing opportunities for residents to become licensed drivers, and for vehicles to be registered; and
• providing greater support for people to address outstanding fines and infringements.
Dampier Peninsula Working Group (DPWG)
DoT has been working closely with other members of the DPWG to provide suggestions and solutions to optimise community outcomes and alleviate concerns resulting from the proposed sealing of the Broome-Cape Leveque Road.
An Outcomes Report was produced by the DPWG which incorporated insights gained from community engagement and workshops, including a co-design workshop in October 2019. This Report identified four major areas of concern:
1. Changes in vehicle and licence requirements
2. Increased risk-taking behaviours with the changed roads
3. Increased risk in community areas for pedestrians and residents
4. Enforcing the rules: by-laws for community safety
The DPWG will continue progressing this work in 2020-21.
Page 42 Department of Transport
Shared Responsibilities
Page 42 Department of Transport
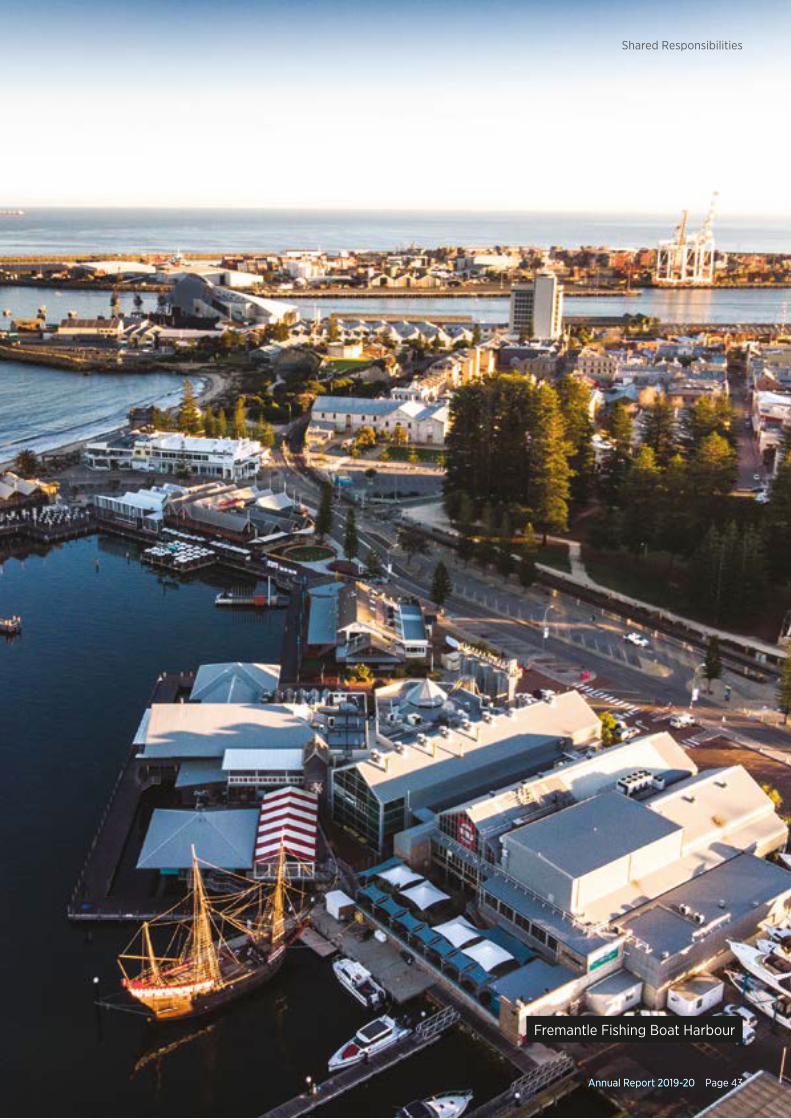
Fremantle Fishing Boat Harbour
Annual Report 2019-20 Page 43Annual Report 2019-20 Page 43
Shared Responsibilities

Page 44 Department of Transport

Agency Performance
Annual Report 2019-20 Page 45
Report on Operations
Delivering the State Government GoalsDoT is committed to enhancing WA’s social and economic prosperity through the delivery of our diverse services that connect people, products and places.
By enabling effective transport systems, services and policies, DoT plays a vital role in delivering on the following three State Government Goals:
Future jobs and skills
Grow and diversify the economy, create jobs and support skills development.
DoT supports this goal by delivering Outcome 1: integrated transport systems that facilitate economic development.
Strong communities
Safe communities and supported families.
DoT supports this goal by delivering Outcome 2: Vehicles and road users that meet established vehicle standards and driver competencies to deliver safe vehicles and safe drivers.
Better places
A quality environment with livable and affordable communities and vibrant regions.
DoT supports this goal by delivering Outcome 3: An accessible and safe transport system.
DoT’s three outcomes are achieved by delivering services, reform and legislation across the following five areas:
1. Strategic Transport Policy and Integrated Planning
2. Driver and Vehicle Services
3. Coastal Infrastructure
4. Marine Safety
5. On-demand Transport
This section of the report provides an overview of how DoT successfully delivered its outcomes and services during 2019-20 to contribute to the State Government’s Goals.
It also includes a summary of the results of our Key Performance Indicators (KPI) as well as information on the significant community and customer-focused programs that were undertaken or completed in 2019-20.
Page 46 Department of Transport
Agency Performance
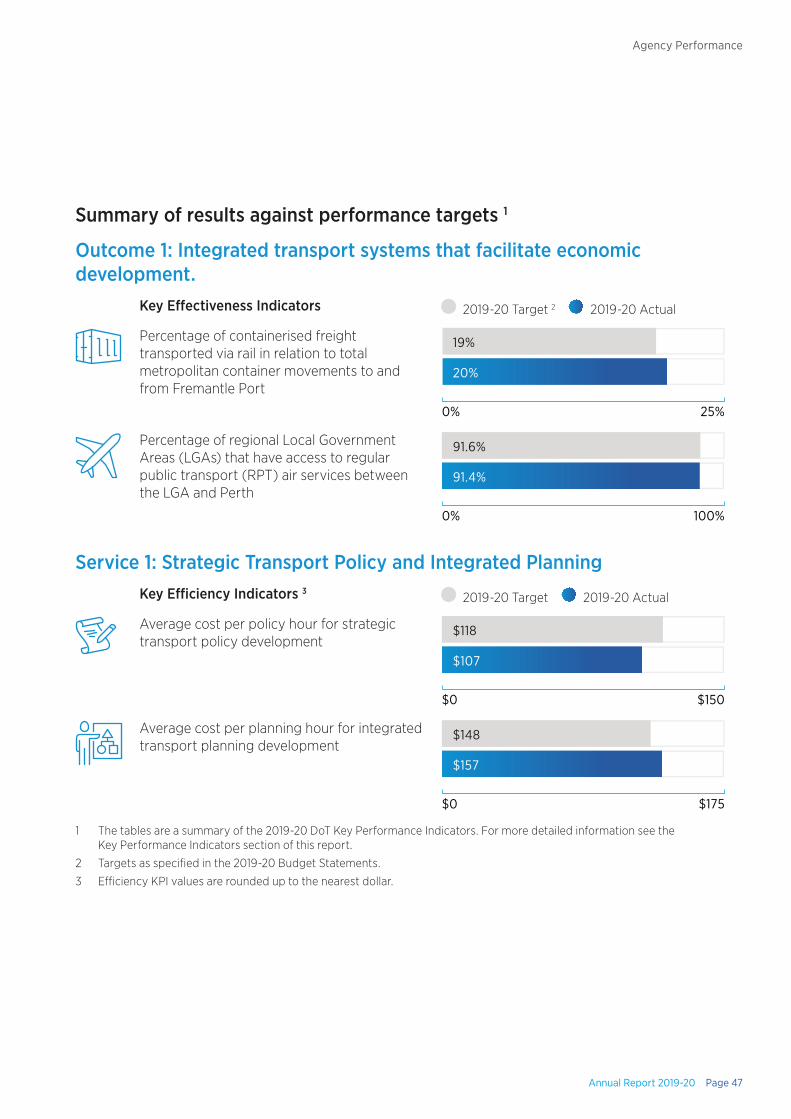
Summary of results against performance targets 1
Outcome 1: Integrated transport systems that facilitate economic development.
Key Effectiveness Indicators 2019-20 Target 2 2019-20 Actual
Percentage of containerised freight transported via rail in relation to total metropolitan container movements to and from Fremantle Port
19%
20%
0% 25%
Percentage of regional Local Government Areas (LGAs) that have access to regular public transport (RPT) air services between the LGA and Perth
91.6%
91.4%
0% 100%
Service 1: Strategic Transport Policy and Integrated PlanningKey Efficiency Indicators 3
2019-20 Target 2019-20 Actual
Average cost per policy hour for strategic transport policy development
$118
$107
$0 $150
Average cost per planning hour for integrated transport planning development
$148
$157
$0 $175
1 The tables are a summary of the 2019-20 DoT Key Performance Indicators. For more detailed information see the Key Performance Indicators section of this report.
2 Targets as specified in the 2019-20 Budget Statements.
3 Efficiency KPI values are rounded up to the nearest dollar.
Annual Report 2019-20 Page 47
Agency Performance
Active Transport and SafetyYour Move updates
Your Move Schools increases students’ active travel
The Your Move Schools program helps create healthier, safer primary and high school communities with less traffic and more people walking, riding, scooting and catching public transport to school. The program reduces local congestion and parking problems, improves local traffic management and supports healthy, active students who arrive at school alert and ready to learn.
The program continued to expand in 2019-20 with 137 schools now involved – an almost 50 per cent increase from 2018-19. More than 300 activities to promote walking, riding and public transport were completed, with 70 schools achieving bronze accreditation or above. 19 of these schools had achieved gold accreditation or better by December 2019. These accreditations resulted in $87,000 of Connecting Schools Grants being awarded to 24 schools in 2019-20, double the number of schools awarded in 2018-19.
DoT collaborated with the Departments of Education (DoE) and Finance (DoF) to devise a consistent approach to engaging with schools that have identified parking or traffic issues. DoF (under delegation) now include a condition within development approvals for metropolitan primary schools to become an active member in the Your Move program. This ensures a holistic approach to traffic and parking challenges at schools that considers travel behaviour change in addition to infrastructure solutions.
As part of the opening of Fremantle Railway Line Principal Shared Path (PSP) between Grant Street and Victoria Street Station, the Your Move Schools team recruited three new schools to the program and facilitated a Ride to School Day activation event. More than 30 students from North Cottesloe Primary School rode from their school along the PSP to the Sculptures by the Sea event at Cottesloe Beach.
In 2019-20, an independent analysis of travel survey data for schools from 2014-2018 demonstrated that, on average, participants in the Your Move Schools program achieved a 13 per cent increase in active travel to school.
In 2020-21, the program will seek to expand the reach of the program to more than 180 schools and deliver $100,000 in funding via the Connecting Schools Grants Program. The program also seeks to strengthen and expand collaboration with DoE and DoF to engage with greater numbers of schools via the Your Move condition in Development Application approvals. To further support this, the program will look to build and strengthen partnerships with local governments to provide enhanced support for active travel to school.
DoT is committed to enhancing WA’s social and economic prosperity through the delivery of our diverse services that connect people, products and places.
Page 48 Department of Transport
Agency Performance
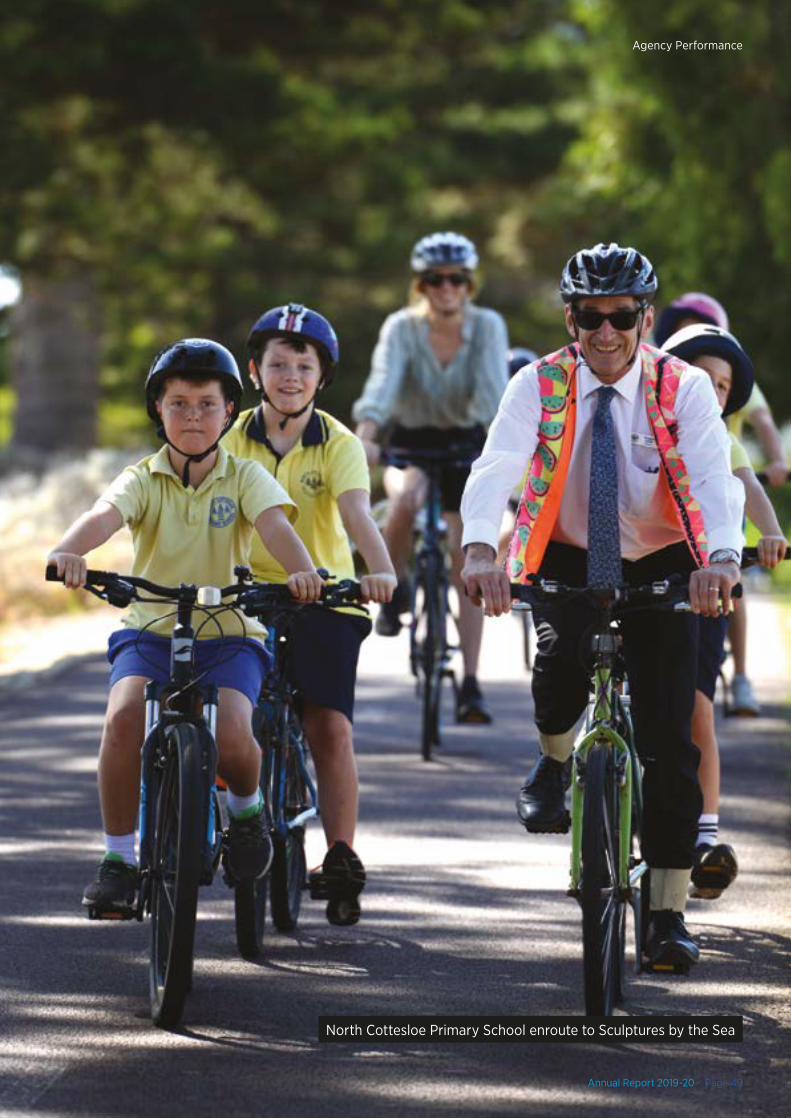
North Cottesloe Primary School enroute to Sculptures by the Sea
Annual Report 2019-20 Page 49
Agency Performance
Your Move Stirling ready to launch
After a successful project in Bassendean, the Your Move program will be delivered in partnership with the City of Stirling in key target areas across the City in 2020-21. Project planning and design was completed in 2019-20, with the objectives of increasing rail and bus patronage at Stirling and Glendalough stations; increasing walking and cycling trips to help activate the new PSP from Glendalough to Hutton Street, and reduce car trips for residents in the City of Stirling. Your Move Stirling was supposed to have launched in 2019-20 but was postponed due to COVID-19.
A $1.2 million service delivery contract was awarded to Your Move Stirling in February 2020. DoT formed a Community Partnership Group comprising 13 stakeholders from various State, local government and not-for profit agencies to support the delivery and post-project legacy in the City. Three large local employers – the City of Stirling, DoT Tassels Place and IKEA – have all signed up to encourage use of public transport, walking and riding to work.
Your Move also recruited 13 schools in the City of Stirling to encourage their students to walk and ride bikes and scooters to school. A two-day ‘student leadership laboratory’ event was conducted with student groups from these schools in October 2019 to develop leadership skills and encourage innovative active travel initiatives at their schools.
The City has committed $300,000 to the project to make improvements to key school routes, expand bike parking and install ground-based wayfinding across the City to link people with local destinations on foot or by bike. Some of the local infrastructure improvements have already been completed in 2019-20, including the installation of 62 bus information modules, two bike repair stations and bike parking at key locations.
Currently, 16,000 Stirling residents are being recruited for the personalised coaching and feedback service. These volunteers will also help to run activities with schools and workplaces, and complete small-scale local infrastructure improvements.
Your Move training forums
For those interested in the Your Move program, DoT hosts quarterly forums to provide training and networking for people interested in promoting active transport in their communities or workplaces. The forums share knowledge and experiences from participating organisations and feature experts with insights on changing travel behaviour.
In 2019-20, 150 people participated in four Your Move forums, which covered topics such as managing car parking, insights into how we travel, commuter life hacks and working from home.
There are now 82 organisations involved in the Your Move program, an increase from 79 organisations in 2018-19.
This $19 million PSP upgrade includes a bridge over Scarborough Beach Road and underpasses at the Hutton Street on- and off-ramps to provide a further 2.1 kilometres of continuous path for riders and walkers.
Page 50 Department of Transport
Agency Performance
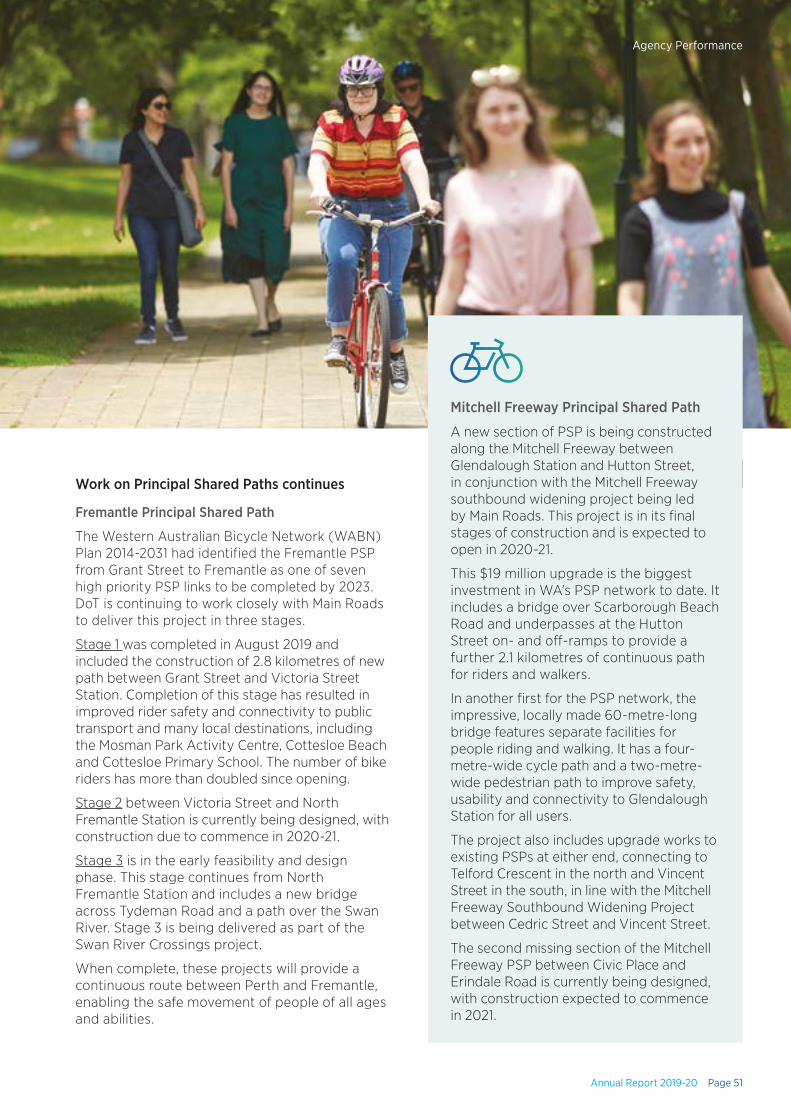
Image captionWork on Principal Shared Paths continues
Fremantle Principal Shared Path
The Western Australian Bicycle Network (WABN) Plan 2014-2031 had identified the Fremantle PSP from Grant Street to Fremantle as one of seven high priority PSP links to be completed by 2023. DoT is continuing to work closely with Main Roads to deliver this project in three stages.
Stage 1 was completed in August 2019 and included the construction of 2.8 kilometres of new path between Grant Street and Victoria Street Station. Completion of this stage has resulted in improved rider safety and connectivity to public transport and many local destinations, including the Mosman Park Activity Centre, Cottesloe Beach and Cottesloe Primary School. The number of bike riders has more than doubled since opening.
Stage 2 between Victoria Street and North Fremantle Station is currently being designed, with construction due to commence in 2020-21.
Stage 3 is in the early feasibility and design phase. This stage continues from North Fremantle Station and includes a new bridge across Tydeman Road and a path over the Swan River. Stage 3 is being delivered as part of the Swan River Crossings project.
When complete, these projects will provide a continuous route between Perth and Fremantle, enabling the safe movement of people of all ages and abilities.
Mitchell Freeway Principal Shared Path
A new section of PSP is being constructed along the Mitchell Freeway between Glendalough Station and Hutton Street, in conjunction with the Mitchell Freeway southbound widening project being led by Main Roads. This project is in its final stages of construction and is expected to open in 2020-21.
This $19 million upgrade is the biggest investment in WA’s PSP network to date. It includes a bridge over Scarborough Beach Road and underpasses at the Hutton Street on- and off-ramps to provide a further 2.1 kilometres of continuous path for riders and walkers.
In another first for the PSP network, the impressive, locally made 60-metre-long bridge features separate facilities for people riding and walking. It has a four-metre-wide cycle path and a two-metre-wide pedestrian path to improve safety, usability and connectivity to Glendalough Station for all users.
The project also includes upgrade works to existing PSPs at either end, connecting to Telford Crescent in the north and Vincent Street in the south, in line with the Mitchell Freeway Southbound Widening Project between Cedric Street and Vincent Street.
The second missing section of the Mitchell Freeway PSP between Civic Place and Erindale Road is currently being designed, with construction expected to commence in 2021.
Annual Report 2019-20 Page 51
Agency Performance
PSP Key Investment Projects, Safe Active Streets Pilot Program evaluations completed
Evaluation plans for the PSP Key Investment Projects and the Safe Active Streets (SAS) Pilot Program were completed in February 2020. Evaluation is critical to determine the impacts and outcomes of State Government investment, as well as establishing an evidence base for future investment decision-making.
The evaluation plans for these two projects were developed with input and oversight from project stakeholders at the Department of Treasury, Main Roads, the Road Safety Commission and the WA Bike Riding Reference Group (previously WA Cycling Strategies Implementation Reference Group), which includes representatives from across government and non-government agencies.
The development of these evaluation plans is in line with the State Government’s commitment to routinely undertake evaluations of innovative, complex or major projects to ensure public funds are being used efficiently and effectively to achieve outcomes. These evaluations also contribute to a growing body of evidence about the community and stakeholder benefits of active transport infrastructure projects, such as:
• PSP Key Investment Projects: the completion of a shared high-quality separated cycling network within 15 kilometres of the Perth CBD will provide safer and more efficient routes for people riding bikes, thereby increasing the number of bike riders on the network.
• SAS Pilot Program: road safety and community benefits warrant the implementation of a combination of reduced speeds and physically calmed local street infrastructure projects.
Some data collection and analysis on these projects has occurred in previous years, particularly SAS projects, to establish a baseline prior to construction. Pre- and post-construction survey data has also been collected for Stage 1 of the Fremantle PSP extension.
Most of the data collection and analysis for the PSP and SAS project evaluations was planned for early 2020; however, due to COVID-19 disruptions, data collection has been postponed until early 2021.
Page 52 Department of Transport
Agency Performance
Long-Term Cycle Network project
WA is a great place for riding a bike – warm weather, rolling landscape and natural beauty. However, concerns around safety, particularly when it comes to riding a bike on the road alongside speeding vehicles, may be preventing more people from taking up this habit.
The Long-Term Cycle Network (LTCN) project, which commenced in July 2018, aims to increase the number of people riding bikes for leisure and transport purposes by developing an aspirational blueprint for one continuous cycling infrastructure network for the metropolitan area. This connected network would reduce or eliminate the need for cyclists to ride on the road, thereby removing a significant safety concern. The vision is for a network of safe and attractive bicycle routes that:
• provide continuous routes along major corridors;
• establish links between activity centres and public transport services; and
• provide connections to schools, education sites and local centres.
The project was progressed in three stages:
• Stage 1 (complete): Project planning and initial engagement with LGAs.
• Stage 2 (complete): Detailed engagement with the LGAs and State agencies. Agreement of draft LTCN.
• Stage 3 (underway): Finalisation of the LTCN.
DoT has been working with the 33 local governments across the Perth and Peel regions towards the delivery of the LTCN. There is already a good level of existing bicycle infrastructure across these regions which can be improved by developing an integrated network. This connectivity between destinations makes bike riding a convenient and viable option for more people, of all ages and abilities.
DoT and local government partners have worked together to identify LTCN routes using a three-tier hierarchy of Primary Routes, Secondary Route and Local Routes.
The categorisation of routes has been based on the function of a given route within the network:
1. Primary routes
Primary routes are high demand corridors that connect to major destinations. They provide high-quality, safe, convenient (and, where possible, uninterrupted) routes that form the spine of the cycle network.
These routes are conducive to medium or long distance commuting, recreational, training and tourism trips.
2. Secondary routes
Secondary routes have a lower demand than primary routes, but provide similar levels of quality, safety and convenience.
These routes provide connections between primary routes and major activity centres such as shopping precincts, industrial areas or major health, education, sporting and civic facilities.
3. Local routes
Local routes are low demand and are predominantly located in local residential areas.
They provide access to higher order routes and local amenities and recreational spaces.
In Stage 2, DoT and the local governments agreed to an aspirational draft LTCN. The proposed network was then reviewed by the Main Roads, PTA and METRONET teams. This process ensured that the Portfolio agencies were aware of the proposed LTCN routes and could provide assistance in shaping the network in relation to their State-controlled assets.
Stage 3, which requires the proposed LTCN networks to be endorsed by each Council, is progressing well and nearing completion. Following endorsement, the bicycle networks will be consolidated and used for future planning purposes for both the State and local government authorities. The two-year LTCN project will conclude in 2020-21.
Annual Report 2019-20 Page 53
Agency Performance
AviationWA Aviation Strategy recommendations progressing
The State Government’s response to the 13 recommendations of the Final Report of the Parliamentary Inquiry into Regional Airfares in WA, was released in April 2018. These recommendations, which crossed a number of areas relating to air services in the State, were significantly progressed by DoT in 2019-20.
One of the key recommendations was to review and update the State Aviation Strategy to: deliver an enduring, whole-of-government approach to the implementation of State aviation policy; pursue improved outcomes for regional WA; and provide a framework for growth of WA’s aviation industry into the future.
An interdepartmental working group, the WA Regional Aviation Taskforce, was established and continued to oversee the review of the aviation strategy. Following extensive consultation undertaken by DoT with airlines, local governments, the mining industry, corporations and communities, the Minister for Transport released the draft WA Aviation Strategy 2020 for public comment on 10 February 2020.
The draft Strategy identified the State Government’s four key goals for aviation in WA, each with their own clear outcomes, approaches and actions:
1. Affordable Airfares;
2. Connected Communities;
3. Fit for Purpose Infrastructure; and
4. Informed and Future Ready.
The initial submission period was extended until late April 2020 to allow stakeholders additional time to submit their feedback following the disruptions caused by COVID-19. More than 400 stakeholders and residents completed a form on DoT’s MySayTransport website, with a further 29 submissions received from organisations and individuals. DoT is now reviewing this feedback.
The COVID-19 pandemic had a significant, and potentially lasting, impact on the aviation industry. The pandemic caused passenger demand on many WA regional routes to drop by up to 90 per cent from March to May 2020, rendering Regular Public Transport (RPT) air services commercially unviable.
In moving beyond the pandemic, a focus for regional aviation will be on increasing seat availability, as well as ensuring reasonable airfares on regional Regular Public Transport air services consistent with increasing demand.
The draft WA Aviation Strategy will be revised in 2020-21 to reflect stakeholder feedback and the impacts of the COVID-19 pandemic. Further work will be undertaken to finalise the document.
Regional communities received air services
Many WA regional communities benefitted from Regular Public Transport (RPT) air services being operated by several airlines on various routes throughout most of 2019-20. However, the onset of the COVID-19 pandemic in early 2020 had a severe adverse impact on the aviation industry, causing passenger demand to drop by up to 90 per cent on many regional routes. During this time, most resources companies stopped using RPT services on regional routes and moved their FIFO workforces onto closed charters to manage the risk of COVID-19 exposure.
Page 54 Department of Transport
Agency Performance
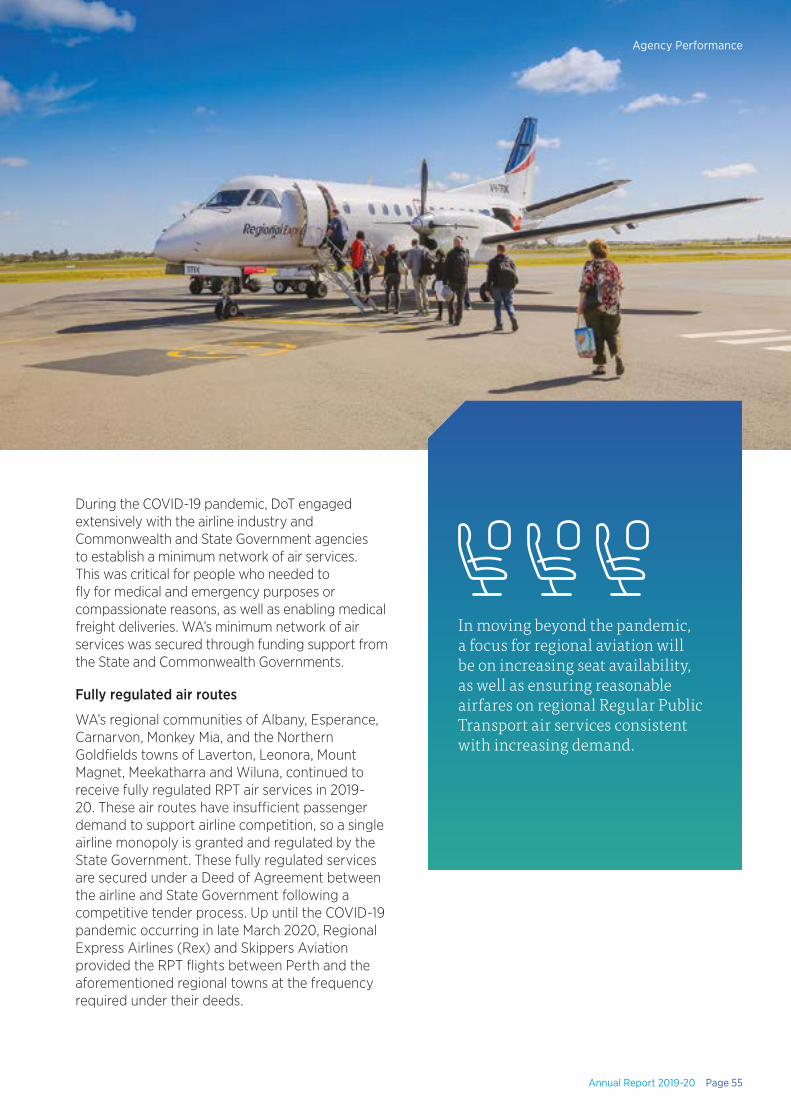
During the COVID-19 pandemic, DoT engaged extensively with the airline industry and Commonwealth and State Government agencies to establish a minimum network of air services. This was critical for people who needed to fly for medical and emergency purposes or compassionate reasons, as well as enabling medical freight deliveries. WA’s minimum network of air services was secured through funding support from the State and Commonwealth Governments.
Fully regulated air routes
WA’s regional communities of Albany, Esperance, Carnarvon, Monkey Mia, and the Northern Goldfields towns of Laverton, Leonora, Mount Magnet, Meekatharra and Wiluna, continued to receive fully regulated RPT air services in 2019-20. These air routes have insufficient passenger demand to support airline competition, so a single airline monopoly is granted and regulated by the State Government. These fully regulated services are secured under a Deed of Agreement between the airline and State Government following a competitive tender process. Up until the COVID-19 pandemic occurring in late March 2020, Regional Express Airlines (Rex) and Skippers Aviation provided the RPT flights between Perth and the aforementioned regional towns at the frequency required under their deeds.
In moving beyond the pandemic, a focus for regional aviation will be on increasing seat availability, as well as ensuring reasonable airfares on regional Regular Public Transport air services consistent with increasing demand.
Annual Report 2019-20 Page 55
Agency Performance
From early March 2020, the pandemic caused a significant reduction in demand on the regulated routes, resulting in a decreased level of RPT air services. This placed significant financial pressures on the airlines, which then reached out to the State Government for support. In late March 2020, following the State Government’s approval of up to $3 million in funding, DoT entered into an agreement with Rex to ensure a minimum network of air services remained operating on the Albany, Esperance, Carnarvon and Monkey Mia routes. In addition to the State’s funding, the RPT air services were underwritten by the Commonwealth Government for the duration of the COVID-19 pandemic. For the period April-June 2020, the Northern Goldfields routes secured two return RPT services per week, supported by the Commonwealth.
Throughout the financial year, regional travellers for Albany, Esperance, Carnarvon, Monkey Mia and the Northern Goldfields continued to benefit from the discounted Community Airfares offered by Rex, and Resident Airfares offered by Skippers Aviation.
Lightly regulated air routes
After DoT facilitated well-attended regional workshops last financial year for some previously unregulated RPT air routes, the airlines responded to community concerns over the price of airfares in 2019-20. Qantas enhanced its Discounted Fares for Residents Program by placing a cap on ticket prices for most of its regional WA air routes, which provided a level of certainty to regional residents about the affordability of their airfares, especially for travel at short notice. Virgin Australia also introduced special pricing on some of its low-demand flights.
To support ongoing engagement and the State Government’s ability to monitor market conditions, DoT introduced additional aircraft licensing conditions from 1 July 2019.
These conditions require the airlines now operating on previously unregulated routes to provide data to the State Government, and to engage with regional communities and stakeholders on a regular basis.
The COVID-19 pandemic placed significant financial pressure on airlines. With a dramatic drop in demand for RPT air services from March through to June 2020, airlines were not able to operate their services on a commercial basis during this time. With support from the Commonwealth Government to maintain at least two return RPT air services per week per airline on each regional route, WA regional communities continued to have access to vital air services throughout the pandemic.
Regional airport infrastructure improved
DoT’s roll out of the Regional Airports Development Scheme (RADS) in 2019-20 continued to improve air services, airport infrastructure and safety across regional WA.
The scheme provided financial assistance for infrastructure projects to eligible owners or leaseholders of publicly accessible regional airports.
A total of 14 RADS projects, with a combined grant value of almost $1.2 million and combined project value of almost $2 million, were completed throughout 2019-20.
Funded projects included the development of runways and patient transfer facilities, improving airport facilities and grounds, and the completion of planning studies.
The Shire of Derby/West Kimberley received $130,000 in RADS funds to upgrade the perimeter fencing to chainmesh at Fitzroy Crossing Airport. These works, at a total project value of $318,000, will improve the safety of the airport’s operations by decreasing the risk of animals on the airstrip.
Page 56 Department of Transport
Agency Performance
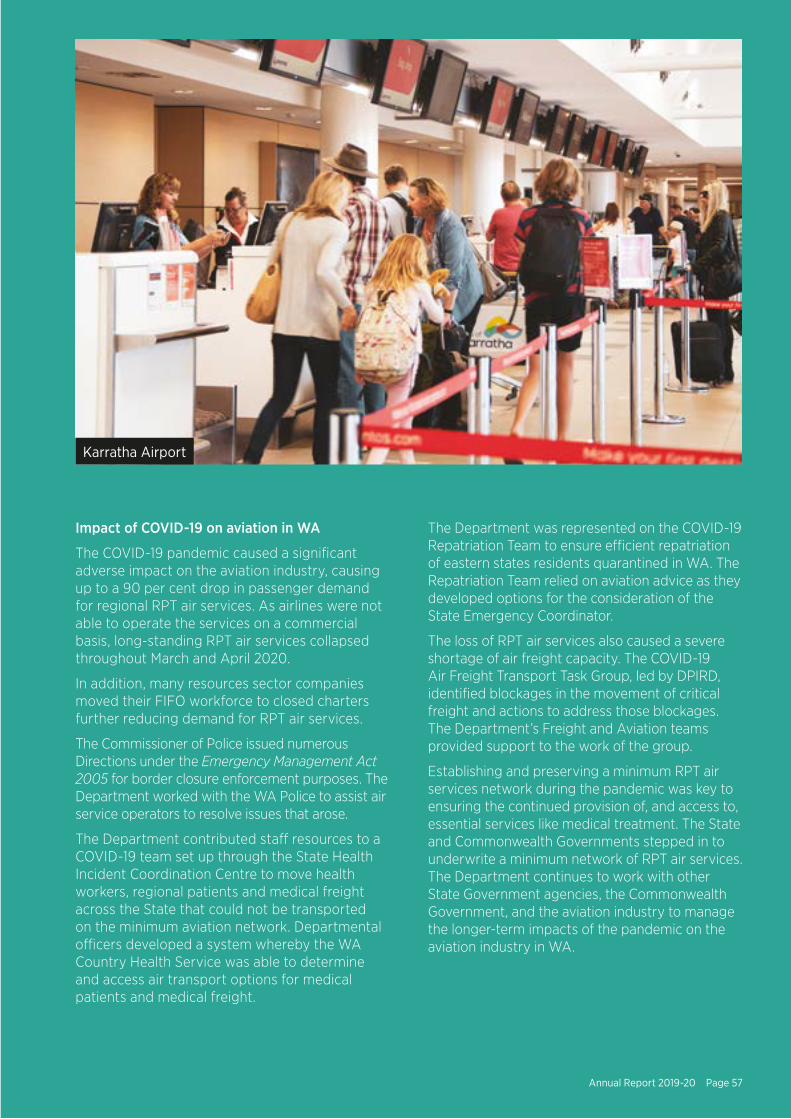
Impact of COVID-19 on aviation in WA
The COVID-19 pandemic caused a significant adverse impact on the aviation industry, causing up to a 90 per cent drop in passenger demand for regional RPT air services. As airlines were not able to operate the services on a commercial basis, long-standing RPT air services collapsed throughout March and April 2020.
In addition, many resources sector companies moved their FIFO workforce to closed charters further reducing demand for RPT air services.
The Commissioner of Police issued numerous Directions under the Emergency Management Act 2005 for border closure enforcement purposes. The Department worked with the WA Police to assist air service operators to resolve issues that arose.
The Department contributed staff resources to a COVID-19 team set up through the State Health Incident Coordination Centre to move health workers, regional patients and medical freight across the State that could not be transported on the minimum aviation network. Departmental officers developed a system whereby the WA Country Health Service was able to determine and access air transport options for medical patients and medical freight.
The Department was represented on the COVID-19 Repatriation Team to ensure efficient repatriation of eastern states residents quarantined in WA. The Repatriation Team relied on aviation advice as they developed options for the consideration of the State Emergency Coordinator.
The loss of RPT air services also caused a severe shortage of air freight capacity. The COVID-19 Air Freight Transport Task Group, led by DPIRD, identified blockages in the movement of critical freight and actions to address those blockages. The Department’s Freight and Aviation teams provided support to the work of the group.
Establishing and preserving a minimum RPT air services network during the pandemic was key to ensuring the continued provision of, and access to, essential services like medical treatment. The State and Commonwealth Governments stepped in to underwrite a minimum network of RPT air services. The Department continues to work with other State Government agencies, the Commonwealth Government, and the aviation industry to manage the longer-term impacts of the pandemic on the aviation industry in WA.
Karratha Airport
Annual Report 2019-20 Page 57
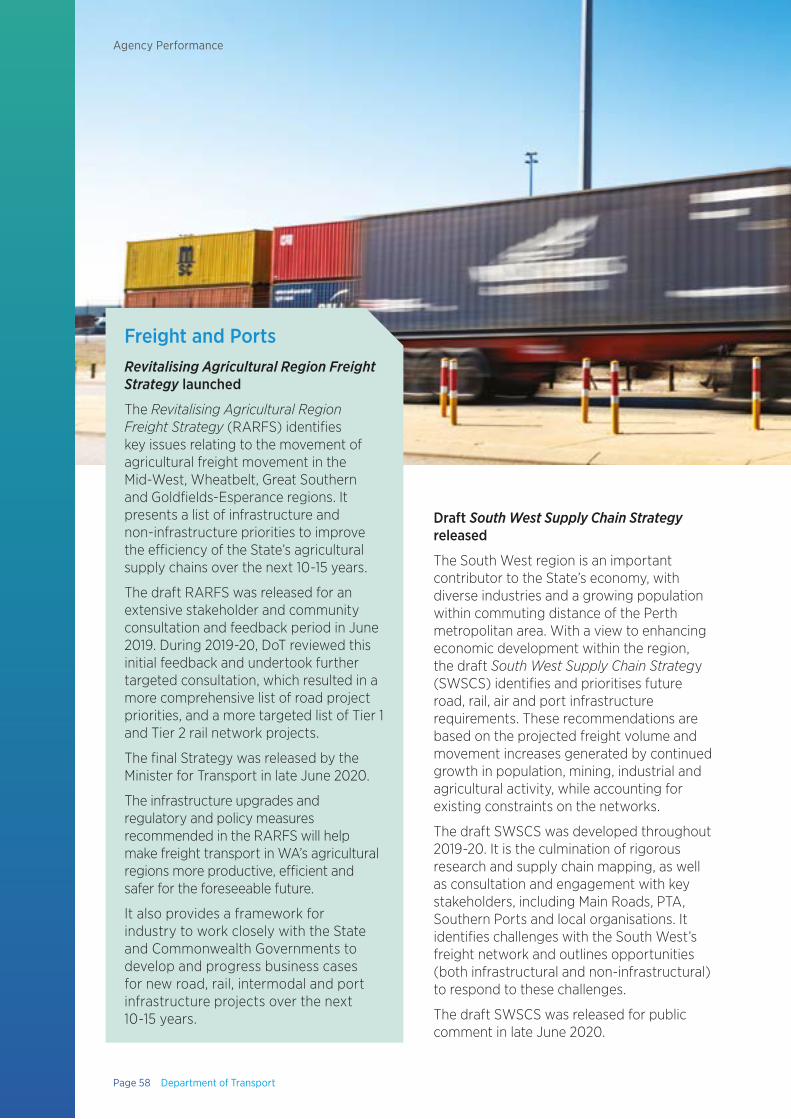
Draft South West Supply Chain Strategy released
The South West region is an important contributor to the State’s economy, with diverse industries and a growing population within commuting distance of the Perth metropolitan area. With a view to enhancing economic development within the region, the draft South West Supply Chain Strategy (SWSCS) identifies and prioritises future road, rail, air and port infrastructure requirements. These recommendations are based on the projected freight volume and movement increases generated by continued growth in population, mining, industrial and agricultural activity, while accounting for existing constraints on the networks.
The draft SWSCS was developed throughout 2019-20. It is the culmination of rigorous research and supply chain mapping, as well as consultation and engagement with key stakeholders, including Main Roads, PTA, Southern Ports and local organisations. It identifies challenges with the South West’s freight network and outlines opportunities (both infrastructural and non-infrastructural) to respond to these challenges.
The draft SWSCS was released for public comment in late June 2020.
Freight and PortsRevitalising Agricultural Region Freight Strategy launched
The Revitalising Agricultural Region Freight Strategy (RARFS) identifies key issues relating to the movement of agricultural freight movement in the Mid-West, Wheatbelt, Great Southern and Goldfields-Esperance regions. It presents a list of infrastructure and non-infrastructure priorities to improve the efficiency of the State’s agricultural supply chains over the next 10-15 years.
The draft RARFS was released for an extensive stakeholder and community consultation and feedback period in June 2019. During 2019-20, DoT reviewed this initial feedback and undertook further targeted consultation, which resulted in a more comprehensive list of road project priorities, and a more targeted list of Tier 1 and Tier 2 rail network projects.
The final Strategy was released by the Minister for Transport in late June 2020.
The infrastructure upgrades and regulatory and policy measures recommended in the RARFS will help make freight transport in WA’s agricultural regions more productive, efficient and safer for the foreseeable future.
It also provides a framework for industry to work closely with the State and Commonwealth Governments to develop and progress business cases for new road, rail, intermodal and port infrastructure projects over the next 10-15 years.
Page 58 Department of Transport
Agency Performance
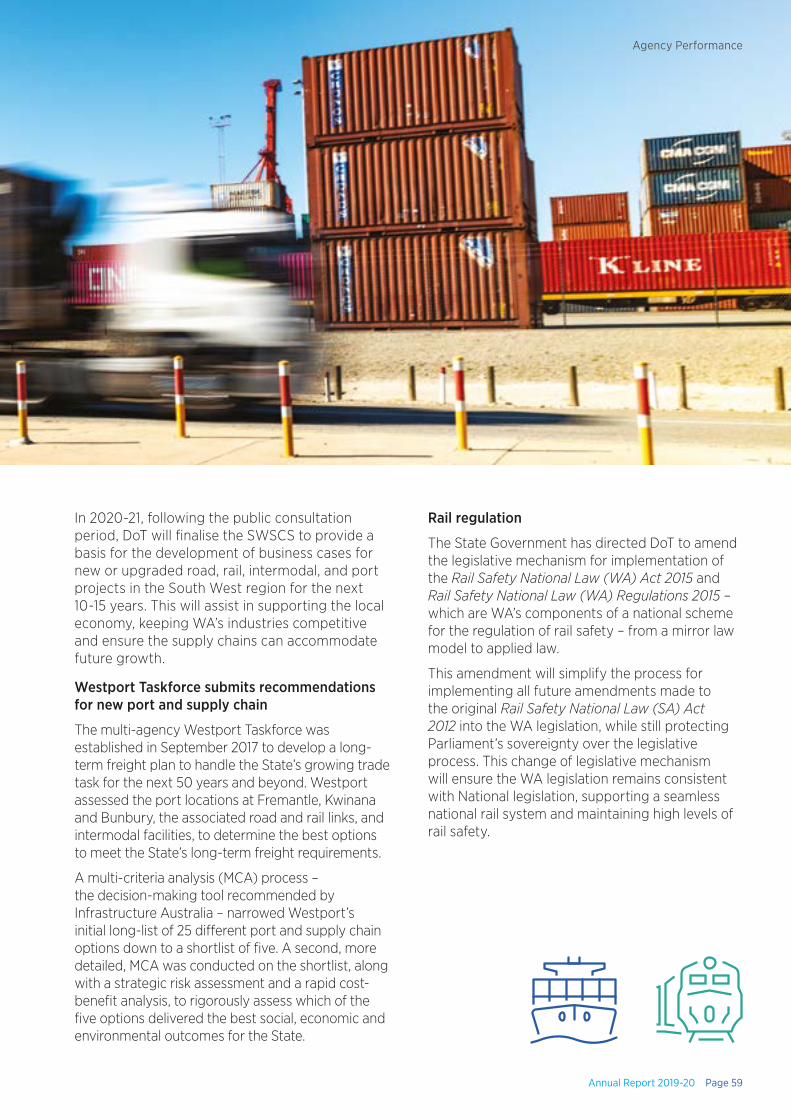
Fremantle Port
In 2020-21, following the public consultation period, DoT will finalise the SWSCS to provide a basis for the development of business cases for new or upgraded road, rail, intermodal, and port projects in the South West region for the next 10-15 years. This will assist in supporting the local economy, keeping WA’s industries competitive and ensure the supply chains can accommodate future growth.
Westport Taskforce submits recommendations for new port and supply chain
The multi-agency Westport Taskforce was established in September 2017 to develop a long-term freight plan to handle the State’s growing trade task for the next 50 years and beyond. Westport assessed the port locations at Fremantle, Kwinana and Bunbury, the associated road and rail links, and intermodal facilities, to determine the best options to meet the State’s long-term freight requirements.
A multi-criteria analysis (MCA) process – the decision-making tool recommended by Infrastructure Australia – narrowed Westport’s initial long-list of 25 different port and supply chain options down to a shortlist of five. A second, more detailed, MCA was conducted on the shortlist, along with a strategic risk assessment and a rapid cost-benefit analysis, to rigorously assess which of the five options delivered the best social, economic and environmental outcomes for the State.
Rail regulation
The State Government has directed DoT to amend the legislative mechanism for implementation of the Rail Safety National Law (WA) Act 2015 and Rail Safety National Law (WA) Regulations 2015 – which are WA’s components of a national scheme for the regulation of rail safety – from a mirror law model to applied law.
This amendment will simplify the process for implementing all future amendments made to the original Rail Safety National Law (SA) Act 2012 into the WA legislation, while still protecting Parliament’s sovereignty over the legislative process. This change of legislative mechanism will ensure the WA legislation remains consistent with National legislation, supporting a seamless national rail system and maintaining high levels of rail safety.
Annual Report 2019-20 Page 59
Agency Performance

Image caption
Page 60 Department of Transport
Agency Performance
Future Transport PlanningPerth Greater CBD Transport Plan
DoT has been collaborating with the City of Perth since October 2018 to deliver the Greater Perth CBD Transport Plan. This plan, informed by extensive stakeholder consultation and more than 1,000 responses from the community, will establish a 10-year vision for transport investment in the Perth CBD, including a five-year program of agreed priority transport initiatives. This will result in improved operations and customer experiences of the Perth CBD transport network.
The development of the Perth Greater CBD Transport Plan is being progressed and delivered in two phases:
• Phase One: A list of agreed priority transport initiatives that fall within the Perth Parking Management Area (PPMA) will be delivered by July 2020. A Memorandum of Understanding will be developed between DoT and the City of Perth to determine the agreed list and intent on implementing these projects.
• Phase Two: The final Perth Greater CBD Transport Plan is expected to be delivered by December 2020. It will integrate the Phase One initiatives into an expanded 10-year vision for the city centre and include initiatives that fall outside of the PPMA (such as the QEII medical precinct and The University of Western Australia), as well as less urgent projects that fall into the 5-10-year horizon.
The draft Phase One plan is progressing well. Once complete, it will be submitted to the City of Perth and the Minister for Transport for endorsement. DoT and the City of Perth have already agreed on a list of priority initiatives and are in the process of developing a Memorandum of Understanding between the two agencies.
Automated vehicle reform
The introduction of automated vehicles (AVs) – sometimes referred to as autonomous or driverless vehicles – is supported by DoT as possible way of enhancing safety, livability and prosperity outcomes for all Western Australians. The eventual introduction of AVs may improve road safety, reduce urban congestion, increase transport efficiency, and deliver greater mobility and transport options for the community.
In 2019-20, DoT, with guidance from the Connected and Automated Vehicle Advisory Committee (CAVAC), continued to coordinate work across government to develop the policy settings for integrating AVs into existing transport systems. CAVAC is also working to facilitate trials in WA and influence a consistent national policy.
At a national level, agreement has been achieved on developing a Safety Assurance System, with a Statement of Compliance to be provided when vehicles are first supplied. An Automated Vehicle National Law is also being formulated, with a view to establishing a National Automated Vehicle Regulator.
In 2019-20, DoT approved the first regional trial of the automated RAC Intellibus® – which has been operating along the South Perth Esplanade since August 2016 – in Busselton, in WA’s South West region. DoT also worked with The University of Western Australia (UWA) to enable a short AV on-road trial within their Nedlands campus.
DoT has participated in AV research with UWA, the George Institute, and the Planning and Transport Research Centre, focusing on understanding potential uptake and impact of AVs on the community. The Department will continue to work with trial proponents throughout 2020-21, with a targeted focus on reaching regional locations and increasing mobility for older Western Australians.
Also in 2020-21, DoT will work with the Commonwealth, the National Transport Commission and State and Territory Government agencies to further define the function and powers of National Automated Vehicle Regulator and the development of the Automated Vehicle Safety Law.
Annual Report 2019-20 Page 61
Agency Performance
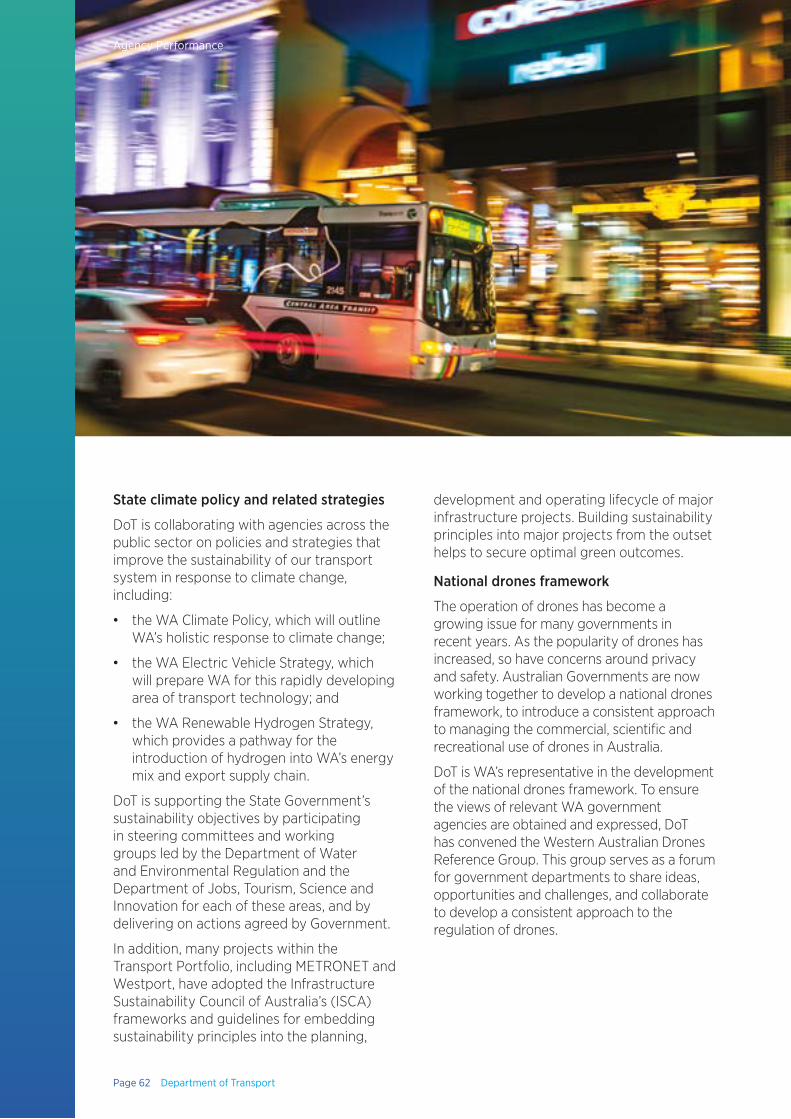
State climate policy and related strategies
DoT is collaborating with agencies across the public sector on policies and strategies that improve the sustainability of our transport system in response to climate change, including:
• the WA Climate Policy, which will outline WA’s holistic response to climate change;
• the WA Electric Vehicle Strategy, which will prepare WA for this rapidly developing area of transport technology; and
• the WA Renewable Hydrogen Strategy, which provides a pathway for the introduction of hydrogen into WA’s energy mix and export supply chain.
DoT is supporting the State Government’s sustainability objectives by participating in steering committees and working groups led by the Department of Water and Environmental Regulation and the Department of Jobs, Tourism, Science and Innovation for each of these areas, and by delivering on actions agreed by Government.
In addition, many projects within the Transport Portfolio, including METRONET and Westport, have adopted the Infrastructure Sustainability Council of Australia’s (ISCA) frameworks and guidelines for embedding sustainability principles into the planning,
development and operating lifecycle of major infrastructure projects. Building sustainability principles into major projects from the outset helps to secure optimal green outcomes.
National drones framework
The operation of drones has become a growing issue for many governments in recent years. As the popularity of drones has increased, so have concerns around privacy and safety. Australian Governments are now working together to develop a national drones framework, to introduce a consistent approach to managing the commercial, scientific and recreational use of drones in Australia.
DoT is WA’s representative in the development of the national drones framework. To ensure the views of relevant WA government agencies are obtained and expressed, DoT has convened the Western Australian Drones Reference Group. This group serves as a forum for government departments to share ideas, opportunities and challenges, and collaborate to develop a consistent approach to the regulation of drones.
Page 62 Department of Transport
Agency Performance
METRONETMETRONET continues to power ahead
The METRONET planning team has continued to set millions of dollars of important infrastructure projects in the right direction throughout 2019-20.
Among these is the long-awaited Morley-Ellenbrook Line, a 21-kilometre stretch of rail line that addresses a public transport service gap for Perth’s north-eastern suburbs. Once completed, the Morley-Ellenbrook Line will importantly give those living and working in this area a new transport choice.
In 2019-20, not only was the planning of the Morley-Ellenbrook Line completed with an endorsed project definition plan released on 9 June 2020 but, on 7 April 2020, Infrastructure Australia (IA) added the project to its Infrastructure Priority List.
IA, the independent body providing advice to government on infrastructure projects, recognised that the Morley-Ellenbrook Line will improve integrated transport options for Perth’s north-eastern suburbs, reduce car dependency and improve liveability by encouraging development around stations and improving access to jobs. IA commented that, in addressing the assessment criteria, it was evident the METRONET office had undertaken a comprehensive options development and assessment process.
Detailed planning continued for the remaining METRONET projects still in planning with:
• the business cases completed for Midland, Lakelands and Karnup Stations, allowing concept design work to progress;
• the preferred solutions for the inner Armadale Line level crossing removal identified, which would see up to six crossings removed along this rail line with concept design work now underway; and
• Byford Rail Extension options analysis reaching its final stages of review. METRONET is seeking to identify the best way for this project to support plans for growth in the area, as well as creating an employment hub and boosting residential development.
In 2020-21, planning for these projects will be completed, allowing them to go to market. This pipeline of METRONET contracts, jobs and investment is critical to supporting WA’s post-pandemic economic recovery effort.
While many of METRONET’s projects move to other Transport Portfolio or State agencies for their final design and construction, the METRONET Office will continue to play a key coordination, oversight and governance role to ensure the project meets the State Government’s priorities.
The Morley-Ellenbrook Line is a 21-kilometre stretch of rail line that addresses a public transport service gap for Perth’s north-eastern suburbs. Once completed, the Morley-Ellenbrook Line will importantly give those living and working in this area a new transport choice.
Annual Report 2019-20 Page 63
Agency Performance

TransportHack demonstrated the importance of government data sharing and making data accessible to support emerging technologies and start-ups in the transport sector. This type of collaboration is win-win, enabling the Transport Portfolio to identify solutions to major challenges while assisting start-ups to refine their products. Following the success of the inaugural TransportHack, it is envisaged that similar events will be run in future years.
TransportHack event
TransportHack event
Portfolio CollaborationTransport Portfolio’s first hackathon
The Transport Portfolio conducted its first industry hackathon, TransportHack, in partnership with the Ministry of Data on Friday, 18 October 2019. The two-day hackathon created a unique opportunity to harness varied skillsets and perspectives from across government, industry and the start-up community to design tools and applications that would deliver positive transport outcomes for Perth travellers. The event attracted 70 innovators, 12 teams, 16 mentors and one State Minister.
Participants worked together on WA transport challenges, using a diverse range of datasets and information to build prototypes, which were then presented to a panel of judges from across the sector. Four prizes with a total value $8,000 were awarded to the winning teams. The first prize of $4,000 was awarded to a group of software developers named Rage Reduction Systems. Their prototype application, Smartparker Bay Finder, was designed to monitor and predict the availability of parking bays at Transperth train stations. Using real-time data and a predictive machine learning algorithm, the application was accurate to within three bays. Winning teams were invited to participate in further discussions with relevant government stakeholders to enhance their prototypes.
Page 64 Department of Transport
Agency Performance
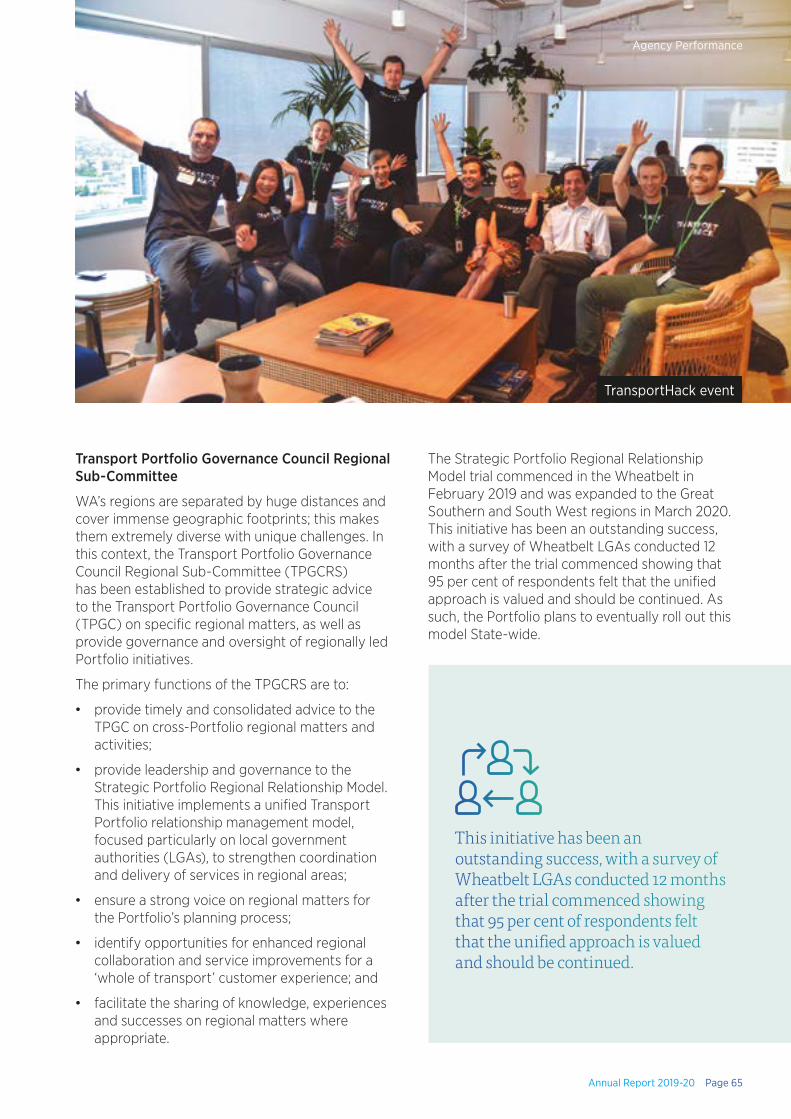
Transport Portfolio Governance Council Regional Sub-Committee
WA’s regions are separated by huge distances and cover immense geographic footprints; this makes them extremely diverse with unique challenges. In this context, the Transport Portfolio Governance Council Regional Sub-Committee (TPGCRS) has been established to provide strategic advice to the Transport Portfolio Governance Council (TPGC) on specific regional matters, as well as provide governance and oversight of regionally led Portfolio initiatives.
The primary functions of the TPGCRS are to:
• provide timely and consolidated advice to the TPGC on cross-Portfolio regional matters and activities;
• provide leadership and governance to the Strategic Portfolio Regional Relationship Model. This initiative implements a unified Transport Portfolio relationship management model, focused particularly on local government authorities (LGAs), to strengthen coordination and delivery of services in regional areas;
• ensure a strong voice on regional matters for the Portfolio’s planning process;
• identify opportunities for enhanced regional collaboration and service improvements for a ‘whole of transport’ customer experience; and
• facilitate the sharing of knowledge, experiences and successes on regional matters where appropriate.
TransportHack event
The Strategic Portfolio Regional Relationship Model trial commenced in the Wheatbelt in February 2019 and was expanded to the Great Southern and South West regions in March 2020. This initiative has been an outstanding success, with a survey of Wheatbelt LGAs conducted 12 months after the trial commenced showing that 95 per cent of respondents felt that the unified approach is valued and should be continued. As such, the Portfolio plans to eventually roll out this model State-wide.
This initiative has been an outstanding success, with a survey of Wheatbelt LGAs conducted 12 months after the trial commenced showing that 95 per cent of respondents felt that the unified approach is valued and should be continued.
Annual Report 2019-20 Page 65
Agency Performance
Page 66 Department of Transport
Agency Performance
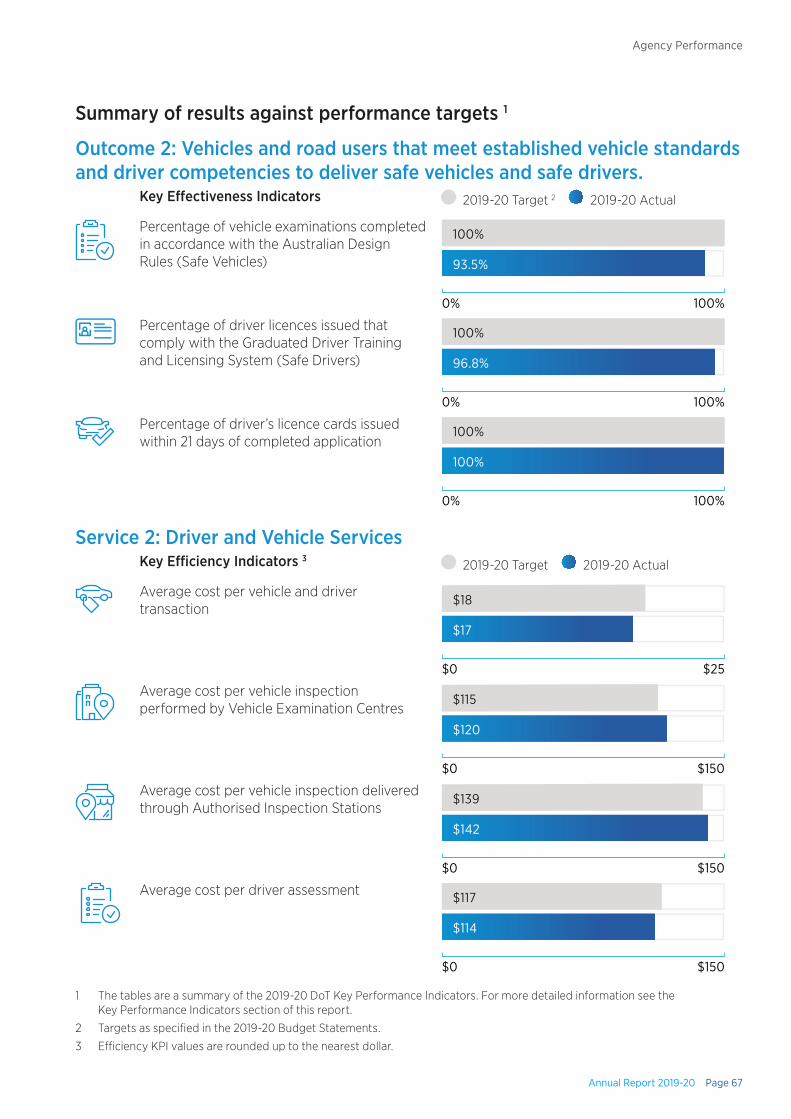
Summary of results against performance targets 1
Outcome 2: Vehicles and road users that meet established vehicle standards and driver competencies to deliver safe vehicles and safe drivers.
Key Effectiveness Indicators 2019-20 Target 2 2019-20 Actual
Percentage of vehicle examinations completed in accordance with the Australian Design Rules (Safe Vehicles)
100%
93.5%
0% 100%
Percentage of driver licences issued that comply with the Graduated Driver Training and Licensing System (Safe Drivers)
100%
96.8%
0% 100%
Percentage of driver’s licence cards issued within 21 days of completed application
100%
100%
0% 100%
1 The tables are a summary of the 2019-20 DoT Key Performance Indicators. For more detailed information see the Key Performance Indicators section of this report.
2 Targets as specified in the 2019-20 Budget Statements.
3 Efficiency KPI values are rounded up to the nearest dollar.
Service 2: Driver and Vehicle ServicesKey Efficiency Indicators 3
2019-20 Target 2019-20 Actual
Average cost per vehicle and driver transaction
$18
$17
$0 $25
Average cost per vehicle inspection performed by Vehicle Examination Centres
$115
$120
$0 $150
Average cost per vehicle inspection delivered through Authorised Inspection Stations
$139
$142
$0 $150
Average cost per driver assessment $117
$114
$0 $150
Annual Report 2019-20 Page 67
Agency Performance
Metropolitan PDA post-COVID-19 recovery plan
Due to the threat to employee and community safety created by the COVID-19 pandemic, DoT suspended its C Class Practical Driving Assessments (PDA) for non-essential reasons between March and May 2020. Approximately 6,500 customers in the Perth metropolitan area had their PDA bookings deferred. A further 35,000 bookings for PDAs that would have normally occurred between March and May 2020 were not made available to the public. This created a substantial backlog and caused frustration for DoT’s customers.
Once the State Government began easing the COVID-19 restrictions in mid-May 2020, the DVS Service Delivery team, with support from across the agency, commenced the Metropolitan PDA Recovery project. This included prioritising the rebooking of cancelled PDAs and recommissioning the closed DoT Welshpool office as a temporary ‘PDA-only’ site for six months. The recommissioned site operations commenced on Monday, 22 June 2020, opening Monday to Sunday from 7.00am to 6.00pm. DoT also created 45 temporary positions to support the PDA and economic recovery for WA.
The efforts of the DoT team enabled all suspended PDAs to be rebooked by early June 2020, with the backlog of 35,000 outstanding PDAs scheduled to be cleared before November 2020.
Digital billing introduced for DoTDirect customers
DoT was delighted to introduce digital billing for DoTDirect customers in September 2019. This initiative has provided customers with the choice to receive their invoices and receipts by electronic means, which is more convenient for customers as well as being more environmentally friendly and cost efficient. A steady growth in the uptake of email billing and BPAY View delivery has
significantly reduced postage costs, and aligns with the Government strategy to reduce the current issue of nine million paper-based renewals, invoices, notices and letters sent by DoT annually.
In addition to email and BPAY View delivery of invoices, DoT customers can now access and download previously paid invoices, various notices and infringements through their DoTDirect account.
DoT is committed to providing greater customer access to all our licensing services and we have actively responded to our customers’ expectations for greater online service delivery. Through the introduction of digital billing, we have improved DoT’s level of service, customer experience and satisfaction. Further enhancements, including the expansion on the range of bills and correspondence that can be electronically delivered, are now being planned.
New Towards Zero State Road Safety Strategy
The Towards Zero State Road Safety Strategy has been in operation since 2008 and expires in 2020. The strategy’s long-term vision is for zero road deaths or serious injuries in WA. With this overarching vision, the strategy set a target range of reducing serious injuries and deaths resulting from road trauma by 50 to 70 per cent. The minimum target range is consistent with what is expected to be the national target in a new National Road Safety Strategy, expected to be published in 2020-21. Achievement of the minimum target range will result in approximately 6,500 deaths and serious injuries being avoided in WA between 2020 and 2030.
As members of the Road Safety Council, DoT have been working with other Council members to develop the next Road Safety Strategy for WA. The proposed new strategy approach has been endorsed by the Council for presentation to the Minister for Road Safety for consideration.
Page 68 Department of Transport
Agency Performance

Transport Portfolio Contact Centre and Knowledge Management System
DVS is seeking to provide a flexible, scalable and reliable Knowledge Management System (KMS) across its multiple physical sites and agents. This would streamline and ensure consistency across DVS’s information and records-keeping systems.
In December 2019, DoT commenced the procurement process of a Contact Centre Managed Service with a KMS. In April 2020, a Request for Quotation (RFQ) was advertised as a restricted tender to GovNext prime contractors. The tender period closed in early June 2020 and submissions received are currently being evaluated.
The new platforms will be deployed across both DoT and Main Roads contact centres in the first instance, and allow for further deployments across other agencies. The system will be Cloud-based, allowing for flexibility in service operations and deployment of software to scale up for emergency situations.
Procurement is expected to be finalised later in 2020, with transition and implementation following soon thereafter.
New PlatesWA website launched
Driving is a significant part of the WA lifestyle, and many people opt to customise their vehicles with personalised (optional) number plates. More than 15,000 optional number plates are sold under DoT’s PlatesWA scheme annually. The revenue from optional plates sales is shared between DoT and WA Police to offset operational costs and fund community policing initiatives.
With most optional plates sales occurring through the DoT website, DVS looked to simplify the online purchasing process to improve the customer experience as well as increase plates sales by upgrading the website. For a streamlined customer experience, the new PlatesWA website had to be easy to navigate and showcase the wide range of number plates available.
DoT partnered with an external provider to redesign the PlatesWA website. Through an extensive design process, a new online ‘shop’ presence was developed, providing optional plate customers with a fresher, more visually appealing approach. The new PlatesWA website was launched in September 2019.
Now on www.plateswa.com.au, customers can see their number plate designs visually to get an idea of what the finished product will look like based on the characters or words they enter. A suite of new images set in iconic WA locations featured on the new website further highlight the customisation PlatesWA can offer our driving community.
In conjunction with a range of complementary initiatives, the new PlatesWA website has supported a dramatic 20 per cent increase in optional plate sales revenue for 2019-20. Further enhancements are planned to continue improving the online optional plate sales journey for customers.
Annual Report 2019-20 Page 69
Agency Performance
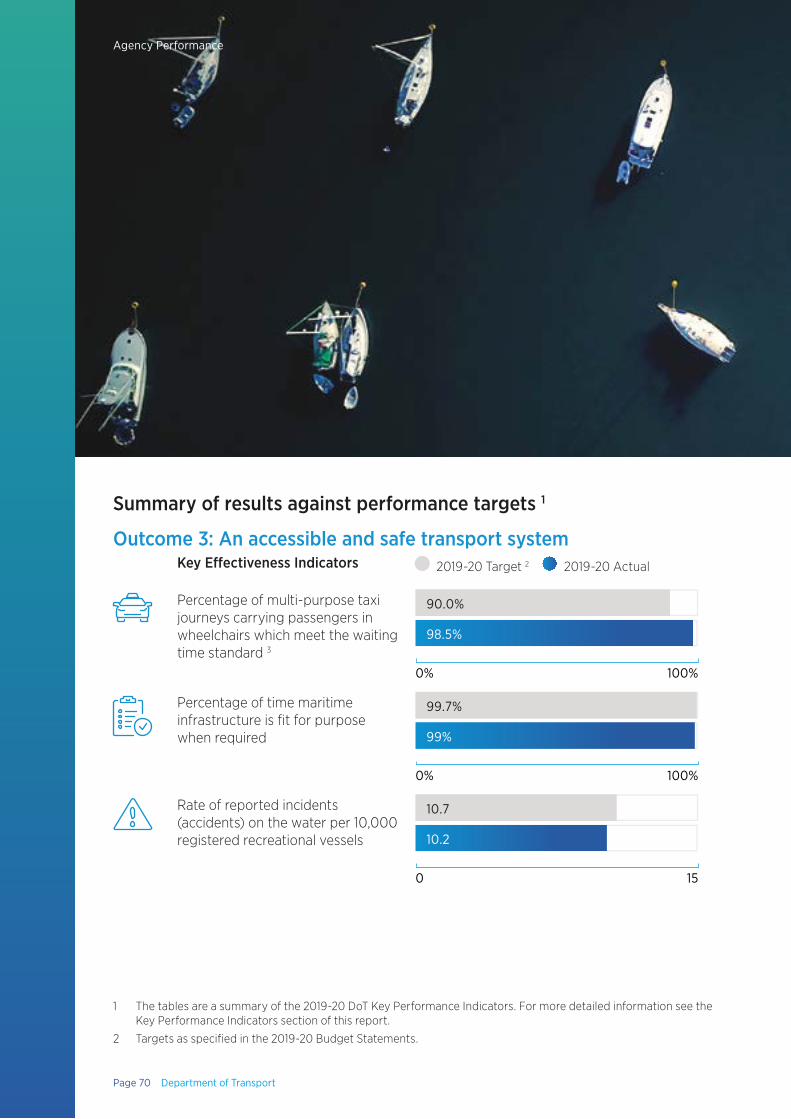
Summary of results against performance targets 1
Outcome 3: An accessible and safe transport systemKey Effectiveness Indicators 2019-20 Target 2 2019-20 Actual
Percentage of multi-purpose taxi journeys carrying passengers in wheelchairs which meet the waiting time standard 3
90.0%
98.5%
0% 100%
Percentage of time maritime infrastructure is fit for purpose when required
99.7%
99%
0% 100%
Rate of reported incidents (accidents) on the water per 10,000 registered recreational vessels
10.7
10.2
0 15
1 The tables are a summary of the 2019-20 DoT Key Performance Indicators. For more detailed information see the Key Performance Indicators section of this report.
2 Targets as specified in the 2019-20 Budget Statements.
Page 70 Department of Transport
Agency Performance
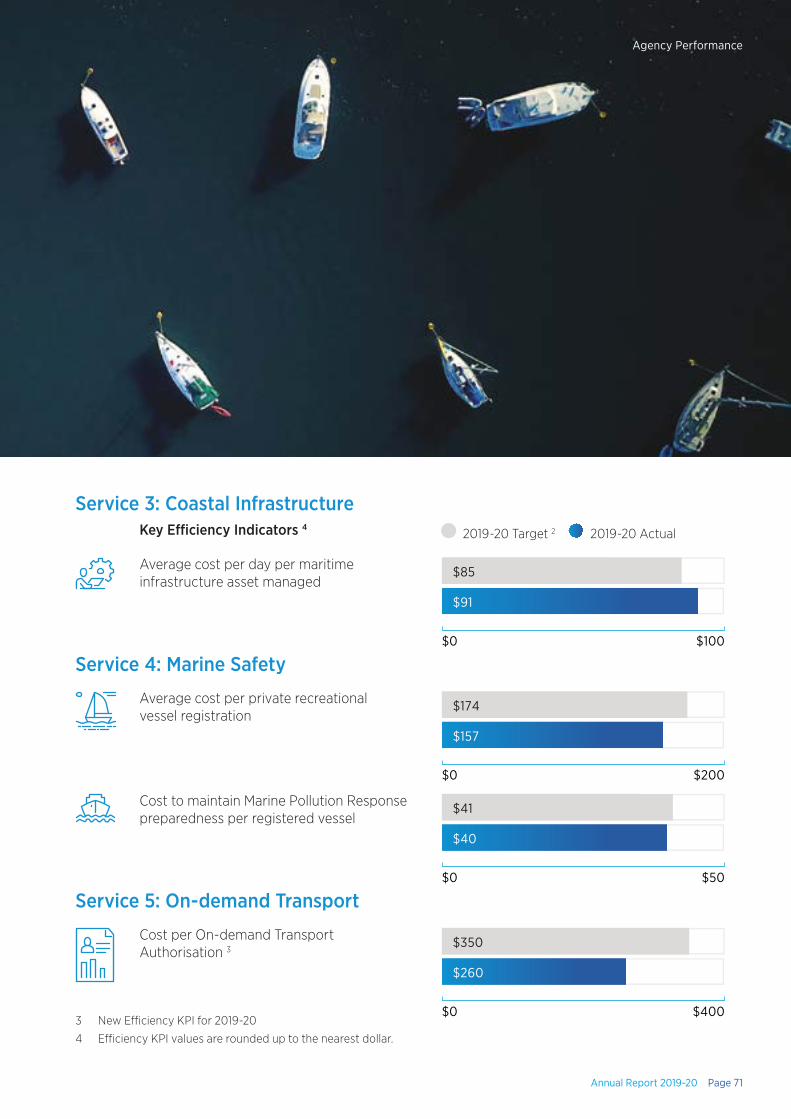
Service 3: Coastal InfrastructureKey Efficiency Indicators 4
2019-20 Target 2 2019-20 Actual
Average cost per day per maritime infrastructure asset managed
$85
$91
$0 $100
Service 4: Marine Safety
Average cost per private recreational vessel registration
$174
$157
$0 $200
Cost to maintain Marine Pollution Response preparedness per registered vessel
$41
$40
$0 $50
Service 5: On-demand Transport
Cost per On-demand Transport Authorisation 3
$350
$260
$0 $4003 New Efficiency KPI for 2019-20
4 Efficiency KPI values are rounded up to the nearest dollar.
Annual Report 2019-20 Page 71
Agency Performance
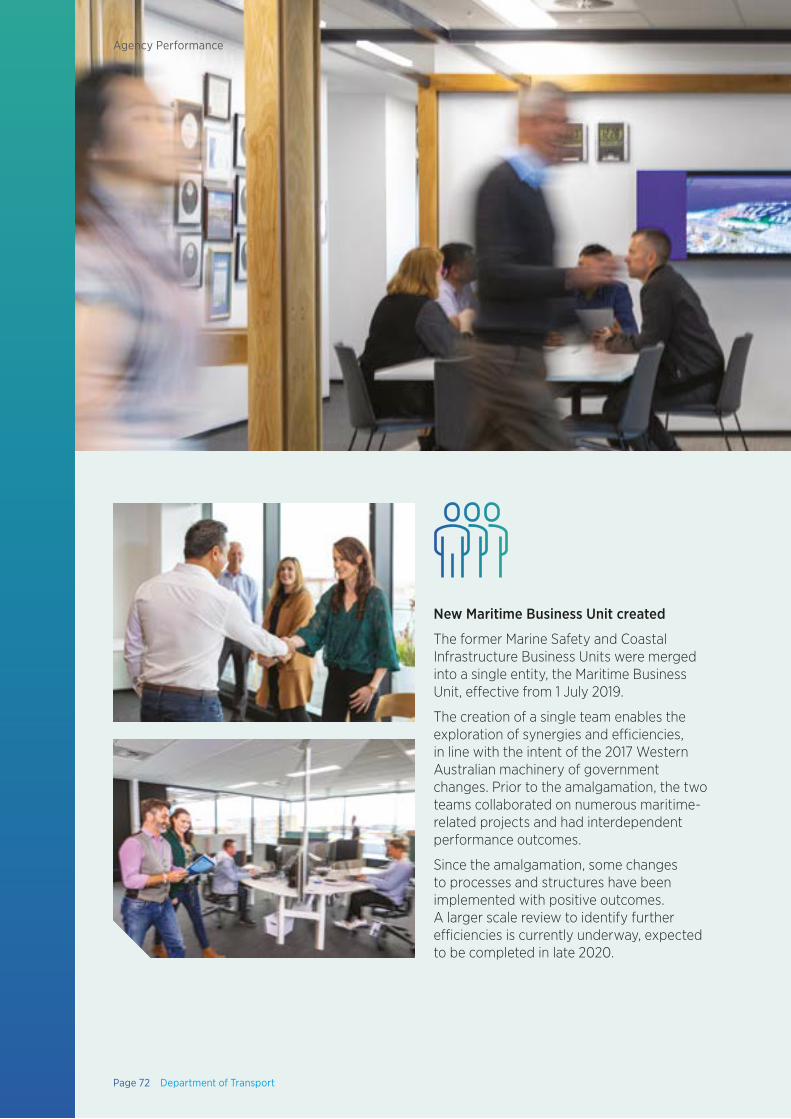
New Maritime Business Unit created
The former Marine Safety and Coastal Infrastructure Business Units were merged into a single entity, the Maritime Business Unit, effective from 1 July 2019.
The creation of a single team enables the exploration of synergies and efficiencies, in line with the intent of the 2017 Western Australian machinery of government changes. Prior to the amalgamation, the two teams collaborated on numerous maritime-related projects and had interdependent performance outcomes.
Since the amalgamation, some changes to processes and structures have been implemented with positive outcomes. A larger scale review to identify further efficiencies is currently underway, expected to be completed in late 2020.
Page 72 Department of Transport
Agency Performance
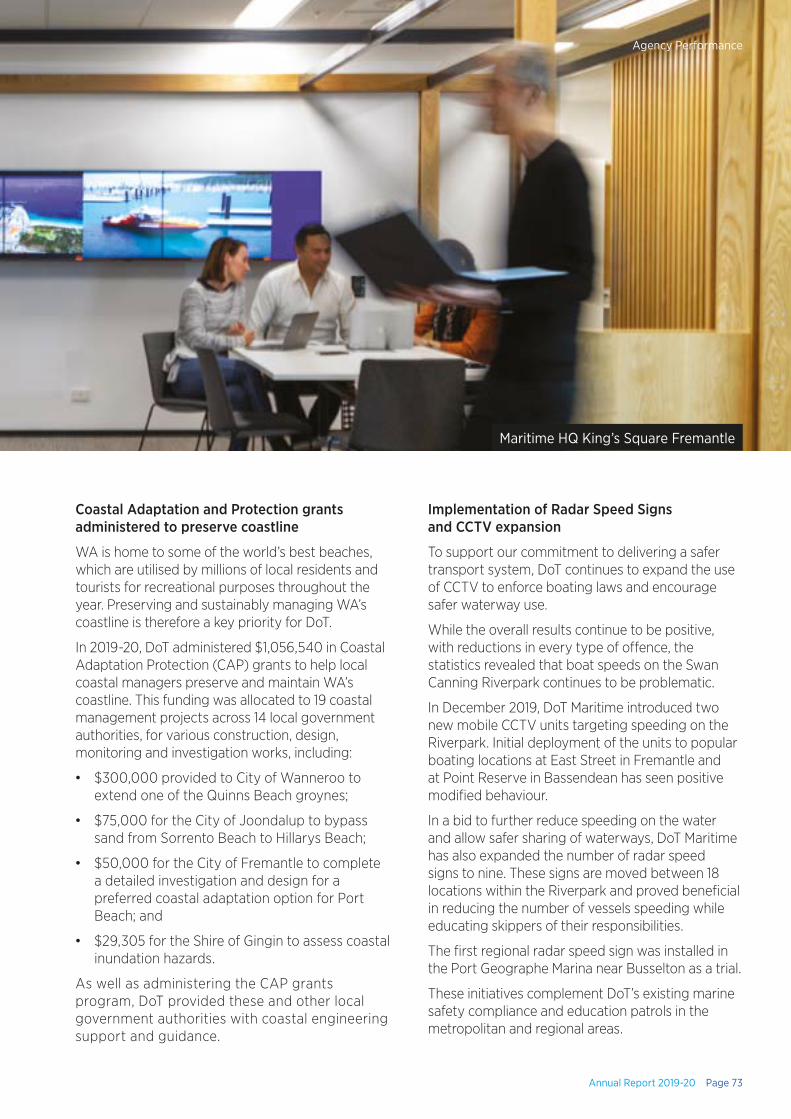
Coastal Adaptation and Protection grants administered to preserve coastline
WA is home to some of the world’s best beaches, which are utilised by millions of local residents and tourists for recreational purposes throughout the year. Preserving and sustainably managing WA’s coastline is therefore a key priority for DoT.
In 2019-20, DoT administered $1,056,540 in Coastal Adaptation Protection (CAP) grants to help local coastal managers preserve and maintain WA’s coastline. This funding was allocated to 19 coastal management projects across 14 local government authorities, for various construction, design, monitoring and investigation works, including:
• $300,000 provided to City of Wanneroo to extend one of the Quinns Beach groynes;
• $75,000 for the City of Joondalup to bypass sand from Sorrento Beach to Hillarys Beach;
• $50,000 for the City of Fremantle to complete a detailed investigation and design for a preferred coastal adaptation option for Port Beach; and
• $29,305 for the Shire of Gingin to assess coastal inundation hazards.
As well as administering the CAP grants program, DoT provided these and other local government authorities with coastal engineering support and guidance.
Implementation of Radar Speed Signs and CCTV expansion
To support our commitment to delivering a safer transport system, DoT continues to expand the use of CCTV to enforce boating laws and encourage safer waterway use.
While the overall results continue to be positive, with reductions in every type of offence, the statistics revealed that boat speeds on the Swan Canning Riverpark continues to be problematic.
In December 2019, DoT Maritime introduced two new mobile CCTV units targeting speeding on the Riverpark. Initial deployment of the units to popular boating locations at East Street in Fremantle and at Point Reserve in Bassendean has seen positive modified behaviour.
In a bid to further reduce speeding on the water and allow safer sharing of waterways, DoT Maritime has also expanded the number of radar speed signs to nine. These signs are moved between 18 locations within the Riverpark and proved beneficial in reducing the number of vessels speeding while educating skippers of their responsibilities.
The first regional radar speed sign was installed in the Port Geographe Marina near Busselton as a trial.
These initiatives complement DoT’s existing marine safety compliance and education patrols in the metropolitan and regional areas.
Maritime HQ King’s Square Fremantle
Annual Report 2019-20 Page 73
Agency Performance

Recreational Boating Facilities Scheme administered to improve infrastructure
The Recreational Boating Facilities Scheme (RBFS) aims to improve recreational boating infrastructure by providing grants to eligible authorities around the State. DoT administers the RBFS on behalf of the State Government. The Scheme is primarily funded through recreational boat registration fees.
In 2019-20, nine infrastructure upgrade projects with a combined grant value of $860,948 were completed, including:
• redesign and construction of the car and trailer parking area at the Murray Bend launching facility;
• a planning study for replacing the existing jetties at Wharf Cove, South Yunderup;
• installation of additional stainless steel ladders to the old Dunsborough and Abbey boat ramps’ finger jetties;
• construction of a 50-metre-long universal floating jetty within the South Harbour precinct of the Mandurah Ocean Marina;
• extending the Port Coogee Marina service jetty by 45 metres and creating a public floating jetty for short-stay recreational boating use;
• installation of an environmental toilet, shelter with table and seating and rainwater tank at Queerearrup Lake for recreational boaters and the wider community;
• construction of three new floating pontoon-style jetties at the Port Geographe boat launching facility to replace the narrow fixed finger jetties;
• redevelopment of the boat trailer parking area at the Port Geographe boat launching facility; and
• the purchase and installation of a fish cleaning station at the Green Head boat ramp facility.
In December 2019, $2.5 million in RBFS funding was allocated to a further ten projects across the State through Round 24 of the Scheme.
Page 74 Department of Transport
Agency Performance
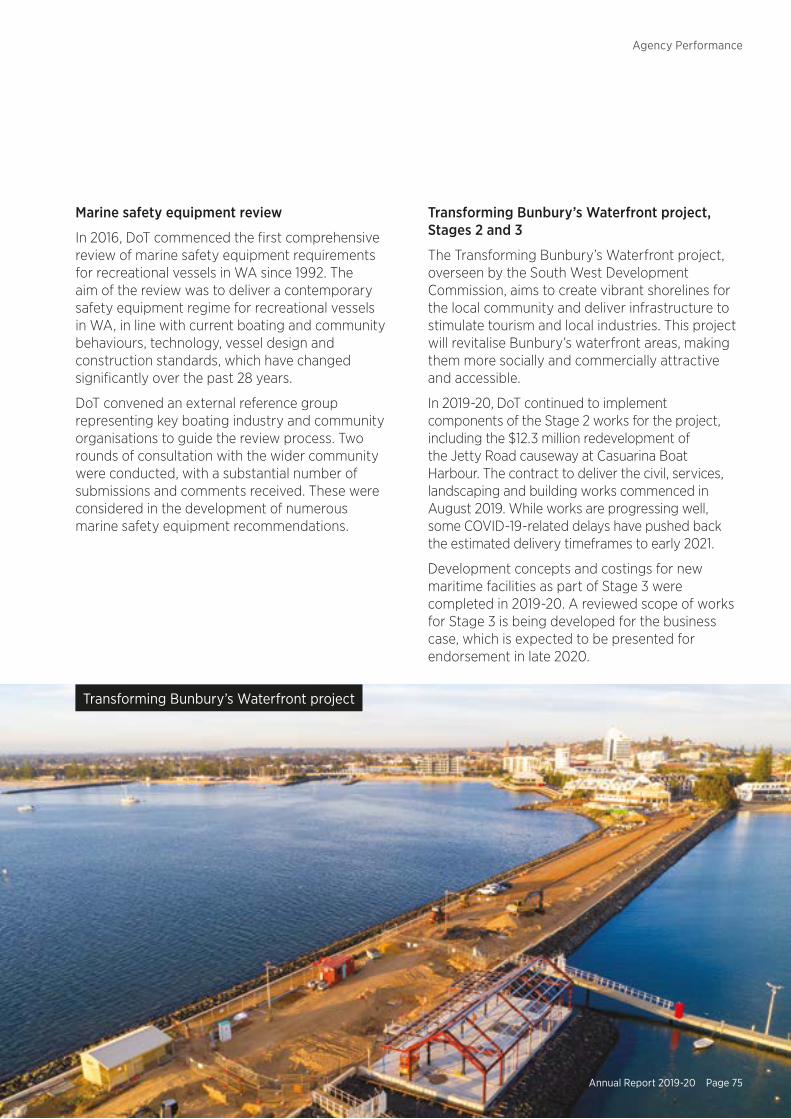
Marine safety equipment review
In 2016, DoT commenced the first comprehensive review of marine safety equipment requirements for recreational vessels in WA since 1992. The aim of the review was to deliver a contemporary safety equipment regime for recreational vessels in WA, in line with current boating and community behaviours, technology, vessel design and construction standards, which have changed significantly over the past 28 years.
DoT convened an external reference group representing key boating industry and community organisations to guide the review process. Two rounds of consultation with the wider community were conducted, with a substantial number of submissions and comments received. These were considered in the development of numerous marine safety equipment recommendations.
Transforming Bunbury’s Waterfront project, Stages 2 and 3
The Transforming Bunbury’s Waterfront project, overseen by the South West Development Commission, aims to create vibrant shorelines for the local community and deliver infrastructure to stimulate tourism and local industries. This project will revitalise Bunbury’s waterfront areas, making them more socially and commercially attractive and accessible.
In 2019-20, DoT continued to implement components of the Stage 2 works for the project, including the $12.3 million redevelopment of the Jetty Road causeway at Casuarina Boat Harbour. The contract to deliver the civil, services, landscaping and building works commenced in August 2019. While works are progressing well, some COVID-19-related delays have pushed back the estimated delivery timeframes to early 2021.
Development concepts and costings for new maritime facilities as part of Stage 3 were completed in 2019-20. A reviewed scope of works for Stage 3 is being developed for the business case, which is expected to be presented for endorsement in late 2020.
Transforming Bunbury’s Waterfront project
Annual Report 2019-20 Page 75
Agency Performance
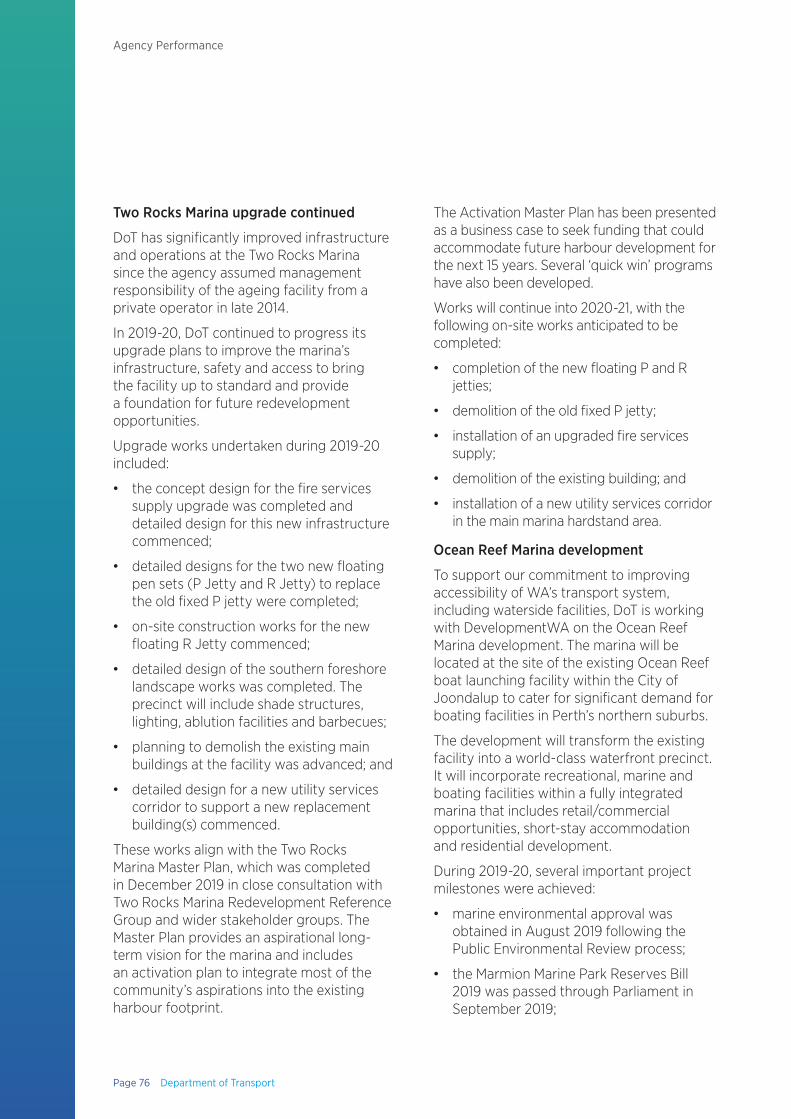
Two Rocks Marina upgrade continued
DoT has significantly improved infrastructure and operations at the Two Rocks Marina since the agency assumed management responsibility of the ageing facility from a private operator in late 2014.
In 2019-20, DoT continued to progress its upgrade plans to improve the marina’s infrastructure, safety and access to bring the facility up to standard and provide a foundation for future redevelopment opportunities.
Upgrade works undertaken during 2019-20 included:
• the concept design for the fire services supply upgrade was completed and detailed design for this new infrastructure commenced;
• detailed designs for the two new floating pen sets (P Jetty and R Jetty) to replace the old fixed P jetty were completed;
• on-site construction works for the new floating R Jetty commenced;
• detailed design of the southern foreshore landscape works was completed. The precinct will include shade structures, lighting, ablution facilities and barbecues;
• planning to demolish the existing main buildings at the facility was advanced; and
• detailed design for a new utility services corridor to support a new replacement building(s) commenced.
These works align with the Two Rocks Marina Master Plan, which was completed in December 2019 in close consultation with Two Rocks Marina Redevelopment Reference Group and wider stakeholder groups. The Master Plan provides an aspirational long-term vision for the marina and includes an activation plan to integrate most of the community’s aspirations into the existing harbour footprint.
The Activation Master Plan has been presented as a business case to seek funding that could accommodate future harbour development for the next 15 years. Several ‘quick win’ programs have also been developed.
Works will continue into 2020-21, with the following on-site works anticipated to be completed:
• completion of the new floating P and R jetties;
• demolition of the old fixed P jetty;
• installation of an upgraded fire services supply;
• demolition of the existing building; and
• installation of a new utility services corridor in the main marina hardstand area.
Ocean Reef Marina development
To support our commitment to improving accessibility of WA’s transport system, including waterside facilities, DoT is working with DevelopmentWA on the Ocean Reef Marina development. The marina will be located at the site of the existing Ocean Reef boat launching facility within the City of Joondalup to cater for significant demand for boating facilities in Perth’s northern suburbs.
The development will transform the existing facility into a world-class waterfront precinct. It will incorporate recreational, marine and boating facilities within a fully integrated marina that includes retail/commercial opportunities, short-stay accommodation and residential development.
During 2019-20, several important project milestones were achieved:
• marine environmental approval was obtained in August 2019 following the Public Environmental Review process;
• the Marmion Marine Park Reserves Bill 2019 was passed through Parliament in September 2019;
Page 76 Department of Transport
Agency Performance
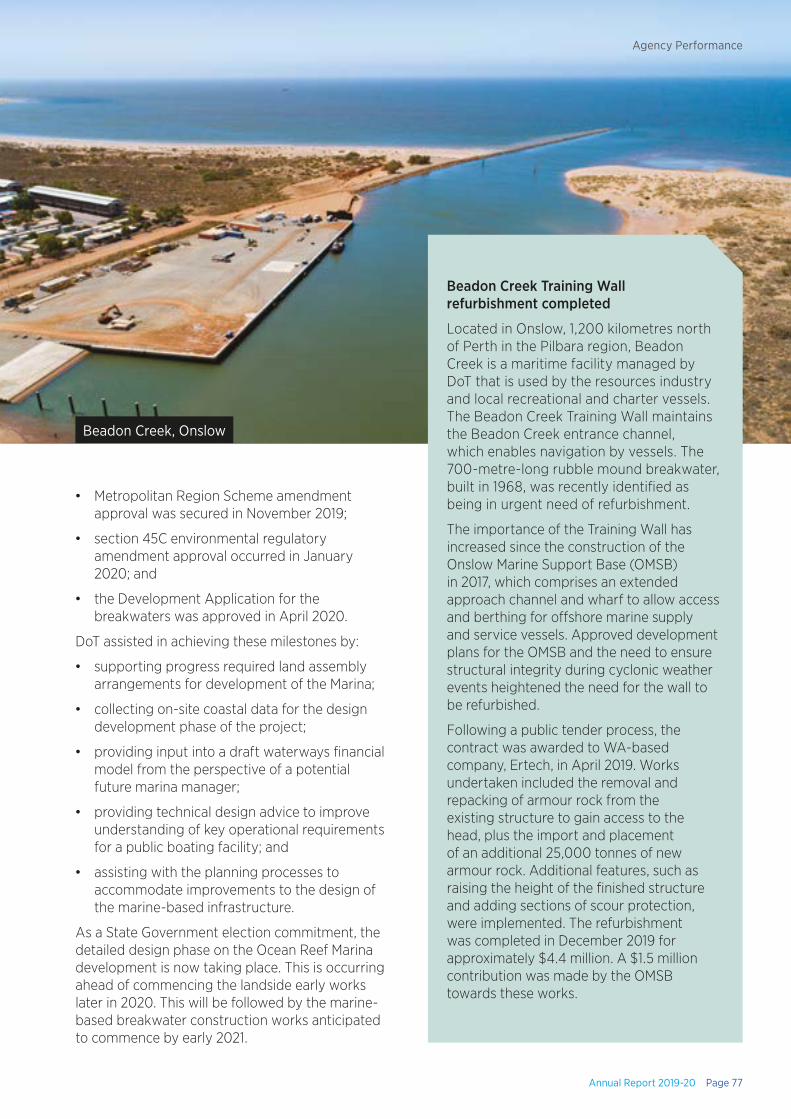
• Metropolitan Region Scheme amendment approval was secured in November 2019;
• section 45C environmental regulatory amendment approval occurred in January 2020; and
• the Development Application for the breakwaters was approved in April 2020.
DoT assisted in achieving these milestones by:
• supporting progress required land assembly arrangements for development of the Marina;
• collecting on-site coastal data for the design development phase of the project;
• providing input into a draft waterways financial model from the perspective of a potential future marina manager;
• providing technical design advice to improve understanding of key operational requirements for a public boating facility; and
• assisting with the planning processes to accommodate improvements to the design of the marine-based infrastructure.
As a State Government election commitment, the detailed design phase on the Ocean Reef Marina development is now taking place. This is occurring ahead of commencing the landside early works later in 2020. This will be followed by the marine-based breakwater construction works anticipated to commence by early 2021.
Beadon Creek, Onslow
Beadon Creek Training Wall refurbishment completed
Located in Onslow, 1,200 kilometres north of Perth in the Pilbara region, Beadon Creek is a maritime facility managed by DoT that is used by the resources industry and local recreational and charter vessels. The Beadon Creek Training Wall maintains the Beadon Creek entrance channel, which enables navigation by vessels. The 700-metre-long rubble mound breakwater, built in 1968, was recently identified as being in urgent need of refurbishment.
The importance of the Training Wall has increased since the construction of the Onslow Marine Support Base (OMSB) in 2017, which comprises an extended approach channel and wharf to allow access and berthing for offshore marine supply and service vessels. Approved development plans for the OMSB and the need to ensure structural integrity during cyclonic weather events heightened the need for the wall to be refurbished.
Following a public tender process, the contract was awarded to WA-based company, Ertech, in April 2019. Works undertaken included the removal and repacking of armour rock from the existing structure to gain access to the head, plus the import and placement of an additional 25,000 tonnes of new armour rock. Additional features, such as raising the height of the finished structure and adding sections of scour protection, were implemented. The refurbishment was completed in December 2019 for approximately $4.4 million. A $1.5 million contribution was made by the OMSB towards these works.
Annual Report 2019-20 Page 77
Agency Performance
Patrol vessel upgrades and replacements
DoT Maritime maintains a fleet of vessels to conduct education and compliance patrols, collect coastal data through hydrographical surveys and provide on-water capability for maritime environmental emergencies. These vessels are also occasionally requested by other agencies to assist in sea search-and-rescue activities, whale disentanglements and shark hazard responses.
DoT manages this fleet under a ten-year rolling replacement and refit program to ensure the vessels are fit for purpose and ready for immediate deployment.
In 2020, DoT Maritime procured a new 6.8 metre centre console vessel (PV16). This dual-purpose vessel, based at Hillarys Boat Harbour, will be used to patrol the upper reaches of the Swan River and will be available to respond to maritime emergency incidents as required.
Another dual-purpose vessel (PV8) was refitted during the 2019-20 financial year. PV8 is used to conduct patrols in the metropolitan area, and as an escort vessel for the Sea Trek program (sailing dinghies going on overnight expeditions) that operate from the Marine Education Boat Shed in East Fremantle.
Engines were also replaced on other vessels, PV1 and PV6, as part of an ongoing engine replacement program.
Port Hedland Spoilbank Marina work continues
DoT continued to support the Pilbara Development Commission in progressing the development of the Spoilbank Marina in Port Hedland. This development will help meet the recreational boating needs of the local community and provide much-needed amenity for locals and tourists.
In October 2018, Cabinet endorsed a $94 million scope of works for the preferred concept design, which includes boat pens, boat launching facilities, two breakwaters and internal revetment walls, and an access channel that separates marina traffic from shipping activity.
The concept also features new public open spaces and improved public access, parking, toilet facilities and areas for pop-up retail stalls.
Following the Cabinet endorsement, DoT was engaged to provide time and cost estimates for the coastal risk mapping for the Spoilbank site, as well as undertake the detailed design for the marina.
In 2019-20, DoT commenced a range of work required to progress the detailed design. This included capturing data around the impacts of Tropical Cyclone Veronica in May 2020, technical investigations and studies, and an assessment of the demand and requirements for boat pens.
Preliminary design work was completed at end August 2019 and the project is now progressing to detailed design. Work on the detailed design will continue throughout 2020-21 for eventual consideration by the Spoilbank Marina Taskforce.
Page 78 Department of Transport
Agency Performance
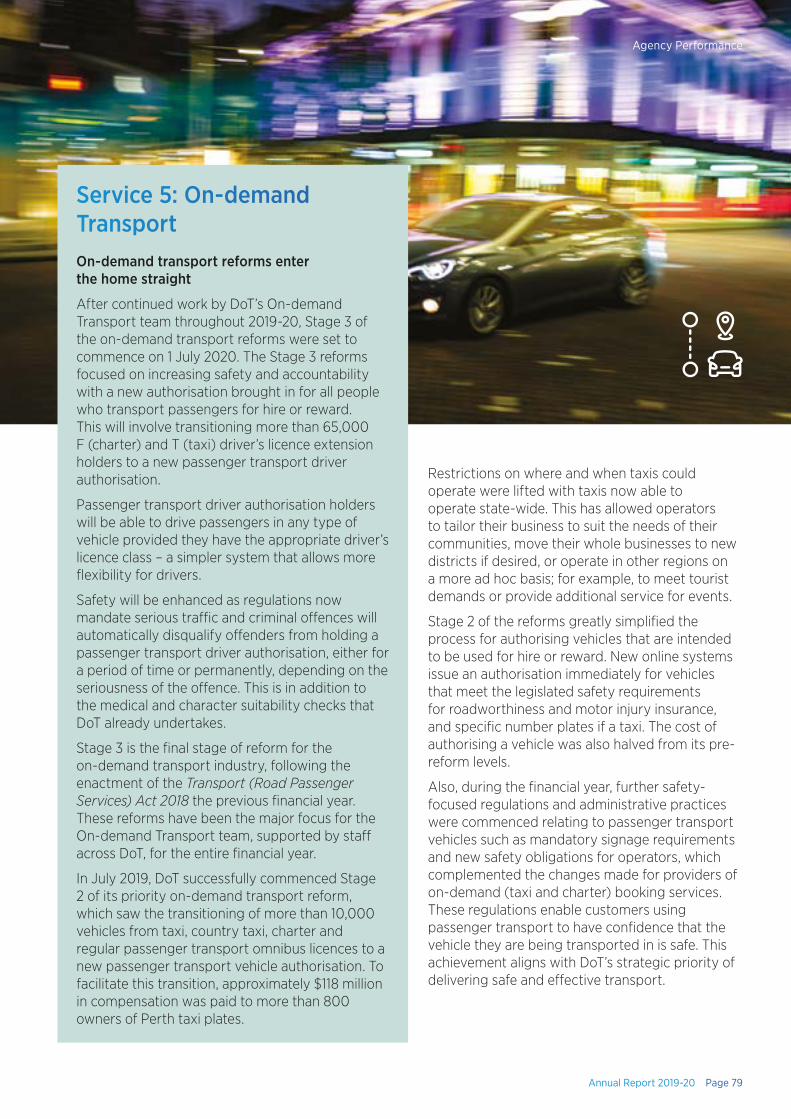
Restrictions on where and when taxis could operate were lifted with taxis now able to operate state-wide. This has allowed operators to tailor their business to suit the needs of their communities, move their whole businesses to new districts if desired, or operate in other regions on a more ad hoc basis; for example, to meet tourist demands or provide additional service for events.
Stage 2 of the reforms greatly simplified the process for authorising vehicles that are intended to be used for hire or reward. New online systems issue an authorisation immediately for vehicles that meet the legislated safety requirements for roadworthiness and motor injury insurance, and specific number plates if a taxi. The cost of authorising a vehicle was also halved from its pre-reform levels.
Also, during the financial year, further safety-focused regulations and administrative practices were commenced relating to passenger transport vehicles such as mandatory signage requirements and new safety obligations for operators, which complemented the changes made for providers of on-demand (taxi and charter) booking services. These regulations enable customers using passenger transport to have confidence that the vehicle they are being transported in is safe. This achievement aligns with DoT’s strategic priority of delivering safe and effective transport.
Service 5: On-demand TransportOn-demand transport reforms enter the home straight
After continued work by DoT’s On-demand Transport team throughout 2019-20, Stage 3 of the on-demand transport reforms were set to commence on 1 July 2020. The Stage 3 reforms focused on increasing safety and accountability with a new authorisation brought in for all people who transport passengers for hire or reward. This will involve transitioning more than 65,000 F (charter) and T (taxi) driver’s licence extension holders to a new passenger transport driver authorisation.
Passenger transport driver authorisation holders will be able to drive passengers in any type of vehicle provided they have the appropriate driver’s licence class – a simpler system that allows more flexibility for drivers.
Safety will be enhanced as regulations now mandate serious traffic and criminal offences will automatically disqualify offenders from holding a passenger transport driver authorisation, either for a period of time or permanently, depending on the seriousness of the offence. This is in addition to the medical and character suitability checks that DoT already undertakes.
Stage 3 is the final stage of reform for the on-demand transport industry, following the enactment of the Transport (Road Passenger Services) Act 2018 the previous financial year. These reforms have been the major focus for the On-demand Transport team, supported by staff across DoT, for the entire financial year.
In July 2019, DoT successfully commenced Stage 2 of its priority on-demand transport reform, which saw the transitioning of more than 10,000 vehicles from taxi, country taxi, charter and regular passenger transport omnibus licences to a new passenger transport vehicle authorisation. To facilitate this transition, approximately $118 million in compensation was paid to more than 800 owners of Perth taxi plates.
Annual Report 2019-20 Page 79
Agency Performance
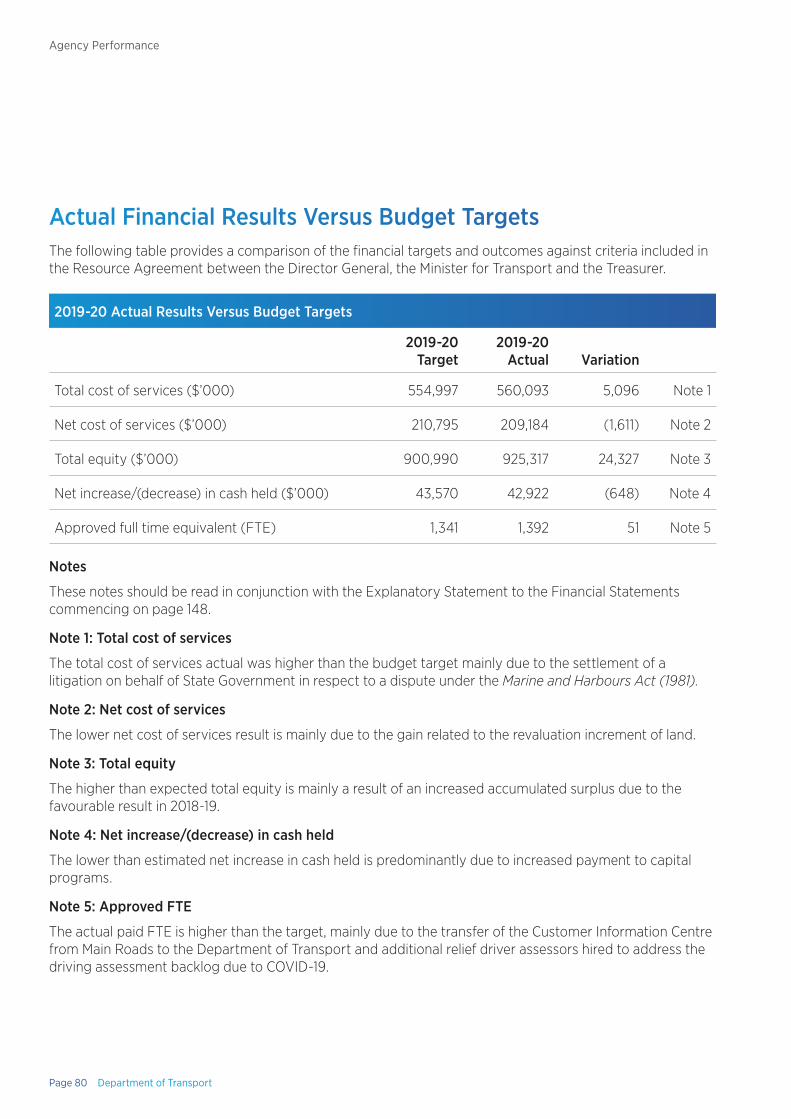
Actual Financial Results Versus Budget TargetsThe following table provides a comparison of the financial targets and outcomes against criteria included in the Resource Agreement between the Director General, the Minister for Transport and the Treasurer.
2019-20 Actual Results Versus Budget Targets
2019-20 Target
2019-20 Actual Variation
Total cost of services ($’000) 554,997 560,093 5,096 Note 1
Net cost of services ($’000) 210,795 209,184 (1,611) Note 2
Total equity ($’000) 900,990 925,317 24,327 Note 3
Net increase/(decrease) in cash held ($’000) 43,570 42,922 (648) Note 4
Approved full time equivalent (FTE) 1,341 1,392 51 Note 5
Notes
These notes should be read in conjunction with the Explanatory Statement to the Financial Statements commencing on page 148.
Note 1: Total cost of services
The total cost of services actual was higher than the budget target mainly due to the settlement of a litigation on behalf of State Government in respect to a dispute under the Marine and Harbours Act (1981).
Note 2: Net cost of services
The lower net cost of services result is mainly due to the gain related to the revaluation increment of land.
Note 3: Total equity
The higher than expected total equity is mainly a result of an increased accumulated surplus due to the favourable result in 2018-19.
Note 4: Net increase/(decrease) in cash held
The lower than estimated net increase in cash held is predominantly due to increased payment to capital programs.
Note 5: Approved FTE
The actual paid FTE is higher than the target, mainly due to the transfer of the Customer Information Centre from Main Roads to the Department of Transport and additional relief driver assessors hired to address the driving assessment backlog due to COVID-19.
Page 80 Department of Transport
Agency Performance
Disclosures and Legal ComplianceDisclosures and Legal Compliance
Annual Report 2019-20 Page 81
Page 82 Department of Transport
Disclosures and Legal Compliance
Annual Report 2019-20 Page 83
Disclosures and Legal Compliance
Page 84 Department of Transport
Disclosures and Legal Compliance
Annual Report 2019-20 Page 85
Disclosures and Legal Compliance

Page 86 Department of Transport
Disclosures and Legal ComplianceDisclosures and Legal Compliance
Certification of Financial StatementsFor the year ended 30 June 2020
The accompanying financial statements of the Department of Transport have been prepared in compliance with the provisions of the Financial Management Act 2006 from proper accounts and records to present fairly the financial transactions for the reporting period ended 30 June 2020 and the financial position as at 30 June 2020.
At the date of signing we are not aware of any circumstances which would render the particulars included in the financial statements misleading or inaccurate.
Peter Parolo Chief Finance Officer
Date 17 September 2020
Peter Woronzow Accountable Authority
Date 17 September 2020
Annual Report 2019-20 Page 87
Disclosures and Legal Compliance
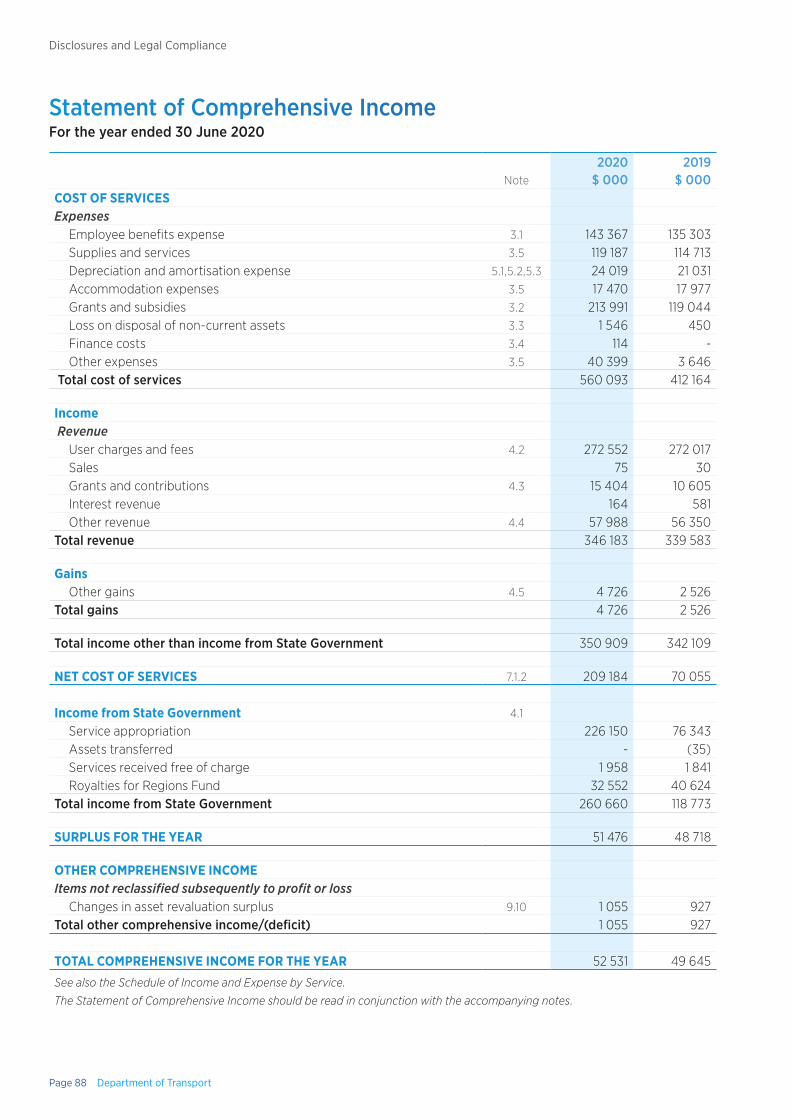
Page 88 Department of Transport
Disclosures and Legal Compliance
Statement of Comprehensive IncomeFor the year ended 30 June 2020
Note2020
$ 0002019
$ 000COST OF SERVICESExpenses
Employee benefits expense 3.1 143 367 135 303 Supplies and services 3.5 119 187 114 713 Depreciation and amortisation expense 5.1,5.2,5.3 24 019 21 031 Accommodation expenses 3.5 17 470 17 977 Grants and subsidies 3.2 213 991 119 044 Loss on disposal of non-current assets 3.3 1 546 450 Finance costs 3.4 114 - Other expenses 3.5 40 399 3 646
Total cost of services 560 093 412 164
Income Revenue
User charges and fees 4.2 272 552 272 017 Sales 75 30 Grants and contributions 4.3 15 404 10 605 Interest revenue 164 581 Other revenue 4.4 57 988 56 350
Total revenue 346 183 339 583
Gains Other gains 4.5 4 726 2 526
Total gains 4 726 2 526
Total income other than income from State Government 350 909 342 109
NET COST OF SERVICES 7.1.2 209 184 70 055
Income from State Government 4.1
Service appropriation 226 150 76 343 Assets transferred - (35) Services received free of charge 1 958 1 841 Royalties for Regions Fund 32 552 40 624
Total income from State Government 260 660 118 773
SURPLUS FOR THE YEAR 51 476 48 718
OTHER COMPREHENSIVE INCOMEItems not reclassified subsequently to profit or loss
Changes in asset revaluation surplus 9.10 1 055 927Total other comprehensive income/(deficit) 1 055 927
TOTAL COMPREHENSIVE INCOME FOR THE YEAR 52 531 49 645
See also the Schedule of Income and Expense by Service.
The Statement of Comprehensive Income should be read in conjunction with the accompanying notes.
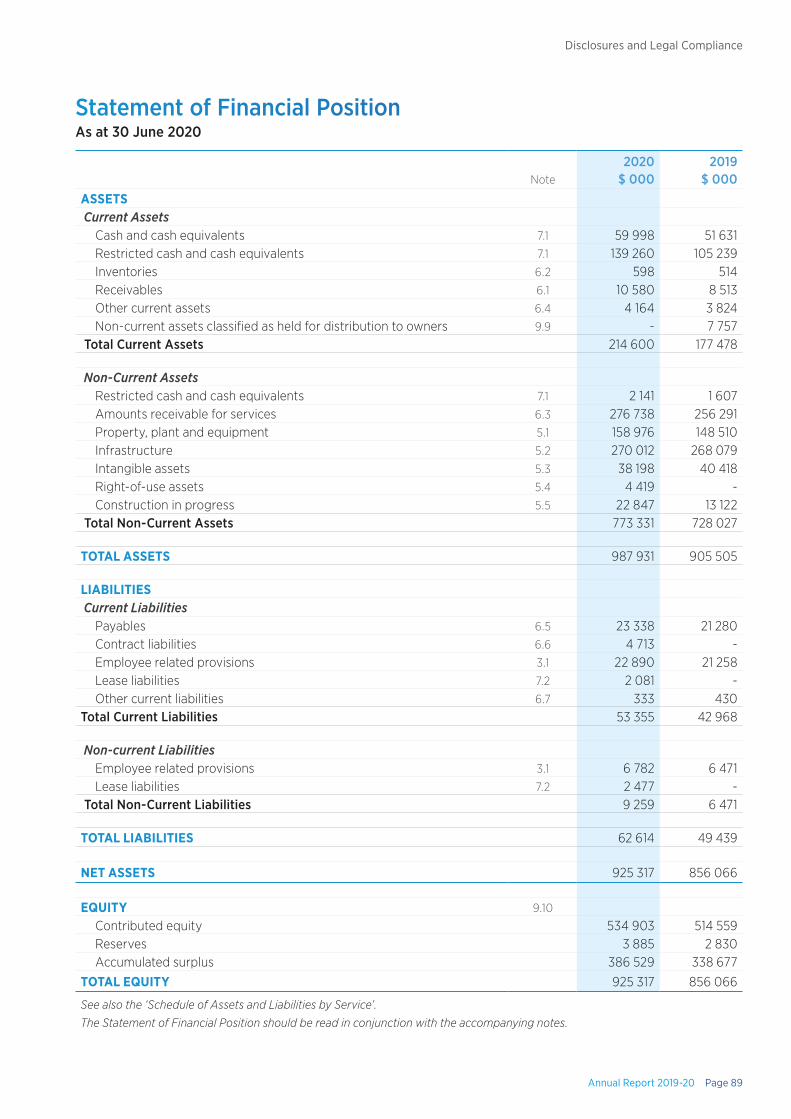
Annual Report 2019-20 Page 89
Disclosures and Legal Compliance
Statement of Financial PositionAs at 30 June 2020
Note2020
$ 0002019
$ 000ASSETS Current Assets
Cash and cash equivalents 7.1 59 998 51 631 Restricted cash and cash equivalents 7.1 139 260 105 239 Inventories 6.2 598 514 Receivables 6.1 10 580 8 513 Other current assets 6.4 4 164 3 824 Non-current assets classified as held for distribution to owners 9.9 - 7 757
Total Current Assets 214 600 177 478
Non-Current Assets Restricted cash and cash equivalents 7.1 2 141 1 607 Amounts receivable for services 6.3 276 738 256 291 Property, plant and equipment 5.1 158 976 148 510 Infrastructure 5.2 270 012 268 079 Intangible assets 5.3 38 198 40 418 Right-of-use assets 5.4 4 419 - Construction in progress 5.5 22 847 13 122
Total Non-Current Assets 773 331 728 027
TOTAL ASSETS 987 931 905 505
LIABILITIES Current Liabilities
Payables 6.5 23 338 21 280 Contract liabilities 6.6 4 713 - Employee related provisions 3.1 22 890 21 258 Lease liabilities 7.2 2 081 - Other current liabilities 6.7 333 430
Total Current Liabilities 53 355 42 968
Non-current Liabilities Employee related provisions 3.1 6 782 6 471 Lease liabilities 7.2 2 477 -
Total Non-Current Liabilities 9 259 6 471
TOTAL LIABILITIES 62 614 49 439
NET ASSETS 925 317 856 066
EQUITY 9.10
Contributed equity 534 903 514 559 Reserves 3 885 2 830 Accumulated surplus 386 529 338 677
TOTAL EQUITY 925 317 856 066
See also the ‘Schedule of Assets and Liabilities by Service’.
The Statement of Financial Position should be read in conjunction with the accompanying notes.
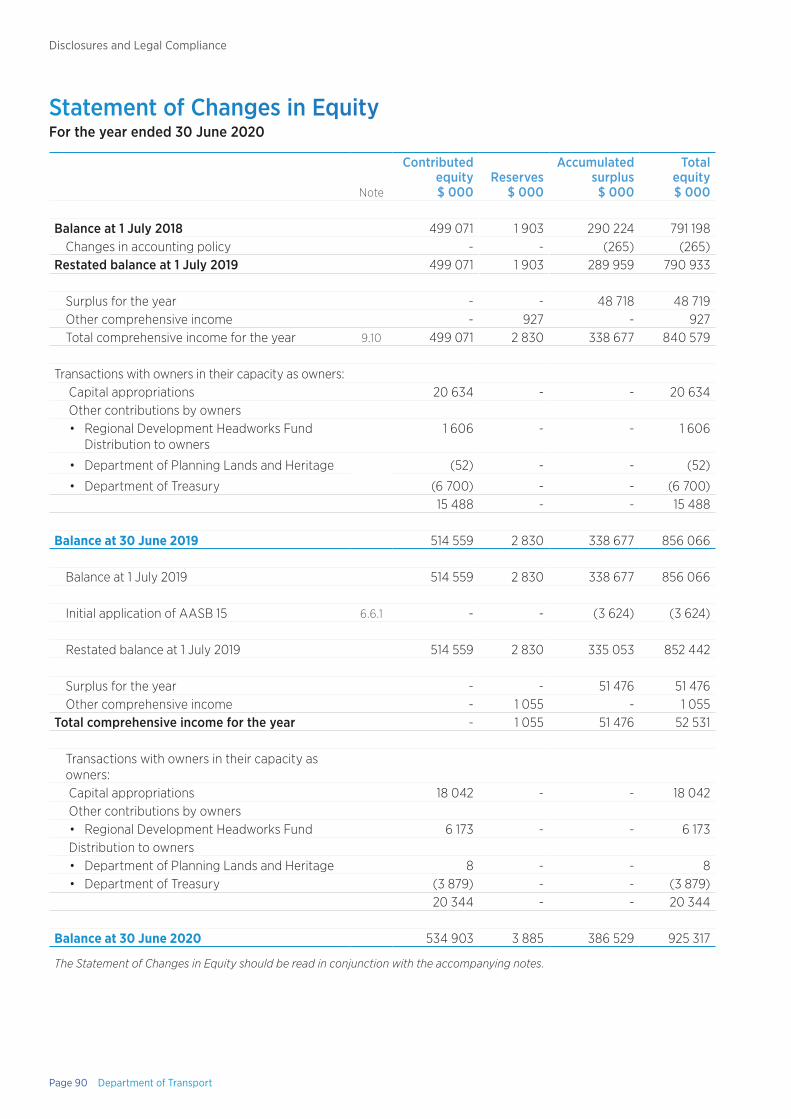
Page 90 Department of Transport
Disclosures and Legal Compliance
Statement of Changes in EquityFor the year ended 30 June 2020
Note
Contributed equity$ 000
Reserves$ 000
Accumulated surplus$ 000
Total equity$ 000
Balance at 1 July 2018 499 071 1 903 290 224 791 198Changes in accounting policy - - (265) (265)
Restated balance at 1 July 2019 499 071 1 903 289 959 790 933
Surplus for the year - - 48 718 48 719Other comprehensive income - 927 - 927Total comprehensive income for the year 9.10 499 071 2 830 338 677 840 579
Transactions with owners in their capacity as owners: Capital appropriations 20 634 - - 20 634 Other contributions by owners• Regional Development Headworks Fund
Distribution to owners1 606 - - 1 606
• Department of Planning Lands and Heritage (52) - - (52)
• Department of Treasury (6 700) - - (6 700)15 488 - - 15 488
Balance at 30 June 2019 514 559 2 830 338 677 856 066
Balance at 1 July 2019 514 559 2 830 338 677 856 066
Initial application of AASB 15 6.6.1 - - (3 624) (3 624)
Restated balance at 1 July 2019 514 559 2 830 335 053 852 442
Surplus for the year - - 51 476 51 476Other comprehensive income - 1 055 - 1 055
Total comprehensive income for the year - 1 055 51 476 52 531
Transactions with owners in their capacity as owners: Capital appropriations 18 042 - - 18 042 Other contributions by owners• Regional Development Headworks Fund 6 173 - - 6 173
Distribution to owners• Department of Planning Lands and Heritage 8 - - 8• Department of Treasury (3 879) - - (3 879)
20 344 - - 20 344
Balance at 30 June 2020 534 903 3 885 386 529 925 317
The Statement of Changes in Equity should be read in conjunction with the accompanying notes.
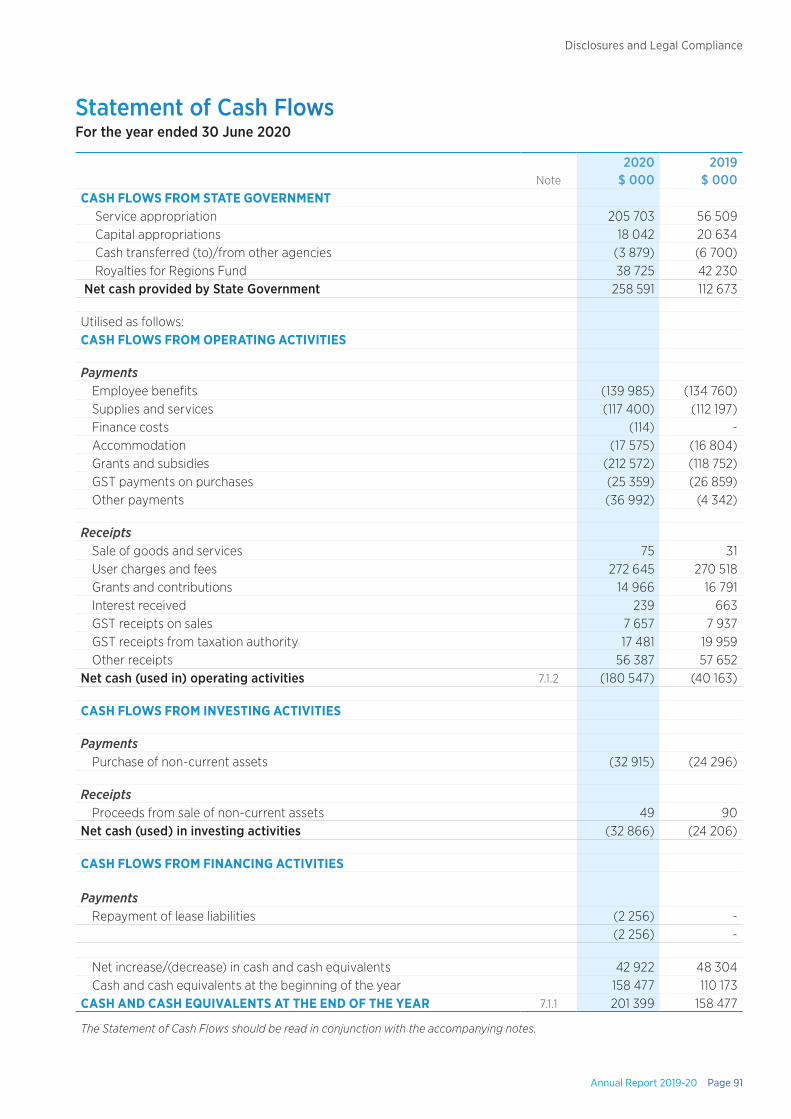
Annual Report 2019-20 Page 91
Disclosures and Legal Compliance
Statement of Cash FlowsFor the year ended 30 June 2020
Note2020
$ 0002019
$ 000CASH FLOWS FROM STATE GOVERNMENT
Service appropriation 205 703 56 509 Capital appropriations 18 042 20 634 Cash transferred (to)/from other agencies (3 879) (6 700) Royalties for Regions Fund 38 725 42 230
Net cash provided by State Government 258 591 112 673
Utilised as follows:CASH FLOWS FROM OPERATING ACTIVITIES
PaymentsEmployee benefits (139 985) (134 760)Supplies and services (117 400) (112 197)Finance costs (114) -Accommodation (17 575) (16 804)Grants and subsidies (212 572) (118 752)GST payments on purchases (25 359) (26 859)Other payments (36 992) (4 342)
ReceiptsSale of goods and services 75 31User charges and fees 272 645 270 518Grants and contributions 14 966 16 791Interest received 239 663GST receipts on sales 7 657 7 937GST receipts from taxation authority 17 481 19 959Other receipts 56 387 57 652
Net cash (used in) operating activities 7.1.2 (180 547) (40 163)
CASH FLOWS FROM INVESTING ACTIVITIES
PaymentsPurchase of non-current assets (32 915) (24 296)
ReceiptsProceeds from sale of non-current assets 49 90
Net cash (used) in investing activities (32 866) (24 206)
CASH FLOWS FROM FINANCING ACTIVITIES
PaymentsRepayment of lease liabilities (2 256) -
(2 256) -
Net increase/(decrease) in cash and cash equivalents 42 922 48 304Cash and cash equivalents at the beginning of the year 158 477 110 173
CASH AND CASH EQUIVALENTS AT THE END OF THE YEAR 7.1.1 201 399 158 477
The Statement of Cash Flows should be read in conjunction with the accompanying notes.
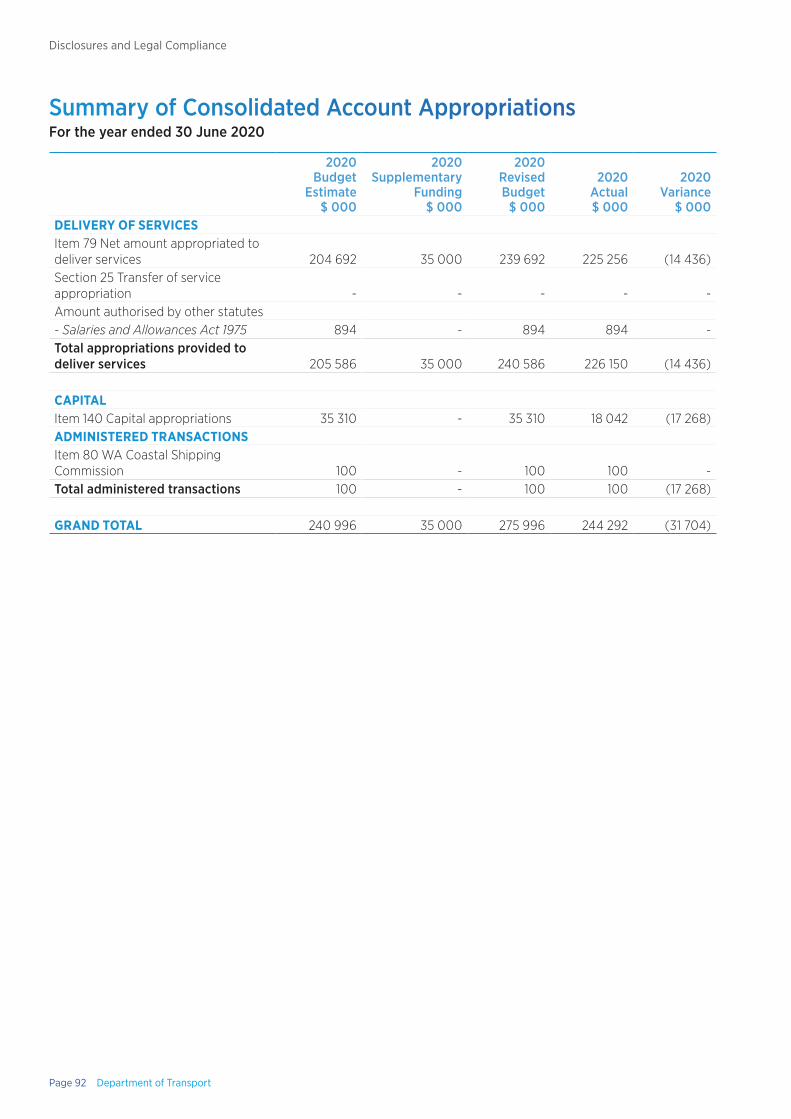
Page 92 Department of Transport
Disclosures and Legal Compliance
Summary of Consolidated Account AppropriationsFor the year ended 30 June 2020
2020Budget
Estimate$ 000
2020Supplementary
Funding$ 000
2020 Revised Budget
$ 000
2020Actual$ 000
2020 Variance
$ 000DELIVERY OF SERVICESItem 79 Net amount appropriated to deliver services 204 692 35 000 239 692 225 256 (14 436)Section 25 Transfer of service appropriation - - - - -Amount authorised by other statutes- Salaries and Allowances Act 1975 894 - 894 894 -Total appropriations provided to deliver services 205 586 35 000 240 586 226 150 (14 436)
CAPITALItem 140 Capital appropriations 35 310 - 35 310 18 042 (17 268)ADMINISTERED TRANSACTIONSItem 80 WA Coastal Shipping Commission 100 - 100 100 -Total administered transactions 100 - 100 100 (17 268)
GRAND TOTAL 240 996 35 000 275 996 244 292 (31 704)

Notes to the Financial StatementsFor the year ended 30 June 2020
Page 94 Department of Transport
Disclosures and Legal Compliance
1. Basis of preparationThe Department is a WA Government entity and is controlled by the State of Western Australia, which is the ultimate parent. The Department is a not-for-profit entity (as profit is not its principal objective).
A description of the nature of its operations and its principal activities has been included in the Overview, which does not form part of these financial statements.
These annual financial statements were authorised for issue by the Accountable Authority of the Department on 17 September 2020.
Statement of complianceThese general-purpose financial statements have been prepared in accordance with:
1. The Financial Management Act 2006;
2. The Treasurer’s Instructions;
3. Australian Accounting Standards including applicable interpretations; and
4. Where appropriate, those accounting standard paragraphs applicable for not-for-profit entities have been applied.
The Financial Management Act 2006 and the Treasurer’s instructions take precedence over Australian Accounting Standards. Several Accounting Standards are modified by the Instructions to vary application, disclosure format and wording. Where modification is required and has had a material or significant financial effect upon the reported results, details of that modification and the resulting financial effect are disclosed in the notes to the financial statements.
Basis of preparationThe financial statements have been prepared on the accrual basis of accounting using the historical cost convention, except for land and buildings which have been measured at fair value.
The accounting policies adopted in the preparation of the financial statements have been consistently applied throughout all financial years presented unless otherwise stated.
The financial statements are presented in Australian dollars and all values are rounded to the nearest thousand dollars ($ 000).
Judgements and estimatesJudgements, estimates and assumptions are required to be made about financial information being presented. The significant judgements and estimates made in the preparation of these financial statements are disclosed in the notes where amounts affected by those judgements and/or estimates are disclosed. Estimates and associated assumptions are based on professional judgements derived from historical experience and various other factors that are believed to be reasonable under the circumstances.
Contributed equityAASB Interpretation 1038 Contributions by Owners Made to Wholly-Owned Public-Sector Entities requires transfers in the nature of equity contributions, other than as a result of a restructure of administrative arrangements, to be designated by the Government (the owner) as contributions by owners (at the time of, or prior to, transfer) before such transfers can be recognised as equity contributions. Capital appropriations have been designated as contributions by owners by Treasurer’s instruction 955 Contributions by Owners made to Wholly Owned Public-Sector Entities and have been credited directly to Contributed Equity.
The transfers of net assets to/from other agencies, other than as a result of a restructure of administrative arrangements, are designated as contributions by owners where the transfers are non-discretionary and non-reciprocal.
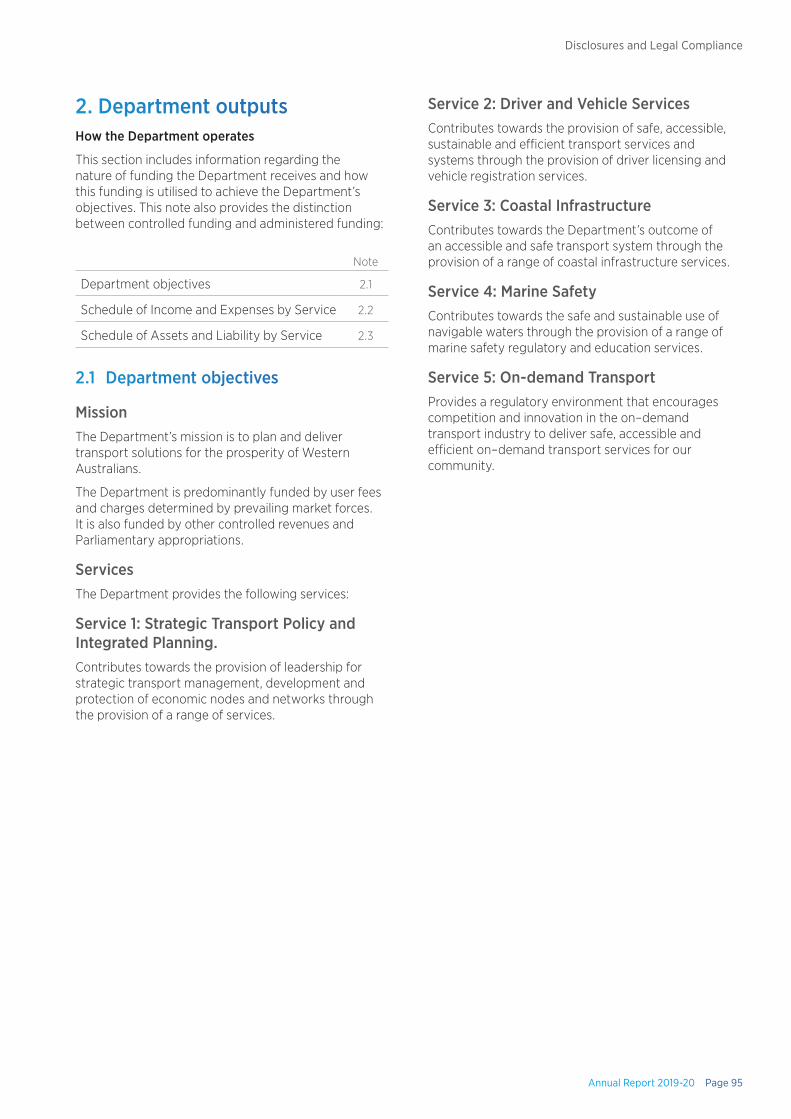
Annual Report 2019-20 Page 95
Disclosures and Legal Compliance
2. Department outputsHow the Department operates
This section includes information regarding the nature of funding the Department receives and how this funding is utilised to achieve the Department’s objectives. This note also provides the distinction between controlled funding and administered funding:
Note
Department objectives 2.1
Schedule of Income and Expenses by Service 2.2
Schedule of Assets and Liability by Service 2.3
2.1 Department objectives
MissionThe Department’s mission is to plan and deliver transport solutions for the prosperity of Western Australians.
The Department is predominantly funded by user fees and charges determined by prevailing market forces. It is also funded by other controlled revenues and Parliamentary appropriations.
ServicesThe Department provides the following services:
Service 1: Strategic Transport Policy and Integrated Planning.Contributes towards the provision of leadership for strategic transport management, development and protection of economic nodes and networks through the provision of a range of services.
Service 2: Driver and Vehicle ServicesContributes towards the provision of safe, accessible, sustainable and efficient transport services and systems through the provision of driver licensing and vehicle registration services.
Service 3: Coastal InfrastructureContributes towards the Department’s outcome of an accessible and safe transport system through the provision of a range of coastal infrastructure services.
Service 4: Marine SafetyContributes towards the safe and sustainable use of navigable waters through the provision of a range of marine safety regulatory and education services.
Service 5: On-demand TransportProvides a regulatory environment that encourages competition and innovation in the on–demand transport industry to deliver safe, accessible and efficient on–demand transport services for our community.
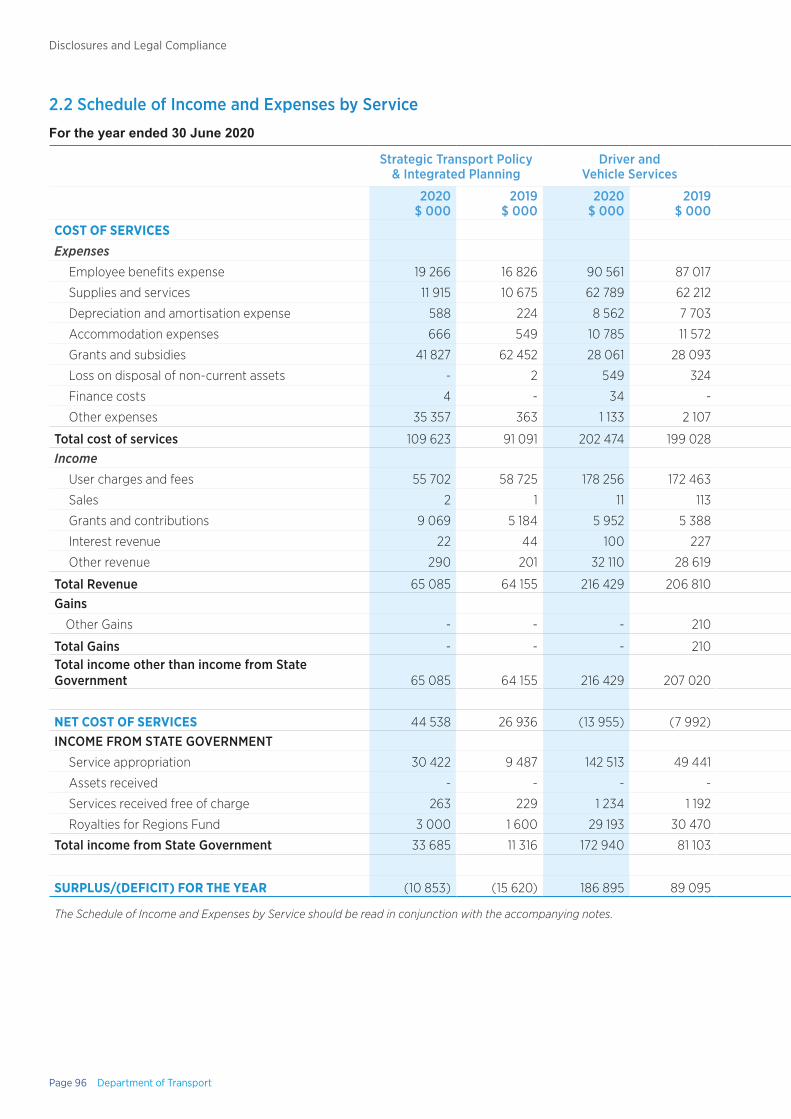
Page 96 Department of Transport
Disclosures and Legal Compliance
2.2 Schedule of Income and Expenses by Service
For the year ended 30 June 2020
Strategic Transport Policy & Integrated Planning
Driver and Vehicle Services Coastal Infrastructure Marine Safety On-demand Transport Total
2020$ 000
2019$ 000
2020$ 000
2019$ 000
2020$ 000
2019$ 000
2020$ 000
2019$ 000
2020$ 000
2019$ 000
2020$ 000
2019$ 000
COST OF SERVICESExpenses
Employee benefits expense 19 266 16 826 90 561 87 017 15 523 13 137 12 155 12 811 5 862 5 512 143 367 135 303 Supplies and services 11 915 10 675 62 789 62 212 34 821 32 750 7 595 7 228 2 067 1 848 119 187 114 713 Depreciation and amortisation expense 588 224 8 562 7 703 12 346 11 322 2 121 1 391 402 391 24 019 21 031 Accommodation expenses 666 549 10 785 11 572 3 688 3 411 1 524 1 661 807 784 17 470 17 977 Grants and subsidies 41 827 62 452 28 061 28 093 5 312 10 619 924 1 306 137 867 16 574 213 991 119 044 Loss on disposal of non-current assets - 2 549 324 34 61 87 61 876 2 1 546 450 Finance costs 4 - 34 - 43 - 31 - 2 - 114 - Other expenses 35 357 363 1 133 2 107 1 207 (3 243) 523 4 234 2 179 185 40 399 3 646
Total cost of services 109 623 91 091 202 474 199 028 72 974 68 057 24 960 28 692 150 062 25 296 560 093 412 164Income
User charges and fees 55 702 58 725 178 256 172 463 14 243 14 353 21 450 20 587 2 901 5 768 272 552 272 017 Sales 2 1 11 113 37 1 24 36 1 - 75 30 Grants and contributions 9 069 5 184 5 952 5 388 377 14 4 13 2 6 15 404 10 605 Interest revenue 22 44 100 227 22 39 14 31 6 240 164 581 Other revenue 290 201 32 110 28 619 24 998 27 261 380 123 210 146 57 988 56 350
Total Revenue 65 085 64 155 216 429 206 810 39 677 41 668 21 872 20 790 3 120 6 160 346 183 339 583Gains
Other Gains - - - 210 4 726 2 316 - - - - 4 726 2 526
Total Gains - - - 210 4 726 2 316 - - - - 4 726 2 526Total income other than income from State Government 65 085 64 155 216 429 207 020 44 403 43 984 21 872 20 790 3 120 6 160 350 909 342 109
NET COST OF SERVICES 44 538 26 936 (13 955) (7 992) 28 571 24 073 3 088 7 902 146 942 19 136 209 184 70 055INCOME FROM STATE GOVERNMENT
Service appropriation 30 422 9 487 142 513 49 441 24 660 7 478 18 990 6 723 9 565 3 214 226 150 76 343
Assets received - - - - - (62) - 27 - - - (35)
Services received free of charge 263 229 1 234 1 192 214 180 164 162 83 78 1 958 1 841
Royalties for Regions Fund 3 000 1 600 29 193 30 470 213 5 416 34 30 112 3 108 32 552 40 624
Total income from State Government 33 685 11 316 172 940 81 103 25 087 13 012 19 188 6 942 9 760 6 400 260 660 118 773
SURPLUS/(DEFICIT) FOR THE YEAR (10 853) (15 620) 186 895 89 095 (3 484) (11 061) 16 100 (960) (137 182) (12 736) 51 476 48 718
The Schedule of Income and Expenses by Service should be read in conjunction with the accompanying notes.
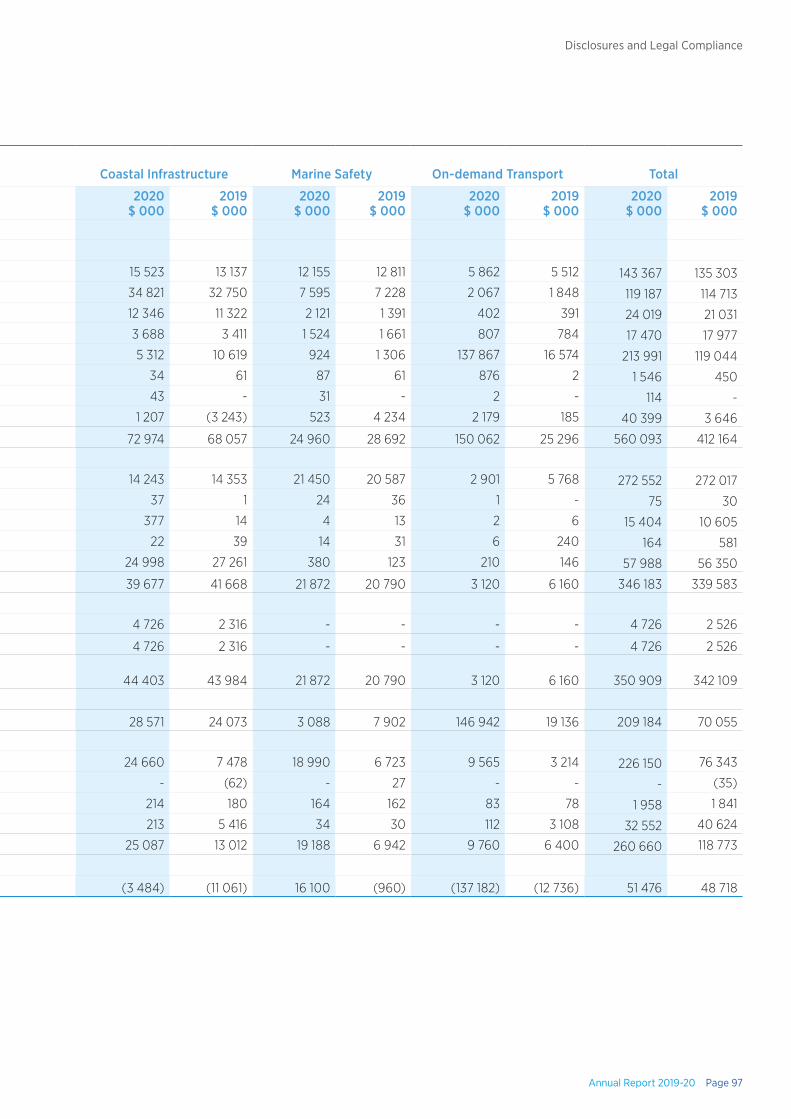
Annual Report 2019-20 Page 97
Disclosures and Legal Compliance
2.2 Schedule of Income and Expenses by Service
For the year ended 30 June 2020
Strategic Transport Policy & Integrated Planning
Driver and Vehicle Services Coastal Infrastructure Marine Safety On-demand Transport Total
2020$ 000
2019$ 000
2020$ 000
2019$ 000
2020$ 000
2019$ 000
2020$ 000
2019$ 000
2020$ 000
2019$ 000
2020$ 000
2019$ 000
COST OF SERVICESExpenses
Employee benefits expense 19 266 16 826 90 561 87 017 15 523 13 137 12 155 12 811 5 862 5 512 143 367 135 303 Supplies and services 11 915 10 675 62 789 62 212 34 821 32 750 7 595 7 228 2 067 1 848 119 187 114 713 Depreciation and amortisation expense 588 224 8 562 7 703 12 346 11 322 2 121 1 391 402 391 24 019 21 031 Accommodation expenses 666 549 10 785 11 572 3 688 3 411 1 524 1 661 807 784 17 470 17 977 Grants and subsidies 41 827 62 452 28 061 28 093 5 312 10 619 924 1 306 137 867 16 574 213 991 119 044 Loss on disposal of non-current assets - 2 549 324 34 61 87 61 876 2 1 546 450 Finance costs 4 - 34 - 43 - 31 - 2 - 114 - Other expenses 35 357 363 1 133 2 107 1 207 (3 243) 523 4 234 2 179 185 40 399 3 646
Total cost of services 109 623 91 091 202 474 199 028 72 974 68 057 24 960 28 692 150 062 25 296 560 093 412 164Income
User charges and fees 55 702 58 725 178 256 172 463 14 243 14 353 21 450 20 587 2 901 5 768 272 552 272 017 Sales 2 1 11 113 37 1 24 36 1 - 75 30 Grants and contributions 9 069 5 184 5 952 5 388 377 14 4 13 2 6 15 404 10 605 Interest revenue 22 44 100 227 22 39 14 31 6 240 164 581 Other revenue 290 201 32 110 28 619 24 998 27 261 380 123 210 146 57 988 56 350
Total Revenue 65 085 64 155 216 429 206 810 39 677 41 668 21 872 20 790 3 120 6 160 346 183 339 583Gains
Other Gains - - - 210 4 726 2 316 - - - - 4 726 2 526
Total Gains - - - 210 4 726 2 316 - - - - 4 726 2 526Total income other than income from State Government 65 085 64 155 216 429 207 020 44 403 43 984 21 872 20 790 3 120 6 160 350 909 342 109
NET COST OF SERVICES 44 538 26 936 (13 955) (7 992) 28 571 24 073 3 088 7 902 146 942 19 136 209 184 70 055INCOME FROM STATE GOVERNMENT
Service appropriation 30 422 9 487 142 513 49 441 24 660 7 478 18 990 6 723 9 565 3 214 226 150 76 343
Assets received - - - - - (62) - 27 - - - (35)
Services received free of charge 263 229 1 234 1 192 214 180 164 162 83 78 1 958 1 841
Royalties for Regions Fund 3 000 1 600 29 193 30 470 213 5 416 34 30 112 3 108 32 552 40 624
Total income from State Government 33 685 11 316 172 940 81 103 25 087 13 012 19 188 6 942 9 760 6 400 260 660 118 773
SURPLUS/(DEFICIT) FOR THE YEAR (10 853) (15 620) 186 895 89 095 (3 484) (11 061) 16 100 (960) (137 182) (12 736) 51 476 48 718
The Schedule of Income and Expenses by Service should be read in conjunction with the accompanying notes.
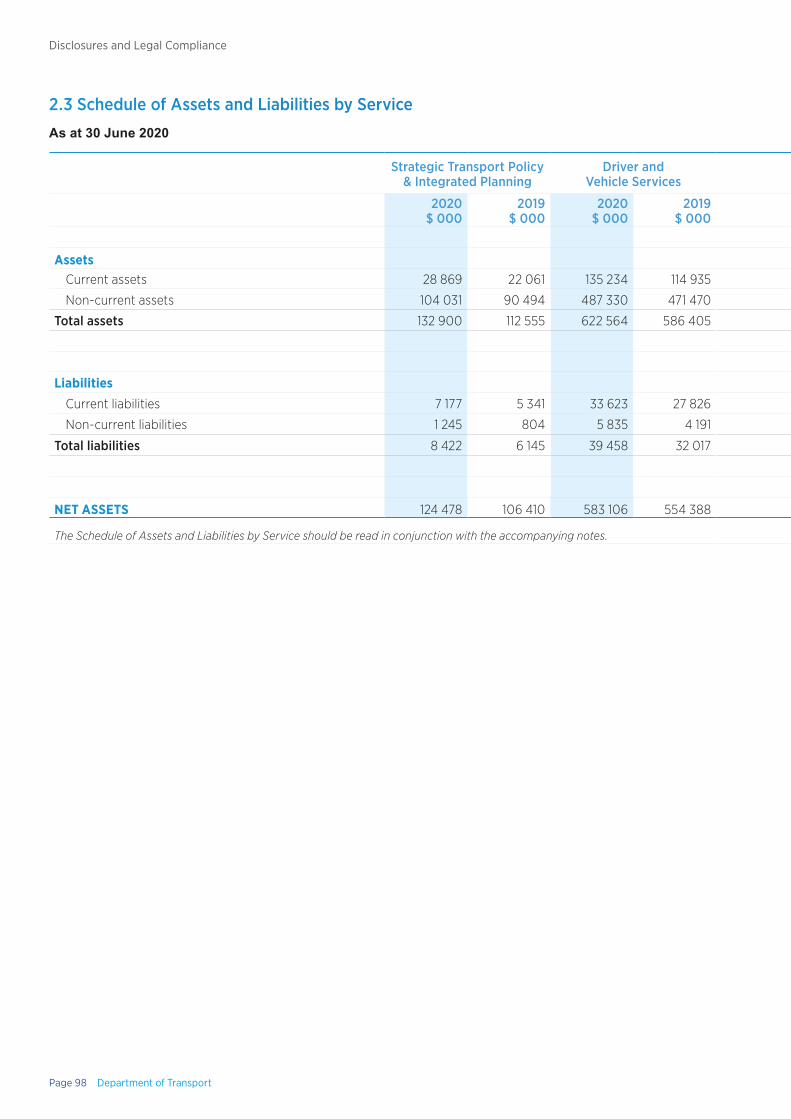
Page 98 Department of Transport
Disclosures and Legal Compliance
2.3 Schedule of Assets and Liabilities by Service
As at 30 June 2020
Strategic Transport Policy & Integrated Planning
Driver and Vehicle Services Coastal Infrastructure Marine Safety On-demand Transport Total
2020$ 000
2019$ 000
2020$ 000
2019$ 000
2020$ 000
2019$ 000
2020$ 000
2019$ 000
2020$ 000
2019$ 000
2020$ 000
2019$ 000
AssetsCurrent assets 28 869 22 061 135 234 114 935 23 401 17 375 18 020 15 636 9 076 7 471 214 600 177 478
Non-current assets 104 031 90 494 487 330 471 470 84 326 71 274 64 939 64 139 32 705 30 649 773 331 728 027
Total assets 132 900 112 555 622 564 586 405 107 727 88 649 82 959 79 775 41 781 38 120 987 931 905 505
LiabilitiesCurrent liabilities 7 177 5 341 33 623 27 826 5 818 4 207 4 480 3 785 2 257 1 809 53 355 42 968
Non-current liabilities 1 245 804 5 835 4 191 1 010 633 777 571 392 272 9 259 6 471
Total liabilities 8 422 6 145 39 458 32 017 6 828 4 840 5 257 4 356 2 649 2 081 62 614 49 439
NET ASSETS 124 478 106 410 583 106 554 388 100 899 83 809 77 702 75 420 39 132 36 040 925 317 856 066
The Schedule of Assets and Liabilities by Service should be read in conjunction with the accompanying notes.
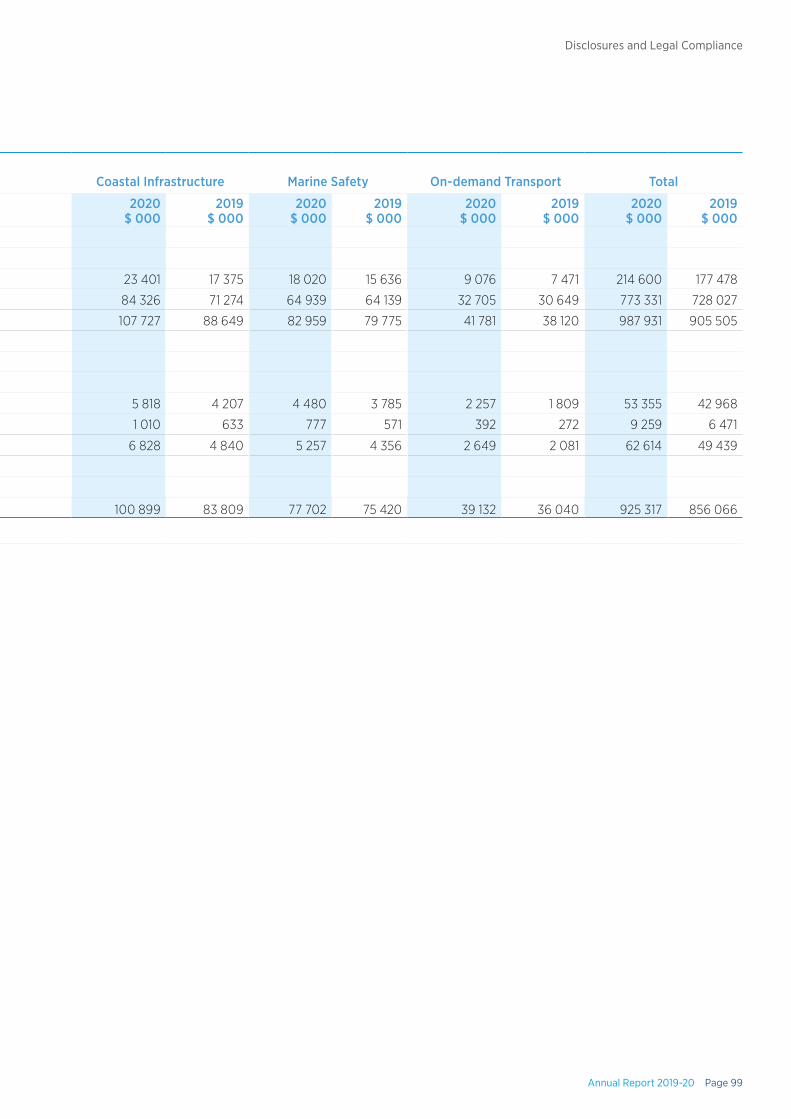
Annual Report 2019-20 Page 99
Disclosures and Legal Compliance
2.3 Schedule of Assets and Liabilities by Service
As at 30 June 2020
Strategic Transport Policy & Integrated Planning
Driver and Vehicle Services Coastal Infrastructure Marine Safety On-demand Transport Total
2020$ 000
2019$ 000
2020$ 000
2019$ 000
2020$ 000
2019$ 000
2020$ 000
2019$ 000
2020$ 000
2019$ 000
2020$ 000
2019$ 000
AssetsCurrent assets 28 869 22 061 135 234 114 935 23 401 17 375 18 020 15 636 9 076 7 471 214 600 177 478
Non-current assets 104 031 90 494 487 330 471 470 84 326 71 274 64 939 64 139 32 705 30 649 773 331 728 027
Total assets 132 900 112 555 622 564 586 405 107 727 88 649 82 959 79 775 41 781 38 120 987 931 905 505
LiabilitiesCurrent liabilities 7 177 5 341 33 623 27 826 5 818 4 207 4 480 3 785 2 257 1 809 53 355 42 968
Non-current liabilities 1 245 804 5 835 4 191 1 010 633 777 571 392 272 9 259 6 471
Total liabilities 8 422 6 145 39 458 32 017 6 828 4 840 5 257 4 356 2 649 2 081 62 614 49 439
NET ASSETS 124 478 106 410 583 106 554 388 100 899 83 809 77 702 75 420 39 132 36 040 925 317 856 066
The Schedule of Assets and Liabilities by Service should be read in conjunction with the accompanying notes.
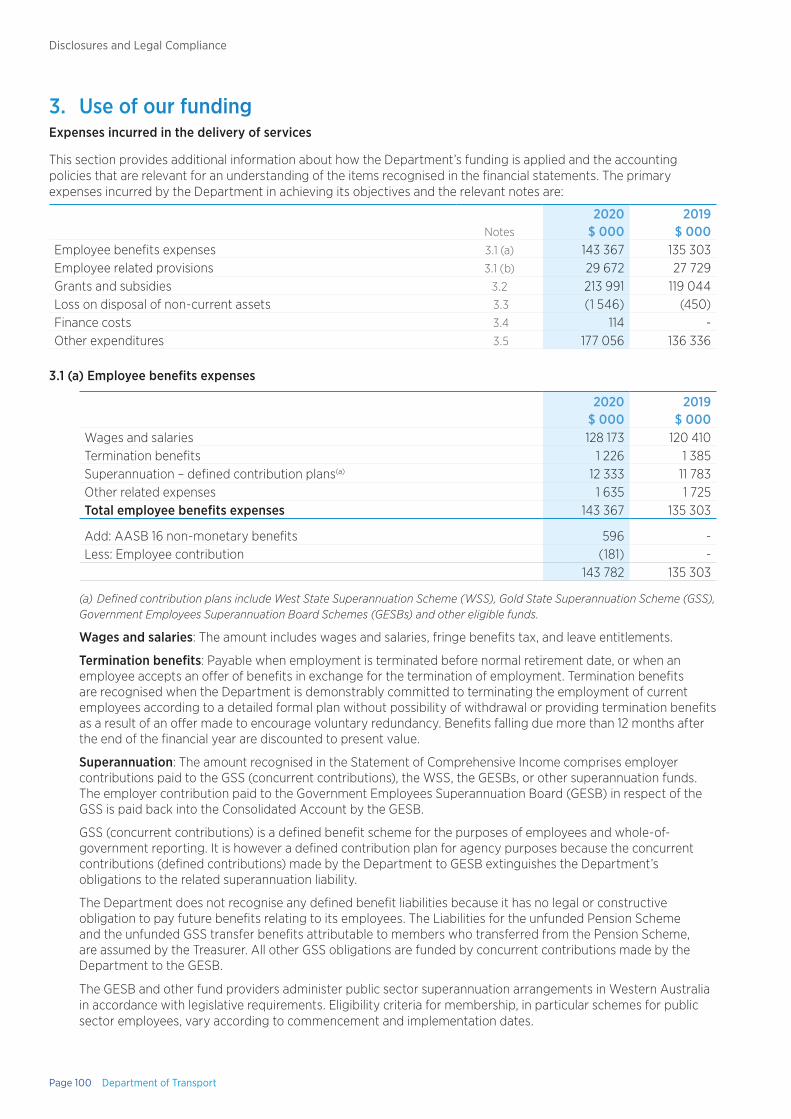
Page 100 Department of Transport
Disclosures and Legal Compliance
3. Use of our fundingExpenses incurred in the delivery of services
This section provides additional information about how the Department’s funding is applied and the accounting policies that are relevant for an understanding of the items recognised in the financial statements. The primary expenses incurred by the Department in achieving its objectives and the relevant notes are:
Notes2020
$ 0002019
$ 000Employee benefits expenses 3.1 (a) 143 367 135 303Employee related provisions 3.1 (b) 29 672 27 729Grants and subsidies 3.2 213 991 119 044Loss on disposal of non-current assets 3.3 (1 546) (450)Finance costs 3.4 114 -Other expenditures 3.5 177 056 136 336
3.1 (a) Employee benefits expenses
2020$ 000
2019$ 000
Wages and salaries 128 173 120 410Termination benefits 1 226 1 385Superannuation – defined contribution plans(a) 12 333 11 783Other related expenses 1 635 1 725Total employee benefits expenses 143 367 135 303
Add: AASB 16 non-monetary benefits 596 -Less: Employee contribution (181) -
143 782 135 303
(a) Defined contribution plans include West State Superannuation Scheme (WSS), Gold State Superannuation Scheme (GSS), Government Employees Superannuation Board Schemes (GESBs) and other eligible funds.
Wages and salaries: The amount includes wages and salaries, fringe benefits tax, and leave entitlements.
Termination benefits: Payable when employment is terminated before normal retirement date, or when an employee accepts an offer of benefits in exchange for the termination of employment. Termination benefits are recognised when the Department is demonstrably committed to terminating the employment of current employees according to a detailed formal plan without possibility of withdrawal or providing termination benefits as a result of an offer made to encourage voluntary redundancy. Benefits falling due more than 12 months after the end of the financial year are discounted to present value.
Superannuation: The amount recognised in the Statement of Comprehensive Income comprises employer contributions paid to the GSS (concurrent contributions), the WSS, the GESBs, or other superannuation funds. The employer contribution paid to the Government Employees Superannuation Board (GESB) in respect of the GSS is paid back into the Consolidated Account by the GESB.
GSS (concurrent contributions) is a defined benefit scheme for the purposes of employees and whole-of-government reporting. It is however a defined contribution plan for agency purposes because the concurrent contributions (defined contributions) made by the Department to GESB extinguishes the Department’s obligations to the related superannuation liability.
The Department does not recognise any defined benefit liabilities because it has no legal or constructive obligation to pay future benefits relating to its employees. The Liabilities for the unfunded Pension Scheme and the unfunded GSS transfer benefits attributable to members who transferred from the Pension Scheme, are assumed by the Treasurer. All other GSS obligations are funded by concurrent contributions made by the Department to the GESB.
The GESB and other fund providers administer public sector superannuation arrangements in Western Australia in accordance with legislative requirements. Eligibility criteria for membership, in particular schemes for public sector employees, vary according to commencement and implementation dates.
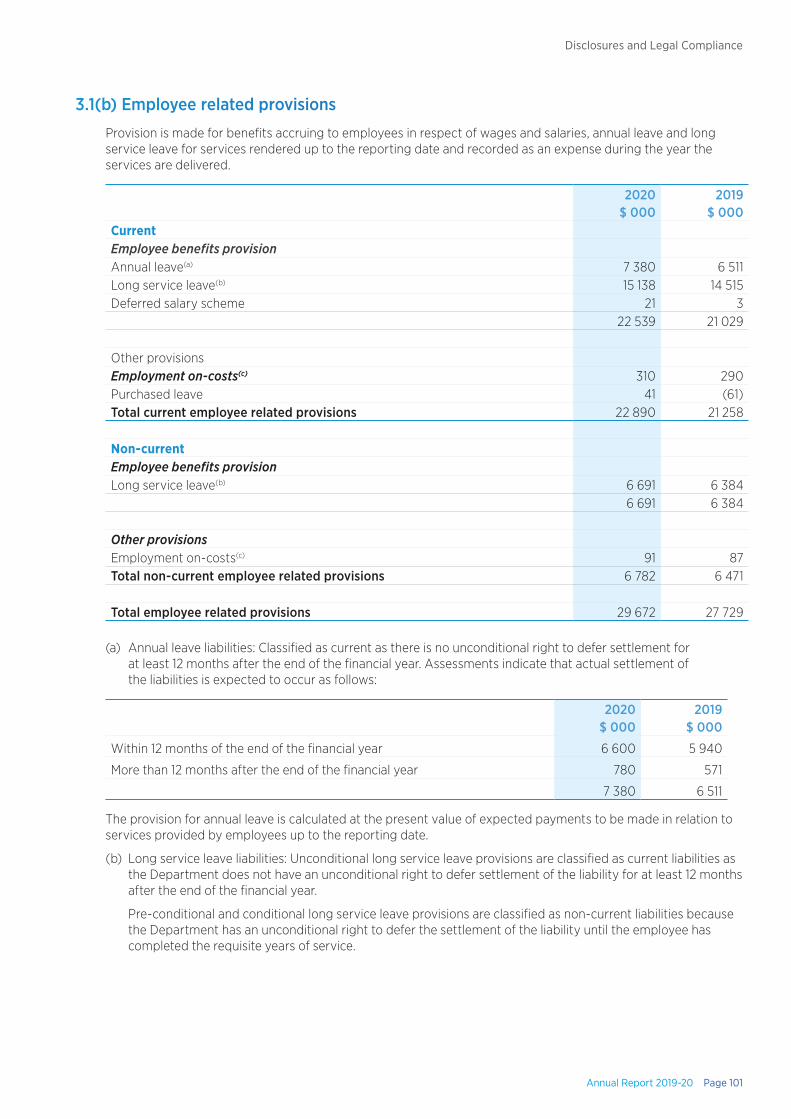
Annual Report 2019-20 Page 101
Disclosures and Legal Compliance
3.1(b) Employee related provisions
Provision is made for benefits accruing to employees in respect of wages and salaries, annual leave and long service leave for services rendered up to the reporting date and recorded as an expense during the year the services are delivered.
2020$ 000
2019$ 000
CurrentEmployee benefits provisionAnnual leave(a) 7 380 6 511Long service leave(b) 15 138 14 515Deferred salary scheme 21 3
22 539 21 029
Other provisionsEmployment on-costs(c) 310 290Purchased leave 41 (61)Total current employee related provisions 22 890 21 258
Non-currentEmployee benefits provisionLong service leave(b) 6 691 6 384
6 691 6 384
Other provisionsEmployment on-costs(c) 91 87Total non-current employee related provisions 6 782 6 471
Total employee related provisions 29 672 27 729
(a) Annual leave liabilities: Classified as current as there is no unconditional right to defer settlement for at least 12 months after the end of the financial year. Assessments indicate that actual settlement of the liabilities is expected to occur as follows:
2020$ 000
2019$ 000
Within 12 months of the end of the financial year 6 600 5 940
More than 12 months after the end of the financial year 780 571
7 380 6 511
The provision for annual leave is calculated at the present value of expected payments to be made in relation to services provided by employees up to the reporting date.
(b) Long service leave liabilities: Unconditional long service leave provisions are classified as current liabilities as the Department does not have an unconditional right to defer settlement of the liability for at least 12 months after the end of the financial year.
Pre-conditional and conditional long service leave provisions are classified as non-current liabilities because the Department has an unconditional right to defer the settlement of the liability until the employee has completed the requisite years of service.
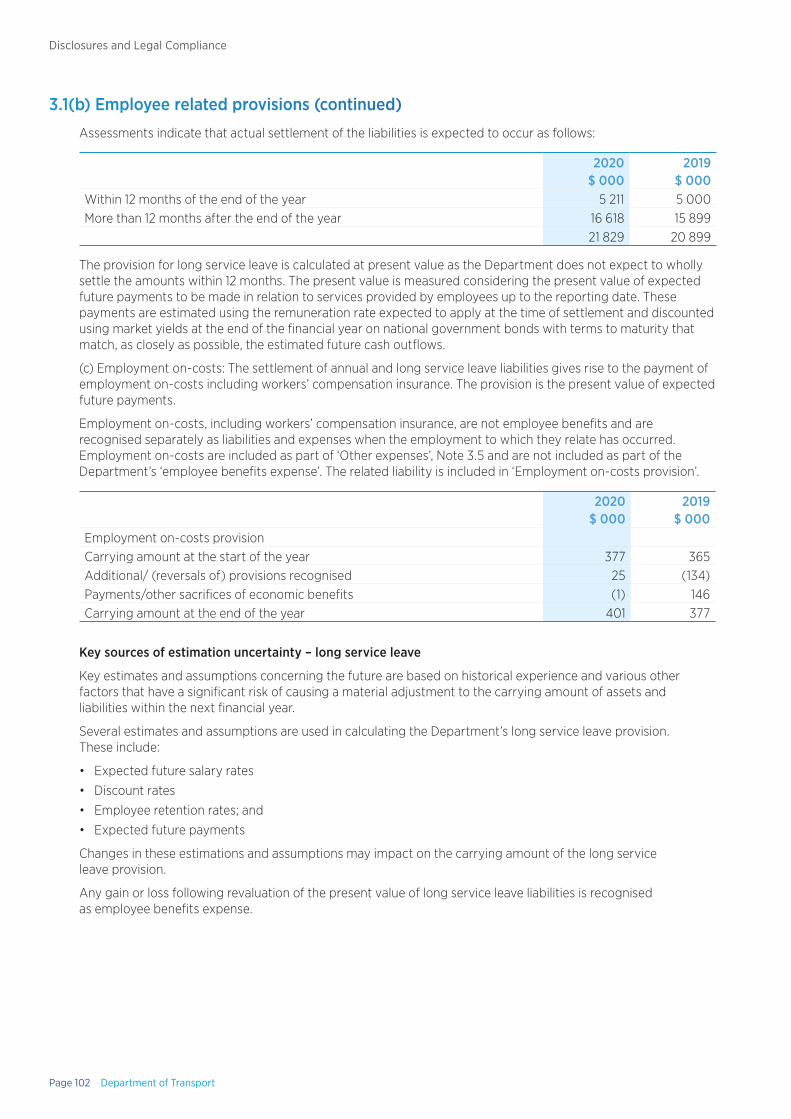
Page 102 Department of Transport
Disclosures and Legal Compliance
3.1(b) Employee related provisions (continued)
Assessments indicate that actual settlement of the liabilities is expected to occur as follows:
2020$ 000
2019$ 000
Within 12 months of the end of the year 5 211 5 000More than 12 months after the end of the year 16 618 15 899
21 829 20 899
The provision for long service leave is calculated at present value as the Department does not expect to wholly settle the amounts within 12 months. The present value is measured considering the present value of expected future payments to be made in relation to services provided by employees up to the reporting date. These payments are estimated using the remuneration rate expected to apply at the time of settlement and discounted using market yields at the end of the financial year on national government bonds with terms to maturity that match, as closely as possible, the estimated future cash outflows.
(c) Employment on-costs: The settlement of annual and long service leave liabilities gives rise to the payment of employment on-costs including workers’ compensation insurance. The provision is the present value of expected future payments.
Employment on-costs, including workers’ compensation insurance, are not employee benefits and are recognised separately as liabilities and expenses when the employment to which they relate has occurred. Employment on-costs are included as part of ‘Other expenses’, Note 3.5 and are not included as part of the Department’s ‘employee benefits expense’. The related liability is included in ‘Employment on-costs provision’.
2020$ 000
2019$ 000
Employment on-costs provisionCarrying amount at the start of the year 377 365Additional/ (reversals of) provisions recognised 25 (134)Payments/other sacrifices of economic benefits (1) 146Carrying amount at the end of the year 401 377
Key sources of estimation uncertainty – long service leave
Key estimates and assumptions concerning the future are based on historical experience and various other factors that have a significant risk of causing a material adjustment to the carrying amount of assets and liabilities within the next financial year.
Several estimates and assumptions are used in calculating the Department’s long service leave provision. These include:
• Expected future salary rates
• Discount rates
• Employee retention rates; and
• Expected future payments
Changes in these estimations and assumptions may impact on the carrying amount of the long service leave provision.
Any gain or loss following revaluation of the present value of long service leave liabilities is recognised as employee benefits expense.
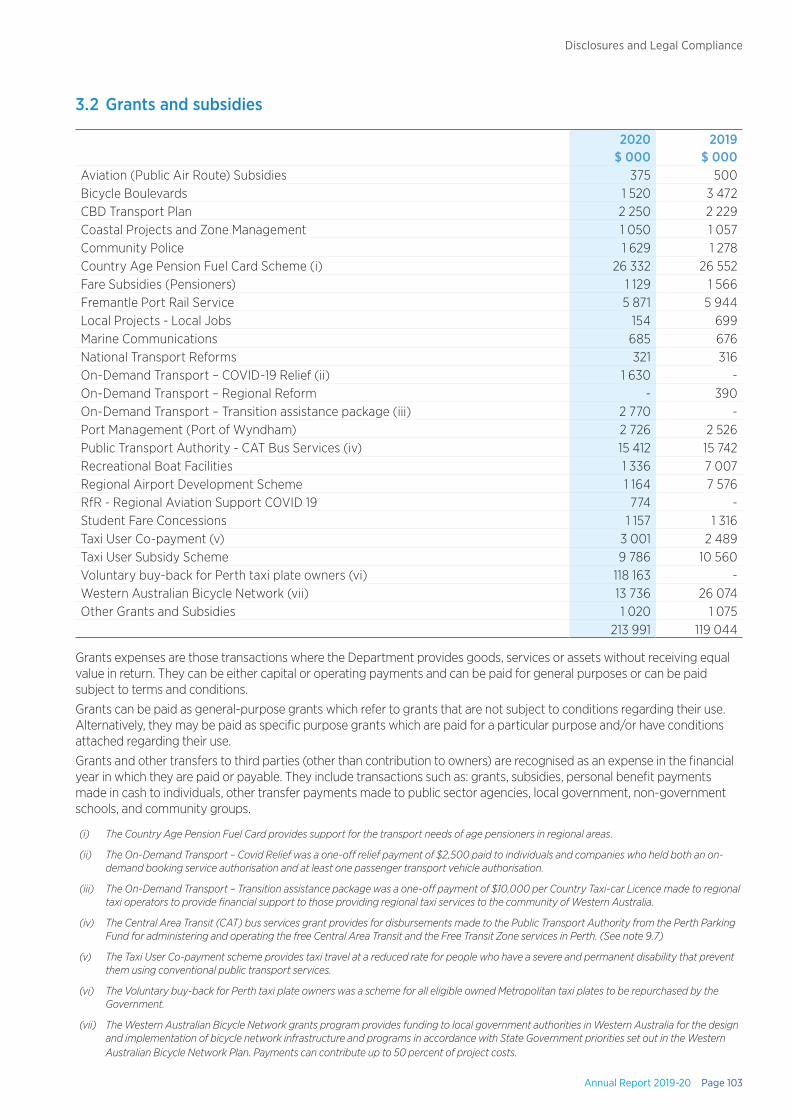
Annual Report 2019-20 Page 103
Disclosures and Legal Compliance
3.2 Grants and subsidies
2020$ 000
2019$ 000
Aviation (Public Air Route) Subsidies 375 500Bicycle Boulevards 1 520 3 472CBD Transport Plan 2 250 2 229Coastal Projects and Zone Management 1 050 1 057Community Police 1 629 1 278Country Age Pension Fuel Card Scheme (i) 26 332 26 552Fare Subsidies (Pensioners) 1 129 1 566Fremantle Port Rail Service 5 871 5 944Local Projects - Local Jobs 154 699Marine Communications 685 676National Transport Reforms 321 316On-Demand Transport – COVID-19 Relief (ii) 1 630 -On-Demand Transport – Regional Reform - 390On-Demand Transport – Transition assistance package (iii) 2 770 -Port Management (Port of Wyndham) 2 726 2 526Public Transport Authority - CAT Bus Services (iv) 15 412 15 742Recreational Boat Facilities 1 336 7 007Regional Airport Development Scheme 1 164 7 576RfR - Regional Aviation Support COVID 19 774 -Student Fare Concessions 1 157 1 316Taxi User Co-payment (v) 3 001 2 489Taxi User Subsidy Scheme 9 786 10 560Voluntary buy-back for Perth taxi plate owners (vi) 118 163 -Western Australian Bicycle Network (vii) 13 736 26 074Other Grants and Subsidies 1 020 1 075
213 991 119 044
Grants expenses are those transactions where the Department provides goods, services or assets without receiving equal value in return. They can be either capital or operating payments and can be paid for general purposes or can be paid subject to terms and conditions.
Grants can be paid as general-purpose grants which refer to grants that are not subject to conditions regarding their use. Alternatively, they may be paid as specific purpose grants which are paid for a particular purpose and/or have conditions attached regarding their use.
Grants and other transfers to third parties (other than contribution to owners) are recognised as an expense in the financial year in which they are paid or payable. They include transactions such as: grants, subsidies, personal benefit payments made in cash to individuals, other transfer payments made to public sector agencies, local government, non-government schools, and community groups.
(i) The Country Age Pension Fuel Card provides support for the transport needs of age pensioners in regional areas.
(ii) The On-Demand Transport – Covid Relief was a one-off relief payment of $2,500 paid to individuals and companies who held both an on-demand booking service authorisation and at least one passenger transport vehicle authorisation.
(iii) The On-Demand Transport – Transition assistance package was a one-off payment of $10,000 per Country Taxi-car Licence made to regional taxi operators to provide financial support to those providing regional taxi services to the community of Western Australia.
(iv) The Central Area Transit (CAT) bus services grant provides for disbursements made to the Public Transport Authority from the Perth Parking Fund for administering and operating the free Central Area Transit and the Free Transit Zone services in Perth. (See note 9.7)
(v) The Taxi User Co-payment scheme provides taxi travel at a reduced rate for people who have a severe and permanent disability that prevent them using conventional public transport services.
(vi) The Voluntary buy-back for Perth taxi plate owners was a scheme for all eligible owned Metropolitan taxi plates to be repurchased by the Government.
(vii) The Western Australian Bicycle Network grants program provides funding to local government authorities in Western Australia for the design and implementation of bicycle network infrastructure and programs in accordance with State Government priorities set out in the Western Australian Bicycle Network Plan. Payments can contribute up to 50 percent of project costs.
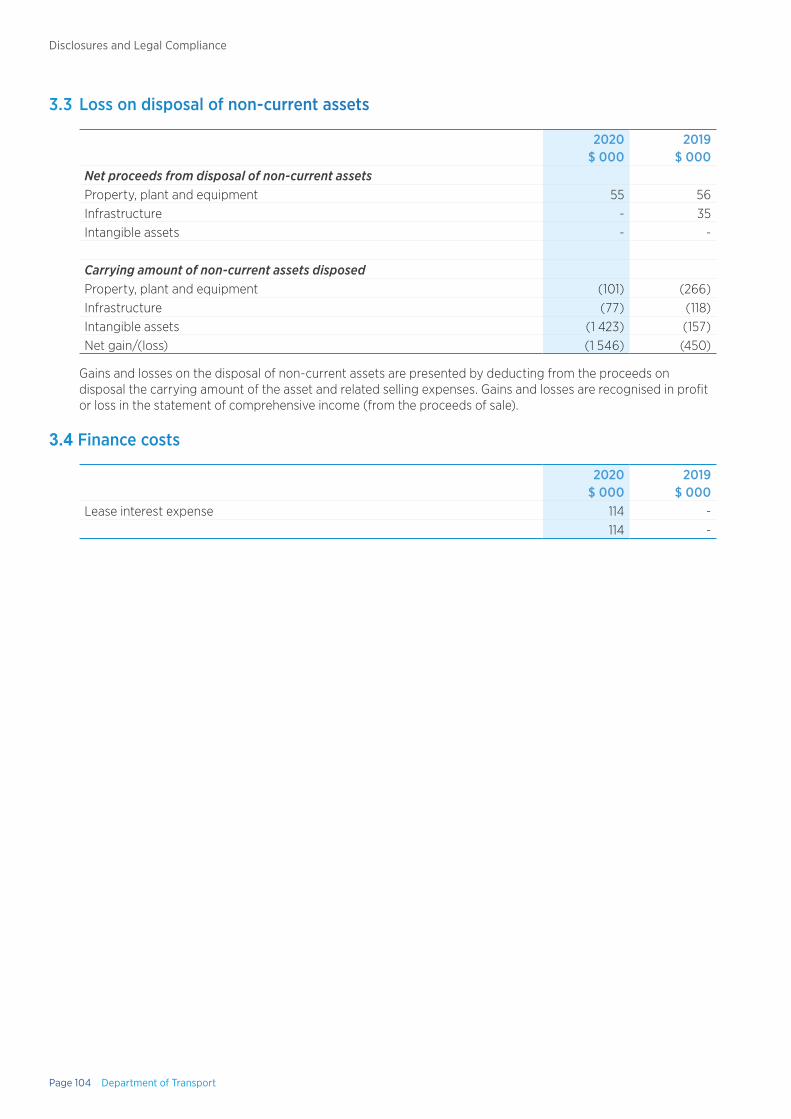
Page 104 Department of Transport
Disclosures and Legal Compliance
3.3 Loss on disposal of non-current assets
2020$ 000
2019$ 000
Net proceeds from disposal of non-current assetsProperty, plant and equipment 55 56Infrastructure - 35Intangible assets - -
Carrying amount of non-current assets disposedProperty, plant and equipment (101) (266)Infrastructure (77) (118)Intangible assets (1 423) (157)Net gain/(loss) (1 546) (450)
Gains and losses on the disposal of non-current assets are presented by deducting from the proceeds on disposal the carrying amount of the asset and related selling expenses. Gains and losses are recognised in profit or loss in the statement of comprehensive income (from the proceeds of sale).
3.4 Finance costs
2020$ 000
2019$ 000
Lease interest expense 114 -114 -
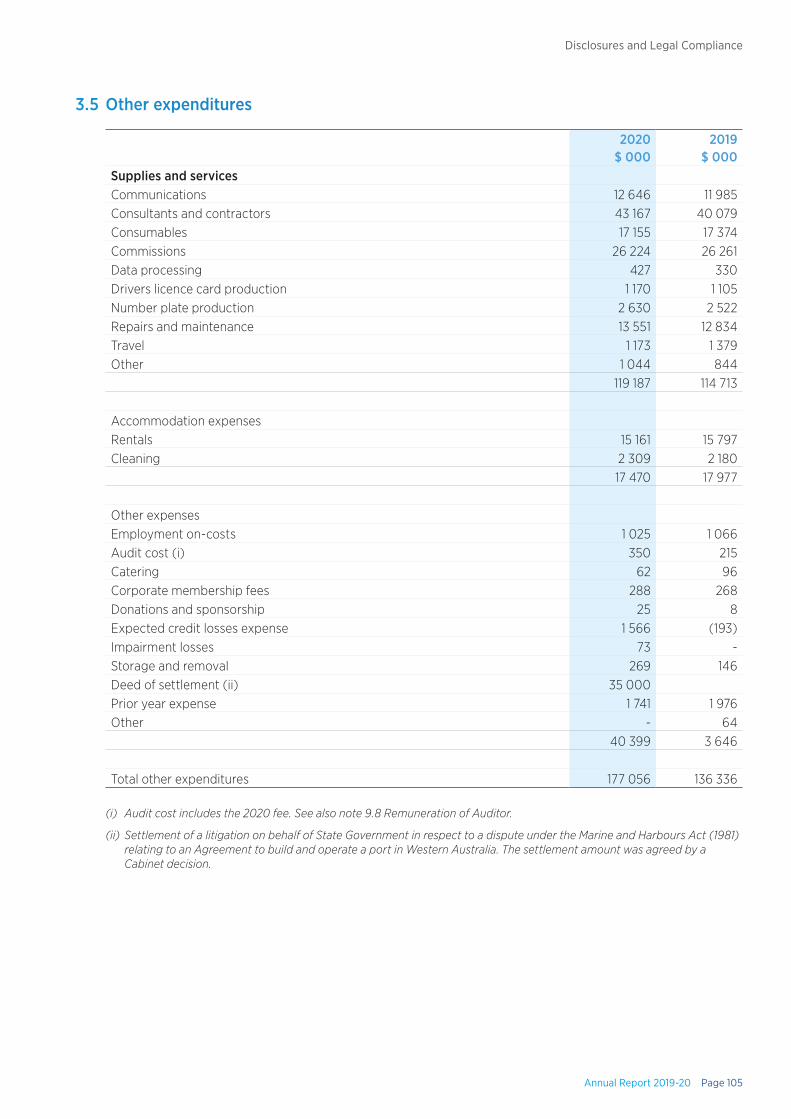
Annual Report 2019-20 Page 105
Disclosures and Legal Compliance
3.5 Other expenditures
2020$ 000
2019$ 000
Supplies and servicesCommunications 12 646 11 985Consultants and contractors 43 167 40 079Consumables 17 155 17 374Commissions 26 224 26 261Data processing 427 330Drivers licence card production 1 170 1 105Number plate production 2 630 2 522Repairs and maintenance 13 551 12 834Travel 1 173 1 379Other 1 044 844
119 187 114 713
Accommodation expensesRentals 15 161 15 797Cleaning 2 309 2 180
17 470 17 977
Other expensesEmployment on-costs 1 025 1 066Audit cost (i) 350 215Catering 62 96Corporate membership fees 288 268Donations and sponsorship 25 8Expected credit losses expense 1 566 (193)Impairment losses 73 -Storage and removal 269 146Deed of settlement (ii) 35 000Prior year expense 1 741 1 976Other - 64
40 399 3 646
Total other expenditures 177 056 136 336
(i) Audit cost includes the 2020 fee. See also note 9.8 Remuneration of Auditor.
(ii) Settlement of a litigation on behalf of State Government in respect to a dispute under the Marine and Harbours Act (1981) relating to an Agreement to build and operate a port in Western Australia. The settlement amount was agreed by a Cabinet decision.
Page 106 Department of Transport
Disclosures and Legal Compliance
3.5 Other expenditures (continued)
Supplies and services: Supplies and services are recognised as an expense in the financial year in which they are incurred. The carrying amounts of any materials held for distribution are expensed when the materials are distributed.
Repairs and maintenance: Repairs and maintenance costs are recognised as expenses as incurred, except where they relate to the replacement of a significant component of an asset. In that case, the costs are capitalised and depreciated.
Consumables: Consumables expenses include short-term leases with a lease term of 12 months or less and low-value leases with an underlying value of $5,000 or less.
Other expenses: Other expenses generally represent the day-to-day running costs incurred in normal operations.
Expected credit losses: Expected credit losses is an allowance of trade receivables, measured at the lifetime expected credit losses at each reporting date. The Department has established a provision matrix that is based on its historical credit loss experience, adjusted for forward-looking factors specific to the debtors and the economic environment.
Please refer to note 6.1.1 Movement in the allowance for impairment of receivables.
Employee on-cost: Employee on-costs include workers’ compensation insurance and other employment on-costs. The on-costs liability associated with the recognition of annual and long service leave liabilities is included at Note 3.1(b) Employee related provision. Superannuation contributions accrued as part of the provision for leave are employee benefits and are not included in employment on-costs.
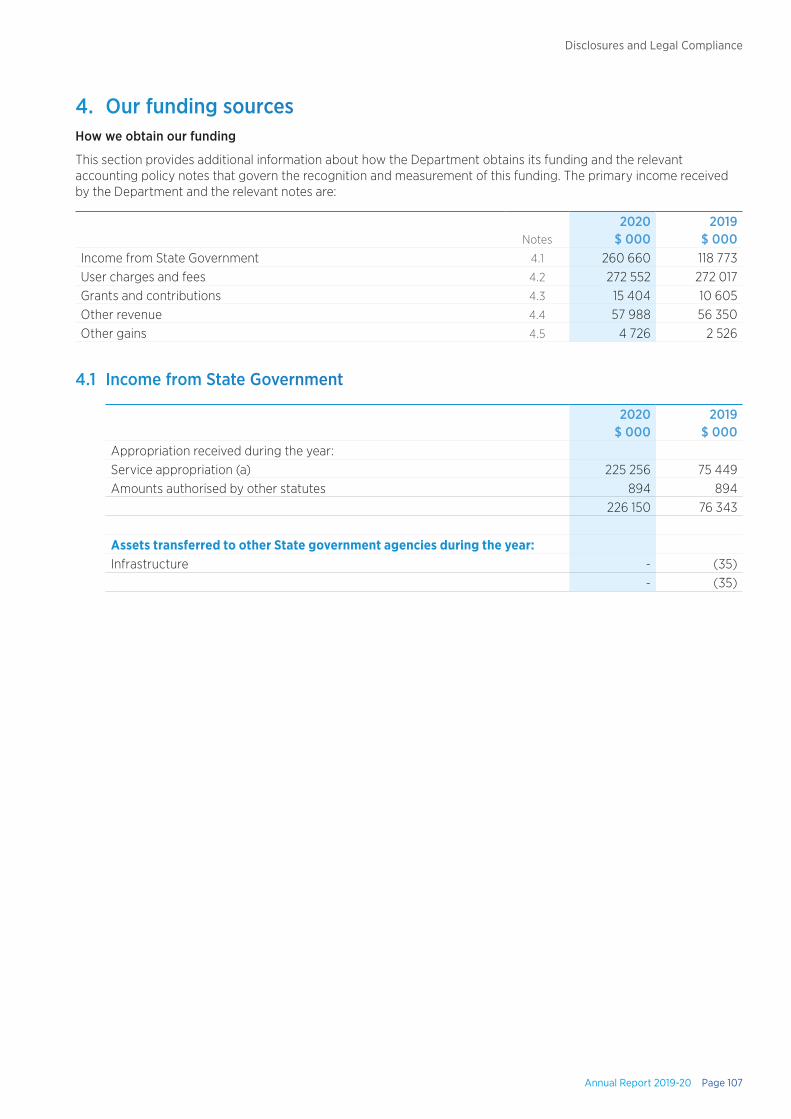
Annual Report 2019-20 Page 107
Disclosures and Legal Compliance
4. Our funding sourcesHow we obtain our funding
This section provides additional information about how the Department obtains its funding and the relevant accounting policy notes that govern the recognition and measurement of this funding. The primary income received by the Department and the relevant notes are:
Notes2020
$ 0002019
$ 000Income from State Government 4.1 260 660 118 773User charges and fees 4.2 272 552 272 017Grants and contributions 4.3 15 404 10 605Other revenue 4.4 57 988 56 350Other gains 4.5 4 726 2 526
4.1 Income from State Government
2020$ 000
2019$ 000
Appropriation received during the year:Service appropriation (a) 225 256 75 449Amounts authorised by other statutes 894 894
226 150 76 343
Assets transferred to other State government agencies during the year: Infrastructure - (35)
- (35)
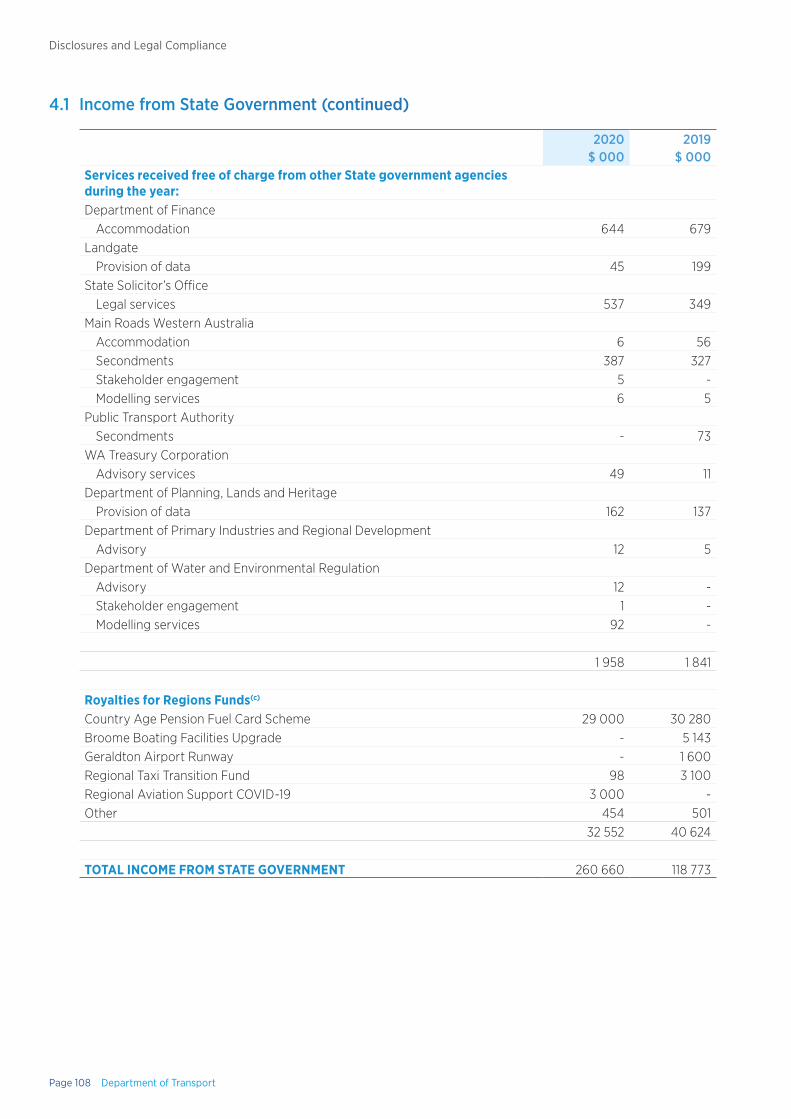
Page 108 Department of Transport
Disclosures and Legal Compliance
4.1 Income from State Government (continued)
2020$ 000
2019$ 000
Services received free of charge from other State government agencies during the year:Department of Finance
Accommodation 644 679Landgate
Provision of data 45 199State Solicitor’s Office
Legal services 537 349Main Roads Western Australia
Accommodation 6 56Secondments 387 327Stakeholder engagement 5 -Modelling services 6 5
Public Transport AuthoritySecondments - 73
WA Treasury CorporationAdvisory services 49 11
Department of Planning, Lands and HeritageProvision of data 162 137
Department of Primary Industries and Regional DevelopmentAdvisory 12 5
Department of Water and Environmental RegulationAdvisory 12 -Stakeholder engagement 1 -Modelling services 92 -
1 958 1 841
Royalties for Regions Funds(c)
Country Age Pension Fuel Card Scheme 29 000 30 280Broome Boating Facilities Upgrade - 5 143Geraldton Airport Runway - 1 600Regional Taxi Transition Fund 98 3 100Regional Aviation Support COVID-19 3 000 -Other 454 501
32 552 40 624
TOTAL INCOME FROM STATE GOVERNMENT 260 660 118 773
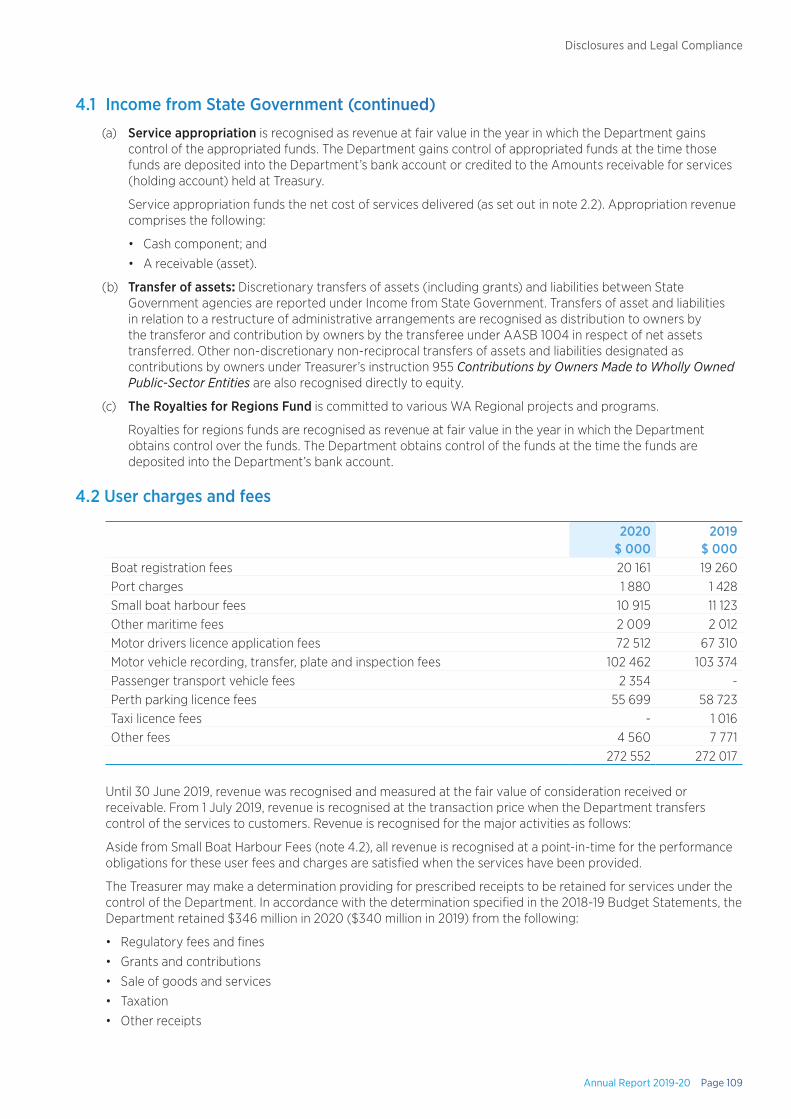
Annual Report 2019-20 Page 109
Disclosures and Legal Compliance
4.1 Income from State Government (continued)
(a) Service appropriation is recognised as revenue at fair value in the year in which the Department gains control of the appropriated funds. The Department gains control of appropriated funds at the time those funds are deposited into the Department’s bank account or credited to the Amounts receivable for services (holding account) held at Treasury.
Service appropriation funds the net cost of services delivered (as set out in note 2.2). Appropriation revenue comprises the following:
• Cash component; and
• A receivable (asset).
(b) Transfer of assets: Discretionary transfers of assets (including grants) and liabilities between State Government agencies are reported under Income from State Government. Transfers of asset and liabilities in relation to a restructure of administrative arrangements are recognised as distribution to owners by the transferor and contribution by owners by the transferee under AASB 1004 in respect of net assets transferred. Other non-discretionary non-reciprocal transfers of assets and liabilities designated as contributions by owners under Treasurer’s instruction 955 Contributions by Owners Made to Wholly Owned Public-Sector Entities are also recognised directly to equity.
(c) The Royalties for Regions Fund is committed to various WA Regional projects and programs.
Royalties for regions funds are recognised as revenue at fair value in the year in which the Department obtains control over the funds. The Department obtains control of the funds at the time the funds are deposited into the Department’s bank account.
4.2 User charges and fees
2020$ 000
2019$ 000
Boat registration fees 20 161 19 260Port charges 1 880 1 428Small boat harbour fees 10 915 11 123Other maritime fees 2 009 2 012Motor drivers licence application fees 72 512 67 310Motor vehicle recording, transfer, plate and inspection fees 102 462 103 374Passenger transport vehicle fees 2 354 -Perth parking licence fees 55 699 58 723Taxi licence fees - 1 016Other fees 4 560 7 771
272 552 272 017
Until 30 June 2019, revenue was recognised and measured at the fair value of consideration received or receivable. From 1 July 2019, revenue is recognised at the transaction price when the Department transfers control of the services to customers. Revenue is recognised for the major activities as follows:
Aside from Small Boat Harbour Fees (note 4.2), all revenue is recognised at a point-in-time for the performance obligations for these user fees and charges are satisfied when the services have been provided.
The Treasurer may make a determination providing for prescribed receipts to be retained for services under the control of the Department. In accordance with the determination specified in the 2018-19 Budget Statements, the Department retained $346 million in 2020 ($340 million in 2019) from the following:
• Regulatory fees and fines
• Grants and contributions
• Sale of goods and services
• Taxation
• Other receipts

Page 110 Department of Transport
Disclosures and Legal Compliance
4.3 Grants and contributions
2020$ 000
2019$ 000
Commonwealth grants 875 777General government grants 14 144 9 684Other 385 144
15 404 10 605
Revenue is recognised at fair value when the Department obtains control over the assets comprising the contributions usually when cash is received.
Other non-reciprocal contributions that are not contributions by owners are recognised at their fair value. Contributions of services are only recognised when a fair value can be reliably determined, and the services would be purchased if not donated.
4.4 Other revenue
2020$ 000
2019$ 000
Commissions 27 524 26 302Rents and leases 15 556 17 064Recoups of operating expenses 1 621 4 891Harbour utility charges 5 834 5 484Service level agreements 4 723 2 112Other 2 730 497
57 988 56 350
Revenue from other operating activities, including rendering of services and the sale of assets is recognised when the Department has passed control of the goods or other assets or delivery of the service to the customer.
Recoupment of operating activities is recognised when invoiced.
4.5 Other gains
2020$ 000
2019$ 000
Revaluation increment - Land 4 726 2 5264 726 2 526
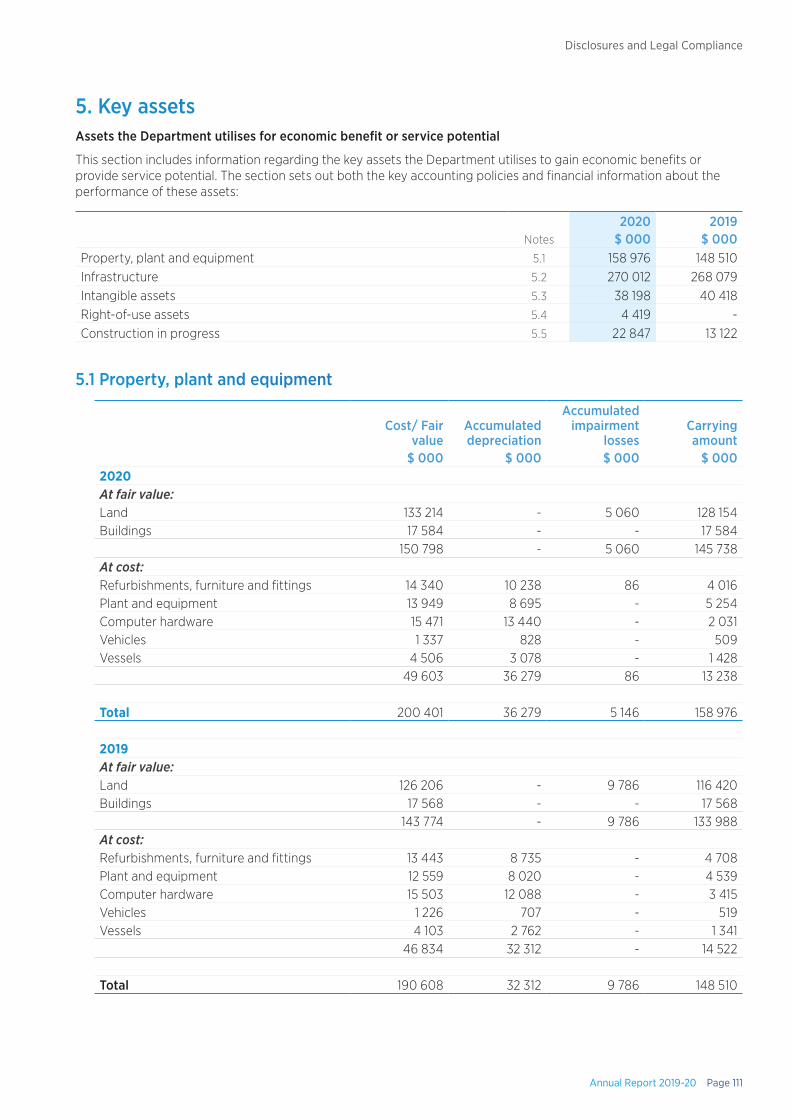
Annual Report 2019-20 Page 111
Disclosures and Legal Compliance
5. Key assetsAssets the Department utilises for economic benefit or service potential
This section includes information regarding the key assets the Department utilises to gain economic benefits or provide service potential. The section sets out both the key accounting policies and financial information about the performance of these assets:
Notes2020
$ 0002019
$ 000Property, plant and equipment 5.1 158 976 148 510Infrastructure 5.2 270 012 268 079Intangible assets 5.3 38 198 40 418Right-of-use assets 5.4 4 419 -Construction in progress 5.5 22 847 13 122
5.1 Property, plant and equipment
Cost/ Fair value
$ 000
Accumulated depreciation
$ 000
Accumulated impairment
losses$ 000
Carrying amount
$ 0002020At fair value:Land 133 214 - 5 060 128 154Buildings 17 584 - - 17 584
150 798 - 5 060 145 738At cost:Refurbishments, furniture and fittings 14 340 10 238 86 4 016Plant and equipment 13 949 8 695 - 5 254Computer hardware 15 471 13 440 - 2 031Vehicles 1 337 828 - 509Vessels 4 506 3 078 - 1 428
49 603 36 279 86 13 238
Total 200 401 36 279 5 146 158 976
2019At fair value:Land 126 206 - 9 786 116 420Buildings 17 568 - - 17 568
143 774 - 9 786 133 988At cost:Refurbishments, furniture and fittings 13 443 8 735 - 4 708Plant and equipment 12 559 8 020 - 4 539Computer hardware 15 503 12 088 - 3 415Vehicles 1 226 707 - 519Vessels 4 103 2 762 - 1 341
46 834 32 312 - 14 522
Total 190 608 32 312 9 786 148 510
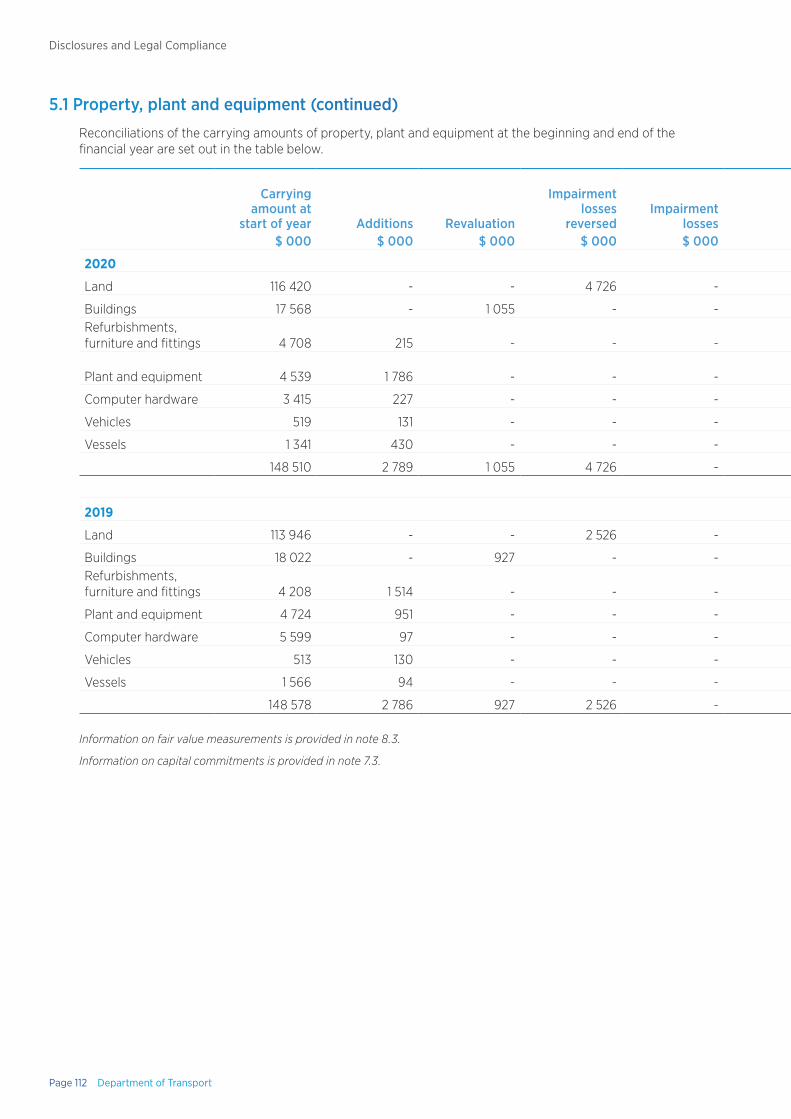
Page 112 Department of Transport
Disclosures and Legal Compliance
5.1 Property, plant and equipment (continued)
Reconciliations of the carrying amounts of property, plant and equipment at the beginning and end of the financial year are set out in the table below.
Carrying amount at
start of year$ 000
Additions$ 000
Revaluation$ 000
Impairment losses
reversed $ 000
Impairment losses $ 000
Disposals $ 000
Write-offs$ 000
Transfers$ 000
Depreciation$ 000
Ceased to be held for
distribution to owners
$ 000
Carrying amount at
end of year$ 000
2020
Land 116 420 - - 4 726 - - - 8 - 7 000 128 154
Buildings 17 568 - 1 055 - - - - - (1 559) 520 17 584Refurbishments, furniture and fittings 4 708 215 - - - - - - (907) - 4 016
Plant and equipment 4 539 1 786 - - - (100)
- - (982) 11 5 254
Computer hardware 3 415 227 - - - - - - (1 611) - 2 031
Vehicles 519 131 - - - (1) - - (140) - 509
Vessels 1 341 430 - - - - - - (343) - 1 428
148 510 2 789 1 055 4 726 - (101) - 8 (5 542) 7 531 158 976
2019
Land 113 946 - - 2 526 - - - (52) - - 116 420
Buildings 18 022 - 927 - - - - - (1 381) - 17 568Refurbishments, furniture and fittings 4 208 1 514 - - - (58) - - (956) - 4 708
Plant and equipment 4 724 951 - - - (169) (2) - (965) - 4 539
Computer hardware 5 599 97 - - - (39) - - (2 242) - 3 415
Vehicles 513 130 - - - - - - (124) - 519
Vessels 1 566 94 - - - - - - (319) - 1 341
148 578 2 786 927 2 526 - (266) (2) (52) (5 987) - 148 510
Information on fair value measurements is provided in note 8.3.
Information on capital commitments is provided in note 7.3.

Annual Report 2019-20 Page 113
Disclosures and Legal Compliance
5.1 Property, plant and equipment (continued)
Reconciliations of the carrying amounts of property, plant and equipment at the beginning and end of the financial year are set out in the table below.
Carrying amount at
start of year$ 000
Additions$ 000
Revaluation$ 000
Impairment losses
reversed $ 000
Impairment losses $ 000
Disposals $ 000
Write-offs$ 000
Transfers$ 000
Depreciation$ 000
Ceased to be held for
distribution to owners
$ 000
Carrying amount at
end of year$ 000
2020
Land 116 420 - - 4 726 - - - 8 - 7 000 128 154
Buildings 17 568 - 1 055 - - - - - (1 559) 520 17 584Refurbishments, furniture and fittings 4 708 215 - - - - - - (907) - 4 016
Plant and equipment 4 539 1 786 - - - (100)
- - (982) 11 5 254
Computer hardware 3 415 227 - - - - - - (1 611) - 2 031
Vehicles 519 131 - - - (1) - - (140) - 509
Vessels 1 341 430 - - - - - - (343) - 1 428
148 510 2 789 1 055 4 726 - (101) - 8 (5 542) 7 531 158 976
2019
Land 113 946 - - 2 526 - - - (52) - - 116 420
Buildings 18 022 - 927 - - - - - (1 381) - 17 568Refurbishments, furniture and fittings 4 208 1 514 - - - (58) - - (956) - 4 708
Plant and equipment 4 724 951 - - - (169) (2) - (965) - 4 539
Computer hardware 5 599 97 - - - (39) - - (2 242) - 3 415
Vehicles 513 130 - - - - - - (124) - 519
Vessels 1 566 94 - - - - - - (319) - 1 341
148 578 2 786 927 2 526 - (266) (2) (52) (5 987) - 148 510
Information on fair value measurements is provided in note 8.3.
Information on capital commitments is provided in note 7.3.
Page 114 Department of Transport
Disclosures and Legal Compliance
5.1 Property, plant and equipment (continued)
Capitalisation/expensing of assetsItems of property, plant and equipment and infrastructure costing $5,000 or more are recognised as assets, and the cost of utilising assets is expensed (depreciated) over their useful lives. Items of property, plant and equipment and infrastructure costing less than $5,000 are immediately expensed directly to the Statement of Comprehensive Income (other than where they form part of a group of similar items which is significant in total).
Initial recognition and measurementProperty, plant and equipment and infrastructure are initially recognised at cost. For items of property, plant and equipment and infrastructure acquired at no cost or for nominal cost, the cost is their fair value at the date of acquisition.
Subsequent measurementAfter initial recognition of an asset, the revaluation model is used for the measurement of land and buildings, and the cost model for all other property, plant and equipment and infrastructure. Land and buildings are carried at fair value less accumulated depreciation (buildings only) and accumulated impairment losses. All other items of property, plant and equipment and infrastructure are stated at historical cost less accumulated depreciation and accumulated impairment losses.
Where market-based evidence is available, the fair value of land and buildings is determined on the basis of current market values determined by reference to recent market transactions.
Where market-based evidence is not available, the fair value of land and buildings is determined on the basis of existing use. This normally applies where buildings are specialised or where land use is restricted. Fair value for existing use buildings is determined by reference to the cost of replacing the remaining future economic benefits embodied in the asset, i.e. current replacement cost.
Land assets were last revalued as at 1 July 2019 by the Western Australian Land Information Authority (Valuations and Property Analytics). The valuations were performed during the year ended 30 June 2020 and recognised at 30 June 2020. In undertaking the revaluation, fair value was determined by reference to market value: $10,691,000 (2019: $3,699,000). For the remaining balance, fair value of land was determined on the basis of comparison with market evidence for land with low level utility (high restricted use land).
Building assets were last revalued as at 1 July 2019 by the Western Australian Land Information Authority (Valuations and Property Analytics). The valuations were performed during the year ended 30 June 2020 and recognised at 30 June 2020. In undertaking the revaluation, fair value was determined by reference to market value: $2,616,000 (2019: $2,096,000). For the remaining balance, fair value of buildings was determined on the basis of current replacement cost.
When buildings are revalued, the accumulated depreciation is eliminated against the gross carrying amount of the asset and the net amount restated to the revalued amount. Fair value for restricted use land is determined by comparison with market evidence for land with similar approximate utility (high restricted use land) or market value of comparable unrestricted land (low restricted use land). Independent valuations of land and buildings are provided annually by the Western Australian Land Information Authority (Valuations and Property Analytics) and recognised annually to ensure that the carrying amount does not differ materially from the asset’s fair value at the end of the financial year.
The most significant assumptions and judgements in estimating fair value are made in assessing whether to apply the existing use basis to assets and in determining estimated economic life. Professional judgement by the valuer is required where the evidence does not provide a clear distinction between market type assets and existing use assets.
Information on fair value measurements is provided in note 8.3.
DerecognitionUpon disposal or derecognition of an item of property, plant and equipment, any revaluation surplus relating to that asset is retained in the asset revaluation surplus.
Asset revaluation surplusThe asset revaluation surplus is used to record increments and decrements on the revaluation of non-current assets.
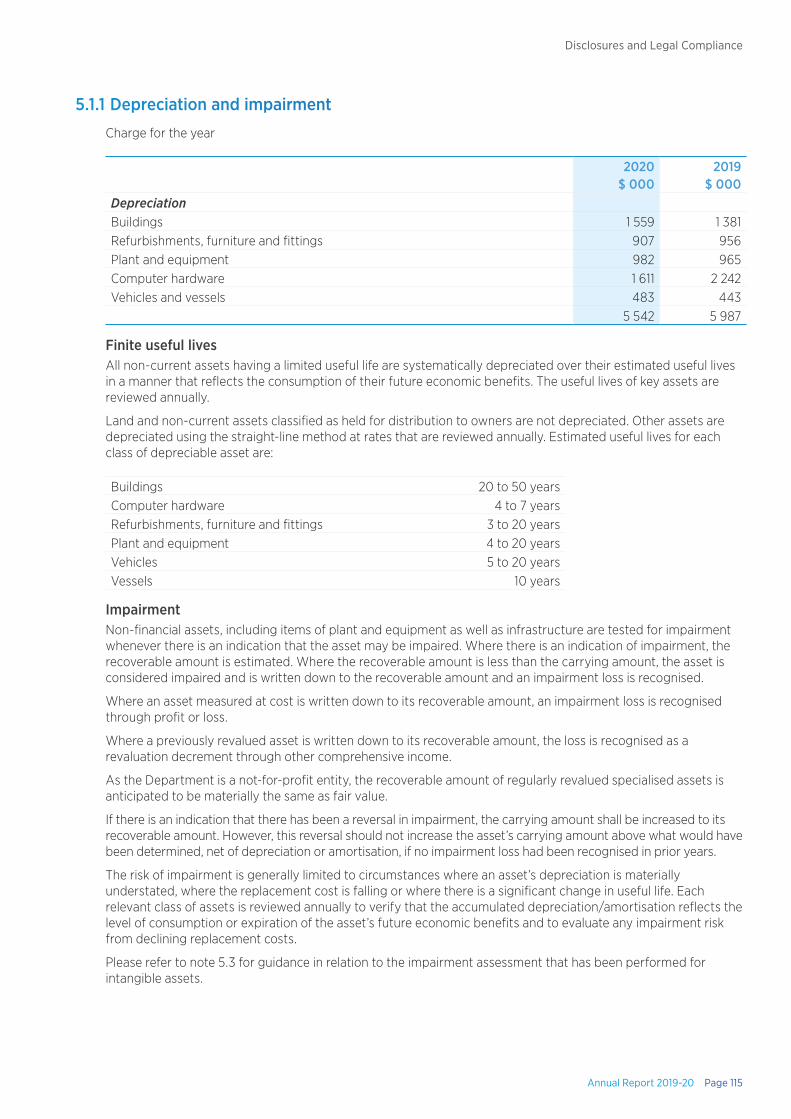
Annual Report 2019-20 Page 115
Disclosures and Legal Compliance
5.1.1 Depreciation and impairment
Charge for the year
2020$ 000
2019$ 000
DepreciationBuildings 1 559 1 381Refurbishments, furniture and fittings 907 956Plant and equipment 982 965Computer hardware 1 611 2 242Vehicles and vessels 483 443
5 542 5 987
Finite useful livesAll non-current assets having a limited useful life are systematically depreciated over their estimated useful lives in a manner that reflects the consumption of their future economic benefits. The useful lives of key assets are reviewed annually.
Land and non-current assets classified as held for distribution to owners are not depreciated. Other assets are depreciated using the straight-line method at rates that are reviewed annually. Estimated useful lives for each class of depreciable asset are:
Buildings 20 to 50 yearsComputer hardware 4 to 7 yearsRefurbishments, furniture and fittings 3 to 20 yearsPlant and equipment 4 to 20 yearsVehicles 5 to 20 yearsVessels 10 years
ImpairmentNon-financial assets, including items of plant and equipment as well as infrastructure are tested for impairment whenever there is an indication that the asset may be impaired. Where there is an indication of impairment, the recoverable amount is estimated. Where the recoverable amount is less than the carrying amount, the asset is considered impaired and is written down to the recoverable amount and an impairment loss is recognised.
Where an asset measured at cost is written down to its recoverable amount, an impairment loss is recognised through profit or loss.
Where a previously revalued asset is written down to its recoverable amount, the loss is recognised as a revaluation decrement through other comprehensive income.
As the Department is a not-for-profit entity, the recoverable amount of regularly revalued specialised assets is anticipated to be materially the same as fair value.
If there is an indication that there has been a reversal in impairment, the carrying amount shall be increased to its recoverable amount. However, this reversal should not increase the asset’s carrying amount above what would have been determined, net of depreciation or amortisation, if no impairment loss had been recognised in prior years.
The risk of impairment is generally limited to circumstances where an asset’s depreciation is materially understated, where the replacement cost is falling or where there is a significant change in useful life. Each relevant class of assets is reviewed annually to verify that the accumulated depreciation/amortisation reflects the level of consumption or expiration of the asset’s future economic benefits and to evaluate any impairment risk from declining replacement costs.
Please refer to note 5.3 for guidance in relation to the impairment assessment that has been performed for intangible assets.
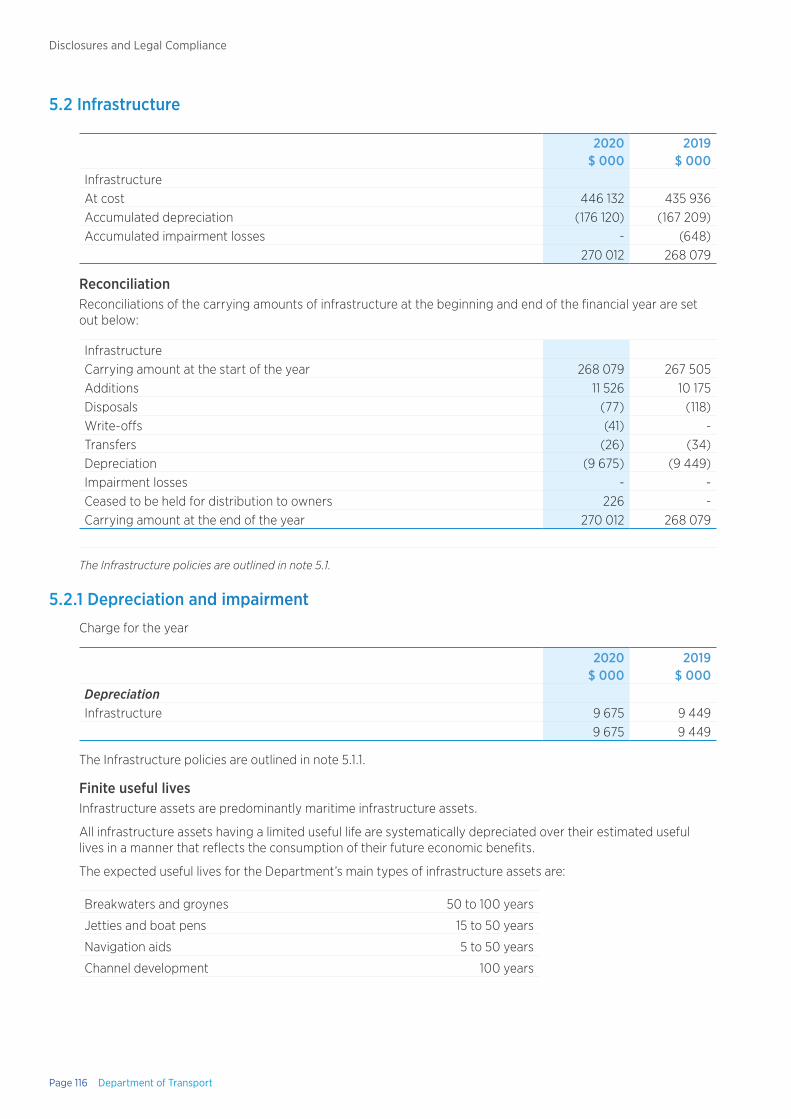
Page 116 Department of Transport
Disclosures and Legal Compliance
5.2 Infrastructure
2020$ 000
2019$ 000
InfrastructureAt cost 446 132 435 936Accumulated depreciation (176 120) (167 209)Accumulated impairment losses - (648)
270 012 268 079
ReconciliationReconciliations of the carrying amounts of infrastructure at the beginning and end of the financial year are set out below:
InfrastructureCarrying amount at the start of the year 268 079 267 505Additions 11 526 10 175Disposals (77) (118)Write-offs (41) - Transfers (26) (34)Depreciation (9 675) (9 449)Impairment losses - -Ceased to be held for distribution to owners 226 -Carrying amount at the end of the year 270 012 268 079
The Infrastructure policies are outlined in note 5.1.
5.2.1 Depreciation and impairment
Charge for the year
2020$ 000
2019$ 000
DepreciationInfrastructure 9 675 9 449
9 675 9 449
The Infrastructure policies are outlined in note 5.1.1.
Finite useful livesInfrastructure assets are predominantly maritime infrastructure assets.
All infrastructure assets having a limited useful life are systematically depreciated over their estimated useful lives in a manner that reflects the consumption of their future economic benefits.
The expected useful lives for the Department’s main types of infrastructure assets are:
Breakwaters and groynes 50 to 100 years
Jetties and boat pens 15 to 50 years
Navigation aids 5 to 50 years
Channel development 100 years
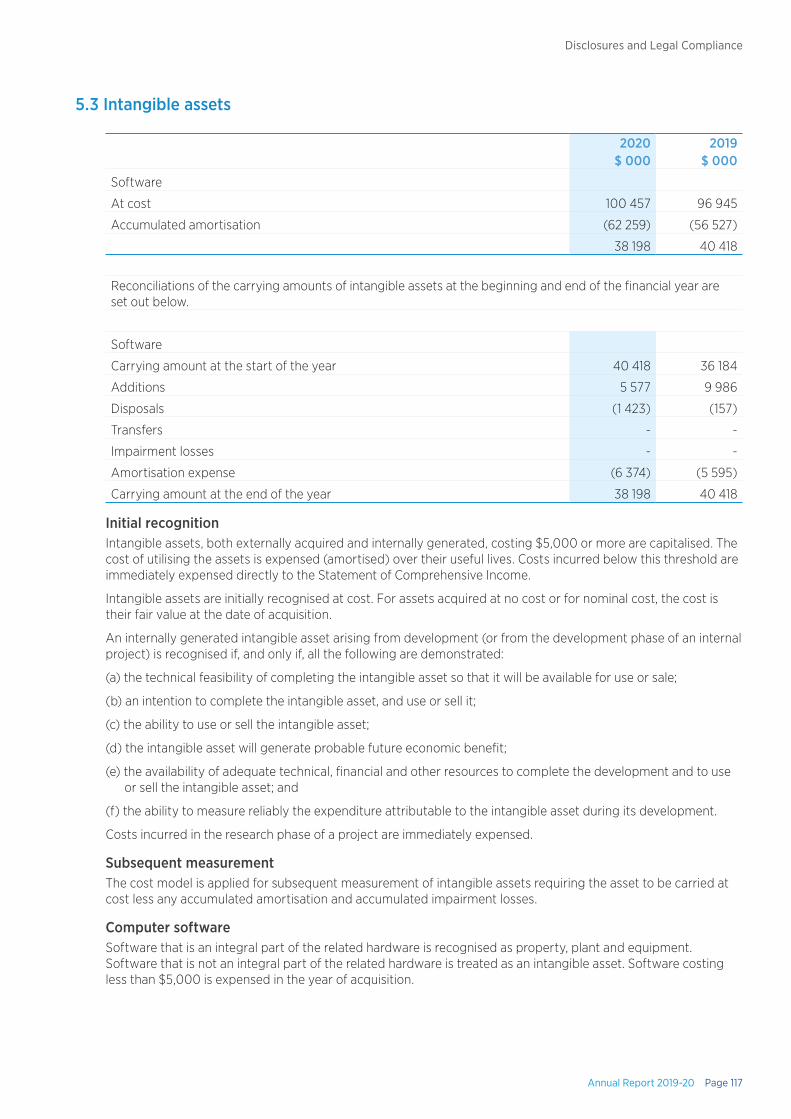
Annual Report 2019-20 Page 117
Disclosures and Legal Compliance
5.3 Intangible assets
2020$ 000
2019$ 000
Software
At cost 100 457 96 945
Accumulated amortisation (62 259) (56 527)
38 198 40 418
Reconciliations of the carrying amounts of intangible assets at the beginning and end of the financial year are set out below.
Software
Carrying amount at the start of the year 40 418 36 184
Additions 5 577 9 986
Disposals (1 423) (157)
Transfers - -
Impairment losses - -
Amortisation expense (6 374) (5 595)
Carrying amount at the end of the year 38 198 40 418
Initial recognitionIntangible assets, both externally acquired and internally generated, costing $5,000 or more are capitalised. The cost of utilising the assets is expensed (amortised) over their useful lives. Costs incurred below this threshold are immediately expensed directly to the Statement of Comprehensive Income.
Intangible assets are initially recognised at cost. For assets acquired at no cost or for nominal cost, the cost is their fair value at the date of acquisition.
An internally generated intangible asset arising from development (or from the development phase of an internal project) is recognised if, and only if, all the following are demonstrated:
(a) the technical feasibility of completing the intangible asset so that it will be available for use or sale;
(b) an intention to complete the intangible asset, and use or sell it;
(c) the ability to use or sell the intangible asset;
(d) the intangible asset will generate probable future economic benefit;
(e) the availability of adequate technical, financial and other resources to complete the development and to use or sell the intangible asset; and
(f) the ability to measure reliably the expenditure attributable to the intangible asset during its development.
Costs incurred in the research phase of a project are immediately expensed.
Subsequent measurementThe cost model is applied for subsequent measurement of intangible assets requiring the asset to be carried at cost less any accumulated amortisation and accumulated impairment losses.
Computer softwareSoftware that is an integral part of the related hardware is recognised as property, plant and equipment. Software that is not an integral part of the related hardware is treated as an intangible asset. Software costing less than $5,000 is expensed in the year of acquisition.
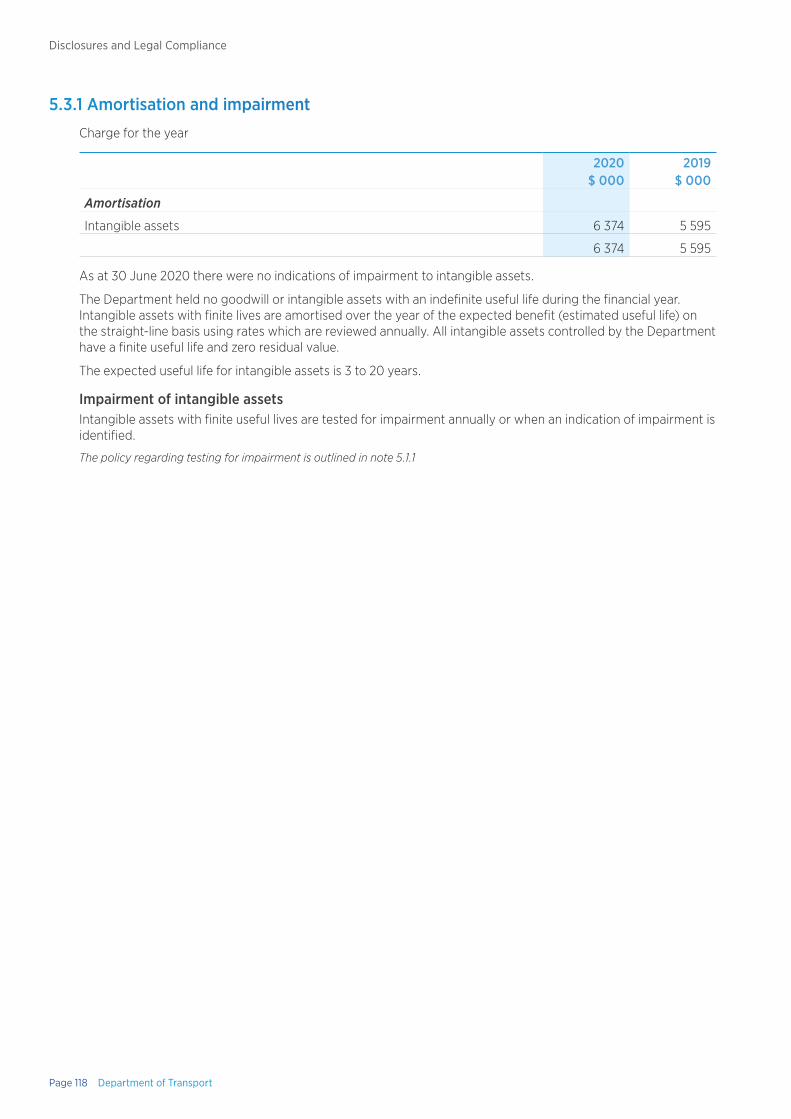
Page 118 Department of Transport
Disclosures and Legal Compliance
5.3.1 Amortisation and impairment
Charge for the year
2020$ 000
2019$ 000
Amortisation
Intangible assets 6 374 5 595
6 374 5 595
As at 30 June 2020 there were no indications of impairment to intangible assets.
The Department held no goodwill or intangible assets with an indefinite useful life during the financial year. Intangible assets with finite lives are amortised over the year of the expected benefit (estimated useful life) on the straight-line basis using rates which are reviewed annually. All intangible assets controlled by the Department have a finite useful life and zero residual value.
The expected useful life for intangible assets is 3 to 20 years.
Impairment of intangible assetsIntangible assets with finite useful lives are tested for impairment annually or when an indication of impairment is identified.
The policy regarding testing for impairment is outlined in note 5.1.1
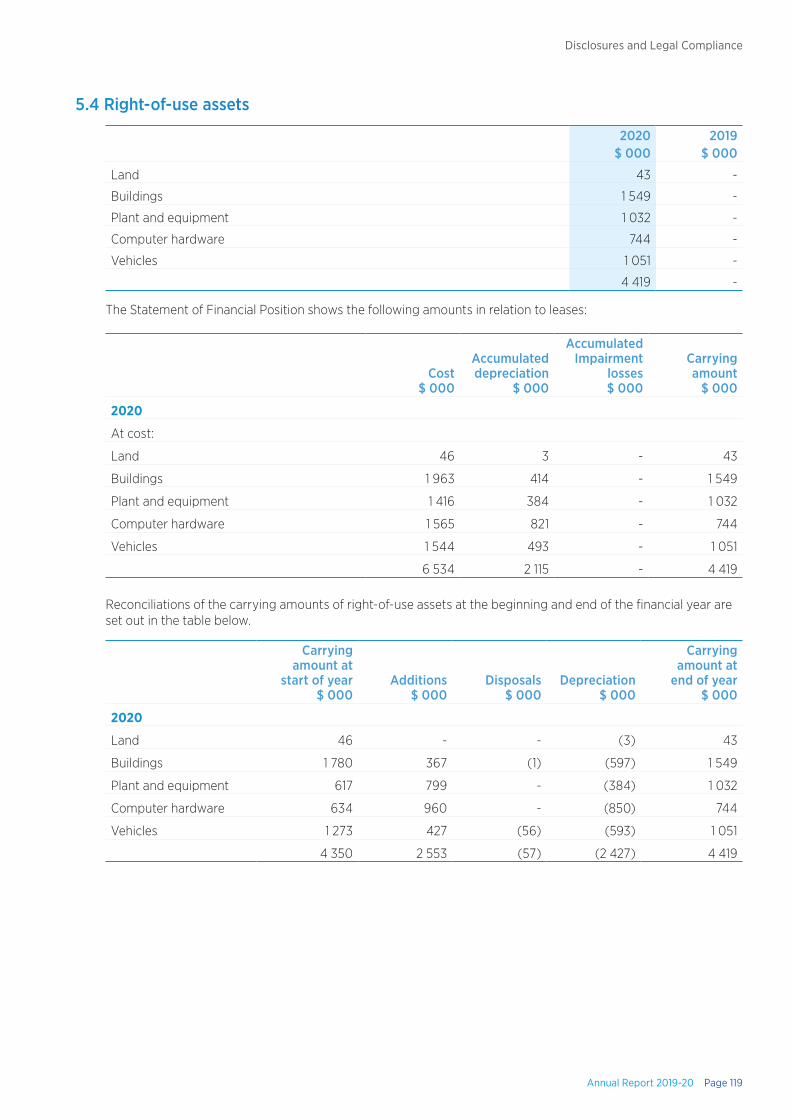
Annual Report 2019-20 Page 119
Disclosures and Legal Compliance
5.4 Right-of-use assets
2020$ 000
2019$ 000
Land 43 -
Buildings 1 549 -
Plant and equipment 1 032 -
Computer hardware 744 -
Vehicles 1 051 -
4 419 -
The Statement of Financial Position shows the following amounts in relation to leases:
Cost$ 000
Accumulated depreciation
$ 000
Accumulated Impairment
losses $ 000
Carrying amount
$ 000
2020
At cost:
Land 46 3 - 43
Buildings 1 963 414 - 1 549
Plant and equipment 1 416 384 - 1 032
Computer hardware 1 565 821 - 744
Vehicles 1 544 493 - 1 051
6 534 2 115 - 4 419
Reconciliations of the carrying amounts of right-of-use assets at the beginning and end of the financial year are set out in the table below.
Carrying amount at
start of year$ 000
Additions$ 000
Disposals $ 000
Depreciation$ 000
Carrying amount at
end of year$ 000
2020
Land 46 - - (3) 43
Buildings 1 780 367 (1) (597) 1 549
Plant and equipment 617 799 - (384) 1 032
Computer hardware 634 960 - (850) 744
Vehicles 1 273 427 (56) (593) 1 051
4 350 2 553 (57) (2 427) 4 419
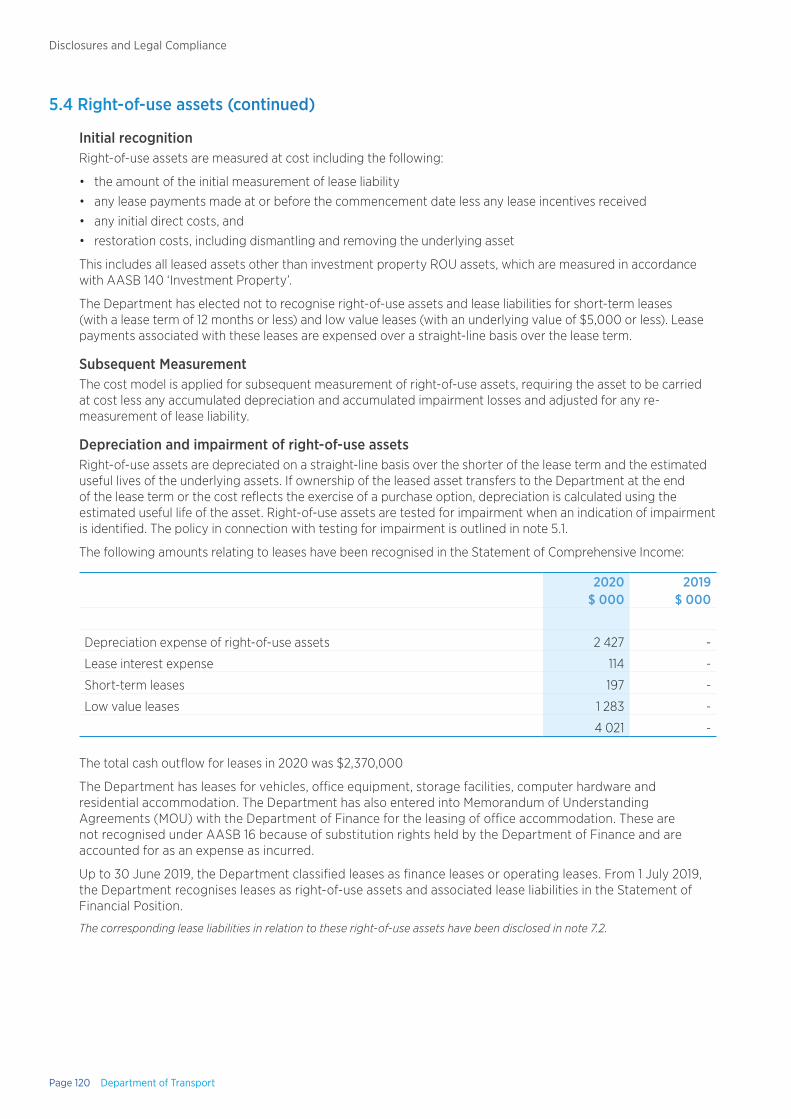
Page 120 Department of Transport
Disclosures and Legal Compliance
5.4 Right-of-use assets (continued)
Initial recognitionRight-of-use assets are measured at cost including the following:
• the amount of the initial measurement of lease liability
• any lease payments made at or before the commencement date less any lease incentives received
• any initial direct costs, and
• restoration costs, including dismantling and removing the underlying asset
This includes all leased assets other than investment property ROU assets, which are measured in accordance with AASB 140 ‘Investment Property’.
The Department has elected not to recognise right-of-use assets and lease liabilities for short-term leases (with a lease term of 12 months or less) and low value leases (with an underlying value of $5,000 or less). Lease payments associated with these leases are expensed over a straight-line basis over the lease term.
Subsequent MeasurementThe cost model is applied for subsequent measurement of right-of-use assets, requiring the asset to be carried at cost less any accumulated depreciation and accumulated impairment losses and adjusted for any re-measurement of lease liability.
Depreciation and impairment of right-of-use assetsRight-of-use assets are depreciated on a straight-line basis over the shorter of the lease term and the estimated useful lives of the underlying assets. If ownership of the leased asset transfers to the Department at the end of the lease term or the cost reflects the exercise of a purchase option, depreciation is calculated using the estimated useful life of the asset. Right-of-use assets are tested for impairment when an indication of impairment is identified. The policy in connection with testing for impairment is outlined in note 5.1.
The following amounts relating to leases have been recognised in the Statement of Comprehensive Income:
2020$ 000
2019$ 000
Depreciation expense of right-of-use assets 2 427 -
Lease interest expense 114 -
Short-term leases 197 -
Low value leases 1 283 -
4 021 -
The total cash outflow for leases in 2020 was $2,370,000
The Department has leases for vehicles, office equipment, storage facilities, computer hardware and residential accommodation. The Department has also entered into Memorandum of Understanding Agreements (MOU) with the Department of Finance for the leasing of office accommodation. These are not recognised under AASB 16 because of substitution rights held by the Department of Finance and are accounted for as an expense as incurred.
Up to 30 June 2019, the Department classified leases as finance leases or operating leases. From 1 July 2019, the Department recognises leases as right-of-use assets and associated lease liabilities in the Statement of Financial Position.
The corresponding lease liabilities in relation to these right-of-use assets have been disclosed in note 7.2.
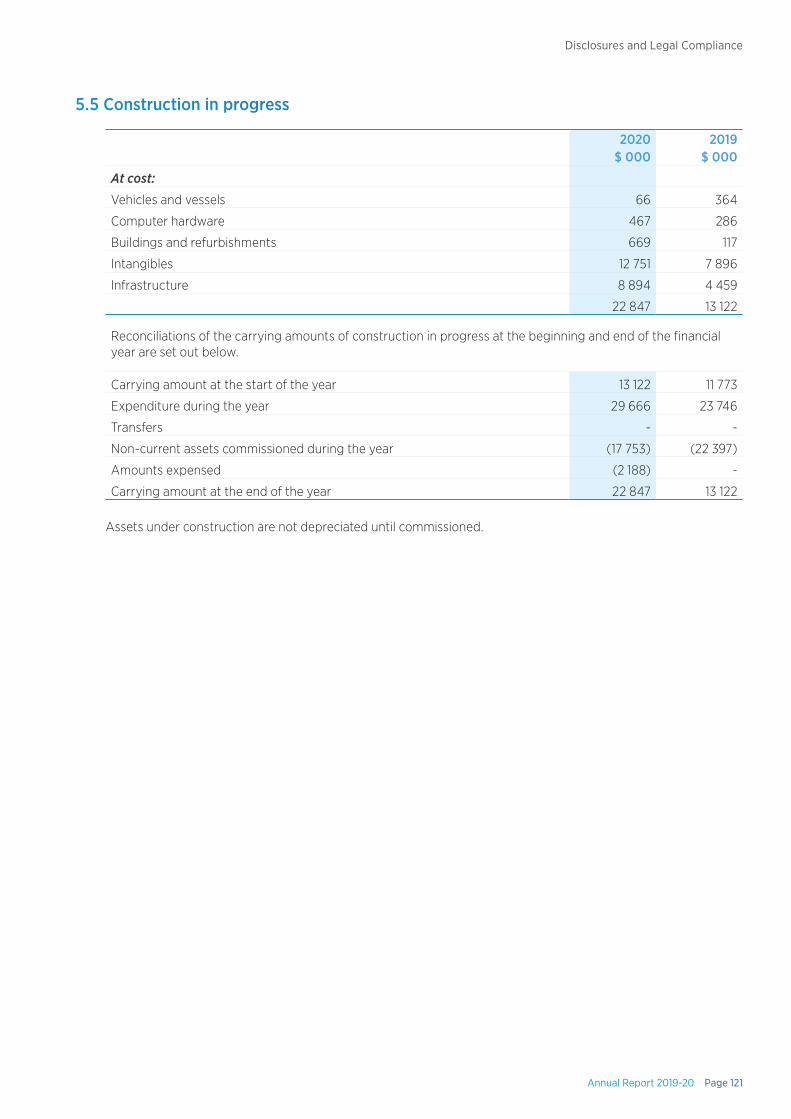
Annual Report 2019-20 Page 121
Disclosures and Legal Compliance
5.5 Construction in progress
2020$ 000
2019$ 000
At cost:
Vehicles and vessels 66 364
Computer hardware 467 286
Buildings and refurbishments 669 117
Intangibles 12 751 7 896
Infrastructure 8 894 4 459
22 847 13 122
Reconciliations of the carrying amounts of construction in progress at the beginning and end of the financial year are set out below.
Carrying amount at the start of the year 13 122 11 773
Expenditure during the year 29 666 23 746
Transfers - -
Non-current assets commissioned during the year (17 753) (22 397)
Amounts expensed (2 188) -
Carrying amount at the end of the year 22 847 13 122
Assets under construction are not depreciated until commissioned.
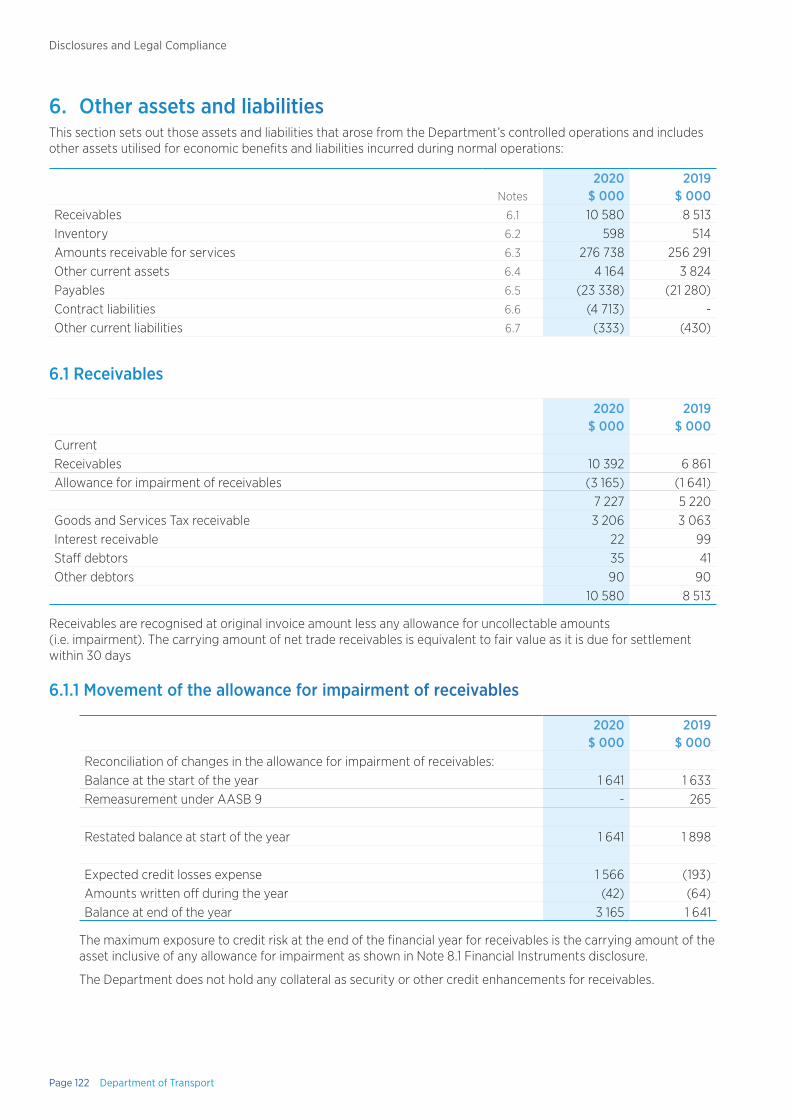
Page 122 Department of Transport
Disclosures and Legal Compliance
6. Other assets and liabilitiesThis section sets out those assets and liabilities that arose from the Department’s controlled operations and includes other assets utilised for economic benefits and liabilities incurred during normal operations:
Notes2020
$ 0002019
$ 000Receivables 6.1 10 580 8 513Inventory 6.2 598 514Amounts receivable for services 6.3 276 738 256 291Other current assets 6.4 4 164 3 824Payables 6.5 (23 338) (21 280)Contract liabilities 6.6 (4 713) -Other current liabilities 6.7 (333) (430)
6.1 Receivables
2020$ 000
2019$ 000
CurrentReceivables 10 392 6 861Allowance for impairment of receivables (3 165) (1 641)
7 227 5 220Goods and Services Tax receivable 3 206 3 063Interest receivable 22 99Staff debtors 35 41Other debtors 90 90
10 580 8 513
Receivables are recognised at original invoice amount less any allowance for uncollectable amounts (i.e. impairment). The carrying amount of net trade receivables is equivalent to fair value as it is due for settlement within 30 days
6.1.1 Movement of the allowance for impairment of receivables
2020$ 000
2019$ 000
Reconciliation of changes in the allowance for impairment of receivables:Balance at the start of the year 1 641 1 633Remeasurement under AASB 9 - 265
Restated balance at start of the year 1 641 1 898
Expected credit losses expense 1 566 (193)Amounts written off during the year (42) (64)Balance at end of the year 3 165 1 641
The maximum exposure to credit risk at the end of the financial year for receivables is the carrying amount of the asset inclusive of any allowance for impairment as shown in Note 8.1 Financial Instruments disclosure.
The Department does not hold any collateral as security or other credit enhancements for receivables.
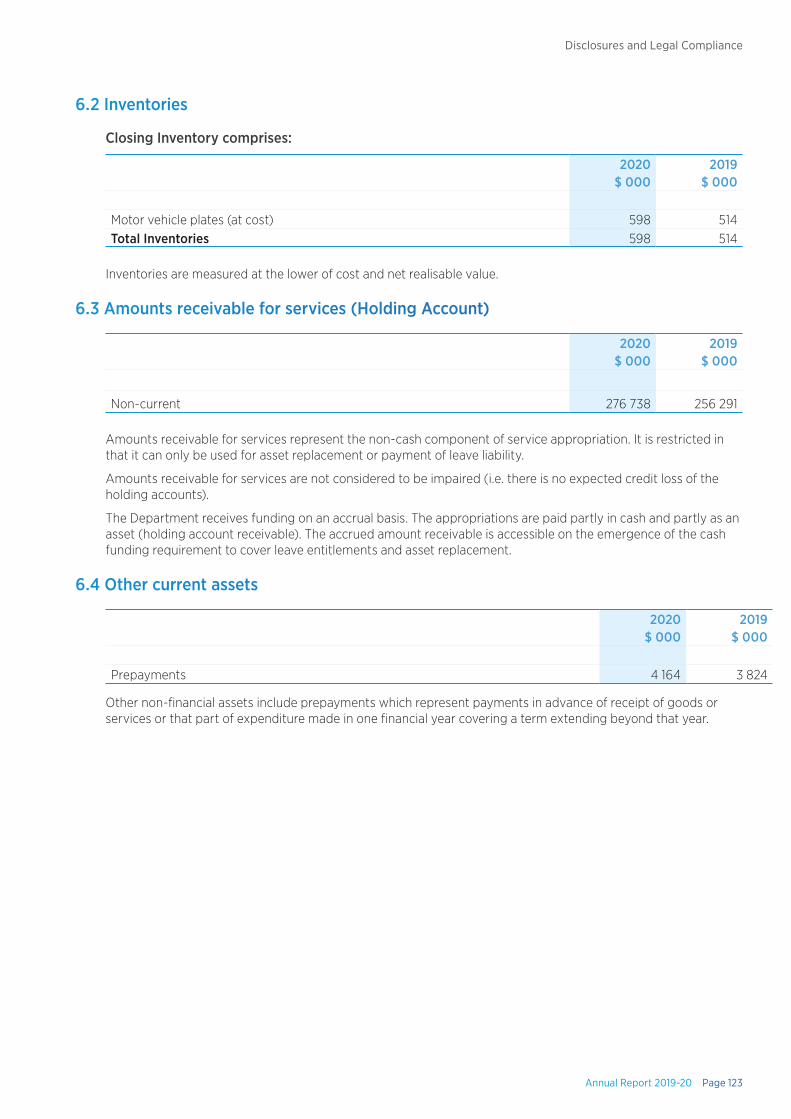
Annual Report 2019-20 Page 123
Disclosures and Legal Compliance
6.2 Inventories
Closing Inventory comprises:
2020$ 000
2019$ 000
Motor vehicle plates (at cost) 598 514Total Inventories 598 514
Inventories are measured at the lower of cost and net realisable value.
6.3 Amounts receivable for services (Holding Account)
2020$ 000
2019$ 000
Non-current 276 738 256 291
Amounts receivable for services represent the non-cash component of service appropriation. It is restricted in that it can only be used for asset replacement or payment of leave liability.
Amounts receivable for services are not considered to be impaired (i.e. there is no expected credit loss of the holding accounts).
The Department receives funding on an accrual basis. The appropriations are paid partly in cash and partly as an asset (holding account receivable). The accrued amount receivable is accessible on the emergence of the cash funding requirement to cover leave entitlements and asset replacement.
6.4 Other current assets
2020$ 000
2019$ 000
Prepayments 4 164 3 824
Other non-financial assets include prepayments which represent payments in advance of receipt of goods or services or that part of expenditure made in one financial year covering a term extending beyond that year.
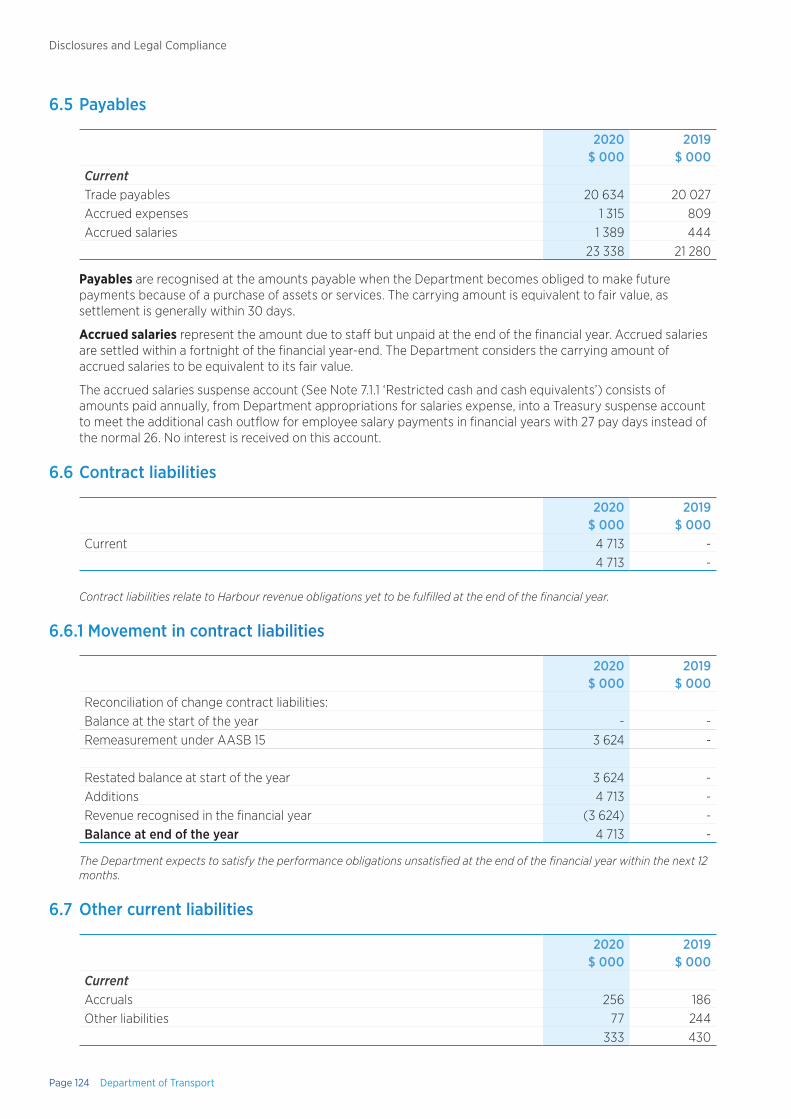
Page 124 Department of Transport
Disclosures and Legal Compliance
6.5 Payables
2020$ 000
2019$ 000
CurrentTrade payables 20 634 20 027Accrued expenses 1 315 809Accrued salaries 1 389 444
23 338 21 280
Payables are recognised at the amounts payable when the Department becomes obliged to make future payments because of a purchase of assets or services. The carrying amount is equivalent to fair value, as settlement is generally within 30 days.
Accrued salaries represent the amount due to staff but unpaid at the end of the financial year. Accrued salaries are settled within a fortnight of the financial year-end. The Department considers the carrying amount of accrued salaries to be equivalent to its fair value.
The accrued salaries suspense account (See Note 7.1.1 ‘Restricted cash and cash equivalents’) consists of amounts paid annually, from Department appropriations for salaries expense, into a Treasury suspense account to meet the additional cash outflow for employee salary payments in financial years with 27 pay days instead of the normal 26. No interest is received on this account.
6.6 Contract liabilities
2020$ 000
2019$ 000
Current 4 713 -4 713 -
Contract liabilities relate to Harbour revenue obligations yet to be fulfilled at the end of the financial year.
6.6.1 Movement in contract liabilities
2020$ 000
2019$ 000
Reconciliation of change contract liabilities:Balance at the start of the year - -Remeasurement under AASB 15 3 624 -
Restated balance at start of the year 3 624 -Additions 4 713 -Revenue recognised in the financial year (3 624) -Balance at end of the year 4 713 -
The Department expects to satisfy the performance obligations unsatisfied at the end of the financial year within the next 12 months.
6.7 Other current liabilities
2020$ 000
2019$ 000
CurrentAccruals 256 186Other liabilities 77 244
333 430
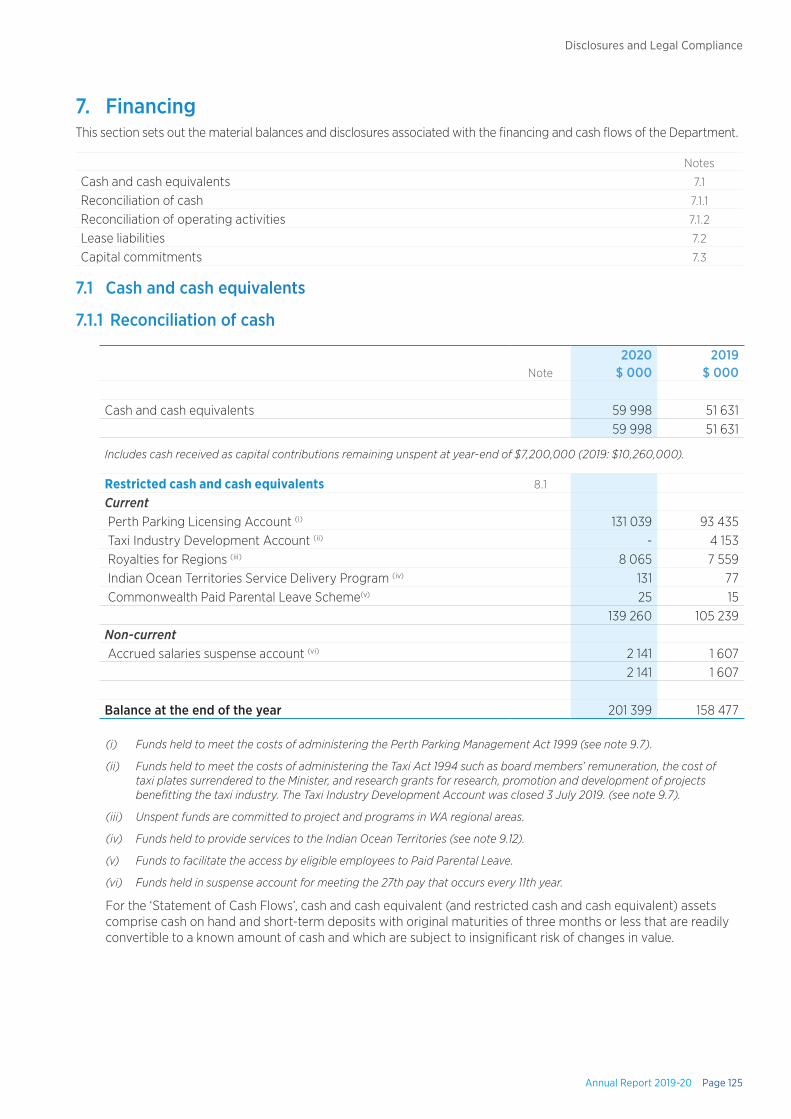
Annual Report 2019-20 Page 125
Disclosures and Legal Compliance
7. FinancingThis section sets out the material balances and disclosures associated with the financing and cash flows of the Department.
Notes
Cash and cash equivalents 7.1
Reconciliation of cash 7.1.1
Reconciliation of operating activities 7.1.2
Lease liabilities 7.2
Capital commitments 7.3
7.1 Cash and cash equivalents
7.1.1 Reconciliation of cash
Note2020
$ 0002019
$ 000
Cash and cash equivalents 59 998 51 63159 998 51 631
Includes cash received as capital contributions remaining unspent at year-end of $7,200,000 (2019: $10,260,000).
Restricted cash and cash equivalents 8.1
Current Perth Parking Licensing Account (i) 131 039 93 435 Taxi Industry Development Account (ii) - 4 153 Royalties for Regions (iii) 8 065 7 559 Indian Ocean Territories Service Delivery Program (iv) 131 77 Commonwealth Paid Parental Leave Scheme(v) 25 15
139 260 105 239Non-current Accrued salaries suspense account (vi) 2 141 1 607
2 141 1 607
Balance at the end of the year 201 399 158 477
(i) Funds held to meet the costs of administering the Perth Parking Management Act 1999 (see note 9.7).
(ii) Funds held to meet the costs of administering the Taxi Act 1994 such as board members’ remuneration, the cost of taxi plates surrendered to the Minister, and research grants for research, promotion and development of projects benefitting the taxi industry. The Taxi Industry Development Account was closed 3 July 2019. (see note 9.7).
(iii) Unspent funds are committed to project and programs in WA regional areas.
(iv) Funds held to provide services to the Indian Ocean Territories (see note 9.12).
(v) Funds to facilitate the access by eligible employees to Paid Parental Leave.
(vi) Funds held in suspense account for meeting the 27th pay that occurs every 11th year.
For the ‘Statement of Cash Flows’, cash and cash equivalent (and restricted cash and cash equivalent) assets comprise cash on hand and short-term deposits with original maturities of three months or less that are readily convertible to a known amount of cash and which are subject to insignificant risk of changes in value.

Page 126 Department of Transport
Disclosures and Legal Compliance
7.1.2 Reconciliation of net cost of services to net cash flows provided by/ (used in) operating activities
Notes2020
$ 0002019
$ 000
Net cost of services (209 184) (70 055)
Non-cash items:Depreciation and amortisation expense 5.1, 5.2, 5.3 24 019 21 031Expected credit losses 3.4 965 (193)Loss on disposal of non-current assets 3.3 1 546 450Services received free of charge 4.1 1 958 1 841Impairment losses 3.4 73 -Assets assumed/(transferred) 4.5 26 -Other gains 4.6 (4 726) (2 526)
(Increase)/decrease in assetsCurrent inventories (84) 29Current receivables(i) (1 924) 6 311Other current assets (340) 1 264
Increase/(decrease) in liabilitiesCurrent payables(i) 2 057 918Contract liabilities 4 713 -Current provisions 1 632 341Other current liabilities (97) (300)Non-current provisions 311 417Net GST receipts/payments(ii) 221 1 038Change in GST in receivables/payables(iii) (1 713) (729)Net cash used in operating activities (180 547) (40 163)
(i) Note that the Australian Taxation Office (ATO) receivable/payable in respect of GST and the receivable/ payable in respect of the sale/purchase of non-current assets are not included in these items as they do not form part of the reconciling items.
(ii) This is the net GST paid/received, i.e. cash transactions
(iii) This reverses out the GST in receivables and payables.
The Department is not exposed to changes in liabilities arising from financing activities, including changes arising from cash flows and non-cash changes.
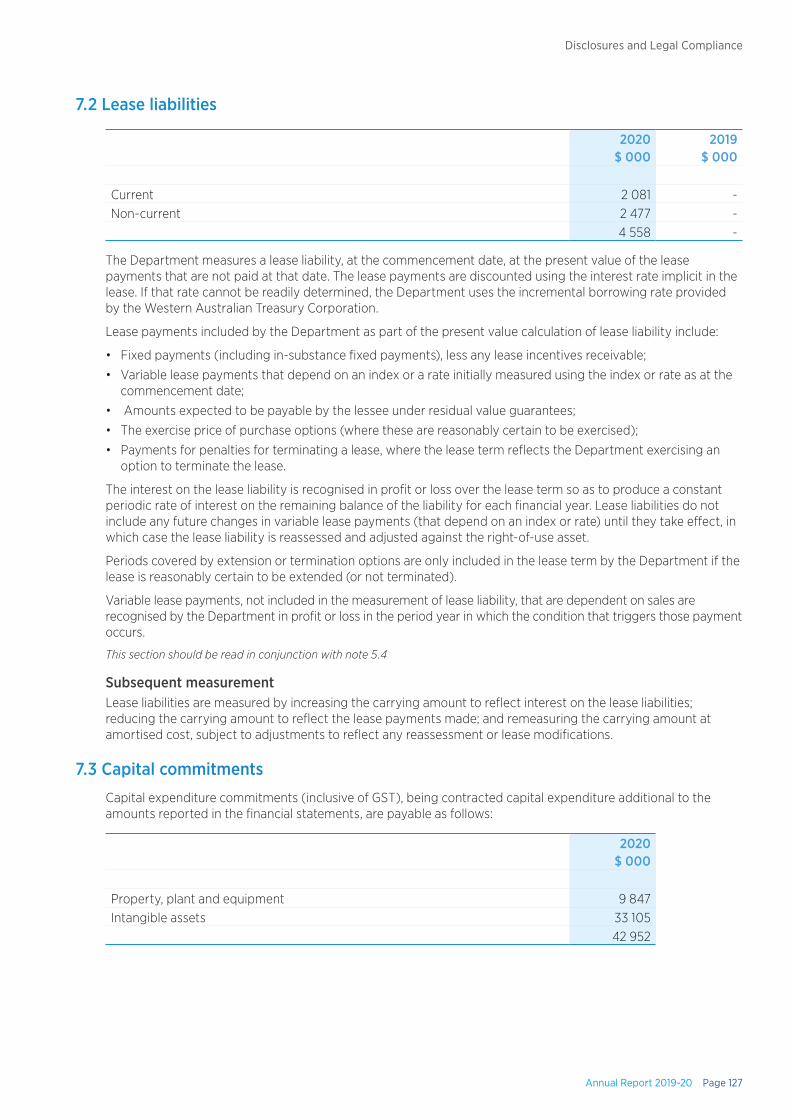
Annual Report 2019-20 Page 127
Disclosures and Legal Compliance
7.2 Lease liabilities
2020$ 000
2019$ 000
Current 2 081 -Non-current 2 477 -
4 558 -
The Department measures a lease liability, at the commencement date, at the present value of the lease payments that are not paid at that date. The lease payments are discounted using the interest rate implicit in the lease. If that rate cannot be readily determined, the Department uses the incremental borrowing rate provided by the Western Australian Treasury Corporation.
Lease payments included by the Department as part of the present value calculation of lease liability include:
• Fixed payments (including in-substance fixed payments), less any lease incentives receivable;
• Variable lease payments that depend on an index or a rate initially measured using the index or rate as at the commencement date;
• Amounts expected to be payable by the lessee under residual value guarantees;
• The exercise price of purchase options (where these are reasonably certain to be exercised);
• Payments for penalties for terminating a lease, where the lease term reflects the Department exercising an option to terminate the lease.
The interest on the lease liability is recognised in profit or loss over the lease term so as to produce a constant periodic rate of interest on the remaining balance of the liability for each financial year. Lease liabilities do not include any future changes in variable lease payments (that depend on an index or rate) until they take effect, in which case the lease liability is reassessed and adjusted against the right-of-use asset.
Periods covered by extension or termination options are only included in the lease term by the Department if the lease is reasonably certain to be extended (or not terminated).
Variable lease payments, not included in the measurement of lease liability, that are dependent on sales are recognised by the Department in profit or loss in the period year in which the condition that triggers those payment occurs.
This section should be read in conjunction with note 5.4
Subsequent measurementLease liabilities are measured by increasing the carrying amount to reflect interest on the lease liabilities; reducing the carrying amount to reflect the lease payments made; and remeasuring the carrying amount at amortised cost, subject to adjustments to reflect any reassessment or lease modifications.
7.3 Capital commitments
Capital expenditure commitments (inclusive of GST), being contracted capital expenditure additional to the amounts reported in the financial statements, are payable as follows:
2020$ 000
Property, plant and equipment 9 847Intangible assets 33 105
42 952
Page 128 Department of Transport
Disclosures and Legal Compliance
8. Risks and ContingenciesThis section sets out the Department’s key risk management policies and measurement techniques.
Notes
Financial risk management 8.1
Contingent assets and liabilities 8.2
Fair value measurements 8.3
8.1 Financial risk management
Financial instruments held by the Department are cash and cash equivalents (restricted and non-restricted), receivables and payables. The Department has limited exposure to financial risks and its overall risk management program focuses on managing the risks identified below.
(a) Summary of risks and risk management
Credit riskCredit risk arises when there is the possibility of the Department’s receivables defaulting on their contractual obligations resulting in financial loss to the Department.
The maximum exposure to credit risk at the end of the financial year in relation to each class of recognised financial asset is the gross carrying amount of those assets inclusive of any allowance for impairment as shown in the table at Note 8.1(c) ‘Financial instruments disclosures’ and note 6.1 ‘Receivables’.
Credit risk associated with the Department’s financial assets is minimal because the main receivable is the amounts receivable for services (holding account). For receivables other than Government, the Department trades only with recognised, creditworthy third parties. The Department has policies in place to ensure that sales of products and services are made to customers with an appropriate credit history. In addition, receivable balances are monitored on an ongoing basis with the result that the Department’s exposure to bad debts is minimal. At the end of the financial year there were no significant concentrations of credit risk.
Liquidity riskLiquidity risk arises when the Department is unable to meet its financial obligations as they fall due.
The Department is exposed to liquidity risk through its trading in the normal course of business.
The Department has appropriate procedures to manage cash flows including drawdowns of appropriations by monitoring forecast cash flows to ensure that enough funds are available to meet its commitments.
Market riskMarket risk is the risk that changes in market prices such as foreign exchange rates and interest rates will affect the Department’s income or the value of its holdings of financial instruments. The Department does not trade in foreign currency and is not materially exposed to other price risks (for example, equity securities or commodity prices changes).
Other than as detailed in the interest rate sensitivity analysis table at Note 8.1(e) Financial instruments disclosures, the Department is not exposed to interest rate risk as it has no borrowings, and cash and cash equivalents are non-interest bearing (apart from certain restricted cash accounts).
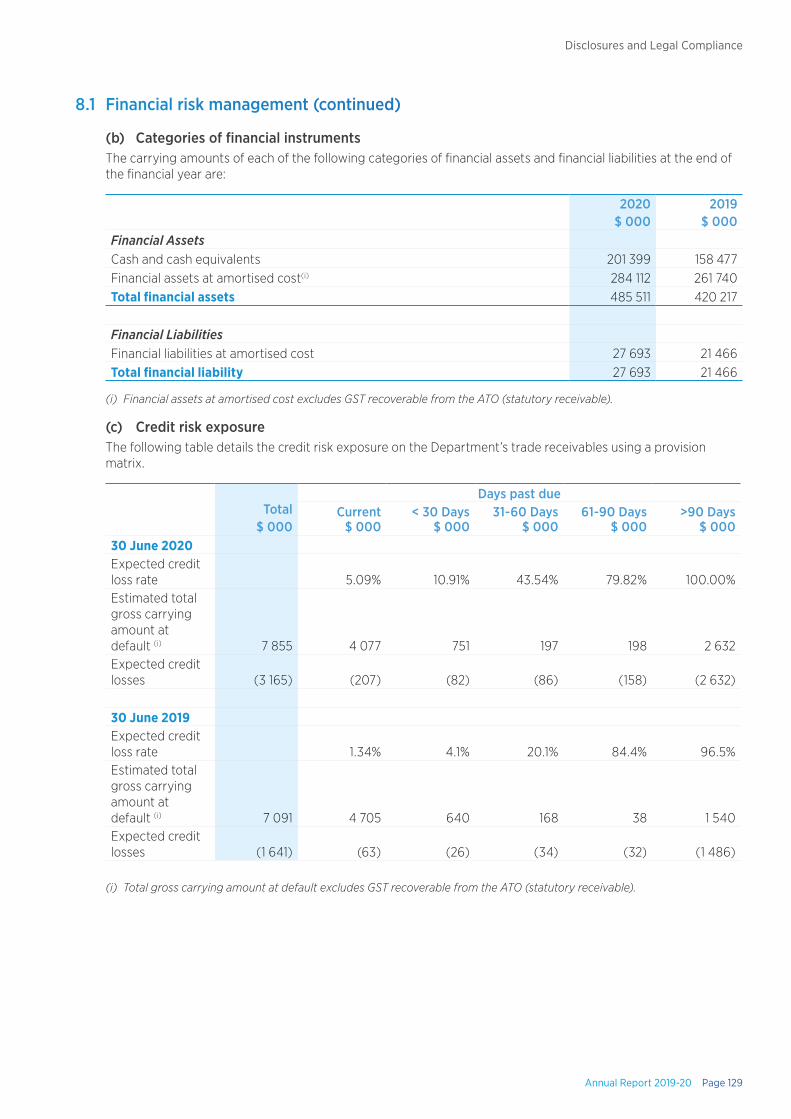
Annual Report 2019-20 Page 129
Disclosures and Legal Compliance
8.1 Financial risk management (continued)
(b) Categories of financial instrumentsThe carrying amounts of each of the following categories of financial assets and financial liabilities at the end of the financial year are:
2020$ 000
2019$ 000
Financial AssetsCash and cash equivalents 201 399 158 477Financial assets at amortised cost(i) 284 112 261 740Total financial assets 485 511 420 217
Financial LiabilitiesFinancial liabilities at amortised cost 27 693 21 466Total financial liability 27 693 21 466
(i) Financial assets at amortised cost excludes GST recoverable from the ATO (statutory receivable).
(c) Credit risk exposureThe following table details the credit risk exposure on the Department’s trade receivables using a provision matrix.
Total$ 000
Days past due Current
$ 000< 30 Days
$ 00031-60 Days
$ 000 61-90 Days
$ 000>90 Days
$ 00030 June 2020Expected credit loss rate 5.09% 10.91% 43.54% 79.82% 100.00%Estimated total gross carrying amount at default (i) 7 855 4 077 751 197 198 2 632Expected credit losses (3 165) (207) (82) (86) (158) (2 632)
30 June 2019Expected credit loss rate 1.34% 4.1% 20.1% 84.4% 96.5%Estimated total gross carrying amount at default (i) 7 091 4 705 640 168 38 1 540Expected credit losses (1 641) (63) (26) (34) (32) (1 486)
(i) Total gross carrying amount at default excludes GST recoverable from the ATO (statutory receivable).
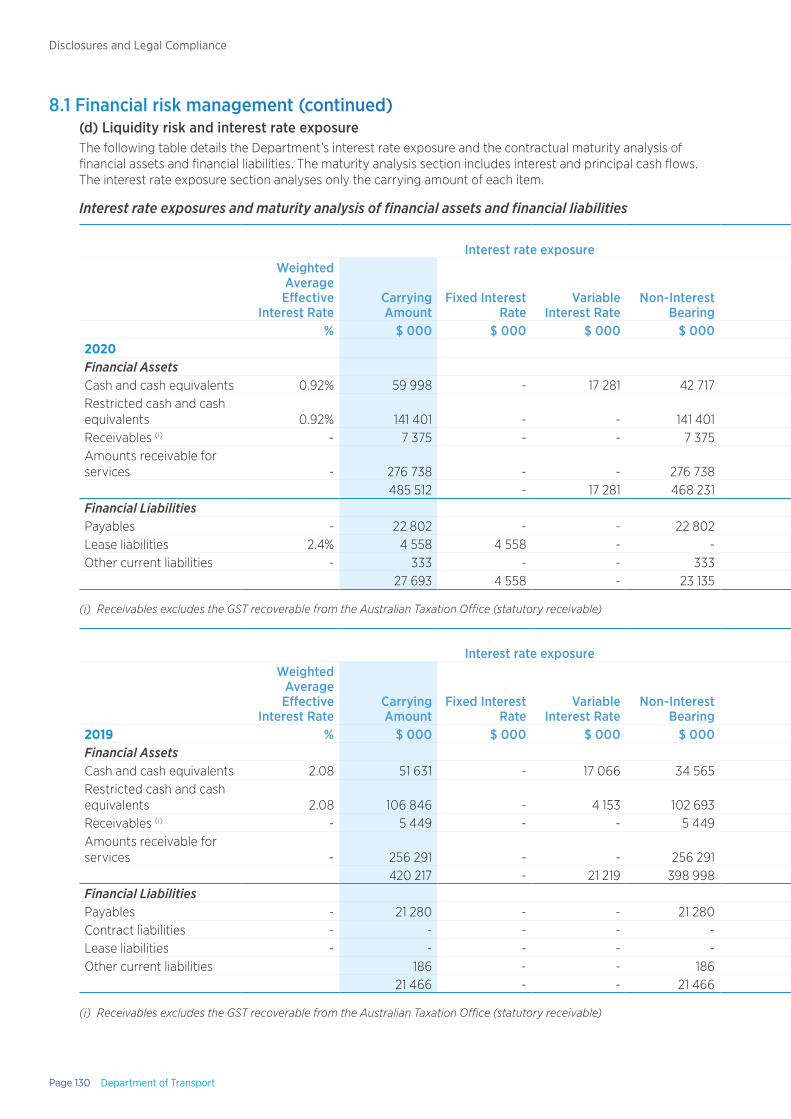
Page 130 Department of Transport
Disclosures and Legal Compliance
8.1 Financial risk management (continued)(d) Liquidity risk and interest rate exposureThe following table details the Department’s interest rate exposure and the contractual maturity analysis of financial assets and financial liabilities. The maturity analysis section includes interest and principal cash flows. The interest rate exposure section analyses only the carrying amount of each item.
Interest rate exposures and maturity analysis of financial assets and financial liabilities
Interest rate exposureInterest rate
exposure Maturity dateWeighted
Average Effective
Interest RateCarrying Amount
Fixed Interest Rate
Variable Interest Rate
Non-Interest Bearing
Nominal Amount Up to 1 month 1-3 Months
3 Months to 1 year 1-5 Years
More than 5 years
% $ 000 $ 000 $ 000 $ 000 $ 000 $ 000 $ 000 $ 000 $ 000 $ 0002020Financial AssetsCash and cash equivalents 0.92% 59 998 - 17 281 42 717 59 998 59 998 - - - -Restricted cash and cash equivalents 0.92% 141 401 - - 141 401 141 401 141 401 - - - -Receivables (i) - 7 375 - - 7 375 7 375 7 375 - - - -Amounts receivable for services - 276 738 - - 276 738 276 738 - - - 276 738 -
485 512 - 17 281 468 231 485 512 208 774 - - 276 738 -Financial LiabilitiesPayables - 22 802 - - 22 802 22 802 22 802 - - - -Lease liabilities 2.4% 4 558 4 558 - - 4 558 304 382 1 476 2 217 179Other current liabilities - 333 - - 333 333 - 333 - - -
27 693 4 558 - 23 135 27 693 23 106 715 1 476 2 217 179
(i) Receivables excludes the GST recoverable from the Australian Taxation Office (statutory receivable)
Interest rate exposureInterest rate
exposure Maturity dateWeighted
Average Effective
Interest RateCarrying Amount
Fixed Interest Rate
Variable Interest Rate
Non-Interest Bearing
Nominal Amount Up to 1 month 1-3 Months
3 Months to 1 year 1-5 Years
More than 5 years
2019 % $ 000 $ 000 $ 000 $ 000 $ 000 $ 000 $ 000 $ 000 $ 000 $ 000Financial AssetsCash and cash equivalents 2.08 51 631 - 17 066 34 565 51 631 51 631 - - - -Restricted cash and cash equivalents 2.08 106 846 - 4 153 102 693 106 846 106 846 - - - -Receivables (i) - 5 449 - - 5 449 5 449 5 449 - - - -Amounts receivable for services - 256 291 - - 256 291 256 291 - - - 256 291 -
420 217 - 21 219 398 998 420 217 163 926 - - 256 291 -Financial LiabilitiesPayables - 21 280 - - 21 280 21 280 21 280 - - - -Contract liabilities - - - - - - - - - - -Lease liabilities - - - - - - - - - - -Other current liabilities 186 - - 186 186 - 186 - - -
21 466 - - 21 466 21 466 21 280 186 - - -
(i) Receivables excludes the GST recoverable from the Australian Taxation Office (statutory receivable)
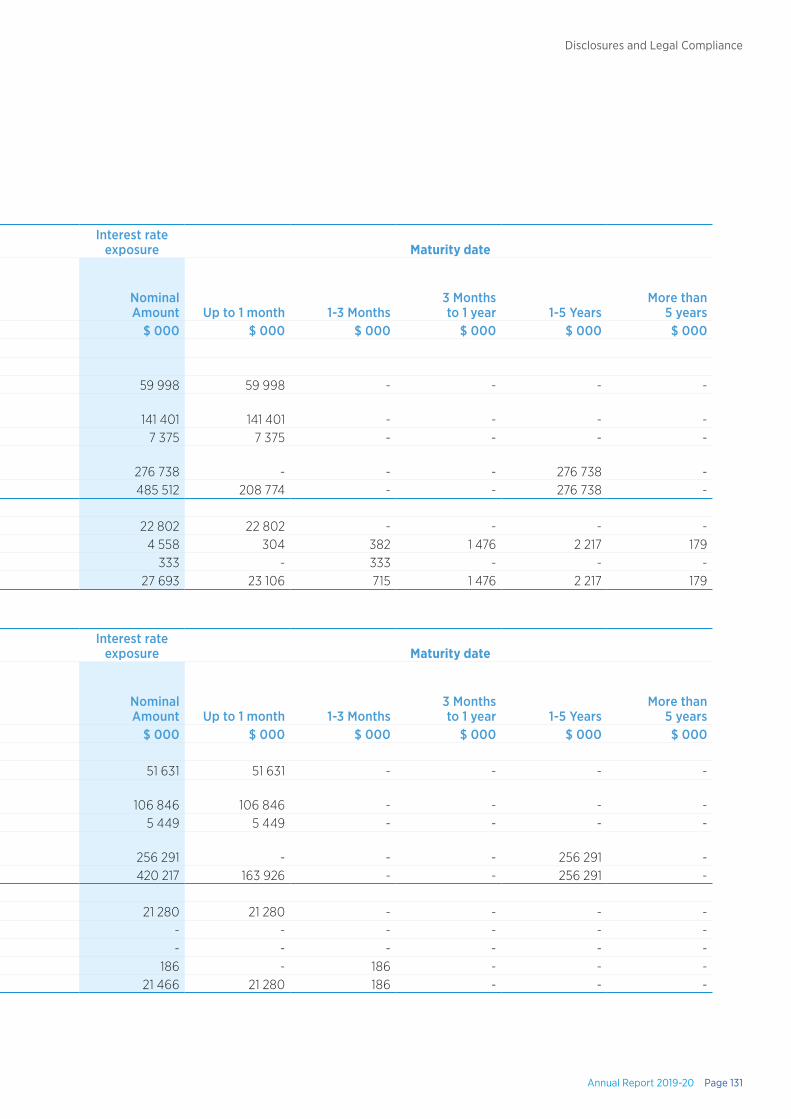
Annual Report 2019-20 Page 131
Disclosures and Legal Compliance
8.1 Financial risk management (continued)(d) Liquidity risk and interest rate exposureThe following table details the Department’s interest rate exposure and the contractual maturity analysis of financial assets and financial liabilities. The maturity analysis section includes interest and principal cash flows. The interest rate exposure section analyses only the carrying amount of each item.
Interest rate exposures and maturity analysis of financial assets and financial liabilities
Interest rate exposureInterest rate
exposure Maturity dateWeighted
Average Effective
Interest RateCarrying Amount
Fixed Interest Rate
Variable Interest Rate
Non-Interest Bearing
Nominal Amount Up to 1 month 1-3 Months
3 Months to 1 year 1-5 Years
More than 5 years
% $ 000 $ 000 $ 000 $ 000 $ 000 $ 000 $ 000 $ 000 $ 000 $ 0002020Financial AssetsCash and cash equivalents 0.92% 59 998 - 17 281 42 717 59 998 59 998 - - - -Restricted cash and cash equivalents 0.92% 141 401 - - 141 401 141 401 141 401 - - - -Receivables (i) - 7 375 - - 7 375 7 375 7 375 - - - -Amounts receivable for services - 276 738 - - 276 738 276 738 - - - 276 738 -
485 512 - 17 281 468 231 485 512 208 774 - - 276 738 -Financial LiabilitiesPayables - 22 802 - - 22 802 22 802 22 802 - - - -Lease liabilities 2.4% 4 558 4 558 - - 4 558 304 382 1 476 2 217 179Other current liabilities - 333 - - 333 333 - 333 - - -
27 693 4 558 - 23 135 27 693 23 106 715 1 476 2 217 179
(i) Receivables excludes the GST recoverable from the Australian Taxation Office (statutory receivable)
Interest rate exposureInterest rate
exposure Maturity dateWeighted
Average Effective
Interest RateCarrying Amount
Fixed Interest Rate
Variable Interest Rate
Non-Interest Bearing
Nominal Amount Up to 1 month 1-3 Months
3 Months to 1 year 1-5 Years
More than 5 years
2019 % $ 000 $ 000 $ 000 $ 000 $ 000 $ 000 $ 000 $ 000 $ 000 $ 000Financial AssetsCash and cash equivalents 2.08 51 631 - 17 066 34 565 51 631 51 631 - - - -Restricted cash and cash equivalents 2.08 106 846 - 4 153 102 693 106 846 106 846 - - - -Receivables (i) - 5 449 - - 5 449 5 449 5 449 - - - -Amounts receivable for services - 256 291 - - 256 291 256 291 - - - 256 291 -
420 217 - 21 219 398 998 420 217 163 926 - - 256 291 -Financial LiabilitiesPayables - 21 280 - - 21 280 21 280 21 280 - - - -Contract liabilities - - - - - - - - - - -Lease liabilities - - - - - - - - - - -Other current liabilities 186 - - 186 186 - 186 - - -
21 466 - - 21 466 21 466 21 280 186 - - -
(i) Receivables excludes the GST recoverable from the Australian Taxation Office (statutory receivable)
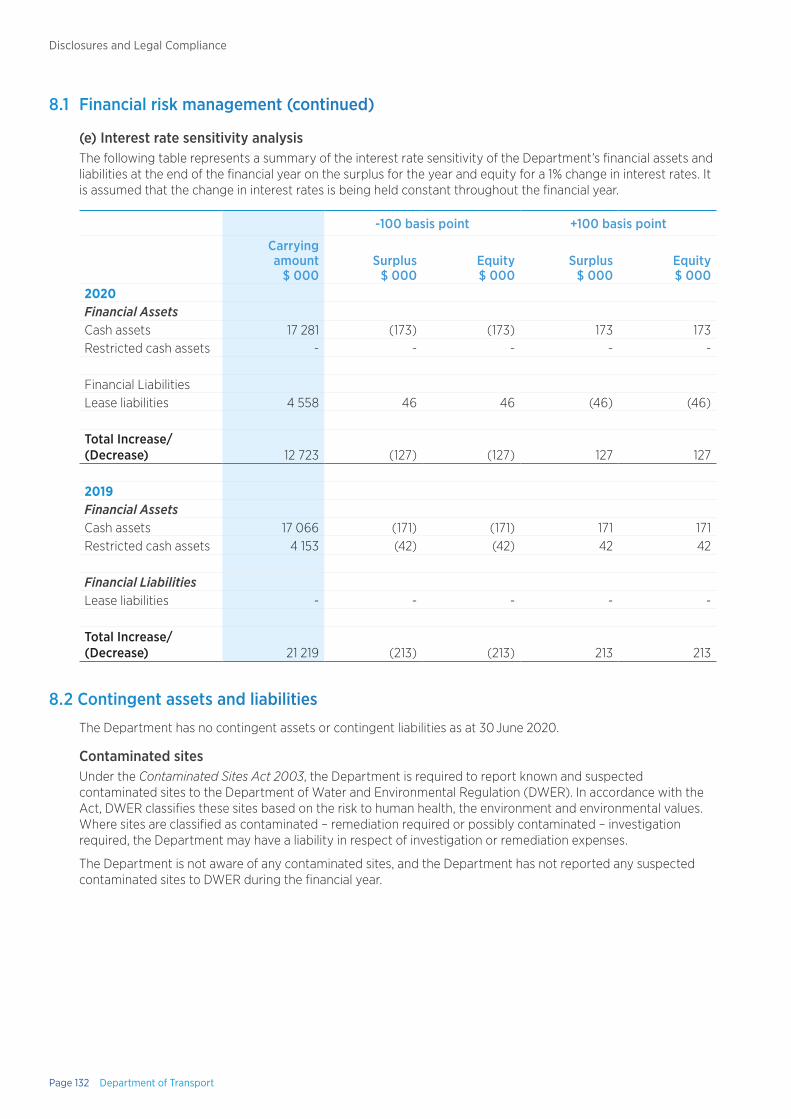
Page 132 Department of Transport
Disclosures and Legal Compliance
8.1 Financial risk management (continued)
(e) Interest rate sensitivity analysisThe following table represents a summary of the interest rate sensitivity of the Department’s financial assets and liabilities at the end of the financial year on the surplus for the year and equity for a 1% change in interest rates. It is assumed that the change in interest rates is being held constant throughout the financial year.
-100 basis point +100 basis point
Carrying amount
$ 000Surplus
$ 000Equity$ 000
Surplus$ 000
Equity$ 000
2020Financial AssetsCash assets 17 281 (173) (173) 173 173Restricted cash assets - - - - -
Financial LiabilitiesLease liabilities 4 558 46 46 (46) (46)
Total Increase/(Decrease) 12 723 (127) (127) 127 127
2019Financial AssetsCash assets 17 066 (171) (171) 171 171Restricted cash assets 4 153 (42) (42) 42 42
Financial LiabilitiesLease liabilities - - - - -
Total Increase/(Decrease) 21 219 (213) (213) 213 213
8.2 Contingent assets and liabilities
The Department has no contingent assets or contingent liabilities as at 30 June 2020.
Contaminated sitesUnder the Contaminated Sites Act 2003, the Department is required to report known and suspected contaminated sites to the Department of Water and Environmental Regulation (DWER). In accordance with the Act, DWER classifies these sites based on the risk to human health, the environment and environmental values. Where sites are classified as contaminated – remediation required or possibly contaminated – investigation required, the Department may have a liability in respect of investigation or remediation expenses.
The Department is not aware of any contaminated sites, and the Department has not reported any suspected contaminated sites to DWER during the financial year.
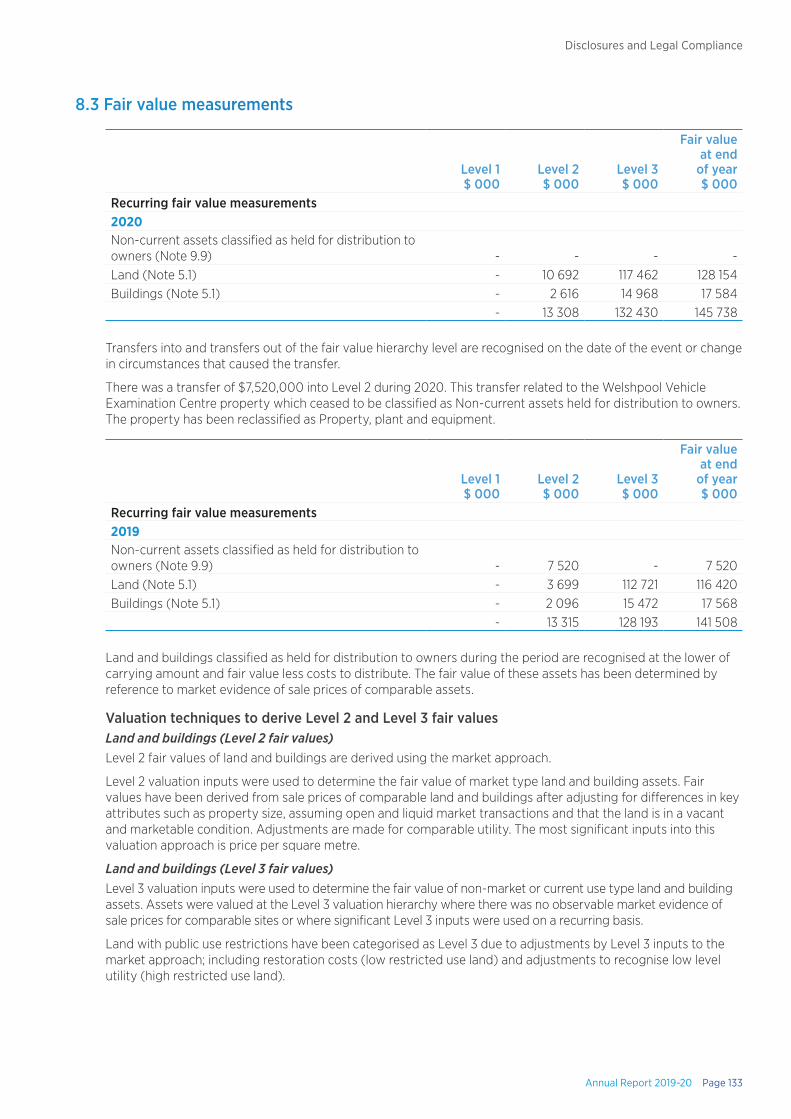
Annual Report 2019-20 Page 133
Disclosures and Legal Compliance
8.3 Fair value measurements
Level 1$ 000
Level 2$ 000
Level 3$ 000
Fair value at end
of year$ 000
Recurring fair value measurements2020Non-current assets classified as held for distribution to owners (Note 9.9) - - - -Land (Note 5.1) - 10 692 117 462 128 154Buildings (Note 5.1) - 2 616 14 968 17 584
- 13 308 132 430 145 738
Transfers into and transfers out of the fair value hierarchy level are recognised on the date of the event or change in circumstances that caused the transfer.
There was a transfer of $7,520,000 into Level 2 during 2020. This transfer related to the Welshpool Vehicle Examination Centre property which ceased to be classified as Non-current assets held for distribution to owners. The property has been reclassified as Property, plant and equipment.
Level 1$ 000
Level 2$ 000
Level 3$ 000
Fair value at end
of year$ 000
Recurring fair value measurements2019Non-current assets classified as held for distribution to owners (Note 9.9) - 7 520 - 7 520Land (Note 5.1) - 3 699 112 721 116 420Buildings (Note 5.1) - 2 096 15 472 17 568
- 13 315 128 193 141 508
Land and buildings classified as held for distribution to owners during the period are recognised at the lower of carrying amount and fair value less costs to distribute. The fair value of these assets has been determined by reference to market evidence of sale prices of comparable assets.
Valuation techniques to derive Level 2 and Level 3 fair valuesLand and buildings (Level 2 fair values)Level 2 fair values of land and buildings are derived using the market approach.
Level 2 valuation inputs were used to determine the fair value of market type land and building assets. Fair values have been derived from sale prices of comparable land and buildings after adjusting for differences in key attributes such as property size, assuming open and liquid market transactions and that the land is in a vacant and marketable condition. Adjustments are made for comparable utility. The most significant inputs into this valuation approach is price per square metre.
Land and buildings (Level 3 fair values)Level 3 valuation inputs were used to determine the fair value of non-market or current use type land and building assets. Assets were valued at the Level 3 valuation hierarchy where there was no observable market evidence of sale prices for comparable sites or where significant Level 3 inputs were used on a recurring basis.
Land with public use restrictions have been categorised as Level 3 due to adjustments by Level 3 inputs to the market approach; including restoration costs (low restricted use land) and adjustments to recognise low level utility (high restricted use land).
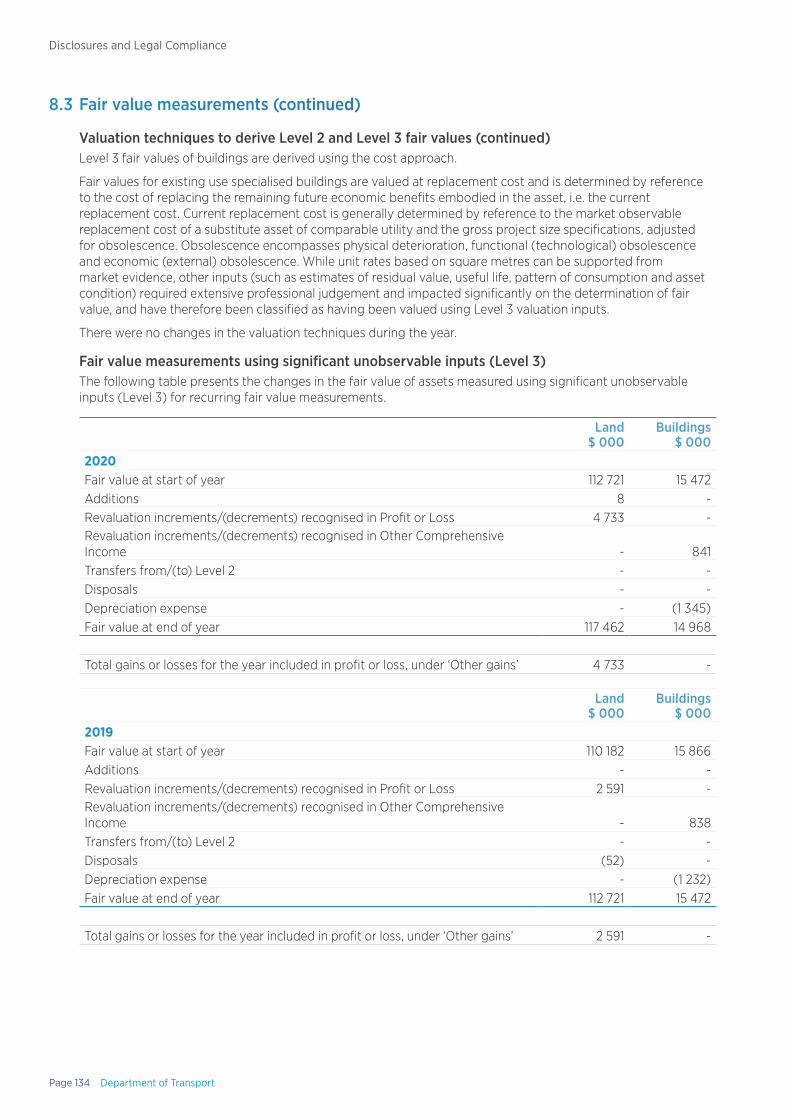
Page 134 Department of Transport
Disclosures and Legal Compliance
8.3 Fair value measurements (continued)
Valuation techniques to derive Level 2 and Level 3 fair values (continued)Level 3 fair values of buildings are derived using the cost approach.
Fair values for existing use specialised buildings are valued at replacement cost and is determined by reference to the cost of replacing the remaining future economic benefits embodied in the asset, i.e. the current replacement cost. Current replacement cost is generally determined by reference to the market observable replacement cost of a substitute asset of comparable utility and the gross project size specifications, adjusted for obsolescence. Obsolescence encompasses physical deterioration, functional (technological) obsolescence and economic (external) obsolescence. While unit rates based on square metres can be supported from market evidence, other inputs (such as estimates of residual value, useful life, pattern of consumption and asset condition) required extensive professional judgement and impacted significantly on the determination of fair value, and have therefore been classified as having been valued using Level 3 valuation inputs.
There were no changes in the valuation techniques during the year.
Fair value measurements using significant unobservable inputs (Level 3)The following table presents the changes in the fair value of assets measured using significant unobservable inputs (Level 3) for recurring fair value measurements.
Land $ 000
Buildings$ 000
2020Fair value at start of year 112 721 15 472Additions 8 -Revaluation increments/(decrements) recognised in Profit or Loss 4 733 -Revaluation increments/(decrements) recognised in Other Comprehensive Income - 841Transfers from/(to) Level 2 - -Disposals - -Depreciation expense - (1 345)Fair value at end of year 117 462 14 968
Total gains or losses for the year included in profit or loss, under ‘Other gains’ 4 733 -
Land $ 000
Buildings$ 000
2019Fair value at start of year 110 182 15 866Additions - -Revaluation increments/(decrements) recognised in Profit or Loss 2 591 -Revaluation increments/(decrements) recognised in Other Comprehensive Income - 838Transfers from/(to) Level 2 - -Disposals (52) -Depreciation expense - (1 232)Fair value at end of year 112 721 15 472
Total gains or losses for the year included in profit or loss, under ‘Other gains’ 2 591 -
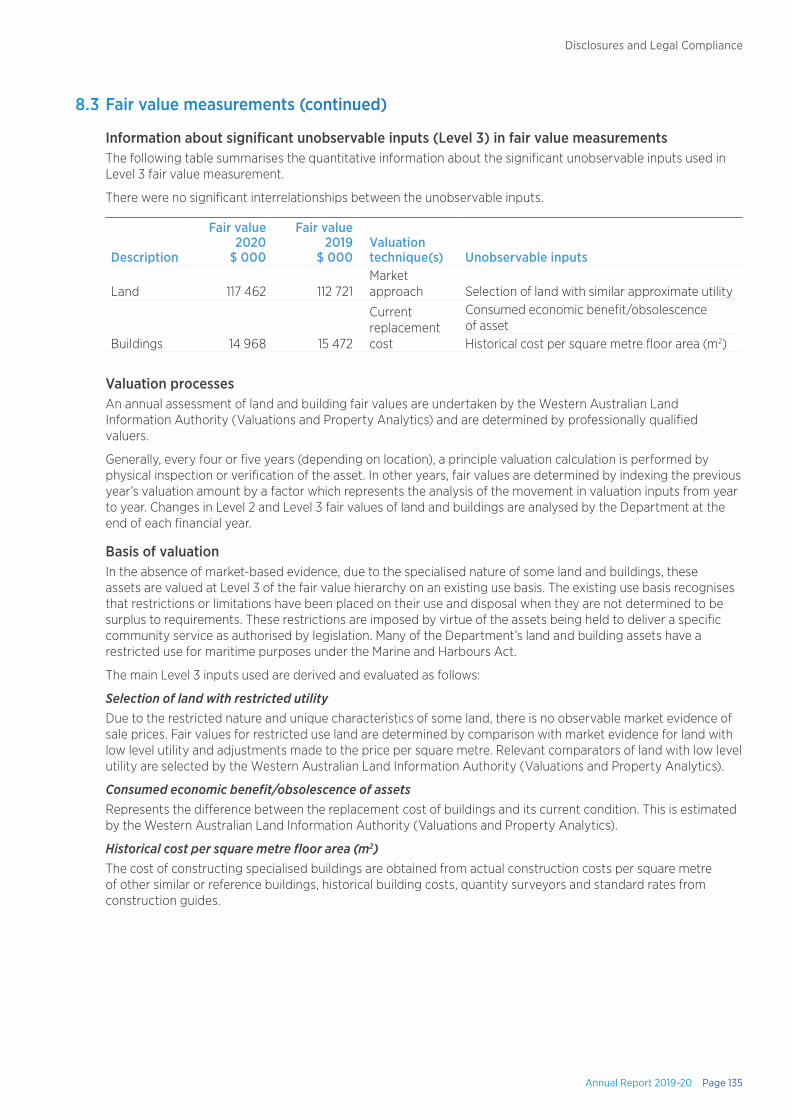
Annual Report 2019-20 Page 135
Disclosures and Legal Compliance
8.3 Fair value measurements (continued)
Information about significant unobservable inputs (Level 3) in fair value measurementsThe following table summarises the quantitative information about the significant unobservable inputs used in Level 3 fair value measurement.
There were no significant interrelationships between the unobservable inputs.
Description
Fair value 2020
$ 000
Fair value 2019
$ 000Valuation technique(s) Unobservable inputs
Land 117 462 112 721Market approach Selection of land with similar approximate utility
Buildings 14 968 15 472
Current replacement cost
Consumed economic benefit/obsolescence of assetHistorical cost per square metre floor area (m2)
Valuation processesAn annual assessment of land and building fair values are undertaken by the Western Australian Land Information Authority (Valuations and Property Analytics) and are determined by professionally qualified valuers.
Generally, every four or five years (depending on location), a principle valuation calculation is performed by physical inspection or verification of the asset. In other years, fair values are determined by indexing the previous year’s valuation amount by a factor which represents the analysis of the movement in valuation inputs from year to year. Changes in Level 2 and Level 3 fair values of land and buildings are analysed by the Department at the end of each financial year.
Basis of valuationIn the absence of market-based evidence, due to the specialised nature of some land and buildings, these assets are valued at Level 3 of the fair value hierarchy on an existing use basis. The existing use basis recognises that restrictions or limitations have been placed on their use and disposal when they are not determined to be surplus to requirements. These restrictions are imposed by virtue of the assets being held to deliver a specific community service as authorised by legislation. Many of the Department’s land and building assets have a restricted use for maritime purposes under the Marine and Harbours Act.
The main Level 3 inputs used are derived and evaluated as follows:
Selection of land with restricted utilityDue to the restricted nature and unique characteristics of some land, there is no observable market evidence of sale prices. Fair values for restricted use land are determined by comparison with market evidence for land with low level utility and adjustments made to the price per square metre. Relevant comparators of land with low level utility are selected by the Western Australian Land Information Authority (Valuations and Property Analytics).
Consumed economic benefit/obsolescence of assetsRepresents the difference between the replacement cost of buildings and its current condition. This is estimated by the Western Australian Land Information Authority (Valuations and Property Analytics).
Historical cost per square metre floor area (m2)The cost of constructing specialised buildings are obtained from actual construction costs per square metre of other similar or reference buildings, historical building costs, quantity surveyors and standard rates from construction guides.

Page 136 Department of Transport
Disclosures and Legal Compliance
9. Other disclosuresThis section includes additional material disclosures required by accounting standards or other pronouncements, for the understanding of this financial report.
Notes
Services provided free of charge 9.1
Initial application of Australian Accounting Standards 9.2
Future impact of Australian standards issued not yet operative 9.3
Key management personnel 9.4
Related party transactions 9.5
Jointly controlled assets 9.6
Special purpose accounts 9.7
Remuneration of auditors 9.8
Non-current assets classified as held for distribution to owners 9.9
Equity 9.10
Supplementary financial information 9.11
Indian Ocean Territories Service Level Agreement 9.12
Explanatory statement 9.13
Events occurring after the end of the financial year 9.14
9.1 Services provided free of charge
During the year the following services were provided to other agencies free of charge for functions outside the normal operations of the Department:
2020$ 000
2019$ 000
Department of Biodiversity, Conservation and Attractions Technical advice 3 -Department of Planning, Lands and Heritage Technical review and support 100 100Department of Primary Industries and Regional Development Technical functionality 13 336DevelopmentWA Technical advice 20 75Department of Water and Environmental Regulation Technical advice - -Office of the Environmental Protection Authority Technical review 50 50WA Conservation and Parks Commission Technical advice - -WA Country Health Service Technical advice and support 7 -Western Australian Police Force Provision of information 1 -
194 561
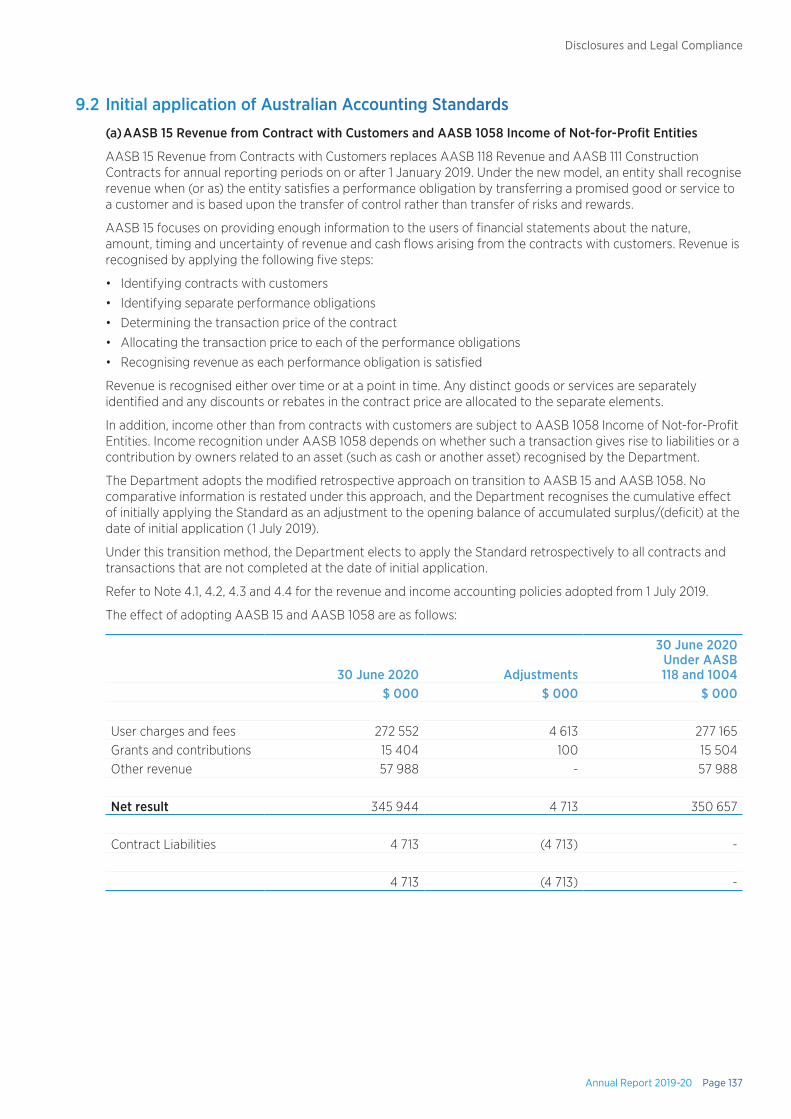
Annual Report 2019-20 Page 137
Disclosures and Legal Compliance
9.2 Initial application of Australian Accounting Standards
(a) AASB 15 Revenue from Contract with Customers and AASB 1058 Income of Not-for-Profit Entities
AASB 15 Revenue from Contracts with Customers replaces AASB 118 Revenue and AASB 111 Construction Contracts for annual reporting periods on or after 1 January 2019. Under the new model, an entity shall recognise revenue when (or as) the entity satisfies a performance obligation by transferring a promised good or service to a customer and is based upon the transfer of control rather than transfer of risks and rewards.
AASB 15 focuses on providing enough information to the users of financial statements about the nature, amount, timing and uncertainty of revenue and cash flows arising from the contracts with customers. Revenue is recognised by applying the following five steps:
• Identifying contracts with customers
• Identifying separate performance obligations
• Determining the transaction price of the contract
• Allocating the transaction price to each of the performance obligations
• Recognising revenue as each performance obligation is satisfied
Revenue is recognised either over time or at a point in time. Any distinct goods or services are separately identified and any discounts or rebates in the contract price are allocated to the separate elements.
In addition, income other than from contracts with customers are subject to AASB 1058 Income of Not-for-Profit Entities. Income recognition under AASB 1058 depends on whether such a transaction gives rise to liabilities or a contribution by owners related to an asset (such as cash or another asset) recognised by the Department.
The Department adopts the modified retrospective approach on transition to AASB 15 and AASB 1058. No comparative information is restated under this approach, and the Department recognises the cumulative effect of initially applying the Standard as an adjustment to the opening balance of accumulated surplus/(deficit) at the date of initial application (1 July 2019).
Under this transition method, the Department elects to apply the Standard retrospectively to all contracts and transactions that are not completed at the date of initial application.
Refer to Note 4.1, 4.2, 4.3 and 4.4 for the revenue and income accounting policies adopted from 1 July 2019.
The effect of adopting AASB 15 and AASB 1058 are as follows:
30 June 2020 Adjustments
30 June 2020 Under AASB 118 and 1004
$ 000 $ 000 $ 000
User charges and fees 272 552 4 613 277 165Grants and contributions 15 404 100 15 504Other revenue 57 988 - 57 988
Net result 345 944 4 713 350 657
Contract Liabilities 4 713 (4 713) -
4 713 (4 713) -
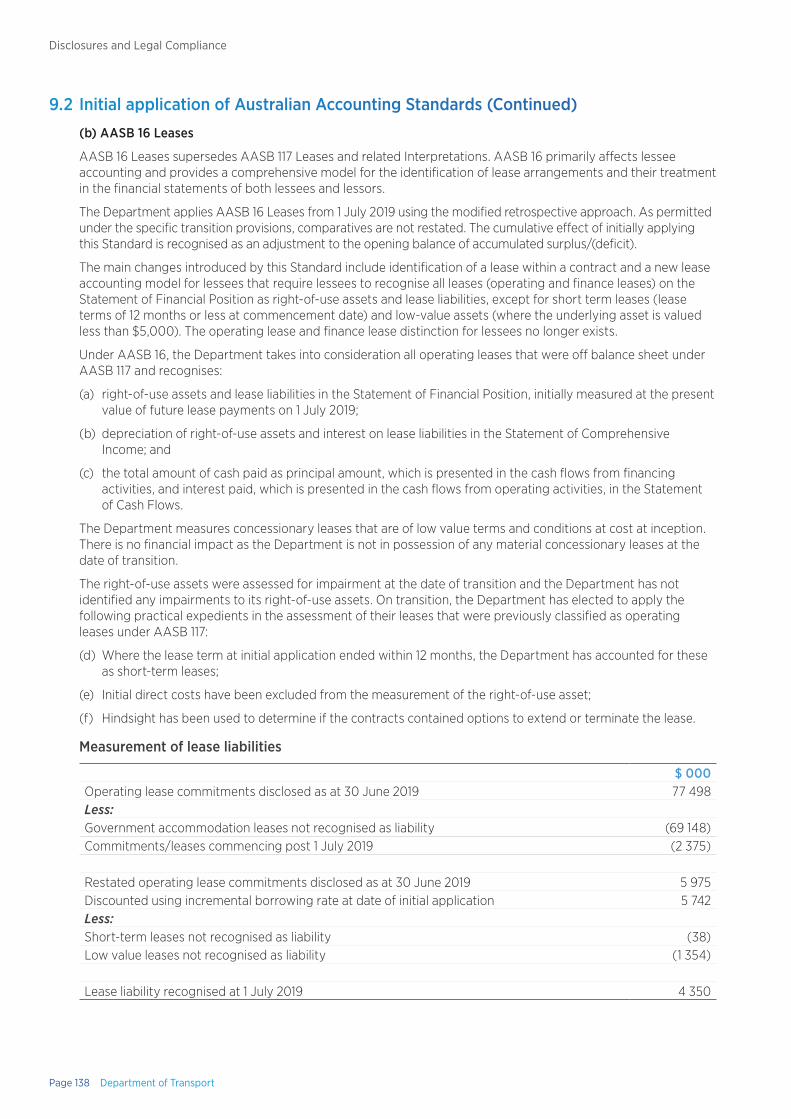
Page 138 Department of Transport
Disclosures and Legal Compliance
9.2 Initial application of Australian Accounting Standards (Continued)
(b) AASB 16 Leases
AASB 16 Leases supersedes AASB 117 Leases and related Interpretations. AASB 16 primarily affects lessee accounting and provides a comprehensive model for the identification of lease arrangements and their treatment in the financial statements of both lessees and lessors.
The Department applies AASB 16 Leases from 1 July 2019 using the modified retrospective approach. As permitted under the specific transition provisions, comparatives are not restated. The cumulative effect of initially applying this Standard is recognised as an adjustment to the opening balance of accumulated surplus/(deficit).
The main changes introduced by this Standard include identification of a lease within a contract and a new lease accounting model for lessees that require lessees to recognise all leases (operating and finance leases) on the Statement of Financial Position as right-of-use assets and lease liabilities, except for short term leases (lease terms of 12 months or less at commencement date) and low-value assets (where the underlying asset is valued less than $5,000). The operating lease and finance lease distinction for lessees no longer exists.
Under AASB 16, the Department takes into consideration all operating leases that were off balance sheet under AASB 117 and recognises:
(a) right-of-use assets and lease liabilities in the Statement of Financial Position, initially measured at the present value of future lease payments on 1 July 2019;
(b) depreciation of right-of-use assets and interest on lease liabilities in the Statement of Comprehensive Income; and
(c) the total amount of cash paid as principal amount, which is presented in the cash flows from financing activities, and interest paid, which is presented in the cash flows from operating activities, in the Statement of Cash Flows.
The Department measures concessionary leases that are of low value terms and conditions at cost at inception. There is no financial impact as the Department is not in possession of any material concessionary leases at the date of transition.
The right-of-use assets were assessed for impairment at the date of transition and the Department has not identified any impairments to its right-of-use assets. On transition, the Department has elected to apply the following practical expedients in the assessment of their leases that were previously classified as operating leases under AASB 117:
(d) Where the lease term at initial application ended within 12 months, the Department has accounted for these as short-term leases;
(e) Initial direct costs have been excluded from the measurement of the right-of-use asset;
(f) Hindsight has been used to determine if the contracts contained options to extend or terminate the lease.
Measurement of lease liabilities
$ 000Operating lease commitments disclosed as at 30 June 2019 77 498Less:Government accommodation leases not recognised as liability (69 148)Commitments/leases commencing post 1 July 2019 (2 375)
Restated operating lease commitments disclosed as at 30 June 2019 5 975Discounted using incremental borrowing rate at date of initial application 5 742Less:Short-term leases not recognised as liability (38)Low value leases not recognised as liability (1 354)
Lease liability recognised at 1 July 2019 4 350

Annual Report 2019-20 Page 139
Disclosures and Legal Compliance
9.3 Future impact of Australian standards issued not yet operative
The Department cannot early adopt an Australian Accounting Standard unless specifically permitted by Treasurer’s instruction 1101 ‘Application of Australian Accounting Standards and Other Pronouncements’ or by an exemption from Treasurer’s instruction 1101. Where applicable, the Department plans to apply the following Australian Accounting Standards from their application date.
Operative for financial years commencing after 1 Jan 2020AASB 1059 Service Concession Arrangements: Grantors
This Standard addresses the accounting for a service concession arrangement (a type of public private partnership) by a grantor that is a public-sector agency by prescribing the accounting for the arrangement from the grantor’s perspective. Timing and measurement for the recognition of a specific asset class occurs on commencement of the arrangement and the accounting for associated liabilities is determined by whether the grantee is paid by the grantor or users of the public service provided. The Department has not identified any public private partnerships within scope of the Standard.
AASB 2018-6 Amendments to Australian Accounting Standards –Definition of a Business
The Standard amends AASB 3 to clarify the definition of a business, assisting entities to determine whether a transaction should be accounted for as a business combination or as an asset acquisition. There is no financial impact.
AASB 2018-7 Amendments to Australian Accounting Standards –Definition of Material
The Standard principally amends AASB 101 and AASB 108. The amendments refine the definition of material in AASB 101. The amendments clarify the definition of material and its application by improving the wording and aligning the definition across AASB Standards and other publications. The amendment also includes some supporting requirements in AASB 101 in the definition to give it more prominence and clarifies the explanation accompanying the definition of material. There is no financial impact.
AASB 2019-1 Amendments to Australian Accounting Standards – References to the Conceptual Framework
This Standard sets out amendments to Australian Accounting Standards, Interpretations and other pronouncements to reflect the issuance of the Conceptual Framework for Financial Reporting (Conceptual Framework) by the AASB. There is no financial impact.
AASB 2019-2 Amendments to Australian Accounting Standards – Implementation of AASB 1059
This Standard makes amendments to AASB 16 and AASB 1059 to: (a) amend the modified retrospective method set out in paragraph C4 of AASB 1059; (b) modify AASB 16 to provide a practical expedient to grantors of service concession arrangements so that AASB 16 would not need to be applied to assets that would be recognised as service concession assets under AASB 1059; and (c) include editorial amendments to the application guidance and implementation guidance accompanying AASB 1059
The Department does not maintain any public private partnership that is within the scope of the Standard.
Operative for financial years commencing after 1 Jan 2022AASB 2020-1 Amendments to Australian Accounting Standards – Classification of Liabilities as Current or Non-current
This Standard amends AASB 101 to clarify requirements for the presentation of liabilities in the statement of financial position as current or non-current. There is no financial impact.
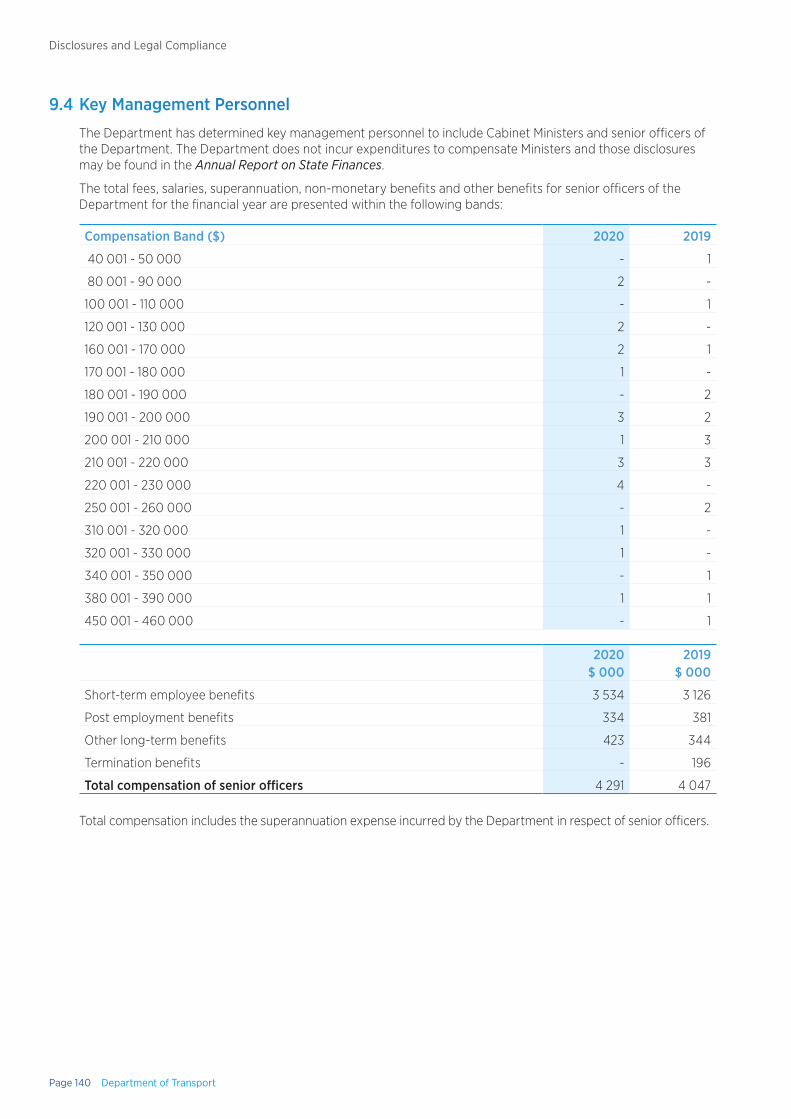
Page 140 Department of Transport
Disclosures and Legal Compliance
9.4 Key Management Personnel
The Department has determined key management personnel to include Cabinet Ministers and senior officers of the Department. The Department does not incur expenditures to compensate Ministers and those disclosures may be found in the Annual Report on State Finances.
The total fees, salaries, superannuation, non-monetary benefits and other benefits for senior officers of the Department for the financial year are presented within the following bands:
Compensation Band ($) 2020 2019
40 001 - 50 000 - 1
80 001 - 90 000 2 -
100 001 - 110 000 - 1
120 001 - 130 000 2 -
160 001 - 170 000 2 1
170 001 - 180 000 1 -
180 001 - 190 000 - 2
190 001 - 200 000 3 2
200 001 - 210 000 1 3
210 001 - 220 000 3 3
220 001 - 230 000 4 -
250 001 - 260 000 - 2
310 001 - 320 000 1 -
320 001 - 330 000 1 -
340 001 - 350 000 - 1
380 001 - 390 000 1 1
450 001 - 460 000 - 1
2020$ 000
2019$ 000
Short-term employee benefits 3 534 3 126
Post employment benefits 334 381
Other long-term benefits 423 344
Termination benefits - 196
Total compensation of senior officers 4 291 4 047
Total compensation includes the superannuation expense incurred by the Department in respect of senior officers.
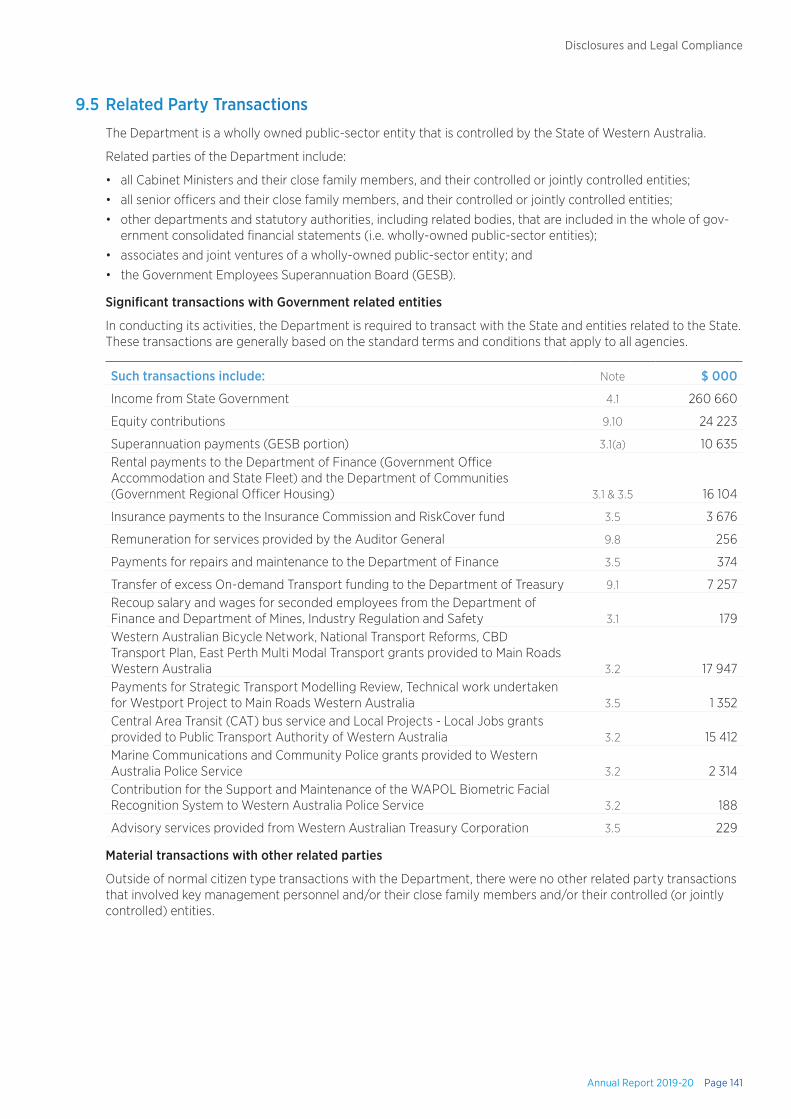
Annual Report 2019-20 Page 141
Disclosures and Legal Compliance
9.5 Related Party Transactions
The Department is a wholly owned public-sector entity that is controlled by the State of Western Australia.
Related parties of the Department include:
• all Cabinet Ministers and their close family members, and their controlled or jointly controlled entities;
• all senior officers and their close family members, and their controlled or jointly controlled entities;
• other departments and statutory authorities, including related bodies, that are included in the whole of gov-ernment consolidated financial statements (i.e. wholly-owned public-sector entities);
• associates and joint ventures of a wholly-owned public-sector entity; and
• the Government Employees Superannuation Board (GESB).
Significant transactions with Government related entities
In conducting its activities, the Department is required to transact with the State and entities related to the State. These transactions are generally based on the standard terms and conditions that apply to all agencies.
Such transactions include: Note $ 000
Income from State Government 4.1 260 660
Equity contributions 9.10 24 223
Superannuation payments (GESB portion) 3.1(a) 10 635Rental payments to the Department of Finance (Government Office Accommodation and State Fleet) and the Department of Communities (Government Regional Officer Housing) 3.1 & 3.5 16 104
Insurance payments to the Insurance Commission and RiskCover fund 3.5 3 676
Remuneration for services provided by the Auditor General 9.8 256
Payments for repairs and maintenance to the Department of Finance 3.5 374
Transfer of excess On-demand Transport funding to the Department of Treasury 9.1 7 257Recoup salary and wages for seconded employees from the Department of Finance and Department of Mines, Industry Regulation and Safety 3.1 179Western Australian Bicycle Network, National Transport Reforms, CBD Transport Plan, East Perth Multi Modal Transport grants provided to Main Roads Western Australia 3.2 17 947Payments for Strategic Transport Modelling Review, Technical work undertaken for Westport Project to Main Roads Western Australia 3.5 1 352Central Area Transit (CAT) bus service and Local Projects - Local Jobs grants provided to Public Transport Authority of Western Australia 3.2 15 412Marine Communications and Community Police grants provided to Western Australia Police Service 3.2 2 314Contribution for the Support and Maintenance of the WAPOL Biometric Facial Recognition System to Western Australia Police Service 3.2 188
Advisory services provided from Western Australian Treasury Corporation 3.5 229
Material transactions with other related parties
Outside of normal citizen type transactions with the Department, there were no other related party transactions that involved key management personnel and/or their close family members and/or their controlled (or jointly controlled) entities.
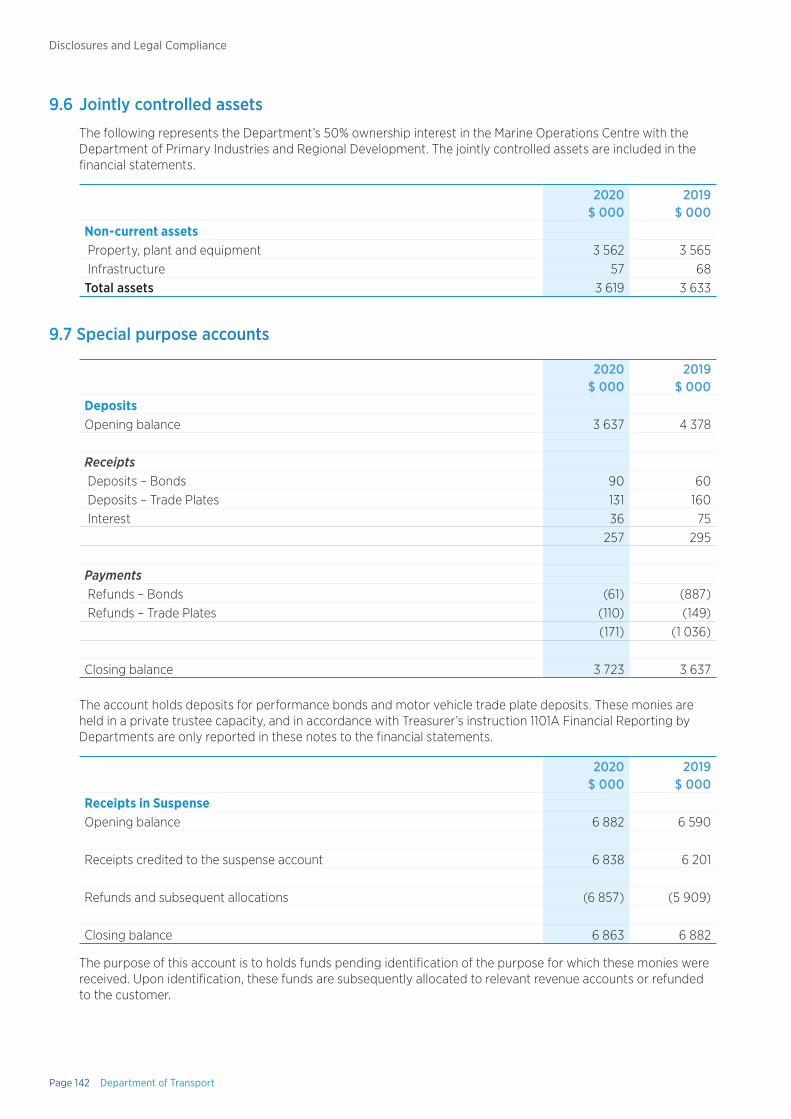
Page 142 Department of Transport
Disclosures and Legal Compliance
9.6 Jointly controlled assets
The following represents the Department’s 50% ownership interest in the Marine Operations Centre with the Department of Primary Industries and Regional Development. The jointly controlled assets are included in the financial statements.
2020$ 000
2019$ 000
Non-current assets Property, plant and equipment 3 562 3 565 Infrastructure 57 68Total assets 3 619 3 633
9.7 Special purpose accounts
2020$ 000
2019$ 000
DepositsOpening balance 3 637 4 378
Receipts Deposits – Bonds 90 60 Deposits – Trade Plates 131 160 Interest 36 75
257 295
Payments Refunds – Bonds (61) (887) Refunds – Trade Plates (110) (149)
(171) (1 036)
Closing balance 3 723 3 637
The account holds deposits for performance bonds and motor vehicle trade plate deposits. These monies are held in a private trustee capacity, and in accordance with Treasurer’s instruction 1101A Financial Reporting by Departments are only reported in these notes to the financial statements.
2020$ 000
2019$ 000
Receipts in SuspenseOpening balance 6 882 6 590
Receipts credited to the suspense account 6 838 6 201
Refunds and subsequent allocations (6 857) (5 909)
Closing balance 6 863 6 882
The purpose of this account is to holds funds pending identification of the purpose for which these monies were received. Upon identification, these funds are subsequently allocated to relevant revenue accounts or refunded to the customer.
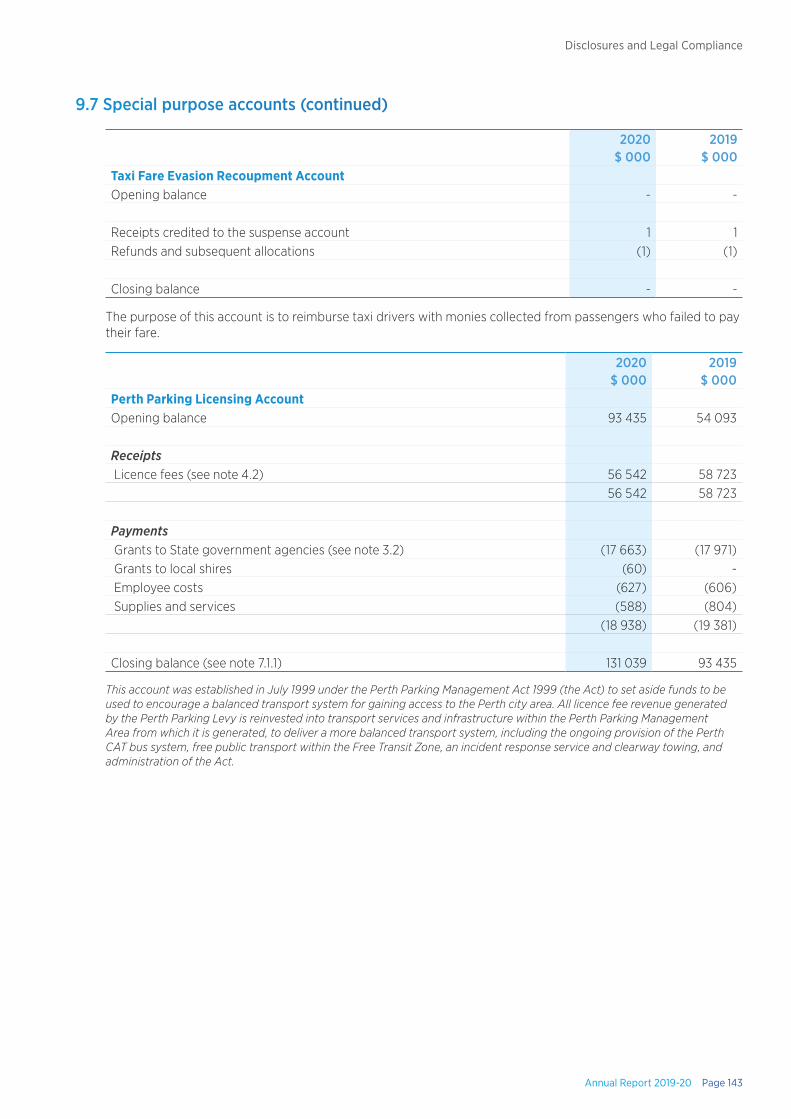
Annual Report 2019-20 Page 143
Disclosures and Legal Compliance
9.7 Special purpose accounts (continued)
2020$ 000
2019$ 000
Taxi Fare Evasion Recoupment AccountOpening balance - -
Receipts credited to the suspense account 1 1Refunds and subsequent allocations (1) (1)
Closing balance - -
The purpose of this account is to reimburse taxi drivers with monies collected from passengers who failed to pay their fare.
2020$ 000
2019$ 000
Perth Parking Licensing AccountOpening balance 93 435 54 093
Receipts Licence fees (see note 4.2) 56 542 58 723
56 542 58 723
Payments Grants to State government agencies (see note 3.2) (17 663) (17 971) Grants to local shires (60) - Employee costs (627) (606) Supplies and services (588) (804)
(18 938) (19 381)
Closing balance (see note 7.1.1) 131 039 93 435
This account was established in July 1999 under the Perth Parking Management Act 1999 (the Act) to set aside funds to be used to encourage a balanced transport system for gaining access to the Perth city area. All licence fee revenue generated by the Perth Parking Levy is reinvested into transport services and infrastructure within the Perth Parking Management Area from which it is generated, to deliver a more balanced transport system, including the ongoing provision of the Perth CAT bus system, free public transport within the Free Transit Zone, an incident response service and clearway towing, and administration of the Act.
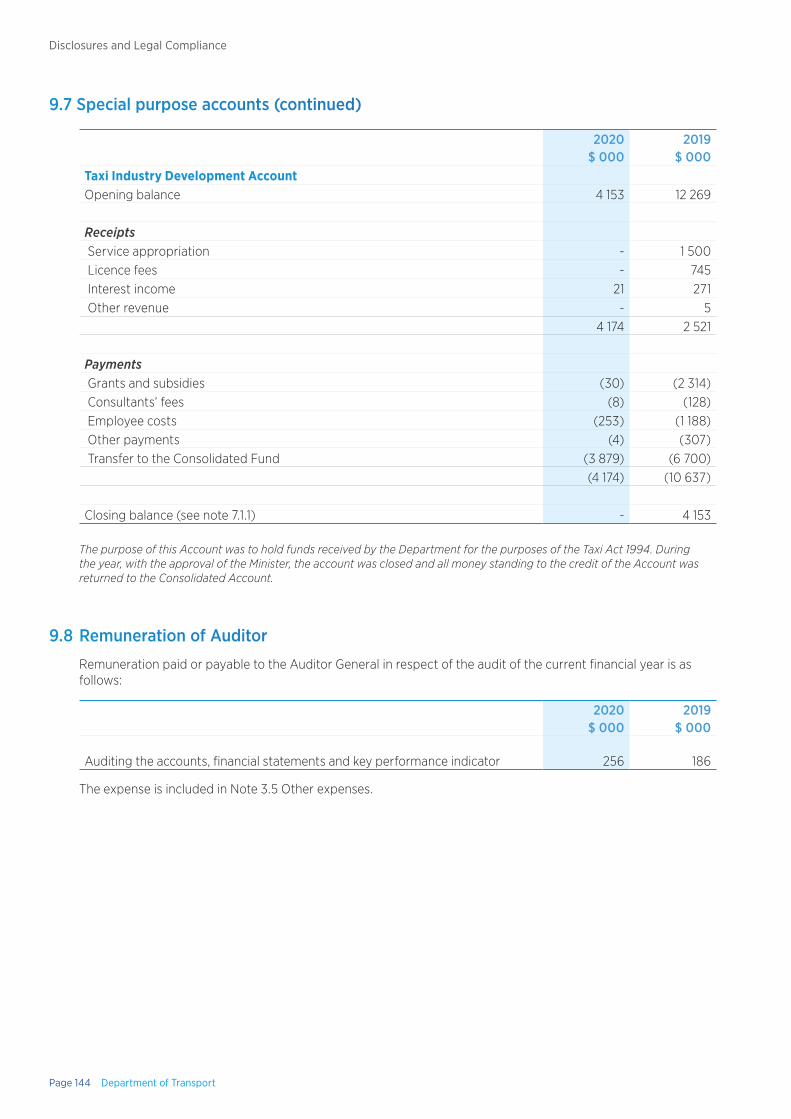
Page 144 Department of Transport
Disclosures and Legal Compliance
9.7 Special purpose accounts (continued)
2020$ 000
2019$ 000
Taxi Industry Development AccountOpening balance 4 153 12 269
Receipts Service appropriation - 1 500 Licence fees - 745 Interest income 21 271 Other revenue - 5
4 174 2 521
Payments Grants and subsidies (30) (2 314) Consultants’ fees (8) (128) Employee costs (253) (1 188) Other payments (4) (307) Transfer to the Consolidated Fund (3 879) (6 700)
(4 174) (10 637)
Closing balance (see note 7.1.1) - 4 153
The purpose of this Account was to hold funds received by the Department for the purposes of the Taxi Act 1994. During the year, with the approval of the Minister, the account was closed and all money standing to the credit of the Account was returned to the Consolidated Account.
9.8 Remuneration of Auditor
Remuneration paid or payable to the Auditor General in respect of the audit of the current financial year is as follows:
2020$ 000
2019$ 000
Auditing the accounts, financial statements and key performance indicator 256 186
The expense is included in Note 3.5 Other expenses.
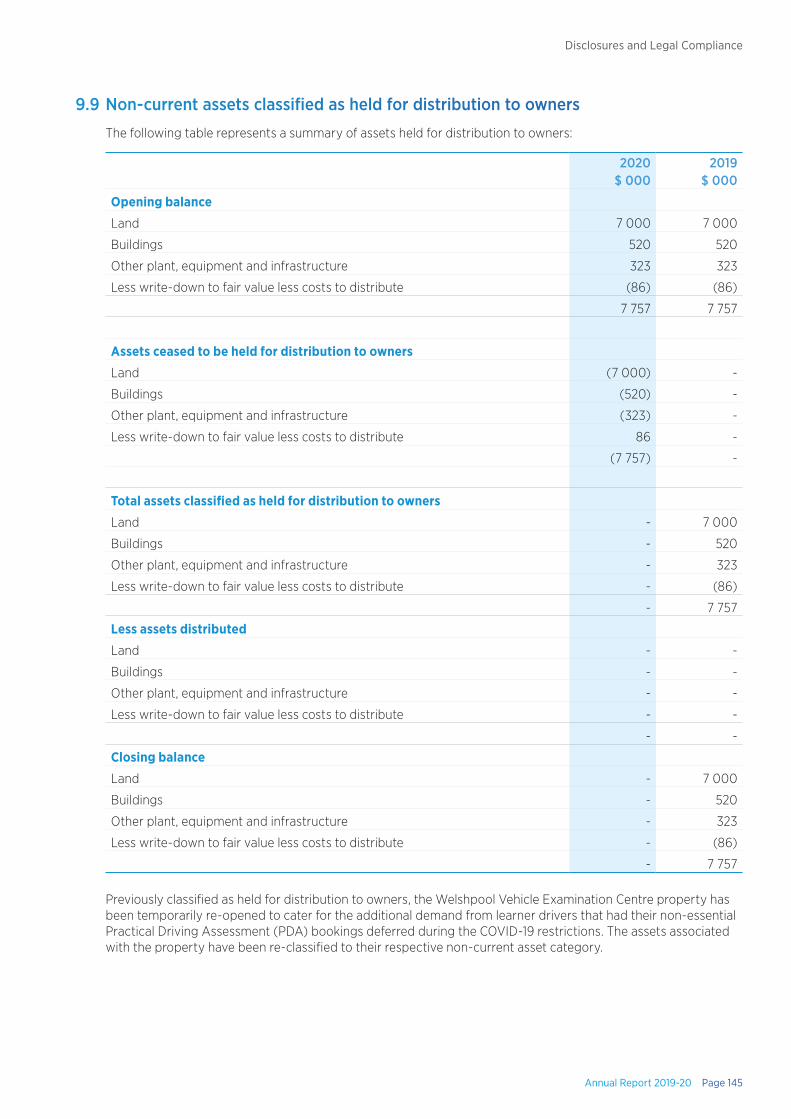
Annual Report 2019-20 Page 145
Disclosures and Legal Compliance
9.9 Non-current assets classified as held for distribution to owners
The following table represents a summary of assets held for distribution to owners:
2020$ 000
2019$ 000
Opening balance
Land 7 000 7 000
Buildings 520 520
Other plant, equipment and infrastructure 323 323
Less write-down to fair value less costs to distribute (86) (86)
7 757 7 757
Assets ceased to be held for distribution to owners
Land (7 000) -
Buildings (520) -
Other plant, equipment and infrastructure (323) -
Less write-down to fair value less costs to distribute 86 -
(7 757) -
Total assets classified as held for distribution to owners
Land - 7 000
Buildings - 520
Other plant, equipment and infrastructure - 323
Less write-down to fair value less costs to distribute - (86)
- 7 757
Less assets distributed
Land - -
Buildings - -
Other plant, equipment and infrastructure - -
Less write-down to fair value less costs to distribute - -
- -
Closing balance
Land - 7 000
Buildings - 520
Other plant, equipment and infrastructure - 323
Less write-down to fair value less costs to distribute - (86)
- 7 757
Previously classified as held for distribution to owners, the Welshpool Vehicle Examination Centre property has been temporarily re-opened to cater for the additional demand from learner drivers that had their non-essential Practical Driving Assessment (PDA) bookings deferred during the COVID-19 restrictions. The assets associated with the property have been re-classified to their respective non-current asset category.
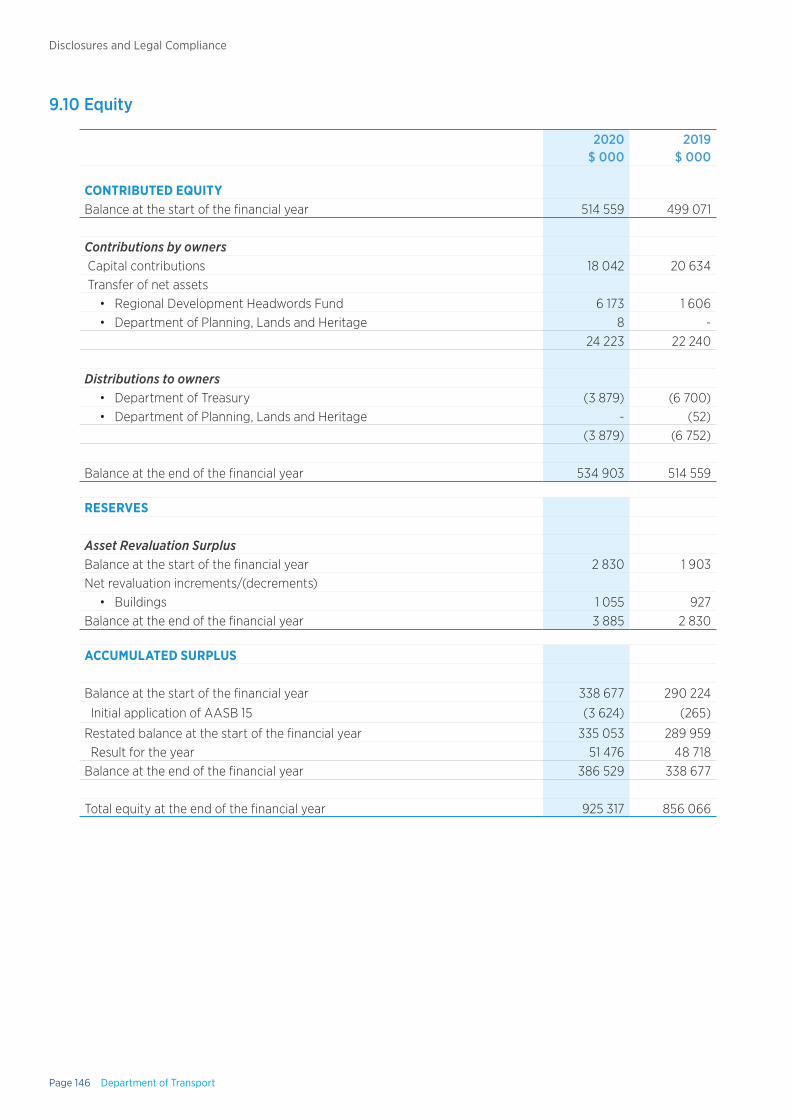
Page 146 Department of Transport
Disclosures and Legal Compliance
9.10 Equity
2020$ 000
2019$ 000
CONTRIBUTED EQUITYBalance at the start of the financial year 514 559 499 071
Contributions by owners Capital contributions 18 042 20 634 Transfer of net assets
• Regional Development Headwords Fund 6 173 1 606• Department of Planning, Lands and Heritage 8 -
24 223 22 240
Distributions to owners• Department of Treasury (3 879) (6 700)• Department of Planning, Lands and Heritage - (52)
(3 879) (6 752)
Balance at the end of the financial year 534 903 514 559
RESERVES
Asset Revaluation SurplusBalance at the start of the financial year 2 830 1 903Net revaluation increments/(decrements)
• Buildings 1 055 927Balance at the end of the financial year 3 885 2 830
ACCUMULATED SURPLUS
Balance at the start of the financial year 338 677 290 224
Initial application of AASB 15 (3 624) (265)
Restated balance at the start of the financial year 335 053 289 959Result for the year 51 476 48 718
Balance at the end of the financial year 386 529 338 677
Total equity at the end of the financial year 925 317 856 066

Annual Report 2019-20 Page 147
Disclosures and Legal Compliance
9.11 Supplementary financial information
(a) Write-offsPublic and other property, revenue and debts due to the State were written-off in accordance with section 48 of the Financial Management Act 2006 under the authority of:
2020$ 000
2019$ 000
(i) Bad Debts The Accountable Authority 42 107
All of the debts written off had previously been provided for.
2020$ 000
2019$ 000
(ii) Assets The Accountable Authority 41 2
(b) Losses through theft, defaults and other causesThe Department suffered no losses of public money or other property through theft, defaults or other causes during the current financial year.
(c) Gifts of public propertyThe Department provided no gifts of public property during the current financial year.
9.12 Indian Ocean Territories Service Level Agreement
The provision of services to the Indian Ocean Territories is recouped from the Commonwealth government.
2020$ 000
2019$ 000
Balance at the start of the year 77 63
Receipts 907 809Payments (853) (795)
Balance at the end of the year 131 77
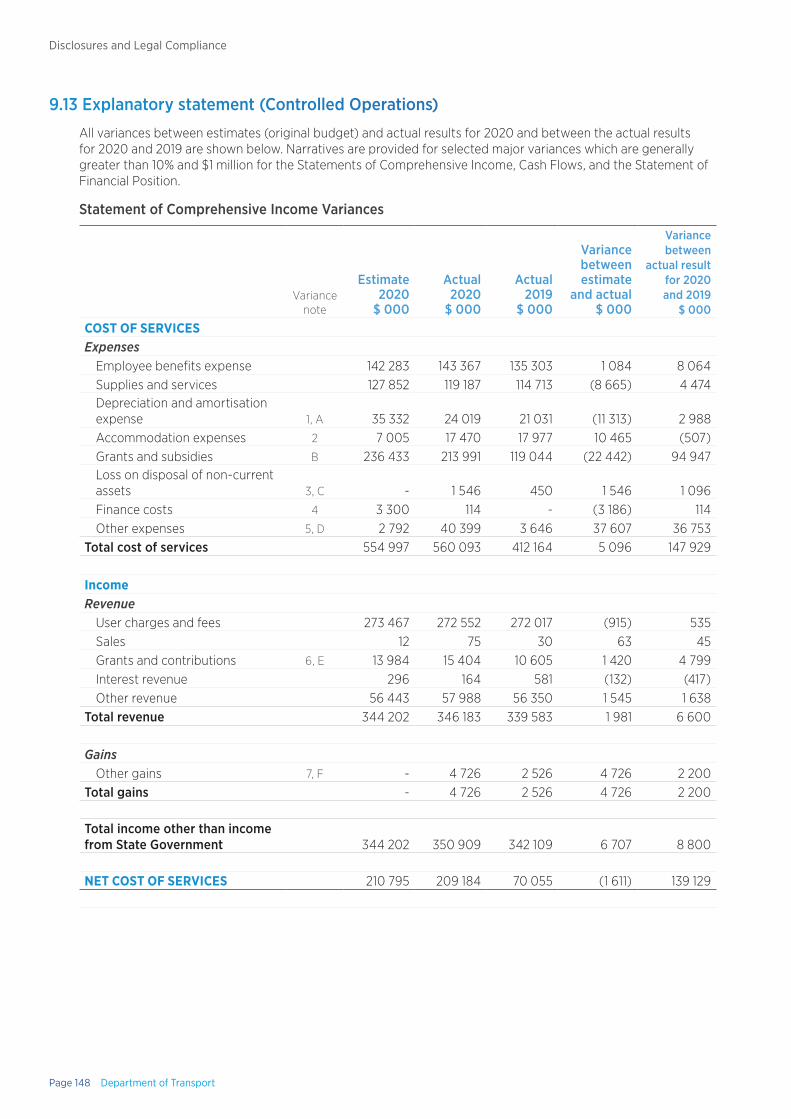
Page 148 Department of Transport
Disclosures and Legal Compliance
9.13 Explanatory statement (Controlled Operations)
All variances between estimates (original budget) and actual results for 2020 and between the actual results for 2020 and 2019 are shown below. Narratives are provided for selected major variances which are generally greater than 10% and $1 million for the Statements of Comprehensive Income, Cash Flows, and the Statement of Financial Position.
Statement of Comprehensive Income Variances
Variance note
Estimate 2020
$ 000
Actual 2020
$ 000
Actual 2019
$ 000
Variance between estimate
and actual$ 000
Variance between
actual result for 2020 and 2019
$ 000
COST OF SERVICESExpenses
Employee benefits expense 142 283 143 367 135 303 1 084 8 064Supplies and services 127 852 119 187 114 713 (8 665) 4 474Depreciation and amortisation expense 1, A 35 332 24 019 21 031 (11 313) 2 988Accommodation expenses 2 7 005 17 470 17 977 10 465 (507)Grants and subsidies B 236 433 213 991 119 044 (22 442) 94 947Loss on disposal of non-current assets 3, C - 1 546 450 1 546 1 096Finance costs 4 3 300 114 - (3 186) 114Other expenses 5, D 2 792 40 399 3 646 37 607 36 753
Total cost of services 554 997 560 093 412 164 5 096 147 929
IncomeRevenue
User charges and fees 273 467 272 552 272 017 (915) 535Sales 12 75 30 63 45Grants and contributions 6, E 13 984 15 404 10 605 1 420 4 799Interest revenue 296 164 581 (132) (417)Other revenue 56 443 57 988 56 350 1 545 1 638
Total revenue 344 202 346 183 339 583 1 981 6 600
GainsOther gains 7, F - 4 726 2 526 4 726 2 200
Total gains - 4 726 2 526 4 726 2 200
Total income other than income from State Government 344 202 350 909 342 109 6 707 8 800
NET COST OF SERVICES 210 795 209 184 70 055 (1 611) 139 129
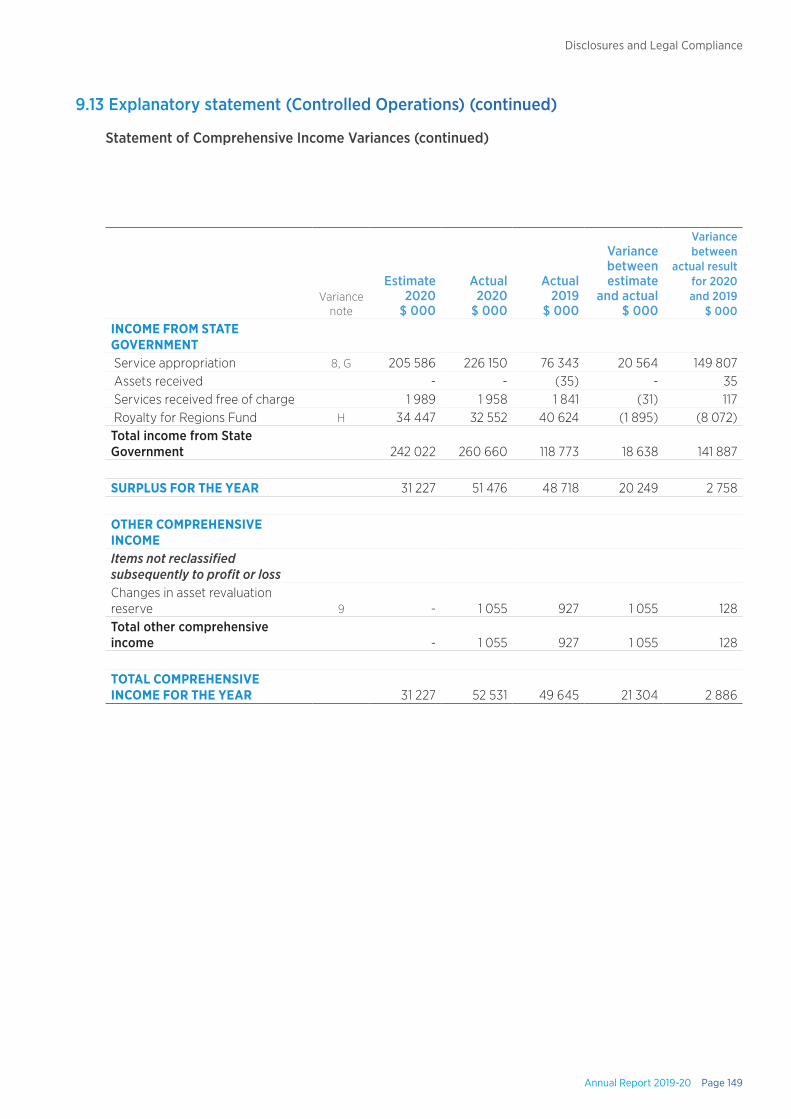
Annual Report 2019-20 Page 149
Disclosures and Legal Compliance
Variance note
Estimate 2020
$ 000
Actual 2020
$ 000
Actual 2019
$ 000
Variance between estimate
and actual$ 000
Variance between
actual result for 2020 and 2019
$ 000INCOME FROM STATE GOVERNMENT Service appropriation 8, G 205 586 226 150 76 343 20 564 149 807 Assets received - - (35) - 35 Services received free of charge 1 989 1 958 1 841 (31) 117 Royalty for Regions Fund H 34 447 32 552 40 624 (1 895) (8 072)Total income from State Government 242 022 260 660 118 773 18 638 141 887
SURPLUS FOR THE YEAR 31 227 51 476 48 718 20 249 2 758
OTHER COMPREHENSIVE INCOMEItems not reclassified subsequently to profit or lossChanges in asset revaluation reserve 9 - 1 055 927 1 055 128Total other comprehensive income - 1 055 927 1 055 128
TOTAL COMPREHENSIVE INCOME FOR THE YEAR 31 227 52 531 49 645 21 304 2 886
9.13 Explanatory statement (Controlled Operations) (continued)
Statement of Comprehensive Income Variances (continued)
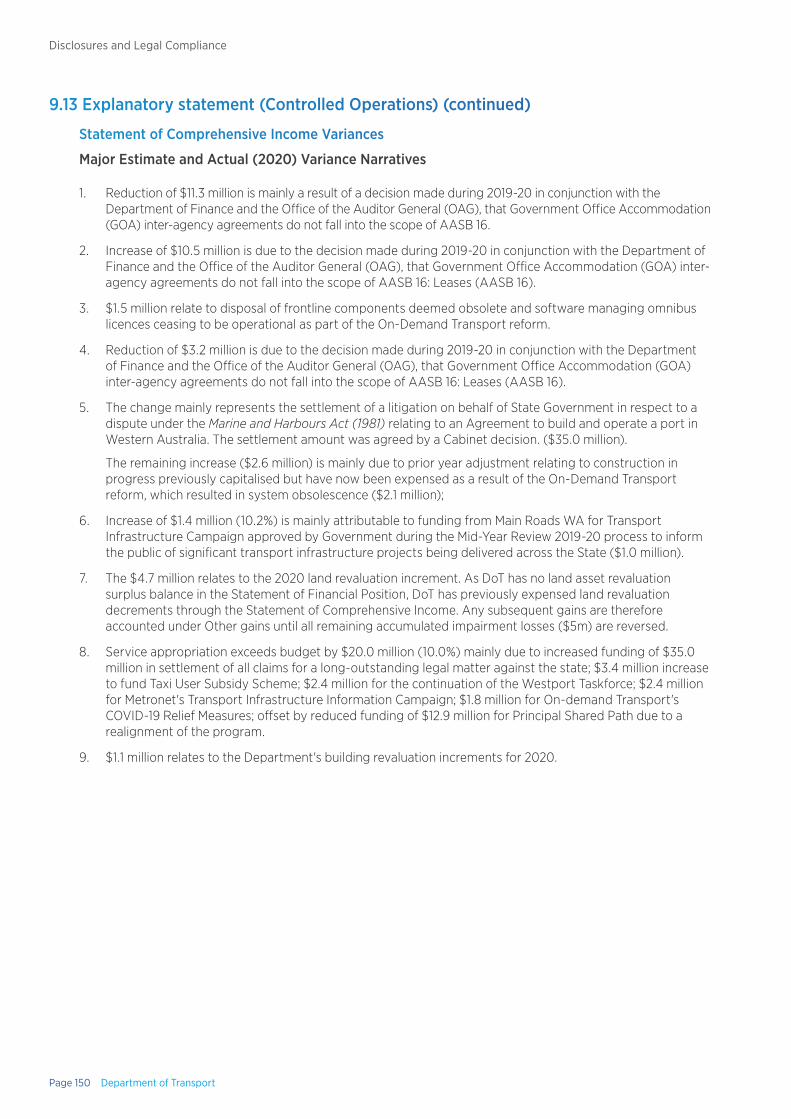
Page 150 Department of Transport
Disclosures and Legal Compliance
9.13 Explanatory statement (Controlled Operations) (continued)
Statement of Comprehensive Income Variances
Major Estimate and Actual (2020) Variance Narratives
1. Reduction of $11.3 million is mainly a result of a decision made during 2019-20 in conjunction with the Department of Finance and the Office of the Auditor General (OAG), that Government Office Accommodation (GOA) inter-agency agreements do not fall into the scope of AASB 16.
2. Increase of $10.5 million is due to the decision made during 2019-20 in conjunction with the Department of Finance and the Office of the Auditor General (OAG), that Government Office Accommodation (GOA) inter-agency agreements do not fall into the scope of AASB 16: Leases (AASB 16).
3. $1.5 million relate to disposal of frontline components deemed obsolete and software managing omnibus licences ceasing to be operational as part of the On-Demand Transport reform.
4. Reduction of $3.2 million is due to the decision made during 2019-20 in conjunction with the Department of Finance and the Office of the Auditor General (OAG), that Government Office Accommodation (GOA) inter-agency agreements do not fall into the scope of AASB 16: Leases (AASB 16).
5. The change mainly represents the settlement of a litigation on behalf of State Government in respect to a dispute under the Marine and Harbours Act (1981) relating to an Agreement to build and operate a port in Western Australia. The settlement amount was agreed by a Cabinet decision. ($35.0 million).
The remaining increase ($2.6 million) is mainly due to prior year adjustment relating to construction in progress previously capitalised but have now been expensed as a result of the On-Demand Transport reform, which resulted in system obsolescence ($2.1 million);
6. Increase of $1.4 million (10.2%) is mainly attributable to funding from Main Roads WA for Transport Infrastructure Campaign approved by Government during the Mid-Year Review 2019-20 process to inform the public of significant transport infrastructure projects being delivered across the State ($1.0 million).
7. The $4.7 million relates to the 2020 land revaluation increment. As DoT has no land asset revaluation surplus balance in the Statement of Financial Position, DoT has previously expensed land revaluation decrements through the Statement of Comprehensive Income. Any subsequent gains are therefore accounted under Other gains until all remaining accumulated impairment losses ($5m) are reversed.
8. Service appropriation exceeds budget by $20.0 million (10.0%) mainly due to increased funding of $35.0 million in settlement of all claims for a long-outstanding legal matter against the state; $3.4 million increase to fund Taxi User Subsidy Scheme; $2.4 million for the continuation of the Westport Taskforce; $2.4 million for Metronet's Transport Infrastructure Information Campaign; $1.8 million for On-demand Transport's COVID-19 Relief Measures; offset by reduced funding of $12.9 million for Principal Shared Path due to a realignment of the program.
9. $1.1 million relates to the Department's building revaluation increments for 2020.
Annual Report 2019-20 Page 151
Disclosures and Legal Compliance
Major Actual (2020) and Comparative (2019) Variance Narratives
A. The increase of $2.99 million is mainly attributable to the introduction of AASB 16 in 2020 that requires recognition of assets and liabilities for all leases with a term of more than 12 months. Consequently, depreciation has been recognised for these right-of-use assets in 2020.
B. Grants and Subsidies increased in 2020 by $94.8 million (79.6%) mainly due to industry funded buy-back scheme of owned taxi plates ($118.2 million) as part of the implementation of the new direction for the on-demand (taxi and charter) industry. This is partly offset by reduced spend in 2020 of $13.0 million for Principal Shared Paths due to the cashflow of the program.
C. The difference of $1.1 million (243.6%) between the 2 years represents a general retirement of various DoT assets as well as frontline systems that were deemed obsolete as a result of the On-demand Transport reform.
D. The change mainly represents the settlement of a litigation on behalf of State Government in respect to a dispute under the Marine and Harbours Act (1981) relating to an Agreement to build and operate a port in Western Australia. The settlement amount was agreed by a Cabinet decision. ($35.0 million).
The remaining increase of $1.7 million (47.4%) is mainly due to prior year adjustment relating to the On-demand Transport reform ($2.1 million). This has resulted in system technology changes which has led to construction in progress components being obsolete.
E. Grants and Subsidies revenue increased by $4.8 million (45.3%) primarily due to funding from Main Roads WA for the WA Bicycle Network ($2.3 million) and Transport Infrastructure Campaign ($1.0 million); $0.4 million for Information Technology costs associated with the move to Kings Square, Fremantle funded by Department of Finance.
F. The $2.2 million represents the increase in land revaluation increments from the previous year.
G. Service Appropriation increased by $149.8 million (196.2%) over 2019 primarily due to the voluntary Taxi Plate Buy Back Scheme ($118.6 million) and Ex Gratia Payment in settlement of all claims for a long-outstanding legal matter against the state. ($35.0 million).
H. Royalties for Region (RfR) Fund in 2020 is $8.1 million less than 2019 due to different funding requirements for RFR programs between the 2 years. For example, the Geraldton Airway Runway program funding is offset by the introduction of new RfR programs such as Regional Aviation Support COVID-19.
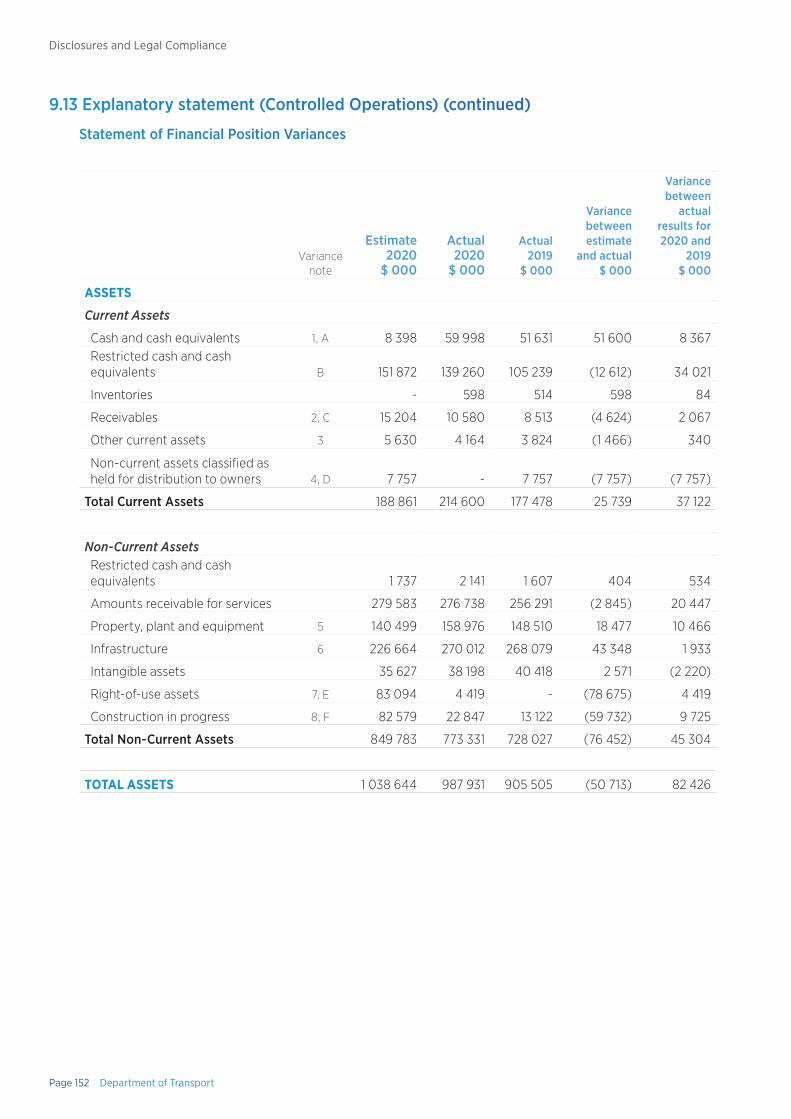
Page 152 Department of Transport
Disclosures and Legal Compliance
9.13 Explanatory statement (Controlled Operations) (continued)
Statement of Financial Position Variances
Variance note
Estimate 2020
$ 000
Actual 2020
$ 000
Actual 2019
$ 000
Variance between estimate
and actual$ 000
Variance between
actual results for 2020 and
2019 $ 000
ASSETS
Current Assets
Cash and cash equivalents 1, A 8 398 59 998 51 631 51 600 8 367 Restricted cash and cash equivalents B 151 872 139 260 105 239 (12 612) 34 021
Inventories - 598 514 598 84
Receivables 2, C 15 204 10 580 8 513 (4 624) 2 067
Other current assets 3 5 630 4 164 3 824 (1 466) 340
Non-current assets classified as held for distribution to owners 4, D
7 757 -
7 757
(7 757)
(7 757)
Total Current Assets 188 861 214 600 177 478 25 739 37 122
Non-Current AssetsRestricted cash and cash equivalents 1 737 2 141 1 607 404 534
Amounts receivable for services 279 583 276 738 256 291 (2 845) 20 447
Property, plant and equipment 5 140 499 158 976 148 510 18 477 10 466
Infrastructure 6 226 664 270 012 268 079 43 348 1 933
Intangible assets 35 627 38 198 40 418 2 571 (2 220)
Right-of-use assets 7, E 83 094 4 419 - (78 675) 4 419
Construction in progress 8, F 82 579 22 847 13 122 (59 732) 9 725
Total Non-Current Assets 849 783 773 331 728 027 (76 452) 45 304
TOTAL ASSETS 1 038 644 987 931 905 505 (50 713) 82 426
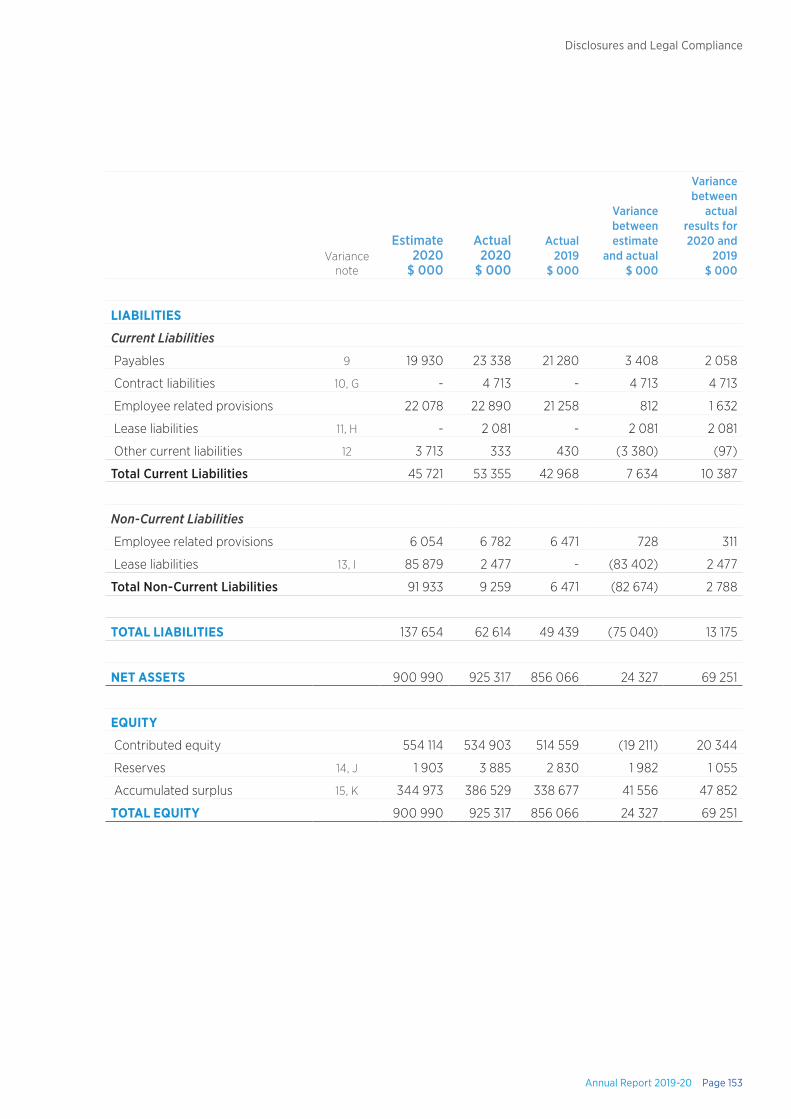
Annual Report 2019-20 Page 153
Disclosures and Legal Compliance
Variance note
Estimate 2020
$ 000
Actual 2020
$ 000
Actual 2019
$ 000
Variance between estimate
and actual$ 000
Variance between
actual results for 2020 and
2019 $ 000
LIABILITIES
Current Liabilities
Payables 9 19 930 23 338 21 280 3 408 2 058
Contract liabilities 10, G - 4 713 - 4 713 4 713
Employee related provisions 22 078 22 890 21 258 812 1 632
Lease liabilities 11, H - 2 081 - 2 081 2 081
Other current liabilities 12 3 713 333 430 (3 380) (97)
Total Current Liabilities 45 721 53 355 42 968 7 634 10 387
Non-Current Liabilities
Employee related provisions 6 054 6 782 6 471 728 311
Lease liabilities 13, I 85 879 2 477 - (83 402) 2 477
Total Non-Current Liabilities 91 933 9 259 6 471 (82 674) 2 788
TOTAL LIABILITIES 137 654 62 614 49 439 (75 040) 13 175
NET ASSETS 900 990 925 317 856 066 24 327 69 251
EQUITY
Contributed equity 554 114 534 903 514 559 (19 211) 20 344
Reserves 14, J 1 903 3 885 2 830 1 982 1 055
Accumulated surplus 15, K 344 973 386 529 338 677 41 556 47 852
TOTAL EQUITY 900 990 925 317 856 066 24 327 69 251
Page 154 Department of Transport
Disclosures and Legal Compliance
9.13 Explanatory statement (Controlled Operations) (continued)
Statement of Financial Position Variances
Major Estimate and Actual (2020) Variance Narratives
1. Cash and cash equivalents are greater than estimate by $51.6 million (614.4%) mainly due to operating cash surplus in 2018-19 ($24.0 million); operating cash surplus from 2019-20 due to reduced operating activities ($13.0 million); Capital projects balances from 2018-19 from project delays ($12.0 million); and unspent capital projects in 2019-20 ($5.0 million).
2. The decrease of $4.6 million (30.4%) relates to reduction of debtors for 18-19 by $6 million and $ 2.6 million increase for net movement in debtors for 2019-20.
3. The decrease of $1.5 million (26.0%) compared to estimate relates to prepayment for 2018-19 which were expensed in 2019-20.
4. The increase of $7.8 million (100%) is a result of the delay in the sale of Welshpool Licensing centre. Therefore, this asset is now reported under Property, plant and equipment.
5. Property, plant and equipment actual exceeded estimates by $18.5 million (13.2%) primarily due more than anticipated projects being finalised and commissioned in 2019-20.
6. Infrastructure actual exceeded estimates by $43.3 million (19.12%) primarily due to a number of infrastructure projects being finalised and commissioned in 2019-20.
7. Reduction of $78.7 million (94.7%) is mainly a result of a decision made during 2019-20 in conjunction with the Department of Finance and the Office of the Auditor General (OAG), that Government Office Accommodation (GOA) inter-agency agreements do not fall into the scope of AASB 16: Leases.
8. Construction in progress trailed estimate by $59.7 million (72.33%) due to more projects finalised and commissioned in 2019-20 then targeted. (refer to notes on Property, Plant and equipment and Infrastructure).
9. Payable are overestimate figures by $3.4 million (17.1%) mainly relating to late receipt of invoices after end of year close off and paid in July 2020.
10. The $4.8 million relate to Harbour revenue obligations yet to be fulfilled at the end of the financial year.
11. With the introduction of AASB 16 in 2020 which primarily affects lessee accounting, the Department measured a lease liability at the commencement date, at the present value of the lease payment that are not paid at that date. This has equated to $2.1 million in 2020.
12. Other Current Liabilities is underestimate by $3.4 million (91.0%) due to the reduction in the credit period of small suppliers from 30 to 20 days.
13. Reduction of $83.4 million (97.1%) in lease liabilities is mainly a result of a decision made during 2019-20 in conjunction with the Department of Finance and the Office of the Auditor General (OAG), that Government Office Accommodation (GOA) inter-agency agreements do not fall into the scope of AASB 16: Leases (AASB 16).
14. The increase in reserves of $2.0 million (104.1%) relates to changes in asset revaluation reserve for 19-20 ($1.1 million) and $0.9 million for asset revaluation reserve for 2018-19.
15. Accumulated surplus in 2020 exceeds estimate by $41.6 million (12.1%) due to the increase in the opening surplus by $21.3 million for 2019 operations; and $23.5 million relates to accumulated surplus for 19-20.
Annual Report 2019-20 Page 155
Disclosures and Legal Compliance
Major Actual (2020) and Comparative (2019) Variance Narratives
A. Cash and cash equivalents in 2020 compared to prior year is greater by $8.4 million (16.2%) primarily due to operating cash surplus from 2019-20 resulting from reduced operating activities ($13.0 million). This is offset by additional $2 million in receivables in 2020 compare to 2019 due to timing of some of invoices of 19-20 paid later than the normal credit period.
B. Restricted cash and cash equivalent increased by $34.0 million (32.3%) primarily due to a net Perth Parking Fund increases in 2020 of $36.7 million offset by reimbursement to Consolidated of $3.9 million with the closure of the Taxi Industry Development Account.
C. The increase of $2.1 million (24.3%) in receivables in 2020 compare to 2019 is due to timing of some of invoices of 19-20 paid later than the normal credit period.
D. The increase of $7.8 million (100%) is a result of the delay in the sale of Welshpool Licensing centre. Therefore, this asset is now reported under Property, plant and equipment.
E. The increase of $4.4 million in mainly attributable to the introduction of AASB 16 in 2020 that requires recognition of assets and liabilities for all leases with a term of more than 12 months.
F. The increase of $9.7 million (74.1%) is due to more capital expenditure in 2019 on maritime assets and Information and Technology compare to 2018.
G. The $4.8 million relate to Harbour revenue related performance obligations yet to be fulfilled at the end of the financial year.
H. With the introduction of AASB 16 in 2020 which primarily affects lessee accounting, the Department measured a lease liability at the commencement date, at the present value of the lease payment that are not paid at that date. This has equated to $2.1 million in 2020.
I. The increase of $2.5 million in Lease liabilities is mainly due to the introduction of AASB 16 in 2019-20.
J. Reserves has increased by $1.1 million (37.3%) over 2019 due to surpluses arising from the increase in Department's building revaluation for 2020.
K. Accumulated Surplus is increased by $47.9 million (14.1%) over 2019. This variance relates to an increased surplus of $51.4 million for 2020 mainly due to an additional $37.6 million added to Perth Parking Fund, reduced operating activities but offset by the return of $3.87 million of balance of TIDA to consolidated Fund.
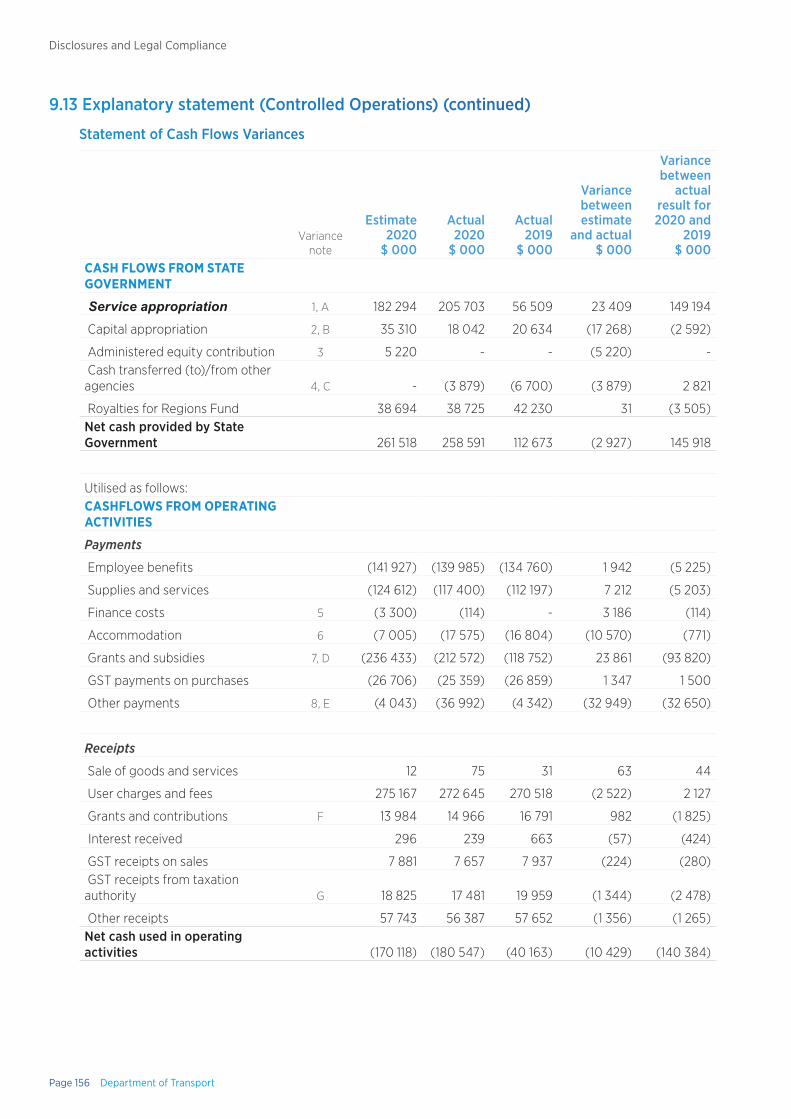
Page 156 Department of Transport
Disclosures and Legal Compliance
9.13 Explanatory statement (Controlled Operations) (continued)
Statement of Cash Flows Variances
Variance note
Estimate 2020
$ 000
Actual 2020
$ 000
Actual 2019
$ 000
Variance between estimate
and actual$ 000
Variance between
actual result for 2020 and
2019 $ 000
CASH FLOWS FROM STATE GOVERNMENT
Service appropriation 1, A 182 294 205 703 56 509 23 409 149 194
Capital appropriation 2, B 35 310 18 042 20 634 (17 268) (2 592)
Administered equity contribution 3 5 220 - - (5 220) - Cash transferred (to)/from other agencies 4, C - (3 879) (6 700) (3 879) 2 821
Royalties for Regions Fund 38 694 38 725 42 230 31 (3 505)Net cash provided by State Government 261 518 258 591 112 673 (2 927) 145 918
Utilised as follows:CASHFLOWS FROM OPERATING ACTIVITIES
Payments
Employee benefits (141 927) (139 985) (134 760) 1 942 (5 225)
Supplies and services (124 612) (117 400) (112 197) 7 212 (5 203)
Finance costs 5 (3 300) (114) - 3 186 (114)
Accommodation 6 (7 005) (17 575) (16 804) (10 570) (771)
Grants and subsidies 7, D (236 433) (212 572) (118 752) 23 861 (93 820)
GST payments on purchases (26 706) (25 359) (26 859) 1 347 1 500
Other payments 8, E (4 043) (36 992) (4 342) (32 949) (32 650)
Receipts
Sale of goods and services 12 75 31 63 44
User charges and fees 275 167 272 645 270 518 (2 522) 2 127
Grants and contributions F 13 984 14 966 16 791 982 (1 825)
Interest received 296 239 663 (57) (424)
GST receipts on sales 7 881 7 657 7 937 (224) (280) GST receipts from taxation authority G 18 825 17 481 19 959 (1 344) (2 478)
Other receipts 57 743 56 387 57 652 (1 356) (1 265)Net cash used in operating activities (170 118) (180 547) (40 163) (10 429) (140 384)

Annual Report 2019-20 Page 157
Disclosures and Legal Compliance
Variance note
Estimate 2020
$ 000
Actual 2020
$ 000
Actual 2019
$ 000
Variance between estimate
and actual$ 000
Variance between
actual result for 2020 and
2019 $ 000
CASH FLOWS FROM INVESTING ACTIVITIES
Payments
Purchase of non-current assets 9, H (38 284) (32 915) (24 296) 5 369 (8 619)
ReceiptsProceeds from sale of non-current assets - 49 90 49 (41)Net cash used in investing activities (38 284) (32 866) (24 206) 5 418 (8 660)
CASH FLOWS FROM FINANCING ACTIVITIES
Payments Repayment of lease liabilities 10, I (9 546) (2 256) - 7 290 (2 256)
Net cash used in financing activities (9 546) (2 256) - 7 290 (2 256)
Net decrease in cash and cash equivalents J 43 570 42 922 48 304 (648) (5 382)Cash and cash equivalents at the beginning of the year 11, K 118 437 158 477 110 173 40 040 48 304CASH AND CASH EQUIVALENTS AT THE END OF THE YEAR 162 007 201 399 158 477 39 392 42 922

Page 158 Department of Transport
Disclosures and Legal Compliance
9.13 Explanatory statement (Controlled Operations) (continued)
Statement of Cash Flows Variances
Major Estimate and Actual (2020) Variance Narratives
1. Service appropriation exceeds budget by $23.4 million (12.8%) mainly due to increased funding of $35.0 million for making ex gratia payment in settlement of all claims for a long-outstanding legal matter against the state; $3.4 million increase to fund Taxi User Subsidy Scheme; $2.4 million for the continuation of the Westport Taskforce; $2.4 million for Metronet's Transport Infrastructure Information Campaign; $1.8 million for On Demand Transport's COVID-19 Relief Measures; offset by reduced funding of $12.9 million for Principal Shared Path due to a realignment of the program to the forward estimate years and deferral of $9.5 million to 2021-22 for Busselton Margaret River Airport.
2. Capital appropriation is $17.3 million (48.9%) below budget mainly due to the deferral of various programs to 2020-21 such as Spoilbank Marina Port Hedland ($15.0 million), National Facial Biometric Matching Capability program ($1.3 million) and Service WA Pilot Program ($0.4 million); delay of Sale of Welshpool Licensing Centre to 2021-22 ($3.4 million); offset by increased to capital appropriation ($2.9 Million) as a result of the release of funds from Treasury Administered Account due to the completion of the Gateway Review on the On Demand Transport Business System Enhancement.
3. Administered equity contribution - $5.2 million represents funding set aside by Government for the On-Demand Transport Business System Enhancement as administered equity until the conclusion of the Gateway Review as stipulated by ERC/Cabinet. Completion of the review resulted in the carryover of the project to 2021 and the release of funds from Treasury's Administered Account.
4. The reduction of $3.9 million is a result of the closure of Taxi Industry Development Account (TIDA) that resulted in the balance of the TIDA account being transferred to Treasury's Consolidated Account.
5. The underspend of $3.2 million (96.5%) is primarily due to the decision made during 2019-20 in conjunction with the Department of Finance and the Office of the Auditor General (OAG), that Government Office Accommodation (GOA) inter-agency agreements do not fall into the scope of AASB 16: Leases (AASB 16).
6. Reduction of $10.6 million (150.9%) is due to the decision made during 2019-20 in conjunction with the Department of Finance and the Office of the Auditor General (OAG), that Government Office Accommodation (GOA) inter-agency agreements do not fall within the scope of AASB 16: Leases (AASB 16).
7. The underspend of $23.9 million (10.1%) is mainly due to the changes to the Principal Shared Path program ($12.5 million); deferral of the Busselton Margaret River Airport project to 2020-21 ($9.5 million) and lower grant payments for Country age Pension Fuel Card ($4.7 million). This is offset by increased grant payment for Taxi User Subsidy Scheme resulting from increased number of approved applicants ($2.0 million) and Covid -19 On Demand Booking Service Relief Payments ($1.6 million).
8. The change mainly represents the settlement of a litigation on behalf of State Government in respect to a dispute under the Marine and Harbours Act (1981) relating to an Agreement to build and operate a port in Western Australia. The settlement amount was agreed by a Cabinet decision. ($35.0 million).
The remaining underspend of $2.1 million (50.7%) is mainly due to reduced operating activities in 2020. Overall operating activities have been impacted by COVID-19.
9. The underspend of $5.4 million is mainly due to deferral of Capital programs approved during the Mid-Year Review 2020 Budget Process ($1.7 million) and general underspend in capital programs such as the Maritime Facilities Program ($2.2 million) and Transforming Bunbury Waterfront ($1.6 million).
10. The underspend of $7.3 million (76.3%) is primarily due to the decision made during 2019-20 in conjunction with the Department of Finance and the Office of the Auditor General (OAG), that Government Office Accommodation (GOA) inter-agency agreements do not fall into the scope of AASB 16: Leases (AASB 16).
11. The increase in cash and cash equivalents at the beginning of the period of $40.0 million (33.8%) is mainly a result of a cash surplus resulted from reduced operations ($24 million ) for 2019 and capital projects delays in 2019 ($11 million) with the balance resulting from accrual invoices.
Annual Report 2019-20 Page 159
Disclosures and Legal Compliance
Major Actual (2020) and Comparative (2019) Variance Narratives
A. Service Appropriation increased by $149.2 million (264%) over 2019 primarily due to the voluntary Taxi Plate Buy Back Scheme ($118.6 million); Ex Gratia Payment to James Point Pty Ltd ($35.0 million); 2019-20 Mid-Year Review approval for Metronet Infrastructure Information campaign ($2.4 million) and continuation of the Westport Taskforce ($2.4 million); increased supplementary funding approved by ERC for Taxi User Subsidy Scheme ($1.7 million) in 2020; offset by reduced funding of $12.9 million for Principal Shared Path due to program realignment.
B. The decrease of capital appropriations between 2019 and 2020 of $2.6 million (12.6%) is mainly deferral of various capital programs as a result of underspends in capital programs during the year.
C. The increase of $2.8 million (42.1%) over 2020 figures is a result of the return of $6.7 million from the TIDA account in 2019 to reimburse Consolidated Account due to the delay in drafting of the new On Demand Transport Act.
D. The increase of $93.8 million (79.0%) in 2020 is mainly a result of the voluntary Taxi Buy Plate Buy Back Scheme ($118.2 million) offset by reduction in grant payment for Principal Shared Paths re-cashflowed ($13.0 million); completion of Geraldton Airport Runway Pavement Renewal ($6.5 million) and decreased grant payment for Broome Boating Facilities Upgrade in 2020 ($3.6 million).
E. The change mainly represents the settlement of a litigation on behalf of State Government in respect to a dispute under the Marine and Harbours Act (1981) relating to an Agreement to build and operate a port in Western Australia. The settlement amount was agreed by a Cabinet decision. ($35.0 million).
The remaining underspend of $2.4 million (54.3%) is mainly due to reduced operating activities in 2020 as a result of the ongoing pandemic impacting all facets of DoT’s operations.
F. The decrease of $1.8 million (10.9%) is mainly due to payment from Main Roads for Safe Active Streets - Bike Boulevard and Stephenson Boulevard Project received in 2019 ($6.6 million); payment from WA Planning Commission for Strategic Transport Modelling ($0.3 million) offset by increase in 2020 to grant payment from Main Roads WA for WA Bicycle Network ($2.3 million); Customer Information Centre ($1.8 million) and METRONET Infrastructure Information Campaign ($1.0 million).
G. The decrease of $2.5 million (12.4%) GST Receipts from Taxation Authority is primarily a result of reduced operating activities in 2020.
H. The increase in purchase of non-current physical assets of $8.6 million in 2020 is mainly due to the completion of Bandy Creek Weir ($4.6 million) and Onslow - Beadon Creek Training Wall upgrade works ($3.5 million).
I. The increase in payment for Finance Leases of $2.2 million in 2020 is the result of the introduction of AASB16 in the 2020 Financial Year.
J. The net decrease in cash and cash equivalents 2020 of $5.4 million (11.4%) is primarily due the increased payment to capital programs ($8.6 million); by reduced net payment for operating activities ($5.5 million) during 2020 impacted by COVID-19.
K. The increase in cash and cash equivalents at the beginning of the period 2020 exceeds 2019 by $48.3 million (43.8%) mainly due to the increase in Perth Parking Licence Account of $36.7 million and reduced operating activities in the Department in light of the inevitable delays associated with the COVID-19 pandemic.
9.14 Events occurring after the end of the financial year
There are no significant events occurring after the reporting date.
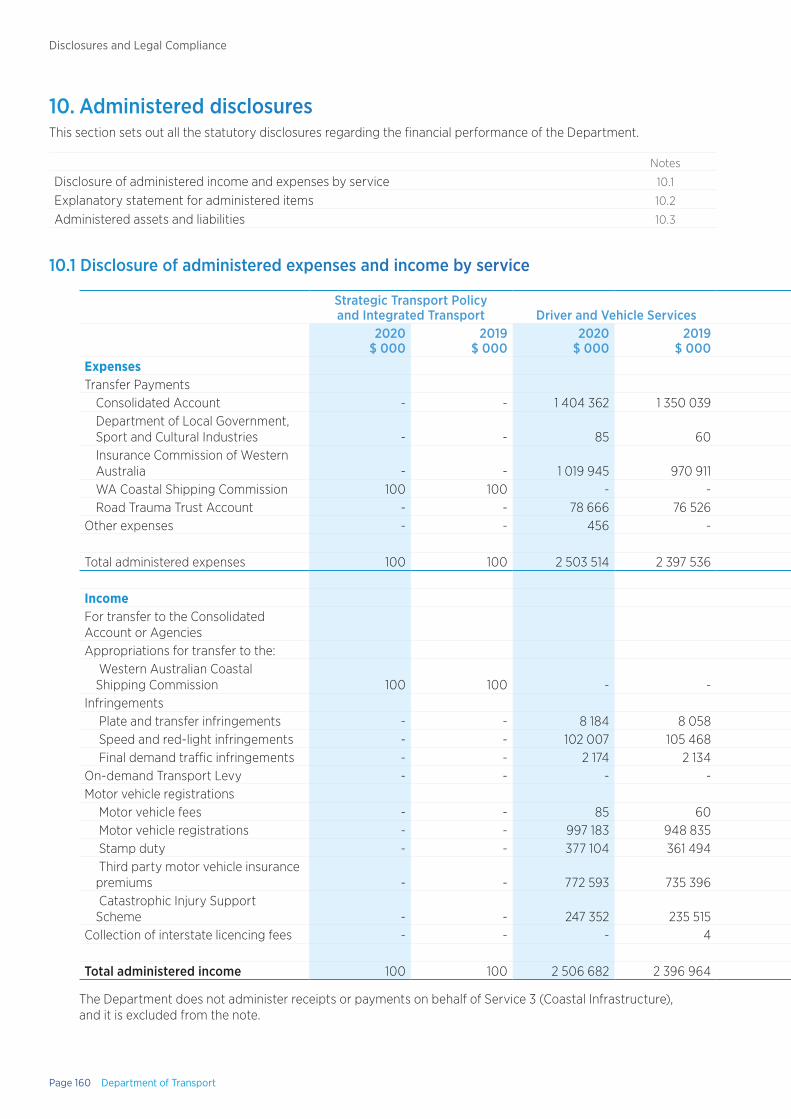
Page 160 Department of Transport
Disclosures and Legal Compliance
10. Administered disclosuresThis section sets out all the statutory disclosures regarding the financial performance of the Department.
Notes
Disclosure of administered income and expenses by service 10.1
Explanatory statement for administered items 10.2
Administered assets and liabilities 10.3
10.1 Disclosure of administered expenses and income by service
Strategic Transport Policy and Integrated Transport Driver and Vehicle Services Marine Safety On-demand Transport Total
2020$ 000
2019$ 000
2020$ 000
2019$ 000
2020$ 000
2019$ 000
2020$ 000
2019$ 000
2020$ 000
2019$ 000
ExpensesTransfer Payments
Consolidated Account - - 1 404 362 1 350 039 - - 37 917 - 1 442 279 1 350 039Department of Local Government, Sport and Cultural Industries - - 85 60 - - - - 85 60Insurance Commission of Western Australia - - 1 019 945 970 911 - - - - 1 019 945 970 911WA Coastal Shipping Commission 100 100 - - - - - - 100 100Road Trauma Trust Account - - 78 666 76 526 - - - - 78 666 76 526
Other expenses - - 456 - - - - - 456 -
Total administered expenses 100 100 2 503 514 2 397 536 - - 37 917 - 2 541 531 2 397 636
IncomeFor transfer to the Consolidated Account or AgenciesAppropriations for transfer to the:
Western Australian Coastal Shipping Commission 100 100 - - - - - - 100 100
Infringements Plate and transfer infringements - - 8 184 8 058 - - - - 8 184 8 058 Speed and red-light infringements - - 102 007 105 468 - - - - 102 007 105 468 Final demand traffic infringements - - 2 174 2 134 - - - - 2 174 2 134
On-demand Transport Levy - - - - - - 43 414 5 213 43 414 5 213Motor vehicle registrations
Motor vehicle fees - - 85 60 - - - - 85 60 Motor vehicle registrations - - 997 183 948 835 - - - - 997 183 948 835 Stamp duty - - 377 104 361 494 - - - - 377 104 361 494 Third party motor vehicle insurance premiums - - 772 593 735 396 - - - - 772 593 735 396 Catastrophic Injury Support Scheme - - 247 352 235 515 - - - - 247 352 235 515
Collection of interstate licencing fees - - - 4 - - - - - 4
Total administered income 100 100 2 506 682 2 396 964 - - 43 414 5 213 2 550 196 2 402 277
The Department does not administer receipts or payments on behalf of Service 3 (Coastal Infrastructure), and it is excluded from the note.
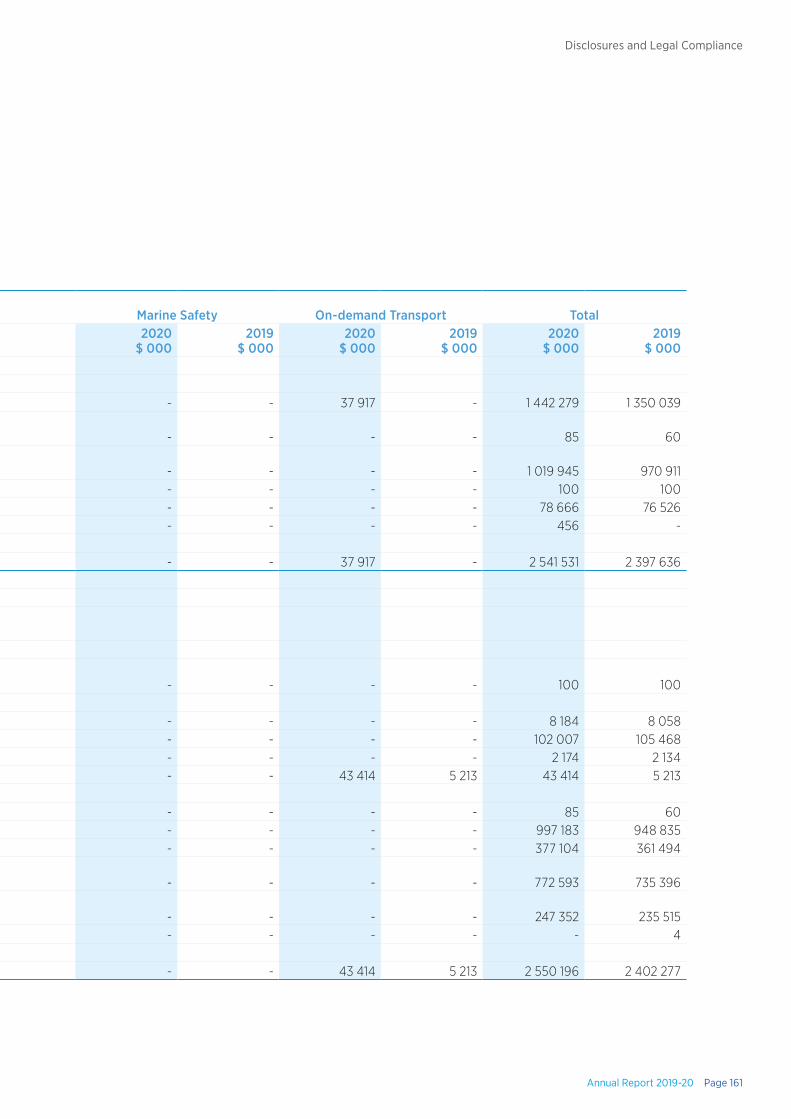
Annual Report 2019-20 Page 161
Disclosures and Legal Compliance
10. Administered disclosuresThis section sets out all the statutory disclosures regarding the financial performance of the Department.
Notes
Disclosure of administered income and expenses by service 10.1
Explanatory statement for administered items 10.2
Administered assets and liabilities 10.3
10.1 Disclosure of administered expenses and income by service
Strategic Transport Policy and Integrated Transport Driver and Vehicle Services Marine Safety On-demand Transport Total
2020$ 000
2019$ 000
2020$ 000
2019$ 000
2020$ 000
2019$ 000
2020$ 000
2019$ 000
2020$ 000
2019$ 000
ExpensesTransfer Payments
Consolidated Account - - 1 404 362 1 350 039 - - 37 917 - 1 442 279 1 350 039Department of Local Government, Sport and Cultural Industries - - 85 60 - - - - 85 60Insurance Commission of Western Australia - - 1 019 945 970 911 - - - - 1 019 945 970 911WA Coastal Shipping Commission 100 100 - - - - - - 100 100Road Trauma Trust Account - - 78 666 76 526 - - - - 78 666 76 526
Other expenses - - 456 - - - - - 456 -
Total administered expenses 100 100 2 503 514 2 397 536 - - 37 917 - 2 541 531 2 397 636
IncomeFor transfer to the Consolidated Account or AgenciesAppropriations for transfer to the:
Western Australian Coastal Shipping Commission 100 100 - - - - - - 100 100
Infringements Plate and transfer infringements - - 8 184 8 058 - - - - 8 184 8 058 Speed and red-light infringements - - 102 007 105 468 - - - - 102 007 105 468 Final demand traffic infringements - - 2 174 2 134 - - - - 2 174 2 134
On-demand Transport Levy - - - - - - 43 414 5 213 43 414 5 213Motor vehicle registrations
Motor vehicle fees - - 85 60 - - - - 85 60 Motor vehicle registrations - - 997 183 948 835 - - - - 997 183 948 835 Stamp duty - - 377 104 361 494 - - - - 377 104 361 494 Third party motor vehicle insurance premiums - - 772 593 735 396 - - - - 772 593 735 396 Catastrophic Injury Support Scheme - - 247 352 235 515 - - - - 247 352 235 515
Collection of interstate licencing fees - - - 4 - - - - - 4
Total administered income 100 100 2 506 682 2 396 964 - - 43 414 5 213 2 550 196 2 402 277
The Department does not administer receipts or payments on behalf of Service 3 (Coastal Infrastructure), and it is excluded from the note.
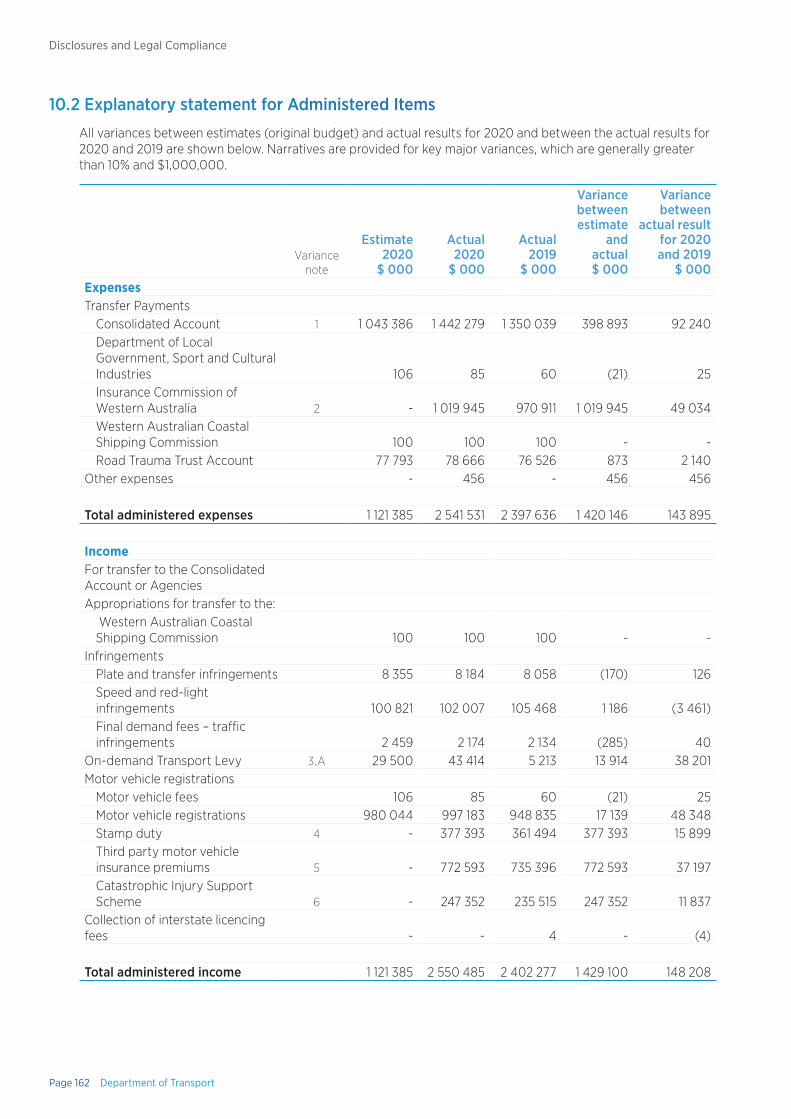
Page 162 Department of Transport
Disclosures and Legal Compliance
10.2 Explanatory statement for Administered Items
All variances between estimates (original budget) and actual results for 2020 and between the actual results for 2020 and 2019 are shown below. Narratives are provided for key major variances, which are generally greater than 10% and $1,000,000.
Variance note
Estimate 2020
$ 000
Actual 2020$ 000
Actual 2019
$ 000
Variance between estimate
and actual$ 000
Variance between
actual result for 2020 and 2019
$ 000ExpensesTransfer Payments
Consolidated Account 1 1 043 386 1 442 279 1 350 039 398 893 92 240Department of Local Government, Sport and Cultural Industries 106 85 60 (21) 25Insurance Commission of Western Australia 2 - 1 019 945 970 911 1 019 945 49 034Western Australian Coastal Shipping Commission 100 100 100 - -Road Trauma Trust Account 77 793 78 666 76 526 873 2 140
Other expenses - 456 - 456 456
Total administered expenses 1 121 385 2 541 531 2 397 636 1 420 146 143 895
IncomeFor transfer to the Consolidated Account or AgenciesAppropriations for transfer to the:
Western Australian Coastal Shipping Commission 100 100 100 - -
InfringementsPlate and transfer infringements 8 355 8 184 8 058 (170) 126Speed and red-light infringements 100 821 102 007 105 468 1 186 (3 461)Final demand fees – traffic infringements 2 459 2 174 2 134 (285) 40
On-demand Transport Levy 3,A 29 500 43 414 5 213 13 914 38 201Motor vehicle registrations
Motor vehicle fees 106 85 60 (21) 25Motor vehicle registrations 980 044 997 183 948 835 17 139 48 348Stamp duty 4 - 377 393 361 494 377 393 15 899Third party motor vehicle insurance premiums 5 - 772 593 735 396 772 593 37 197Catastrophic Injury Support Scheme 6 - 247 352 235 515 247 352 11 837
Collection of interstate licencing fees - - 4 - (4)
Total administered income 1 121 385 2 550 485 2 402 277 1 429 100 148 208
Annual Report 2019-20 Page 163
Disclosures and Legal Compliance
10.2 Explanatory statement for Administered Items (continued)
Major Estimate and Actual (2020) Variance Narratives
1. Consolidated account transfer payments exceeded estimates by $398.9 million (38.2%) mainly due to stamp duty on motor vehicle registrations collected on behalf of the Office of State revenue and transferred to the Consolidated Account. This item is not reflected in the Department’s budget statement.
2. Insurance Commission of Western Australia transfer payments totalled $1,019.9 million from Third Party insurance premiums ($772.6 million) and Catastrophic Injury Support Scheme ($247.4 million) collected on behalf and transferred to Insurance Commission of Western Australia. This item is not reflected in the Department’s budget statement.
3. The On-demand Transport Levy collection is greater than expected (as part of the 10% surcharge/levy on all on -demand transport fare) mainly due to greater number of trips undertaken by On Demand Booking Service. This levy was to fund the voluntary buy back scheme for taxi drivers which was initially funded from the Consolidated Account.
4. Stamp Duty revenue collected amounted to $377.1 million due to stamp duty on motor vehicle registration collected on behalf of the Office of State Revenue. This item is not reflected in the Department's budget statements as it falls under Insurance Commission of Western Australia.
5. Third Party Motor Vehicle Insurance premiums totalled $772.6 million collected on behalf and transferred to Insurance Commission of Western Australia. This item is not reflected in the Department’s budget statement.
6. Catastrophic Injury Support Scheme totalled $247.4 million collected on behalf and transferred to Insurance Commission of Western Australia. This item is not reflected in the Department’s budget statement.
Major Actual (2020) and Comparative (2019) Variance Narratives
A. The increase in On Demand Transport Levy over 2019 of $38.2 million (733%) is due to the commencement of the levy on 1 April 2019 which resulted in only 25 percent of returns lodged by the end of 2019-20 Financial year. The increase was also contributed by higher number of trips being undertaken compared to projections.
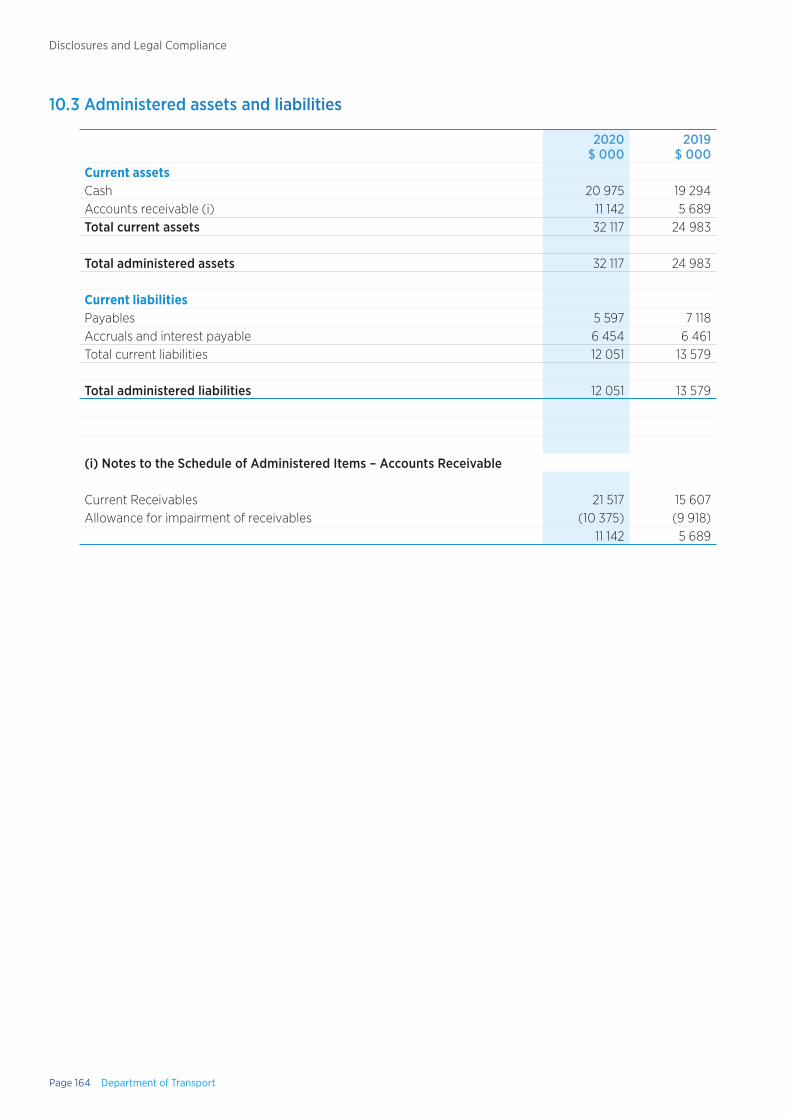
Page 164 Department of Transport
Disclosures and Legal Compliance
10.3 Administered assets and liabilities
2020$ 000
2019$ 000
Current assetsCash 20 975 19 294Accounts receivable (i) 11 142 5 689Total current assets 32 117 24 983
Total administered assets 32 117 24 983
Current liabilitiesPayables 5 597 7 118Accruals and interest payable 6 454 6 461Total current liabilities 12 051 13 579
Total administered liabilities 12 051 13 579
(i) Notes to the Schedule of Administered Items – Accounts Receivable
Current Receivables 21 517 15 607Allowance for impairment of receivables (10 375) (9 918)
11 142 5 689

Annual Report 2019-20 Page 165

Page 166 Department of Transport
Disclosures and Legal Compliance
Certification of Key Performance IndicatorsFor the year ended 30 June 2020
I hereby certify that the Key Performance Indicators are based on proper records, are relevant and appropriate for assisting users to assess the Department of Transport’s (DoT) performance, and fairly represent the performance of the DoT for the financial year ended 30 June 2020.
Peter Woronzow Accountable Authority
17 September 2020
Annual Report 2019-20 Page 167
Disclosures and Legal Compliance
DoT’s outcome structure and links to the overall Government Goals
The transport function is integral to business and commerce and is important for social interaction and connecting communities. DoT’s focus is on strategic transport policy and planning, regulation and the delivery of safe and sustainable transport services and programs. This includes the licensing of drivers, vehicles, aircraft and vessels; developing and planning infrastructure; ensuring service delivery; and setting safety standards across the range of public and commercial transport systems in WA.
Together with its Portfolio partners, DoT has the expertise to deliver the integrated transport plans, policy and high-quality services needed to connect a complex, interrelated economic and social network. DoT connects people with goods and services through an intricate system of roads, railways, airports, ports, paths and waterways, and keeps people safe within those networks through an integrated approach to planning, licensing, and education and compliance strategies.
DoT made the following changes to its Outcome Based Management Framework during 2019-20 to reflect the On-demand Transport reform:
Key Effectiveness Indicators under ‘Outcome 3: An accessible and safe transport system’:
• discontinued Key Performance Indicator (KPI) “Percentage by which, the waiting time standard, for metropolitan area taxis, is met”; and
• introduced new KPI “Percentage of multi-purpose taxi journeys carrying passengers in wheelchairs which meet the waiting time standard”.
Key Efficiency Indicators under ‘Service 5: On-Demand Transport’:
• Discontinued KPI “Cost of Regulation per Taxi Plate Administered”; and
• introduced new KPI “Cost per On-demand Transport Authorisation”.
The breadth and diversity of DoT’s functions and services means that DoT contributes to three of the Government’s strategic goals outlined in the following table.
Key Performance IndicatorsFor the year ended 30 June 2020
Page 168 Department of Transport
Disclosures and Legal Compliance
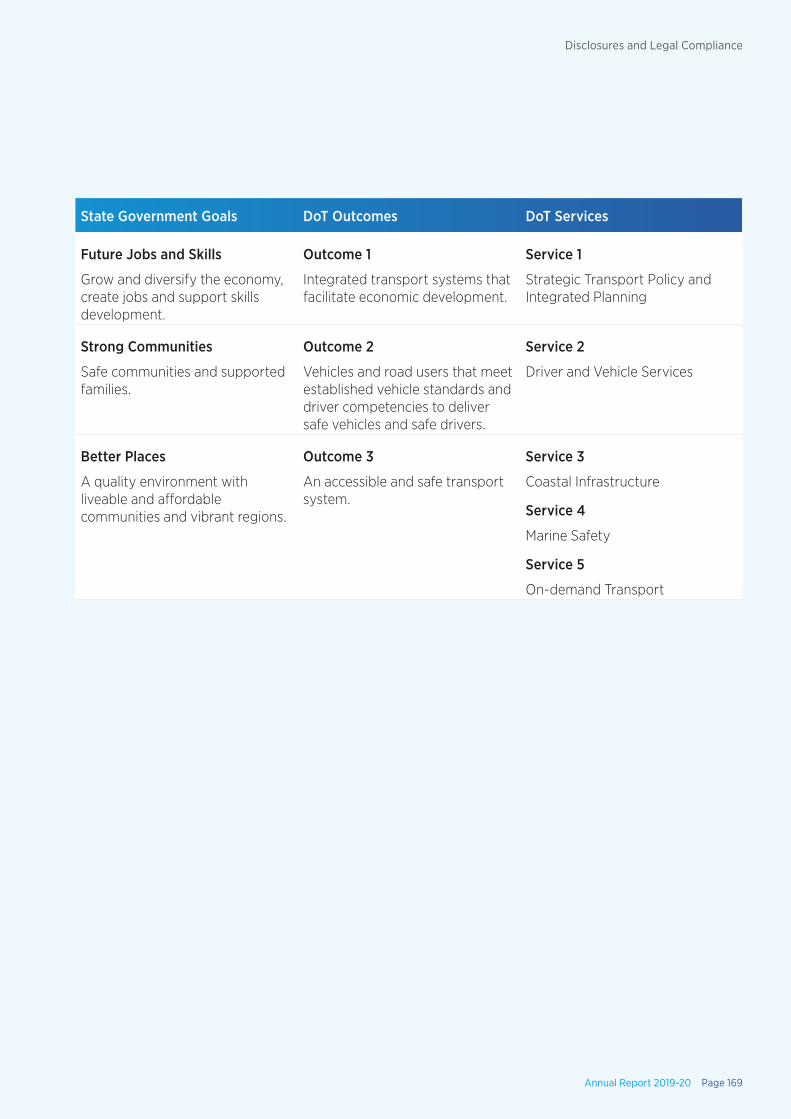
State Government Goals DoT Outcomes DoT Services
Future Jobs and Skills
Grow and diversify the economy, create jobs and support skills development.
Outcome 1
Integrated transport systems that facilitate economic development.
Service 1
Strategic Transport Policy and Integrated Planning
Strong Communities
Safe communities and supported families.
Outcome 2
Vehicles and road users that meet established vehicle standards and driver competencies to deliver safe vehicles and safe drivers.
Service 2
Driver and Vehicle Services
Better Places
A quality environment with liveable and affordable communities and vibrant regions.
Outcome 3
An accessible and safe transport system.
Service 3
Coastal Infrastructure
Service 4
Marine Safety
Service 5
On-demand Transport
Annual Report 2019-20 Page 169
Disclosures and Legal Compliance
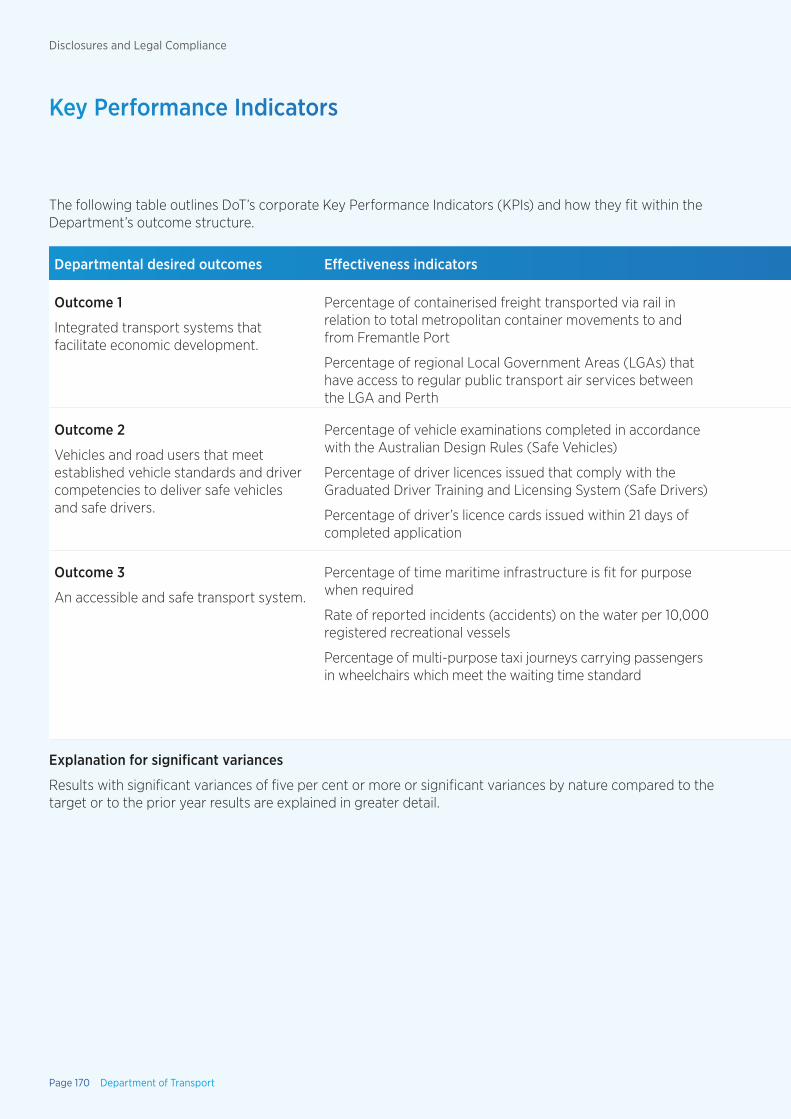
Key Performance Indicators
The following table outlines DoT’s corporate Key Performance Indicators (KPIs) and how they fit within the Department’s outcome structure.
Departmental desired outcomes Effectiveness indicators Departmental services Efficiency indicators
Outcome 1
Integrated transport systems that facilitate economic development.
Percentage of containerised freight transported via rail in relation to total metropolitan container movements to and from Fremantle Port
Percentage of regional Local Government Areas (LGAs) that have access to regular public transport air services between the LGA and Perth
Service 1
Strategic Transport Policy and Integrated Planning
Average cost per policy hour for strategic transport policy development
Average cost per planning hour for integrated transport planning development
Outcome 2
Vehicles and road users that meet established vehicle standards and driver competencies to deliver safe vehicles and safe drivers.
Percentage of vehicle examinations completed in accordance with the Australian Design Rules (Safe Vehicles)
Percentage of driver licences issued that comply with the Graduated Driver Training and Licensing System (Safe Drivers)
Percentage of driver’s licence cards issued within 21 days of completed application
Service 2
Driver and Vehicle Services
Average cost per vehicle and driver transaction
Average cost per vehicle inspection performed by Vehicle Examination Centres
Average cost per vehicle inspection delivered through Authorised Inspection Stations
Average cost per driver assessment
Outcome 3
An accessible and safe transport system.
Percentage of time maritime infrastructure is fit for purpose when required
Rate of reported incidents (accidents) on the water per 10,000 registered recreational vessels
Percentage of multi-purpose taxi journeys carrying passengers in wheelchairs which meet the waiting time standard
Service 3
Coastal Infrastructure
Average cost per day per maritime infrastructure asset managed
Service 4
Marine Safety
Average cost per private recreational vessel registration
Cost to maintain Marine Pollution Response preparedness per registered vessel
Service 5
On-demand Transport
Cost per On-demand Transport Authorisation
Explanation for significant variances
Results with significant variances of five per cent or more or significant variances by nature compared to the target or to the prior year results are explained in greater detail.
Page 170 Department of Transport
Disclosures and Legal Compliance
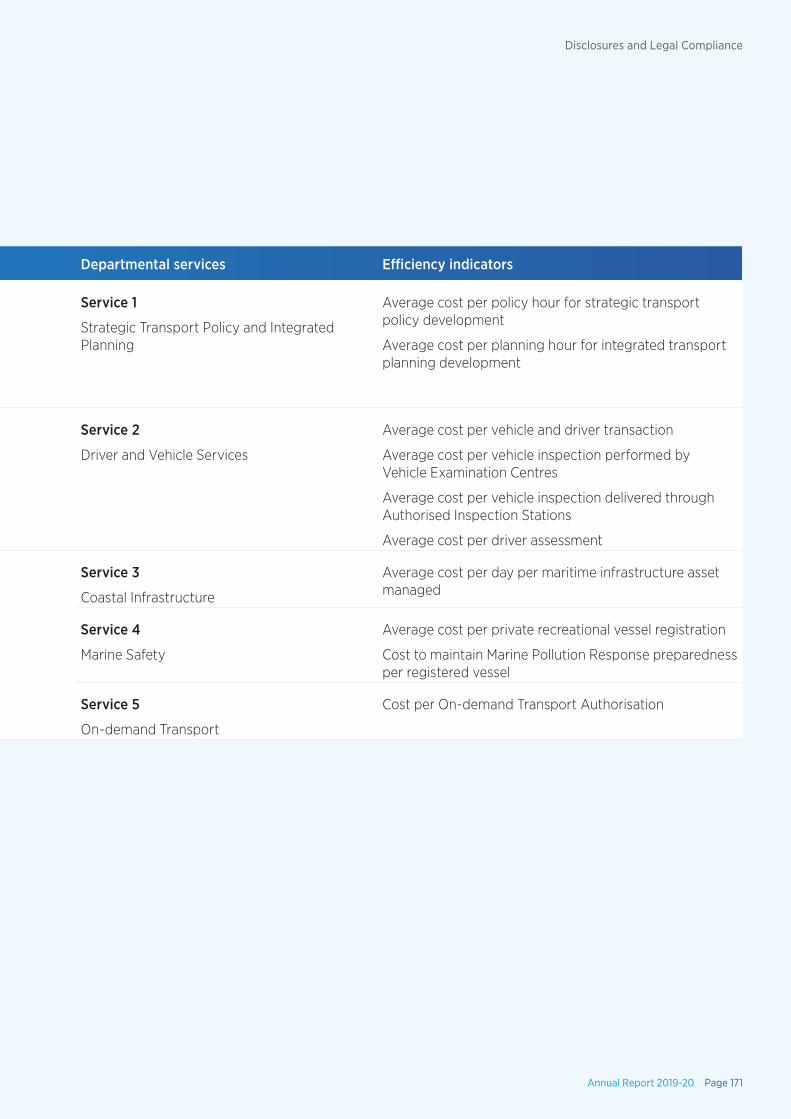
The following table outlines DoT’s corporate Key Performance Indicators (KPIs) and how they fit within the Department’s outcome structure.
Departmental desired outcomes Effectiveness indicators Departmental services Efficiency indicators
Outcome 1
Integrated transport systems that facilitate economic development.
Percentage of containerised freight transported via rail in relation to total metropolitan container movements to and from Fremantle Port
Percentage of regional Local Government Areas (LGAs) that have access to regular public transport air services between the LGA and Perth
Service 1
Strategic Transport Policy and Integrated Planning
Average cost per policy hour for strategic transport policy development
Average cost per planning hour for integrated transport planning development
Outcome 2
Vehicles and road users that meet established vehicle standards and driver competencies to deliver safe vehicles and safe drivers.
Percentage of vehicle examinations completed in accordance with the Australian Design Rules (Safe Vehicles)
Percentage of driver licences issued that comply with the Graduated Driver Training and Licensing System (Safe Drivers)
Percentage of driver’s licence cards issued within 21 days of completed application
Service 2
Driver and Vehicle Services
Average cost per vehicle and driver transaction
Average cost per vehicle inspection performed by Vehicle Examination Centres
Average cost per vehicle inspection delivered through Authorised Inspection Stations
Average cost per driver assessment
Outcome 3
An accessible and safe transport system.
Percentage of time maritime infrastructure is fit for purpose when required
Rate of reported incidents (accidents) on the water per 10,000 registered recreational vessels
Percentage of multi-purpose taxi journeys carrying passengers in wheelchairs which meet the waiting time standard
Service 3
Coastal Infrastructure
Average cost per day per maritime infrastructure asset managed
Service 4
Marine Safety
Average cost per private recreational vessel registration
Cost to maintain Marine Pollution Response preparedness per registered vessel
Service 5
On-demand Transport
Cost per On-demand Transport Authorisation
Explanation for significant variances
Results with significant variances of five per cent or more or significant variances by nature compared to the target or to the prior year results are explained in greater detail.
Annual Report 2019-20 Page 171
Disclosures and Legal Compliance
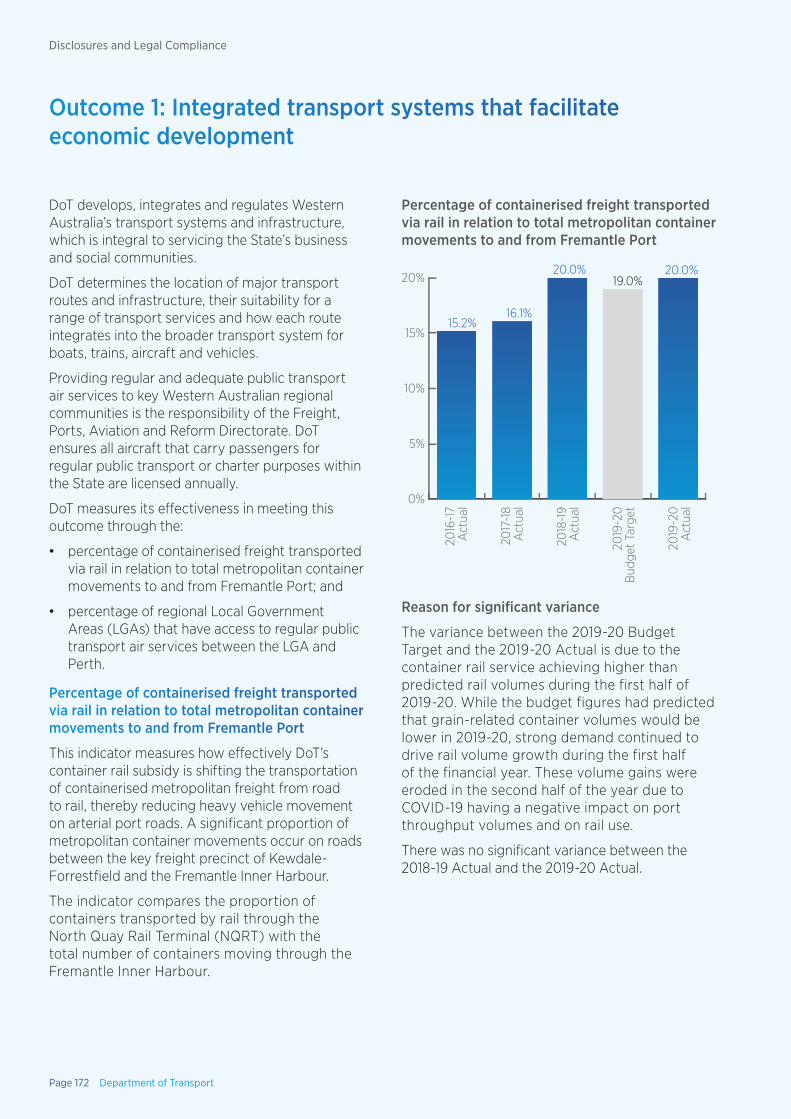
Outcome 1: Integrated transport systems that facilitate economic development
DoT develops, integrates and regulates Western Australia’s transport systems and infrastructure, which is integral to servicing the State’s business and social communities.
DoT determines the location of major transport routes and infrastructure, their suitability for a range of transport services and how each route integrates into the broader transport system for boats, trains, aircraft and vehicles.
Providing regular and adequate public transport air services to key Western Australian regional communities is the responsibility of the Freight, Ports, Aviation and Reform Directorate. DoT ensures all aircraft that carry passengers for regular public transport or charter purposes within the State are licensed annually.
DoT measures its effectiveness in meeting this outcome through the:
• percentage of containerised freight transported via rail in relation to total metropolitan container movements to and from Fremantle Port; and
• percentage of regional Local Government Areas (LGAs) that have access to regular public transport air services between the LGA and Perth.
Percentage of containerised freight transported via rail in relation to total metropolitan container movements to and from Fremantle Port
This indicator measures how effectively DoT’s container rail subsidy is shifting the transportation of containerised metropolitan freight from road to rail, thereby reducing heavy vehicle movement on arterial port roads. A significant proportion of metropolitan container movements occur on roads between the key freight precinct of Kewdale-Forrestfield and the Fremantle Inner Harbour.
The indicator compares the proportion of containers transported by rail through the North Quay Rail Terminal (NQRT) with the total number of containers moving through the Fremantle Inner Harbour.
Percentage of containerised freight transported via rail in relation to total metropolitan container movements to and from Fremantle Port
0%
5%
10%
15%
20%
15.2%16.1%
20.0%19.0%
20.0%
2016
-17
Act
ual
2017
-18
Act
ual
2018
-19
Act
ual
2019
-20
Bud
get T
arge
t
2019
-20
Act
ual
Reason for significant variance
The variance between the 2019-20 Budget Target and the 2019-20 Actual is due to the container rail service achieving higher than predicted rail volumes during the first half of 2019-20. While the budget figures had predicted that grain-related container volumes would be lower in 2019-20, strong demand continued to drive rail volume growth during the first half of the financial year. These volume gains were eroded in the second half of the year due to COVID-19 having a negative impact on port throughput volumes and on rail use.
There was no significant variance between the 2018-19 Actual and the 2019-20 Actual.
Page 172 Department of Transport
Disclosures and Legal Compliance
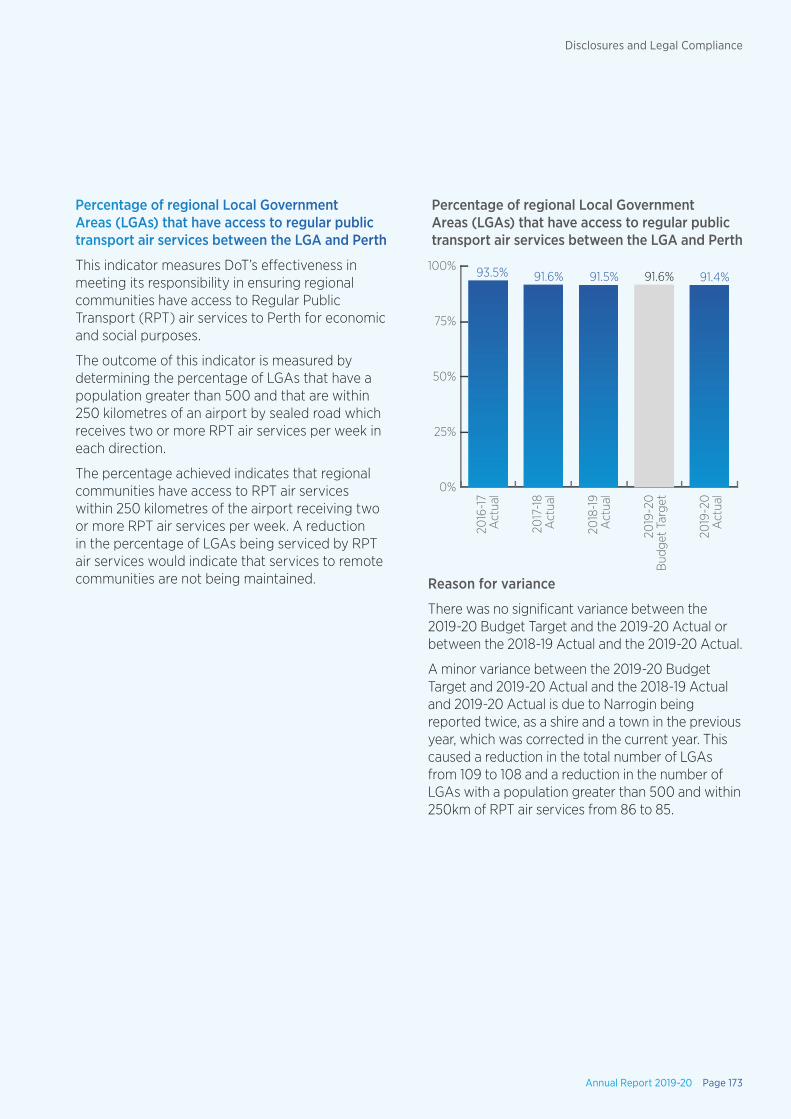
Percentage of regional Local Government Areas (LGAs) that have access to regular public transport air services between the LGA and Perth
This indicator measures DoT’s effectiveness in meeting its responsibility in ensuring regional communities have access to Regular Public Transport (RPT) air services to Perth for economic and social purposes.
The outcome of this indicator is measured by determining the percentage of LGAs that have a population greater than 500 and that are within 250 kilometres of an airport by sealed road which receives two or more RPT air services per week in each direction.
The percentage achieved indicates that regional communities have access to RPT air services within 250 kilometres of the airport receiving two or more RPT air services per week. A reduction in the percentage of LGAs being serviced by RPT air services would indicate that services to remote communities are not being maintained.
Percentage of regional Local Government Areas (LGAs) that have access to regular public transport air services between the LGA and Perth
0%
25%
50%
75%
100% 93.5% 91.6% 91.5% 91.6% 91.4%
2016
-17
Act
ual
2017
-18
Act
ual
2018
-19
Act
ual
2019
-20
Bud
get T
arge
t
2019
-20
Act
ual
Reason for variance
There was no significant variance between the 2019-20 Budget Target and the 2019-20 Actual or between the 2018-19 Actual and the 2019-20 Actual.
A minor variance between the 2019-20 Budget Target and 2019-20 Actual and the 2018-19 Actual and 2019-20 Actual is due to Narrogin being reported twice, as a shire and a town in the previous year, which was corrected in the current year. This caused a reduction in the total number of LGAs from 109 to 108 and a reduction in the number of LGAs with a population greater than 500 and within 250km of RPT air services from 86 to 85.
Annual Report 2019-20 Page 173
Disclosures and Legal Compliance
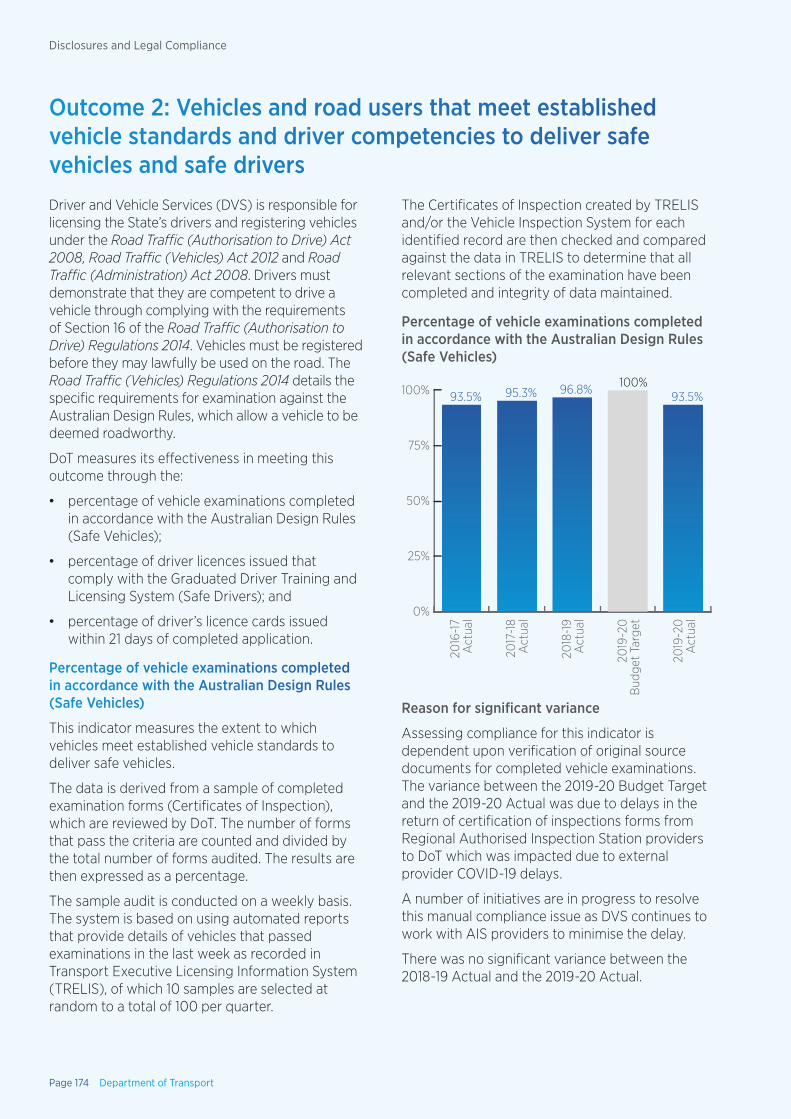
Outcome 2: Vehicles and road users that meet established vehicle standards and driver competencies to deliver safe vehicles and safe driversDriver and Vehicle Services (DVS) is responsible for licensing the State’s drivers and registering vehicles under the Road Traffic (Authorisation to Drive) Act 2008, Road Traffic (Vehicles) Act 2012 and Road Traffic (Administration) Act 2008. Drivers must demonstrate that they are competent to drive a vehicle through complying with the requirements of Section 16 of the Road Traffic (Authorisation to Drive) Regulations 2014. Vehicles must be registered before they may lawfully be used on the road. The Road Traffic (Vehicles) Regulations 2014 details the specific requirements for examination against the Australian Design Rules, which allow a vehicle to be deemed roadworthy.
DoT measures its effectiveness in meeting this outcome through the:
• percentage of vehicle examinations completed in accordance with the Australian Design Rules (Safe Vehicles);
• percentage of driver licences issued that comply with the Graduated Driver Training and Licensing System (Safe Drivers); and
• percentage of driver’s licence cards issued within 21 days of completed application.
Percentage of vehicle examinations completed in accordance with the Australian Design Rules (Safe Vehicles)
This indicator measures the extent to which vehicles meet established vehicle standards to deliver safe vehicles.
The data is derived from a sample of completed examination forms (Certificates of Inspection), which are reviewed by DoT. The number of forms that pass the criteria are counted and divided by the total number of forms audited. The results are then expressed as a percentage.
The sample audit is conducted on a weekly basis. The system is based on using automated reports that provide details of vehicles that passed examinations in the last week as recorded in Transport Executive Licensing Information System (TRELIS), of which 10 samples are selected at random to a total of 100 per quarter.
The Certificates of Inspection created by TRELIS and/or the Vehicle Inspection System for each identified record are then checked and compared against the data in TRELIS to determine that all relevant sections of the examination have been completed and integrity of data maintained.
Percentage of vehicle examinations completed in accordance with the Australian Design Rules (Safe Vehicles)
0%
25%
50%
75%
100% 93.5% 95.3% 96.8% 100%93.5%
2016
-17
Act
ual
2017
-18
Act
ual
2018
-19
Act
ual
2019
-20
Bud
get T
arge
t
2019
-20
Act
ual
Reason for significant variance
Assessing compliance for this indicator is dependent upon verification of original source documents for completed vehicle examinations. The variance between the 2019-20 Budget Target and the 2019-20 Actual was due to delays in the return of certification of inspections forms from Regional Authorised Inspection Station providers to DoT which was impacted due to external provider COVID-19 delays.
A number of initiatives are in progress to resolve this manual compliance issue as DVS continues to work with AIS providers to minimise the delay.
There was no significant variance between the 2018-19 Actual and the 2019-20 Actual.
Page 174 Department of Transport
Disclosures and Legal Compliance
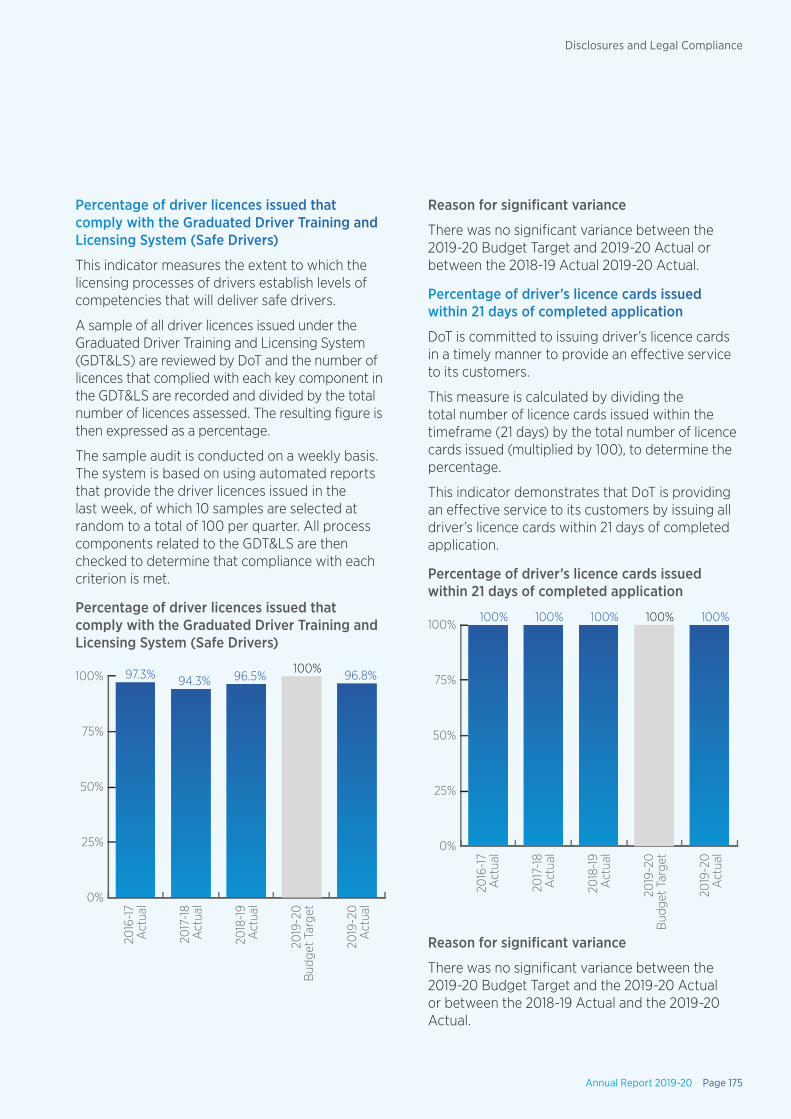
Percentage of driver licences issued that comply with the Graduated Driver Training and Licensing System (Safe Drivers)
This indicator measures the extent to which the licensing processes of drivers establish levels of competencies that will deliver safe drivers.
A sample of all driver licences issued under the Graduated Driver Training and Licensing System (GDT&LS) are reviewed by DoT and the number of licences that complied with each key component in the GDT&LS are recorded and divided by the total number of licences assessed. The resulting figure is then expressed as a percentage.
The sample audit is conducted on a weekly basis. The system is based on using automated reports that provide the driver licences issued in the last week, of which 10 samples are selected at random to a total of 100 per quarter. All process components related to the GDT&LS are then checked to determine that compliance with each criterion is met.
Percentage of driver licences issued that comply with the Graduated Driver Training and Licensing System (Safe Drivers)
0%
25%
50%
75%
100% 97.3% 94.3% 96.5%100% 96.8%
2016
-17
Act
ual
2017
-18
Act
ual
2018
-19
Act
ual
2019
-20
Bud
get T
arge
t
2019
-20
Act
ual
Reason for significant variance
There was no significant variance between the 2019-20 Budget Target and 2019-20 Actual or between the 2018-19 Actual 2019-20 Actual.
Percentage of driver’s licence cards issued within 21 days of completed application
DoT is committed to issuing driver’s licence cards in a timely manner to provide an effective service to its customers.
This measure is calculated by dividing the total number of licence cards issued within the timeframe (21 days) by the total number of licence cards issued (multiplied by 100), to determine the percentage.
This indicator demonstrates that DoT is providing an effective service to its customers by issuing all driver’s licence cards within 21 days of completed application.
Percentage of driver’s licence cards issued within 21 days of completed application
0%
25%
50%
75%
100%100% 100% 100% 100% 100%
2016
-17
Act
ual
2017
-18
Act
ual
2018
-19
Act
ual
2019
-20
Bud
get T
arge
t
2019
-20
Act
ual
Reason for significant variance
There was no significant variance between the 2019-20 Budget Target and the 2019-20 Actual or between the 2018-19 Actual and the 2019-20 Actual.
Annual Report 2019-20 Page 175
Disclosures and Legal Compliance
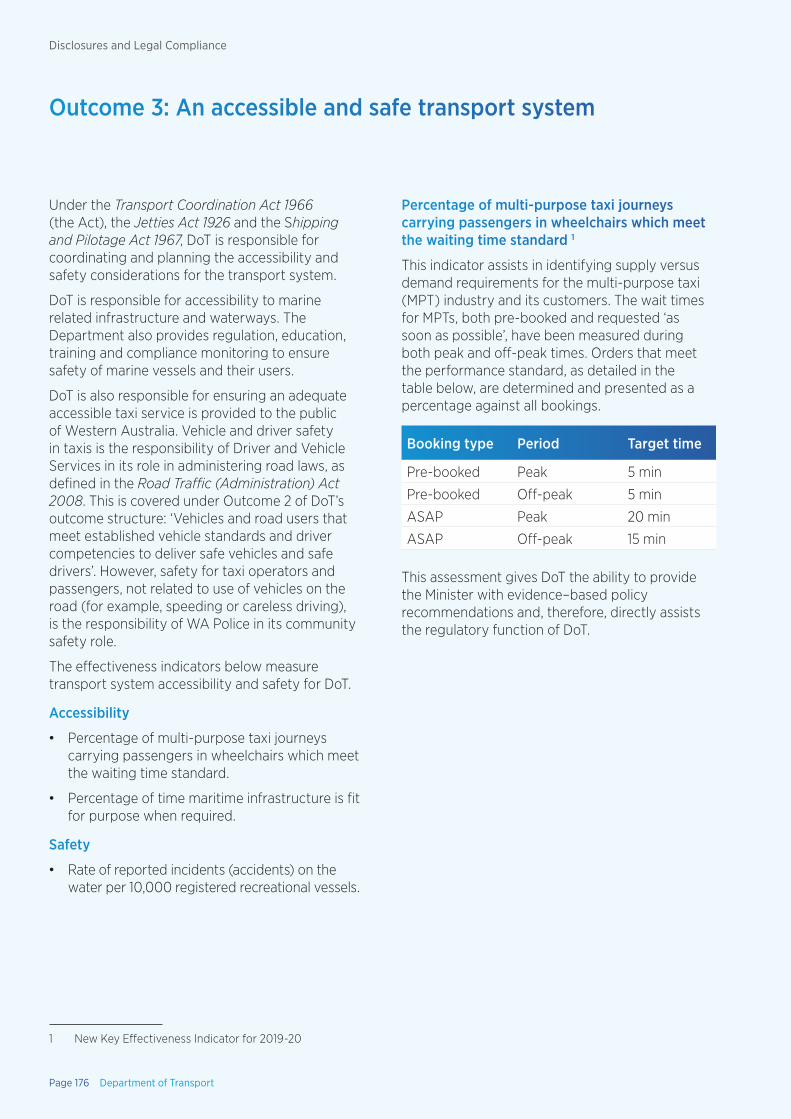
Outcome 3: An accessible and safe transport system
Under the Transport Coordination Act 1966 (the Act), the Jetties Act 1926 and the Shipping and Pilotage Act 1967, DoT is responsible for coordinating and planning the accessibility and safety considerations for the transport system.
DoT is responsible for accessibility to marine related infrastructure and waterways. The Department also provides regulation, education, training and compliance monitoring to ensure safety of marine vessels and their users.
DoT is also responsible for ensuring an adequate accessible taxi service is provided to the public of Western Australia. Vehicle and driver safety in taxis is the responsibility of Driver and Vehicle Services in its role in administering road laws, as defined in the Road Traffic (Administration) Act 2008. This is covered under Outcome 2 of DoT’s outcome structure: ‘Vehicles and road users that meet established vehicle standards and driver competencies to deliver safe vehicles and safe drivers’. However, safety for taxi operators and passengers, not related to use of vehicles on the road (for example, speeding or careless driving), is the responsibility of WA Police in its community safety role.
The effectiveness indicators below measure transport system accessibility and safety for DoT.
Accessibility
• Percentage of multi-purpose taxi journeys carrying passengers in wheelchairs which meet the waiting time standard.
• Percentage of time maritime infrastructure is fit for purpose when required.
Safety
• Rate of reported incidents (accidents) on the water per 10,000 registered recreational vessels.
1 New Key Effectiveness Indicator for 2019-20
Percentage of multi-purpose taxi journeys carrying passengers in wheelchairs which meet the waiting time standard 1
This indicator assists in identifying supply versus demand requirements for the multi-purpose taxi (MPT) industry and its customers. The wait times for MPTs, both pre-booked and requested ‘as soon as possible’, have been measured during both peak and off-peak times. Orders that meet the performance standard, as detailed in the table below, are determined and presented as a percentage against all bookings.
Booking type Period Target time
Pre-booked Peak 5 min
Pre-booked Off-peak 5 min
ASAP Peak 20 min
ASAP Off-peak 15 min
This assessment gives DoT the ability to provide the Minister with evidence–based policy recommendations and, therefore, directly assists the regulatory function of DoT.
Page 176 Department of Transport
Disclosures and Legal Compliance

Percentage of multi-purpose taxi journeys carrying passengers in wheelchairs which meet the waiting time standard
0%
25%
50%
75%
100%
N/A N/A N/A
90.0%
98.5%
2016
-17
Act
ual
2017
-18
Act
ual
2018
-19
Act
ual
2019
-20
Bud
get T
arge
t
2019
-20
Act
ual
Reason for significant variance
When the target of 90% was set, it was expected that this would be exceeded as the multi-purpose taxi dispatch service contract is closely managed. However, it was unknown what effect the on-demand transport industry reform would have on the KPI’s performance when the target was set to allow for a period of transition for the industry. Another factor in exceeding the target may be that the reform has allowed the multi-purpose taxi dispatch service contractor to increase its fleet of wheelchair accessible vehicles, making more services available to people with disability.
Percentage of time maritime infrastructure is fit for purpose when required
DoT is responsible for the planning, creation, enhancement and management of new and existing land and water-based maritime facilities for small craft boats throughout Western Australia.
DoT manages and maintains facilities at approximately 50 discrete locations throughout the State, including a variety of maritime infrastructure assets, such as jetties, boat launching facilities, pens and mooring areas, as well as associated navigational aids and access to facilities via dredged channels.
This indicator measures the percentage of time that these maritime facilities under DoT’s managerial control were accessible to the public throughout 2019-20.
The accessibility of four maritime facilities — pens, jetties, navigational aids and dredged channels — is individually calculated in terms of percentage. These individual percentages are then aggregated and divided by four to arrive at the indicator’s result.
Percentage of time maritime infrastructure is fit for purpose when required
0%
25%
50%
75%
100%99.6% 99.8% 99.0% 99.7% 99.0%
2016
-17
Act
ual
2017
-18
Act
ual
2018
-19
Act
ual
2019
-20
Bud
get T
arge
t
2019
-20
Act
ual
Reason for significant variance
There was no significant variance between the 2019-20 Budget Target and the 2019-20 Actual or between the 2018-19 Actual and the 2019-20 Actual.
Annual Report 2019-20 Page 177
Disclosures and Legal Compliance
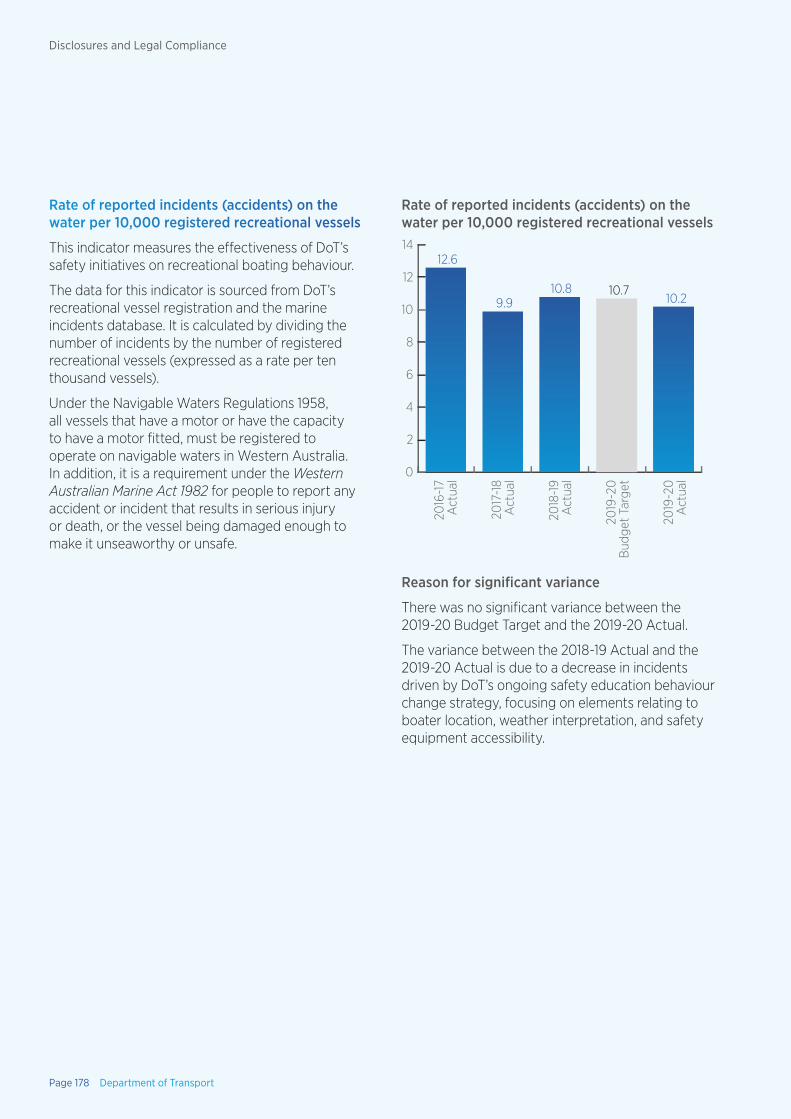
Rate of reported incidents (accidents) on the water per 10,000 registered recreational vessels
This indicator measures the effectiveness of DoT’s safety initiatives on recreational boating behaviour.
The data for this indicator is sourced from DoT’s recreational vessel registration and the marine incidents database. It is calculated by dividing the number of incidents by the number of registered recreational vessels (expressed as a rate per ten thousand vessels).
Under the Navigable Waters Regulations 1958, all vessels that have a motor or have the capacity to have a motor fitted, must be registered to operate on navigable waters in Western Australia. In addition, it is a requirement under the Western Australian Marine Act 1982 for people to report any accident or incident that results in serious injury or death, or the vessel being damaged enough to make it unseaworthy or unsafe.
Rate of reported incidents (accidents) on the water per 10,000 registered recreational vessels
0
2
4
6
8
10
12
1412.6
9.910.8 10.7
10.2
2016
-17
Act
ual
2017
-18
Act
ual
2018
-19
Act
ual
2019
-20
Bud
get T
arge
t
2019
-20
Act
ual
Reason for significant variance
There was no significant variance between the 2019-20 Budget Target and the 2019-20 Actual.
The variance between the 2018-19 Actual and the 2019-20 Actual is due to a decrease in incidents driven by DoT’s ongoing safety education behaviour change strategy, focusing on elements relating to boater location, weather interpretation, and safety equipment accessibility.
Page 178 Department of Transport
Disclosures and Legal Compliance
The measures of efficiency indicate the key services provided (outputs) in relation to the cost of the resources (inputs) required to deliver them. While the effectiveness indicators measure DoT’s success in achieving its desired outcomes, the efficiency indicators measure the efficiency (in most cases, the cost per unit of the service delivered) in providing the services that relates to these outcomes.
When calculating the efficiency indicators, all costs involved with providing the service, such as direct cost, corporate overheads and interdepartmental cost allocations, are included.
The following expenditures have been excluded in calculating efficiency indicators, as they either do not relate to the delivery of services by DoT or are specific project spending mostly funded by external sources such as for METRONET.
Measures of efficiency
2019–20 2018–19 2017–18
Non–reportable KPI cost $’000 $’000 $’000
Grant and subsidies 214,919 123,418 93,340
Non–core operation 68,598 24,382 28,756
Total non–reportable cost 283,517 147,800 122,096
For example, non–core operation costs include functions that are not directly related to the reportable KPIs, such as all costs associated with administering grants and subsidies and specific projects that can have project specific efficiency measures.
The significant increase in the Grant and subsidies costs in 2019-20 reflects the State Government’s commitment to buy back metropolitan taxi plates for $118 million.
The non-core operations also had a significant cost increase in 2019-20, which was mainly due to the settlement of a litigation on behalf of State Government in respect to a dispute under the Marine and Harbours Act.
The measures of efficiency used for DoT and how they relate are as follows.
Annual Report 2019-20 Page 179
Disclosures and Legal Compliance
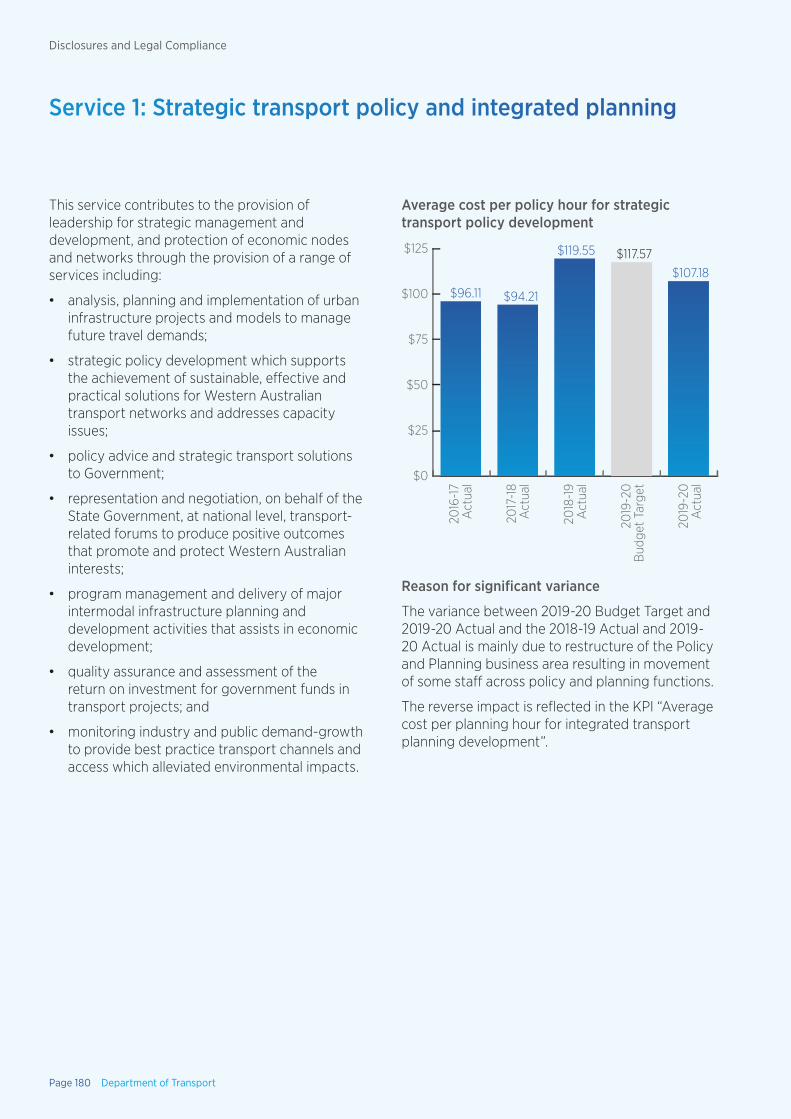
This service contributes to the provision of leadership for strategic management and development, and protection of economic nodes and networks through the provision of a range of services including:
• analysis, planning and implementation of urban infrastructure projects and models to manage future travel demands;
• strategic policy development which supports the achievement of sustainable, effective and practical solutions for Western Australian transport networks and addresses capacity issues;
• policy advice and strategic transport solutions to Government;
• representation and negotiation, on behalf of the State Government, at national level, transport-related forums to produce positive outcomes that promote and protect Western Australian interests;
• program management and delivery of major intermodal infrastructure planning and development activities that assists in economic development;
• quality assurance and assessment of the return on investment for government funds in transport projects; and
• monitoring industry and public demand-growth to provide best practice transport channels and access which alleviated environmental impacts.
Average cost per policy hour for strategic transport policy development
$0
$25
$50
$75
$100
$125
$96.11 $94.21
$119.55 $117.57$107.18
2016
-17
Act
ual
2017
-18
Act
ual
2018
-19
Act
ual
2019
-20
Bud
get T
arge
t
2019
-20
Act
ual
Reason for significant variance
The variance between 2019-20 Budget Target and 2019-20 Actual and the 2018-19 Actual and 2019-20 Actual is mainly due to restructure of the Policy and Planning business area resulting in movement of some staff across policy and planning functions.
The reverse impact is reflected in the KPI “Average cost per planning hour for integrated transport planning development”.
Service 1: Strategic transport policy and integrated planning
Page 180 Department of Transport
Disclosures and Legal Compliance
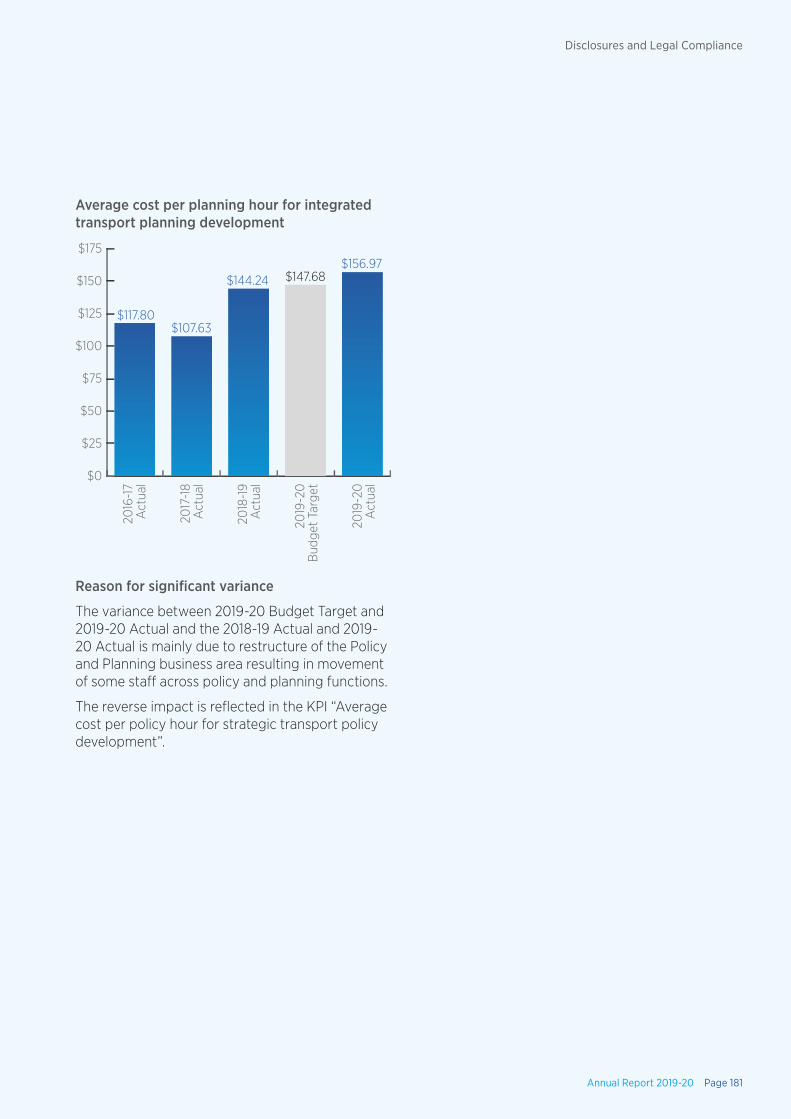
Average cost per planning hour for integrated transport planning development
$0
$25
$50
$75
$100
$125
$150
$175
$117.80$107.63
$144.24 $147.68$156.97
2016
-17
Act
ual
2017
-18
Act
ual
2018
-19
Act
ual
2019
-20
Bud
get T
arge
t
2019
-20
Act
ual
Reason for significant variance
The variance between 2019-20 Budget Target and 2019-20 Actual and the 2018-19 Actual and 2019-20 Actual is mainly due to restructure of the Policy and Planning business area resulting in movement of some staff across policy and planning functions.
The reverse impact is reflected in the KPI “Average cost per policy hour for strategic transport policy development”.
Annual Report 2019-20 Page 181
Disclosures and Legal Compliance
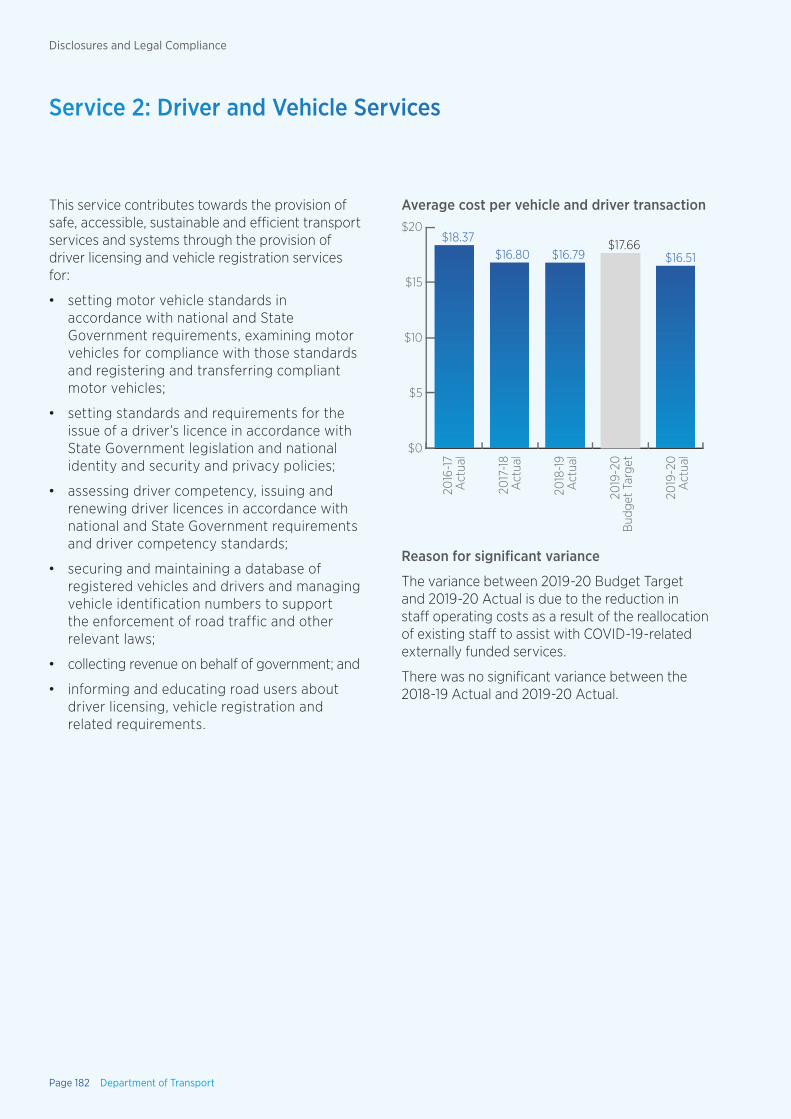
Service 2: Driver and Vehicle Services
This service contributes towards the provision of safe, accessible, sustainable and efficient transport services and systems through the provision of driver licensing and vehicle registration services for:
• setting motor vehicle standards in accordance with national and State Government requirements, examining motor vehicles for compliance with those standards and registering and transferring compliant motor vehicles;
• setting standards and requirements for the issue of a driver’s licence in accordance with State Government legislation and national identity and security and privacy policies;
• assessing driver competency, issuing and renewing driver licences in accordance with national and State Government requirements and driver competency standards;
• securing and maintaining a database of registered vehicles and drivers and managing vehicle identification numbers to support the enforcement of road traffic and other relevant laws;
• collecting revenue on behalf of government; and
• informing and educating road users about driver licensing, vehicle registration and related requirements.
Average cost per vehicle and driver transaction
$0
$5
$10
$15
$20$18.37
$16.80 $16.79$17.66
$16.51
2016
-17
Act
ual
2017
-18
Act
ual
2018
-19
Act
ual
2019
-20
Bud
get T
arge
t
2019
-20
Act
ual
Reason for significant variance
The variance between 2019-20 Budget Target and 2019-20 Actual is due to the reduction in staff operating costs as a result of the reallocation of existing staff to assist with COVID-19-related externally funded services.
There was no significant variance between the 2018-19 Actual and 2019-20 Actual.
Page 182 Department of Transport
Disclosures and Legal Compliance
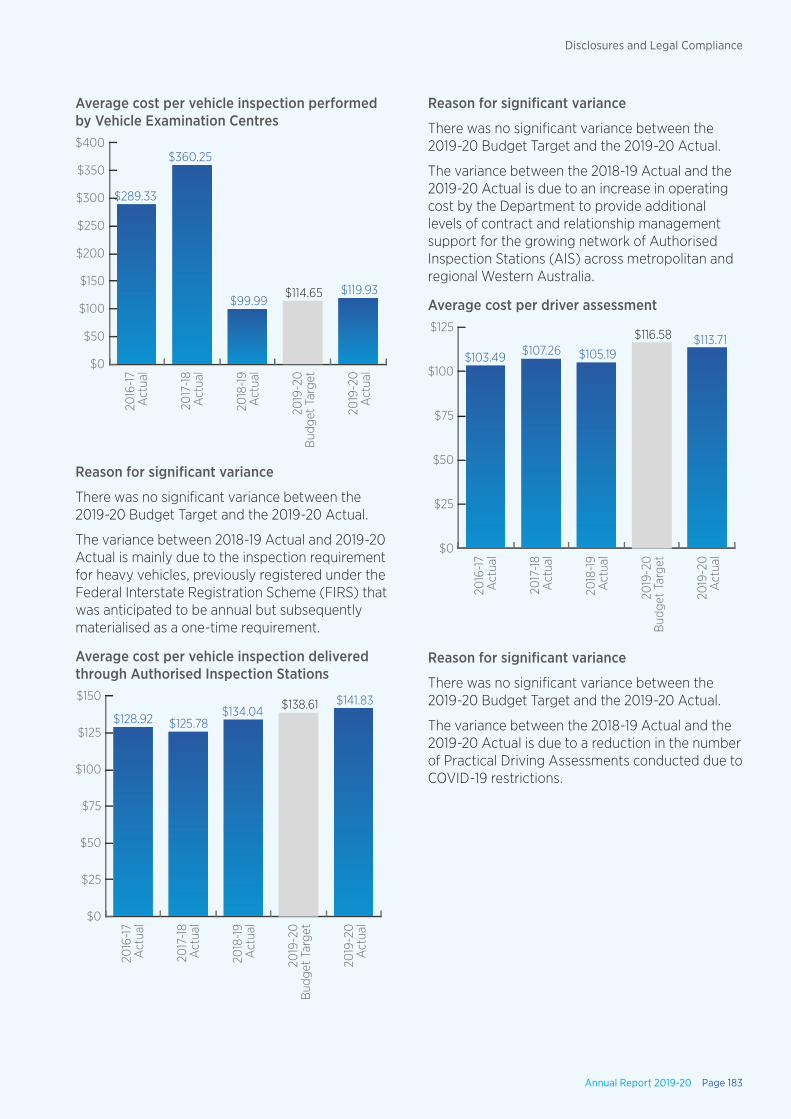
Reason for significant variance
There was no significant variance between the 2019-20 Budget Target and the 2019-20 Actual.
The variance between the 2018-19 Actual and the 2019-20 Actual is due to an increase in operating cost by the Department to provide additional levels of contract and relationship management support for the growing network of Authorised Inspection Stations (AIS) across metropolitan and regional Western Australia.
Average cost per driver assessment
$0
$25
$50
$75
$100
$125
$103.49 $107.26 $105.19
$116.58 $113.71
2016
-17
Act
ual
2017
-18
Act
ual
2018
-19
Act
ual
2019
-20
Bud
get T
arge
t
2019
-20
Act
ual
Reason for significant variance
There was no significant variance between the 2019-20 Budget Target and the 2019-20 Actual.
The variance between the 2018-19 Actual and the 2019-20 Actual is due to a reduction in the number of Practical Driving Assessments conducted due to COVID-19 restrictions.
Average cost per vehicle inspection performed by Vehicle Examination Centres
$0
$50
$100
$150
$200
$250
$300
$350
$400
$289.33
$360.25
$99.99$114.65 $119.93
2016
-17
Act
ual
2017
-18
Act
ual
2018
-19
Act
ual
2019
-20
Bud
get T
arge
t
2019
-20
Act
ual
Reason for significant variance
There was no significant variance between the 2019-20 Budget Target and the 2019-20 Actual.
The variance between 2018-19 Actual and 2019-20 Actual is mainly due to the inspection requirement for heavy vehicles, previously registered under the Federal Interstate Registration Scheme (FIRS) that was anticipated to be annual but subsequently materialised as a one-time requirement.
Average cost per vehicle inspection delivered through Authorised Inspection Stations
$0
$25
$50
$75
$100
$125
$150
$128.92 $125.78$134.04 $138.61 $141.83
2016
-17
Act
ual
2017
-18
Act
ual
2018
-19
Act
ual
2019
-20
Bud
get T
arge
t
2019
-20
Act
ual
Annual Report 2019-20 Page 183
Disclosures and Legal Compliance
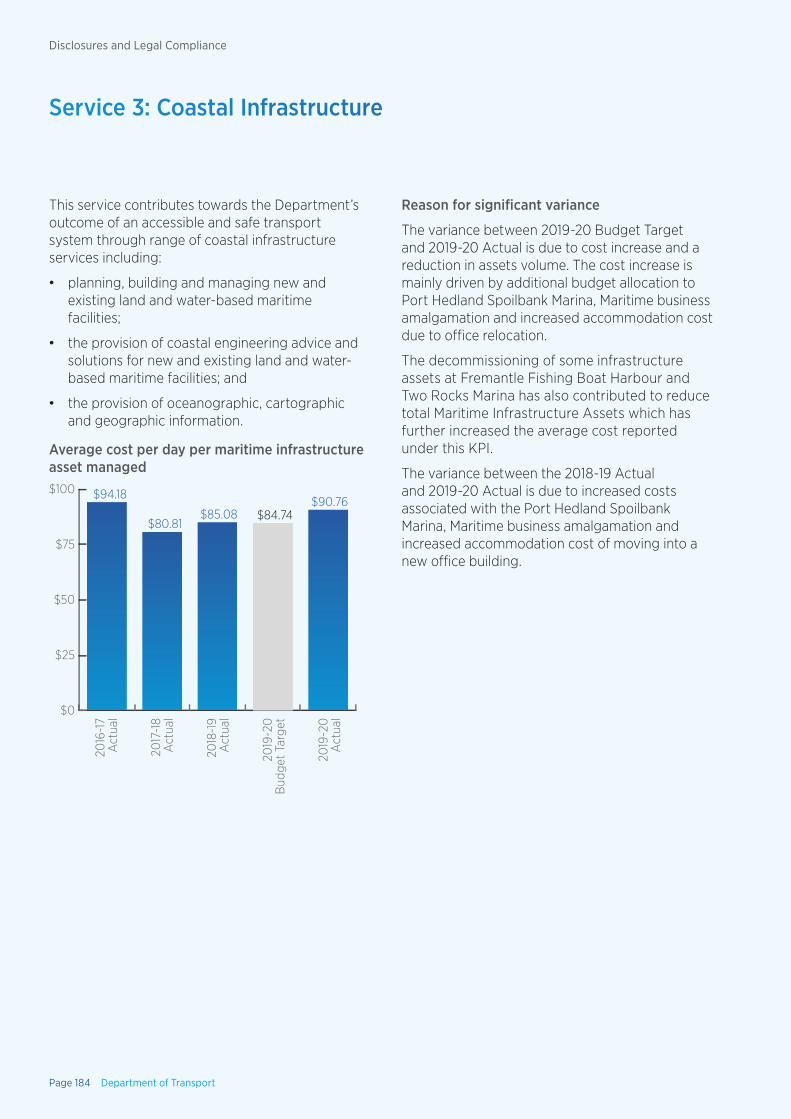
This service contributes towards the Department’s outcome of an accessible and safe transport system through range of coastal infrastructure services including:
• planning, building and managing new and existing land and water-based maritime facilities;
• the provision of coastal engineering advice and solutions for new and existing land and water-based maritime facilities; and
• the provision of oceanographic, cartographic and geographic information.
Average cost per day per maritime infrastructure asset managed
$0
$25
$50
$75
$100 $94.18
$80.81$85.08 $84.74
$90.76
2016
-17
Act
ual
2017
-18
Act
ual
2018
-19
Act
ual
2019
-20
Bud
get T
arge
t
2019
-20
Act
ual
Reason for significant variance
The variance between 2019-20 Budget Target and 2019-20 Actual is due to cost increase and a reduction in assets volume. The cost increase is mainly driven by additional budget allocation to Port Hedland Spoilbank Marina, Maritime business amalgamation and increased accommodation cost due to office relocation.
The decommissioning of some infrastructure assets at Fremantle Fishing Boat Harbour and Two Rocks Marina has also contributed to reduce total Maritime Infrastructure Assets which has further increased the average cost reported under this KPI.
The variance between the 2018-19 Actual and 2019-20 Actual is due to increased costs associated with the Port Hedland Spoilbank Marina, Maritime business amalgamation and increased accommodation cost of moving into a new office building.
Service 3: Coastal Infrastructure
Page 184 Department of Transport
Disclosures and Legal Compliance
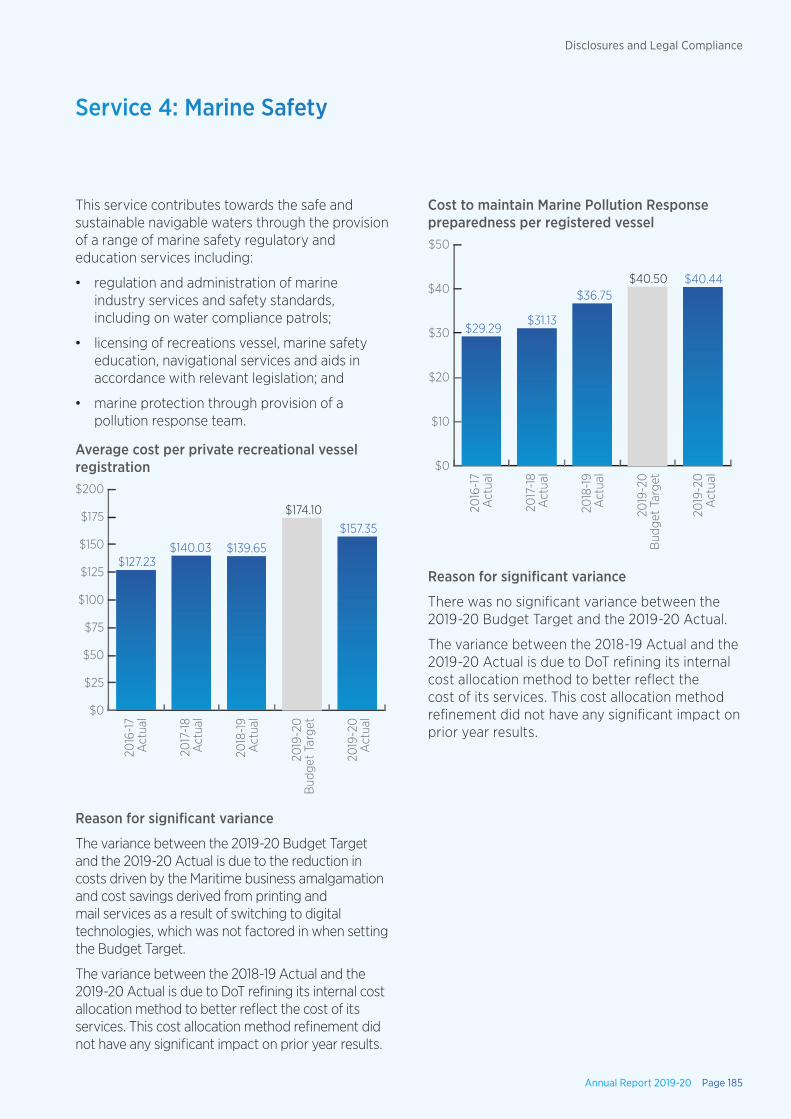
This service contributes towards the safe and sustainable navigable waters through the provision of a range of marine safety regulatory and education services including:
• regulation and administration of marine industry services and safety standards, including on water compliance patrols;
• licensing of recreations vessel, marine safety education, navigational services and aids in accordance with relevant legislation; and
• marine protection through provision of a pollution response team.
Average cost per private recreational vessel registration
$0
$25
$50
$75
$100
$125
$150
$175
$200
2016
-17
Act
ual
2017
-18
Act
ual
2018
-19
Act
ual
2019
-20
Bud
get T
arge
t
2019
-20
Act
ual
$127.23$140.03 $139.65
$174.10$157.35
Reason for significant variance
The variance between the 2019-20 Budget Target and the 2019-20 Actual is due to the reduction in costs driven by the Maritime business amalgamation and cost savings derived from printing and mail services as a result of switching to digital technologies, which was not factored in when setting the Budget Target.
The variance between the 2018-19 Actual and the 2019-20 Actual is due to DoT refining its internal cost allocation method to better reflect the cost of its services. This cost allocation method refinement did not have any significant impact on prior year results.
Service 4: Marine Safety
Cost to maintain Marine Pollution Response preparedness per registered vessel
$0
$10
$20
$30
$40
$50
2016
-17
Act
ual
2017
-18
Act
ual
2018
-19
Act
ual
2019
-20
Bud
get T
arge
t
2019
-20
Act
ual
$29.29$31.13
$36.75$40.50 $40.44
Reason for significant variance
There was no significant variance between the 2019-20 Budget Target and the 2019-20 Actual.
The variance between the 2018-19 Actual and the 2019-20 Actual is due to DoT refining its internal cost allocation method to better reflect the cost of its services. This cost allocation method refinement did not have any significant impact on prior year results.
Annual Report 2019-20 Page 185
Disclosures and Legal Compliance
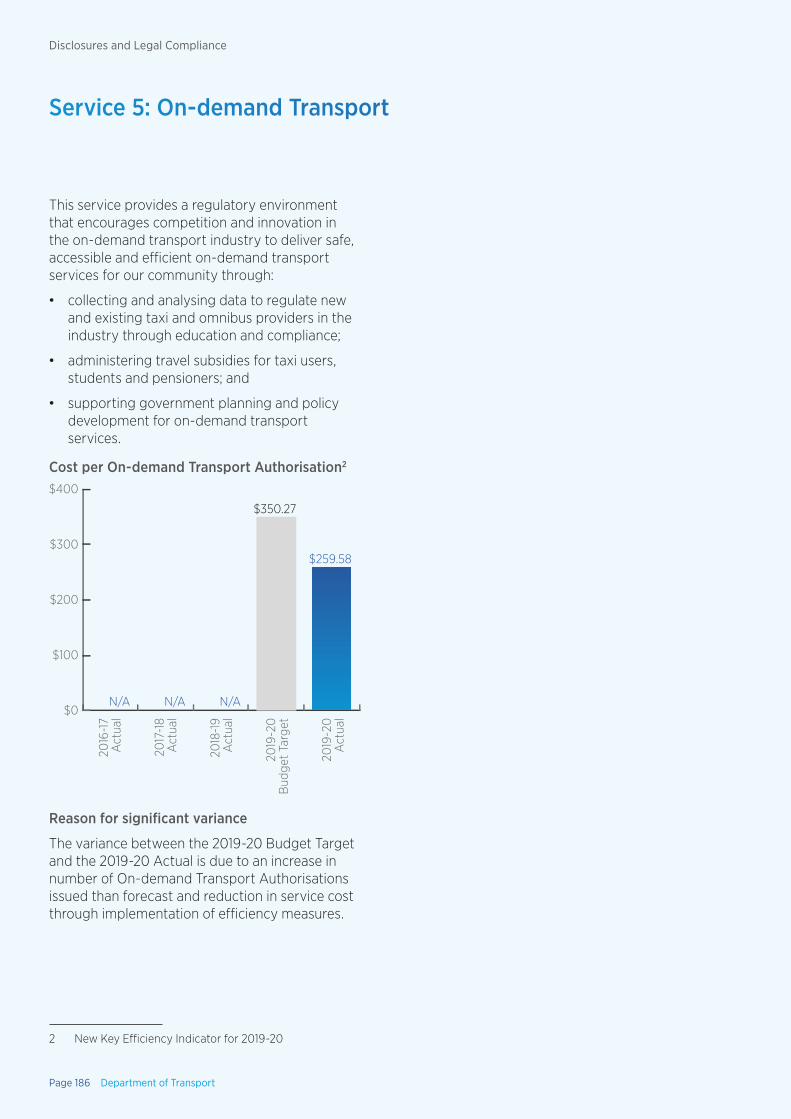
This service provides a regulatory environment that encourages competition and innovation in the on-demand transport industry to deliver safe, accessible and efficient on-demand transport services for our community through:
• collecting and analysing data to regulate new and existing taxi and omnibus providers in the industry through education and compliance;
• administering travel subsidies for taxi users, students and pensioners; and
• supporting government planning and policy development for on-demand transport services.
Cost per On-demand Transport Authorisation2
$0
$100
$200
$300
$400
2016
-17
Act
ual
2017
-18
Act
ual
2018
-19
Act
ual
2019
-20
Bud
get T
arge
t
2019
-20
Act
ual
N/A N/A N/A
$350.27
$259.58
Reason for significant variance
The variance between the 2019-20 Budget Target and the 2019-20 Actual is due to an increase in number of On-demand Transport Authorisations issued than forecast and reduction in service cost through implementation of efficiency measures.
2 New Key Efficiency Indicator for 2019-20
Service 5: On-demand Transport
Page 186 Department of Transport
Disclosures and Legal Compliance
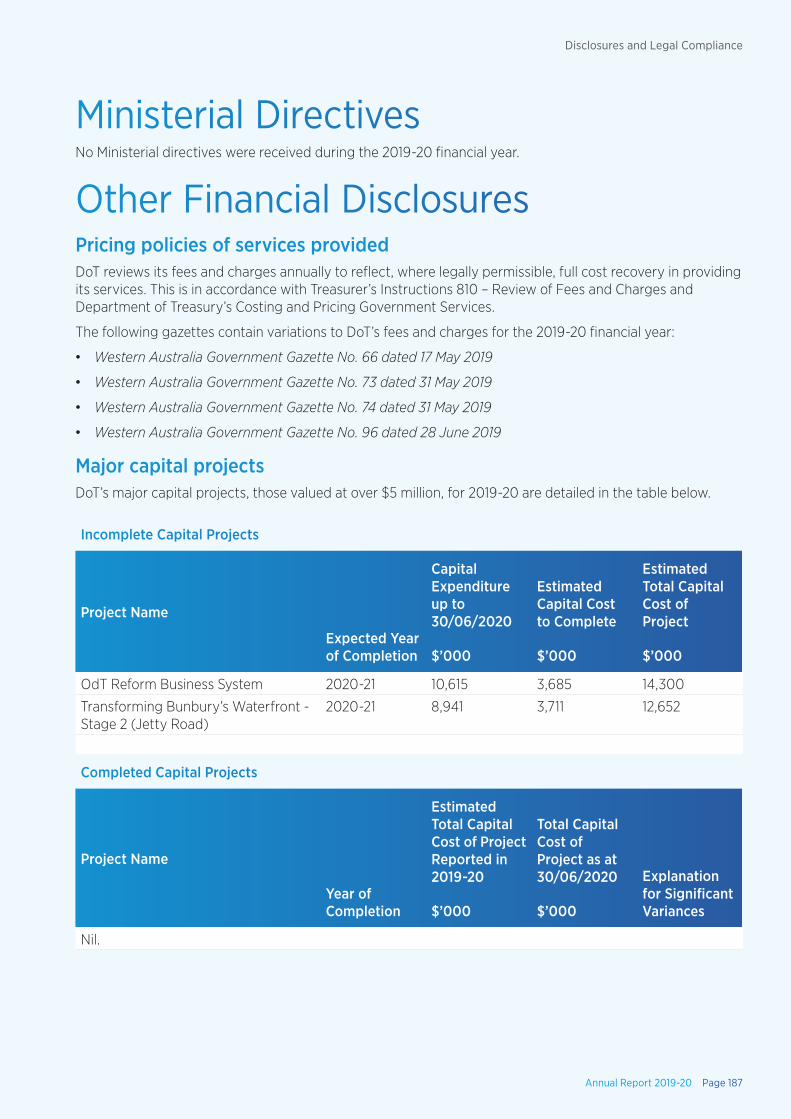
Ministerial DirectivesNo Ministerial directives were received during the 2019-20 financial year.
Other Financial DisclosuresPricing policies of services providedDoT reviews its fees and charges annually to reflect, where legally permissible, full cost recovery in providing its services. This is in accordance with Treasurer’s Instructions 810 – Review of Fees and Charges and Department of Treasury’s Costing and Pricing Government Services.
The following gazettes contain variations to DoT’s fees and charges for the 2019-20 financial year:
• Western Australia Government Gazette No. 66 dated 17 May 2019
• Western Australia Government Gazette No. 73 dated 31 May 2019
• Western Australia Government Gazette No. 74 dated 31 May 2019
• Western Australia Government Gazette No. 96 dated 28 June 2019
Major capital projectsDoT’s major capital projects, those valued at over $5 million, for 2019-20 are detailed in the table below.
Incomplete Capital Projects
Project Name
Expected Year of Completion
Capital Expenditure up to 30/06/2020
Estimated Capital Cost to Complete
Estimated Total Capital Cost of Project
$’000 $’000 $’000
OdT Reform Business System 2020-21 10,615 3,685 14,300
Transforming Bunbury’s Waterfront - Stage 2 (Jetty Road)
2020-21 8,941 3,711 12,652
Completed Capital Projects
Project Name
Year of Completion
Estimated Total Capital Cost of Project Reported in 2019-20
Total Capital Cost of Project as at 30/06/2020 Explanation
for Significant Variances$’000 $’000
Nil.
Annual Report 2019-20 Page 187
Disclosures and Legal Compliance
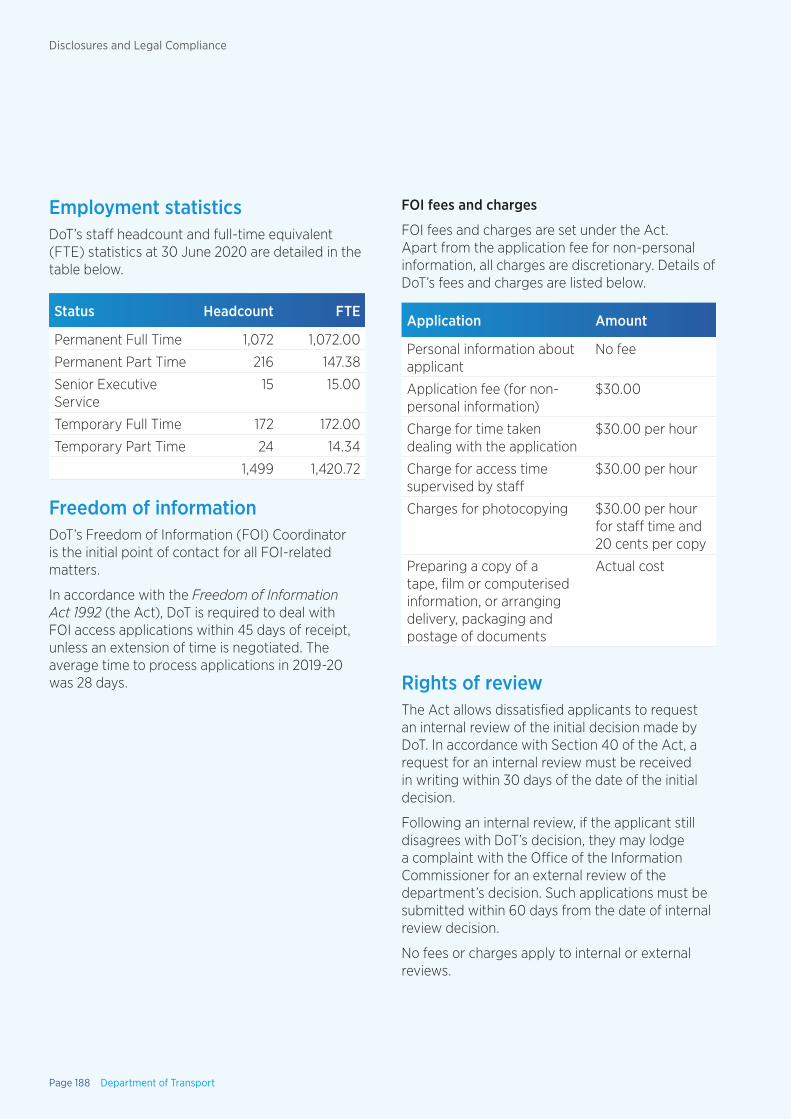
Employment statisticsDoT’s staff headcount and full-time equivalent (FTE) statistics at 30 June 2020 are detailed in the table below.
Status Headcount FTE
Permanent Full Time 1,072 1,072.00
Permanent Part Time 216 147.38
Senior Executive Service
15 15.00
Temporary Full Time 172 172.00
Temporary Part Time 24 14.34
1,499 1,420.72
Freedom of informationDoT’s Freedom of Information (FOI) Coordinator is the initial point of contact for all FOI-related matters.
In accordance with the Freedom of Information Act 1992 (the Act), DoT is required to deal with FOI access applications within 45 days of receipt, unless an extension of time is negotiated. The average time to process applications in 2019-20 was 28 days.
FOI fees and charges
FOI fees and charges are set under the Act. Apart from the application fee for non-personal information, all charges are discretionary. Details of DoT’s fees and charges are listed below.
Application Amount
Personal information about applicant
No fee
Application fee (for non-personal information)
$30.00
Charge for time taken dealing with the application
$30.00 per hour
Charge for access time supervised by staff
$30.00 per hour
Charges for photocopying $30.00 per hour for staff time and 20 cents per copy
Preparing a copy of a tape, film or computerised information, or arranging delivery, packaging and postage of documents
Actual cost
Rights of reviewThe Act allows dissatisfied applicants to request an internal review of the initial decision made by DoT. In accordance with Section 40 of the Act, a request for an internal review must be received in writing within 30 days of the date of the initial decision.
Following an internal review, if the applicant still disagrees with DoT’s decision, they may lodge a complaint with the Office of the Information Commissioner for an external review of the department’s decision. Such applications must be submitted within 60 days from the date of internal review decision.
No fees or charges apply to internal or external reviews.
Page 188 Department of Transport
Disclosures and Legal Compliance
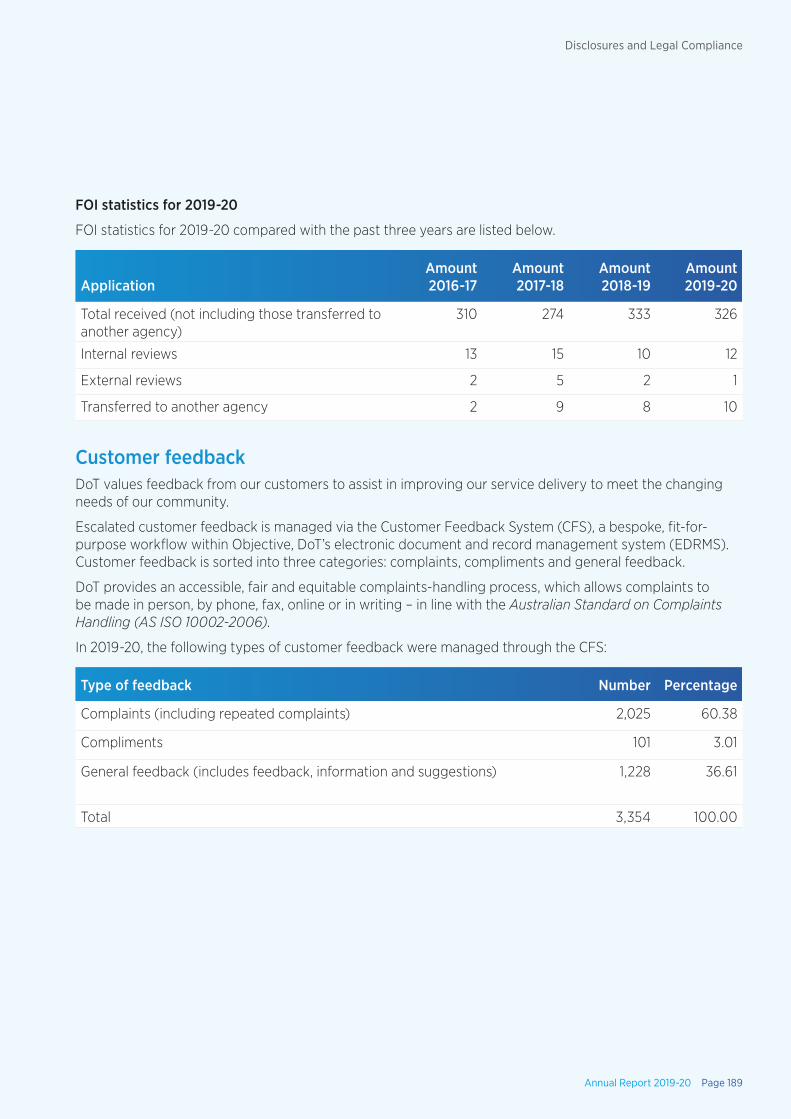
FOI statistics for 2019-20
FOI statistics for 2019-20 compared with the past three years are listed below.
ApplicationAmount 2016-17
Amount 2017-18
Amount 2018-19
Amount 2019-20
Total received (not including those transferred to another agency)
310 274 333 326
Internal reviews 13 15 10 12
External reviews 2 5 2 1
Transferred to another agency 2 9 8 10
Customer feedbackDoT values feedback from our customers to assist in improving our service delivery to meet the changing needs of our community.
Escalated customer feedback is managed via the Customer Feedback System (CFS), a bespoke, fit-for-purpose workflow within Objective, DoT’s electronic document and record management system (EDRMS). Customer feedback is sorted into three categories: complaints, compliments and general feedback.
DoT provides an accessible, fair and equitable complaints-handling process, which allows complaints to be made in person, by phone, fax, online or in writing – in line with the Australian Standard on Complaints Handling (AS ISO 10002-2006).
In 2019-20, the following types of customer feedback were managed through the CFS:
Type of feedback Number Percentage
Complaints (including repeated complaints) 2,025 60.38
Compliments 101 3.01
General feedback (includes feedback, information and suggestions) 1,228 36.61
Total 3,354 100.00
Annual Report 2019-20 Page 189
Disclosures and Legal Compliance

Overall, the percentage of complaints received has reduced slightly in 2019-20 (down from 64 per cent in 2018-19) while general feedback has increased compared with 32.66 per cent previous year. DoT continues to analyse customer complaints and feedback processes, and ensures accessibility for customers wishing to submit a general enquiry online.
A breakdown of customer feedback received by business unit in 2019-20 is shown below.
Business Units Complaints
Feedback, Information,
Suggestions and Compliments
Total Customer Feedback
Total Customer Feedback by
Percentage
Driver and Vehicle Services
1,796 1,141 2,937 87.57
Maritime 47 83 130 3.88
Regional Services 68 22 90 2.68
On-demand Transport 85 29 114 3.40
Other** 29 54 83 2.47
Total 2,025 1,329 3,354 100.00
** all other DoT business units combined
In 2019-20, there was a slight increase in the percentage of total feedback received relating to DoT’s DVS business unit. However, the total number of complaints received regarding these services has decreased slightly when compared to the previous year (1,805 complaints).
The percentage of total feedback for the Maritime business unit has decreased to 3.88 per cent compared with 4.27 per cent the previous year when it was two separate business units (Coastal Infrastructure and Marine Safety).
DoT’s On-demand transport business unit also experienced a drop in total feedback and complaints – 5.18 per cent in 2018-19 compared to 3.40 per cent this year. This is a significant achievement in light of the industry reforms implemented by the team, and demonstrates the concerted efforts to keep the industry informed of the legislative changes.
A Customer Feedback Working Group (Working Group) was established by DoT in 2019 to identify improvements to customer feedback policies, processes and systems, with a view to improving outcomes for our customers. The Working Group has developed a Customer Service Charter which is available on our website. The charter outlines our commitment to our customers, what they can expect from DoT and how they can assist the agency to deliver the best possible customer experience.
Page 190 Department of Transport
Disclosures and Legal Compliance
Creating a values-driven organisationFuture Ready Workforce update
In an environment of rapidly changing technologies that are changing the way we live and work, DoT established its Future Ready Workforce (FRW) program in 2018. This initiative aims to ensure DoT creates a capable, adaptive and responsive workforce for the continued delivery of the agency’s strategic priorities for the long-term. The need for a digitally-enabled workforce was further highlighted by the COVID-19 pandemic, which saw large numbers of employees working remotely.
The FRW group comprises 24 representatives from across the agency. After participating in training, development and co-design workshops, the group developed five innovative solutions to equip DoT and its workforce for sustainable change and continued evolution.
The five prototypes will be piloted in the second half of 2020, focusing on flexible working arrangements, building a culture of trust, creating greater diversity and inclusion, identifying and developing talent, and enabling managers to lead more effectively.
DoT has facilitated the creation of People Plans for each business unit that outline the current and desired future states of their teams focusing on workforce composition, values, behaviours and capabilities.
In November 2019, a DoT-wide values assessment was conducted to understand the extent to which our organisational and personal values enable the delivery of DoT’s operations and services. The assessment received a response rate of 64 per cent and showed our top values are great teamwork, work/home balance, great people and customer satisfaction. The results were unpacked with both leaders and their teams, and a cultural action plan is being designed to strengthen DoT as a values-driven organisation.
Establishing a fully conscious organisational culture requires change to be managed well at all levels. A change leadership training series has been developed to increase individuals’ emotional intelligence and understanding of their impacts on others, create greater awareness of the drivers for change, and support employees to lead, achieve and thrive during change. The leadership series has been facilitated for teams in two business units.
The feedback captured from staff during the COVID-19 pulse check showed a strong mandate to continue enabling flexible working arrangements. DoT is now prioritising the development of a framework to support flexible working arrangements while taking into consideration the multifaceted nature of our workforce.
Workforce Diversity and Inclusion Plan 2016-20
DoT’s Workforce Diversity and Inclusion Plan (WDIP) 2016-2020 builds on the positive steps that have already been taken by the agency to create an inclusive, values-driven culture. The WDIP outlines strategies to improve representation and outcomes for employees from six target diversity groups:
1. Aboriginal and Torres Strait Islander people
2. Culturally and linguistically diverse (CALD) people
3. People with disability
4. Youth (under 24 years of age)
5. Mature age
6. Women in the Senior Executive Service (SES)
The plan reaches the end of its four-year term at the end of 2020, and planning has already commenced on developing the next WDIP for 2021 onwards. There will be a renewed focus on priority areas to create meaningful change, aligned with DoT’s and the public sector’s strategic priorities. The approach will be supported through developing DoT’s recruitment and selection techniques alongside our hiring managers and recruitment panel members.
Annual Report 2019-20 Page 191
Disclosures and Legal Compliance
The current WDIP has successfully achieved the following outcomes:
• An increase in females within leadership roles across DoT.
• Fresh thinking applied to Contact Centre customer service officer recruitment, resulting in an increase in the percentage of suitable younger candidates, improving age diversity. Changes included using contemporary language in job advertisements, simplified application questions, shorter response times and a new recruiting assessment approach. In 2018, 0 per cent of onboarded candidates were aged 30 years and under, while 36 per cent were aged 40 years and under. During 2019, these figures increased to 57 per cent and 86 per cent respectively.
• DoT and Main Roads continue to collaborate to promote benefits, events and opportunities from our corporate membership of the National Association of Women in Construction.
• Staff diversity awareness continued to be raised through DoT’s induction program, intranet Newsflashes, publishing of employee profiles and celebrating special events and occasions for diversity groups such as Harmony Day and NAIDOC Week.
• DoT, in partnership with the Department of Planning, Lands and Heritage, hosted a morning tea event to celebrate International Women’s Day in March. Guest speakers included Fadzi Whande, Principal Consultant Workforce Diversity for the PSC and a global inclusion and diversity strategist, who spoke on the theme, Each for Equal. The message highlighted how we can all contribute to achieving gender balance and ensure inclusion and belonging for all.
• POD is participating in a working group looking at joint traineeships and other employment pathway opportunities with Department of Communities (DoC), Fremantle Ports and the City of Fremantle. This opportunity has arisen through the co-location of agencies in the new Kings Square facilities at Fremantle. Early discussions are exploring the prospects to collaborate with DoC in regional areas.
• The selection process of participants in the 2020 Transport Portfolio Leadership Program included additional questions to capture diversity information and ensure a more diverse participant group.
Staff learning on discrimination and harassment has been reviewed and updated based on universal design principles.
Page 192 Department of Transport
Disclosures and Legal Compliance
Employee developmentDoT’s People and Organisational Development (POD) team offers and coordinates a range of development programs, targeted learning and training sessions to meet current upskilling needs and strengthen DoT’s capabilities to achieve business unit and organisational outcomes. Programs are delivered by both internal staff and external providers who bring specialised expertise, deliver contemporary content and, where appropriate, provide e-learning packages.
During 2019-20, POD reviewed feedback from employee perception surveys, operational people planning analysis and Future Ready Workforce sessions undertaken across the business. Capability gaps were identified and responded to with the development of a range of new programs to meet the skills needs of the organisation. Ten new training sessions and programs were implemented and programs, while three ongoing programs were continued. Many of these programs have been adapted to be delivered both face to face, or modified to a webinar format.
In responding to DoT’s highest priority areas, POD will continue to focus on delivering programs around everyday people management, leadership development and supporting capability development of the business. All programs and sessions are readily available to DoT employees through the intranet, which managers are also encouraged to utilise in support of their performance partnership program discussions and individual development plans.
At DoT, employee development is provided from day one, with induction essentials via e-learning to give a positive, effective and efficient onboarding experience.
Over the past year, DoT had two intakes of staff commence their Certificate IV in Leadership and Management. This program supports DoT’s commitment to developing our female leadership capability, with a high proportion of female managers at 54.5 per cent. 14 per cent of participants have been promoted since undertaking the program.
Following significant feedback from our staff, DoT developed a program to focus on common people management matters with an Everyday People Management Program. The program provides all managers with foundational or refresher learning on people management. Key modules include:
• conversations to address behaviour and performance;
• confident decision making on key industrial relations matters
• effective delegation;
• giving and receiving feedback; and
• managing conflict and resistance.
For more experienced managers, DoT conducted The Power of Influence. Further, POD have reviewed our People Managers Program and updated the content in preparation to go to tender for a provider to deliver this program. Consultation has taken place and POD anticipates offering a choice of electives to allow participants to align their learning to their relevant business needs. A six-month Leadership and Development Program for the Transport Portfolio was scheduled, but unfortunately had to be postponed until February 2021 due to COVID-19.
The onset of COVID-19 required POD to quickly adapt to delivering development sessions and content online. POD responded with a series of webinars on leading virtual and geographically dispersed teams, which were well-received by delegates.
In late 2019, POD facilitated a pilot of LinkedIn Learning for 100 staff over a three-month period. Feedback from participants was positive regarding the ease of accessing learning at any time from any platform. Of particular value was being able to find content while in the workplace to facilitate specific learning, especially IT and technology-based learning. DoT is exploring the capability to offer LinkedIn Learning as an ongoing option.
Annual Report 2019-20 Page 193
Disclosures and Legal Compliance

Page 194 Department of Transport
Disclosures and Legal Compliance
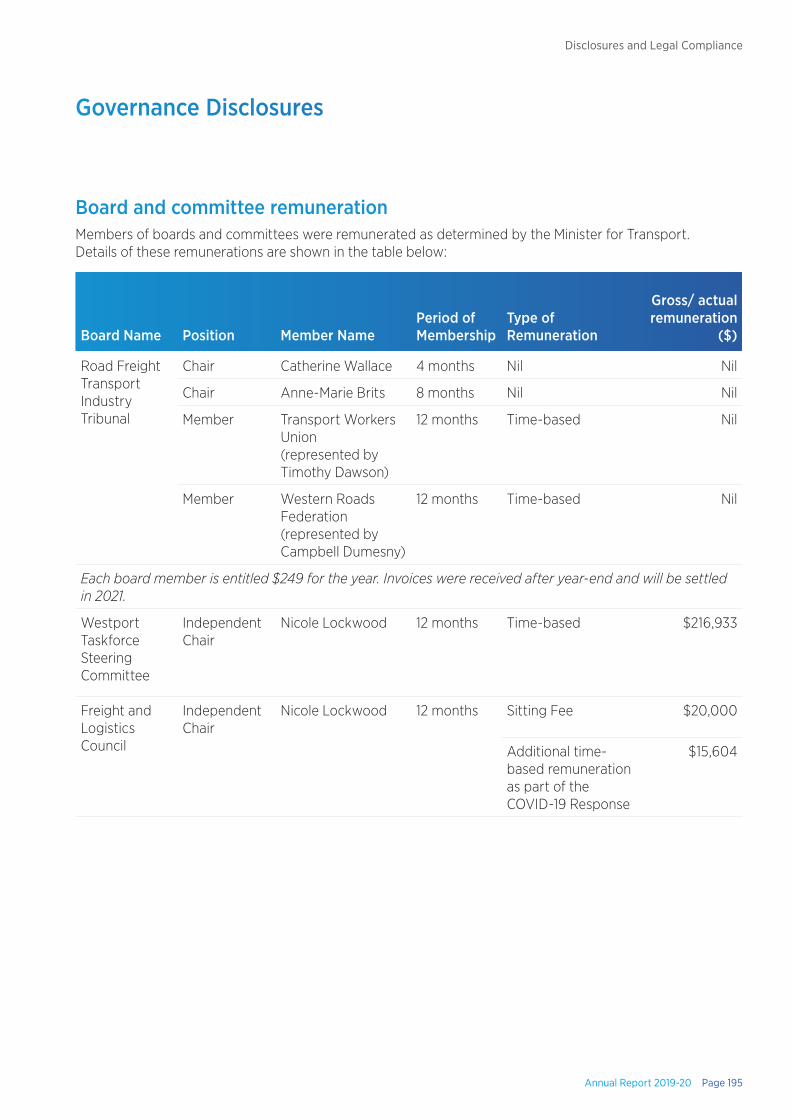
Governance Disclosures
Board and committee remuneration Members of boards and committees were remunerated as determined by the Minister for Transport. Details of these remunerations are shown in the table below:
Board Name Position Member Name Period of Membership
Type of Remuneration
Gross/ actual remuneration
($)
Road Freight Transport Industry Tribunal
Chair Catherine Wallace 4 months Nil Nil
Chair Anne-Marie Brits 8 months Nil Nil
Member Transport Workers Union (represented by Timothy Dawson)
12 months Time-based Nil
Member Western Roads Federation (represented by Campbell Dumesny)
12 months Time-based Nil
Each board member is entitled $249 for the year. Invoices were received after year-end and will be settled in 2021.
Westport Taskforce Steering Committee
Independent Chair
Nicole Lockwood 12 months Time-based $216,933
Freight and Logistics Council
Independent Chair
Nicole Lockwood 12 months Sitting Fee $20,000
Additional time-based remuneration as part of the COVID-19 Response
$15,604
Annual Report 2019-20 Page 195
Disclosures and Legal Compliance
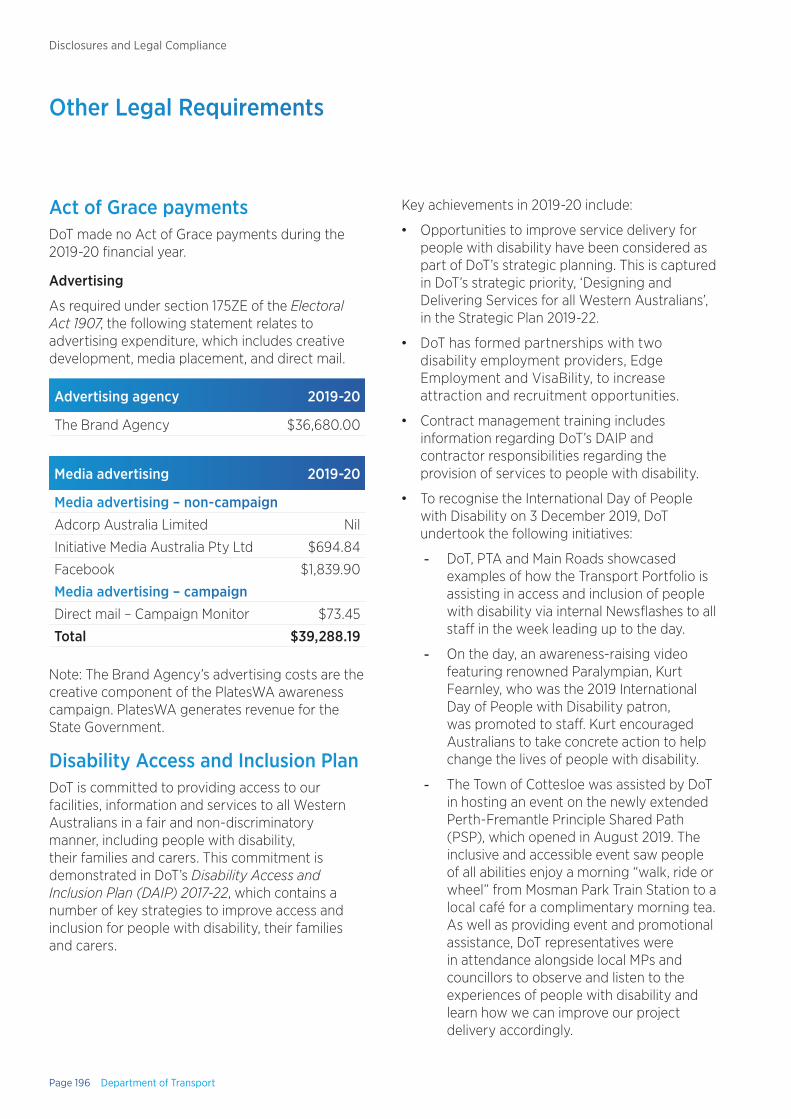
Other Legal Requirements
Act of Grace paymentsDoT made no Act of Grace payments during the 2019-20 financial year.
Advertising
As required under section 175ZE of the Electoral Act 1907, the following statement relates to advertising expenditure, which includes creative development, media placement, and direct mail.
Advertising agency 2019-20
The Brand Agency $36,680.00
Media advertising 2019-20
Media advertising – non-campaignAdcorp Australia Limited Nil
Initiative Media Australia Pty Ltd $694.84
Facebook $1,839.90
Media advertising – campaignDirect mail – Campaign Monitor $73.45
Total $39,288.19
Note: The Brand Agency’s advertising costs are the creative component of the PlatesWA awareness campaign. PlatesWA generates revenue for the State Government.
Disability Access and Inclusion PlanDoT is committed to providing access to our facilities, information and services to all Western Australians in a fair and non-discriminatory manner, including people with disability, their families and carers. This commitment is demonstrated in DoT’s Disability Access and Inclusion Plan (DAIP) 2017-22, which contains a number of key strategies to improve access and inclusion for people with disability, their families and carers.
Key achievements in 2019-20 include:
• Opportunities to improve service delivery for people with disability have been considered as part of DoT’s strategic planning. This is captured in DoT’s strategic priority, ‘Designing and Delivering Services for all Western Australians’, in the Strategic Plan 2019-22.
• DoT has formed partnerships with two disability employment providers, Edge Employment and VisaBility, to increase attraction and recruitment opportunities.
• Contract management training includes information regarding DoT’s DAIP and contractor responsibilities regarding the provision of services to people with disability.
• To recognise the International Day of People with Disability on 3 December 2019, DoT undertook the following initiatives:
- DoT, PTA and Main Roads showcased examples of how the Transport Portfolio is assisting in access and inclusion of people with disability via internal Newsflashes to all staff in the week leading up to the day.
- On the day, an awareness-raising video featuring renowned Paralympian, Kurt Fearnley, who was the 2019 International Day of People with Disability patron, was promoted to staff. Kurt encouraged Australians to take concrete action to help change the lives of people with disability.
- The Town of Cottesloe was assisted by DoT in hosting an event on the newly extended Perth-Fremantle Principle Shared Path (PSP), which opened in August 2019. The inclusive and accessible event saw people of all abilities enjoy a morning “walk, ride or wheel” from Mosman Park Train Station to a local café for a complimentary morning tea. As well as providing event and promotional assistance, DoT representatives were in attendance alongside local MPs and councillors to observe and listen to the experiences of people with disability and learn how we can improve our project delivery accordingly.
Page 196 Department of Transport
Disclosures and Legal Compliance

• DoT established a partnership with Job Access to increase disability awareness and employment outcomes for staff. Job Access completed a review of DoTs recruitment and selection process from the perspective of an applicant with disability. The outcomes have been considered and recommendations are being implemented. Job Access will deliver three disability awareness training sessions for DoT, including a ‘train the trainer’ session so participants may then facilitate future training sessions for DoT.
• The long-term cycle network plan, cycle design guidelines and Portfolio cycling infrastructure policy are all inclusive of people with disability, catering for people of all ages and abilities.
• DoT reviewed recent community consultation processes to identify any improvements that could be made for future consultations to better accommodate people with different needs.
The Active Transport and Safety, Maritime, Westport and Freight, Ports, Aviation and Reform teams have all used the digital My Say Transport stakeholder engagement platform for consultation, which allows for improved online consultation. Each business unit also seeks feedback in person, by phone and via mail.
The Active Transport and Safety team also provided flexibility by sending consultation materials directly to customers who nominated to be consulted, and allocated time to fill out online surveys on behalf of those community members. Next steps are to review guiding resources for community consultation to identify any opportunities for improvement.
• Events published on the DoT website and Facebook are reviewed to ensure they are inclusive and accessible to people with disability. The DoT Communications team works with business units to ensure people registering for workshops and events can advise if they need special assistance.
DoT will continue to implement strategies from the DAIP 2017-22 to improve access to our services, facilities and information for people with disability, their families and carers.
Annual Report 2019-20 Page 197
Disclosures and Legal Compliance
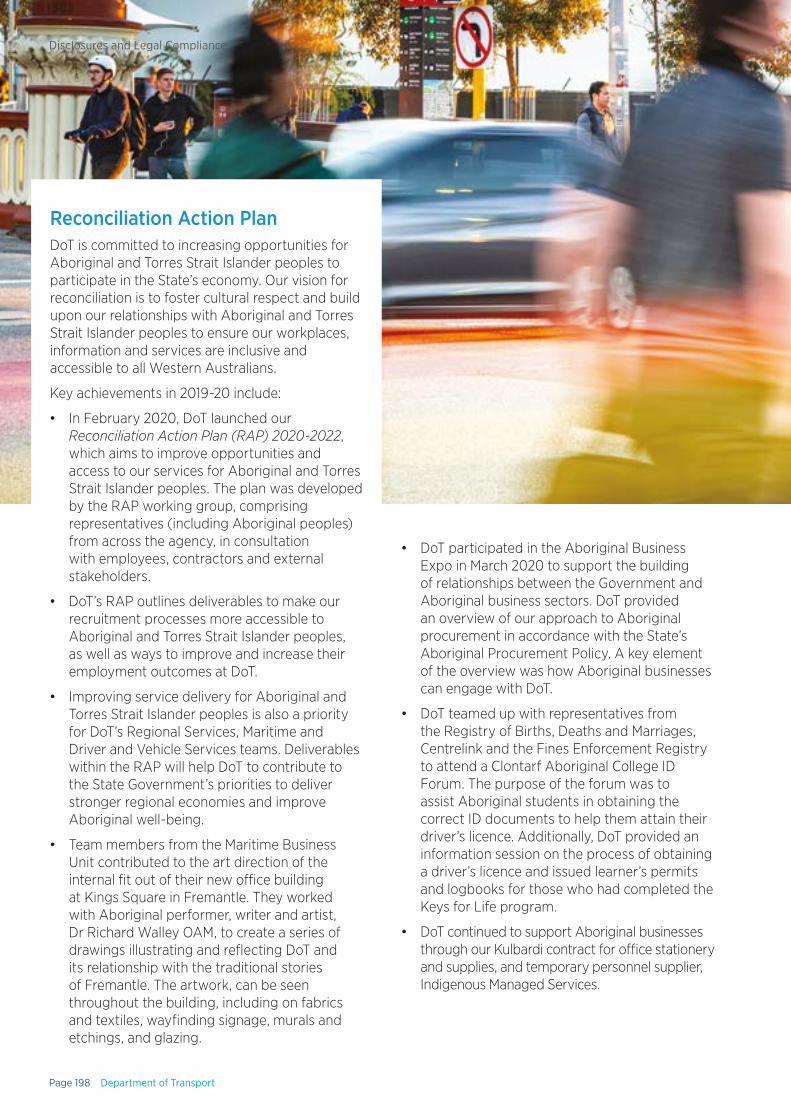
• DoT participated in the Aboriginal Business Expo in March 2020 to support the building of relationships between the Government and Aboriginal business sectors. DoT provided an overview of our approach to Aboriginal procurement in accordance with the State’s Aboriginal Procurement Policy. A key element of the overview was how Aboriginal businesses can engage with DoT.
• DoT teamed up with representatives from the Registry of Births, Deaths and Marriages, Centrelink and the Fines Enforcement Registry to attend a Clontarf Aboriginal College ID Forum. The purpose of the forum was to assist Aboriginal students in obtaining the correct ID documents to help them attain their driver’s licence. Additionally, DoT provided an information session on the process of obtaining a driver’s licence and issued learner’s permits and logbooks for those who had completed the Keys for Life program.
• DoT continued to support Aboriginal businesses through our Kulbardi contract for office stationery and supplies, and temporary personnel supplier, Indigenous Managed Services.
Reconciliation Action PlanDoT is committed to increasing opportunities for Aboriginal and Torres Strait Islander peoples to participate in the State’s economy. Our vision for reconciliation is to foster cultural respect and build upon our relationships with Aboriginal and Torres Strait Islander peoples to ensure our workplaces, information and services are inclusive and accessible to all Western Australians.
Key achievements in 2019-20 include:
• In February 2020, DoT launched our Reconciliation Action Plan (RAP) 2020-2022, which aims to improve opportunities and access to our services for Aboriginal and Torres Strait Islander peoples. The plan was developed by the RAP working group, comprising representatives (including Aboriginal peoples) from across the agency, in consultation with employees, contractors and external stakeholders.
• DoT’s RAP outlines deliverables to make our recruitment processes more accessible to Aboriginal and Torres Strait Islander peoples, as well as ways to improve and increase their employment outcomes at DoT.
• Improving service delivery for Aboriginal and Torres Strait Islander peoples is also a priority for DoT’s Regional Services, Maritime and Driver and Vehicle Services teams. Deliverables within the RAP will help DoT to contribute to the State Government’s priorities to deliver stronger regional economies and improve Aboriginal well-being.
• Team members from the Maritime Business Unit contributed to the art direction of the internal fit out of their new office building at Kings Square in Fremantle. They worked with Aboriginal performer, writer and artist, Dr Richard Walley OAM, to create a series of drawings illustrating and reflecting DoT and its relationship with the traditional stories of Fremantle. The artwork, can be seen throughout the building, including on fabrics and textiles, wayfinding signage, murals and etchings, and glazing.
Page 198 Department of Transport
Disclosures and Legal Compliance

• DoT hosted a joint agency event for NAIDOC Week at 140 William Street on Monday, 8 July 2019. The event included a Welcome to Country from Matthew McGuire, a keynote presentation by Rishelle Hume AM and a performance by Aboriginal Noongar-language choir, Madjitil Moora. NADIOC Week was promoted to staff through internal newsletters and the intranet, and employees were invited to attend or livestream the event.
• DoT continued efforts to improve access to services and break down barriers associated with the driver licensing system in remote communities through our Remote Services program. Ongoing successes of the Remote Services program include:
- Continued partnerships with private industry, not-for-profit organisations, Aboriginal corporations and the WA Police to include learner’s permit theory testing as part of a driver training program. This provides an alternate service-delivery channel and ensures candidates have a full understanding of traffic laws prior to undertaking their driver’s assessment. To date, approximately 7,500 people have successfully completed the theory test through these partnerships.
- DoT officers regularly visit remote communities, with approximately 142 visits across 55 locations undertaken in 2019-20. Through these visits:
› 300 driver’s licences were issued, reissued or transferred;
› 163 driver’s licences were renewed;
› 168 theory tests and 298 practical driving assessments were conducted across all licence classes;
› 284 learner’s permits were issued or reissued; and
› 189 vehicle licensing activities were conducted.
DoT will continue to progress actions from our Reconciliation Action Plan 2020-22 and improve service delivery and opportunities for Aboriginal and Torres Strait Islander peoples.
Annual Report 2019-20 Page 199
Disclosures and Legal Compliance
Compliance with Public Sector Standards and ethical codesDoT is committed to promoting and sustaining the highest standard of ethical behaviour in the workplace by all our employees. DoT has numerous initiatives, policies, processes and systems in place to ensure the highest standards of ethical behaviour are displayed at all times.
During 2019-2020, DoT’s activities to achieve compliance with public sector standards and ethical codes included:
• conducting a pulse survey to gather feedback from employees to understand areas affecting organisational performance and culture;
• acting on employee feedback and other input to evolve human resource management policies and procedures to enhance both employee and customer experiences;
• business units introducing targeted People Plans, incorporating desired values and behaviours;
• ongoing requirement for all employees to undertake online training in Accountable and Ethical Decision-Making, with a 99 per cent completion rate as at June 2020;
• ongoing Equal Employment Opportunity training to enable a workplace free of discrimination and harassment; and
• addressing allegations of misconduct in a timely and responsible way.
Compliance issues
Two Breach of Standard claims relating to the Employment Standard were received in 2019-2020. The claims were considered and dismissed by the Public Sector Commissioner.
In 2019-2020, seven cases of non-compliance with Code of Ethics/Code of Conduct were reported, with three cases resulting in disciplinary investigations.
Better recordkeeping
DoT is committed to continuously improving its recordkeeping culture, tools and practices to ensure compliance with the State Records Act 2000 (the Act) and the best business outcomes for the Department. The following information is provided in accordance with the State Records Commission Standard 2, Principle 6.
Efficiency and effectiveness of DoT’s recordkeeping system
DoT’s corporate Electronic Document and Records Management System (EDRMS) is Objective. All DoT staff have access to Objective, enabling them to capture and manage records in line with agency policies and procedures.
In 2019-20, DoT commenced a project to upgrade Objective to ensure ongoing version currency and enhance its functionality and usability.
In addition to Objective, business-specific systems are in place across DoT to capture both digital and hard copy records, enabling efficient and compliant recordkeeping throughout the agency. DoT’s Information Management Services (IMS) branch works closely with business units to provide advice and review processes to progress to a fully digital recordkeeping environment.
In 2020-21, DoT’s implementation of an information classification process will provide clear guidelines around the handling of DoT information according to sensitivity and the sharing of this information to support multi-agency service delivery.
Recordkeeping training and induction programs
DoT’s online Recordkeeping Awareness Training (RAT) is mandatory for all staff and contractors, which covers their obligations to comply with both internal recordkeeping policies and procedures, as well as the Act.
All new employees, including contractors, are automatically enrolled in the online course as part of DoT’s on-boarding process. As at 30 June 2020, 96.04 per cent of those enrolled have completed the course.
Page 200 Department of Transport
Disclosures and Legal Compliance
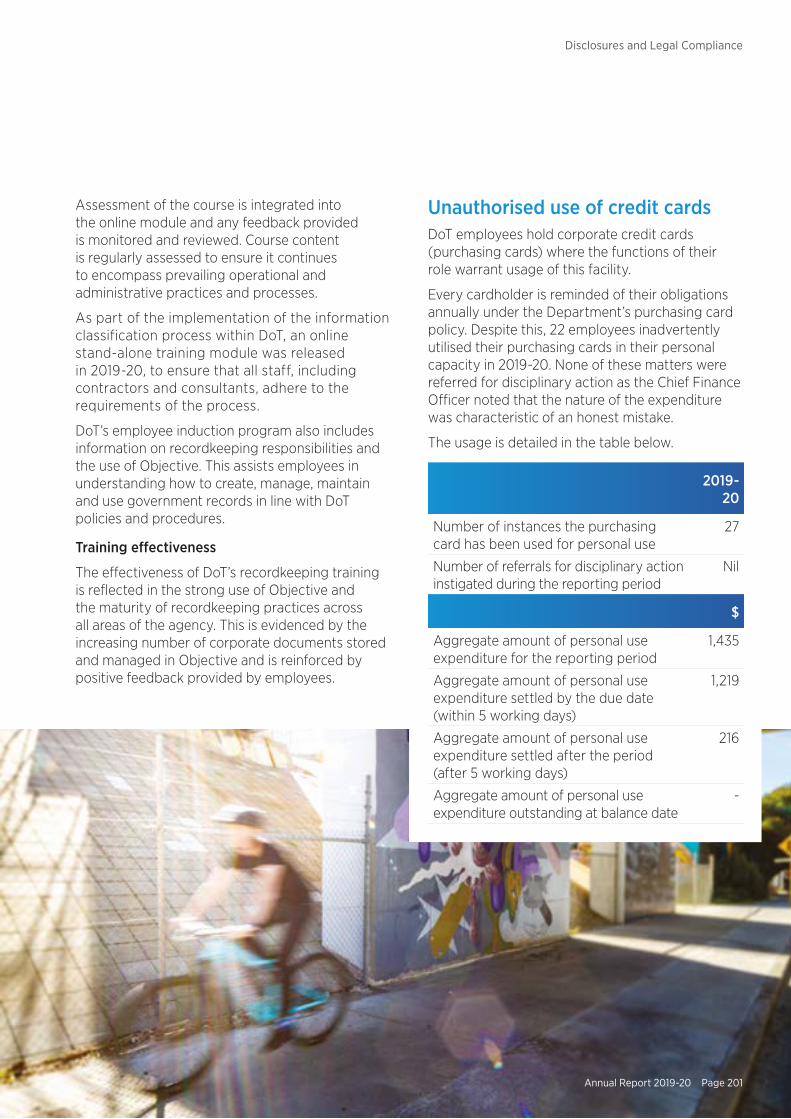
Assessment of the course is integrated into the online module and any feedback provided is monitored and reviewed. Course content is regularly assessed to ensure it continues to encompass prevailing operational and administrative practices and processes.
As part of the implementation of the information classification process within DoT, an online stand-alone training module was released in 2019-20, to ensure that all staff, including contractors and consultants, adhere to the requirements of the process.
DoT’s employee induction program also includes information on recordkeeping responsibilities and the use of Objective. This assists employees in understanding how to create, manage, maintain and use government records in line with DoT policies and procedures.
Training effectiveness
The effectiveness of DoT’s recordkeeping training is reflected in the strong use of Objective and the maturity of recordkeeping practices across all areas of the agency. This is evidenced by the increasing number of corporate documents stored and managed in Objective and is reinforced by positive feedback provided by employees.
Unauthorised use of credit cardsDoT employees hold corporate credit cards (purchasing cards) where the functions of their role warrant usage of this facility.
Every cardholder is reminded of their obligations annually under the Department’s purchasing card policy. Despite this, 22 employees inadvertently utilised their purchasing cards in their personal capacity in 2019-20. None of these matters were referred for disciplinary action as the Chief Finance Officer noted that the nature of the expenditure was characteristic of an honest mistake.
The usage is detailed in the table below.
2019-20
Number of instances the purchasing card has been used for personal use
27
Number of referrals for disciplinary action instigated during the reporting period
Nil
$
Aggregate amount of personal use expenditure for the reporting period
1,435
Aggregate amount of personal use expenditure settled by the due date (within 5 working days)
1,219
Aggregate amount of personal use expenditure settled after the period (after 5 working days)
216
Aggregate amount of personal use expenditure outstanding at balance date
-
Annual Report 2019-20 Page 201
Disclosures and Legal Compliance
Substantive equality
DoT is committed to achieving substantive equality in service delivery and employment for the diverse Western Australian community. The agency continuously looks for opportunities to improve access and outcomes for people with different needs.
Key achievements in 2019-20 included:
• DoT participated in workshops held by the Department of Local Government, Sport and Cultural Industries regarding the new State Multicultural Policy Framework, which was launched in February 2020. DoT helped shape resources to assist public sector agencies in exploring ideas and strategies to implement the Framework.
• We continued to partner with North Metropolitan TAFE in offering work experience placements at DoT to students enrolled in the Settlement Language Pathways to Employment and Training program. Maritime’s property services team at Fremantle welcomed aboard two students, Radha and Yanchen.
Radha and Yanchen showed their previous experience in office administration by helping the property team to audit lease documentation and review jetty files. Both students said they enjoyed the friendly and supportive atmosphere, which helped them grow their confidence.
Radha said that she had “developed confidence in workplace communication”, while Yanchen said that “working in a team is great and culturally different to the way I worked in China”.
• DoT’s services are responsive to the needs of customers who are unable to communicate effectively in spoken or written English. We provide interpreting services, and staff dealing directly with customers are able to identify when and how to work with an interpreter. The most popular language requested for interpreting services in 2019-20 was Arabic, which accounted for almost a quarter of all on-site interpreter visits across WA. Mandarin was the second most popular language.
DoT will continue to implement strategies to improve access to information, services and facilities for people with different needs.
Audit and Risk Management Committee
The Audit and Risk Management Committee (ARMC) provides oversight and advisory into the effectiveness of DoT’s corporate governance, including risk management, control processes and internal audit.
The ARMC was established by the Director General – Transport as the accountable authority under Treasurer’s Instruction 1201: Structure of the Internal Audit Function, which requires accountable authorities to develop and maintain an effective internal audit function. The ARMC is an independent committee, reporting directly to the Director General.
During 2019-20, DoT appointed an independent Chair and an independent external member. Additionally, two new internal members were also appointed: Executive Director Finance and Contracts, Public Transport Authority (PTA), and General Manager Regional Services, DoT. The committee now includes the following members:
• Chief Financial Officer – Department of Planning, Lands and Heritage (Chair)
• Executive Director, Finance and Contracts – PTA
• Executive Director Regional Services – DoT
• Appointed independent external member
• Executive Director, Office of Director General – DoT (ex-officio)
The ARMC met four times in 2019-20, with an additional meeting held for committee members to consider the draft internal audit plan.
Government Policy Requirements
Page 202 Department of Transport
Disclosures and Legal Compliance
Internal audit
DoT’s Internal Audit function operates under the approved Internal Audit Charter. It provides an independent and objective assurance and consulting activity designed to add value and improve the operations of DoT. The function assists DoT in accomplishing its objectives by bringing a systematic and disciplined approach to evaluate and improve the effectiveness of risk management, controls, compliance and governance processes.
DoT’s internal audits were conducted by EY, in accordance with the Financial Management Act 2006 and Institute of Internal Auditors’ International Standards for the Professional Practice of Internal Auditing. During 2019-20, DoT also appointed a Senior Internal Auditor to conduct internal audits.
The annual Internal Audit Plan is aligned with DoT’s strategic objectives and risks, with a focus on core functions and controls.
Internal audits conducted by DoT in 2019-20 included:
• Contract Management Framework
• Contractors Embedded in the Workplace
• Aviation grants subsidies (Regional Airports Development Scheme (RADS) & Kimberley Subsidised Air Service (KSAS)
• Freight Industry Subsidy Grant
• Licensing (Jetty and Ferries)
• Marine Exemptions Process
• On-demand Booking Service Application Assessment Process
• On-demand Booking Service Levy
• Penetration Testing
• Purchasing Cards
• Risk Intelligence – Governance Framework Review
• Taxi Pate Owner Buyback Scheme
• Website Compliance
The recommendations arising from internal audits are managed and monitored through DoT’s Audit Recommendation Management System. The implementation status of these recommendations are reported on a quarterly basis to the ARMC.
Risk management
DoT is committed to ensuring a comprehensive risk management process that meets the requirements of Treasurer’s Instruction 825, the Public Sector Commissioner’s Circular: 2015-03 Risk Management and Business Continuity Planning and aligns with the international standard AS/NZS ISO 31000:2018 Risk Management – Principles and Guidelines.
DoT’s structured risk management approach is integrated into management, planning and operational processes. This assists DoT in achieving its desired outcomes by providing a transparent process that identifies what is essential to success, and demonstrates the decision-making process regarding the acceptance of risks.
Integrity framework
DoT recently reshaped its Fraud and Corruption Control Plan into an Integrity Framework based on the Australian Standard Fraud and Corruption Control (AS 8001-2008).
The Integrity Framework aims to promote integrity and minimise the potential for incidents of fraud and corruption related to DoT’s business processes, programs and systems, either by employees or others. Fraud and corruption control strategies are embedded within DoT’s Risk Management Framework, and includes strategies to prevent, detect and respond to incidents of fraud and corruption.
Annual Report 2019-20 Page 203
Disclosures and Legal Compliance
Occupational safety, health and injury management
DoT’s executives, safety and health representatives and employees are committed to achieving a workplace environment that is free of work-related injuries and disease, and to achieving excellence in occupational safety and health management.
In accordance with the Public Sector Commissioner’s Circular 2018-03: Code of Practice: Occupational Safety and Health in the Western Australian Public Sector (the Circular), DoT complies with the requirements of the Occupational Safety and Health Act 1984, the Workers’ Compensation and Injury Management Act 1981 and the Circular.
DoT’s Work Health and Safety (WHS) Strategy
DoT is committed to its corporate legislative responsibility to promote health and safety in the workplace. In support of this commitment, DoT strives to promote and maintain a values-driven workplace. We encourage employees to bring their passion for life to work, and nurture an environment where all employees can thrive.
In readiness for updated Work Health and Safety (WHS) legislation, DoT rebranded its safety team from OHS to WHS. DoT’s 2019-2020 WHS Strategy is designed to provide a structured approach to WHS, for both proactive and reactive health and safety activities undertaken by the POD WHS Team. It is based on partnering with other POD areas of expertise and the DoT business units. It provides DoT with a structured and fit for purpose safety management system that addresses its legislative obligations and enables business units and line managers to actively manage safety.
DoT has an established injury management (IM) program, detailing the steps taken to assist injured employees to return to work as soon as medically appropriate. The procedures focus on early intervention IM strategies that may allow the injured employee to remain at work or return to work at the earliest appropriate time. DoT’s IM procedure is compliant with the requirements of the Workers’ Compensation and Injury Management Act 1981 and the Code of Practice (Injury Management) 2005.
DoT’s Corporate Executive is strongly committed to WHS management in the workplace. This is demonstrated by its endorsement of the DoT WHS Policy Statement and the establishment of the Corporate WHS Management Committee on behalf of the Director General – Transport. The Corporate WHS Management Committee is responsible for identifying and implementing WHS initiatives and making recommendations on policy and strategy to CorpEx. The Corporate WHS Management Committee is comprised of members from CorpEx and DoT’s WHS Team in POD.
All employees can access DoT’s WHS and IM information through the department’s WHS Management System available on the intranet. WHS and IM information is widely communicated through various training sessions designed for both employees (Employee Induction) and people managers (WHS and IM for Managers). WHS information is also provided through DoT’s three WHS subcommittees below, each chaired by an Executive Director of the relevant business unit/s:
• Maritime and Regional Services WHS Subcommittee;
• Driver and Vehicles Services and Business Information Systems WHS Subcommittee; and
• 140 William Street and On-demand Transport WHS Subcommittee.
The three WHS Subcommittees meet quarterly to discuss matters relating to workplace issues that affect the health and welfare of employees, as well as the continuous improvement of WHS performance. The agenda and meeting minutes for each of the WHS subcommittee meetings and the Corporate WHS Management Committee Meetings are displayed on dedicated WHS noticeboards across all DoT sites and via the DoT WHS Virtual Noticeboard on the intranet.
During the year, DoT discussed and resolved issues raised by employees, reviewed accident and incident forms to ensure that hazards were addressed to eliminate or reduce future issues, discussed injury trends and identified preventative measures that promote a safe working environment, at the various committee meetings.
Page 204 Department of Transport
Disclosures and Legal Compliance
The safety and health representatives, in consultation with management, are responsible for updating the noticeboards. The effectiveness of the WHS Committee meetings is measured by member attendance rates, which subsequently forms part of the key performance indicators reported to CorpEx.
Workers’ Compensation and Injury Management
DoT has a strong focus on early intervention and return to work. People Managers are trained in the importance of good injury management and return to work procedures, all with the purpose of promoting a supportive, productive and positive workplace.
DoT has a dedicated Employee Experience Team, comprising of three Employee Experience Partners who manages the workers’ compensation claims and supports the management of the non-work-related injury management issues.
As of 30 June 2020, DoT had 18 open workers’ compensation claims, of which all 18 claimants (100%) were back at work.
WHS Management System audit and results
The DoT WHS Management System was audited in 2016-2017 to ensure alignment with relevant health and safety management system specifications (including Australian Standard 4801), its core principles of relevant WHS legislation and DoT’s risk profile. The audit was conducted by an external auditor from EY, utilising an AS 4801 Audit Tool. The following actions were addressed and implemented:
• DoT continues to implement a formal and proactive process to identify WHS risks across all sites. 626 roles were risk assessed and risk rated accordingly; roles that presented with a medium or high risk have been thoroughly reviewed and Safe Work Practices (SWPs) created.
• A DoT WHS Position Risk Register (electronic form) was then created and includes common public-sector hazards described in the Circular, such as aggression, manual handling, working in isolation, organisational change, inadequate workstations and inadequate work organisation.
The register will detail the WHS risks associated with each of the 626 job positions within. It also provides links to all the supporting SWPs and WHS procedures that are relevant the position. All DoT employees have access to the register and all managers have been advised on how to best utilise the register. The DoT WHS Position Risk Register and supporting documentation facilitates a comprehensive risk management approach DoT.
• Each DoT workplace now has a Site Specific Chemical Register, which documents all chemicals brought into the workplace. The register is managed by both management and the safety and health representative of the site. POD WHS manages the overarching DoT Chemical Register, which contains the combined information from the site-specific registers. Every chemical at a DoT workplace has a corresponding Safety Data Sheet (SDS) loading onto the safety page on the intranet.
It is proposed that in the 2020-21 financial year, the DoT WHS Management system will be audited again in readiness for updated WHS legislation.
WHS Training
In 2019-20 Work Health, Safety and Injury Management training programs were reviewed with the following results:
• POD WHS continues to roll out WHS and Injury Management for Managers training sessions. DoT currently has 87 per cent of managers trained in their WHS and IM responsibilities. All people managers must undergo a refresher WHS and IM for Managers training session every three years. POD WHS completed refresher training for 96 of DoT’s 285 people managers in 2019-20 (note: the other 196 managers are not yet due to attend the refresher training).
• Mental Health Awareness sessions were conducted throughout the year as part of the Wellness@Work 2020 Strategy. The training provides leaders and employees with the ability to recognise changes in behaviour, appearance and performance within themselves and in
Annual Report 2019-20 Page 205
Disclosures and Legal Compliance
colleagues, enabling recognition of potential mental health issues.
• Ergonomic training sessions were conducted throughout the year for all employees. Vehicle ergonomics training was also conducted in all regional offices and for the Remote Licensing team to promote good ergonomics on long distance driving.
• Manual Tasks, Ergonomics and WHS Induction one-hour training sessions are available to all employees. All new starters at DoT attend the Employee Induction Day, which includes the WHS Induction session.
• Introduction of the Maritime Environmental Emergency Response (MEER) Safety Training session (available to all MEER Responders) designed to educate the responders on their WHS responsibilities and requirements during an emergency response.
These sessions were undertaken on site at each business unit and via video conferencing for the Regional sites. This allowed for a greater number of managers and employees to attend the sessions.
COVID-19 and WHS responses
DoT’s operations and services evolved rapidly during COVID-19. Some services, such as PDAs, were significantly scaled back due to concerns around community transmission, whereas other services ramped up as community demand shifted from counter services to contact centres and digital channels. Expectantly, footfall in DoT’s customer service centres fell, resulting in a spike in calls received throughout this period.
POD WHS undertook detailed safety risk assessments, with input from frontline employees and the union, to implement a range of ongoing safety measures to protect our customer service officers and driver assessors. These included the installation of clear Perspex screens across all counters at all DoT business centres, and line markings on the ground to ensure social distancing in the waiting areas.
A COVID-19 online hub was established on the DoT intranet, Transporta. The hub provided employees with live links to the Department of Health, the latest instructions from the State Government regarding health and safety measures, frequently asked questions, safety factsheets and working from home documentation.
At the peak of the pandemic, approximately 65 per cent of DoT’s eligible workforce were working remotely. All employees who chose to work remotely had to complete the COVID-19 Working from Home WHS Checklist to ensure their home-based work environment met safety regulations. In total, POD WHS processed 921 applications to work remotely.
Special allowances were made for vulnerable and high-risk employees, as well as those with high-risk household members, on a case by case basis. Many frontline employees were assigned to suitable alternative duties, such as manning the SPIL hotline which could be administered from home.
POD WHS participated in the daily morning conference calls with all the DoT customer service centre managers and provided safety advice and recommendations as requested.
POD WHS developed various mental health and well-being factsheets, which could be accessed via the COVID-19 online hub, to promote both mental and physical well-being during the pandemic.
Other key WHS achievements and new initiatives
In 2019-20, the following achievements and activities supported DoT’s management of WHS in the workplace:
• All WHS and IM performance targets achieved in 2019-20, with a significant reduction in lost time injury claims (from 22 claims in 2018-19 down to nine claims in 2019-20).
• Reduction in the total number of reportable incidents (from 246 incidents reported in 2018-19 down to 196 reported in 2019-20).
• Reduction in the total number of customer aggression incidents (from 52 in 2018-19 to 44 in 2019-20).
Page 206 Department of Transport
Disclosures and Legal Compliance
• The implementation of the DoT Wellness@Work strategy, which adopts an integrated approach to both mental and physical well-being. The strategy provides a holistic approach towards well-being while integrating contemporary human resources practices. Some of the initiatives within the strategy include the flu vaccination and skin check (mole assessment) programs; Mental Health Awareness and Psychological Safety Training sessions; corporate gym membership discounts; corporate health insurance discounts; and promoting several Safe Work Australia National Priorities, including asthma management and minimising sedentary behaviors through the ‘Sit Less, Stand Up and Move More’ campaign.
• Flagged expansion of the Mental Health First Aider Program across DoT in 2020-21, as part of the Wellness@Work Program.
• Introduction of the Safety Culture Project to empower managers and employees to adopt a culture of safety accountability within their daily activities as part of the DoT Future Ready Workforce Strategy. The Safety Culture Project also includes a Psychological Safety component that encourages a blame-free working environment where employees feel trusted and safe to report safety concerns.
• Launching the ‘Fee for Service Contractor WHS Induction’ video online to ensure all non-DoT staff working within DoT workplaces are inducted according to the agency’s WHS requirements.
• Successful relocation the Maritime Business Unit from Marine House to its new activity based working (ABW) offices in Kings Square. This included transitioning employees to ABW, reviewing the office layout, ergonomics, emergency procedures, traffic management, risk assessments and First Aid requirements.
• Collaborating with the Transport Portfolio’s WHS teams to align safety initiatives across the Portfolio, with a Transport Portfolio Safety Forum planned for February 2021.
• Scheduling of DoT proactive site visits to conduct workplace inspections, risk assessments, WHS audits and onsite training, as per the POD WHS Site Visits calendars for 2019 and 2020.
• Ensuring every DoT workplace has a registered safety and health representative. There are now 29 representatives across DoT, of which 24 have completed their training. The remaining five representatives are awaiting their training after recently being elected to the role.
• The review and implementation of the DoT Maritime Environmental Emergencies Response (MEER) Safety Management System (SMS). This SMS provides guidelines for developing site WHS plans for MEER and Marine Oil Pollution (MOP) Emergencies, in alignment with the relevant legislation.
• Successfully implementing the MEER SMS in two State MEER Exercises (Exercise Dampier Challenge in June 2019, and Exercise Browse in collaboration with Shell in October 2019, involving approximately 300 responders from 23 government and private organisations. Responders were deployed for both shoreline clean-up and marine-based operational activities.
Annual Report 2019-20 Page 207
Disclosures and Legal Compliance
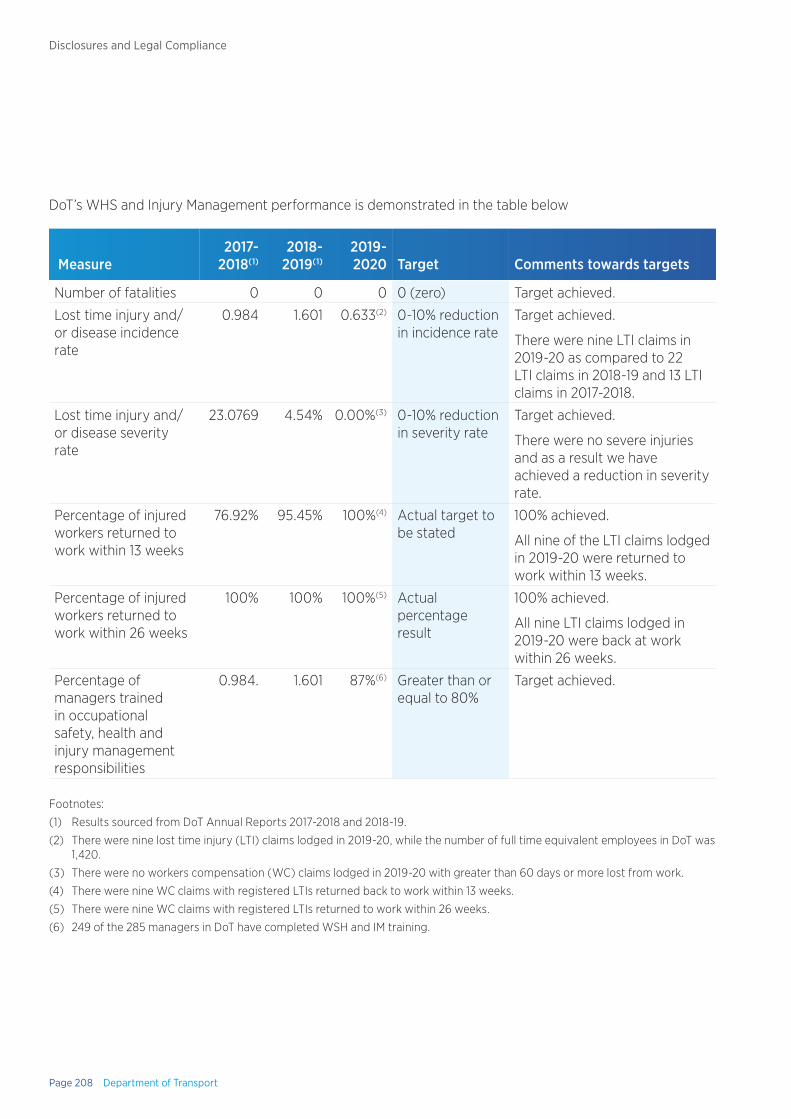
DoT’s WHS and Injury Management performance is demonstrated in the table below
Measure2017-
2018(1)2018-
2019(1)2019-2020 Target Comments towards targets
Number of fatalities 0 0 0 0 (zero) Target achieved.
Lost time injury and/or disease incidence rate
0.984 1.601 0.633(2) 0-10% reduction in incidence rate
Target achieved.
There were nine LTI claims in 2019-20 as compared to 22 LTI claims in 2018-19 and 13 LTI claims in 2017-2018.
Lost time injury and/or disease severity rate
23.0769 4.54% 0.00%(3) 0-10% reduction in severity rate
Target achieved.
There were no severe injuries and as a result we have achieved a reduction in severity rate.
Percentage of injured workers returned to work within 13 weeks
76.92% 95.45% 100%(4) Actual target to be stated
100% achieved.
All nine of the LTI claims lodged in 2019-20 were returned to work within 13 weeks.
Percentage of injured workers returned to work within 26 weeks
100% 100% 100%(5) Actual percentage result
100% achieved.
All nine LTI claims lodged in 2019-20 were back at work within 26 weeks.
Percentage of managers trained in occupational safety, health and injury management responsibilities
0.984. 1.601 87%(6) Greater than or equal to 80%
Target achieved.
Footnotes:
(1) Results sourced from DoT Annual Reports 2017-2018 and 2018-19.
(2) There were nine lost time injury (LTI) claims lodged in 2019-20, while the number of full time equivalent employees in DoT was 1,420.
(3) There were no workers compensation (WC) claims lodged in 2019-20 with greater than 60 days or more lost from work.
(4) There were nine WC claims with registered LTIs returned back to work within 13 weeks.
(5) There were nine WC claims with registered LTIs returned to work within 26 weeks.
(6) 249 of the 285 managers in DoT have completed WSH and IM training.
Page 208 Department of Transport
Disclosures and Legal Compliance
Annual Report 2019-20 Page 209
Disclosures and Legal Compliance


© State Government of Western Australia
PUBLISHED BY
Department of Transport 140 William Street Perth Western Australia 6000 SEPTEMBER 2020
www.transport.wa.gov.au Phone: (08) 6551 6000 Fax: (08) 6551 6001
Disclaimer: The information contained in this publication is provided in good faith and believed to be accurate at time of publication. The State shall in no way be liable for any loss sustained or incurred by anyone relying on the information.